morgan jessica thesis etd changes - ncsu
TRANSCRIPT

ABSTRACT
MORGAN, JESSICA KELLEY. Examining Growth Outcomes in Military Veterans: Posttraumatic Growth, Core Beliefs, and Temporality. (Under the direction of Dr. Roger E. Mitchell).
This study examined whether posttraumatic growth (PTG) model relationships found
in previous work (Cann, Calhoun, Tedeschi, Kilmer, et al., 2010) could be replicated within a
Veteran population. The process model of PTG suggests that stressful events can challenge
one’s core beliefs, promoting distress, and potentially, PTG. It was hypothesized that the
Core Beliefs Inventory (CBI), measuring challenge to one’s basic assumptions, would
represent a single factor, and be related positively to forms of rumination (i.e., deliberate and
intrusive), PTG, posttraumatic stress disorder (PTSD) symptoms, and indirectly related to
satisfaction with life (SWL).
Method. Data were collected via Amazon’s Mechanical Turk (MTurk), an online
crowdsourcing website, from Veterans who had experienced a stressful event in the last 3
years (N = 197). The design was cross-sectional.
Results. The presence of a single factor structure for the CBI was supported, although
the indicators were somewhat mixed. In a linear regression, challenge to core beliefs was
significantly associated with PTG and SWL. Higher levels of PTG were associated with
higher levels of SWL and greater challenge to core beliefs was associated with lower levels
of SWL. SEM results indicated that CBI scores were directly associated with both deliberate
and intrusive rumination. Deliberate rumination was related to PTG; intrusive rumination
was related to PTSD symptoms. PTG and PTSD symptoms mediated the relationship
between rumination styles and SWL.

Discussion. These results mirror the pattern of relationships found on the PTG model
in previous work with undergraduates, but extends it to Veterans who have experienced
stressful events. The findings extend previous work by suggesting the pathways through
which challenges to core beliefs may influence rumination and thereby PTG, PTSD, and
SWL. Efforts to facilitate PTG should take into account the nature and size of these effects.
Limitations include the use of self-report data and the accuracy of retrospective recall.

© Copyright 2015 Jessica Kelley Morgan
All Rights Reserved

Examining Growth Outcomes in Military Veterans: Posttraumatic Growth, Core Beliefs, and Temporality
by Jessica Kelley Morgan
A thesis submitted to the Graduate Faculty of North Carolina State University
in partial fulfillment of the requirements for the degree of
Master of Science
Psychology
Raleigh, North Carolina
2015
APPROVED BY:
_______________________________ ______________________________ Joseph M. Simons-Rudolph, PhD Sarah L. Desmarais, PhD
________________________________ Roger E. Mitchell, PhD
Committee Chair

ii
DEDICATION
To my husband, Tim Morgan, whose service to our country was the impetus for my work.
iii
BIOGRAPHY
Jessica Kelley Morgan is originally from Ohio and grew up in Holly Springs, North Carolina.
She attended North Carolina State University and graduated summa cum laude with a B.A. in
Sociology. Jessica entered the Psychology in the Public Interest program at North Carolina
State University in 2013. She is the Campus Representative for the American Psychological
Association’s Division 19 – Society for Military Psychology and Founder/President of the
Military Psychology Interest Group. Her research interests include posttraumatic growth,
resilience, and grit, as well as evaluation of pre-deployment and post-deployment training.
Additional interests include positive psychology and stress and coping. Her volunteer
positions include community, military, and provider outreach for Give An Hour, and at local
Veterans Stand Downs. Jessica lives in Fuquay Varina, North Carolina with her husband,
Tim.

iv
ACKNOWLEDGMENTS
I would like to express my sincerest gratitude to my advisor, Dr. Roger Mitchell for
his guidance over the past several years. He has consistently provided direction and support,
as well as the opportunity to question and challenge my most basic assumptions. I would also
like to thank Dr. Sarah Desmarais for her invaluable knowledge and insight, and willingness
to invest significant time in mentoring me. I am also extremely grateful to Dr. Joe Simons-
Rudolph for his unending encouragement and enthusiasm.
To my husband, Tim: Thank you so much for all of your support and love throughout
this process. Thank you for listening to my every fleeting thought and curiosity, for reading
draft after draft of my work, and for being my greatest cheerleader. Most importantly, thank
you for being my muse, my inspiration, and my favorite Veteran. Thank you for your service
to our country.
To my mom, Pegg; my dad, Gregg; and my brother, Kip: Thank you for being the
first ones to encourage me in all things academic and in life. Your willingness to take an
interest in my work means the world to me. It is so comforting to know that at every
presentation, regardless of the time or place, I will see familiar and smiling faces. I love you.
To my cohort, my labmates, my friends: Thank you for being there with me through
early mornings and late nights, for consistently taking an interest in my well-being, and for
surrounding me with energy, passion, and intellect.

v
TABLE OF CONTENTS
LIST OF TABLES................................................................................................................. viii
LIST OF FIGURES ................................................................................................................. iv
Introduction................................................................................................................................1
Literature Review ......................................................................................................................3
The construct of posttraumatic growth ..........................................................................3
Posttraumatic growth and psychological outcomes.............................................6
Core beliefs and posttraumatic growth ..........................................................................7
The Core Beliefs Inventory..................................................................................8
The CBI and PTG ................................................................................................8
PTG, SWL, and Time ..........................................................................................9
PTG and Gender ..................................................................................................9
Implications of PTG models for intervention ....................................................10
Statement of problem...................................................................................................11
Aims and Hypotheses ..............................................................................................................11
Aim 1 ...........................................................................................................................11
Hypothesis 1 ......................................................................................................11
Analytic Strategy 1 ............................................................................................11
Aim 2 ...........................................................................................................................12
Hypothesis 2a.....................................................................................................12
Analytic Strategy 2a...........................................................................................12
Hypotheses 2b....................................................................................................13

vi
Analytic Strategy 2b ..........................................................................................13
Aim 3 ...........................................................................................................................13
Hypothesis 3 ......................................................................................................13
Analytic Strategy 3 ............................................................................................14
Method .....................................................................................................................................14
Procedure .....................................................................................................................14
Participants...................................................................................................................15
Statistical power and sample size calculations ............................................................17
Measures ......................................................................................................................17
Dependent variables...........................................................................................17
Independent variables ........................................................................................18
Covariates ..........................................................................................................19
Descriptive .........................................................................................................19
Participant well-being and confidentiality ...................................................................20
Results......................................................................................................................................20
Data cleaning ...............................................................................................................20
Missing data .................................................................................................................21
Descriptive ...................................................................................................................22
Bivariate relationships .................................................................................................22
Hypothesis testing........................................................................................................23
Factor structure of CBI ......................................................................................23
PTG Regression .................................................................................................24

vii
SWL Regression ................................................................................................24
SEM ...................................................................................................................25
Discussion................................................................................................................................26
Sample .........................................................................................................................26
Results..........................................................................................................................27
Limitations ...................................................................................................................29
Future directions ..........................................................................................................30
References................................................................................................................................32
Appendices...............................................................................................................................40
Appendix A – Posttraumatic Growth Inventory ..........................................................41
Appendix B – Core Beliefs Inventory .........................................................................42
Appendix C – Satisfaction with Life Scale..................................................................43
Appendix D – Mental Health Resources .....................................................................44
Appendix E – Event-Related Rumination Inventory ...................................................46

viii
LIST OF TABLES
Table 1. Qualitative studies of growth concepts following adversity in chronological
order ............................................................................................................................... 47
Table 2. Quantitative studies of growth after adversity in chronological order .................... 48
Table 3. Results of association between PTG and mental health .......................................... 49
Table 4. Means and standard deviations of present study and Cann et al. 2010 ................... 50
Table 5. Bivariate correlations between independent variables, dependent variables,
and covariates .................................................................................................................. 51
Table 6. Standardized effects of core belief challenge, rumination, time, PTSD, and PTG
on rumination, PTSD, PTG, and life satisfaction ........................................................... 52

ix
LIST OF FIGURES
Figure 1. Condensed concept map of PTG process. ................................................................53
Figure 2. Hypothesized model of relationships in posttraumatic growth process ...................53
Figure 3. Confirmatory Factor Analysis of Core Beliefs Inventory including
standardized regression weights and intercepts .......................................................................53
Figure 4. Structural equation model of PTG, PTSD, and Life Satisfaction in military
Veterans ...................................................................................................................................54

1
Introduction
In 1963, Viktor Frankl, an Austrian neurologist and psychologist, released his seminal
work, Man’s Search for Meaning, (Frankl, 1963). The book recounts his experiences in a
Nazi concentration camp and his assertions, as both a psychologist and man, that the key to
well being is the discovery of meaning in suffering. Although a few other notable
psychologists and clinicians (e.g., Caplan, 1964; Dohrenwend, 1978; Yalom, 1980) have
discussed the positive life changes that may emerge from negative events, the primary focus,
historically, has been on the pathological consequences of trauma and related stressors
(Tedeschi & McNally, 2011). In the past three decades, researchers have begun to study
growth outcomes of adversity more systematically (Affleck & Tennen, 1996; Calhoun &
Tedeschi, 1998; Cann, Calhoun, Tedeschi, Taku, et al., 2010; Kaler, Erbes, Tedeschi, Arbisi,
& Polusny, 2011; Tedeschi & Calhoun, 2004; Tedeschi & McNally, 2011) including research
on constructs such as resilience (Bonanno, 2004), hardiness (Kobasa, 1979; Maddi, 2002),
growth (Park, Cohen, & Murch, 1996; Tedeschi & Calhoun, 1996), and coping (Antonovsky,
1979). This body of research suggests that people are sometimes able to struggle with
extraordinarily traumatic events and perceive positive outcomes as coming from the tragedy
(Kaler et al., 2011; Tedeschi & Calhoun, 1996).
This line of research eventually led to the concept of posttraumatic growth (PTG;
Tedeschi & Calhoun, 1995). PTG is essentially the ultimate paradoxical experience: the
positive by-products of dealing with negative events. This experience of growth is different
from resilience, which refers to an individual’s ability to “bounce back” from adversity
(Bonanno, 2004) because growth suggests that somehow the individual is actually, in some

2
ways, positively changed post-adversity (Tedeschi & Calhoun, 1996). Within the PTG
model, it is the individual’s struggle with the negative event that produces the growth, and
not the negative event in and of itself (Tedeschi & Calhoun, 2004; Tedeschi & McNally,
2011). Throughout this paper, posttraumatic growth will be defined as “positive personal
changes that result from their struggle to deal with trauma and its psychological
consequences” (Tedeschi & McNally, 2011, p. 19).
The conceptual model of PTG has primarily been built on retrospective reports using
undergraduate students. This model now includes two constructs: a) core beliefs, or the
extent to which one’s beliefs are challenged by an adverse event (Cann, Calhoun, Tedeschi,
Kilmer, et al., 2010) and b) intrusive and deliberate rumination, or the amount of intrusive
thoughts and deliberate cognitive processing following adversity (Cann et al., 2011).
Although PTG has been studied in military populations, the concept of core beliefs has only
been examined using undergraduate students and non-Veteran samples (i.e., leukemia
patients). The purpose of this study is to examine whether the pattern of relationships among
constructs in the PTG model, specifically that disruption of core beliefs is predictive of PTG
and that PTG is predictive of satisfaction with life, can be replicated within a Veteran
population. Given the interest in using the PTG model as a foundation for interventions with
Veterans, it becomes important to empirically verify whether predicted relationships exist
among Veteran populations (Kaler et al., 2011). Although the trauma literature suggests that
the type of trauma may not dictate the experience, it is unclear whether or not the model of
PTG will replicate from non-Veteran to Veteran populations.
3
Literature Review
The Construct of Posttraumatic Growth
Beginning in the early 1980s, clinicians and trauma researchers began to examine
growth outcomes as a result of adversity. Initially, reports of such growth were anecdotal or
based in qualitative research by clinicians. The work was conceptually intriguing, but
somewhat limited in its generalizability. A central finding was often that victims of a specific
trauma reported increased compassion for others in a similar situation, or felt called to
become an activist for a specific cause (Burt & Katz, 1987). Oftentimes, entire coding
themes were trauma-specific (e.g., increased sympathy for other victims of incest, Draucker,
1992). Table 1 provides a brief overview of the early efforts to examine post-adversity
growth using qualitative research, which did not include operational definitions. While
researchers seemingly shared a similar interest in an overarching theme of growth, the lack of
similar terminology or standardized measurement made it difficult to draw conclusions about
this phenomenon.
What followed was the attempted operationalization and measurement of these
experiences of growth. Early attempts at quantification of growth outcomes were limited by a
similar focus on specific populations (e.g., the Cancer Patient Behavior Scale) that precluded
use of those instruments with diverse populations. It was unclear whether or not reports in
any specific field of health, such as cancer, would be applicable in other trauma populations.
Table 2 summarizes quantitative work on post-adversity growth and related measures.

4
Similarly, there was little in the way of overarching theory that articulated how and why
growth outcomes might occur across trauma more generally.
The strongest conceptual and empirical work at this time was the Stress-Related
Growth Scale (SRGS) developed by Park, Cohen, and Murch (1996). It not only offered one
of the first reliable and valid measures of post-adversity growth, it also assessed social
desirability of participants’ responses, corroboration of changes by informants, and
longitudinal analysis of the process (Park et al., 1996). The SRGS was developed based on
Schaefer and Moos’ (1992) theory of growth outcomes, as well as qualitative and anecdotal
personal experience of such reports (Park et al., 1996).
In the initial study using the SRGS, college students (N = 506) were asked to describe
the most “stressful/upsetting” event that had occurred in the last year (Park et al., 1996).
Respondents also rated the stressfulness of the event at the time of event occurrence, current
stressfulness of the event, and the amount of personal growth they had experienced because
of the event (Park et al., 1996). Factor analysis and internal reliability statistics suggested that
this was a psychometrically valid scale that cut across different types of traumatic events.
Correlates of SRGS were also examined; the SRGS was significantly correlated with initial
stressfulness, current stressfulness, one-item self-report growth, and distress as measured by
the Impact of Event Scale (IES; Horowitz, Wilner, & Alvarez, 1979). Although the SRGS is
a valid measure, it seems that the PTGI assumed prominence because it addresses more
severe trauma, as opposed to lower level stressors.
Particularly influential in the growth and trauma literature were Janoff-Bulman’s
(1992) efforts to articulate the processes through which adversity leads to psychological
5
harm. Her program of research was focused on shattered assumptions, the idea that ‘‘the
essence of trauma is the abrupt disintegration of one’s inner world. Overwhelming
experiences...shatter... fundamental assumptions’’ (Janoff-Bulman, 1992, p. 63). An
individual holds fundamental assumptions about the way the world operates, what Parkes
(1971) referred to as the assumptive world, which “includes everything we know or think we
know” (p. 103). Tedeschi and Calhoun’s (1996) work on PTG is acknowledged as an
extension of this work. Current models of PTG, then, begin with an examination of the extent
to which these core beliefs about the assumptive world are shattered (Calhoun & Tedeschi,
1998, 2004; Cobb, Tedeschi, Calhoun, & Cann, 2006; Janoff-Bulman, 1992, 2004; Tedeschi
& Calhoun, 2004).
The model of PTG began with the assessment of PTG, assessed using the
Posttraumatic Growth Inventory (PTGI; Tedeschi & Calhoun, 1996), which was developed
using extant literature regarding trauma and responses to adversity. Interviews with
individuals experiencing “a variety of major crises or stressors” were also utilized in initial
scale development (Cann, Calhoun, Tedeschi, Taku, et al., 2010). Based on the previous
qualitative research across numerous populations, three specific domains of growth were
expected prior to the development of the PTGI (Tedeschi & Calhoun, 1996). In terms of
perceived benefits, the themes that had emerged across many studies were changes in self-
perception, changes in interpersonal relationships, and a changed philosophy in life
(Tedeschi & Calhoun, 1996). After item development and tests of scale reliability, factor
analyses revealed a five-factor structure or a five-factor structure with a single higher-order
factor. The PTGI measures five domains of PTG: greater appreciation of life and changed

6
sense of priorities; warmer, more intimate relationships with others; a greater sense of
personal strength; recognition of new possibilities or paths for one's life; and spiritual
development (Taku, Cann, Calhoun, & Tedeschi, 2008; Tedeschi & Calhoun, 1996, 2004).
These five domains are consistently endorsed across various populations, ages, and gender
(Tedeschi & Calhoun, 2004).
Posttraumatic growth and psychological outcomes.
The validity of the PTG construct would presumably be supported by a positive
relationship with measures of positive psychological health. For example, Cann et al. (2010)
found that PTG is positively related to satisfaction with life. However, the relationship
between PTG and other psychological outcomes (e.g., depression, well-being, and suicidal
ideation) has been mixed, especially with regard to posttraumatic stress disorder (PTSD).
Although some conceptualize PTSD and PTG as mutually exclusive and opposite, the data
do not support this conclusion. Not all studies have found significant relationships between
PTG and mental health (Cordova, Cunningham, Carlson, & Andrykowski, 2001), but some
have found PTG to be negatively associated with distress (Frazier, Conlon, & Glaser, 2001;
Park et al., 1996). Though it may seem counterintuitive, others have found a positive
association between distress and PTG (Park & Lechner, 2006). It is still unclear what
mechanisms account for the inconsistency in these findings (Cobb et al., 2006). Some
discrepancies may be attributed to the measurement of distress, but even using consistent
measures, there have been mixed findings regarding the relationship between PTSD and PTG
(Zoellner & Maercker, 2006). Detailed findings, including magnitude, are included in Table

7
3. Coyne and Tennen (2010) offer possibilities for the lack of association between growth
outcomes and other outcomes of interest (e.g., depression, wellbeing, PTSD), including a
non-linear relationship, moderators, and the potential for both positive and negative effects of
this style of coping.
Core Beliefs and Posttraumatic Growth
An examination of the processes through which adversity influences psychological
well-being might help untangle the contradictory findings regarding PTG and mental health.
More recently, researchers developed a measure of shattered assumptions or core beliefs,
measured by the Core Beliefs Inventory (CBI; Cann, Calhoun, Tedeschi, Kilmer, et al.,
2010). This challenging of core beliefs causes a person to ruminate in sometimes productive
(deliberative) and counterproductive (intrusive) ways, as measured by the Event Related
Rumination Inventory (ERRI; Cann et al., 2011). The more one’s core beliefs are challenged,
the more cognitive work that must be done and the more opportunity there is for PTG.
Research has shown that a critical part of adapting to trauma and rebuilding worldview
schema is cognitive processing (Greenberg, 1995). It is the cognitive processing, and not the
trauma itself, that leads to growth. It is possible for someone to be experiencing elements of
both intrusive and deliberative rumination as well as both distress and PTG. Figure 1 depicts
the author’s rendering of Tedeschi and Calhoun’s current theoretical model of PTG.
Given the mixed results and lack of clarity between PTG and outcomes of interest, it
is desirable to continue to investigate possible relationships and their temporal aspects.
Without clearly determining reliable associations, the pragmatic value of PTG as a tool for
decreasing distress through its intentional facilitation is unknown. This study will address

8
this by examining the relationship between PTG (as measured by the PTGI) and wellbeing
(as measured by the Satisfaction with Life Scale; Diener, Emmons, Larsen, & Griffin, 1985).
The Core Beliefs Inventory. The Core Beliefs Inventory (CBI) was developed based
on Janoff-Bulman’s (1992) notion of shattered assumptions and is a critical component of the
current PTG model. The CBI measures a core element of the PTG model: core beliefs. It is
theorized that the extent to which someone’s assumptions are shattered correlates positively
with both the amount of distress that they will experience as well as the amount of growth
they may experience. This measure was initially developed, and an exploratory factor
analysis performed, using undergraduate students.
Core Beliefs and PTG. To date, several studies have examined the relationship
between challenge to core beliefs and PTG. Results suggest that the extent to which one’s
core beliefs are challenged is predictive of the amount of growth one reports. The first study
found that CBI scores were positively correlated with PTGI (r = .57, p < .001), as well as
stressfulness at the time of the event (r = .24) and current stressfulness reported (r = .30)
(Cann, Calhoun, Tedeschi, Kilmer, et al., 2010). CBI scores were negatively correlated with
wellbeing, as measured by the Satisfaction with Life Scale (r = -.30) and were not correlated
with time since event (r = -.01) (Cann, Calhoun, Tedeschi, Kilmer, et al., 2010). A regression
analysis was then conducted to determine whether or not CBI was useful in explaining PTG.
The model included CBI, time since event, stressful of the event at the time the event
happened, and gender. The overall model was significant [F(4, 176) = 22.74, p < .001, R2adj =
.33], with CBI (! = .571, p < .001) and time since event (! = .121, p = .05) significantly
predicting PTG. Subsequent studies have produced similar results, with CBI correlating

9
strongly with PTGI (r = .58, p < .01; Lindstrom, Cann, Calhoun, & Tedeschi, 2013),
including longitudinally (Danhauer et al., 2013). A recent study using structural equation
modeling also provided support for the current model of PTG, with cancer-related distress
predicting core belief examination, followed by intrusive rumination, deliberate rumination,
and PTG (Wilson, Morris, & Chambers, 2014).
PTG, SWL, and Time. A critical and currently understudied area of PTG is the
temporal aspect of the model. In initial work on stress-related growth, there were
nonsignificant results for a correlation with time since event (Park, et al., 1996). This may be
due to the restricted range, as participants only reported on events that occurred within the
last year. In the seminal article on CBI, researchers included time since event as a predictor
of PTG. While time since event was significantly predictive of PTG, it was not predictive of
satisfaction with life. It is unclear how quickly PTG is experienced over time, and how
variable this process may be across individuals. This study will seek to add to this body of
work by examining time as a predictor of PTG, including possible nonlinear relationships,
and SWL as well.
PTG and Gender. There have been prior findings of gender differences in PTG
(Hegelson, Reynolds, & Tomich, 2006), such that women tend to report higher levels of
PTG. Gender differences in CBI scores also were found in the study reporting on the
development of the measure, such that women tended to report higher challenge to core
beliefs (authors noted that while this was statistically significant, it is a potentially trivial
difference given the small effect size) (Cann, Calhoun, Tedeschi, Kilmer, et al., 2010).

10
Associations between gender and PTG as well as gender and CBI will be examined in this
study as well.
Implications of PTG Models for Intervention. The past decade has seen an increase
in the examination of pathological outcomes stemming from participation in both Operation
Enduring Freedom and Operation Iraqi Freedom (OEF/OIF), including major depression,
generalized anxiety disorder, and PTSD (Hoge et al., 2004). Percentages of soldiers requiring
mental health treatment ranged from 20.3% to 42.4% in one study of 88,235 United States
soldiers (Milliken, Auchterlonie, & Hoge, 2007). There has been an increased interest in
preventive intervention efforts that might forestall or mitigate such harm. The PTG model
has been used to help support the development of a major resilience building effort among
military personnel (Cornum, Matthews, & Seligman, 2011). Replication of the relationships
among variables in the PTG model among military personnel would seem important in
understanding its applicability to this population. Current studies’ limitations include the use
of undergraduate students in the development of the model of PTG (Lindstrom et al., 2011),
and the homogeneity of the population (Stockton et al., 2011).
Although the CBI has been validated in undergraduate students and has been used to
predict PTG, it is essential to ask under what conditions these theories operate (Greenwald,
Pratkanis, Leippe, & Baumgardner, 1986). One important developmental question is when
young adults develop a strong enough set of core beliefs such that a challenge to them might
cause distress and whether undergraduates are the most appropriate population on whom to
test the PTG model. Further research with diverse populations is necessary to continue to
develop our understanding of the concept of core beliefs and its association with PTG, as

11
well as its generalizability across experiences and populations. Due to the high incidence of
trauma related to deployment, as well as secondary trauma, these advances could make a
particular contribution to military psychology and Veterans’ mental health.
Statement of Problem
Though initial development of the literature on growth outcomes followed a logical
progression from anecdotal evidence, to exploratory qualitative and exploratory quantitative
analyses, as well as scale development, the theory of PTG is now informing intervention and
preventive efforts (Cornum, Matthews, & Seligman, 2011), necessitating a clear
understanding of the entire process. It is necessary to continue critical empirical analysis of
growth and its related constructs, in order to better understand potential practical uses of such
theory.
Aims and Hypotheses
Aim 1
The first aim of this project is to examine the psychometric properties of the Core
Beliefs Inventory, a measure designed to assess the extent to which an adverse event
challenges a person’s core beliefs or assumptive world, in a sample of military Veterans.
Hypothesis 1. I hypothesize finding that the Core Beliefs Inventory measures one
latent construct, challenge to core beliefs, and shows high internal reliability.
Analytic strategy 1. Confirmatory Factor Analysis to assess the underlying latent
constructs being assessed, as well as Cronbach’s alpha to assess internal reliability. Goodness
of Fit indices will be used to assess the degree to which the CBI measures one latent
construct, or factor.

12
Aim 2
The second aim of this project is to replicate Study 1 by (Cann, Calhoun, Tedeschi,
Kilmer, et al., 2010), which utilized an undergraduate student sample in a cross-sectional
study to examine the internal reliability of the Core Beliefs Inventory (CBI) and its
relationship to PTG, in a sample of military Veterans. For this reason, the same variables and
analytic strategies will be utilized, so that any discrepancies in results can be more likely
attributed to differences between the samples.
Hypothesis 2a. I hypothesize finding an association between disruption of core
beliefs and stressfulness at the time of the event with PTG, while controlling for gender.
Specifically, disruption of core beliefs and time since event will be significant unique
predictors of PTG, such that greater disruption of core beliefs and longer time since event
will be associated with higher PTG. Associations of stressfulness at time of event and gender
with PTG will be nonsignificant. This is congruent with findings in the Cann et al. (2010)
study.
Analytic strategy 2a. A linear regression analysis predicting PTGI total scores will
be run with the following variables: CBI scores, time since the event, and stressfulness of the
event at the time it happened (1 “not at all stressful” to 7 “extremely stressful”). All predictor
variables will be entered at once. Tolerance levels and VIF will be assessed, as well as
bivariate correlations run to assess collinearity. Gender will be included as a covariate
because it was included in the Cann et al. (2010) study, in light of prior findings of gender
differences in PTG (Hegelson et al., 2006).

13
Hypothesis 2b. I hypothesize finding an association between disruption of core
beliefs, current stressfulness, and PTG with well-being, while controlling for gender.
Specifically, greater disruption of core beliefs and higher reports of current stressfulness will
be significant negative predictors and greater PTG, a significant positive predictor of well-
being. Associations of time since event and gender with PTG will be nonsignificant. This is
congruent with what was found in the Cann et al. (2010) study.
Analytic strategy 2b. A second linear regression analysis will be run to predict well-
being, as measured by the Satisfaction with Life Scale (SWLS; Diener, Emmons, Larsen, &
Griffin, 1985) scores. Predictors will include PTGI scores, CBI scores, current stressfulness
(1 “not at all stressful” to 7 “extremely stressful”) (instead of stress at time of event), and
time since event. Gender will be included as a covariate. All predictors will be entered at
once. Tolerance levels and VIF will be assessed, as well as bivariate correlations run to
assess collinearity.
Aim 3
The third aim of this study is to test a comprehensive PTG conceptual model in
military Veterans that describes the process through which disruption of core beliefs can lead
to PTG and/or PTSD symptoms over time.
Hypothesis 3. The hypothesized model is provided in Figure 2. I hypothesize that
greater challenge to core beliefs will be associated with higher levels of both intrusive and
deliberate rumination. Intrusive rumination will be associated with higher levels of PTSD
symptoms, and deliberate rumination will be associated with higher levels of PTG. PTSD
symptoms and PTG will be highly correlated with each other as well.

14
Analytic strategy 3. Structural equation modeling (SEM) is used to test the validity
of the proposed model. SEM is preferred over multiple regression for several reasons, most
notably (for the purposes of this study) the ability to develop complex path models with
direct and indirect effects and more accurately model causal mechanisms (Leong & Austin,
2005). The root mean square error of approximation (RMSEA) will be used to determine the
model of best fit, with fit statistics less than 0.08 indicating a better fit (Vandenberg & Lance,
2000).
Method
Procedure
An online survey was developed and posted on Amazon’s Mechanical Turk (mTurk).
The study was presented as an opportunity to further the theoretical framework of how
Veterans experience life following adversity. Amazon’s mTurk allows investigators to post
human intelligence tasks (HITs) to be performed by workers registered on the site. Workers
were credited $1.45 for their participation in this survey. Participation in the survey was
limited to military Veterans who had experienced an emotionally traumatic or distressing
event within the last three years.
The first qualifying question asked the Veteran to report on the most stressful event that
he/she had experienced within the last three years. This is congruent with work in the
development of the CBI, where Cann et al., 2010 asked that all undergraduate students fill
out a survey by reporting on the most stressful event that they had experienced in the last
three years. A second qualifying question asked the participant to select which criterion is
met for status as a Veteran, as determined by the Federal Government (see Participants

15
section below).
The first section included a list of commonly reported traumatic experiences, derived
from the PTGI (Tedeschi & Calhoun, 1996). The participant was asked to choose the most
distressing event that occurred within the last three years. The remainder of the survey asked
that respondents report on this event in particular.
Participants
This sample consisted of military Veterans only. Active Duty, Retired, and Separated
Veterans were eligible. Military Veterans were defined in a matter similar to the definition
provided by the Federal Government as follows:
“To meet the criterion of Veteran, your service must meet one of the following conditions:
• 180 or more consecutive days, any part of which occurred during the period beginning
September 11, 2001 and ending on a future date prescribed by Presidential proclamation or
law as the last date of Operation Iraqi Freedom, OR
• Between August 2, 1990 and January 2, 1992, OR
• 180 or more consecutive days, any part of which occurred after January 31, 1955 and
before October 15, 1976.
• In a war, campaign or expedition for which a campaign badge has been authorized or
between April 28, 1952 and July 1, 1955.” (Veterans Services, 2015)
Veterans reported on the most distressing event within the last three years. This timeframe
is restricted in order to mitigate difficulties in retrospective recall. A similar timeframe has
been used in previous studies of PTG and core beliefs (Cann, Calhoun, Tedeschi, Kilmer, et
al., 2010).

16
After data cleaning (see section below), 197 participants completed the survey. The
mean age of participants was 36.01 (SD = 10.94, range 21-71). The sample was 69.4% male
and 30.6% female, for an overrepresentation of female Veterans compared to the national
population of Veterans (9%; National Center for Veteran Analysis and Statistics, 2014). This
is not surprising, given that 70% of American Turkers are female (Ipeirotis, 2014).
Participants were predominately European-American/Caucasian/White (82.7%, n = 163),
while 8.6% (n = 17) were African-American/Black, 5.1% (n = 10) were biracial/multiracial,
and 2% (n = 4) were Asian. One respondent (0.5%) reported being American Indian/Alaska
Native and one respondent (0.5%) reported being Native Hawaiian/Pacific Islander. The
majority of respondents (n = 171, 89.5%) were not Hispanic/Latino and 10.5% (n = 20)
reported Hispanic/Latino ethnicity.
Respondents were from all five branches of the military, with the majority being Army
Veterans (47.7%, n = 94), followed by Air Force (19.3%, n = 38), Navy (16.2%, n = 32),
Marines (12.7%, n = 25), and Coast Guard (4.1%, n = 8). The National Center for Veteran
Analysis and Statistics (2014) reports the branch of military service only for active duty
Veterans, and combines all branches of Reserve and National Guard for reporting purposes,
making a direct comparison somewhat complicated. That being said, this sample was similar
to estimates of the current population of living Veterans (43% Army, 22% Navy, 18% Air
Force, 11% Marines, and 2% Coast Guard). The majority also reported being Active Duty at
the time of service (71.9%, n = 138), compared to Reserves (19.3%, n = 37) and National
Guard (8.9%, n = 17). This is a greater proportion of Reserve and National Guard than is
estimated in the national population of Veterans (only 5%; National Center for Veteran
17
Analysis and Statistics, 2014), but this could be due to a difference in reporting, as the VA
classifies Veterans as Active Duty if they have ever served on Active Duty, and many
Veterans may classify themselves as Reserve or National Guard if that is the status under
which they retired or were discharged. Veterans represented enlisted (n = 171, 86.8%) and
officer (n = 26, 13.2%) ranks, ranging from E-1 to E-9, W-1 to W-4, and O-1 to O-4. The
majority (n = 127, 64.4%) were between E-3 and E-5 ranks. !
Statistical Power and Sample Size Calculations
In order to estimate anticipated effect sizes for this study’s hypotheses associated with
Aim 2, the total variance explained in PTG scores using the CBI and Time since Event in the
original study to be replicated (Cann, Calhoun, Tedeschi, Kilmer, et al., 2010) was used.
These two predictors explained 33% of the variance in PTG scores, with CBI contributing an
R2 change of 26.80 and time since event contributing an R2 change equal to 5.68. The effect
size of the multiple regression (Cohen’s f2) was calculated using this given R2. Because time
was the smaller effect of the two variables, it was used to calculate required sample size. An
R2 of .0568 is equal to an effect size f2 of .0602 [f2=R2/(1-R2)]. The sample size requirement
was then calculated using G*Power software, using an effect size (f2) of .0602, at " = .05,
Power = 0.8, with up to 6 predictors. Using these parameters, a sample size of 144
participants was required (Faul, Erdfelder, Buchner, & Lang, 2009). A goal of 200
participants is accepted for the use of SEM (Garver & Mentzer, 1999; Hoelter, 1983), and a
similar recommendation is made for CFA (Kline, 2005).
Measures
Dependent Variables:

18
Posttraumatic Growth; PTGI – Posttraumatic Growth Inventory – a 21-item
instrument for assessing positive outcomes in people who have experienced traumatic events.
Five domains or factors are assessed (e.g., Relating to Others, New Possibilities, Personal
Strength, Spiritual Change, and a deeper Appreciation of Life) (Tedeschi & Calhoun, 2004)
as well as a single higher order factor (Taku et al., 2008). Internal consistency for both the
total PTGI score and subscales of the PTGI has been found to be satisfactory (" coefficient
for PTGI total scale = .90, Relating to Others = .85, New Possibilities = .84, Personal
Strength = .72, Spiritual Change = .85, Appreciation of Life = .67) in the original study
(Tedeschi & Calhoun, 1996). Test-retest reliability based on a sample of university students
over two months was mediocre (.71). Correlations among PTGI, social desirability, and
personality variables, as well as comparisons between participants who had experienced
trauma and those who had not assessed concurrent, discriminant, and construct validity;
direction and magnitude of the correlations were as predicted, suggesting the PTGI is a valid
measure (Tedeschi & Calhoun, 1996). This measure yields a total score between 0-105. In
this sample, the PTGI (M = 45.91, SD = 24.68, Min = 0, Max = 102) showed high internal
reliability (Cronbach’s " = .95). For a complete copy of the measure, see Appendix A.
Satisfaction with Life Scale – SWLS – 5 items to assess global life satisfaction. The
SWLS (M = 21.95, SD = 7.60) showed good internal reliability in this sample (Cronbach’s "
= .91). A complete copy of the measure can be found in Appendix C.
Independent Variables:
Core Beliefs Inventory; CBI – 9-item measure assessing the degree to which one’s
assumptive world was challenged by an adverse event (Cann et al., 2010). Internal reliability

19
during scale construction was found to be good (" = .82) and a second study confirmed these
findings (" = .87) (Cann, Calhoun, Tedeschi, Kilmer, et al., 2010). Test-retest reliability was
acceptable (r = .69). Although the PTGI has been used with Veterans (Kaler et al., 2011;
Tedeschi & McNally, 2011), the CBI still has not been validated with this population. The
CBI (Min = 0, Max = 45, M = 22.42, SD = 11.02) showed good internal reliability in this
study (Cronbach’s " = .91). For a complete copy of the measure, see Appendix B.
Time since Event – Measured in years and months
Stressfulness Now – Stressfulness of traumatic event now (1 “not at all stressful” to 7
“extremely stressful”) (Cann, Calhoun, Tedeschi, Kilmer, et al., 2010)
Stressfulness Then – Stressfulness of traumatic event then (1 “not at all stressful” to 7
“extremely stressful”) (Cann, Calhoun, Tedeschi, Kilmer, et al., 2010)
Deliberate Rumination – amount of deliberate rumination after an adverse event as
measured by the Event Related Rumination Inventory (ERRI) 10-item deliberate factor (Min
= 0, Max = 30, M = 16.42, SD = 7.77). Internal consistency was strong (Cronbach’s " = .92)
in this study. For a complete copy of the measure, see Appendix F.
Intrusive Rumination – amount of intrusive rumination after an adverse event as
measured by the ERRI 10-item intrusive factor (Min = 0, Max = 30, M = 16.81, SD = 8.79).
Internal consistency was high (Cronbach’s " = .97) in this study. For a complete copy of the
measure, see Appendix F.
Covariates:
Gender – categorical; Female (0), Male (1)
Descriptive:

20
Age – continuous; in years
Military Branch – categorical; Army, Marines, Navy, Air Force, Coast Guard
Rank – categorical; Enlisted (0), Officer (1)
Race – categorical; European American/Caucasian/White, American Indian/Alaska
Native, Asian, African American/Black, Native Hawaiian/Pacific Islander,
Biracial/Multiracial, Other
Ethnicity – categorical; Hispanic/Latino, Not Hispanic/Latino
Status – categorical; Active Duty (0) vs. National Guard/Reserve (1)
Post-traumatic Stress Disorder (PTSD) symptoms – PCL-5 – PTSD symptoms were
measured using the PCL-5 (Weathers et al., 2013), a 20-item self-report measure that
assesses the 20 DSM-5 symptoms of PTSD. While there was a military version for DSM-IV
(PCL-M), there is no corresponding military version of PCL-5. The PCL-5 (Min = 0, Max =
80, M = 25.82, SD = 20.22) showed very high internal reliability in this sample (Cronbach’s
" = .97).
Participant Well-Being and Confidentiality
All responses were anonymous and confidential. Only aggregate data were examined.
Resources for dealing with mental health concerns were provided for all Veterans, in the
event that an individual was interested in receiving assistance (see Appendix E).
Results
Data Cleaning
A total of 255 participants accessed the survey. One participant did not consent and
exited the survey (N = 254). When asked which criterion was met for Veteran status, 21

21
selected “I am not a Veteran” (N =233). At the first Veteran check question, 12 selected “I
am not a Veteran” (N = 221). Two selected “I am not a Veteran” at the second Veteran
check question and one did not answer (N = 218). For the third Veteran check question, 1
participant selected “I am not a Veteran” (N = 217). Two participants failed all three Veteran
check questions and the attention check (N = 215) and one participant left every question
blank (N = 214). Finally, 17 participants left all scales blank (N = 197).
Missing Data
Missing data on the independent and predictor variables were varying, ranging from a
low of 1% for Satisfaction with Life, to a high of 14.7% for the PCL-5. The remaining
variables fell within this range: CBI (2.5%), ERRI-Intrusive (4.6%), PTGI (6.1%), ERRI-
Deliberate (6.6%). Dummy codes were created that separated the sample into two groups:
those with no missing data and those with any missing data for each of the six main variables
of interest (PTGI, CBI, SWL, ERRI-Intrusive, ERRI-Deliberate, and PCL-5). Analyses of
variance (ANOVAs) revealed no statistically significant differences between the two groups
on any demographic variables (age, sex, race, and ethnicity), suggesting that the data were
missing completely at random (i.e., MCAR).
Given the MCAR nature of the data, composite scores based on multi-item scales
were pro-rated using the individual’s mean on the other items (case-by-case item deletion or
ipsative mean imputation; Schafer & Graham, 2002) to replace missing values to the extent
feasible. When internal reliability is greater than .90, this practice does not introduce bias, as
all items are highly correlated (Osborne, 2013). A conservative threshold for imputing data
on measures or scales missing less than 10% for an individual was used. Because the PTGI is

22
a multi-factor scale, items were imputed by averaging the respondent’s score on that factor.
The changes in variables’ mean scores as a result of imputation were minimal and
statistically nonsignificant.
Descriptive Statistics
Means and standard deviations are reported in Table 4. In this study, Veterans
reported, on average, a small to moderate degree of growth as a result of the adverse event,
and a small to moderate degree of core belief challenge. Results show that, compared to the
Cann et al., 2010 article, participants in this study reported less stress associated with the
event at the time that it occurred, less challenge to core beliefs, less posttraumatic growth,
and lower satisfaction with life. Although these are statistically significant differences,
college students in the Cann et al. 2010 article can still be classified as having experienced
only a small to moderate degree of change, on average, as well as a moderate degree of core
belief challenge. In addition, this sample reported higher amounts of stress now related to the
adverse event.
Bivariate Relationships
The pattern of bivariate correlations was examined for expected results (see Table 4
for correlations and significance). Bivariate correlations demonstrated expected significant
associations between all of the main variables in the PTG model (PTG, core beliefs,
satisfaction with life, PTSD symptoms, and intrusive and deliberate rumination). Neither
time nor gender was associated with any of the variables in the PTG model. This is
inconsistent with some previous findings (Cann, Calhoun, Tedeschi, Kilmer, et al., 2010),
though these variables are not central to the concept model tested in this study. Results also

23
indicated that older participants reported on events that had happened longer ago than
younger participants (within the three year timeframe). Additionally, age was negatively
related to stress now and PTSD symptoms.
Hypothesis Testing
Factor Structure of CBI. Hypothesis 1, the presence of a single factor structure, was
supported, although the indicators were somewhat mixed. The factor structure of the Core
Beliefs Inventory was evaluated using confirmatory factor analysis (Figure 3). Based on
initial scale construction (Cann, Calhoun, Tedeschi, Kilmer, et al., 2010), a single-factor
structure was hypothesized. The model was assessed using the chi-square statistic and five fit
indices: Bollen’s Incremental Fit Index (IFI), Tucker-Lewis Index (TLI), Bentler-Bonett
Normed Fit Index (NFI), Comparative Fit Index (CFI), and Root Mean Square Error of
Approximation (RMSEA). Fit statistics closer to 1.00 indicate better fit for the CFI and TLI
(Hu & Bentler, 1999), while fit statistics less than 0.08 indicate better fit for the RMSEA
(Vandenberg & Lance, 2000).
The chi-square test was significant [#2 (27, N= 197) = 117.01], which is anticipated
with sample sizes over 100. This statistic also exceeds the recommended chi-square/degrees
of freedom ratio of 2:1. Two of the fit indices indicated a good fit for the one-factor solution
(IFI = .91; CFI = .91), and three indicated a poor fit (NFI = .88; TLI = .85; RMSEA = .13).
There have, however, been discussions of limitations of the use of the RMSEA with small
degrees of freedom (Kenny, Kaniskan, & McCoach, 2014). Additionally, principal
components analysis (PCA) indicated that only one factor had an eigenvalue over 1.

24
Conceptually, a 1-factor structure made more sense than alternative factor structures offered
by an Exploratory Factor Analysis.
PTG Regression. Hypothesis 2a was partially supported, with core beliefs, as
expected, being significantly associated with PTG; stressfulness at time since event was not a
significant predictor as hypothesized. Controlling for time since event (! = .06, p = .293),
gender (! = -.06, p = .263), and stressfulness at time of event (! = -.06, p = .340), Veterans
who reported experiencing greater challenge to core beliefs also reported significantly higher
posttraumatic growth than those with less core belief challenge (! = .68, p < .001). Overall,
the model significantly predicted posttraumatic growth. Challenge to core beliefs, time since
event, stressfulness at time of event, and gender accounted for 44% of the variability in PTG
scores [F(4) = 37.26, p < .001, R2adj
= .439]; this is greater variance explained than in the
same model in Cann et al., (2010; R2adj
= .33).
SWL Regression. Hypothesis 2b was fully supported; higher levels of PTG were
associated with higher levels of SWL and greater challenge to core beliefs was associated
with lower levels of SWL. Controlling for time since event (! = .05, p = .433) and gender (!
= .03, p = .651), Veterans who reported experiencing more PTG also reported experiencing
greater satisfaction with life (! = .47, p < .001), and Veterans who reported experiencing
greater challenge to core beliefs also reported significantly lower satisfaction with life than
those with less core belief challenge (! = -.45, p < .001). Current stressfulness of the event
also predicted significantly lower reports of satisfaction with life (! = -.29, p < .001). This
model significantly predicted satisfaction with life, and challenge to core beliefs, time since
event, gender, PTG, and current stressfulness accounted for 27% of the variability in SWL

25
scores [F(5) = 14.73, p < .001, R2adj
= .271]; the amount of variance explained was more than
in the original study by Cann et al. (2010; R2adj=.19).
SEM. Hypothesis 3 was fully supported. Due to the inconsistent relationships
between PTG and PTSD, and the necessity to designate a variable as either an independent or
dependent variable in a regression analysis, structural equation modeling (SEM) was
conducted using SPSS AMOS Version 7.0 (Arbuckle, 2006) in order to determine the best
fitting model for predicting PTG and PTSD among military Veterans. This model analyzed
seven variables: core beliefs, time since event, deliberate rumination, intrusive rumination,
PTG and PTSD symptoms, and satisfaction with life. Challenge to core beliefs is directly
associated with both deliberate and intrusive rumination. Intrusive rumination is then
associated with deliberate rumination. Deliberate rumination is directly related to PTG and
intrusive rumination is directly related to PTSD symptoms. PTG and PTSD symptoms
mediate the relationship between rumination styles and satisfaction with life. PTG and PTSD
symptoms are also significantly correlated with one another. The Chi-square statistic for the
model was significant [#2(770) = 1598.37, p < .001], as is expected given the sample size
(N=197) and its sensitivity to even slight differences between observed and predicted
covariances (Kline, 2005). Model fit statistics indicated a good fit (RMSEA = .074, 90% CI
= .069-.079). Figure 4 depicts the structural equation model. Table 5 shows all direct,
indirect, and total effects in the model. Also of interest are results of the PTGI. While all five
factors are typically highly correlated (Lee, Luxton, Reger, & Gahm, 2010), it should be
noted that the items regarding the domain of Spiritual Change were not highly endorsed in
this sample.

26
Discussion
Sample
Several aspects of this sample should be discussed, particularly in comparison to the
Cann et al. 2010 study and with respect to clinical levels of distress. The Veterans in this
sample reported lower levels of PTG and core belief challenge than the undergraduates in the
Cann et al. 2010 article. There are several possible explanations for these differences. One
could hypothesize that the three-year timeframe prevented Veterans from reporting on the
most adverse events that they have experienced, while undergraduates were more likely to
have experienced a subjectively adverse experience in the same timeframe. Another possible
explanation is that the lack of reporting on spiritual matters in the Veteran sample skewed the
overall scores. Indeed, if the average item score for the CBI is calculated without the item on
spirituality, the mean (3.60) is higher than that of the undergraduate sample, and the mean on
the PTGI increases significantly as well.
In addition to the participants in this study reporting less stress associated with the
event at the time that it occurred, less challenge to core beliefs, less posttraumatic growth,
and lower satisfaction with life, as well as higher amounts of stress now related to the
adverse event, there are demographic differences as well. Clearly, this study aimed to
validate previous findings from an undergraduate sample in a sample of military Veterans.
Aside from differences in military status, this sample was also older in age (M = 36.01 versus
22.8 in Cann et al. 2010). In terms of types of events on which participants reported, there
were some similarities and some noticeable differences. The most commonly reported event
in this sample was loss of a loved one (23.4%); this is congruent with the undergraduate

27
sample (24%). Veterans also reported on financial hardship (20.3%), job loss (12.2%), career
or location change/move (6.6%), change in family responsibility (6.1%), accident or injury
(6.1%), divorce (5.6%) and combat (5.6%), with no other category representing more than
5%. The undergraduates in the Cann et al. 2010 study reported most often on serious
relationship issues (23%), school problems, typically involving academic probations,
suspensions, or failure to be admitted to a desired college (15%), serious medical issues
(9%), relocation transitions, typically involving moving out of state to begin college (8%),
and motor vehicle accidents (5%) (Cann, Calhoun, Tedeschi, Kilmer, et al., 2010).
This sample also needs to be contextualized in terms of clinical levels of distress. On
the PCL-5, the cutoff score that has been suggested for meeting provisional diagnostic
criteria for PTSD is a total score of 38 (Weathers et al., 2013). Using these guidelines in this
sample, 32.7% of Veterans had levels of PTSD symptoms that can be indicative of a
provisional diagnosis of PTSD. This suggests that, while Veterans with clinical levels of
PTSD were well-represented, the majority of participants were not experiencing clinical
symptoms or distress.
Results
The main purposes of this study were to examine the psychometric properties of the
Core Beliefs Inventory in military Veterans, replicate the results of initial CBI work in
Veterans, and to test a conceptual path model of challenge to core beliefs, rumination styles,
time, PTG, PTSD symptoms, and life satisfaction. Findings from a confirmatory factor
analysis provide some support for a one-factor solution, though fit statistics were mixed. It
should also be noted how few people, in this sample, endorsed Item 8 of the CBI (“Because

28
of the event, I seriously examined my spiritual or religious beliefs.”), compared to the other
items. It is possible that these results were due to a lack of endorsement of religious and
spiritual core belief challenge by this sample of Veterans.
For the second study aim, there was strong support for relationships derived from the
theoretical model of PTG in regression analyses predicting PTG and satisfaction with life.
Specifically, there was solid support for the value of the CBI in predicting PTG scores, as
well as support for the value of both CBI and PTG in predicting SWL. Time was not
associated significantly with PTG or SWL in either bivariate or multivariate analyses.
Although this relationship was found in the Cann et al. (2010) article, it is not central to the
model of PTG and there is not yet strong theoretical understanding of how temporal aspects
should influence PTG.
Examination of the time by PTG scatter plot shows wide variation in the relationship.
Not only did it not appear linear, there was also no curvilinear or quadratic relationship
within this three-year timeframe, leaving many areas of future exploration. Specifically, what
causes some Veterans to report high levels of PTG after only one or two months of
experience of a traumatic event? Also, what causes some Veterans to report very low levels
of PTG a full three years following the trauma? Longitudinal work that addresses the natural
course of PTG development is warranted.
Lastly, structural equation modeling was used to examine the relationships between
core belief challenge, intrusive and deliberate rumination, PTG, PTSD symptoms, and life
satisfaction. There was strong support for this model, with model fit statistics suggesting a
good fit as well as all paths showing statistical significance. Specifically, challenge to core
29
beliefs was directly associated with both intrusive and deliberate rumination, and intrusive
rumination was associated with deliberate rumination. This supports the idea that intrusive
rumination may act as a catalyst for individuals to engage in more deliberate types of
rumination following trauma. It is this deliberate rumination style, a sort of cognitive work,
which is thought to lead to experiences of PTG. Indeed, the results of this study support this
notion. Results of the structural equation model suggest that deliberate rumination is directly
associated with PTG, while intrusive rumination is directly related to PTSD symptoms.
Interestingly, and of particular importance to this population, is the possibility that a
certain level of cognitive functioning might by necessary to apply this model. This may be
problematic in a population that has such high prevalence of traumatic brain injury (TBI) and
mild traumatic brain injury (mTBI). Another limiting factor may be substance use or any
other factor limiting cognitive capacity. The potential for these factors to impede deliberate
rumination should be kept in mind when assessing the applicability of this model to any
sample.
Also of importance is support for the coexistence of PTG and PTSD symptoms. This
is especially important to note when one examines the contrasting associations between PTG
with life satisfaction and PTSD symptoms with life satisfaction. Results from this study show
the strong positive association between PTG and life satisfaction, as well as the strong
negative association between PTSD symptoms and life satisfaction. Overall, these findings
are congruent with the few studies that have examined a similar model in differing
populations (e.g., Triplett, Tedeschi, Cann, Calhoun, & Reeve, 2012; Wilson et al., 2014).
Limitations

30
There are a few limitations of this study that should be mentioned. Most importantly,
this cross-sectional study provides only correlational data and therefore causality cannot be
inferred. Secondly, though demographic characteristics suggest representation from a variety
of Veterans, this was a convenience sample and was not nationally representative. In the
same vein, this is one of the first studies to use mTurk with Veterans, and differences
between mTurk Veterans and others have not been fully examined. Additionally, we must
continue to exercise caution in the interpretation of self-reports of PTG and its related
constructs. As Coyne & Tennen (2010) note, there is a certain complexity to the judgments
participants are asked to make (“(a) evaluate her/his current standing on the dimension
described in the item, e.g., a sense of closeness to others; (b) recall her/ his previous standing
on the same dimension; (c) compare the current and previous standings; (d) assess the degree
of change; and (e) determine how much of that change can be attributed to the stressful
encounter.” p. 24).
Future Directions
Future studies should examine these constructs longitudinally, including measures of
life satisfaction pre-trauma, when possible. This is particularly difficult given the lifetime
prevalence of trauma in military Veterans. These results have important implications for
interventions with military Veterans. First, while many researchers and clinicians focus their
efforts on decreasing PTSD, it is also possible to examine intervention opportunities in
facilitating increases in PTG in order to affect satisfaction with life. Secondly, standardized
regression weights show the relative importance or value of PTG and PTSD symptoms in
overall life satisfaction. These results suggest that PTSD symptoms may have a more

31
powerful effect on life satisfaction than PTG. Additionally, this study provides support for
the positive effects of deliberate rumination following trauma. These results also suggest a
need to further investigate the ways in which military Veterans may or may not experience
challenge of core beliefs and PTG related to spirituality or religiosity. This is particularly the
case because current resilience training (e.g., Comprehensive Soldier Fitness) includes a
component of spirituality; including spiritual fitness in Comprehensive Soldier Fitness
remains controversial.

32
REFERENCES
Affleck, G., & Tennen, H. (1996). Construing benefits from adversity: Adaptational
significance and dispositional underpinnings. Journal of Personality, 64(4), 899–922.
http://doi.org/10.1111/1467-6494.ep9706272191
Antonovsky, A. (1979). Health, stress, and coping. Jossey-Bass.
Bonanno, G. A. (2004). Loss, Trauma, and Human Resilience: Have We Underestimated the
Human Capacity to Thrive After Extremely Aversive Events? The American
Psychologist, 59(1), 20–28.
Burt, M. R., & Katz, B. L. (1987). Dimensions of recovery from rape: Focus on growth
outcomes. Journal of Interpersonal Violence, 2, 57–81.
Calhoun, L. G., & Tedeschi, R. G. (1998). Posttraumatic growth: positive changes in the
aftermath of crisis. Mahwah, NJ: Erlbaum.
Calhoun, L. G., & Tedeschi, R. G. (2004). The foundations of posttraumatic growth: New
considerations. Psychological Inquiry, 15, 93–102.
Cann, A., Calhoun, L. G., Tedeschi, R. G., Kilmer, R. P., Gil-Rivas, V., Vishnevsky, T., &
Danhauer, S. C. (2010). The Core Beliefs Inventory: A Brief Measure of Disruption
in the Assumptive World. Anxiety, Stress & Coping: An International Journal, 23(1),
19–34.
Cann, A., Calhoun, L. G., Tedeschi, R. G., Taku, K., Vishnevsky, T., Triplett, K. N., &
Danhauer, S. C. (2010). A Short Form of the Posttraumatic Growth Inventory.
Anxiety, Stress & Coping: An International Journal, 23(2), 127–137.

33
Cann, A., Calhoun, L. G., Tedeschi, R. G., Triplett, K. N., Vishnevsky, T., & Lindstrom, C.
M. (2011). Assessing Posttraumatic Cognitive Processes: the Event Related
Rumination Inventory. Anxiety, Stress & Coping: An International Journal, 24(2),
137–156.
Caplan, G. (1964). Principles of preventive psychiatry. New York: Basic Books.
Cobb, A. R., Tedeschi, R. G., Calhoun, L. G., & Cann, A. (2006). Correlates of Posttraumatic
Growth in Survivors of Intimate Partner Violence. Journal of Traumatic Stress, 19(6),
895–903.
Cordova, M. J., Cunningham, L. L. C., Carlson, C. R., & Andrykowski, M. A. (2001).
Posttraumatic growth following breast cancer: A controlled comparison study. Health
Psychology, 20, 176–185.
Coyne, J. C., & Tennen, H. (2010). Positive Psychology in Cancer Care: Bad Science,
Exaggerated Claims, and Unproven Medicine. Annals of Behavioral Medicine, 39(1),
16–26. http://doi.org/10.1007/s12160-009-9154-z
Danhauer, S. C., Russell, G. B., Tedeschi, R. G., Jesse, M. T., Vishnevsky, T., Daley, K., …
Powell, B. L. (2013). A Longitudinal Investigation of Posttraumatic Growth in Adult
Patients Undergoing Treatment for Acute Leukemia. Journal of Clinical Psychology
in Medical Settings, 20(1), 13–24. http://doi.org/10.1007/s10880-012-9304-5
Diener, E., Emmons, R. A., Larsen, R. J., & Griffin, S. (1985). The Satisfaction With Life
Scale. Journal of Personality Assessment, 49(1), 71.
Dohrenwend, B. S. (1978). Social stress and community psychology. American Journal of
Community Psychology, 6, 1–15.

34
Draucker, C. (1992). Construing benefit from a negative experience of incest. Western
Journal of Nursing Research, 14, 343–357.
Faul, F., Erdfelder, E., Buchner, A., & Lang, A. G. (2009). Statistical power analyses using
G*Power 3.1: Tests for correlation and regression analyses. Behavior Research
Methods, 41, 1149–1160.
Frankl, V. E. (1963). Man’s search for meaning. New York: Pocket Books.
Frazier, P., Conlon, A., & Glaser, T. (2001). Positive and negative life changes following
sexual assault. Journal of Consulting and Clinical Psychology, 69, 1048–1055.
Garver, M. S., & Mentzer, J. T. (1999). Logistics research methods: Employing structural
equation modeling to test for construct validity. Journal of Business Logistics, 20(1),
33–57.
Greenberg, M. A. (1995). Cognitive Processing of Traumas: The Role of Intrusive Thoughts
and Reappraisals1. Journal of Applied Social Psychology, 25(14), 1262–1296.
http://doi.org/10.1111/j.1559-1816.1995.tb02618.x
Greenwald, A. G., Pratkanis, A. R., Leippe, M. R., & Baumgardner, M. H. (1986). Under
what conditions does theory obstruct research progress? Psychological Review, 93(2),
216–229. http://doi.org/10.1037/0033-295X.93.2.216
Hegelson, V. S., Reynolds, K. A., & Tomich, P. L. (2006). A meta-analytic review of benefit
finding and growth. Journal of Consulting and Clinical Psychology, 74(5), 797–816.
http://doi.org/10.1037/0022-006X.74.5.797
Hoelter, D. R. (1983). The analysis of covariance structures: Goodness-of-fit indices.
Sociological Methods and Research, 11, 325–344.

35
Hoge, C. W., Castro, C. A., Messer, S. C., McGurk, D., Cotting, D. I., & Koffman, R. L.
(2004). Combat Duty in Iraq and Afghanistan, Mental Health Problems, and Barriers
to Care. New England Journal of Medicine, 351(1), 13–22.
http://doi.org/10.1056/NEJMoa040603
Horowitz, M., Wilner, N., & Alvarez, W. (1979). Impact of Event Scale: A measure of
subjective stress. Psychosomatic Medicine, 41, 209–218.
Hu, L., & Bentler, P. M. (1999). Cutoff criteria for fit indexes in covariance structure
analysis: Conventional criteria versus new alternatives. Structural Equation
Modeling: A Multidisciplinary Journal, 6(1), 1–55.
http://doi.org/10.1080/10705519909540118
Ipeirotis, P. (2014). Demographics of Mechanical Turk. Department of Information,
Operation, and Management Sciences, Leonard N. Stern School of Business, New
York University.
Janoff-Bulman, R. (1992). Shattered assumptions: Towards a new psychology of trauma.
New York: Free Press.
Janoff-Bulman, R. (2004). Posttraumatic growth: Three explanatory models. Psychological
Inquiry, 15, 31–35.
Kaler, M. E., Erbes, C. R., Tedeschi, R. G., Arbisi, P. A., & Polusny, M. A. (2011). Factor
Structure and Concurrent Validity of the Posttraumatic Growth Inventory–Short Form
Among Veterans From the Iraq War. Journal of Traumatic Stress, 24(2), 200–207.

36
Kenny, D. A., Kaniskan, B., & McCoach, D. B. (2014). The Performance of RMSEA in
Models With Small Degrees of Freedom. Sociological Methods & Research,
0049124114543236. http://doi.org/10.1177/0049124114543236
Kline, R. B. (c2005.). Principles and practice of structural equation modeling (2nd ed.). New
York: Guilford Press,. Retrieved from
http://catalog.lib.ncsu.edu/record/NCSU1753098
Kobasa, S. C. (1979). Stressful life events, personality, and health: An inquiry into hardiness.
Journal of Personality and Social Psychology, 37(1), 1–11.
http://doi.org/10.1037/0022-3514.37.1.1
Lee, J. A., Luxton, D. D., Reger, G. M., & Gahm, G. A. (2010). Confirmatory Factor
Analysis of the Posttraumatic Growth Inventory with a Sample of Soldiers Previously
Deployed in Support of the Iraq and Afghanistan Wars. JOURNAL OF CLINICAL
PSYCHOLOGY, 66(7), 813–819.
Lindstrom, C. M., Cann, A., Calhoun, L. G., & Tedeschi, R. G. (2013). The Relationship of
Core Belief Challenge, Rumination, Disclosure, and Sociocultural Elements to
Posttraumatic Growth. Psychological Trauma: Theory, Research, Practice, and
Policy, 5(1), 50–55.
Maddi, S. R. (2002). The story of hardiness: Twenty years of theorizing, research, and
practice. Consulting Psychology Journal: Practice and Research, 54(3), 173–185.
http://doi.org/10.1037/1061-4087.54.3.173

37
Milliken, C. S., Auchterlonie, J. L., & Hoge, C. W. (2007). Longitudinal Assessment of
Mental Health Problems Among Active and Reserve Component Soldiers Returning
From the Iraq War. JAMA, 298(18).
National Center for Veteran Analysis and Statistics. (2014). Veteran Population. United
States Department of Veterans Affairs.
Osborne, J. W. (2013). Best Practices in Data Cleaning: A Complete Guide to Everything
You Need to Do Before and After Collecting Your Data. SAGE Publications, Inc.
Park, C. L., Cohen, L., & Murch, R. (1996). Assessment and prediction of stress-related
growth. Journal of Personality, 64, 71–105.
Park, C. L., & Lechner, S. (2006). Measurement issues in assessing growth following
stressful life experiences. In L. G. Calhoun & R. G. Tedeschi (Eds.), Handbook of
posttraumatic growth: Research and practice (pp. 47–67). Mahwah, NJ: Erlbaum.
Schafer, J., & Graham, J. (2002). Missing data: Our view of the state of the art.
Psychological Methods, 7(2), 147–177.
Taku, K., Cann, A., Calhoun, L. G., & Tedeschi, R. G. (2008). The Factor Structure of the
Posttraumatic Growth Inventory: A Comparison of Five Models Using Confirmatory
Factor Analysis. Journal of Traumatic Stress, 21(2), 158–164.
http://doi.org/10.1002/jts.20305
Tedeschi, R. G., & Calhoun, L. G. (1995). Trauma & transformation: growing in the
aftermath of suffering. Thousand Oaks, Calif.: Sage Publications.
Tedeschi, R. G., & Calhoun, L. G. (1996). The Posttraumatic Growth Inventory: Measuring
the Positive Legacy of Trauma. Journal of Traumatic Stress, 9(3), 455–471.

38
Tedeschi, R. G., & Calhoun, L. G. (2004). Posttraumatic Growth: Conceptual Foundations
and Empirical Evidence. Psychological Inquiry, 15(1), 1–18.
Tedeschi, R. G., & McNally, R. J. (2011). Can We Facilitate Posttraumatic Growth in
Combat Veterans? American Psychologist, 66(1), 19–24.
Triplett, K. N., Tedeschi, R. G., Cann, A., Calhoun, L. G., & Reeve, C. L. (2012).
Posttraumatic Growth, Meaning in Life, and Life Satisfaction in Response to Trauma.
Psychological Trauma: Theory, Research, Practice, and Policy, 4(4), 400–410.
http://doi.org/10.1037/a0024204
Vandenberg, R. J., & Lance, C. E. (2000). A Review and Synthesis of the Measurement
Invariance Literature: Suggestions, Practices, and Recommendations for
Organizational Research. Organizational Research Methods, 3(1), 4–70.
http://doi.org/10.1177/109442810031002
Veterans Services. (2015). Retrieved April 19, 2015, from http://www.opm.gov/policy-data-
oversight/veterans-services/veterans-services-faqs/
Weathers, F. W., Litz, B. T., Keane, T. M., Palmieri, P. A., Marx, B. P., & Schnurr, P. P.
(2013). The PTSD Checklist for DSM-5 (PCL-5). Scale Available from the National
Center for PTSD at Www.ptsd.va.gov.
Wilson, B., Morris, B. A., & Chambers, S. (2014). A structural equation model of
posttraumatic growth after prostate cancer. Psycho-Oncology, 23(11), 1212–1219.
http://doi.org/10.1002/pon.3546
Yalom, I. (1980). Existential therapy. New York: Basic Books.

39
Zoellner, T., & Maercker, A. (2006). Posttraumatic Growth in Clinical Psychology — A
Critical Review and Introduction of a Two Component Model. Clinical Psychology
Review, 26, 626–653.

40
APPENDICES

41
Appendix A
Posttraumatic Growth Inventory Indicate for the statement below the degree to which the change reflected in the question is true in your life as a result of your crisis, using the following scale.
0 = I did not experience this change as a result of my crisis.
1 = I experienced this change to a very small degree as a result of my crisis.
2 = I experienced this change to a small degree as a result of my crisis.
3 = I experienced this change to a moderate degree as a result of my crisis.
4 = I experienced this change to a great degree as a result of my crisis.
5 = I experienced this change to a very great degree as a result of my crisis.
1. I changed my priorities about what is important in life. (V) 2. I have a greater appreciation for the value of my own life. (V) 3. I developed new interests. (II) 4. I have a greater feeling of self-reliance. (III) 5. I have a better understanding of spiritual matters. (IV) 6. I more clearly see that I can count on people in times of trouble. (I) 7. I established a new path for my life. (II) 8. I have a greater sense of closeness with others. (I) 9. I am more willing to express my emotions. (I) 10. I know better that I can handle difficulties. (III) 11. I am able to do better things with my life. (II) 12. I am better able to accept the way things work out. (III) 13. I can better appreciate each day. (V) 14. New opportunities are available which wouldn't have been otherwise. (II) 15. I have more compassion for others. (I) 16. I put more effort into my relationships. (I) 17. I am more likely to try to change things which need changing. (II) 18. I have a stronger religious faith. (IV) 19. I discovered that I'm stronger than I thought I was. (III) 20. I learned a great deal about how wonderful people are. (I) 21. I better accept needing others. (I)

42
Appendix B
Instructions and individual items included in the Core Beliefs Inventory. Some events that people experience are so powerful that they ‘shake their world’ and lead them to seriously examine core beliefs about the world, other people, themselves and their future. Please reflect upon the event about which you are reporting and indicate the extent to which it led you to seriously examine each of the following core beliefs. 1. Because of the event, I seriously examined the degree to which I believe things that happen to people are fair. 2. Because of the event, I seriously examined the degree to which I believe things that happen to people are controllable. 3. Because of the event, I seriously examined my assumptions concerning why other people think and behave the way that they do. 4. Because of the event, I seriously examined my beliefs about my relationships with other people. 5. Because of the event, I seriously examined my beliefs about my own abilities, strengths and weaknesses. 6. Because of the event, I seriously examined my beliefs about my expectations for my future. 7. Because of the event, I seriously examined my beliefs about the meaning of my life. 8. Because of the event, I seriously examined my spiritual or religious beliefs. 9. Because of the event, I seriously examined my beliefs about my own value or worth as a person. Responses are on a six-point scale (0-5): 0 - not at all 1 - to a very small degree 2 - to a small degree 3 - to a moderate degree 4 - to a great degree 5 - to a very great degree

43
Appendix C Satisfaction with Life Scale (Diener et al., 1985) Below are five statements that you may agree or disagree with. Using the 1 - 7 scale below, indicate your agreement with each item by placing the appropriate number on the line preceding that item. Please be open and honest in your responding.
• 7 - Strongly agree • 6 - Agree • 5 - Slightly agree • 4 - Neither agree nor disagree • 3 - Slightly disagree • 2 - Disagree • 1 - Strongly disagree
____ In most ways my life is close to my ideal.
____ The conditions of my life are excellent.
____ I am satisfied with my life.
____ So far I have gotten the important things I want in life.
____ If I could live my life over, I would change almost nothing.
! 31 - 35 Extremely satisfied ! 26 - 30 Satisfied ! 21 - 25 Slightly satisfied ! 20 Neutral ! 15 - 19 Slightly dissatisfied ! 10 - 14 Dissatisfied ! 5 - 9 Extremely dissatisfied

44
Appendix D
You will be asked a number of personal questions related to your mental health. Your participation is voluntary and you may choose not to participate at any time, and your part in this study is confidential. None of the information will identify you by name, and you may choose not to answer any of the questions. If you find yourself or a loved one having thoughts of wanting to hurt yourself/themselves, seek immediate help. If it is an emergency, dial 911. Also, for immediate help 24/7, contact a Military OneSource Consultant at 1-800-342-9647 or online at www.militaryonesourceeap.org/achievesolutions/en/militaryonesource/login.do you can request a callback or an online session. If you need assistance when you are taking the survey or after, you can contact the Military Crisis Line at no cost. For crisis support, those in the US can call 800-273-8255, then press 1. Callers in Europe dial 00800-1273-8255 or DSN 118. The toll-free service in Europe may not be available through all carriers or in all countries. The Military Crisis Line, also called the Veterans Crisis Line, is a joint Department of Defense and Department of Veterans Affairs Initiative, staffed with caring, qualified VA responders who understand the challenges of military life. Many responders are veterans and service members themselves. Apart from calling the crisis line, those in crisis can chat online with a crisis line responder or phone text (to 838255). For more information, visit the Military Crisis Line website. A confidential peer support crisis hotline is also available in Afghanistan specifically for service members struggling with stress from battlefield experiences, relationship issues, or other personal problems. Service members can access the Operation Enduring Freedom Crisis Hotline by: Cell phone: Dial 070-113-2000, wait for the tone, then 111 DSN/NVOIP: Dial 111 or 318 421-8218 Email: [email protected] The Operation Enduring Freedom Crisis Hotline can also be found on Facebook at “OEF Crisis Hotline.” If you believe that you, a family member, a significant other or a friend is in crisis, know that there are resources available to support you and your loved ones. These crisis lines can provide immediate support and additional resources to help you through to a more balanced and healthy outlook. The confidential inTransition Mental Health Coaching and Support Program can be contacted toll free at 1-800-424-7877 (within the US) or 314-387-4700 (outside the US). This program is designed to help if you are concerned about your mental health treatment. A

45
coach will help coach you, connect you to a provider, and empower you to make healthy choices if you are transitioning from a change in status, relocating, or returning to civilian life. Family members are encouraged to call the program to find out how their service member can get started with inTransition. Coaches can also assist with family issues, such as counseling family members related to stress of war, supporting military children, overcoming obstacles to military spouse education and employment. Services are available 24/7, 365 days a year. For members of the Coast Guard, emergency suicide crisis services may also be accessed 24 hours a day, seven days a week via the CG SUPRT Program toll free number 855-CGSUPRT (247-8778).
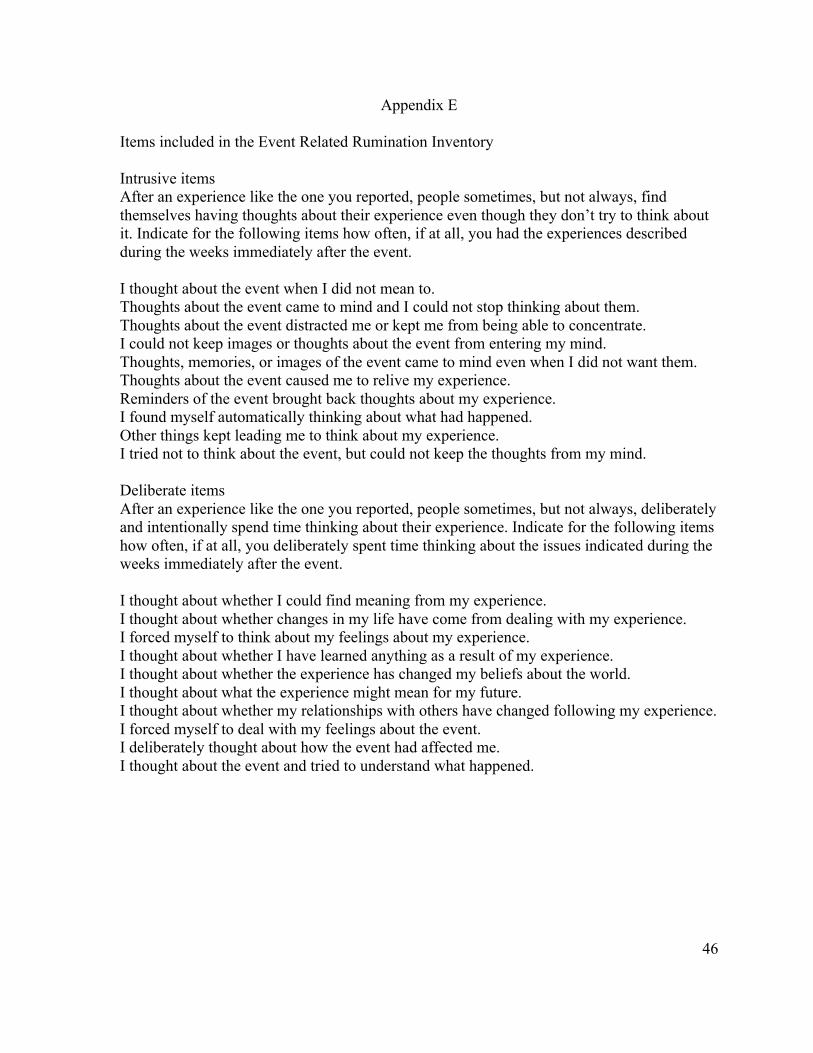
46
Appendix E
Items included in the Event Related Rumination Inventory Intrusive items After an experience like the one you reported, people sometimes, but not always, find themselves having thoughts about their experience even though they don’t try to think about it. Indicate for the following items how often, if at all, you had the experiences described during the weeks immediately after the event. I thought about the event when I did not mean to. Thoughts about the event came to mind and I could not stop thinking about them. Thoughts about the event distracted me or kept me from being able to concentrate. I could not keep images or thoughts about the event from entering my mind. Thoughts, memories, or images of the event came to mind even when I did not want them. Thoughts about the event caused me to relive my experience. Reminders of the event brought back thoughts about my experience. I found myself automatically thinking about what had happened. Other things kept leading me to think about my experience. I tried not to think about the event, but could not keep the thoughts from my mind. Deliberate items After an experience like the one you reported, people sometimes, but not always, deliberately and intentionally spend time thinking about their experience. Indicate for the following items how often, if at all, you deliberately spent time thinking about the issues indicated during the weeks immediately after the event. I thought about whether I could find meaning from my experience. I thought about whether changes in my life have come from dealing with my experience. I forced myself to think about my feelings about my experience. I thought about whether I have learned anything as a result of my experience. I thought about whether the experience has changed my beliefs about the world. I thought about what the experience might mean for my future. I thought about whether my relationships with others have changed following my experience. I forced myself to deal with my feelings about the event. I deliberately thought about how the event had affected me. I thought about the event and tried to understand what happened.

47
Table 1. Qualitative studies of growth concepts following adversity in chronological order
Authors, Date Language Population
Sledge, Boydstun, & Rabe, 1980 Self-Concept Changes
Vietnam Prisoners of War
Miles & Crandall, 1983 Search for Meaning/Growth Bereaved Parents
Taylor, 1983 Cognitive Adaptation Cancer Patients
Silver, Boon, & Stones, 1983 Search for Meaning Incest Victims
Veronen & Kilpatrick, 1983 Change Rape Victims
Thompson, 1985 Finding Positive Meaning Fire Victims
Affleck, Tennen & Gershman, 1985 Cognitive Adaptations Mothers of Infants Discharged from
ICU
Abbott & Meredith, 1986 Family Strengths Parents of Children with Developmental Disabilities
Affleck, Tennen, & Croog, 1987 Perceived Benefits Heart Attack Victims
Laerum, Johnsen, Smith, & Larsen, 1987 Positive Changes Heart Attack Victims
Calhoun & Tedeschi, 1989 Perceived Benefits Bereaved Adults
Elder, Jr. & Clipp, 1989 Psychological Gains Combat Veterans in Later-Life
Schwab, 1990 Coping Bereaved Parents
Collins, Taylor, & Skokan, 1990 Changes in Life Perspective Cancer Patients
Schwartzberg & Janoff-Bulman, 1991 Search for Meaning Bereaved Undergraduates
Cole, 1992 A New Life Being Held Hostage
Edmonds & Hooker, 1992 Perceived Changes in Life Meaning Bereaved College Students
Draucker, 1992 Construing Benefit Incest Victims
Lehman, et al., 1993 Positive Life Changes Bereaved Spouses and Parents
Schwartzberg, 1994 Growth HIV-Positive Gay Men
C. McMillen, Zuravin, & Rideout, 1995 Perceived Benefits Women Victims of Child Sexual
Abuse
Hogan, Morse, & Tason, 1996 Experiential Theory Bereaved Adults

48
Table 2. Quantitative studies of growth after adversity in chronological order
Authors, Date Measures Population
Burt & Katz, 1987 Developed 3 Instruments: “How I See Myself Now”; “How I Deal with Things”; “Changes That
Have Come From Your Efforts to Recover”
Rape Victims
Draucker, 1992 Cognitive Adaptation Scale (Draucker, 1989) Meaning Subscale (2 items)
Incest Victims
Tennen, Affleck, Urrows, Higgins, & Mendola, 1992 Benefit Appraisals (5 items) Rheumatoid
Arthritis
Andrykowski, Brady, & Hunt, 1993
Cancer Patient Behavior Scale (Ross, et al., 1978)
Cancer Patients
Joseph, Williams & Yule, 1993
Developed: Change in Outlook Questionnaire (11 positive items; 15 negative items)
Survivors of Boat Crash
Park, Cohen, & Murch, 1996 Developed: Stress-Related Growth Scale (SRGS) College
Students
Frazier, Conlon, & Glaser, 2001 Posttraumatic Life Change Scale
Sexual Assault
Survivors

49
Table 3. Results of association between PTG and mental health
Authors, Date Mental Health Measure Results Magnitude
Depression: Center for Epidemiologic Studies-
Depression Scale (CES-D)
Nonsignificant differences t(69) = -.13, ns
Cordova, Cunningham, Carlson, &
Andrykowski, 2001 Wellbeing: Ryff’s Wellbeing Scales
Nonsignificant differences
Personal Growth: t(69) =
-.59, ns Purpose in Life: t(69) = .36, ns
Self-Acceptance:
t(69) = .74, ns
Gallaway, Millikan, & Bell, 2011
Military Behavioral Health: Suicidal Ideation
Significant negative
correlation b = -7.7, p< .004
Park & Lechner, 2006*
Posttraumatic Stress Disorder:
Impact of Event Scale (IES-R)
Significant positive
correlation r = .31, p<.01
Note: *indicates use of SRGS for measuring PTG. For a complete review, see Zoellner & Maercker, 2006.

50
Table 4 Means and Standard Deviations from Present Study and Cann et al. 2010
Present Study Cann et al. (2010)
Variable Min Max M SD M SD t
PTGI 0 102 45.91 24.68 56.28 21.00 -5.65***
CBI 0 45 22.42 11.02 27.27 9.54 -6.10***
ERRI - Deliberate 0 30 16.42 7.77 - - -
ERRI – Intrusive 0 30 16.81 8.79 - - -
Stress Then 1 7 5.72 1.19 6.20 .84 -5.61***
Stress Now 1 7 4.05 1.66 3.50 1.61 4.61***
PCL-5 0 80 25.82 20.22 - - -
SWLS 5 35 21.95 7.60 22.60 6.05 -2.58* Note. PTGI = Posttraumatic Growth Inventory; CBI = Core Beliefs Inventory; ERRI = Event-Related Rumination Inventory; PCL-5 = PTSD Checklist; SWLS = Satisfaction with Life Scale. “-“ denotes this measure was not used in Cann et al. (2010). ***p < .001. **p < .01. *p < .05

51
Table 5. Bivariate Correlations between Independent Variables, Dependent Variables, and Covariates
CBI SWL PTSD Symptoms
Intrusive Rumination
Deliberate Rumination Stress Then Stress Now Time Gender Age
PTGI .66*** .16* .30*** .30*** .56*** .14 .02 .10 -.10 -.08
CBI -- -.21** .57*** .58*** .62*** .30*** .22** .05 -.02 -.08
SWL -- -.42*** -.43*** -.21** -.31*** -.40*** .13 -.02 -.10
PTSD Symptoms -- .68*** .37*** .39*** .44*** -.14 -.01 -.19*
Intrusive Rumination -- .62*** .52*** .45*** -.10 .12 .02
Deliberate Rumination -- .28*** .25*** .01 .07 .12
Stress Then -- .50*** .05 .09 .04
Stress Now -- -.21** .05 -.14*
Time -- .07 .20**
Gender -- -.07
Note. ***Correlation is significant at the 0.001 level (2-tailed). **Correlation is significant at the 0.01 level (2-tailed). *Correlation is significant at the 0.05 level (2-tailed).

52
Table 6. Standardized Effects of Core Belief Challenge, Rumination, Time, PTSD, and PTG on Rumination, PTSD, PTG and Life Satisfaction
Core Belief Challenge
Intrusive Rumination Deliberate
Rumination Time PTSD Symptoms PTG
Direct Indirect Total Direct Indirect Total Direct Indirect Total Direct Indirect Total Direct Total Direct Total
Intrusive Rumination .62 .62
Deliberate Rumination .50 .21 .71 .34 .34
PTSD Symptoms .28 .42 .70 .67 .67
PTG .43 .43 .21 .21 .61 .61 .14 .14
Life Satisfaction -.33 -.33 -.43 -.43 .32 .32 .07 .07 -.80 -.80 .53 .53
Note. N = 197. All effects are significant at the p < .001.

53
Figure 1. Condensed concept map of PTG process. Note: Both intrusive and deliberative rumination may be present. Distress and PTG can coexist.
Figure 2. Hypothesized model of relationships in posttraumatic growth process.
Figure 3. Confirmatory Factor Analysis of Core Beliefs Inventory including standardized regression weights and intercepts.

54
Figure 4. Structural equation model of PTG, PTSD, and Life Satisfaction in military Veterans. All paths are significant at the p < .001 level.