moocs annual report - 2015€¦ · moocs annual report - 2015 - ... rlc d1 740 (rolex learning...
TRANSCRIPT


MOOCS ANNUAL REPORT- 2015 -
Center for Digital Education
CENTER FOR DIGITAL EDUCATION (CEDE)ÉCOLE POLYTECHNIQUE FÉDÉRALE DE LAUSANNE (EPFL)MOOCS.EPFL.CH
Copyright c©2016École Polytechnique Fédérale de Lausanne
All rights reserved. This publication is freely distributed online, and can be re-distributed onlyin its original form and for non-commercial purposes. For any other use, please write yourrequest to the address below.
EPFL SI CEDERLC D1 740 (Rolex Learning Center)Station 20CH-1015 LausanneSwitzerland
First release, March 2016Printed in Switzerland.

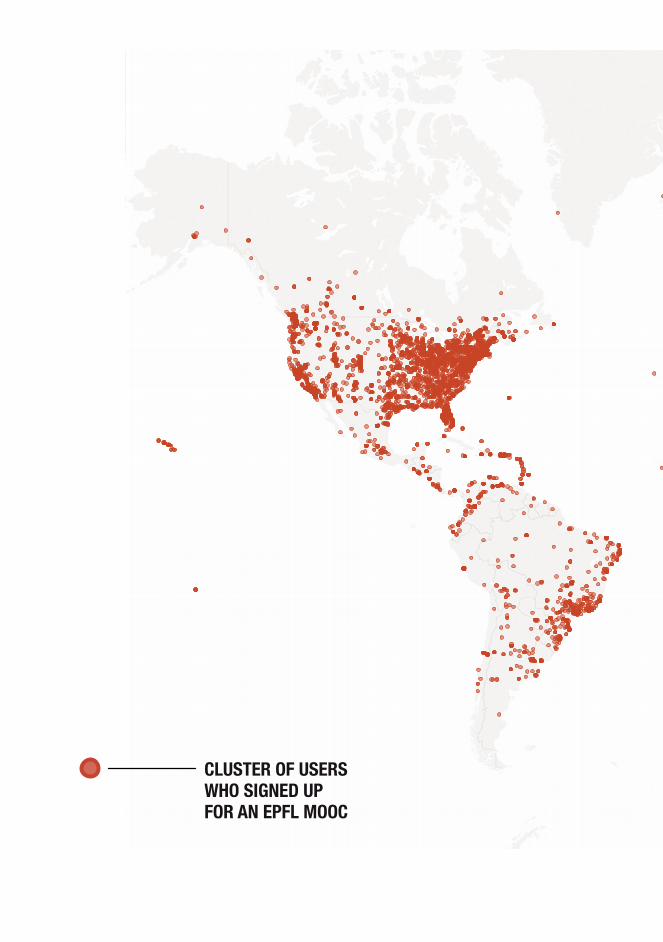
CLUSTER OF USERSWHO SIGNED UPFOR AN EPFL MOOC

EPFL MOOCs Campus
HEADQUARTERS

Contents
1 Production for the Masses . . . . . . . . . . . . . . . . . . . . . . . . . . . . 11
1.1 MOOCs Production 12
1.2 Challenges in Scaling Up Teaching 13
1.3 The Production Process: Step-by-Step 15
1.4 Production Costs and Revenues 16
2 Teaching Innovations at EPFL . . . . . . . . . . . . . . . . . . . . . . . . . 21
2.1 Engagement of EPFL Students 22
2.2 Are MOOCs Helpful in the Classroom? 23
3 MOOCs: Empowering the World . . . . . . . . . . . . . . . . . . . . . . 29
3.1 Here’s to the Fearless Ones 30
3.2 Status Report: 2012 to 2015 32
4 Impact in Africa . . . . . . . . . . . . . . . . . . . . . . . . . . . . . . . . . . . . . 41
4.1 Higher Education in Africa 42
4.2 MOOCs Usage in Africa 44
4.3 Case Study: Launching New Ventures 45
5 Targeting Professionals . . . . . . . . . . . . . . . . . . . . . . . . . . . . . . . 49
5.1 MOOCs in the Corporate World 50
5.2 Targeted Advertising 53
5.3 The EPFL Extension School 55
6 Latest Research . . . . . . . . . . . . . . . . . . . . . . . . . . . . . . . . . . . . . 57
6.1 Identifying Successful Activity Patterns 58
6.2 Predicting Success from Programming Assignments Strategies 58
6.3 Regulating Students’ Gaze 59
6.4 Ongoing Research Projects 60
7 Closing Remarks . . . . . . . . . . . . . . . . . . . . . . . . . . . . . . . . . . . . . 63

Introduction
MASSIVE OPEN ONLINE COURSES (MOOCs) are a new embodiment of Digital Edu-cation that has been gaining momentum around the world since 2012. These are
courses presented as video lectures—that professors record at their own universities—withintegrated assignments that students can submit and receive a grade for (often automatically).If students receive a series of sufficiently high grades on their assignments, they are consideredto have passed the course, and therefore are eligible to receive an electronic statement ofaccomplishment.
The Ecole Polytechnique Fédérale de Lausanne (EPFL) was one of the first universities toexperiment with MOOCs, and among the few in Europe to integrate the use of MOOCs on itsown campus. Some of our professors have been actively using MOOCs as an integral part oftheir classroom teaching. The MOOCs are authored by professors themselves, and recorded atthe Center for Digital Education (CEDE) of EPFL—the new center responsible for in-houseproduction of MOOCs.
From 2012 to 2015, the MOOCs deployed by EPFL amassed more than 1 million registrationsfrom 186 countries, of whom 58,000 passed the course with a statement of accomplishment.On the EPFL campus alone, 5,300 students registered for an average of 2 MOOCs—abouthalf of the students on the entire EPFL campus.
Other universities in Europe have started to follow suit by recording their own MOOCs. Butfew have successfully integrated MOOCs into their own educational systems as we have, andeven fewer have achieved the massive global reach that EPFL has achieved in the span of 3.5years. With the MOOCs initiative, EPFL has effectively grown into a 1-million strong "globalcampus" with 186 nationalities.
This report describes the main activities and results related to the EPFL MOOCs program in2015, and the main challenges our team and instructors have faced in an effort to maintainEPFL as the undisputed European leader in MOOCs production and integration.
10
In Chapter 1, Production for the Masses, we present the MOOCs creation process at CEDE,as well as its main challenges in terms of production and scaling. We describe how videosare recorded and edited, how self-grading assignments are developed—including remoteexperiments that students can interact with—and how data analytics are used in qualitycontrol.
In Chapter 2, Teaching Innovations at EPFL, we present statistics that show how EPFLstudents have embraced the use of MOOCs as a means of learning new subjects, as well asadditional material that helps them complete their EPFL coursework. We also present casestudies of EPFL professors who have applied the "flipped classroom" model to their classes,using MOOCs created by themselves.
In Chapter 3, MOOCs: Empowering the World, we go beyond EPFL and show how ourMOOCs have a global reach and are making a difference in people’s lives. We providestatistics of user engagement and achievement, user demographics, and vital signs that providea global picture of the current vitality of our program.
In Chapter 4, Impact in Africa, we address a specific division of our program called MOOCsfor Africa, which focuses on promoting the use of MOOCs in technology universities insub-Saharan countries. We describe how African students can benefit from the use of MOOCs,and how our efforts in the continent are already starting to make a difference.
In Chapter 5, Targeting Professionals, we describe how our MOOCs are serving the needsof an important sector of the population: employed professionals. We present numbers thatshow how large this market is, what type of companies these people work for, and how wecan target them effectively through the use of social media marketing.
In Chapter 6, Latest Research, we show how MOOCs Big Data is being used at EPFLto conduct research on Learning Analytics and the Psychology of Learning. We providea summary of our published results, describing the outcome of psychological studies weconducted based on the statistical analysis of massive behavioral data sets.
1. Production for the Masses
«Educate and inform the whole mass of the people; they are the only surereliance for the preservation of our liberty.» – Thomas Jefferson
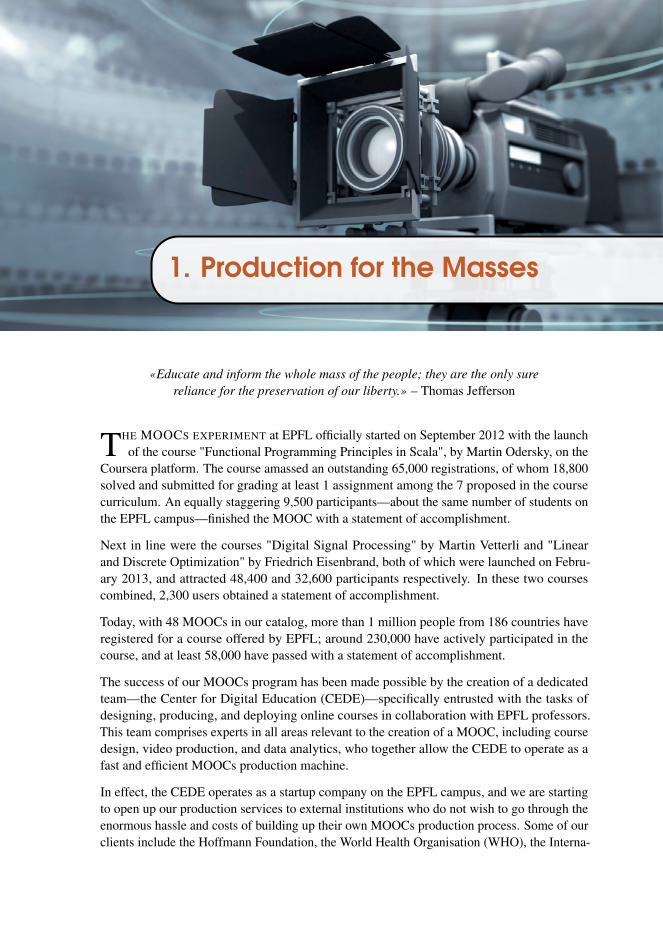
THE MOOCS EXPERIMENT at EPFL officially started on September 2012 with the launchof the course "Functional Programming Principles in Scala", by Martin Odersky, on the
Coursera platform. The course amassed an outstanding 65,000 registrations, of whom 18,800solved and submitted for grading at least 1 assignment among the 7 proposed in the coursecurriculum. An equally staggering 9,500 participants—about the same number of students onthe EPFL campus—finished the MOOC with a statement of accomplishment.
Next in line were the courses "Digital Signal Processing" by Martin Vetterli and "Linearand Discrete Optimization" by Friedrich Eisenbrand, both of which were launched on Febru-ary 2013, and attracted 48,400 and 32,600 participants respectively. In these two coursescombined, 2,300 users obtained a statement of accomplishment.
Today, with 48 MOOCs in our catalog, more than 1 million people from 186 countries haveregistered for a course offered by EPFL; around 230,000 have actively participated in thecourse, and at least 58,000 have passed with a statement of accomplishment.
The success of our MOOCs program has been made possible by the creation of a dedicatedteam—the Center for Digital Education (CEDE)—specifically entrusted with the tasks ofdesigning, producing, and deploying online courses in collaboration with EPFL professors.This team comprises experts in all areas relevant to the creation of a MOOC, including coursedesign, video production, and data analytics, who together allow the CEDE to operate as afast and efficient MOOCs production machine.
In effect, the CEDE operates as a startup company on the EPFL campus, and we are startingto open up our production services to external institutions who do not wish to go through theenormous hassle and costs of building up their own MOOCs production process. Some of ourclients include the Hoffmann Foundation, the World Health Organisation (WHO), the Interna-

12 Chapter 1. Production for the Masses
3. Delivery
RecruitmentMOOC
EditorialCommittee
Design
Advertising
Course production
Laun
ch
Analytics
Video production
Share
Training
Run
Research
1. Submission 2. Production
Figure 1: MOOC Production Process. The production comprises three phases (submission, production and delivery)and usually lasts 12 months.
tional Organization for Standardization (ISO), the Bühler Group, as well as CoorpAcademy, astartup located in the EPFL Innovation Park and active in the corporate eLearning sector.
1.1 MOOCs Production
Producing a MOOC usually takes 12 months and includes three phases. It is a collaborativeeffort with a course team (professor and assistants) and the staff of the CEDE. The productionprocess is illustrated in Figure 1.
In the submission phase, instructors submit a project for their course to an EPFL internalMOOC Editorial Committee. Two calls for proposal are organized every year in spring and fall.The CEDE is a valuable partner in the preparation of the project since it has accumulated solidexperience in coordinating pedagogical, technical as well as business related aspects. EPFL isencouraging the creation of a series of courses which add a strong academic dimension tothe preparation of the projects. Instructors have to obtain the support of their deans and theirdirector of curriculum before submitting to the committee. The coordination between partnersalso becomes an essential part of the preparation.
In the production phase, instructors start by designing the course as a sequence of activitiesand lectures. The next step is to produce the videos and prepare the assignments on thelearning platforms. As the course launch date approaches, some courses are advertisedto boost the number of registrations. We provide more details about this critical phase inSection 1.3.
In the delivery phase, the course team follows the users’ on-line activity by monitoringdiscussion forums and grading the assignments. Recently, MOOC platforms have switched toan on-demand delivery model (or self-paced) that allows users to start the course whenever theywant and progress at their own pace. This new model requires a higher level of commitmentfrom the course teams to monitor the course. We are currently looking for alternative

1.2 Challenges in Scaling Up Teaching 13
models where professors can focus their attention during a limited period of time and wherecommunity tutors (e.g., MOOC alumni) could perform the base service.
The collection of users’ expectations and level of satisfaction through questionnaires allowscourse teams to reflect on the course design and adapt the course accordingly. Behavioral userdata lends itself to research activities by partners of the CEDE.
Lastly, there is one other, relatively new, dimension introduced by the advent of online courses:the use of Big Data in learning analytics. When people register for a MOOC in a platformlike Coursera or EdX, their behavior on the website is continuously logged. This meansthat, by the time a user has finished the course, we have access to his or her entire history ofactions—from the exact time he or she submitted the assignments, to how many forum postswere viewed, all the way down to every mouse click on the video navigation bar.
This exhaustive recording of users’ learning activity requires a dedicated data managementsystem on our side, capable of collecting the Giga-bytes of data that we receive every day,and storing them securely. We take special care in protecting user privacy, by storing all dataon secure servers within EPFL with restricted access.
Such data also requires a team of researchers—in our case, the Computer-Human Interaction inLearning and Instruction (CHILI) lab—who can go through the data, find relevant patterns ofbehavior, and use their conclusions to help professors improve their online teaching methods.Data analytics is essentially the feedback loop in our MOOC production process. It can beused to progressively improve everything from course development to production quality, aswell as provide valuable insights about our target users.
1.2 Challenges in Scaling Up Teaching
The acronym MOOC stands for "Massively Open Online Course". As the name suggests,a MOOC can be any online course that is open to an unlimited number of participants. Itshould therefore be expected that a course is self-contained, with all lectures and exercisesrequired for the mastery of a particular subject, as well as partially self-operating (at least inthe long-term), so that the massive number of users can be graded and guided throughout thecourse with minimal intervention from the instructors. In other words, the cost of operating acourse must not grow proportionally with the number of users.
These requirements are harder to meet than it seems. For a start, instructors are typically notas comfortable in front of a camera as they are in front of an audience. To become reasonablycomfortable such that their lectures are not awkward, our team provides training in the art ofengaging large audiences through video. More often than not, this training has to be continuedthroughout the recording sessions, since it requires changing some hardwired habits.
As a consequence, it takes about 2.5 days of recording time and editing work to produce2 hours of lecture (8 videos = 4 recording sessions = 2 days), since most of the raw videofootage must be cut out. To meet this demand, our team currently has 7 professionals workingfull-time on video editing and production tasks alone, with several others working part-time

14 Chapter 1. Production for the Masses
Figure 2: Automatic control remote experiment. Users connect to an activity that is linked directly to a servo motorin an EPFL lab, and are able to control its parameters and observe the machine’s behavior in real-time through alive camera feed. The following steps in the activity consist of mathematically modeling the response of the system.The experiment was developed by Christophe Salzmann in collaboration with Denis Gillet, who have both beenconducting research on remote experimentation for many years.
during periods of large demand.
Secondly, the course assignments have to be adapted to a massive number of participants.It would be unthinkable for an instructor to go through thousands of assignments submittedby users every week. In order for the course to work on this scale, assignments have to beeither automatically graded or peer-graded (where users grade each other’s assignments). Thisintroduces challenges for different types of assignments, such as:
- laboratory experiments,- non-textual responses, like chemical formulas and mathematical proofs,- programming and typesetting assignments that require a functional code,- open-ended questions that can be answered in multiple ways.
At CEDE, we are constantly developing new ways of adapting traditional classroom assign-ments to an online environment that supports a large number of users. For instance, in thecontext of laboratory work, some of our professors have created remote experiments thatusers can control from a dashboard on a website. Three experiments are currently available: ahydraulic machine where the water flow is regulated by a slider on a website and a live videois streamed back to the user ("Fluid Mechanics" MOOC), a micro-controller that users canprogram remotely and see the result through live video ("Microcontrollers" MOOC), and aservo-motor that is controlled remotely to move to a given position ("Automatic Control"MOOC). The last one is illustrated in Figure 2.
Some professors have developed auto-graders for programming assignments in Java, C++ andScala, that allow users to submit their code and then verify if the correct output is produced.Others have created peer-graded assignments, where users submit their answers for grading to
1.3 The Production Process: Step-by-Step 15
Laun
ch
Teacher Training
Course Design
Review Meeting
First Recording
CameraWorkshop
Design Meeting
Record and Tuning
Ready
Storyboard
Video Production (1/2) Video Production (2/2)
50%
Landing Page
Analytics
News Facebook & co.
Advertising Evaluation
ConversionRate
Record
Edit Review
Start Survey
ProductionSpeed
Registrations EngagementAchievement
Subtitles
Teaser End Survey
OK
Course Implementation
Assignments
VideosStatus ReportCourse
Follow-up
...
2. Production
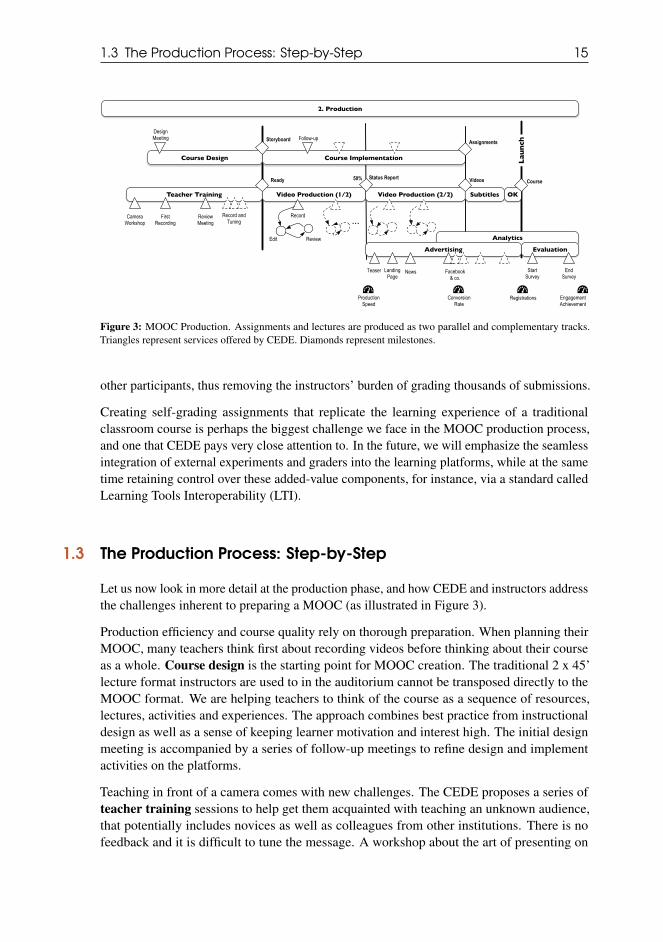
Figure 3: MOOC Production. Assignments and lectures are produced as two parallel and complementary tracks.Triangles represent services offered by CEDE. Diamonds represent milestones.
other participants, thus removing the instructors’ burden of grading thousands of submissions.
Creating self-grading assignments that replicate the learning experience of a traditionalclassroom course is perhaps the biggest challenge we face in the MOOC production process,and one that CEDE pays very close attention to. In the future, we will emphasize the seamlessintegration of external experiments and graders into the learning platforms, while at the sametime retaining control over these added-value components, for instance, via a standard calledLearning Tools Interoperability (LTI).
1.3 The Production Process: Step-by-Step
Let us now look in more detail at the production phase, and how CEDE and instructors addressthe challenges inherent to preparing a MOOC (as illustrated in Figure 3).
Production efficiency and course quality rely on thorough preparation. When planning theirMOOC, many teachers think first about recording videos before thinking about their courseas a whole. Course design is the starting point for MOOC creation. The traditional 2 x 45’lecture format instructors are used to in the auditorium cannot be transposed directly to theMOOC format. We are helping teachers to think of the course as a sequence of resources,lectures, activities and experiences. The approach combines best practice from instructionaldesign as well as a sense of keeping learner motivation and interest high. The initial designmeeting is accompanied by a series of follow-up meetings to refine design and implementactivities on the platforms.
Teaching in front of a camera comes with new challenges. The CEDE proposes a series ofteacher training sessions to help get them acquainted with teaching an unknown audience,that potentially includes novices as well as colleagues from other institutions. There is nofeedback and it is difficult to tune the message. A workshop about the art of presenting on

16 Chapter 1. Production for the Masses
camera is organized with a professional coach, and teachers are invited to discover the studioduring a first recording session. Such sessions are organized until the instructors feel proficient(see "record and tuning" in Figure 3).
While it is important for students to see the instructors speaking to them, we have chosen tofocus the video presentation on the content. During a 12 minute video, instructors appearon screen for 1 minute at the beginning to introduce the topic of the lesson and 1 minuteat the end to sum up the main points. The remaining time is used to dive into the content.Accordingly, during the review meeting that follows the first recording, we mostly address thedesign of visual resources, how to perform gestures, what to write on the tablet, how to bestuse pictures, schemata and video-clips to illustrate the explanations.
Once instructors are ready to record, we start the video production. Teachers make appoint-ments for half-day sessions in the studio. We have observed that a 4-hour session is enoughto produce 2 videos on average and that the production of a MOOC requires 20 sessionson average. The preparation of the material is the most time-consuming aspect of videoproduction. It is not unusual for instructors to spend half a day preparing for 15 minutes ofvideo. We recommend rehearsing the delivery of the lectures before coming to the studio and,if this is not possible, we ask instructors to warm up before recording with the cameras. Afterthe recording session, video editors from CEDE produce a first version of the lecture which issent to instructors for review. This step is critical for quality control since it allows instructorsto check that the academic content is adequate. Most often a single review step is enoughbefore the final version of the video.
The total video production duration is difficult to predict in advance because it depends a loton instructors’ availability and reaction to do reviews. We estimate the productivity of eachcourse team by observing the number of videos produced in the first few weeks. We startadvertising once we have a clear estimation of the delivery date. Advertising includes theannouncement of the course on the platforms as well as publication of short news articles thatare spread on social networks. Section 5.2 provides more details on the conversion rate ofsuch initiatives.
Finally, in 2015, two brand new recording studios were inaugurated. The Center now operatesthree studios with identical equipment and capabilities. An impressive total of 485 half-dayrecording sessions were organized during the year for teachers to record their courses. Inaddition, 34 official visits have been hosted by the team from the Center in the studios.In parallel, CEDE has also developed a mobile version of the studio that is used for fieldrecordings and could be used as a basis for such a facility in developing countries.
1.4 Production Costs and Revenues
The biggest cost of creating and operating a MOOCs Production Factory such as ours—bothin terms of time and money—is by far the initial cost of building the factory itself. Thisincludes building the recording studios from the ground up, setting up a video productionteam and infrastructure, and programming a data analytics pipeline that keeps track of all the

1.4 Production Costs and Revenues 17
Figure 4: Jürgen Brugger (MEMs and nanofabrication) records his MOOC in one of our studios at CEDE.
usage numbers and statistics. Table 1 shows a summary of the initial costs that were involvedin setting up the Center for Digital Education (CEDE)—the EPFL MOOCs Factory.
Table 1: Initial setup costs for the MOOC Factory
Material Cost SalariesRecording Studio Infrastructure 85,000 CHF 18 Man MonthVideo Editing Infrastructure 55,000 CHF 4 Man MonthData Analytics Pipeline 25,000 CHF 12 Man MonthTotal 165,000 CHF 34 Man Months
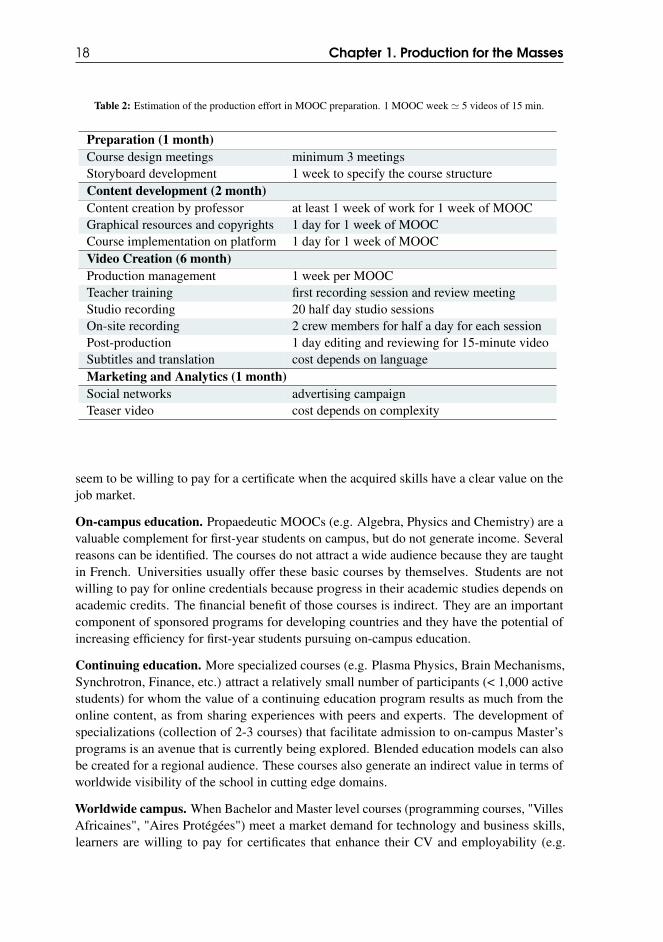
Production costs for a single MOOC are much lower in comparison to the initial investmentsthat are necessary to produce a state of the art course (approximately 8% for a 5 week longcourse). Table 2 summarizes the production effort incurred by MOOC production. Instructorsobtain a subsidy to help them develop the content. They often use the subsidy to hire studentsto redraw figures, check copyrights, transpose quizzes, etc. We consider that 1 MOOC weekcorresponds to 5 videos each lasting 15 minutes accompanied with an assignment.
In terms of revenue, different types of courses have different commercial potential. So far,only a few courses have generated revenue: "Functional Programming Principles in Scala","Digital Signal Processing", "Villes Africaines", and "Launching New Ventures". The basicprinciple is that MOOCs that provide income should subsidize less profitable MOOCs. Users
18 Chapter 1. Production for the Masses
Table 2: Estimation of the production effort in MOOC preparation. 1 MOOC week ' 5 videos of 15 min.
Preparation (1 month)Course design meetings minimum 3 meetingsStoryboard development 1 week to specify the course structureContent development (2 month)Content creation by professor at least 1 week of work for 1 week of MOOCGraphical resources and copyrights 1 day for 1 week of MOOCCourse implementation on platform 1 day for 1 week of MOOCVideo Creation (6 month)Production management 1 week per MOOCTeacher training first recording session and review meetingStudio recording 20 half day studio sessionsOn-site recording 2 crew members for half a day for each sessionPost-production 1 day editing and reviewing for 15-minute videoSubtitles and translation cost depends on languageMarketing and Analytics (1 month)Social networks advertising campaignTeaser video cost depends on complexity
seem to be willing to pay for a certificate when the acquired skills have a clear value on thejob market.
On-campus education. Propaedeutic MOOCs (e.g. Algebra, Physics and Chemistry) are avaluable complement for first-year students on campus, but do not generate income. Severalreasons can be identified. The courses do not attract a wide audience because they are taughtin French. Universities usually offer these basic courses by themselves. Students are notwilling to pay for online credentials because progress in their academic studies depends onacademic credits. The financial benefit of those courses is indirect. They are an importantcomponent of sponsored programs for developing countries and they have the potential ofincreasing efficiency for first-year students pursuing on-campus education.
Continuing education. More specialized courses (e.g. Plasma Physics, Brain Mechanisms,Synchrotron, Finance, etc.) attract a relatively small number of participants (< 1,000 activestudents) for whom the value of a continuing education program results as much from theonline content, as from sharing experiences with peers and experts. The development ofspecializations (collection of 2-3 courses) that facilitate admission to on-campus Master’sprograms is an avenue that is currently being explored. Blended education models can alsobe created for a regional audience. These courses also generate an indirect value in terms ofworldwide visibility of the school in cutting edge domains.
Worldwide campus. When Bachelor and Master level courses (programming courses, "VillesAfricaines", "Aires Protégées") meet a market demand for technology and business skills,learners are willing to pay for certificates that enhance their CV and employability (e.g.

1.4 Production Costs and Revenues 19
Coursera statements of accomplishment are visible on the LinkedIn profile of participants).Other universities and sub-licensors are primarily interested in these courses since they allowthem to offer the courses in a specific geographical region and academic programs (e.g.Russian or Chinese translations of courses). In addition, new business models are currentlybeing developed and tested by platforms, such as the provisioning of tutoring for a fee.

2. Teaching Innovations at EPFL
«We cannot know ahead of time how far our predisposition mightbe developed by which education method. This can only be ascertained by
trying and assessing different methods.» – Immanuel Kant
THE SUCCESS of the MOOCs initiative has been particularly notable on the EPFL campus.Between September 2012 and December 2015, more than 5,300 EPFL students registered
for at least one of our MOOCs, among whom 26% passed with a statement of accomplishment,and 61% of those who were very active (solved at least half of the assignments) passed thecourse. On average, each student signed up for 2 different MOOCs.
Since the beginning of the program, EPFL students have been consistently active in ourMOOCs. Close to 48% of our students have tried to submit at least one assignment forgrading, compared to 22% in the rest of the world. The figure is even higher for MOOCs thathave been recommended by professors as complementary material, particularly in classes thathave a direct MOOC counterpart. In fact, most of the MOOCs offered by EPFL were createdas an online version of existing courses, and therefore are widely used internally.
Central to the EPFL MOOC strategy is a teaching method called "flipped classroom". Thismethod is defined by an inversion of the types of events that happen inside and outside theclassroom. For instance, teachers may require students to learn the material before arrivingto class. Then, rather than giving a traditional lecture, they can use their class time to solveexercises and engage students in discussion.
This pedagogical approach is not new; it has been progressively developed in various universi-ties across the world, but became increasingly popular when students began having accessto video lectures. The success of Khan Academy1 is a great example of the adoption of theflipped classroom model2. With its massive collection of video lectures and learning analyticstools, teachers in high schools and elementary schools can rely on Khan Academy to provide
1www.khanacademy.org2"Research on the Use of Khan Academy in Schools", SRI Education, Research Brief, March 7, 2014.

22 Chapter 2. Teaching Innovations at EPFL
pupils with the course material they need, analyze their progress on each student’s dashboard,and then the time in class can be used for interactive activities.
The advent of MOOCs has provided a similar opportunity to university professors, and inparticular to EPFL. The fact that we produce every MOOC in-house, and any professor cancreate one if he or she wishes, gives us the freedom to push the flipped classroom model toany degree we like. We could, theoretically, package all the support material of an EPFLcourse into a MOOC, for students to learn at home, and leave only the social and interactiveaspects of the course for the classroom.
This is harder than it seems. Although the principles of a flipped classroom are straightforward,its execution requires a substantial amount of effort by the instructors in transforming theirclasses. Yet, some of our professors have indeed done so, and their efforts were eventuallyrewarded (see Section 2.2).
The creation of MOOCs based on EPFL courses has had a number of positive side-effects.For a start, lectures are now broadcast to the rest of the world, giving professors a previouslynon-existent exposure outside the classroom walls. This inevitably increases their motivationto improve the quality of their teaching, both in terms of content and delivery. In a way,professors become public figures; it provides an opportunity to take advantage of their massivereach, and ultimately improve the lives of thousands of students they would never meetotherwise.
Furthermore, the influence of MOOCs is starting to be felt in terms of academic credibility.The same way h-factors3 and publications in high-impact journals are accepted measures ofresearch output, launching a MOOC with thousands of registrations is becoming a credibleindicator of excellence in teaching.
2.1 Engagement of EPFL Students
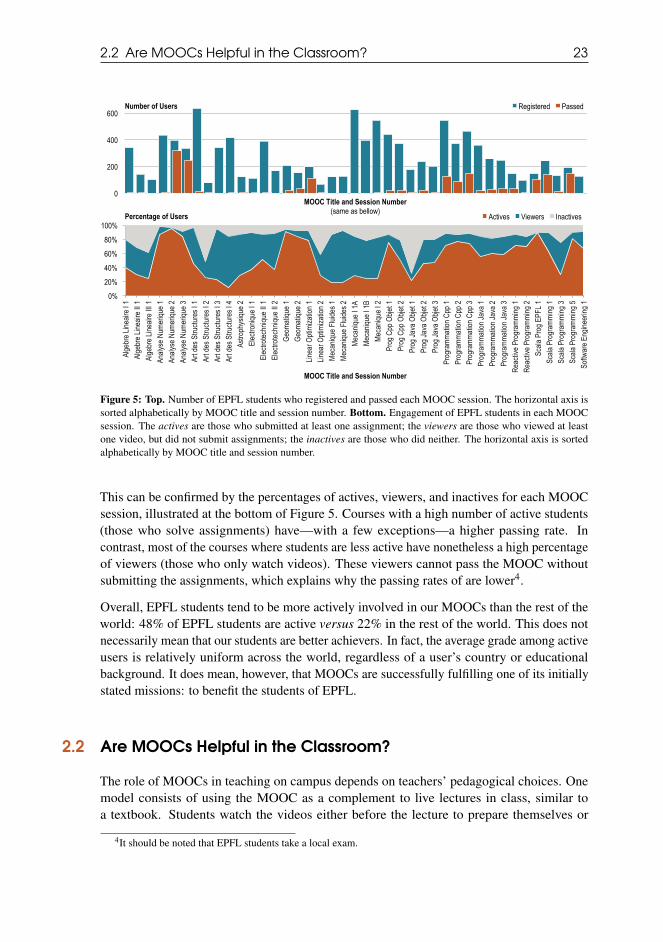
The main purpose of the MOOCs program is to improve the teaching experience of ourstudents at EPFL. For this reason, it is not surprising that EPFL students have been among ourbiggest early adopters. At least 5,300 EPFL students registered for one of our MOOCs (thecampus has about 10,000 students), among which 48% were more or less active in the coursesthey registered for. Among these active users, the number of those who passed depended onwhether or not finishing the MOOC was encouraged by professors in their respective courses(see the top of Figure 5).
For instance, in courses such as "Numerical Analysis", "Linear Optimization", and "ScalaProgramming", the students were advised to solve and submit all assignments in addition towatching the video lectures. In other courses, such as "Mechanics I" and "Geomatics", theteachers’ recommendations were more relaxed, simply encouraging students to watch thevideos.
3The h-factor (or h-index) is a metric that measures the productivity and citation impact of the publications of ascientist or scholar.
2.2 Are MOOCs Helpful in the Classroom? 23
MOOC Title and Session Number(same as bellow)
0
200
400
600Registered PassedNumber of Users
0%
20%
40%
60%
80%
100%
AlgebreLin
eaire
I1AlgebreLin
eaire
II1
AlgebreLin
eaire
III1
Analy
seNu
meriqu
e1
Analy
seNu
meriqu
e2
Analy
seNu
meriqu
e3
Artdes
Structu
resI
1Artdes
Structu
resI
2Artdes
Structu
resI
3Artdes
Structu
resI
4Astrophysiqu
e2
Electroniq
ueI1
Electrotechniq
ueII1
Electrotechniq
ueII2
Geom
atiqu
e1
Geom
atiqu
e2
LinearO
ptimiza
tion1
LinearO
ptimiza
tion2
Mecaniqu
eFluid
es1
Mecaniqu
eFluid
es2
Mecaniqu
eI1A
Mecaniqu
eI1B
Mecaniqu
eI2
Prog
CppOb
jet1
Prog
CppOb
jet2
Prog
Java
Objet
1Prog
Java
Objet
2Prog
Java
Objet
3Programmation
Cpp1
Programmation
Cpp2
Programmation
Cpp3
Programmation
Java
1Programmation
Java
2Programmation
Java
3Re
activeProgramming
1Re
activeProgramming
2Scala
Prog
EPFL
1Scala
Programming
1Scala
Programming
3Scala
Programming
5So
ftwareEn
gineering1
Actives Viewers InactivesPercentage of Users
MOOC Title and Session Number
Figure 5: Top. Number of EPFL students who registered and passed each MOOC session. The horizontal axis issorted alphabetically by MOOC title and session number. Bottom. Engagement of EPFL students in each MOOCsession. The actives are those who submitted at least one assignment; the viewers are those who viewed at leastone video, but did not submit assignments; the inactives are those who did neither. The horizontal axis is sortedalphabetically by MOOC title and session number.
This can be confirmed by the percentages of actives, viewers, and inactives for each MOOCsession, illustrated at the bottom of Figure 5. Courses with a high number of active students(those who solve assignments) have—with a few exceptions—a higher passing rate. Incontrast, most of the courses where students are less active have nonetheless a high percentageof viewers (those who only watch videos). These viewers cannot pass the MOOC withoutsubmitting the assignments, which explains why the passing rates of are lower4.
Overall, EPFL students tend to be more actively involved in our MOOCs than the rest of theworld: 48% of EPFL students are active versus 22% in the rest of the world. This does notnecessarily mean that our students are better achievers. In fact, the average grade among activeusers is relatively uniform across the world, regardless of a user’s country or educationalbackground. It does mean, however, that MOOCs are successfully fulfilling one of its initiallystated missions: to benefit the students of EPFL.
2.2 Are MOOCs Helpful in the Classroom?
The role of MOOCs in teaching on campus depends on teachers’ pedagogical choices. Onemodel consists of using the MOOC as a complement to live lectures in class, similar toa textbook. Students watch the videos either before the lecture to prepare themselves or
4It should be noted that EPFL students take a local exam.
24 Chapter 2. Teaching Innovations at EPFL
after the lecture to reinforce the content. Another model, called "flipped classroom" consistsof switching learning activities performed in the classroom and at home. Following theflipped model, students acquire basic knowledge by watching videos at home and deepen theirknowledge by solving problems in class with the teacher.
There are no clear rules about how to best implement the textbook and the flipped models.To try to shed some light on the conditions under which MOOCs are beneficial for learning,we conducted an analysis to compare students’ engagement with the MOOC and their gradeson the EPFL exam for 26 on-campus courses. We analyzed 6,000 grades from coursesthat roughly fall into the two categories we just outlined. Twelve first-year physics coursesand eight second-year courses simply used the MOOCs as complements to the lecture. Sixfirst-year courses used the MOOCs following a version of a flipped classroom.
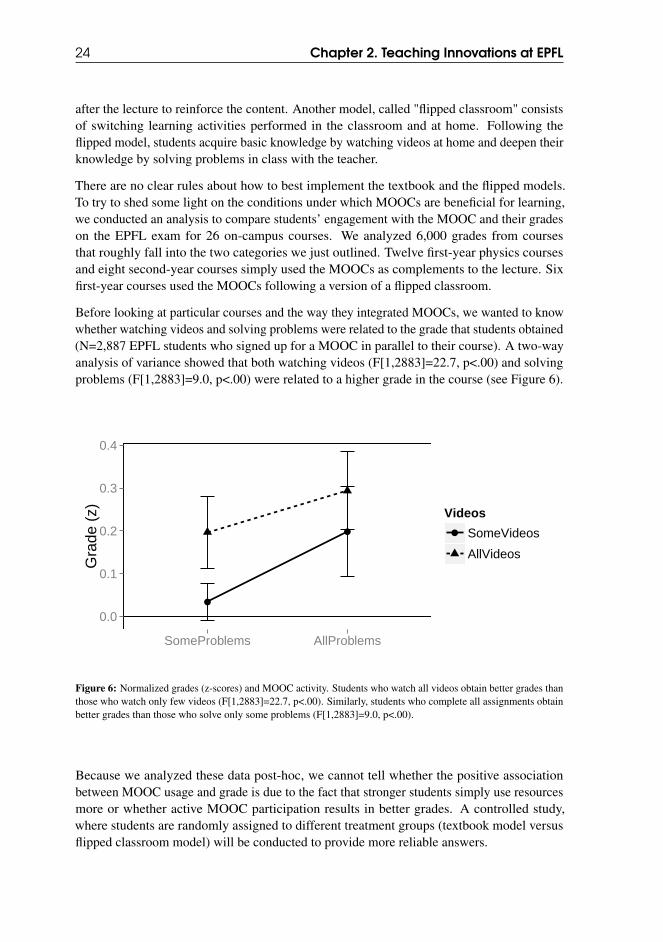
Before looking at particular courses and the way they integrated MOOCs, we wanted to knowwhether watching videos and solving problems were related to the grade that students obtained(N=2,887 EPFL students who signed up for a MOOC in parallel to their course). A two-wayanalysis of variance showed that both watching videos (F[1,2883]=22.7, p<.00) and solvingproblems (F[1,2883]=9.0, p<.00) were related to a higher grade in the course (see Figure 6).
0.0
0.1
0.2
0.3
0.4
SomeProblems AllProblems
Gra
de (
z) Videos
SomeVideos
AllVideos
Figure 6: Normalized grades (z-scores) and MOOC activity. Students who watch all videos obtain better grades thanthose who watch only few videos (F[1,2883]=22.7, p<.00). Similarly, students who complete all assignments obtainbetter grades than those who solve only some problems (F[1,2883]=9.0, p<.00).
Because we analyzed these data post-hoc, we cannot tell whether the positive associationbetween MOOC usage and grade is due to the fact that stronger students simply use resourcesmore or whether active MOOC participation results in better grades. A controlled study,where students are randomly assigned to different treatment groups (textbook model versusflipped classroom model) will be conducted to provide more reliable answers.

2.2 Are MOOCs Helpful in the Classroom? 25
Textbook model
Let us first look in detail at the "Mécanique" MOOC (Physics 101) that was created by Prof.Jean-Philippe Ansermet. Rather than requiring students to watch the MOOC video lecturesbeforehand, Prof. Ansermet simply offered the MOOC as reference material to his class. Thebasic material was still taught in the traditional ex cathedra style, but was equally available inthe form of video lectures and quizzes that students could refer to at home (in addition to theirlecture notes).
The same first-year physics course is taught in parallel by twelve professors to our 1,500first-year students but not all of them rely on the MOOC. We observed a wide variation ofusing the MOOC by students ranging from 0% to 77%. The highest level of participationwas in Prof. Ansermet’s class, who is the creator of the MOOC. The MOOC was used in 8classes as a complementary resource to the face-to-face lecture and was not used at all in theremaining 4 classes.
We compared the grades (normalized as z-scores) of students who signed up for the MOOCand the students who did not sign up. In half of the cases, the grades of students who used theMOOC were higher than the grades of students who did not (see Figure 7 and Table 3).
Is this difference simply due to the fact that the stronger students use available resourceswhereas weaker students do not? To find out, we used students’ grades on the linear algebraexam as an indicator of their academic level to isolate the MOOC effect. The score in algebraand introductory physics are highly correlated (r=.64) and adding the algebra score to ourstatistical model allows placing the MOOC effect in competition with the academic level. Atwo-way analysis of variance revealed that MOOC participation had a small positive impacton the grade (F[1,2125]=6.6, p<.01) in addition to the huge effect of the students’ academiclevel (F[1,2125]=1502, p<.0001).
Table 3: Comparison of normalized grades (z-scores) for students who participated in the MOOC (yes) and studentswho did not participate (no). See Figure 7.
Course t df p MOOC(N) Course (z-score) dyes no yes no
PHYS-101 (T4) -1.94 18.2 0.07 16 223 -0.41 = 0.02 -0.43PHYS-101 (T3) -0.18 8.5 0.86 6 108 -0.03 = 0.00 -0.04PHYS-101 (T1) 0.04 91.3 0.97 50 152 0.00 = 0.00 0.01PHYS-101 (T6) 2.05 36.0 0.05 30 202 0.39 > * -0.05 0.44PHYS-101 (T10) 2.43 10.3 0.03 10 198 0.62 > * -0.04 0.66PHYS-101 (Anser.) 2.78 95.7 0.01 212 63 0.16 > * -0.23 0.39PHYS-101 (T8) 3.23 180.5 0.00 84 99 0.26 > * -0.20 0.46PHYS-101 (T9) 4.42 289.5 0.00 138 204 0.29 > * -0.19 0.48
We repeated a similar analysis for eight second-year courses. In three courses, the MOOCwas used by nearly all students, which makes a comparison impossible between students whotake the MOOC and those who do not. Among the five remaining classes, the MOOC was notmandatory. Only 1 course out of 5 showed a positive impact of MOOC participation.

26 Chapter 2. Teaching Innovations at EPFL
−0.5
0.0
0.5
1.0P
HY
S−
101
(T4)
PH
YS
−10
1 (T
3)
PH
YS
−10
1 (T
1)
PH
YS
−10
1 (A
nser
met
)
PH
YS
−10
1 (T
6)
PH
YS
−10
1 (T
8)
PH
YS
−10
1 (T
9)
PH
YS
−10
1 (T
10)
PH
YS
−10
1 (T
11)
PH
YS
−10
1 (T
2)
PH
YS
−10
1 (T
5)
PH
YS
−10
1 (T
7)
Gra
de
MOOC Usage
MOOC
NoMOOC
Figure 7: Normalized grades (z-scores) obtained by first-year students in their PHYS-101 course. In 4 courses theMOOC was not used at all. In 4 out of the remaining 8 courses, students who signed up (and participated) in theMOOC obtained a better grade than those who did not. See Table 3 for statistics.
Motivated students always welcome any additional material they can get their hands on. Thedownside of such an approach—with respect to a true flipped classroom model—is that itputs little or no pressure on unmotivated students to become more engaged in the class. Theanalysis of students’ grades supports this conjecture, as it shows that high-performing studentstend to engage more in the MOOCs than low-performing ones.
All in all, one can safely say that the experiment conducted by Prof. Ansermet was a success.A course evaluation survey showed that 91% of his students appreciated the availability ofthe MOOC as a complement to the class. And, in fact, students from parallel classes referredto the same MOOC as an extra resource, despite the fact they were following a class witha different teacher. This leads us to conclude that MOOCs are a legitimate source of studymaterial.

2.2 Are MOOCs Helpful in the Classroom? 27
Figure 8: Jamila Sam and Jean-Cédric Chappelier, lecturers of computer programming at EPFL, have successfullyapplied the flipped classroom model to their classes, "Introduction to Java and C++ Programming".
Flipped classroom model
Jamila Sam and Jean-Cédric Chappelier are two EPFL lecturers who have successfully appliedthe flipped classroom model to their classes, "Introduction to Java and C++ Programming"—an initiative for which they received the Credit Suisse Award for Best Teaching in 2015, whichrecognizes the best contribution to the area of teaching at EPFL.
In the teaching of computer programming languages, teachers often spend the bulk of theirlecture time on the foundation of coding theory and syntax. Although this is a necessarycomponent of teaching computer programming, it leaves less time for other activities that areequally (or more) important in the development of students’ coding skills—such as practicaluse cases, common errors, and exercises.
By "flipping" the classroom, the teachers shifted all the basic material to a MOOC format,comprising video lectures and quizzes. Students were required to watch the video lecturesprior to each class, and solve all the related quizzes at home. In class, they were encouragedto ask questions about what they had learned at home, and participate in the various classdiscussions.
As a result, students arrived to class much better prepared, with concrete and profoundquestions about the material and valuable insights to share with each other. Classes becameless of a monologue about theory and more of a "field training" for the students (and muchmore fun as a result). Moreover, the fact that the MOOC was open to anyone else in the worldgave EPFL students the opportunity to ask for help and feedback from tens of thousands ofother students, through the use of MOOC forums. In all of the Java and C++ MOOC sessionscombined, more than 200,000 students produced 50,000 forum posts.
28 Chapter 2. Teaching Innovations at EPFL
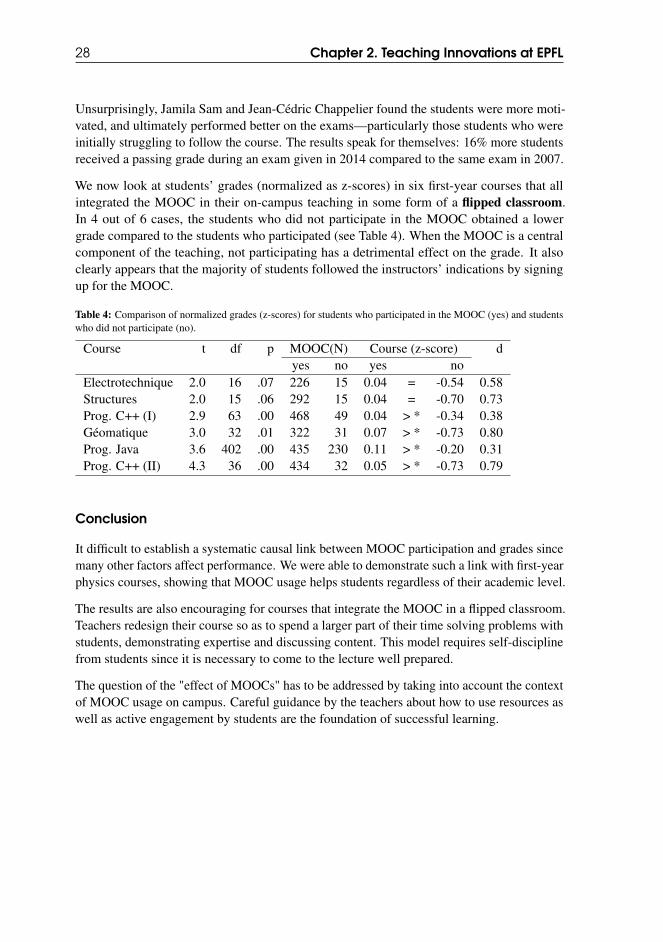
Unsurprisingly, Jamila Sam and Jean-Cédric Chappelier found the students were more moti-vated, and ultimately performed better on the exams—particularly those students who wereinitially struggling to follow the course. The results speak for themselves: 16% more studentsreceived a passing grade during an exam given in 2014 compared to the same exam in 2007.
We now look at students’ grades (normalized as z-scores) in six first-year courses that allintegrated the MOOC in their on-campus teaching in some form of a flipped classroom.In 4 out of 6 cases, the students who did not participate in the MOOC obtained a lowergrade compared to the students who participated (see Table 4). When the MOOC is a centralcomponent of the teaching, not participating has a detrimental effect on the grade. It alsoclearly appears that the majority of students followed the instructors’ indications by signingup for the MOOC.
Table 4: Comparison of normalized grades (z-scores) for students who participated in the MOOC (yes) and studentswho did not participate (no).
Course t df p MOOC(N) Course (z-score) dyes no yes no
Electrotechnique 2.0 16 .07 226 15 0.04 = -0.54 0.58Structures 2.0 15 .06 292 15 0.04 = -0.70 0.73Prog. C++ (I) 2.9 63 .00 468 49 0.04 > * -0.34 0.38Géomatique 3.0 32 .01 322 31 0.07 > * -0.73 0.80Prog. Java 3.6 402 .00 435 230 0.11 > * -0.20 0.31Prog. C++ (II) 4.3 36 .00 434 32 0.05 > * -0.73 0.79
Conclusion
It difficult to establish a systematic causal link between MOOC participation and grades sincemany other factors affect performance. We were able to demonstrate such a link with first-yearphysics courses, showing that MOOC usage helps students regardless of their academic level.
The results are also encouraging for courses that integrate the MOOC in a flipped classroom.Teachers redesign their course so as to spend a larger part of their time solving problems withstudents, demonstrating expertise and discussing content. This model requires self-disciplinefrom students since it is necessary to come to the lecture well prepared.
The question of the "effect of MOOCs" has to be addressed by taking into account the contextof MOOC usage on campus. Careful guidance by the teachers about how to use resources aswell as active engagement by students are the foundation of successful learning.

3. MOOCs: Empowering the World
«Give me a lever long enough and a place to stand on,and I shall move the Earth.» – Archimedes
THERE ARE TWO MAJOR FORCES in human achievement. The first one is leverage—thepower to produce a large result from a small effort applied. The second one is compound-
ing—the effect of multiplying small results and growing them exponentially. Because theseconcepts are not intuitive, people often underestimate the effects of taking small initiatives—which, no matter how small, can quickly grow into outstanding results.
Critics of online education often fall into this trap, by dismissing MOOCs as less worthy than,say, an Ivy League education. In a sense, they are correct. MOOCs are not a replacement for auniversity degree; they serve a different purpose. While an institution like Harvard can propel ayoung student to the top very quickly, an education based on MOOCs requires students to buildtheir own path to the top. Under such circumstances, only those who understand the power ofleveraging and compounding knowledge will prevail in an unprescribed self-educating world.
Perhaps for this reason, the positive effects of online education are still not fully apparent tothe mainstream. There is a myth that says MOOCs have a less than 10% completion ratio.Even though this number is false—as we show in this chapter, the true completion ratiois closer to 73%—the re-enforcement of the myth by critics in the media has plagued thereputation of MOOCs, and delayed their adoption since the beginning of our program.
Furthermore, the market is still skeptical about MOOCs. It is not guaranteed that companieswill accept a MOOC certificate as proof of mastery of a subject1. Yet, 10 years ago, few wouldhave imagined that institutions such as EPFL, Harvard, and Stanford would be competing toput out their best courses available online for free—courses that were once only available
1Positive signs are beginning to emerge in that direction: Coursera reported in 2015 that 26% of their users havefound a job as a result of taking a MOOC, 9% started a business, and 6% received a raise or promotion. Udacity,another MOOC provider, is reimbursing its users if they fail to get a new job within 6 months of paying for one oftheir courses.
30 Chapter 3. MOOCs: Empowering the World
to a tiny elite of students. Some of these top institutions are starting to offer credits to thosewho complete their courses online, and it is only a matter of time until they start offering fulldegrees as well. This is a strong indication that MOOCs are here to stay, and that we arestarting to see a world where common people have more leverage than ever to take control oftheir education, and build their own way to the top.
3.1 Here’s to the Fearless Ones
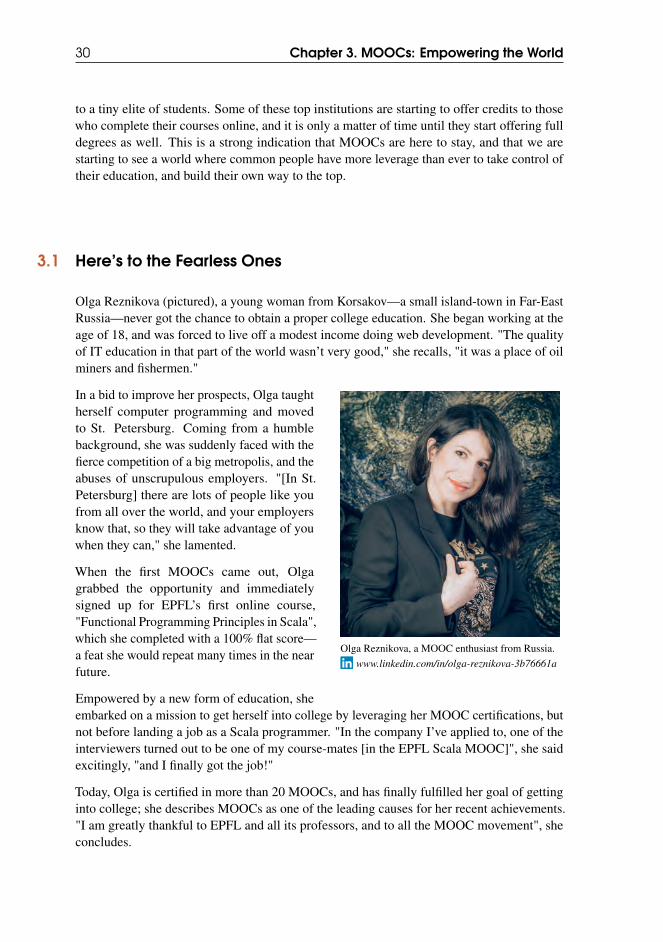
Olga Reznikova (pictured), a young woman from Korsakov—a small island-town in Far-EastRussia—never got the chance to obtain a proper college education. She began working at theage of 18, and was forced to live off a modest income doing web development. "The qualityof IT education in that part of the world wasn’t very good," she recalls, "it was a place of oilminers and fishermen."
Olga Reznikova, a MOOC enthusiast from Russia.www.linkedin.com/in/olga-reznikova-3b76661a
In a bid to improve her prospects, Olga taughtherself computer programming and movedto St. Petersburg. Coming from a humblebackground, she was suddenly faced with thefierce competition of a big metropolis, and theabuses of unscrupulous employers. "[In St.Petersburg] there are lots of people like youfrom all over the world, and your employersknow that, so they will take advantage of youwhen they can," she lamented.
When the first MOOCs came out, Olgagrabbed the opportunity and immediatelysigned up for EPFL’s first online course,"Functional Programming Principles in Scala",which she completed with a 100% flat score—a feat she would repeat many times in the nearfuture.
Empowered by a new form of education, sheembarked on a mission to get herself into college by leveraging her MOOC certifications, butnot before landing a job as a Scala programmer. "In the company I’ve applied to, one of theinterviewers turned out to be one of my course-mates [in the EPFL Scala MOOC]", she saidexcitingly, "and I finally got the job!"
Today, Olga is certified in more than 20 MOOCs, and has finally fulfilled her goal of gettinginto college; she describes MOOCs as one of the leading causes for her recent achievements."I am greatly thankful to EPFL and all its professors, and to all the MOOC movement", sheconcludes.

3.1 Here’s to the Fearless Ones 31
36%18%
31%
8%8%
55%
19%
19%
4%3%
Number of MOOCs:■ 1 ■ 2 to 5 ■ 6 to 10 ■ >10 ■ 0
Percentage of Respondents whoregistered to other MOOCs
Percentage of Respondents whocompleted other MOOCs
Figure 9: Distribution of users who followed andcompleted other MOOCs—including those from otherinstitutions—prior to registering for one of our MOOCs.Users are grouped by number of MOOCs they followed orpassed.
Stories like these are not unique. Ev-ery MOOC session we launch attractsthousands of self-education enthusiasts,who graciously share with us their inspir-ing stories of achievement. We send outsurveys on a regular basis, so that ourusers can give us feedback on their objec-tives and level of commitment, and weexchange e-mails with our most outstand-ing MOOCs alumni.
Most of our users are, in fact, people whofollow MOOCs on a regular basis. Take,for instance, the survey results depictedin Figure 9. The survey showed that 64%of our users have registered for at least
one other MOOC before signing up for one of ours, and an equally impressive 45% havecompleted at least one MOOC before. Furthermore, 16% of our users have registered forat least 6 MOOCs prior to ours, and 8% have registered for more than 10—an impressivepercentage of highly committed users.
0% 20% 40% 60% 80% 100%Electrotechnique IIAlgebre Lineaire IAstrophysiqueProgrammation CppElectronique IProg Java ObjetCellular Brain FunctArt des Structures IProgrammation JavaMagnetic ResonanceSignal ProcessingHumans SpacesAires ProtegeesNew VenturesReactive Programming
Find a new job Earn a higher salaryGet a promotion Solve specific problemMeet family expectations Help passing class
Percentage of Respondents
Figure 10: Reasons cited by users for registering to ourMOOCs. The courses are sorted by decreasing percentageof job-related motives.
The motivation that drives people to fol-low an EPFL MOOC varies according tothe MOOC subject. One of our surveysasked users to specify their motivationfor registering for a given course, by pro-viding the following options: (1) to geta new job; (2) to get a promotion or astatus change; (3) to earn a higher salary;(4) to solve specific problems in their cur-rent job; (5) to help pass a class to geta degree; or (6) to meet the expectationsof their family. The results are shown inFigure 10.
These answers are allusive to the funda-mental motivations that drive human be-ings, such as the need for resources, sta-tus, and appreciation. Although someof the answers are correlated (e.g., "earnmore money" vs "get a promotion") theyare intended to reveal the deep motiva-tions (e.g., money vs status) that lead to the more superficial ones.
At the same time, the answers are representative of the context within which a user followsour MOOC: at school or at work. It is clear that basic-level courses, such as linear algebra and

32 Chapter 3. MOOCs: Empowering the World
electronics, tend to attract students who just want to complete their university coursework,and therefore follow the MOOC to help them pass a specific class. This trend is reversedfor advanced-level and extra-curricular MOOCs, where job related motivations are moreprominent.
Programming courses in particular are associated with job related ambitions, as well as solvingspecific problems at work. The same is true for our entrepreneurship course, in which 92% ofusers are primarily motivated by improving their careers or businesses.
Job van de Kieft, winner of the Best Busi-ness Proposal in our entrepreneurship MOOC.Founder of the startup company Scoozy.
www.linkedin.com/in/jobvandekieft
An example of such a user is Job van de Kieft,the winner of the Best Business Proposal prizefor our "Launching New Ventures" MOOC. Mr.van de Kieft, an entrepreneur from Delft, Holland,was developing his own startup company Scoozy2
when he signed up for the MOOC taught by EPFLbusiness professors Christopher Tucci and MarcGruber. The MOOC, he said, helped him structuresome of his fragmented ideas about business intoa concrete and executable strategy.
"The course helped me create a bigger picture ofall the separate aspects I had already looked into",he said. "It helped me understand my customersbetter, and led me to negotiate a paid pilot projectwith a particular customer who could very well bethe one that makes my business take off". This isan exemplary case of a small initiative that has ledto a big and unexpected result.
These, and other examples are the precise reasonwhy MOOCs work. People do not need to be"spoon fed"; if they are motivated, they will recog-nize the value of what we offer and they will benefit from it. The next section will reinforcethis conclusion by presenting the latest key performance indicators of our MOOCs.
3.2 Status Report: 2012 to 2015
The year 2015 has come to an end, and after more than 3 years of operation we can proudlysay that the EPFL MOOCs program has been serving its purpose beyond all expectations. Inaddition to the overwhelming adoption of MOOCs by EPFL students, and the success storieswe receive from our users abroad, all of our international indicators suggest we are moving inthe right direction—despite the increasing competition from other institutions, and the settlingof the initial "MOOCs euphoria".
2www.scoozy.nl
3.2 Status Report: 2012 to 2015 33
At the Center for Digital Education (CEDE), new MOOCs are being produced and deployedevery semester, allowing us to acquire hundreds of thousands of new users every year. Manyof these users are actively engaging in our courses, and successfully completing the requiredcoursework, even though our MOOCs are as challenging and difficult to pass as our classroomcourses.
This means that, every year, thousands of people are receiving an EPFL-grade educationon a variety of subjects from the comfort of their distant homes, including many homes indeveloping countries. This is a remarkable achievement for EPFL and its professors, whichwe intend to preserve in the years to come.
In this section, we analyze the evolution of our main indicators from September 2012 (whenour first MOOC was launched) to December 2015. These indicators include what we callthe "vital signs"—number of registrations, active users, and certified users—as well asdemographic data, including age, gender, and country of origin. With this goal in mind, thevarious graphs presented next depict the main vital indicators as a function of either time ordate of launch of our MOOC sessions. These graphs will hopefully provide the reader with anintuitive "temporal overview" of our entire MOOCs program to date.
Engagement and achievement
On the 24th of August 2015, EPFL reached 1 million MOOC registrations. This numberhas since grown to an estimated 1.17 million, with a total of 58,000+ certified users (thosewho passed) from 186 countries and 28 territories. Out of all the registered users:
- 218,000+ (23%) submitted at least one assignment (those we call actives), of whom26% passed;
- 77,000+ (8%) submitted at least half the assignments (those we call very actives), ofwhom 73% passed.
There are two lessons that can be taken from these simple numbers: (1) users who commit atleast one step towards following the course—in this case, submitting an assignment—morethan double their chances of success (recall the 10% passing rate myth); (2) users whoseriously try to follow the course, by regularly submitting assignments, normally pass.
In terms of registrations, the number has been remarkably stable each year: 321,882 in 2013,362,547 in 2014, and 329,908 in 2015. That is a variation of little more than 6% from oneyear to the next. This stability can be observed in the vital signs graph of Figure 11—a graphthat we call the MOOCs "heart beat". It represents the weekly number of registrations for allof our open3 MOOC sessions combined.
Looking at the graph, one can easily notice that every "heart beat" corresponds to a registrationscycle of 1 semester, when most of our MOOCs are deployed. Although some "beats" areclearly stronger than others (depending on the popularity of the courses involved) the overallpattern is relatively stable, hence explaining the small yearly variation.
3In both Coursera and EdX, every course accepts new registrations for as long as a session is open.

34 Chapter 3. MOOCs: Empowering the World
0
5,000
10,000
15,000
20,000
25,000Registrations per week
0
10,000
20,000
30,000
40,000
50,000
60,000Registrations per semester ■ Scala Programming ■ Reactive Programming ■ Signal Processing ■ Linear Optimization ■ Other Courses
Fall 2012 Spring 2013 Fall 2013 Spring 2014 Fall 2014 Spring 2015 Fall 2015
Time Frame (semester)
MOOC Sessions MOOC Sessions MOOC Sessions MOOC SessionsMOOC Sessions MOOC Sessions MOOC Sessions
Fall 2012 Spring 2013 Fall 2013 Spring 2014 Fall 2014 Spring 2015 Fall 2015
Time Frame (semester)
Weeks 1-26 Weeks 27-53 Weeks 1-26 Weeks 27-53Weeks 27-53 Weeks 1-26 Weeks 27-53
Figure 11: MOOC Vital Signs I: Number of registrations. Top. Number of registrations over time. The graph showsthe weekly number of registrations on a linear time frame, and includes registrations from all open MOOC sessionseach week. Bottom. Number of registrations per MOOC, per semester. The graph shows the number of registrationsthat each MOOC received during each semester, sorted by decreasing number of registrations. Note that, from 2012to 2015, the number of open MOOC sessions progressively increases, even though the number of registrations perMOOC decreases. This helps to preserve a high and stable number of registrations each semester.
This will change in the future, as we drop the old session-based MOOCs in favor of theon-demand model—currently being adopted by Coursera and EdX—where users are allowedto follow the courses whenever they want, at their own pace. As a result, once all of ouron-demand courses have been deployed, the oscillatory pattern of Figure 11-(top) will mostlikely converge to a flat line4.
Another useful look at the temporal progress of our MOOCs program is the vital signs graphof Figure 12, which depicts the number of active users (those who submitted at least oneassignment) together with those who passed the course. This graph, however, should beanalyzed with caution, since it does not follow a linear temporal flow.
In fact, the horizontal axis of the graph represents the start date of the MOOC sessions,which implies that each point incorporates the entire population of users who followed therespective course over the following weeks—all compressed into a single point. As a result,the impression that the curve is decreasing with "time" is only illusory.
4We hypothesize that, in an on-demand environment, new users will sign up for our MOOCs in accordance with aPoisson process, just like other human behavioral phenomena in which events occur continuously and independentlyat a constant average rate.

3.2 Status Report: 2012 to 2015 35
10
100
1,000
10,000
100,000Number of users per session ■ Actives ■ Passed
50
500
5,000
50,000
Scala
Programming
SignalProcessin
g
ReactiveProgramming
Programmation
Java
Prog
Java
Objet
Programmation
Cpp
Prog
CppOb
jet
VillesA
fricaine
sI
LinearO
ptimiza
tion
Microcontroleu
rs
NeuronalDy
namics
Mecaniqu
eI
Analy
seNu
meriqu
e
WaterTreatment
Artdes
Structu
resI
Geom
atiqu
e
Electrotechniq
ueII
PlasmaPh
ysics
Cellular
Brain
Funct
Astrophysiqu
e
Sanitation
Syste
ms
NewVe
ntures
AlgebreLin
eaire
I
AiresP
rotegees
Number of users per MOOC ■ Actives ■ Passed
Spring 2013 Fall 2013 Spring 2014 Fall 2014 Spring 2015 Fall 2015
Time Frame (semester)
Sep 1 - Nov 25 Jan 19 - Jun 22 Sep 4 - Nov 23Feb 18 - Mar 25 Sep 13 - Nov 4 Feb 17 - Apr 28
MOOC Titles (all sessions included)
Figure 12: MOOC Vital Signs II: Number of active and certified users. Top. Number of active and certified usersover time. The graph shows the number of users who submitted at least 1 assignment (actives) and those who passedthe course, on a vertical log scale. The horizontal axis is sorted by start date of MOOC sessions, in order to give theimpression of temporal evolution. Bottom. Number of active and certified users per MOOC. The graph shows thenumber of active and certified users that each MOOC amassed during all deployed sessions, sorted by decreasingnumber of actives. Note that this ranking favors older courses that went through multiple sessions (such as "ScalaProgramming" with 5 sessions) against those that launched only once (such as "Launching New Ventures").
Nevertheless, it is interesting to observe that whenever a new session of our most popularMOOCs is launched—such as "Scala Programming", "Reactive Programming", and "SignalProcessing"—there is a peak in both the number of active users and the number of users whopass the course.
This type of graph allows us to precisely determine which MOOC sessions were the mostpopular, and which ones failed to attract a satisfactory following (in comparison to ourglobal historical performance). Several decisions are made as a direct result of such analysis,particularly when choosing subjects for future MOOCs.
The third vital signs graph that we use to evaluate the general health of our MOOCs programis illustrated in Figure 13. This graph shows the percentage of engaged users who passeach MOOC session as they are launched over time. We distinguish between two levels ofengagement: active users (those who submit at least one assignment) and very active users(those who submit at least half of the assignments).
As the graph shows, the passing rates among active and very active users has been relatively

36 Chapter 3. MOOCs: Empowering the World
0%
25%
50%
75%
100%
Spring 2013 Fall 2013 Spring 2014 Fall 2014 Spring 2015 Fall 2015
Percentage of users per session ■ Actives who passed ■ Very Actives who passed
0%
25%
50%
75%
100%
Astrophysiqu
eSignalProcessin
gCe
llular
Brain
Funct
Prog
Java
Objet
LinearO
ptimiza
tion
Scala
Programming
ReactiveProgramming
Sanitation
Syste
ms
Scala
Prog
EPFL
NeuronalDy
namics
AlgebreLin
eaire
IIElectrotechniq
ueII
Programmation
Cpp
Prog
CppOb
jetHu
mansS
paces
Microcontroleu
rsMecaniqu
eII
VillesA
fricaine
sIAlgebreLin
eaire
IIIAn
alyse
Numeriqu
eWaterTreatment
Artdes
Structu
resII
Artdes
Structu
resI
Electroniq
ueI
AiresP
rotegees
Geom
atiqu
eProgrammation
Java
Mecaniqu
eI
PlasmaPh
ysics
AlgebreLin
eaire
IMagnetic
Resonance
FonctTrig
LogExp
Mecaniqu
eFluid
esNe
wVe
ntures
Percentage of users per MOOC ■ Actives who passed ■ Very Actives who passed ■ Very Actives who failed
Time Frame (semester)
Sep 1 - Nov 25 Jan 19 - Jun 22 Sep 4 - Nov 23Feb 18 - Mar 25 Sep 13 - Nov 4 Feb 17 - Apr 28
MOOC Titles (all sessions included)
Figure 13: MOOC Vital Signs III: User performance. Top. Percentage of active and very active users who passedover time. The graph shows the percentage of users who passed the course among those who submitted at least 1assignment (actives) and those who submitted at least half of the assignments (very actives). The horizontal axis issorted by start date of MOOC sessions, in order to give the impression of temporal evolution. Bottom. Percentage ofactive and very active users who passed each MOOC—all sessions included. In this ranking, since it is shown on apercentage scale, there is no bias favoring MOOCs with more than 1 session. It is, however, affected by the gradethat instructors have chosen as the passing threshold. The vertical dashed line separates the courses that had morethan 50% passing rate among very actives from those that had less.
steady for the last 3.5 years. It also shows a high effectiveness of our professors in educatingengaged users online: only 13 of the 71 MOOC sessions launched by EPFL saw less than 50%of very active users passing the course. In the remaining 58 sessions, more than 50% havepassed. In fact, by this measure, 2015 was our best year: only 4 sessions out of 31 finishedbelow the 50% passing rate threshold.
Assuming we are able to maintain this steady performance, increasing the number of certifiedusers at the end of each year is a matter of attracting more registrations—a problem that canbe solved with better marketing (see Chapter 5).
Country of origin
Among the 193 countries recognized by the United Nations, there are only 7 which EPFLhas not yet reached with the MOOCs program. These are: Nauru, Palau, Solomon Islands,South Sudan, Timor-Leste, Tonga, and Tuvalu. All other 186 countries—and an additional 28
3.2 Status Report: 2012 to 2015 37
10,000 registrations
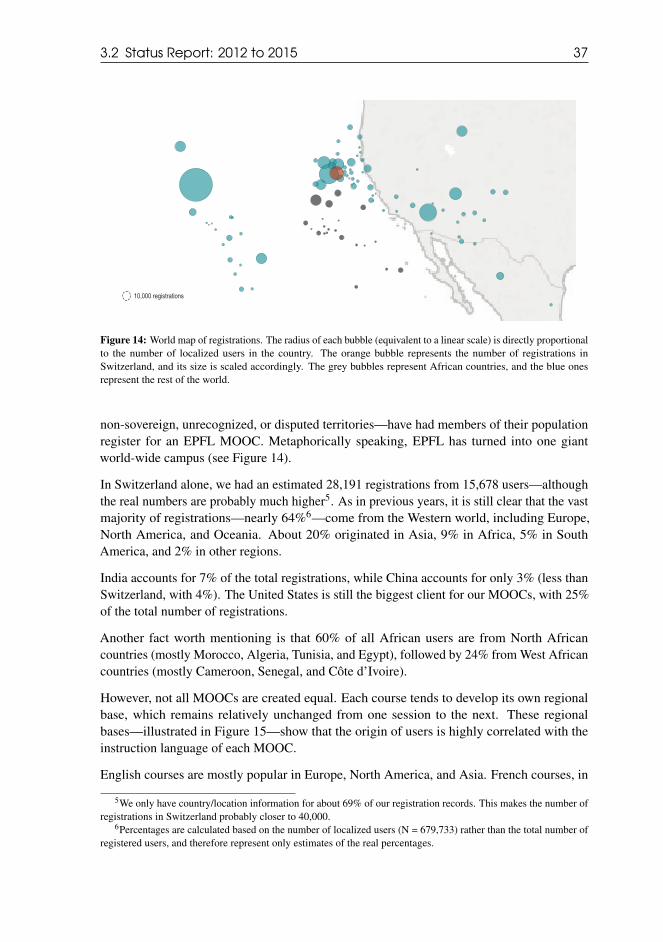
Figure 14: World map of registrations. The radius of each bubble (equivalent to a linear scale) is directly proportionalto the number of localized users in the country. The orange bubble represents the number of registrations inSwitzerland, and its size is scaled accordingly. The grey bubbles represent African countries, and the blue onesrepresent the rest of the world.
non-sovereign, unrecognized, or disputed territories—have had members of their populationregister for an EPFL MOOC. Metaphorically speaking, EPFL has turned into one giantworld-wide campus (see Figure 14).
In Switzerland alone, we had an estimated 28,191 registrations from 15,678 users—althoughthe real numbers are probably much higher5. As in previous years, it is still clear that the vastmajority of registrations—nearly 64%6—come from the Western world, including Europe,North America, and Oceania. About 20% originated in Asia, 9% in Africa, 5% in SouthAmerica, and 2% in other regions.
India accounts for 7% of the total registrations, while China accounts for only 3% (less thanSwitzerland, with 4%). The United States is still the biggest client for our MOOCs, with 25%of the total number of registrations.
Another fact worth mentioning is that 60% of all African users are from North Africancountries (mostly Morocco, Algeria, Tunisia, and Egypt), followed by 24% from West Africancountries (mostly Cameroon, Senegal, and Côte d’Ivoire).
However, not all MOOCs are created equal. Each course tends to develop its own regionalbase, which remains relatively unchanged from one session to the next. These regionalbases—illustrated in Figure 15—show that the origin of users is highly correlated with theinstruction language of each MOOC.
English courses are mostly popular in Europe, North America, and Asia. French courses, in
5We only have country/location information for about 69% of our registration records. This makes the number ofregistrations in Switzerland probably closer to 40,000.
6Percentages are calculated based on the number of localized users (N = 679,733) rather than the total number ofregistered users, and therefore represent only estimates of the real percentages.

38 Chapter 3. MOOCs: Empowering the World
0%
20%
40%
60%
80%
100%
ReactiveProgramming
Scala
Programming
HumansS
paces
LinearO
ptimiza
tion
NeuronalDy
namics
PlasmaPh
ysics
Cellular
Brain
Funct
Magnetic
Resonance
SignalProcessin
g
WaterTreatment
Sanitation
Syste
ms
NewVentures
AlgebreLin
eaire
II
AlgebreLin
eaire
III
AlgebreLin
eaire
I
Mecaniqu
eI
Artdes
Structu
resII
Artdes
Structu
resI
FonctTrig
LogExp
Analy
seNu
meriqu
e
Geom
atiqu
e
Electrotechniq
ueII
Electroniq
ueI
Mecaniqu
eFluid
es
Programmation
Java
Prog
Java
Objet
Microcontroleu
rs
VillesA
fricaine
sI
Programmation
Cpp
Prog
CppOb
jet
Mecaniqu
eII
Astrophysiqu
e
AiresP
rotegees
Switzerland Rest of Europe North America OceaniaSouth America Asia Africa
Percentage of Users
MOOC Titles (all sessions included)
English MOOCs French MOOCs
Figure 15: Distribution of users across regions and continents for English and French MOOCs. The chart showsthe regional base developed by each course for the whole duration of its existence online. The high percentage ofusers in Switzerland for propaedeutic French MOOCs can be partially explained by the fact that instructors at EPFLencourage their use as additional material (but it could also be a result of these courses having a low number ofregistrations).
contrast, are dominated by African and European users (including a large proportion fromSwitzerland), even though all French MOOCs have English subtitles. Among our FrenchMOOCs, in particular, those that are targeted to EPFL students attract a high percentage ofusers from Switzerland.
It should be noted, however, that the language dimension is not independent from the courselevel, as most basic courses at EPFL are taught in French, while more advanced courses aretaught in English. Moreover, almost 70% of European users who take our French courses arefrom French-speaking countries (such as France, Switzerland, Belgium, and Luxembourg). Incontrast, only 15% of European users who take our English courses are from French-speakingcountries.
The specific subject area covered by MOOCs can also influence their geographical distribution.Courses such as "Water Treatment", "Sanitation Systems", and "Launching New Ventures",even though they are taught in English, are particularly relevant in the African continent.
Demographics
From a demographics standpoint, the profile of our users has not changed significantly from2012 to 2015. For this reason, there is no point in discussing the temporal evolution ofdemographic indicators, such as age, education, and background. Instead, we will discuss theaggregated numbers of the past 3.5 years.
The simplest demographics indicator we use is the users’ gender. As Figure 16 shows, ourcourses have different proportions of male and female users depending on the subjects beingtaught, much like the gender ratios observed in traditional colleges.

3.2 Status Report: 2012 to 2015 39
10%
11%
19%
20%
34%
36%
42%
0% 25% 50% 75% 100%
School of Computer andCommunications
School of Engineering
School of Basic Sciences
College of Management ofTechnology
EAWAG Aquatic Research*
School of Architecture, Civil,Environmental Engineering
School of Life Sciences
Female Male EPFL School
* Non-EPFL research institute
Figure 16: Gender distribution in MOOCs authoredby each EPFL school (except EAWAG).
On the one hand, male users tend to domi-nate courses in the areas of basic sciences,engineering, and information technology. Onthe other, courses in the areas of life sciences,architecture, and humanities have a more bal-anced ratio, with the percentage of femalesgoing up to 42%.
The gender ratio also varies with the age ofour users. Figure 17-(top) shows that ourMOOCs are taken mostly by young peoplebetween the ages of 22 and 28 (peaking atage 25) with a female-to-male ratio of 1:5, fol-lowed by people between 29 and 34 with a 1:6gender ratio, and 45 to 54 with a 1:8 gender
ratio. In general, the ratio between females and males tends to decrease for older age groups.
0
20,000
40,000
60,000
80,000
< 18 18-21 22-28 29-34 35-44 45-54 55-64 65+
Female MaleNumber of Users
0
10,000
20,000
30,000
40,000
50,000
60,000
HighSchool
AssociateDegree
BachelorDegree
MasterDegree
DoctorateDegree
Other
Female MaleNumber of Users
Age Groups
Highest Educational Degree
Figure 17: Top. Number of MOOC users by age group andgender. Bottom. Number of MOOC users by level of education(highest degree obtained). Note that the graphs only account forusers who filled out the demographics survey, which are no morethan 15% on average.
In terms of user education, thehigher number of registrations forages 22 to 28 is consistent with theage group of typical academic pro-grams. By age 25, students havefinished their Bachelor’s and Mas-ter’s degrees, and resort to MOOCsas part of their continuing educa-tion. This is confirmed by the aca-demic degrees held by users of ourMOOCs, illustrated in Figure 17-(bottom). The chart demonstratesthat most registrations come frompeople with Bachelor’s and Master’sdegrees. This is true for both malesand females, who have a nearlyequal distribution of academic de-grees.
Continuing education is a key con-cept in evaluating the target audienceof online courses. While commonsense would suggest that full-timestudents represent the largest groupof clients for online courses, our data shows that only 34% of registered users are, in fact,enrolled in an educational program. An astounding 66% of users are not students (see Fig-ure 18). These statistics, which are important in defining the future strategy of our MOOCsprogram, will be discussed in more detail in Chapter 5.

40 Chapter 3. MOOCs: Empowering the World
25%
9%
66%
Full-time Student
Part-time Student
Not a Student
Student Status of MOOC Users
Employed: 89%Unemployed: 11%
Figure 18: Percentage of MOOC users who are cur-rently enrolled in an educational program.
In this context, it is equally important to un-derstand the educational background of ouruser-base. Figure 19 illustrates the percentageof users who have studied (or are currentlyworking on) a particular class of subject ar-eas.
The chart shows that our MOOC catalog ap-peals to users with a variety of backgrounds,depending on the subject and level of special-ization of the course. For instance, "Func-tional Programming in Scala", "Principles of
Reactive Programming", and "Digital Signal Processing"—our 3 most popular MOOCs—are highly technical and specialized, and therefore attract a higher percentage of engineersand computer scientists. On the other end of the spectrum, courses like "African Cities","Sanitation Systems", and "Water Treatment" attract users from a variety of other backgrounds.
0%
20%
40%
60%
80%
100%
ReactiveProgramming
Scala
Programming
SignalProcessin
g
LinearO
ptimiza
tion
Microcontroleu
rs
Analy
seNu
meriqu
e
Prog
Java
Objet
Prog
CppOb
jet
Programmation
Java
Programmation
Cpp
Geom
atiqu
e
Artdes
Structu
resI
Mecaniqu
eI
Mecaniqu
eII
Artdes
Structu
resII
NewVentures
VillesA
fricaine
sI
Sanitation
Syste
ms
WaterTreatment
AiresP
rotegees
Percentage of Users
■ Legal, Administration, Social Services■ Construction, Food, Utilities■ Healthcare, Life Sciences
■ Arts, Design, Entertainment■ Business, Finance, Sales, Management
■ Education and Training■ Architechture, Civil Engineering■ Math, Computers, Engineering
MOOC Titles (all sessions included)
Figure 19: Background of users who followed our MOOCs. The courses are approximately sorted by percentage ofusers with a highly technical background to a less technical one.

4. Impact in Africa
«I showed my friend the windmill I was building that would produce power formy home. He asked me where I got such a cool idea. I said: the library!»
– William Kamkwamba, 15-year-old author from Malawi
USING THE WORD "REVOLUTION" to describe the advent of Massive Open Online Courses(MOOCs) has long been avoided by EPFL. The paradigm of online education is not new,
at least to the Western world, and has been implemented in many different forms ever sincethe advent of the Internet. Yet, if there is a place in the world where MOOCs can potentiallybe revolutionary, that place is Africa.
With the exception of a few countries—particularly in the north—the continent of Africa isstill largely under-educated. In central Africa, the adult literacy rate is estimated to be as lowas 15-40%, despite the region having the highest birth rates in the world1. How to providea high-quality education to such a large population of young people is one of Africa’s mainchallenges for the 21st century, and one that MOOCs (powered by the Internet) can help solve.
Never in the history of the region has Africa had such wide-spread access to first-rate educa-tional material like it has today. In the last decade alone, the percentage of the population withaccess to the Internet in sub-Saharan countries has grown from 2% to 20%. Although most ofthese connections are low-bandwidth, they provide unprecedented access to the educationalsystem of developed societies.
However, access to knowledge is not enough. Students still need a well-organized localinstitution that can guide and motivate them throughout their studies. This is why partnershipswith local African schools and universities are so important to help Africa adopt a modernand efficient educational system. It is with this sense of responsibility that EPFL decided tolaunch the MOOCs for Africa program—a long-term initiative to bring MOOCs into the heartof Africa.
1All social-economic indicators in this chapter are obtained from the World Bank Organization, unless statedotherwise.
42 Chapter 4. Impact in Africa
Specifically, the initiative aims at building partnerships with universities of technology in sub-Saharan African countries, and producing MOOCs with direct interest to those universities. Asa result of adopting these MOOCs into their own curriculum, we expect African universitiesto act as regional hubs for the dissemination of our courses among the rest of their studentpopulation.
The next step of this initiative, which is already being put into action, is to offer EPFLcertificates to Africans who complete our MOOCs with a proctored exam. This will provide asignificant amount of leverage when applying to jobs, universities, and foreign institutions.
4.1 Higher Education in Africa
Despite the dramatic growth of higher education in Africa in recent years, only 6% of studentsof suitable age are enrolled in a higher education program—compared to 20–40% in mostdeveloping countries, and 72% in North America and Western Europe. In French-speakingAfrica, the enrollment is estimated to be 3-4%.
To make matters worse, at the current population growth rate, the population of Africa isexpected to double by 2050 (possibly sooner)2. If the situation does not improve by then,Africa risks being left with an estimated 178 million young adults without access to highereducation3.
This presents a formidable challenge for the continent in the time to come. And despitethe genuine attempts of some African countries to modernize their educational systems, thequestion remains of how to effectively educate such a massive new generation of people thatwill soon be approaching working age.
The role of MOOCs
One of the answers—certainly among many—is to encourage the adoption of MOOCs inAfrican universities. There are many advantages of doing so, particularly in terms of quality,cost, and scalability.
By using our MOOCs, Africans will have access to some of the best educational material inthe world, taught by world-leading experts in each field. In the past, such a possibility wouldhave been available only to a small elite group of students who could pursue their studies inEurope or the United States. With MOOCs, they can get a share of that education from theirown home country.
For the university, the additional cost of hosting MOOCs is negligible in comparison to itsscalability. If only low-bandwidth connectivity is available to the university, as is often the
2"World Population Data Sheet", Population Reference Bureau, 2013.3According to projections by the United Nations Department of Economic and Social Affairs, 8.5% of the
population in Africa will be aged 20-29 in 2050. With a population increase from 1.1 to 2.2 billion, the number ofcollege-age adults will be 187 million, of whom only 9 million will have access to higher education.
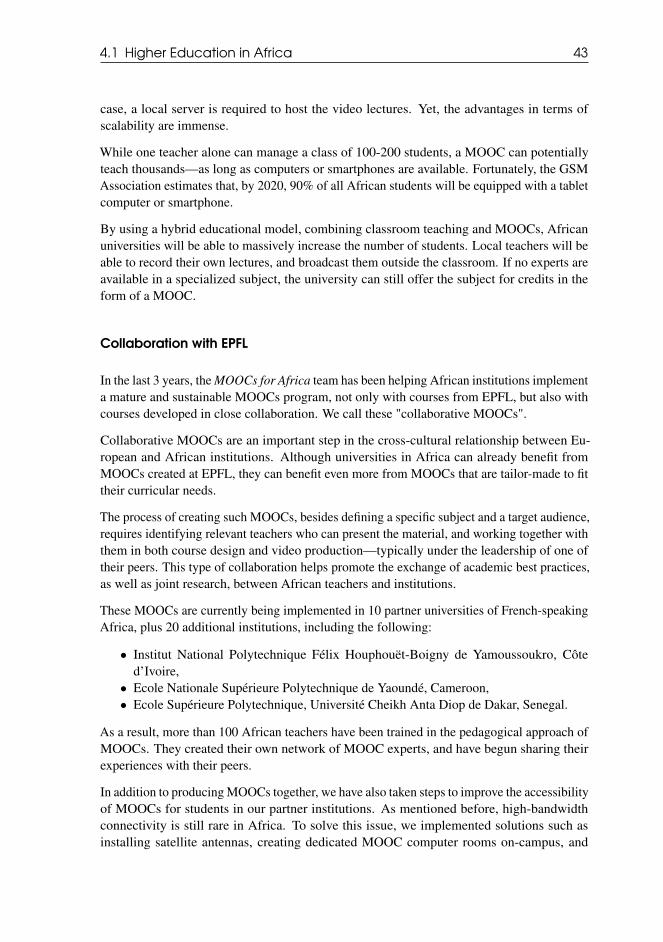
4.1 Higher Education in Africa 43
case, a local server is required to host the video lectures. Yet, the advantages in terms ofscalability are immense.
While one teacher alone can manage a class of 100-200 students, a MOOC can potentiallyteach thousands—as long as computers or smartphones are available. Fortunately, the GSMAssociation estimates that, by 2020, 90% of all African students will be equipped with a tabletcomputer or smartphone.
By using a hybrid educational model, combining classroom teaching and MOOCs, Africanuniversities will be able to massively increase the number of students. Local teachers will beable to record their own lectures, and broadcast them outside the classroom. If no experts areavailable in a specialized subject, the university can still offer the subject for credits in theform of a MOOC.
Collaboration with EPFL
In the last 3 years, the MOOCs for Africa team has been helping African institutions implementa mature and sustainable MOOCs program, not only with courses from EPFL, but also withcourses developed in close collaboration. We call these "collaborative MOOCs".
Collaborative MOOCs are an important step in the cross-cultural relationship between Eu-ropean and African institutions. Although universities in Africa can already benefit fromMOOCs created at EPFL, they can benefit even more from MOOCs that are tailor-made to fittheir curricular needs.
The process of creating such MOOCs, besides defining a specific subject and a target audience,requires identifying relevant teachers who can present the material, and working together withthem in both course design and video production—typically under the leadership of one oftheir peers. This type of collaboration helps promote the exchange of academic best practices,as well as joint research, between African teachers and institutions.
These MOOCs are currently being implemented in 10 partner universities of French-speakingAfrica, plus 20 additional institutions, including the following:
• Institut National Polytechnique Félix Houphouët-Boigny de Yamoussoukro, Côted’Ivoire,• Ecole Nationale Supérieure Polytechnique de Yaoundé, Cameroon,• Ecole Supérieure Polytechnique, Université Cheikh Anta Diop de Dakar, Senegal.
As a result, more than 100 African teachers have been trained in the pedagogical approach ofMOOCs. They created their own network of MOOC experts, and have begun sharing theirexperiences with their peers.
In addition to producing MOOCs together, we have also taken steps to improve the accessibilityof MOOCs for students in our partner institutions. As mentioned before, high-bandwidthconnectivity is still rare in Africa. To solve this issue, we implemented solutions such asinstalling satellite antennas, creating dedicated MOOC computer rooms on-campus, and
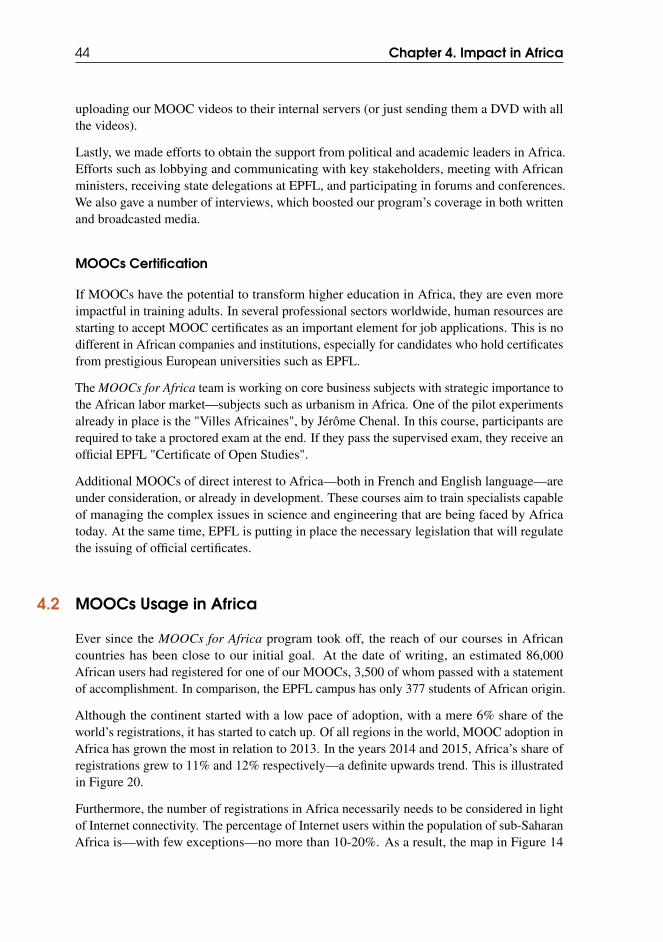
44 Chapter 4. Impact in Africa
uploading our MOOC videos to their internal servers (or just sending them a DVD with allthe videos).
Lastly, we made efforts to obtain the support from political and academic leaders in Africa.Efforts such as lobbying and communicating with key stakeholders, meeting with Africanministers, receiving state delegations at EPFL, and participating in forums and conferences.We also gave a number of interviews, which boosted our program’s coverage in both writtenand broadcasted media.
MOOCs Certification
If MOOCs have the potential to transform higher education in Africa, they are even moreimpactful in training adults. In several professional sectors worldwide, human resources arestarting to accept MOOC certificates as an important element for job applications. This is nodifferent in African companies and institutions, especially for candidates who hold certificatesfrom prestigious European universities such as EPFL.
The MOOCs for Africa team is working on core business subjects with strategic importance tothe African labor market—subjects such as urbanism in Africa. One of the pilot experimentsalready in place is the "Villes Africaines", by Jérôme Chenal. In this course, participants arerequired to take a proctored exam at the end. If they pass the supervised exam, they receive anofficial EPFL "Certificate of Open Studies".
Additional MOOCs of direct interest to Africa—both in French and English language—areunder consideration, or already in development. These courses aim to train specialists capableof managing the complex issues in science and engineering that are being faced by Africatoday. At the same time, EPFL is putting in place the necessary legislation that will regulatethe issuing of official certificates.
4.2 MOOCs Usage in Africa
Ever since the MOOCs for Africa program took off, the reach of our courses in Africancountries has been close to our initial goal. At the date of writing, an estimated 86,000African users had registered for one of our MOOCs, 3,500 of whom passed with a statementof accomplishment. In comparison, the EPFL campus has only 377 students of African origin.
Although the continent started with a low pace of adoption, with a mere 6% share of theworld’s registrations, it has started to catch up. Of all regions in the world, MOOC adoption inAfrica has grown the most in relation to 2013. In the years 2014 and 2015, Africa’s share ofregistrations grew to 11% and 12% respectively—a definite upwards trend. This is illustratedin Figure 20.
Furthermore, the number of registrations in Africa necessarily needs to be considered in lightof Internet connectivity. The percentage of Internet users within the population of sub-SaharanAfrica is—with few exceptions—no more than 10-20%. As a result, the map in Figure 14

4.3 Case Study: Launching New Ventures 45
gives an unfair view of the success in our MOOCs program in Africa. A more realistic view isgiven by the map in Figure 21, which shows the number of registrations among the populationof Internet users in each country.
0.6
0.8
1.0
1.2
1.4
1.6
1.8
2.0
2.2
2013 2014 2015
AfricaEuropeNorth AmericaSouth AmericaAsiaOceania
Proportional increase from 2013
Year (Jan-Dec)
Figure 20: Proportional increase or decrease in reg-istrations with respect to 2013 in each continent.The values are normalized according to the formulaf (y,c) = R(y,c)
R(2013,c)/∑cR(y,c)
R(2013,c) , where R(y,c) is thenumber of registrations for year y and continent c.
The map demonstrates that African coun-tries where we have been actively promot-ing our MOOCs—countries like Senegal,Côte d’Ivoire, Benin, Togo, Cameroon, andMadagascar—have an effective adoption rateamong Internet users comparable to that ofEuropean countries, and even higher than theUnited States, India, and China.
From a success point of view, African usersdo not lag behind the rest of the world. Thepassing rate among "very active" users (thosewho submitted at least half of the assignments)is 60% in Africa, compared to 74% in theother continents combined. Moreover, theaverage grade among users who passed is83/100 in Africa compared to 88/100 in other
continents, which is remarkably close.
Where Africa still lags behind is in terms of user retention. Only 6% of registered users fromAfrica can be considered "very active", compared to 11% in the rest of the world. This couldbe happening for a variety of reasons, including students using the MOOC as a complementto their lectures—in which case, they have no motivation to submit assignments for grading.However, as the achievement numbers show, once African users commit to solving (andsubmitting) the assignments, they tend to pass with a good grade.
In terms of demographics, the percentage distributions of age, gender, and education inAfrica do not differ much from other continents. The analysis in Section 3.2 can therefore beused as a reference.
4.3 Case Study: Launching New Ventures
A good example of a MOOC that embodies the strategy of the MOOCs for Africa program isthe entrepreneurship course entitled "Launching New Ventures". This course was created byProfessors Marc Gruber and Chris Tucci, from the College of Management of Technology(CDM) at EPFL, with the purpose of teaching entrepreneurship to people who are interestedin starting a new venture, and especially tailored for a audience of entrepreneurs (or aspiringentrepreneurs) in emerging economies in Africa.
The course features interviews with many African entrepreneurs, which help students seereal applications of the course material, experience positive inspiration, and realize that
46 Chapter 4. Impact in Africa
1 registration per1,000 internet users
Figure 21: Number of registrations per 1,000 Internet users in each country. The radius of each bubble (equivalent toa linear scale) is directly proportional to the number of localized users in that country. The orange bubble representsthe number of registrations in Switzerland, and its radius is scaled accordingly. The grey bubbles represent Africancountries, and the blue ones represent the rest of the world.
entrepreneurship is not just a Silicon Valley phenomenon. It also included a contest, wherefive of the top performing new venture teams were invited to an intensive entrepreneurshipworkshop in Switzerland, hosted at EPFL and CERN, in late 2015.
However, what made the experience of launching this course particularly interesting is that itwas distributed in refugee camps in Africa, and followed by people within the camps with aremarkable level of engagement.
The initiative took place at the Ampain Refugee Camp and the Krisan Refugee Camp, both inGhana (see Figure 22), and was organized by the Open University of West Africa (OUWA)—an open university which runs courses based on MOOCs. Refugees were given smartphoneswith shared headphones where they could watch the MOOC videos and solve the exercisestogether. At the end of the course, the refugees were expected to come up with their ownventure idea, and pitch their proposal in front of a camera.
In the end, more than 90% of the participating refugees completed the MOOC successfully.Those who completed the MOOC earned a joint certificate of completion signed by Chris Tucciand OUWA president John Roberts4. Those who participated but did not attain completionwere issued a certificate of participation.
At the time of writing, the course had amassed over 12,000 registrations, 42% from emergingcountries, and an estimated 1,600 from Africa. In addition, two startups have been launchedby participants in the refugee camps, with financial aid and coaching support from OUWA.
4No ECTS credits were given, however.

4.3 Case Study: Launching New Ventures 47
Figure 22: Participants in a refugee camp in Ghana following the MOOC "Launching New Ventures". Theparticipants were given smartphones where they could watch the video lectures, and expected to pitch a ventureproposal in front of a camera at the end of the course.


5. Targeting Professionals
«The illiterate of the 21st century will not be those who cannot read andwrite, but those who cannot learn, unlearn, and relearn.» – Alvin Toffler
A SURPRISING REALIZATION we had, the moment demographics data started flowingfrom Coursera and EdX into our servers, is that an overwhelming percentage of our
MOOC users are not students in the traditional sense—they are not enrolled in any educationalprogram. They are, in fact, either employed by a company or working as self-employedprofessionals.
Upon further investigation, we discovered that many of these professionals are employed bysome of the biggest and most profitable companies in the world, with annual revenues onthe order of 1 billion USD. They also have a higher passing rate compared to the rest of thepopulation, as we shall see.
The immediate consequence of this realization, from a strategic point of view, is that wecannot separate our target audience only into EPFL and non-EPFL students. Instead, we needto consider an additional third group of non-student professionals which forms an important(and potentially more profitable) part of the MOOC user population.
On many fronts, this third group requires a completely different approach from the firsttwo. While students can benefit from courses that focus on academic material, such as basicsciences and engineering, that help them pass their classes, the employed professionals aremore interested in courses that can provide them with concrete skills that will help them solvespecific problems at work, get a promotion or raise, or find a new job entirely (see Figure 10).
Furthermore, the way we reach these two populations and promote our new courses to them isalso different, requiring the use of different marketing channels—particularly, social mediachannels. For instance, a recent study1 on the demographics of social networks shows that32% of American teenagers consider Instagram their most important social tool. In contrast,
1"Social Media Update 2014", M. Duggan et al, Pew Research Center, Jan 9, 2015.
50 Chapter 5. Targeting Professionals
LinkedIn is used by 44% of American adults with income of 75,000 USD or more.
The importance of offering continuing education to professionals, coupled with the appealof our MOOCs to this group of users, has motivated the creation of an EPFL ExtensionSchool—a partially online school that will bring together all extra-curricular courses andMOOCs offered by EPFL into a single program.
The EPFL Extension School will bring our continuing education program to a whole newlevel. It will trigger a breadth of new innovations, both in teaching methods and technology,as well as in our marketing and branding efforts. It will amplify our visibility world-wide,exposing us to new markets that were never reached before. It will bring about importantsources of revenue, not only from Switzerland but from other countries that will access ourMOOCs en masse. All these developments will inevitably accelerate our transition into thedigital world.
5.1 MOOCs in the Corporate World
When we talk about monetizing the EPFL MOOCs program, we think primarily of thecorporate world. There is a large population of professionals who are yearning for newtraining opportunities—something that can help them solve specific problems for which theylack the skills, or that can help them earn more money or achieve a higher status in theircompany.
Fortunately, our MOOCs have proved appealing to this group of users. In a survey completedby 62,908 of our MOOC users, only 25% reported to be full-time students, and 9% part-timestudents. The remaining 66% said they are currently not enrolled in any educational program.Among those who are non-students, 89% are fully or partially employed, which means thatan estimated 59% of our entire MOOC user-base (about 690,000 people) are, in effect,employed professionals.
In addition, our users are highly educated: the survey shows that 72% have either a Bachelor’s,Master’s, or Doctorate degree (see Figure 17). While it remains one of our ambitions to attractyoung and unprivileged people to our MOOCs, we cannot ignore the needs of such a highpercentage of users who are educated professionals. Therefore, the purpose of this sectionis to analyze this important section of our user-base, by characterizing the companies theywork for, and evaluating their performance in our MOOCs as compared to other parts of thepopulation.
In the following analysis, we use a population of 2,286 professionals from 206 companiesand organizations. We selected only companies (or organizations) where at least 5 employeesregistered for an EPFL MOOC. The results are presented next.
Company profiles
In the corporate world, the most popular MOOCs taken by employees were the following:

5.1 MOOCs in the Corporate World 51
1. "Functional Programming Principles in Scala", used in 86% of the companies;2. "Digital Signal Processing", used in 11% of the companies;3. Other programming courses, such as "Introduction to C++", "Introduction to Java", and
"Linear and Discrete Optimisation", used in 11% of the companies.
Non-governmental organizations (NGOs) have also used our MOOCs. Some of the courseswe created with an African audience in mind—such as "African Cities", "Water Treatment",and "Sanitation Systems"—were particularly popular, and used by at least 3 NGOs and otherinstitutions in the areas of construction and sanitation.
47%
12%
6%
6%
5%4%
4%
16%
Location of Companies taking our MOOCs
United StatesUnited KingdomGermanyNetherlandsIndiaFranceSwitzerlandOthers
Figure 23: Headquarters’ location of the companieswhere at least 5 of its employees signed up for anEPFL MOOC.
In terms of location, the companies we iden-tified are mostly based in Western countries(see Figure 23). Nearly half have their head-quarters in the United States, with the otherhalf in Europe and other countries. Switzer-land is relatively well represented, with 4% ofall the companies.
The profile of these companies covers a widespectrum, both in terms of sheer size andarea of activity. As Figure 24 shows, com-panies where employees take our MOOCs aremedium to large in size, peaking at 1-10 bil-lion USD in annual revenue.
However, there is no correlation between thenumber of employees in a company and the number registrations (the correlation coefficientwas 0.12), which suggests that most of these registrations are spontaneous, rather than theresult of company policy.
0%
5%
10%
15%
20%
25%
30%
< 1 million 1-10million
10-50million
50-100million
100-500million
500-1000million
1-10billion
10-50billion
50-100billion
100-500billion
Annual Revenue (USD)
Percentage of Companies
Figure 24: Annual revenue distribution of companies where at least 5 of its employees signedup for a particular EPFL MOOC.

52 Chapter 5. Targeting Professionals
1%10%
1%2%
1%1%1%
3%2%
17%4%
8%5%
1%3%
1%2%
19%8%
3%5%
Aerospace & DefenceBanking & Finance
Structures & ArchitectureConsulting
Data AnalyticsEducation
Food & AgricultureHardware
Health CareIT Services
Marketing & AdvertisingMedia & Publishing
Non-Profit OrganisationsResearch & Development
Retail & E-CommerceSanitation & Urbanism
SemiconductorsSoftware & InternetTelecommunications
Various AgenciesOther
Percentage of CompaniesArea of Activity
Figure 25: Area of activity of companies taking ourMOOCs.
The area of activity of the companies we iden-tified (see Figure 25) is as diverse as their sizeand annual revenue. It ranges from technologycompanies to non-profit organizations.
The main industries where our MOOCs havebeen the most popular are Software, Internet,and Information Technology (IT) services, es-pecially due to our Scala, C++, and Java pro-gramming courses.
Banking and Finance are also prominent inthe list of industries, not only due to our pro-gramming courses, but also due to our courseon Digital Signal Processing (DSP), which isa critical tool in the analysis of markets andthe science of wealth management that banksand hedge funds have specialized in.
Other industries of interest include Telecom-munications (such as network providers andequipment manufacturers), Hardware andSemiconductors, and Media and Publishing.
Performance of company users
Professionals who are currently employees in a company are not only using our MOOCs inlarge numbers, but also performing better than others. This is demonstrated by the chart inFigure 26.
19% 6% 48% 26%0%
10%
20%
30%
40%
50%
CompanyUsers
Other Users ActiveCompanyUsers
Other ActiveUsers
Percentage of Users Passed Failed
Figure 26: MOOC completion rate among companyemployees compared to other users, and compared toother levels of engagement.
With no constraints on their engagement, com-pany users are nearly 3 times more likely topass the course than other users (19% vs 6%).If we consider only the population of activeusers (who solved at least 1 assignment) thoseworking for a company are nearly twice aslikely to pass the course than others (48% vs26%).
In other words, we are discussing a groupof users who have a near 50% passing ratewhen they are minimally engaged. Such ahigh performance does not necessarily meanthat company users are fundamentally moreengaged than others; it only means that they are potentially more motivated to obtain astatement of accomplishment, which can be included in their CVs or posted on their LinkedIn

5.2 Targeted Advertising 53
profiles.
As we have seen in Section 3.1, many users are motivated by results that are directly relatedto their jobs. These results include getting a promotion, earning a higher salary, solving aspecific problem, or finding a new job entirely. On some level, any of these ambitions has ahigher chance of being realized if the user completes the course. Thus, if we want to reachmore of these users, we ought to touch on these ambitions and propose MOOCs that can helpthem achieve their specific professional goals.
5.2 Targeted Advertising
One way of reaching more professionals to whom we can sell our MOOCs is through the useof targeted advertising. This is a type of advertising that is directed towards a specific nicheaudience, with specific interests that can be identified and used to isolate them from the restof the world. Once we identify those interests, we can communicate in a language that speaksdirectly to them.
There are many strategies and technologies we can use for targeted advertising, some moremodern than others. With the advent of the Internet, digital marketing has become one of themost important tools for advertising in the modern world.
Yet, we should not forget that, on a fundamental level, and regardless of which marketingchannel we use, we are dealing with human psychology. The deeper motivations of our users,such as the need for achievement, status, and appreciation, do not change over time. Only theplatforms where users spend their time change.
In 2016, it is reasonable to say that social networks are almost synonymous with "time spenton the Internet". More than 1.59 billion people spend an average of 20-40 min a day onFacebook. If we count all 5 social networks that people use on average, they spend 1h40minevery day browsing these networks2 (accounting for 28% of the total time spent online). Thatis a considerably large time-window we can use to advertise our MOOCs.
The challenge with social media marketing (SMM) is that the marketing channels are net-worked, rather than hierarchical like traditional marketing channels (such as billboards andtelevision). This means that, in order to reach a potential lead, one has to cross througha network of intermediary people—typically their friends—who we depend on to pass themessage.
But this is also an opportunity. Many SMM platforms provide paid tools that allow us tobypass the network and advertise directly to a very narrow target audience, based on specificdemographics and interests. As an experiment, we used one of these tools—the FacebookSMM platform—to promote the launch of our course "Management of Protected Areas inAfrica", by Dr. Geoffroy Mauvais.
The campaign was a success, resulting is an estimated 30% conversion rate among African
2"Quarterly report on the latest trends in social networking", GlobalWebIndex Social, Q3 2015.

54 Chapter 5. Targeting Professionals
15,000
17,500
20,000
22,500
25,000
0
50
100
150
200
Sep11
Sep13
Sep15
Sep17
Sep19
Sep21
Sep23
Sep25
Sep27
Sep29
Oct01
Oct03
Oct05
Oct07
Oct09
Oct11
Oct13
Oct15
Oct17
Oct19
Oct21
Oct23
Oct25
Oct27
Oct29
Oct31
Nov0
2No
v04
Nov0
6No
v08
Nov1
0No
v12
Nov1
4No
v16
Nov1
8No
v20
Nov2
2No
v24
Nov2
6No
v28
Nov3
0De
c02
Dec0
4De
c06
Number of Registrations ■ Daily Registrations on Coursera ■ Daily Ad Reach on Facebook Reach
Advertised on Radio
0%
5%
10%
15%
20%
Cameroon
France
Senegal
D.R.
Congo
Madagascar
Burkina
Faso
Coted'Ivoire
Benin
Togo
Rwanda
Gabon
Belgium
Guine
a
Haiti
Canada
Niger
Mali
Percentage of Registrations / Clicks ■ Total Registrations on Coursera ■ Total Ad Clicks on Facebook
Date (Month & Day)
Country of Origin
Figure 27: Effects of Facebook advertising on MOOC registrations. Top. Number of Facebook users to whomthe ad was displayed every day (daily reach) compared to the number of daily registrations on Coursera. Bottom.Percentage distribution among different countries of the Facebook ad clicks and the Coursera MOOC registrations.
Facebook users, where 1 out of 3 people we reached registered for the course3. This helpedboost the number of registrations from 907 to 3,097, by attracting 1,000 additional users whowould not have otherwise learned about the existence of the course.
The effects of our Facebook advertising campaign are illustrated in Figure 27. The graph ontop suggests that there is a high correlation between the daily reach of our "ad" on Facebookand the number of MOOC registrations on the Coursera website; whenever one peaks, theother peaks as well. The graph also shows an additional peak in registrations right after anannouncement made on the Swiss radio.
The graph at the bottom shows the correlation between the countries where the Facebookad was shown (and clicked) and the number of registrations on Coursera coming from thosecountries. As the graph suggests, there is a reasonable match.
Another piece of evidence that the Facebook campaign was successful is the result of a surveythat asked users the question "Where did you learn about our course?". The survey offeredseveral possibilities, such as the Coursera and EdX websites, search engines, and various socialnetworks. The results, shown in Figure 28, demonstrate that an unusually high percentage
3This estimation is based on indirect proof, by comparing the daily reach on Facebook for each country with thenumber of registrations in those countries, and by asking users directly (though a survey) how they learned about us.Direct proof would be possible only if we could track every person from the moment he/she clicked the ad, all theway to a MOOC registration—a functionality that neither Coursera nor EdX provide.
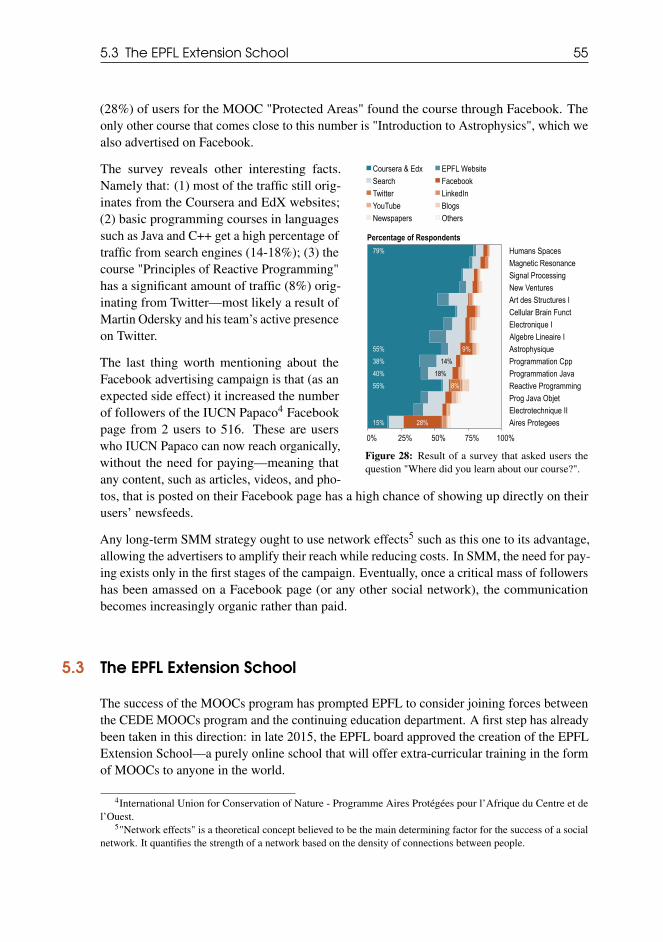
5.3 The EPFL Extension School 55
(28%) of users for the MOOC "Protected Areas" found the course through Facebook. Theonly other course that comes close to this number is "Introduction to Astrophysics", which wealso advertised on Facebook.
15%
55%
40%
38%
55%
79%
18%
14%
28%
9%
8%
0% 25% 50% 75% 100%
Aires ProtegeesElectrotechnique IIProg Java ObjetReactive ProgrammingProgrammation JavaProgrammation CppAstrophysiqueAlgebre Lineaire IElectronique ICellular Brain FunctArt des Structures INew VenturesSignal ProcessingMagnetic ResonanceHumans Spaces
Coursera & Edx EPFL WebsiteSearch FacebookTwitter LinkedInYouTube BlogsNewspapers Others
Percentage of Respondents
Figure 28: Result of a survey that asked users thequestion "Where did you learn about our course?".
The survey reveals other interesting facts.Namely that: (1) most of the traffic still orig-inates from the Coursera and EdX websites;(2) basic programming courses in languagessuch as Java and C++ get a high percentage oftraffic from search engines (14-18%); (3) thecourse "Principles of Reactive Programming"has a significant amount of traffic (8%) orig-inating from Twitter—most likely a result ofMartin Odersky and his team’s active presenceon Twitter.
The last thing worth mentioning about theFacebook advertising campaign is that (as anexpected side effect) it increased the numberof followers of the IUCN Papaco4 Facebookpage from 2 users to 516. These are userswho IUCN Papaco can now reach organically,without the need for paying—meaning thatany content, such as articles, videos, and pho-tos, that is posted on their Facebook page has a high chance of showing up directly on theirusers’ newsfeeds.
Any long-term SMM strategy ought to use network effects5 such as this one to its advantage,allowing the advertisers to amplify their reach while reducing costs. In SMM, the need for pay-ing exists only in the first stages of the campaign. Eventually, once a critical mass of followershas been amassed on a Facebook page (or any other social network), the communicationbecomes increasingly organic rather than paid.
5.3 The EPFL Extension School
The success of the MOOCs program has prompted EPFL to consider joining forces betweenthe CEDE MOOCs program and the continuing education department. A first step has alreadybeen taken in this direction: in late 2015, the EPFL board approved the creation of the EPFLExtension School—a purely online school that will offer extra-curricular training in the formof MOOCs to anyone in the world.
4International Union for Conservation of Nature - Programme Aires Protégées pour l’Afrique du Centre et del’Ouest.
5"Network effects" is a theoretical concept believed to be the main determining factor for the success of a socialnetwork. It quantifies the strength of a network based on the density of connections between people.
56 Chapter 5. Targeting Professionals
The Extension School will work in close collaboration with the CEDE, in an effort to producenew and profitable MOOCs, in addition to monetizing existing ones. These purely onlinecourses will most likely be offered in the form of specializations, each consisting of a smallcurriculum of 3 to 4 MOOCs. They will be hosted on partner platforms such as Coursera andEdX, as well as our own private platform, depending on the technical and legal needs of eachspecialization.
One of the specializations about to be launched is the one on Scala programming. It consists of4 MOOCs: (1) Functional Programming Principles in Scala, (2) Functional Program Designin Scala, (3) Parallel Programming, and (4) Big Data Analysis in Scala and Spark. Thesecourses are offered by the EPFL Scala Center—an EPFL-based foundation dedicated to thedevelopment of the Scala programming language—the language invented by EPFL professorMartin Odersky.
New developments on the EPFL Extension School and its future specializations will beannounced during 2016.

6. Latest Research
«In God we trust; all others must bring data.»– W. Edwards Deming
THE MASSIVE AMOUNTS of behavioral data collected by the MOOC platforms (and madeavailable to us) has boosted the development of learning analytics, a recent field that
brings learning sciences to the era of data sciences. In our database alone, we have 100 millionuser actions describing every single "mouse click" a user has made while following a MOOC,including video navigation, assignment submissions and forum browsing. Such massive data—which we store securely at EPFL—is changing the way we conduct educational research.
One of the EPFL goals is to take full advantage of MOOCs Big Data from a research standpoint,by sharing it1 with the various research groups at EPFL that conduct research on educationalBig Data—groups such as the Artificial Intelligence Lab, the Automated Reasoning andAnalysis Lab, the Audiovisual Communications Lab and the Computer-Human InteractionLab for Learning and Instruction (CHILI).
Research at the CHILI Lab concerns the behavior of MOOC students and the factors thataffect their success, such as how to select learning methods, how students succeed, whatmotivates them and what grabs their attention. Such knowledge is important for understandinghow people learn with MOOCs, but also for the practical use of instructors, who can judgethe quality of their teaching material by the way students navigate the videos or re-submitassignments. It can be used to improve the way we design MOOCs as well as to improve theplatform’s technology, by making it adaptive to each student’s learning style, and to buildrecommendation systems that can point students to other courses they may be interested in.
Thus, even though our research only touches the tip of the iceberg, it is potentially game-changing. In this section, we describe a few selected studies conducted by the CHILI Lab
1We only share data within EPFL, and the data is fully anonymous. The CEDE takes all the necessary steps toprotect any information that may reveal the identity of our users.
58 Chapter 6. Latest Research
in 2015. Such studies exemplify the types of conclusions we can reach from the analysis ofMOOC data.
6.1 Identifying Successful Activity Patterns
One of the difficulties we have in evaluating student performance in MOOCs is in defininggood metrics of engagement that account for the different motivations that lead students toshow different activity patterns, such as solving all assignments, only watching videos, oronly watching 1 video. Take, for example, a student who is able to master the entire coursematerial just by watching lectures. By definition, a zero means the user failed the course. Butcan we conclude that the user did not benefit from the MOOC, even though he or she masteredthe material? The creation of broadly-accepted engagement metrics that enable comparisonsacross MOOCs and across platforms is an important challenge for the MOOCs community.
One way to address this question is to consider time dynamics. Until recently, MOOCsfollowed a rather rigid weekly structure that probably explains the social richness of MOOClife: the message a learner reads in the forum has been posted by other students who also needto deliver their assignment in a couple of hours. One measure of engagement is hence theextent to which MOOC users follow its time structure, including the release time of videosand the assignment deadlines. This measure can be described as some kind of "procrastinationindex": the delay between the times when a resource (lecture, quiz or assignment) is madeavailable on the platform and the time the student actually accesses the resource, i.e, watchesa lecture video or submits an assignment. Not surprisingly, this index is predictive of success:the more the students procrastinate, the less likely they are to score passing grades at the endof the MOOC. The global MOOC time span (time difference between the first and last activityof a student) is also predictive of final score, but these results are influenced by the fact thatsome participants discover and join the MOOC later than the official starting date, whichis a rather difficult situation. In an on-going study, we analyzed in more detail when in theday/week MOOC users interact with the MOOC and how these time profiles differ from thosewho have a job and those who are students.
These results concern the balance between the freedom required for adapting MOOC activitiesto individual time constraints and the social benefits of a shared time structure. The currentevolution of MOOCs consists of exploring new time structures that optimize this balance, suchas on-demand MOOCs (always open) and multiple cohorts (one session starts on a regularbasis).
Reference: Pending publication.
6.2 Predicting Success from Programming Assignments Strategies
Generally speaking, assessments play a key role in defining success in MOOCs. In the case ofprogramming courses, assessments become even more important, as they constitute the primeway to provide feedback to learners. In a preliminary analysis for 120,000 programming

6.3 Regulating Students’ Gaze 59
assessments, we observed that the main disengaging factor for the active students (who submitat least one assignment) is failure in these programming assignments.
One specificity of programming courses is that the use of automatic graders allow MOOCusers to submit their code several times for the same assignment. In some MOOCs, themaximum number of submissions is limited; in other MOOCs, it is not. It is hence interestingto discriminate different strategies used by learners for fulfilling their assignments. Weidentified 3 major problem-solving strategies: "one-timers", "thinkers" and "trial-and-error"."One-timers" submit the assignment only once, and accept the first grade they get. "Thinkers"re-submit their assignments more than once, but they do so moderately. "Trial-and-error" is astrategy where students re-submit an assignment multiple times with small changes, until theyget the grade they want.
Do some strategies lead some to quit after a failure while others lead to a better score? Notsurprisingly, students who followed a trial-and-error strategy had a higher score, since theirscore should improve every time they submit a corrected version of their code. Conversely theone-timers who failed their single attempt tended to quit the MOOC. This is actually also thecase for both thinkers and trial-and-errors after their second trial. In other words, failing anassignment seems to be a huge blow to the motivation of students, causing them to drop-outin many cases. Letting learners upload their solution multiple times is hence rather positive,especially if the code is complex enough to discourage random variations that lead to success.
Reference: "Towards Predicting Success in MOOCs: Programming Assignments", KshitijSharma, Łukasz Kidzinski, Patrick Jermann, Pierre Dillenbourg, Proceedings of the EuropeanMOOC Stakeholder Summit, 2016.
6.3 Regulating Students’ Gaze
In last year’s report, we discussed the advantages of using the instructor’s own gaze as a pointeron the lecture slides. Our research has shown that doing so improves the students’ videonavigation patters. They pause the video less frequently, and tend to navigate forward morefrequently than backwards. This year, we tried to evaluate if there was actual improvementin their learning gain if we redirect their gaze whenever the student loses focus on what theteacher is talking about.
To do so, we recruited 27 Bachelor students from EPFL and equipped them with eye trackingdevices. The students were shown 2 video lectures on the subject of "resting membranepotentials", at the end of which they were given a test to evaluate their knowledge. In thecourse of each lecture, the instructor’s gaze was displayed in the video whenever the studentswere not paying attention—judged by the students’ own gaze. The process is illustrated inFigure 29.
The results of this study included the following. By redirecting their focus:
- students significantly increased their attention, and the extent to which they followedthe teacher;

60 Chapter 6. Latest Research
Figure 29: Example of the feedback used in the experiment. The circumscribing red rectangles were shown if theattention of the participant went below the baseline (estimated by the average attention of other students) at any giveninstant in the video.
- students significantly increased their learning gain, consequently scoring higher on thepost-test.
The results showed a significant learning gain when redirecting the attention of students witha feedback system. Such a system, however, requires measuring the gaze of the students inreal-time, while they are watching the videos. At the CHILI lab, we have ongoing projectstrying to do this using a standard computer webcam.
Reference: "A Gaze-based Learning Analytics Model: In-Video Visual Feedback to ImproveLearner’s Attention in MOOCs", Kshitij Sharma, Hamed Alavi, Patrick Jermann, and PierreDillenbourg, 6th international conference on learning analytics and knowledge.
6.4 Ongoing Research Projects
Simulation of MOOC users
Analytics from MOOCs are often considered Big Data, since we collect behaviors fromthousands of students. However, after filtering students relevant to the context of a specificstudy, sample sizes may not be sufficient for detecting some of the effects we are seeking.Estimating the required sample size is a key factor of experimental design.
To explore this problem, we generated cohorts of (highly simplified) simulated students andused a Monte Carlo simulation. We modeled students’ actions with several Semi-Markovchains and we implemented an expectation-maximization algorithm to fit the model. Runningthese models with sets of simulated students allowed us to determine the distributions ofMOOC features for various sample sizes.
This approach differs from the learning analytics method that mostly focuses on recorded data,

6.4 Ongoing Research Projects 61
while the modelling effort described here aims to simulate students even before a MOOCstarts. If we succeed at improving the validity of our model, we could predict some features ofa course, such as the success rate or the evolution of the number of assignment submissions.
Reference: "Semi-Markov model for simulating MOOC students", Louis Faucon, ŁukaszKidzinski, Pierre Dillenbourg, submitted.
Forum analysis
One of the main differences between MOOCs and previous forms of e-Learning is the intensityof social interactions in MOOCs. The analysis of forum posts is the main source of informationon social interactions among users. Yet, this analysis requires laborious and costly periodsof manual coding or classification, for instance to decide if a post is a question, an answer,feedback, etc.
Methods from natural language processing allow us to extract information from the forum inorder to classify the posts accurately and to estimate the relevance of the posts with regardto the topic of the MOOC. The potential benefits of this classifier are twofold. For MOOCpractice, we will be able to support teaching assistants by detecting threads that require theirintervention (e.g. because the average level of relevance is too low). For MOOC research,the automatic classification allows us to apply content analysis to large data sets within areasonable amount of time. For instance, we found that students who answer questions on theforum perform better than those who ask them.
Reference: "Semiautomatic Annotation of MOOC Forum Posts", Weizhe Liu, Łukasz Kidzinski,Pierre Dillenbourg, State-of-the-Art and Future Directions of Smart Learning
Learning styles
Educational research has identified so-called "aptitude-treatment interaction laws", whichpredict the fact that a specific method will be more effective with learners that correspondto some profiles. Conversely, learning analytics establish a posteriori that a method hasbeen more effective for some learner categories. Can we integrate these two sources ofinformation to create the best pedagogical decision: the a-priori probabilities inferred fromMOOC-independent laws can be progressively updated with a-posteriori analytics, using aBayesian framework.
A Swiss NSF grant has been awarded to answer this question and will start in summer 2016.In the meanwhile, a Master’s student, Farah Bouassida, ran a short pilot study with LukaszKidzinski. They built a small learning platform in which they identified two student profiles(introvert vs extrovert) and provided two learning activities (video vs texts). Their systemdetected that extrovert students obtained higher learning gains when they were given videomaterials, whereas introvert students were performing better when given text.
62 Chapter 6. Latest Research
The effects of gamification
Gamification refers to the use of game mechanisms (lives, badges, scores, etc.) in a non-gaming environment. We collaborate with a MOOC-providing company, CoorpAcademy,located in EPFL Innovation Park, to understand the effects of gamification. We studied agamification feature available on their platform, called "Battle Mode", when two learnersasynchronously compete on a set of quizzes related to a specific learning module.
We analyzed the anonymized data from different MOOCs developed for four companies byCoorpAcademy, which represents a total of more than 20,000 learners. We found that thebattle feature was adopted by up to 37% of learners and up to 83% of battle invitations wereaccepted. We also found that battle players covered up to 14% of the modules and battledagainst an average of 4.5 peers in some companies. Globally, engagement was higher amongbattle players as compared to non-players, but we do not know which of these two featuresis the cause of the other. In any case, they illustrate that some gamification mechanism mayenhance social interaction on MOOC platforms.
Reference: "Gamified Competition Features for Corporate MOOCs: The Battle Mode",Jessica Dehler-Zufferey, Hamed Alavi, Łukasz Kidzinski, Pierre Dillenbourg, eMOOCs 2016.

7. Closing Remarks
Another year has gone by and EPFL’s commitment to Digital Education remains unshaken.Three and a half years after the beginning of our MOOCs initiative, we have produced 48MOOCs and attracted over 1 million registrations from all over the world. Although severalEuropean universities have produced MOOCs, only few have integrated these as a core partof their educational strategy (as we have).
The engagement of EPFL combines global trust with fragmented uncertainty. The trust refersto the belief that MOOCs will change the European academic landscape. Who could predictthat EPFL courses would be taken all over the world? MOOCs are more than a variation ofe-Learning; they are game-changers.
Now, building on this kernel of confidence, we have numerous points of uncertainty. We arepushing MOOCs forward not because we know whether or not they will work, but becausewe want to discover the possibilities. Is it not the role of universities to explore unknownterritories?
EPFL MOOCs target 3 major audiences: (1) on-campus students, (2) worldwide professionals,and (3) French-speaking African universities. The year 2015 provided us with experienceswith each audience.
For the first audience, we have seen that the impact of MOOCs depends on two variables: therole that the teacher allocates to a MOOC in his or her own course, and the students’ level ofengagement. For the second audience, worldwide professionals, this report examined theirprofile and sought to clarify the market opportunities. For the third audience, 2015 has seennew developments, especially the fact that partners from Africa recorded MOOCs segmentsat EPFL.
New audiences and markets have emerged in 2015, such as the desire to include MOOCs inthe long term relationship with EPFL alumni, the production of MOOCs and other servicesfor external companies and institutions.

64 Chapter 7. Closing Remarks
The EPFL MOOCs strategy is constantly adapted based on what we learn from the data. Earlyon, we found that the worldwide use of MOOCs actually constitutes continuing education.We are therefore launching the EPFL Extension School.
In 2015, it has become clear that a bottom-up approach is not sufficient. Most EPFL MOOCshave been proposed by professors driven by personal motivations. This allowed us to startrapidly and learn a lot. Now, the set of 48 MOOCs that we have produced does not constitutea consistent whole; our MOOCs are scattered across most EPFL curricula.
A major evolution in 2015 has been to promote a sequence of 4-5 MOOCs on the sametopic—so-called "specializations", "tracks" or "nano-degrees". This ambition requires moretop-down coordination.
We have launched two specializations: one on protected areas in Africa, and one on Africancities. We will soon launch the specialization in Scala programing as well. Other special-izations in the pipe include: quantitative finance, embedded systems, water in developingcountries, and brain simulation.
For our own students, the EPFL doctoral school has decided that Ph.D. students will beallowed to take MOOCs from other universities as part of the credits they have to acquire.The underlying assumption is that, since this will be done on an individual basis, the Ph.D.supervisor probably knows the MOOC teacher, and may therefore judge the relevance of theMOOC as well as the assessment format.
Our next step is to offer the same possibility at the Master’s level for a limited set of MOOCs,selected from top European institutions. The CEDE is collaborating with the best MOOCproducing universities in Europe to elaborate on the rules that will allow credits to be shared.This second top-down trend could lead to something equivalent to a virtual Erasmus, but atthe level of specific courses.
Prof. Pierre DillenbourgAcademic Director of CEDE

