monthly investor report - legislative - rbc
TRANSCRIPT

Programme InformationOutstanding Covered Bonds
Series Initial Principal Amount Translation Rate C$ Equivalent Final Maturity Date⁽¹⁾ Interest Basis Rate Type
CB7 CHF500,000,000 1.1149700 C$/CHF $557,485,000 2021/04/21 2.250% Fixed
CB21 €1,000,000,000 1.3870000 C$/€ $1,387,000,000 2022/06/17 0.875% Fixed
CB22 €279,500,000 1.4017000 C$/€ $391,775,150 2031/07/21 1.652% Fixed
CB27 €410,500,000 1.4524599 C$/€ $596,234,800 2034/12/15 1.616% Fixed
CB28 €100,000,000 1.5370000 C$/€ $153,700,000 2036/01/14 1.625% Fixed
CB33 £100,000,000 1.7199000 C$/£ $171,990,000 2021/09/14 3 month £ ICE LIBOR +0.400% Floating
CB34 £500,000,000 1.6401000 C$/£ $820,050,000 2021/12/22 1.125% Fixed
CB35 £650,000,000 1.7114000 C$/£ $1,112,410,000 2022/12/08 3 month £ LIBOR +0.230% Floating
CB36 £750,000,000 1.7220000 C$/£ $1,291,500,000 2021/06/08 3 month £ LIBOR +0.270% Floating
CB37 €1,500,000,000 1.5417000 C$/€ $2,312,550,000 2023/06/28 0.250% Fixed
CB38 €1,500,000,000 1.5148000 C$/€ $2,272,200,000 2025/09/10 0.625% Fixed
CB39 USD$1,700,000,000 1.2990000 C$/US$ $2,208,300,000 2021/10/22 3.350% Fixed
CB40 €1,750,000,000 1.5160000 C$/€ $2,653,000,000 2024/01/29 0.250% Fixed
CB41 €100,000,000 1.5110000 C$/€ $151,100,000 2039/03/14 1.384% Fixed
CB42 €1,250,000,000 1.5040000 C$/€ $1,880,000,000 2026/06/19 0.050% Fixed
CB43 $1,250,000,000 N/A $1,250,000,000 2022/06/27 3 month BA +0.140% Floating
CB44 USD$1,500,000,000 1.3244000 C$/US$ $1,986,600,000 2022/09/23 1.900% Fixed
CB45 £1,000,000,000 1.6354000 C$/£ $1,635,400,000 2024/10/03 SONIA +0.580% Floating
CB46 €150,000,000 1.4687000 C$/€ $220,305,000 2039/12/30 0.652% Fixed
CB47 €1,500,000,000 1.4505000 C$/€ $2,175,750,000 2027/01/21 0.010% Fixed
CB48 €120,000,000 1.4529000 C$/€ $174,348,000 2040/01/24 0.667% Fixed
CB49 £1,250,000,000 1.7234000 C$/£ $2,154,250,000 2025/01/30 SONIA +0.470% Floating
CB50 €1,000,000,000 1.5600000 C$/€ $1,560,000,000 2025/03/25 0.125% Fixed
CB51⁽²⁾ $2,500,000,000 N/A $2,500,000,000 2021/04/24 3 month BA +0.100% Floating
CB52 CHF200,000,000 1.4557000 C$/CHF $291,140,000 2027/04/06 0.155% Fixed
CB53⁽²⁾ $5,000,000,000 N/A $5,000,000,000 2021/09/27 3 month BA +0.200% Floating
CB54⁽²⁾ $5,000,000,000 N/A $5,000,000,000 2022/09/27 3 month BA +0.450% Floating
CB55⁽²⁾ $5,000,000,000 N/A $5,000,000,000 2023/03/27 3 month BA +0.500% Floating
CB56⁽²⁾ $5,000,000,000 N/A $5,000,000,000 2023/09/27 3 month BA +0.600% Floating
CB57 AUD$2,250,000,000 0.8909700 C$/AU$ $2,004,682,500 2023/04/24 3 month AUD BBSW +1.000% Floating
CB58⁽²⁾ $5,000,000,000 N/A $5,000,000,000 2023/12/01 3 month BA +0.450% Floating
CB59⁽²⁾ $5,000,000,000 N/A $5,000,000,000 2024/03/01 3 month BA +0.450% Floating
CB60 €1,250,000,000 1.5467000 C$/€ $1,933,375,000 2031/01/27 0.010% FixedTotal $65,845,145,450
OFSI Covered Bond Ratio: ⁽³⁾⁽⁴⁾ 2.15% OFSI Covered Bond Ratio Limit: ⁽³⁾ 5.50%
OFSI Covered Bond Ratio: ⁽³⁾ 4.24% OFSI Temporary Covered Bond Ratio Limit:⁽³⁾ 10.00%
Series Ratings Moody's DBRS Fitch
CB7 Aaa AAA AAA
CB21 Aaa AAA AAA
CB22 Aaa AAA AAA
CB27 Aaa AAA AAA
CB28 Aaa AAA AAA
CB33 Aaa AAA AAA
CB34 Aaa AAA AAA
CB35 Aaa AAA AAA
CB36 Aaa AAA AAA
CB37 Aaa AAA AAA
CB38 Aaa AAA AAA
CB39 Aaa AAA AAA
CB40 Aaa AAA AAA
CB41 Aaa AAA AAA
CB42 Aaa AAA AAA
Weighted average maturity of Outstanding Covered Bonds (months)
Weighted average remaining term of Loans in Cover Pool (months)
35.26 28.65
RBC Covered Bond Programme Monthly Investor Report - March 31, 2021 Page 1 of 22
RBC Covered Bond Programme Monthly Investor Report Calculation Date: 3/31/2021
This report contains information regarding assets pledged as security (the Cover Pool) in respect of the obligations under the Covered Bonds issued under RBC’s Global Covered Bond Programme as of the indicated Calculation Date. In this report, credit bureau scores refer to FICO® Scores obtained from TransUnion, based on the latest available information as at the cut-off date of the report and generally calculated in the same calendar quarter as this report. The composition of the Cover Pool will change as Loans are added and removed from the Cover Pool from time to time and, accordingly, the characteristics and performance of the Loans in the Cover Pool will vary over time. Certain of the information set forth in this report, including credit bureau scores, current ratings and “The Teranet-National Bank House Price Index™” Methodology has been obtained from and is based upon sources believed by RBC and the Guarantor LP to be accurate, however, neither RBC nor the Guarantor LP makes any representation or warranty, express or implied, in relation to the accuracy, completeness or reliability of such information or assumes any liability for any errors or any reliance you place on such information. Past performance should not be taken as an indication or guarantee of future performance, and no representation or warranty, express or implied, is made regarding future performance. The information contained in this report does not constitute an invitation or recommendation to invest or otherwise deal in, or an offer to sell or the solicitation of an offer to buy or subscribe for, any security, which will be made only by a prospectus or otherwise in accordance with applicable securities laws. Reliance should not be placed on the information herein when making any decision to buy, hold or sell any security or for any other purpose.THESE COVERED BONDS HAVE NOT BEEN APPROVED OR DISAPPROVED BY CANADA MORTGAGE HOUSING CORPORATION (CMHC) NOR HAS CMHC PASSED UPON THE ACCURACY OR ADEQUACY OF THIS REPORT. THE COVERED BONDS ARE NOT INSURED OR GUARANTEED BY CMHC OR THE GOVERNMENT OF CANADA OR ANY OTHER AGENCY THEREOF.The Cover Pool is owned by RBC Covered Bond Guarantor Limited Partnership (Guarantor LP), which has no liabilities or claims outstanding against it other than those relating to the RBC Covered Bond Programme. Please click on the link below for additional information about the RBC Covered Bond Programme and the information contained herein. For the meaning of capitalized terms used and not otherwise defined in this report, click the following link and go to the Glossary tab in the Monthly Investor Report section: http://www.rbc.com/investorrelations/fixed_income/covered-bonds-terms.html In this report, currency amounts are stated in Canadian dollars ("$"), unless otherwise specified.

CB43 Aaa AAA AAA
CB44 Aaa AAA AAA
CB45 Aaa AAA AAA
CB46 Aaa AAA AAA
CB47 Aaa AAA AAA
CB48 Aaa AAA AAA
CB49 Aaa AAA AAA
CB50 Aaa AAA AAA
CB51 Aaa AAA AAA
CB52 Aaa AAA AAA
CB53 Aaa AAA AAA
CB54 Aaa AAA AAA
CB55 Aaa AAA AAA
CB56 Aaa AAA AAA
CB57 Aaa AAA AAA
CB58 Aaa AAA AAA
CB59 Aaa AAA AAA
CB60 Aaa AAA AAA
⁽¹⁾ An Extended Due for Payment Date twelve-months after the Final Maturity Date has been specified in the Final Terms of each Series. The Interest Basis specified in this report in respect of each Series applies until the Final Maturity Date for the relevant Series following which the floating rate of interest specified in the Final Terms of each Series is payable monthly in arrears from the Final Maturity Date to but excluding the Extended Due for Payment Date.
⁽²⁾ Issued for purpose of accessing Bank of Canada facilities.
⁽³⁾ Per OSFI’s letter dated March 27, 2020, OSFI has provided temporary relief to allow Canadian federal deposit taking institutions to pledge covered bonds as collateral to the Bank of Canada by providing that assets pledged for covered bonds relative to total on-balance sheet assets not exceed 10.00% including instruments issued to the market and those pledged to Bank of Canada; provided that the maximum amount of pool assets relating to market instruments remains limited to 5.50%.
⁽⁴⁾Does not include assets pledged for covered bonds issued for the purpose of accessing Bank of Canada facilities.
RBC Covered Bond Programme Monthly Investor Report - March 31, 2021 Page 2 of 22
RBC Covered Bond Programme Monthly Investor Report Calculation Date: 3/31/2021

Supplementary Information
Parties to RBC Global Covered Bond Programme
Issuer Royal Bank of CanadaGuarantor entity RBC Covered Bond Guarantor Limited PartnershipServicer & Cash Manager Royal Bank of CanadaSwap Providers Royal Bank of CanadaCovered Bond Trustee & Custodian Computershare Trust Company of CanadaAsset Monitor PricewaterhouseCoopers LLPAccount Bank & GDA Provider Royal Bank of CanadaStandby Account Bank & GDA Provider Bank of MontrealPaying Agent ⁽¹⁾ The Bank of New York Mellon⁽¹⁾The Paying Agent in respect of Series CB7 is Credit Suisse AG. The Paying Agent in respect of Series CB51, CB53 to CB56, CB58 and CB59 is Royal Bank of Canada. The Paying Agent in respect of CB52 is UBS AG.
Royal Bank of Canada's RatingsMoody's DBRS Fitch
Senior Debt⁽¹⁾ / Long-Term Issuer Default Rating (Fitch) Aa2 AA (high) AA+/AAShort-Term Debt / Short-Term Issuer Default Rating (Fitch) P-1 R-1 (high) F1+Deposit Rating ("dr") (Short-Term/Long-Term) P-1 (dr) / Aa2 (dr) n/a / AA (high)(dr) F1+/AA+Counterparty Risk Assessment (Short-Term/Long-Term) P-1 (cr) / Aa2 (cr) n/a n/aDerivative Counterparty Rating (Short-Term/Long-Term) n/a n/a AA+(dcr)Rating Outlook Stable Stable Negative
Applicable Ratings of Standby Account Bank & Standby GDA ProviderMoody's DBRS Fitch
Senior Debt⁽²⁾ / Long-Term Issuer Default Rating (Fitch) Aa2 AA AA/AA-
Short-Term Debt / Short-Term Issuer Default Rating (Fitch) P-1 R-1 (high) F1+Deposit Rating (Short-Term/Long-Term) P-1 (dr) / Aa2 (dr) n/a / AA (dr) F1+ / AA
Description of Ratings Triggers⁽³⁾⁽⁴⁾
A. Party ReplacementIf the rating(s) of the Party falls below the level stipulated below, such party is required to be replaced or in the case of the Swap Providers (i) transfer credit support and (ii) replace itself or obtain a guarantee for its obligations.
Role (Current Party) Moody's DBRS Fitch
Account Bank/GDA Provider (RBC) P-1 (dr) & A2 (dr) R-1 (low) & A F1 & A-⁽⁵⁾Standby Account Bank/GDA Provider (BMO) P-1 (dr) & A2 (dr) R-1 (low) & A F1 & A-⁽⁵⁾Cash Manager (RBC) P-2 (cr) BBB (low) (long) F2 & BBB+⁽⁶⁾Servicer (RBC) Baa3 (cr) BBB (low) (long) F2 & BBB+⁽⁶⁾Interest Rate Swap Provider (RBC) P-2 (cr) & A3 (cr) R-2 (middle) & BBB F2 & BBB+⁽⁶⁾Covered Bond Swap Provider (RBC) P-2 (cr) & A3 (cr) R-2 (middle) & BBB F2 & BBB+⁽⁶⁾B. Specified Rating Related Action
i. The following actions are required if the rating of the Cash Manager (RBC) falls below the stipulated ratingMoody's DBRS Fitch
(a) Asset Monitor is required to verify the Cash Manager's calculations of the Asset Baa3 (cr) n/a BBB (long)⁽⁶⁾Coverage/Amortization test on each Calculation Date(b) Amounts received by the Cash Manager are required to be deposited directly into P-1 (dr) BBB (low) F1 & A-⁽⁵⁾the Transaction Account(c) Amounts received by the Servicer are to be deposited directly to the GIC P-1 (dr) BBB (low) F1 & A-⁽⁵⁾Account and not provided to the Cash Managerii. The following actions are required if the rating of the Servicer (RBC) falls below the stipulated rating
Moody's DBRS Fitcha) Servicer is required to hold amounts received in a separate account and transfer P-1 (dr) BBB (low) F1 & A-⁽⁵⁾them to the Cash Manager or GIC Account, as applicable, within 2 business daysiii. The following actions are required if the rating of the Issuer (RBC) falls below the stipulated rating
Moody's DBRS Fitch(a) Establishment of the Reserve Fund P-1(cr) R-1 (mid) & A (low) F1 & A-⁽⁵⁾iv. The following actions are required if the rating of the Issuer (RBC) falls below the stipulated rating
Moody's DBRS Fitch(a) Cash flows will be exchanged under the Covered Bond Swap Agreement (to the extent not already occurring) except as otherwise provided in the Covered Bond Baa1 (cr) BBB (high) (long) BBB+ (dcr)Swap Agreement v. Each Swap Provider is required to replace itself, transfer credit support or obtain a guarantee of its obligations if the rating of such Swap Provider falls below the specified rating
Moody's DBRS Fitch(a) Interest Rate Swap Provider P-1 (cr) & A2 (cr) R-1 (low) & A F1 & A-⁽⁶⁾(b) Covered Bond Swap Provider P-1 (cr) & A2 (cr) R-1 (low) & A F1 & A-⁽⁶⁾Events of Default & TriggersAsset Coverage Test (C$ Equivalent of Outstanding PassCovered Bonds < Adjusted Aggregate Asset Amount)Issuer Event of Default NoGuarantor LP Event of Default No
⁽¹⁾ Includes: (a) senior debt issued prior to September 23, 2018; and (b) senior debt issued on or after September 23, 2018 which is excluded from the bank recapitalization “bail-in” regime. Senior debt subject to conversion under the bail-in regime is rated A2 by Moody’s, AA by DBRS and AA by Fitch.⁽²⁾ Includes: (a) senior debt issued prior to September 23, 2018; and (b) senior debt issued on or after September 23, 2018 which is excluded from the bank recapitalization “bail-in” regime. Senior debt subject to conversion under the bail-in regime is rated A2 by Moody’s, AA (low) by DBRS and AA- by Fitch.
RBC Covered Bond Programme Monthly Investor Report - March 31, 2021 Page 3 of 22
RBC Covered Bond Programme Monthly Investor Report Calculation Date: 3/31/2021

⁽³⁾ Where one rating or assessment is expressed, unless otherwise specified, such rating or assessment is short-term. Where two ratings or assessments are expressed, the first is short-term and the second is long-term. Unless otherwise specified, ratings or assessments are in respect of Senior Debt (or the Long-Term Issuer Default Rating in the case of Fitch) and Short-Term Debt (or the Short-Term Issuer Default Rating in the case of Fitch). Where two ratings or assessments are listed in respect of a relevant action, the action is required to be taken where the rating or assessment of the relvevant party falls below both such ratings or assessments.⁽⁴⁾ The discretion of the Guarantor LP to waive a required action upon a Rating Trigger may be limited by the terms of the Transaction Documents.⁽⁵⁾ These ratings will be in respect of deposit ratings from Fitch following Fitch having assigned deposit ratings to the relevant party.⁽⁶⁾ These ratings will be in respect of Derivative Counterparty Ratings from Fitch and include the (dcr) reference following Fitch having assigned Derivative Counterparty Ratings to the relevant party.
RBC Covered Bond Programme Monthly Investor Report - March 31, 2021 Page 4 of 22
RBC Covered Bond Programme Monthly Investor Report Calculation Date: 3/31/2021

Asset Coverage Test
C$ Equivalent of Outstanding Covered Bonds $65,845,145,450
A = lower of (i) LTV Adjusted True Balance, and $88,054,495,523 A (i) $94,675,176,262(ii) Asset Percentage Adjusted True Balance, as adjusted A (ii) $88,054,495,523
B = Principal Receipts - Asset Percentage: 93.00%C = Cash Capital Contributions - Maximum Asset
Percentage:93.00%
D = Substitute Assets -E = Reserve Fund balance -F = Negative Carry Factor calculation $971,374,882
Adjusted Aggregate Asset Amount (Total: A + B + C + D + E - F)
$87,083,120,641
Regulatory OC Minimum Calculation
A Lesser of (a) Cover Pool Collateral, and $70,879,597,009 A(a) $94,638,826,248*(b) Cover Pool Collateral required to meet the Asset Coverage Test
A(b) $70,879,597,009
B (C$ Equivalent of Outstanding Covered Bonds) $65,845,145,450Level of Overcollateralization (A/B) 107.65%Regulatory OC Minimum 103.00%*Amount includes Voluntary Overcollateralization and does not include Accrued Interest, Arrears of Interest or any other amount which is due or accrued on the Loans amount which has not been paid or capitalized.
Valuation Calculation
Trading Value of Covered Bonds $66,860,096,549
A = LTV Adjusted Present Value $96,056,478,438 Weighted Average Effective Yield of Performing Eligible Loans:
1.89%
B = Principal Receipts -C = Cash Capital Contributions -D = Trading Value of Substitute Assets -E = Reserve Fund Balance -F = Trading Value of Swap Collateral -
Present Value Adjusted Aggregate Asset Amount(Total: A + B + C + D + E + F)
$96,056,478,438
Intercompany Loan Balance
Guarantee Loan $71,166,606,299Demand Loan $23,777,252,499
Total $94,943,858,797
Cover Pool Losses
Period End Write-off Amounts Loss Percentage (Annualized)
March 31, 2021 $679,154 0.01%
Cover Pool Flow of Funds
31-Mar-2021 26-Feb-2021Cash Inflows
- -- -
- -
- -
Principal ReceiptsProceeds for sale of LoansDraw on Intercompany LoanRevenue ReceiptsSwap receiptsCash Outflows
Swap paymentSwap Breakage FeeIntercompany Loan interest Intercompany Loan principal Purchase of LoansNet inflows/(outflows)
RBC Covered Bond Programme Monthly Investor Report - March 31, 2021 Page 5 of 22
RBC Covered Bond Programme Monthly Investor Report Calculation Date: 3/31/2021
(1) Includes Capitalized Interest on Loans. Amounts drawn by the Guarantor LP on the Intercompany Loan in respect of Capitalized Interest are included on a net basis in the Intercompany Loan principal.(2) Cash settlement to occur on April 19, 2021(3) Cash settlement occurred on March 17, 2021
$2,283,900,076 (1)
$251,867,611
$134,305,246 (2)
($251,867,611) (2)
($134,036,636) (2)
($2,283,900,076) (1)(2)
$268,610
$2,423,557,198 (1)
$223,059,744$124,764,865 (3)
($223,059,744) (3)
($124,515,335) (3)
($2,423,557,198) (1)(3)
$249,530

Cover Pool Summary Statistics
Previous Month Ending Balance $96,994,528,199Current Month Ending Balance $94,708,917,204Number of Mortgages in Pool 438,844Average Mortgage Size $215,815Ten Largest Mortgages as a % of Current Month Ending Balance 0.02%Number of Properties 377,821Number of Borrowers 355,239
Original⁽¹⁾ Indexed ⁽²⁾Weighted Average LTV - Authorized 68.77% 55.33%Weighted Average LTV - Drawn 60.60% 49.20%Weighted Average LTV - Original Authorized 71.22%Weighted Average Mortgage Rate 2.66%Weighted Average Seasoning (Months) 25.49Weighted Average Original Term (Months) 54.61Weighted Average Remaining Term (Months) 28.65
⁽¹⁾ Value as most recently determined or assessed in accordance with the underwriting policies (whether upon origination or renewal of the Eligible Loan or subsequently thereto).
⁽²⁾ Value as determined by adjusting, not less than quarterly, the Original Market Value for each Property subject to the Related Security in respect of a Loan utilizing the Housing Price Index Methodology for subsequent price developments. See Appendix under "Housing Price Index Methodology" for details.
Disclaimer: Due to rounding, numbers presented in the following distribution tables may not add up precisely to the totals provided and percentages may not precisely reflect the absolute figures.
Cover Pool Delinquency Distribution
Aging Summary Number of Loans Percentage Principal Balance Percentage
Current and less than 30 days past due 438,102 99.83 $94,544,268,124 99.8330 to 59 days past due 264 0.06 $61,912,314 0.0760 to 89 days past due 118 0.03 $32,645,809 0.0390 or more days past due 360 0.08 $70,090,956 0.07Total 438,844 100.00 $94,708,917,204 100.00
Cover Pool Provincial Distribution
Province Number of Loans Percentage Principal Balance Percentage
Alberta 48,884 11.14 $9,702,515,765 10.24British Columbia 79,443 18.10 $20,755,853,868 21.92Manitoba 16,139 3.68 $2,206,520,862 2.33New Brunswick 8,060 1.84 $771,489,448 0.81Newfoundland and Labrador 5,552 1.27 $784,149,960 0.83Northwest Territories 14 0.00 $1,090,143 0.00Nova Scotia 11,959 2.73 $1,405,978,746 1.48Nunavut 1 0.00 $36,614 0.00Ontario 192,037 43.76 $47,993,069,193 50.67Prince Edward Island 1,551 0.35 $179,066,610 0.19Quebec 61,942 14.11 $8,990,752,673 9.49Saskatchewan 13,183 3.00 $1,906,238,019 2.01Yukon 79 0.02 $12,155,304 0.01Total 438,844 100.00 $94,708,917,204 100.00
Cover Pool Credit Bureau Score Distribution
Credit Bureau Score Number of Loans Percentage Principal Balance Percentage
Score Unavailable 1,245 0.28 $188,804,871 0.20499 and below 403 0.09 $77,231,523 0.08500 - 539 837 0.19 $172,787,562 0.18540 - 559 713 0.16 $152,713,849 0.16560 - 579 983 0.22 $221,503,641 0.23580 - 599 1,409 0.32 $323,337,836 0.34600 - 619 2,338 0.53 $538,128,949 0.57620 - 639 4,060 0.93 $976,831,336 1.03640 - 659 6,302 1.44 $1,553,020,256 1.64660 - 679 9,987 2.28 $2,368,618,251 2.50680 - 699 14,436 3.29 $3,456,065,763 3.65700 - 719 19,363 4.41 $4,533,223,474 4.79720 - 739 23,066 5.26 $5,386,626,927 5.69740 - 759 25,779 5.87 $5,987,627,786 6.32760 - 779 29,525 6.73 $6,962,162,435 7.35780 - 799 34,950 7.96 $8,192,499,230 8.65800 and above 263,448 60.03 $53,617,733,514 56.61Total 438,844 100.00 $94,708,917,204 100.00
RBC Covered Bond Programme Monthly Investor Report - March 31, 2021 Page 6 of 22
RBC Covered Bond Programme Monthly Investor Report Calculation Date: 3/31/2021

Cover Pool Rate Type Distribution
Rate Type Number of Loans Percentage Principal Balance Percentage
Fixed 362,217 82.54 $75,871,572,838 80.11Variable 76,627 17.46 $18,837,344,366 19.89Total 438,844 100.00 $94,708,917,204 100.00
Mortgage Asset Type Distribution
Asset Type Number of Loans Percentage Principal Balance Percentage
Conventional Mortgage 109,888 25.04 $31,159,196,814 32.90Homeline Mortgage Segment 328,956 74.96 $63,549,720,389 67.10Total 438,844 100.00 $94,708,917,204 100.00
Cover Pool Occupancy Type Distribution
Occupancy Type Number of Loans Percentage Principal Balance Percentage
Owner Occupied 386,623 88.10 $82,675,329,872 87.29Non-Owner Occupied 52,221 11.90 $12,033,587,332 12.71Total 438,844 100.00 $94,708,917,204 100.00
Cover Pool Mortgage Rate Distribution
Mortgage Rate (%) Number of Loans Percentage Principal Balance Percentage
1.9999% and below 87,476 19.93 $20,415,192,297 21.562.0000% - 2.4999% 50,435 11.49 $11,087,035,486 11.712.5000% - 2.9999% 170,881 38.94 $37,854,999,162 39.973.0000% - 3.4999% 91,034 20.74 $18,871,378,040 19.933.5000% - 3.9999% 35,405 8.07 $6,029,991,959 6.374.0000% - 4.4999% 1,385 0.32 $152,953,731 0.164.5000% - 4.9999% 912 0.21 $138,583,898 0.155.0000% - 5.4999% 81 0.02 $7,380,183 0.015.5000% - 5.9999% 11 0.00 $596,411 0.006.0000% - 6.4999% 1 0.00 $76,832 0.006.5000% - 6.9999% 0 0.00 $0 0.007.0000% and above 1,223 0.28 $150,729,205 0.16Total 438,844 100.00 $94,708,917,204 100.00
Cover Pool Remaining Term Distribution
Remaining Term (Months) Number of Loans Percentage Principal Balance Percentage
Less than 12.00 67,736 15.44 $12,947,317,151 13.6712.00 - 23.99 105,711 24.09 $22,096,661,291 23.3324.00 - 35.99 123,978 28.25 $27,813,237,292 29.3736.00 - 47.99 93,712 21.35 $22,355,354,862 23.6048.00 - 59.99 44,628 10.17 $8,863,491,477 9.3660.00 - 71.99 2,598 0.59 $555,480,672 0.5972.00 - 83.99 258 0.06 $36,354,236 0.0484.00 - 119.99 220 0.05 $40,203,964 0.04120.00 and above 3 0.00 $816,258 0.00Total 438,844 100.00 $94,708,917,204 100.00
Cover Pool Loan Seasoning
Loan Seasoning (Months) Number of Loans Percentage Principal Balance Percentage
Less than 12.00 70,714 16.11 $13,340,367,444 14.0912.00 - 23.99 148,332 33.80 $35,004,155,035 36.9624.00 - 35.99 98,536 22.45 $21,324,195,122 22.5236.00 - 59.99 119,955 27.33 $24,899,583,476 26.2960.00 and above 1,307 0.30 $140,616,127 0.15Total 438,844 100.00 $94,708,917,204 100.00
RBC Covered Bond Programme Monthly Investor Report - March 31, 2021 Page 7 of 22
RBC Covered Bond Programme Monthly Investor Report Calculation Date: 3/31/2021

Cover Pool Range of Remaining Principal Balance
Range of Remaining Principal Balance Number of Loans Percentage Principal Balance Percentage
99,999 and below 134,949 30.75 $7,139,890,072 7.54100,000 - 149,999 66,291 15.11 $8,275,454,099 8.74150,000 - 199,999 57,177 13.03 $9,963,600,516 10.52200,000 - 249,999 45,236 10.31 $10,137,576,853 10.70250,000 - 299,999 34,730 7.91 $9,509,098,012 10.04300,000 - 349,999 24,626 5.61 $7,974,746,941 8.42350,000 - 399,999 18,265 4.16 $6,826,517,045 7.21400,000 - 449,999 13,365 3.05 $5,666,967,905 5.98450,000 - 499,999 10,236 2.33 $4,850,615,373 5.12500,000 - 549,999 7,705 1.76 $4,036,344,384 4.26550,000 - 599,999 5,987 1.36 $3,434,929,127 3.63600,000 - 649,999 4,326 0.99 $2,699,177,659 2.85650,000 - 699,999 3,387 0.77 $2,282,141,973 2.41700,000 - 749,999 2,499 0.57 $1,809,373,839 1.91750,000 - 799,999 2,036 0.46 $1,576,537,795 1.66800,000 - 849,999 1,483 0.34 $1,222,540,535 1.29850,000 - 899,999 1,285 0.29 $1,123,202,389 1.19900,000 - 949,999 1,058 0.24 $977,343,293 1.03950,000 - 999,999 791 0.18 $769,056,516 0.811,000,000 and above 3,412 0.78 $4,433,802,877 4.68Total 438,844 100.00 $94,708,917,204 100.00
Cover Pool Property Type Distribution
Property Type Number of Loans Percentage Principal Balance Percentage
Apartment (Condominium) 59,484 13.55 $11,618,525,188 12.27Detached 315,389 71.87 $69,095,233,218 72.96Duplex 4,910 1.12 $710,670,851 0.75Fourplex 1,139 0.26 $210,070,530 0.22Other 474 0.11 $63,650,559 0.07Row (Townhouse) 31,570 7.19 $7,227,893,560 7.63Semi-detached 24,579 5.60 $5,555,393,580 5.87Triplex 1,299 0.30 $227,479,718 0.24Total 438,844 100.00 $94,708,917,204 100.00
Cover Pool Indexed LTV - Authorized Distribution
Indexed LTV (%) Number of Properties Percentage Principal Balance Percentage
20.00 and below 15,964 4.23 $1,275,924,389 1.3520.01 - 25.00 9,224 2.44 $1,374,001,584 1.4525.01 - 30.00 15,137 4.01 $2,565,182,602 2.7130.01 - 35.00 23,043 6.10 $4,373,147,481 4.6235.01 - 40.00 29,816 7.89 $6,453,366,221 6.8140.01 - 45.00 38,157 10.10 $8,182,959,086 8.6445.01 - 50.00 38,559 10.21 $9,098,280,159 9.6150.01 - 55.00 38,084 10.08 $10,310,731,162 10.8955.01 - 60.00 38,102 10.08 $11,088,590,658 11.7160.01 - 65.00 36,025 9.53 $11,111,954,001 11.7365.01 - 70.00 38,760 10.26 $12,564,116,498 13.2770.01 - 75.00 38,186 10.11 $10,839,263,398 11.4475.01 - 80.00 11,027 2.92 $3,268,233,477 3.45> 80.00 7,737 2.05 $2,203,166,487 2.33Total 377,821 100.00 $94,708,917,204 100.00
Cover Pool Indexed LTV - Drawn Distribution
Indexed LTV (%) Number of Loans Percentage Principal Balance Percentage
20.00 and below 55,939 14.81 $5,065,792,740 5.3520.01 - 25.00 21,718 5.75 $3,693,120,479 3.9025.01 - 30.00 25,461 6.74 $5,121,704,140 5.4130.01 - 35.00 29,165 7.72 $6,633,620,765 7.0035.01 - 40.00 31,558 8.35 $7,851,873,692 8.2940.01 - 45.00 32,209 8.52 $8,406,075,354 8.8845.01 - 50.00 31,825 8.42 $9,028,956,328 9.5350.01 - 55.00 32,608 8.63 $10,109,238,818 10.6755.01 - 60.00 31,020 8.21 $9,829,525,402 10.3860.01 - 65.00 30,883 8.17 $10,070,020,515 10.6365.01 - 70.00 31,366 8.30 $10,669,924,990 11.2770.01 - 75.00 16,651 4.41 $5,869,519,693 6.2075.01 - 80.00 5,663 1.50 $1,804,112,366 1.90> 80.00 1,755 0.46 $555,431,922 0.59Total 377,821 100.00 $94,708,917,204 100.00
RBC Covered Bond Programme Monthly Investor Report - March 31, 2021 Page 8 of 22
RBC Covered Bond Programme Monthly Investor Report Calculation Date: 3/31/2021

Province Indexed LTV (%)
Current and less than 30
days past due30 to 59
days past due60 to 89
days past due90 or more
days past due Total
Alberta
20.00 and below $268,942,516 $290,022 $133,253 $449,473 $269,815,26420.01 - 25.00 $197,127,122 $0 $0 $52,200 $197,179,32225.01 - 30.00 $275,705,141 $312,169 $677,272 $447,928 $277,142,51030.01 - 35.00 $380,440,718 $138,918 $0 $835,914 $381,415,55035.01 - 40.00 $474,397,860 $225,022 $136,534 $1,515,837 $476,275,25440.01 - 45.00 $581,926,800 $1,078,197 $990,688 $1,789,086 $585,784,77145.01 - 50.00 $636,004,670 $831,950 $816,601 $1,852,857 $639,506,07950.01 - 55.00 $675,794,947 $1,787,572 $293,619 $1,190,636 $679,066,77455.01 - 60.00 $820,426,280 $347,943 $1,375,345 $1,806,648 $823,956,21760.01 - 65.00 $993,941,065 $1,026,988 $163,556 $1,351,477 $996,483,08765.01 - 70.00 $1,155,436,282 $2,025,400 $400,058 $5,161,064 $1,163,022,80470.01 - 75.00 $1,336,203,576 $1,119,046 $755,686 $2,273,596 $1,340,351,90475.01 - 80.00 $1,382,105,729 $77,152 $469,972 $2,334,068 $1,384,986,920> 80.00 $484,157,447 $762,535 $1,280,705 $1,328,621 $487,529,308
Total Alberta $9,662,610,154 $10,022,915 $7,493,290 $22,389,405 $9,702,515,765
Province Indexed LTV (%)
Current and less than 30
days past due30 to 59
days past due60 to 89
days past due90 or more
days past due Total
British Columbia
20.00 and below $1,509,330,296 $1,150,180 $574,817 $1,062,559 $1,512,117,85220.01 - 25.00 $1,062,269,227 $0 $134,310 $258,263 $1,062,661,80025.01 - 30.00 $1,416,939,472 $1,539,325 $122,726 $2,107,148 $1,420,708,67130.01 - 35.00 $1,813,672,505 $1,512,253 $745,258 $3,789,113 $1,819,719,12935.01 - 40.00 $1,955,543,457 $596,985 $0 $3,646,525 $1,959,786,96840.01 - 45.00 $1,823,034,120 $1,335,512 $124,960 $794,294 $1,825,288,88645.01 - 50.00 $1,814,857,250 $3,443,845 $2,874,009 $334,138 $1,821,509,24350.01 - 55.00 $1,759,315,633 $0 $186,181 $120,328 $1,759,622,14255.01 - 60.00 $1,987,170,723 $2,376,152 $258,494 $0 $1,989,805,36960.01 - 65.00 $1,848,250,952 $2,941,677 $228,761 $2,720,234 $1,854,141,62465.01 - 70.00 $1,773,811,501 $278,706 $0 $267,086 $1,774,357,29370.01 - 75.00 $1,675,530,898 $909,969 $0 $341,639 $1,676,782,50575.01 - 80.00 $270,105,934 $0 $0 $0 $270,105,934> 80.00 $9,246,453 $0 $0 $0 $9,246,453
Total British Columbia $20,719,078,422 $16,084,605 $5,249,514 $15,441,327 $20,755,853,868
Province Indexed LTV (%)
Current and less than 30
days past due30 to 59
days past due60 to 89
days past due90 or more
days past due Total
Manitoba
20.00 and below $65,134,642 $0 $0 $0 $65,134,64220.01 - 25.00 $47,135,794 $114,549 $0 $65,002 $47,315,34625.01 - 30.00 $64,359,663 $38,215 $105,634 $0 $64,503,51230.01 - 35.00 $94,809,717 $0 $0 $159,944 $94,969,66135.01 - 40.00 $120,273,754 $90,962 $117,641 $143,010 $120,625,36740.01 - 45.00 $157,212,548 $186,995 $0 $0 $157,399,54345.01 - 50.00 $177,889,446 $86,834 $127,760 $162,455 $178,266,49650.01 - 55.00 $203,867,388 $174,987 $214,065 $182,734 $204,439,17455.01 - 60.00 $250,147,705 $64,048 $0 $198,223 $250,409,97560.01 - 65.00 $310,250,261 $318,227 $0 $526,306 $311,094,79465.01 - 70.00 $382,359,574 $252,422 $0 $877,765 $383,489,76170.01 - 75.00 $299,684,384 $128,594 $150,983 $502,455 $300,466,41675.01 - 80.00 $23,942,808 $0 $0 $474,074 $24,416,882> 80.00 $3,989,293 $0 $0 $0 $3,989,293
Total Manitoba $2,201,056,978 $1,455,834 $716,084 $3,291,966 $2,206,520,862
Provincial Distribution by Indexed LTV- Drawn and Aging Summary
RBC Covered Bond Programme Monthly Investor Report - March 31, 2021 Page 9 of 22
RBC Covered Bond Programme Monthly Investor Report Calculation Date: 3/31/2021

Province Indexed LTV (%)
Current and less than 30
days past due30 to 59
days past due60 to 89
days past due90 or more
days past due Total
New Brunswick
20.00 and below $32,941,272 $18,888 $77,573 $0 $33,037,73320.01 - 25.00 $24,058,817 $0 $0 $0 $24,058,81725.01 - 30.00 $34,439,122 $0 $0 $0 $34,439,12230.01 - 35.00 $56,192,871 $0 $82,285 $43,988 $56,319,14435.01 - 40.00 $61,212,056 $55,900 $77,079 $24,907 $61,369,94240.01 - 45.00 $76,751,297 $0 $170,334 $44,195 $76,965,82745.01 - 50.00 $75,765,544 $165,992 $112,945 $0 $76,044,48150.01 - 55.00 $72,447,729 $147,242 $0 $358,926 $72,953,89755.01 - 60.00 $78,366,584 $0 $0 $0 $78,366,58460.01 - 65.00 $100,930,879 $0 $0 $0 $100,930,87965.01 - 70.00 $103,590,284 $198,100 $0 $120,019 $103,908,40370.01 - 75.00 $43,243,811 $0 $0 $0 $43,243,81175.01 - 80.00 $4,944,955 $0 $0 $0 $4,944,955> 80.00 $4,817,206 $0 $88,648 $0 $4,905,854
Total New Brunswick $769,702,427 $586,122 $608,865 $592,034 $771,489,448
Province Indexed LTV (%)
Current and less than 30
days past due30 to 59
days past due60 to 89
days past due90 or more
days past due Total
Newfoundland and Labrador
20.00 and below $27,294,392 $0 $85 $72,684 $27,367,16120.01 - 25.00 $21,251,229 $0 $0 $0 $21,251,22925.01 - 30.00 $35,053,966 $19,848 $0 $38,636 $35,112,45030.01 - 35.00 $48,828,453 $0 $0 $0 $48,828,45335.01 - 40.00 $70,762,685 $0 $0 $0 $70,762,68540.01 - 45.00 $91,836,891 $0 $0 $430,843 $92,267,73445.01 - 50.00 $92,349,269 $232,760 $0 $476,082 $93,058,11050.01 - 55.00 $72,954,152 $0 $202,433 $177,858 $73,334,44355.01 - 60.00 $85,723,376 $0 $0 $0 $85,723,37660.01 - 65.00 $92,940,779 $0 $0 $0 $92,940,77965.01 - 70.00 $107,450,693 $197,802 $0 $0 $107,648,49570.01 - 75.00 $31,304,162 $0 $0 $0 $31,304,16275.01 - 80.00 $2,035,712 $0 $0 $0 $2,035,712> 80.00 $2,515,170 $0 $0 $0 $2,515,170
Total Newfoundland and Labrador $782,300,929 $450,410 $202,518 $1,196,103 $784,149,960
Province Indexed LTV (%)
Current and less than 30
days past due30 to 59
days past due60 to 89
days past due90 or more
days past due Total
Northwest Territories
20.00 and below $317,422 $0 $0 $0 $317,42220.01 - 25.00 $130,582 $0 $0 $0 $130,58225.01 - 30.00 $67,668 $0 $0 $0 $67,66830.01 - 35.00 $343,969 $0 $0 $0 $343,96935.01 - 40.00 $0 $0 $0 $0 $040.01 - 45.00 $84,107 $0 $0 $0 $84,10745.01 - 50.00 $0 $0 $0 $0 $050.01 - 55.00 $0 $0 $0 $0 $055.01 - 60.00 $0 $0 $0 $0 $060.01 - 65.00 $0 $0 $0 $0 $065.01 - 70.00 $0 $0 $0 $0 $070.01 - 75.00 $146,396 $0 $0 $0 $146,39675.01 - 80.00 $0 $0 $0 $0 $0> 80.00 $0 $0 $0 $0 $0
Total Northwest Territories $1,090,143 $0 $0 $0 $1,090,143
RBC Covered Bond Programme Monthly Investor Report - March 31, 2021 Page 10 of 22
RBC Covered Bond Programme Monthly Investor Report Calculation Date: 3/31/2021

Province Indexed LTV (%)
Current and less than 30
days past due30 to 59
days past due60 to 89
days past due90 or more
days past due Total
Nova Scotia
20.00 and below $61,699,044 $36,032 $0 $0 $61,735,07620.01 - 25.00 $40,491,592 $49,636 $0 $37,501 $40,578,72925.01 - 30.00 $59,179,360 $0 $0 $40,215 $59,219,57530.01 - 35.00 $82,256,295 $0 $0 $424,250 $82,680,54535.01 - 40.00 $113,722,423 $80,911 $0 $598,375 $114,401,70940.01 - 45.00 $136,871,214 $0 $191,022 $1,294,161 $138,356,39745.01 - 50.00 $155,588,255 $561,527 $0 $90,194 $156,239,97650.01 - 55.00 $190,355,478 $0 $0 $131,525 $190,487,00355.01 - 60.00 $212,967,777 $0 $0 $105,597 $213,073,37460.01 - 65.00 $182,633,813 $0 $0 $0 $182,633,81365.01 - 70.00 $126,500,186 $69,552 $0 $132,097 $126,701,83570.01 - 75.00 $31,233,619 $0 $0 $0 $31,233,61975.01 - 80.00 $5,002,654 $0 $0 $0 $5,002,654> 80.00 $3,634,442 $0 $0 $0 $3,634,442
Total Nova Scotia $1,402,136,151 $797,658 $191,022 $2,853,914 $1,405,978,746
Province Indexed LTV (%)
Current and less than 30
days past due30 to 59
days past due60 to 89
days past due90 or more
days past due Total
Nunavut
20.00 and below $0 $0 $0 $0 $020.01 - 25.00 $0 $0 $0 $0 $025.01 - 30.00 $36,614 $0 $0 $0 $36,61430.01 - 35.00 $0 $0 $0 $0 $035.01 - 40.00 $0 $0 $0 $0 $040.01 - 45.00 $0 $0 $0 $0 $045.01 - 50.00 $0 $0 $0 $0 $050.01 - 55.00 $0 $0 $0 $0 $055.01 - 60.00 $0 $0 $0 $0 $060.01 - 65.00 $0 $0 $0 $0 $065.01 - 70.00 $0 $0 $0 $0 $070.01 - 75.00 $0 $0 $0 $0 $075.01 - 80.00 $0 $0 $0 $0 $0> 80.00 $0 $0 $0 $0 $0
Total Nunavut $36,614 $0 $0 $0 $36,614
Province Indexed LTV (%)
Current and less than 30
days past due30 to 59
days past due60 to 89
days past due90 or more
days past due Total
Ontario
20.00 and below $2,605,627,269 $965,526 $238,137 $690,831 $2,607,521,76320.01 - 25.00 $1,943,888,335 $1,636,377 $97,046 $327,231 $1,945,948,98925.01 - 30.00 $2,727,434,928 $4,271,552 $0 $190,480 $2,731,896,96130.01 - 35.00 $3,455,917,830 $2,657,815 $810,767 $968,249 $3,460,354,66035.01 - 40.00 $4,119,205,538 $2,098,959 $936,032 $955,689 $4,123,196,21840.01 - 45.00 $4,304,827,418 $1,851,186 $161,983 $2,459,490 $4,309,300,07645.01 - 50.00 $4,629,383,114 $1,506,231 $1,357,379 $1,437,181 $4,633,683,90650.01 - 55.00 $5,483,581,918 $1,373,161 $3,963,131 $1,846,680 $5,490,764,88955.01 - 60.00 $4,940,640,593 $2,601,864 $3,438,649 $2,136,616 $4,948,817,72460.01 - 65.00 $5,340,611,187 $2,838,167 $2,713,271 $1,186,635 $5,347,349,26065.01 - 70.00 $6,108,774,152 $2,430,692 $1,921,074 $2,421,676 $6,115,547,59570.01 - 75.00 $2,147,708,965 $1,063,424 $1,038,650 $671,261 $2,150,482,30175.01 - 80.00 $99,996,494 $378,489 $0 $0 $100,374,983> 80.00 $27,829,870 $0 $0 $0 $27,829,870
Total Ontario $47,935,427,612 $25,673,441 $16,676,120 $15,292,020 $47,993,069,193
RBC Covered Bond Programme Monthly Investor Report - March 31, 2021 Page 11 of 22
RBC Covered Bond Programme Monthly Investor Report Calculation Date: 3/31/2021

Province Indexed LTV (%)
Current and less than 30
days past due30 to 59
days past due60 to 89
days past due90 or more
days past due Total
Prince Edward Island
20.00 and below $6,694,242 $0 $0 $0 $6,694,24220.01 - 25.00 $4,168,455 $0 $0 $0 $4,168,45525.01 - 30.00 $9,313,239 $0 $0 $0 $9,313,23930.01 - 35.00 $8,139,171 $0 $0 $0 $8,139,17135.01 - 40.00 $13,368,568 $84,706 $0 $0 $13,453,27440.01 - 45.00 $16,769,826 $0 $0 $0 $16,769,82645.01 - 50.00 $18,012,284 $59,923 $103,349 $0 $18,175,55650.01 - 55.00 $24,182,957 $0 $0 $0 $24,182,95755.01 - 60.00 $19,474,404 $0 $0 $0 $19,474,40460.01 - 65.00 $18,020,916 $0 $0 $156,767 $18,177,68365.01 - 70.00 $25,020,493 $0 $0 $0 $25,020,49370.01 - 75.00 $12,743,416 $0 $0 $0 $12,743,41675.01 - 80.00 $1,325,728 $0 $0 $0 $1,325,728> 80.00 $1,428,165 $0 $0 $0 $1,428,165
Total Prince Edward Island $178,661,865 $144,629 $103,349 $156,767 $179,066,610
Province Indexed LTV (%)
Current and less than 30
days past due30 to 59
days past due60 to 89
days past due90 or more
days past due Total
Quebec
20.00 and below $393,955,975 $367,273 $0 $6,958 $394,330,20620.01 - 25.00 $284,190,272 $0 $0 $104,047 $284,294,31925.01 - 30.00 $384,834,990 $528,666 $78,604 $128,599 $385,570,86030.01 - 35.00 $536,695,472 $0 $0 $216,249 $536,911,72135.01 - 40.00 $699,131,823 $293,254 $140,993 $26,358 $699,592,42840.01 - 45.00 $954,810,333 $1,120,759 $152,083 $1,134,325 $957,217,50045.01 - 50.00 $1,180,373,205 $355,101 $55,780 $622,591 $1,181,406,67750.01 - 55.00 $1,427,818,483 $260,355 $0 $437,580 $1,428,516,41755.01 - 60.00 $1,250,144,646 $49,506 $132,270 $892,712 $1,251,219,13360.01 - 65.00 $980,046,904 $150,365 $0 $249,532 $980,446,80265.01 - 70.00 $662,680,842 $422,243 $0 $206,550 $663,309,63670.01 - 75.00 $211,261,258 $158,366 $243,378 $556,995 $212,219,99775.01 - 80.00 $7,717,209 $0 $0 $0 $7,717,209> 80.00 $7,999,767 $0 $0 $0 $7,999,767
Total Quebec $8,981,661,179 $3,705,888 $803,108 $4,582,497 $8,990,752,673
Province Indexed LTV (%)
Current and less than 30
days past due30 to 59
days past due60 to 89
days past due90 or more
days past due Total
Saskatchewan
20.00 and below $88,029,842 $37,066 $0 $8,879 $88,075,78720.01 - 25.00 $64,599,181 $0 $0 $148,437 $64,747,61825.01 - 30.00 $101,729,323 $0 $0 $352,715 $102,082,03730.01 - 35.00 $139,146,546 $584,519 $277,760 $183,630 $140,192,45535.01 - 40.00 $209,218,283 $704,002 $0 $253,514 $210,175,80040.01 - 45.00 $244,094,395 $476,419 $0 $1,004,973 $245,575,78745.01 - 50.00 $228,269,600 $299,047 $52,734 $1,030,835 $229,652,21750.01 - 55.00 $184,348,548 $0 $271,445 $827,444 $185,447,43855.01 - 60.00 $168,175,178 $504,069 $0 $0 $168,679,24760.01 - 65.00 $185,759,538 $34,464 $0 $0 $185,794,00265.01 - 70.00 $206,223,862 $351,226 $0 $484,495 $207,059,58270.01 - 75.00 $70,234,577 $0 $0 $0 $70,234,57775.01 - 80.00 $3,055,594 $0 $0 $0 $3,055,594> 80.00 $5,465,878 $0 $0 $0 $5,465,878
Total Saskatchewan $1,898,350,345 $2,990,812 $601,940 $4,294,922 $1,906,238,019
RBC Covered Bond Programme Monthly Investor Report - March 31, 2021 Page 12 of 22
RBC Covered Bond Programme Monthly Investor Report Calculation Date: 3/31/2021

Province Indexed LTV (%)
Current and less than 30
days past due30 to 59
days past due60 to 89
days past due90 or more
days past due Total
Yukon
20.00 and below $1,612,329 $0 $0 $0 $1,612,32920.01 - 25.00 $969,966 $0 $0 $0 $969,96625.01 - 30.00 $1,482,451 $0 $0 $0 $1,482,45130.01 - 35.00 $3,127,675 $0 $0 $0 $3,127,67535.01 - 40.00 $2,385,386 $0 $0 $0 $2,385,38640.01 - 45.00 $1,010,095 $0 $0 $0 $1,010,09545.01 - 50.00 $1,281,160 $0 $0 $0 $1,281,16050.01 - 55.00 $222,218 $0 $0 $0 $222,21855.01 - 60.00 $0 $0 $0 $0 $060.01 - 65.00 $0 $0 $0 $0 $065.01 - 70.00 $0 $0 $0 $0 $070.01 - 75.00 $64,023 $0 $0 $0 $64,02375.01 - 80.00 $0 $0 $0 $0 $0> 80.00 $0 $0 $0 $0 $0
Total Yukon $12,155,304 $0 $0 $0 $12,155,304
Grand Total $94,544,268,124 $61,912,314 $32,645,809 $70,090,956 $94,708,917,204
Province Indexed LTV (%)
Current and less than 30
days past due30 to 59
days past due60 to 89
days past due90 or more
days past due Total
Alberta
20.00 and below 0.28 0.00 0.00 0.00 0.2820.01 - 25.00 0.21 0.00 0.00 0.00 0.2125.01 - 30.00 0.29 0.00 0.00 0.00 0.2930.01 - 35.00 0.40 0.00 0.00 0.00 0.4035.01 - 40.00 0.50 0.00 0.00 0.00 0.5040.01 - 45.00 0.61 0.00 0.00 0.00 0.6245.01 - 50.00 0.67 0.00 0.00 0.00 0.6850.01 - 55.00 0.71 0.00 0.00 0.00 0.7255.01 - 60.00 0.87 0.00 0.00 0.00 0.8760.01 - 65.00 1.05 0.00 0.00 0.00 1.0565.01 - 70.00 1.22 0.00 0.00 0.01 1.2370.01 - 75.00 1.41 0.00 0.00 0.00 1.4275.01 - 80.00 1.46 0.00 0.00 0.00 1.46> 80.00 0.51 0.00 0.00 0.00 0.51
Total Alberta 10.20 0.01 0.01 0.02 10.24
Province Indexed LTV (%)
Current and less than 30
days past due30 to 59
days past due60 to 89
days past due90 or more
days past due Total
British Columbia
20.00 and below 1.59 0.00 0.00 0.00 1.6020.01 - 25.00 1.12 0.00 0.00 0.00 1.1225.01 - 30.00 1.50 0.00 0.00 0.00 1.5030.01 - 35.00 1.91 0.00 0.00 0.00 1.9235.01 - 40.00 2.06 0.00 0.00 0.00 2.0740.01 - 45.00 1.92 0.00 0.00 0.00 1.9345.01 - 50.00 1.92 0.00 0.00 0.00 1.9250.01 - 55.00 1.86 0.00 0.00 0.00 1.8655.01 - 60.00 2.10 0.00 0.00 0.00 2.1060.01 - 65.00 1.95 0.00 0.00 0.00 1.9665.01 - 70.00 1.87 0.00 0.00 0.00 1.8770.01 - 75.00 1.77 0.00 0.00 0.00 1.7775.01 - 80.00 0.29 0.00 0.00 0.00 0.29> 80.00 0.01 0.00 0.00 0.00 0.01
Total British Columbia 21.88 0.02 0.01 0.02 21.92
Provincial Distribution by Indexed LTV - Drawn and Aging Summary (%)
RBC Covered Bond Programme Monthly Investor Report - March 31, 2021 Page 13 of 22
RBC Covered Bond Programme Monthly Investor Report Calculation Date: 3/31/2021

Province Indexed LTV (%)
Current and less than 30
days past due30 to 59
days past due60 to 89
days past due90 or more
days past due Total
Manitoba
20.00 and below 0.07 0.00 0.00 0.00 0.0720.01 - 25.00 0.05 0.00 0.00 0.00 0.0525.01 - 30.00 0.07 0.00 0.00 0.00 0.0730.01 - 35.00 0.10 0.00 0.00 0.00 0.1035.01 - 40.00 0.13 0.00 0.00 0.00 0.1340.01 - 45.00 0.17 0.00 0.00 0.00 0.1745.01 - 50.00 0.19 0.00 0.00 0.00 0.1950.01 - 55.00 0.22 0.00 0.00 0.00 0.2255.01 - 60.00 0.26 0.00 0.00 0.00 0.2660.01 - 65.00 0.33 0.00 0.00 0.00 0.3365.01 - 70.00 0.40 0.00 0.00 0.00 0.4070.01 - 75.00 0.32 0.00 0.00 0.00 0.3275.01 - 80.00 0.03 0.00 0.00 0.00 0.03> 80.00 0.00 0.00 0.00 0.00 0.00
Total Manitoba 2.32 0.00 0.00 0.00 2.33
Province Indexed LTV (%)
Current and less than 30
days past due30 to 59
days past due60 to 89
days past due90 or more
days past due Total
New Brunswick
20.00 and below 0.03 0.00 0.00 0.00 0.0320.01 - 25.00 0.03 0.00 0.00 0.00 0.0325.01 - 30.00 0.04 0.00 0.00 0.00 0.0430.01 - 35.00 0.06 0.00 0.00 0.00 0.0635.01 - 40.00 0.06 0.00 0.00 0.00 0.0640.01 - 45.00 0.08 0.00 0.00 0.00 0.0845.01 - 50.00 0.08 0.00 0.00 0.00 0.0850.01 - 55.00 0.08 0.00 0.00 0.00 0.0855.01 - 60.00 0.08 0.00 0.00 0.00 0.0860.01 - 65.00 0.11 0.00 0.00 0.00 0.1165.01 - 70.00 0.11 0.00 0.00 0.00 0.1170.01 - 75.00 0.05 0.00 0.00 0.00 0.0575.01 - 80.00 0.01 0.00 0.00 0.00 0.01> 80.00 0.01 0.00 0.00 0.00 0.01
Total New Brunswick 0.81 0.00 0.00 0.00 0.81
Province Indexed LTV (%)
Current and less than 30
days past due30 to 59
days past due60 to 89
days past due90 or more
days past due Total
Newfoundland and Labrador
20.00 and below 0.03 0.00 0.00 0.00 0.0320.01 - 25.00 0.02 0.00 0.00 0.00 0.0225.01 - 30.00 0.04 0.00 0.00 0.00 0.0430.01 - 35.00 0.05 0.00 0.00 0.00 0.0535.01 - 40.00 0.07 0.00 0.00 0.00 0.0740.01 - 45.00 0.10 0.00 0.00 0.00 0.1045.01 - 50.00 0.10 0.00 0.00 0.00 0.1050.01 - 55.00 0.08 0.00 0.00 0.00 0.0855.01 - 60.00 0.09 0.00 0.00 0.00 0.0960.01 - 65.00 0.10 0.00 0.00 0.00 0.1065.01 - 70.00 0.11 0.00 0.00 0.00 0.1170.01 - 75.00 0.03 0.00 0.00 0.00 0.0375.01 - 80.00 0.00 0.00 0.00 0.00 0.00> 80.00 0.00 0.00 0.00 0.00 0.00
Total Newfoundland and Labrador 0.83 0.00 0.00 0.00 0.83
RBC Covered Bond Programme Monthly Investor Report - March 31, 2021 Page 14 of 22
RBC Covered Bond Programme Monthly Investor Report Calculation Date: 3/31/2021

Province Indexed LTV (%)
Current and less than 30
days past due30 to 59
days past due60 to 89
days past due90 or more
days past due Total
Northwest Territories
20.00 and below 0.00 0.00 0.00 0.00 0.0020.01 - 25.00 0.00 0.00 0.00 0.00 0.0025.01 - 30.00 0.00 0.00 0.00 0.00 0.0030.01 - 35.00 0.00 0.00 0.00 0.00 0.0035.01 - 40.00 0.00 0.00 0.00 0.00 0.0040.01 - 45.00 0.00 0.00 0.00 0.00 0.0045.01 - 50.00 0.00 0.00 0.00 0.00 0.0050.01 - 55.00 0.00 0.00 0.00 0.00 0.0055.01 - 60.00 0.00 0.00 0.00 0.00 0.0060.01 - 65.00 0.00 0.00 0.00 0.00 0.0065.01 - 70.00 0.00 0.00 0.00 0.00 0.0070.01 - 75.00 0.00 0.00 0.00 0.00 0.0075.01 - 80.00 0.00 0.00 0.00 0.00 0.00> 80.00 0.00 0.00 0.00 0.00 0.00
Total Northwest Territories 0.00 0.00 0.00 0.00 0.00
Province Indexed LTV (%)
Current and less than 30
days past due30 to 59
days past due60 to 89
days past due90 or more
days past due Total
Nova Scotia
20.00 and below 0.07 0.00 0.00 0.00 0.0720.01 - 25.00 0.04 0.00 0.00 0.00 0.0425.01 - 30.00 0.06 0.00 0.00 0.00 0.0630.01 - 35.00 0.09 0.00 0.00 0.00 0.0935.01 - 40.00 0.12 0.00 0.00 0.00 0.1240.01 - 45.00 0.14 0.00 0.00 0.00 0.1545.01 - 50.00 0.16 0.00 0.00 0.00 0.1650.01 - 55.00 0.20 0.00 0.00 0.00 0.2055.01 - 60.00 0.22 0.00 0.00 0.00 0.2260.01 - 65.00 0.19 0.00 0.00 0.00 0.1965.01 - 70.00 0.13 0.00 0.00 0.00 0.1370.01 - 75.00 0.03 0.00 0.00 0.00 0.0375.01 - 80.00 0.01 0.00 0.00 0.00 0.01> 80.00 0.00 0.00 0.00 0.00 0.00
Total Nova Scotia 1.48 0.00 0.00 0.00 1.48
Province Indexed LTV (%)
Current and less than 30
days past due30 to 59
days past due60 to 89
days past due90 or more
days past due Total
Nunavut
20.00 and below 0.00 0.00 0.00 0.00 0.0020.01 - 25.00 0.00 0.00 0.00 0.00 0.0025.01 - 30.00 0.00 0.00 0.00 0.00 0.0030.01 - 35.00 0.00 0.00 0.00 0.00 0.0035.01 - 40.00 0.00 0.00 0.00 0.00 0.0040.01 - 45.00 0.00 0.00 0.00 0.00 0.0045.01 - 50.00 0.00 0.00 0.00 0.00 0.0050.01 - 55.00 0.00 0.00 0.00 0.00 0.0055.01 - 60.00 0.00 0.00 0.00 0.00 0.0060.01 - 65.00 0.00 0.00 0.00 0.00 0.0065.01 - 70.00 0.00 0.00 0.00 0.00 0.0070.01 - 75.00 0.00 0.00 0.00 0.00 0.0075.01 - 80.00 0.00 0.00 0.00 0.00 0.00> 80.00 0.00 0.00 0.00 0.00 0.00
Total Nunavut 0.00 0.00 0.00 0.00 0.00
RBC Covered Bond Programme Monthly Investor Report - March 31, 2021 Page 15 of 22
RBC Covered Bond Programme Monthly Investor Report Calculation Date: 3/31/2021
Province Indexed LTV (%)
Current and less than 30
days past due30 to 59
days past due60 to 89
days past due90 or more
days past due Total
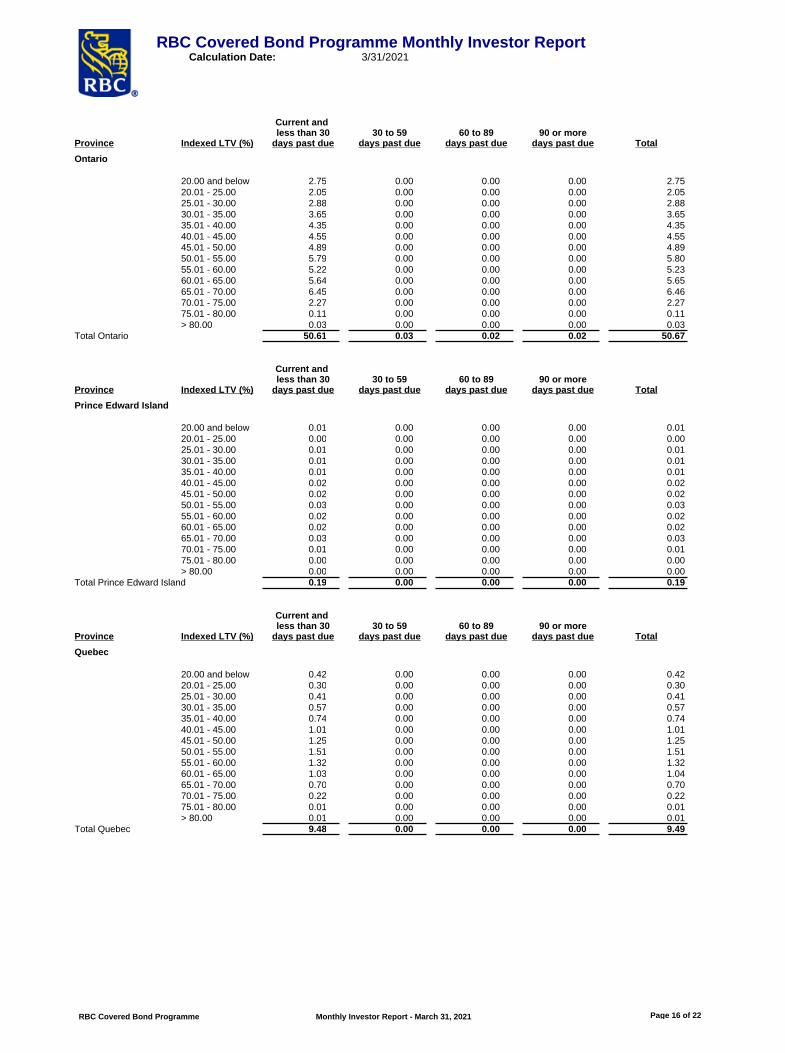
Ontario
20.00 and below 2.75 0.00 0.00 0.00 2.7520.01 - 25.00 2.05 0.00 0.00 0.00 2.0525.01 - 30.00 2.88 0.00 0.00 0.00 2.8830.01 - 35.00 3.65 0.00 0.00 0.00 3.6535.01 - 40.00 4.35 0.00 0.00 0.00 4.3540.01 - 45.00 4.55 0.00 0.00 0.00 4.5545.01 - 50.00 4.89 0.00 0.00 0.00 4.8950.01 - 55.00 5.79 0.00 0.00 0.00 5.8055.01 - 60.00 5.22 0.00 0.00 0.00 5.2360.01 - 65.00 5.64 0.00 0.00 0.00 5.6565.01 - 70.00 6.45 0.00 0.00 0.00 6.4670.01 - 75.00 2.27 0.00 0.00 0.00 2.2775.01 - 80.00 0.11 0.00 0.00 0.00 0.11> 80.00 0.03 0.00 0.00 0.00 0.03
Total Ontario 50.61 0.03 0.02 0.02 50.67
Province Indexed LTV (%)
Current and less than 30
days past due30 to 59
days past due60 to 89
days past due90 or more
days past due Total
Prince Edward Island
20.00 and below 0.01 0.00 0.00 0.00 0.0120.01 - 25.00 0.00 0.00 0.00 0.00 0.0025.01 - 30.00 0.01 0.00 0.00 0.00 0.0130.01 - 35.00 0.01 0.00 0.00 0.00 0.0135.01 - 40.00 0.01 0.00 0.00 0.00 0.0140.01 - 45.00 0.02 0.00 0.00 0.00 0.0245.01 - 50.00 0.02 0.00 0.00 0.00 0.0250.01 - 55.00 0.03 0.00 0.00 0.00 0.0355.01 - 60.00 0.02 0.00 0.00 0.00 0.0260.01 - 65.00 0.02 0.00 0.00 0.00 0.0265.01 - 70.00 0.03 0.00 0.00 0.00 0.0370.01 - 75.00 0.01 0.00 0.00 0.00 0.0175.01 - 80.00 0.00 0.00 0.00 0.00 0.00> 80.00 0.00 0.00 0.00 0.00 0.00
Total Prince Edward Island 0.19 0.00 0.00 0.00 0.19
Province Indexed LTV (%)
Current and less than 30
days past due30 to 59
days past due60 to 89
days past due90 or more
days past due Total
Quebec
20.00 and below 0.42 0.00 0.00 0.00 0.4220.01 - 25.00 0.30 0.00 0.00 0.00 0.3025.01 - 30.00 0.41 0.00 0.00 0.00 0.4130.01 - 35.00 0.57 0.00 0.00 0.00 0.5735.01 - 40.00 0.74 0.00 0.00 0.00 0.7440.01 - 45.00 1.01 0.00 0.00 0.00 1.0145.01 - 50.00 1.25 0.00 0.00 0.00 1.2550.01 - 55.00 1.51 0.00 0.00 0.00 1.5155.01 - 60.00 1.32 0.00 0.00 0.00 1.3260.01 - 65.00 1.03 0.00 0.00 0.00 1.0465.01 - 70.00 0.70 0.00 0.00 0.00 0.7070.01 - 75.00 0.22 0.00 0.00 0.00 0.2275.01 - 80.00 0.01 0.00 0.00 0.00 0.01> 80.00 0.01 0.00 0.00 0.00 0.01
Total Quebec 9.48 0.00 0.00 0.00 9.49
RBC Covered Bond Programme Monthly Investor Report - March 31, 2021 Page 16 of 22
RBC Covered Bond Programme Monthly Investor Report Calculation Date: 3/31/2021

Province Indexed LTV (%)
Current and less than 30
days past due30 to 59
days past due60 to 89
days past due90 or more
days past due Total
Saskatchewan
20.00 and below 0.09 0.00 0.00 0.00 0.0920.01 - 25.00 0.07 0.00 0.00 0.00 0.0725.01 - 30.00 0.11 0.00 0.00 0.00 0.1130.01 - 35.00 0.15 0.00 0.00 0.00 0.1535.01 - 40.00 0.22 0.00 0.00 0.00 0.2240.01 - 45.00 0.26 0.00 0.00 0.00 0.2645.01 - 50.00 0.24 0.00 0.00 0.00 0.2450.01 - 55.00 0.19 0.00 0.00 0.00 0.2055.01 - 60.00 0.18 0.00 0.00 0.00 0.1860.01 - 65.00 0.20 0.00 0.00 0.00 0.2065.01 - 70.00 0.22 0.00 0.00 0.00 0.2270.01 - 75.00 0.07 0.00 0.00 0.00 0.0775.01 - 80.00 0.00 0.00 0.00 0.00 0.00> 80.00 0.01 0.00 0.00 0.00 0.01
Total Saskatchewan 2.00 0.00 0.00 0.00 2.01
Province Indexed LTV (%)
Current and less than 30
days past due30 to 59
days past due60 to 89
days past due90 or more
days past due Total
Yukon
20.00 and below 0.00 0.00 0.00 0.00 0.0020.01 - 25.00 0.00 0.00 0.00 0.00 0.0025.01 - 30.00 0.00 0.00 0.00 0.00 0.0030.01 - 35.00 0.00 0.00 0.00 0.00 0.0035.01 - 40.00 0.00 0.00 0.00 0.00 0.0040.01 - 45.00 0.00 0.00 0.00 0.00 0.0045.01 - 50.00 0.00 0.00 0.00 0.00 0.0050.01 - 55.00 0.00 0.00 0.00 0.00 0.0055.01 - 60.00 0.00 0.00 0.00 0.00 0.0060.01 - 65.00 0.00 0.00 0.00 0.00 0.0065.01 - 70.00 0.00 0.00 0.00 0.00 0.0070.01 - 75.00 0.00 0.00 0.00 0.00 0.0075.01 - 80.00 0.00 0.00 0.00 0.00 0.00> 80.00 0.00 0.00 0.00 0.00 0.00
Total Yukon 0.01 0.00 0.00 0.00 0.01
Grand Total 99.83 0.07 0.03 0.07 100.00
Cover Pool Indexed LTV - Drawn by Credit Bureau Score (continued)
Indexed LTV (%) Credit Bureau Score Principal Balance Percentage
20.00 and below
Score Unavailable $30,550,227 0.03499 and below $1,799,633 0.00500 - 539 $4,165,778 0.00540 - 559 $6,010,098 0.01560 - 579 $4,498,813 0.00580 - 599 $6,308,001 0.01600 - 619 $10,646,608 0.01620 - 639 $13,814,650 0.01640 - 659 $30,415,601 0.03660 - 679 $43,490,566 0.05680 - 699 $75,954,973 0.08700 - 719 $106,052,802 0.11720 - 739 $143,669,298 0.15740 - 759 $168,951,089 0.18760 - 779 $211,091,623 0.22780 - 799 $284,265,781 0.30800 and above $3,926,073,937 4.15
Total $5,067,759,478 5.35
Indexed LTV (%) Credit Bureau Score Principal Balance Percentage
20.01 - 25.00
Score Unavailable $14,357,894 0.02499 and below $1,360,130 0.00500 - 539 $4,156,040 0.00540 - 559 $2,946,892 0.00560 - 579 $3,301,556 0.00580 - 599 $5,800,406 0.01600 - 619 $9,685,414 0.01620 - 639 $19,438,386 0.02640 - 659 $31,341,471 0.03
RBC Covered Bond Programme Monthly Investor Report - March 31, 2021 Page 17 of 22
RBC Covered Bond Programme Monthly Investor Report Calculation Date: 3/31/2021

660 - 679 $49,033,280 0.05680 - 699 $72,159,652 0.08700 - 719 $112,134,534 0.12720 - 739 $137,908,715 0.15740 - 759 $153,044,688 0.16760 - 779 $176,720,574 0.19780 - 799 $250,001,400 0.26800 and above $2,649,914,142 2.80
Total $3,693,305,172 3.90
Indexed LTV (%) Credit Bureau Score Principal Balance Percentage
25.01 - 30.00
Score Unavailable $22,495,859 0.02499 and below $3,665,969 0.00500 - 539 $5,520,749 0.01540 - 559 $7,278,904 0.01560 - 579 $9,310,866 0.01580 - 599 $11,109,995 0.01600 - 619 $18,283,521 0.02620 - 639 $31,707,654 0.03640 - 659 $52,561,775 0.06660 - 679 $76,007,627 0.08680 - 699 $115,519,831 0.12700 - 719 $169,097,659 0.18720 - 739 $195,302,839 0.21740 - 759 $238,423,726 0.25760 - 779 $278,226,004 0.29780 - 799 $372,149,133 0.39800 and above $3,514,913,561 3.71
Total $5,121,575,670 5.41
Indexed LTV (%) Credit Bureau Score Principal Balance Percentage
30.01 - 35.00
Score Unavailable $22,510,537 0.02499 and below $4,005,468 0.00500 - 539 $10,000,846 0.01540 - 559 $7,864,404 0.01560 - 579 $12,143,343 0.01580 - 599 $14,629,670 0.02600 - 619 $29,530,495 0.03620 - 639 $48,147,539 0.05640 - 659 $70,091,038 0.07660 - 679 $122,273,673 0.13680 - 699 $169,882,732 0.18700 - 719 $248,950,608 0.26720 - 739 $300,298,304 0.32740 - 759 $336,082,481 0.35760 - 779 $406,810,348 0.43780 - 799 $488,922,045 0.52800 and above $4,340,858,599 4.58
Total $6,633,002,132 7.00
Indexed LTV (%) Credit Bureau Score Principal Balance Percentage
35.01 - 40.00
Score Unavailable $17,659,777 0.02499 and below $6,109,667 0.01500 - 539 $15,989,100 0.02540 - 559 $11,172,731 0.01560 - 579 $14,639,267 0.02580 - 599 $23,861,730 0.03600 - 619 $37,955,539 0.04620 - 639 $66,807,862 0.07640 - 659 $104,976,293 0.11660 - 679 $164,910,048 0.17680 - 699 $241,421,248 0.25700 - 719 $315,171,793 0.33720 - 739 $391,247,068 0.41740 - 759 $429,017,747 0.45760 - 779 $539,520,610 0.57780 - 799 $637,595,965 0.67800 and above $4,833,968,586 5.10
Total $7,852,025,030 8.29
RBC Covered Bond Programme Monthly Investor Report - March 31, 2021 Page 18 of 22
RBC Covered Bond Programme Monthly Investor Report Calculation Date: 3/31/2021

Indexed LTV (%) Credit Bureau Score Principal Balance Percentage
40.01 - 45.00
Score Unavailable $13,798,212 0.01499 and below $8,151,634 0.01500 - 539 $17,698,962 0.02540 - 559 $12,289,234 0.01560 - 579 $25,379,547 0.03580 - 599 $33,764,493 0.04600 - 619 $48,903,945 0.05620 - 639 $87,059,002 0.09640 - 659 $130,313,273 0.14660 - 679 $175,922,976 0.19680 - 699 $282,995,665 0.30700 - 719 $369,338,812 0.39720 - 739 $450,164,273 0.48740 - 759 $502,496,249 0.53760 - 779 $595,020,137 0.63780 - 799 $711,538,760 0.75800 and above $4,941,185,373 5.22
Total $8,406,020,549 8.88
Indexed LTV (%) Credit Bureau Score Principal Balance Percentage
45.01 - 50.00
Score Unavailable $13,067,719 0.01499 and below $7,892,823 0.01500 - 539 $19,863,211 0.02540 - 559 $15,884,182 0.02560 - 579 $17,484,891 0.02580 - 599 $36,918,406 0.04600 - 619 $48,814,329 0.05620 - 639 $81,967,010 0.09640 - 659 $132,553,055 0.14660 - 679 $228,328,949 0.24680 - 699 $350,826,662 0.37700 - 719 $434,377,933 0.46720 - 739 $506,260,343 0.53740 - 759 $608,695,717 0.64760 - 779 $723,203,650 0.76780 - 799 $802,788,062 0.85800 and above $4,999,896,960 5.28
Total $9,028,823,902 9.53
Indexed LTV (%) Credit Bureau Score Principal Balance Percentage
50.01 - 55.00
Score Unavailable $10,940,595 0.01499 and below $8,814,948 0.01500 - 539 $19,010,469 0.02540 - 559 $16,616,976 0.02560 - 579 $24,217,766 0.03580 - 599 $30,589,936 0.03600 - 619 $56,991,645 0.06620 - 639 $99,358,407 0.10640 - 659 $179,237,393 0.19660 - 679 $249,461,282 0.26680 - 699 $398,752,314 0.42700 - 719 $508,983,705 0.54720 - 739 $625,029,272 0.66740 - 759 $724,793,485 0.77760 - 779 $786,601,964 0.83780 - 799 $971,917,555 1.03800 and above $5,397,719,643 5.70
Total $10,109,037,353 10.67
RBC Covered Bond Programme Monthly Investor Report - March 31, 2021 Page 19 of 22
RBC Covered Bond Programme Monthly Investor Report Calculation Date: 3/31/2021

Indexed LTV (%) Credit Bureau Score Principal Balance Percentage
55.01 - 60.00
Score Unavailable $13,358,864 0.01499 and below $8,663,372 0.01500 - 539 $16,881,979 0.02540 - 559 $17,159,623 0.02560 - 579 $24,051,707 0.03580 - 599 $31,044,813 0.03600 - 619 $56,965,279 0.06620 - 639 $105,122,940 0.11640 - 659 $173,132,631 0.18660 - 679 $256,268,546 0.27680 - 699 $399,202,425 0.42700 - 719 $521,013,196 0.55720 - 739 $633,586,758 0.67740 - 759 $707,990,810 0.75760 - 779 $803,811,036 0.85780 - 799 $919,204,960 0.97800 and above $5,142,066,463 5.43
Total $9,829,525,402 10.38
Indexed LTV (%) Credit Bureau Score Principal Balance Percentage
60.01 - 65.00
Score Unavailable $13,022,361 0.01499 and below $6,778,427 0.01500 - 539 $17,162,080 0.02540 - 559 $18,207,053 0.02560 - 579 $25,319,700 0.03580 - 599 $40,416,877 0.04600 - 619 $64,885,091 0.07620 - 639 $123,613,277 0.13640 - 659 $206,492,496 0.22660 - 679 $296,297,220 0.31680 - 699 $408,887,282 0.43700 - 719 $544,870,484 0.58720 - 739 $622,826,075 0.66740 - 759 $691,557,272 0.73760 - 779 $805,013,602 0.85780 - 799 $945,908,519 1.00800 and above $5,238,734,907 5.53
Total $10,069,992,724 10.63
Indexed LTV (%) Credit Bureau Score Principal Balance Percentage
65.01 - 70.00
Score Unavailable $11,740,406 0.01499 and below $13,330,085 0.01500 - 539 $20,964,917 0.02540 - 559 $18,209,660 0.02560 - 579 $32,058,120 0.03580 - 599 $49,419,193 0.05600 - 619 $85,782,178 0.09620 - 639 $154,795,330 0.16640 - 659 $247,734,973 0.26660 - 679 $357,856,519 0.38680 - 699 $475,344,133 0.50700 - 719 $639,010,600 0.67720 - 739 $736,544,698 0.78740 - 759 $775,308,617 0.82760 - 779 $914,312,141 0.97780 - 799 $1,016,200,086 1.07800 and above $5,121,454,243 5.41
Total $10,670,065,897 11.27
Indexed LTV (%) Credit Bureau Score Principal Balance Percentage
70.01 - 75.00
Score Unavailable $3,202,928 0.00499 and below $4,398,342 0.00500 - 539 $13,515,495 0.01540 - 559 $13,331,141 0.01560 - 579 $19,591,234 0.02580 - 599 $27,742,396 0.03600 - 619 $50,292,337 0.05620 - 639 $115,716,587 0.12640 - 659 $135,599,546 0.14660 - 679 $246,975,061 0.26680 - 699 $329,305,390 0.35700 - 719 $386,854,727 0.41720 - 739 $447,188,292 0.47740 - 759 $440,841,406 0.47
RBC Covered Bond Programme Monthly Investor Report - March 31, 2021 Page 20 of 22
RBC Covered Bond Programme Monthly Investor Report Calculation Date: 3/31/2021
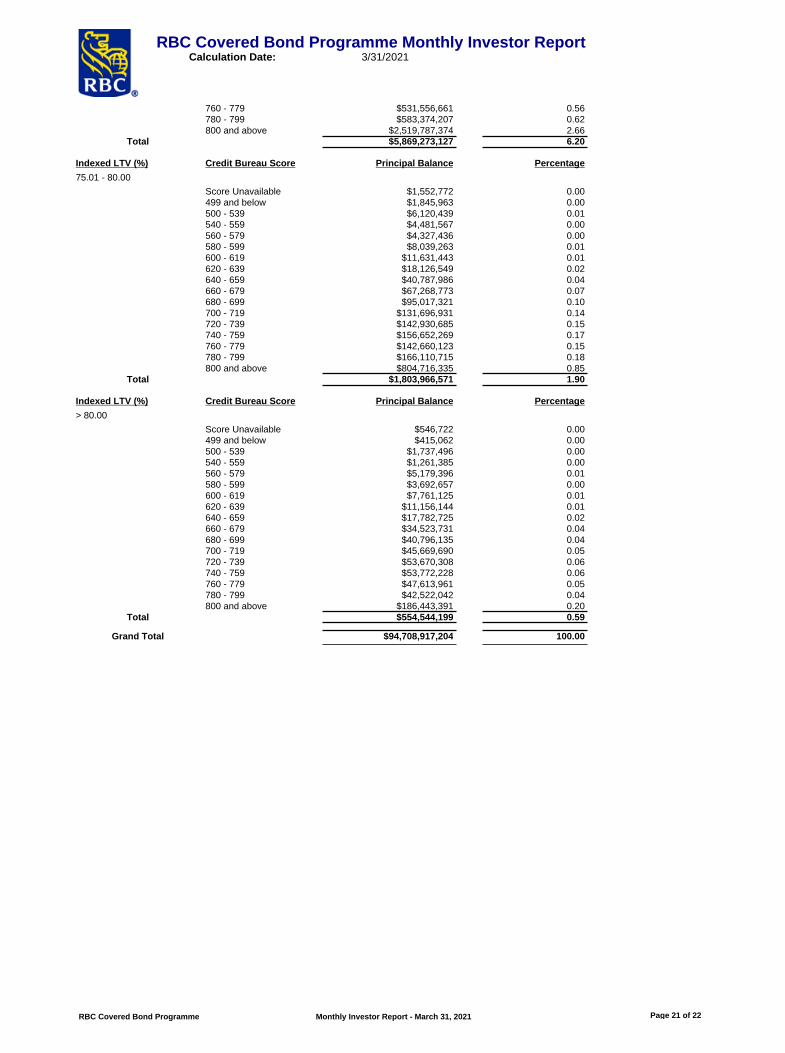
760 - 779 $531,556,661 0.56780 - 799 $583,374,207 0.62800 and above $2,519,787,374 2.66
Total $5,869,273,127 6.20
Indexed LTV (%) Credit Bureau Score Principal Balance Percentage
75.01 - 80.00
Score Unavailable $1,552,772 0.00499 and below $1,845,963 0.00500 - 539 $6,120,439 0.01540 - 559 $4,481,567 0.00560 - 579 $4,327,436 0.00580 - 599 $8,039,263 0.01600 - 619 $11,631,443 0.01620 - 639 $18,126,549 0.02640 - 659 $40,787,986 0.04660 - 679 $67,268,773 0.07680 - 699 $95,017,321 0.10700 - 719 $131,696,931 0.14720 - 739 $142,930,685 0.15740 - 759 $156,652,269 0.17760 - 779 $142,660,123 0.15780 - 799 $166,110,715 0.18800 and above $804,716,335 0.85
Total $1,803,966,571 1.90
Indexed LTV (%) Credit Bureau Score Principal Balance Percentage
> 80.00
Score Unavailable $546,722 0.00499 and below $415,062 0.00500 - 539 $1,737,496 0.00540 - 559 $1,261,385 0.00560 - 579 $5,179,396 0.01580 - 599 $3,692,657 0.00600 - 619 $7,761,125 0.01620 - 639 $11,156,144 0.01640 - 659 $17,782,725 0.02660 - 679 $34,523,731 0.04680 - 699 $40,796,135 0.04700 - 719 $45,669,690 0.05720 - 739 $53,670,308 0.06740 - 759 $53,772,228 0.06760 - 779 $47,613,961 0.05780 - 799 $42,522,042 0.04800 and above $186,443,391 0.20
Total $554,544,199 0.59
Grand Total $94,708,917,204 100.00
RBC Covered Bond Programme Monthly Investor Report - March 31, 2021 Page 21 of 22
RBC Covered Bond Programme Monthly Investor Report Calculation Date: 3/31/2021

RBC Covered Bond Programme Monthly Investor Report
Appendix
Housing Price Index Methodology
Indexation Methodology
The Market Value of the Properties used in calculating the Asset Coverage Test, the Valuation Calculation and the Amortization Test (except in respect of Calculation Dates prior to June 30, 2014) and for other purposes required by the Guide is adjusted, at least quarterly, for subsequent price developments with respect to the Property subject to the Related Security in respect of each such Loan by adjusting the Latest Valuation for such Property by a rate of change determined by the Index (as described below).
The Teranet-National Bank House Price Index™ Composite 11 (the Index) is an independently developed representation of monthly average home price changes in the following eleven Canadian metropolitan areas: Victoria, Vancouver, Calgary, Edmonton, Winnipeg, Hamilton, Toronto, Ottawa, Montréal, Québec and Halifax. These metropolitan areas are combined to form the Index. The Index is the weighted average of these eleven metropolitan areas.
Further details on the Index including a description of the method used to calculate the Index is available at www.housepriceIndex.ca
A three-step process is used to determine the Market Value for each Property subject to the Related Security in respect of a Loan. First, a code (the Forward Sortation Area (FSA)) which identifies the location of the Property is compared to corresponding codes maintained by Teranet Inc. to confirm whether the property is located within any of the 11 Canadian metropolitanareas covered by the Index. Second, to the extent an FSA match is not found, the name of the city in which such Property is located is used to confirm whether such city matches any of the Canadian metropolitan areas covered by the Index. The Market Value is then determined by adjusting the Latest Valuation for such Property, at least quarterly, by the rate of change for the corresponding Canadian metropolitan area, and where there is no corresponding Canadian metropolitan area, the rate of change indicated in the Index, from the date of the Latest Valuationto the date on which the Latest Valuation is being adjusted for purposes of determining the Market Value for such Property. Where the Latest Valuation in respect of such Property pre-dates the first available date for the relevant rate of change in the Index, the first available date for such rate of change is used to determine the rate of change to apply to adjust the Latest Valuation for purposes of determining the Market Value for such Property. Such adjusted Market Value is the adjusted Original Market Value referred to in footnote 2 on page 4 of the Investor Report.
The Issuer and the Guarantor LP may from time to time determine to use a different index or indices or a different indexation methodology to adjust the Latest Valuation for subsequent price developments to determine Market Value for example, to obtain rates of changes in home prices for metropolitan or geographic areas not covered by the Index, to use an index or indices that the Issuer and Guarantor LP believe will produce better or more reliable results or that is more cost effective. Any such change in the Index or Index Methodology used to determine Market Value will be disclosed to Covered Bondholders and made in accordance with the definition of "Market Value" and “Index Methodology” in the Master Definition and Construction Agreement and be required to meet the requirements in the Guide, which include the requirement that any such change may only be made (i) upon notice to CMHC and satisfaction of any other conditions specified by CMHC in relation thereto, (ii) if such change constitutes a material change, subject to Rating Agency Confirmation, and (iii) if such change is materially prejudicial to the Covered Bondholders, subject to the consent of the Bond Trustee. In addition, the Issuer is required, pursuant to the Guide, to provide CMHC notice upon becoming aware of any change or proposed change in the method used to calculate the Index.
No website referred to herein forms part of the Investor Report, nor have the contents of any such website been approved by or submitted to CMHC or any other governmental, securities or other regulatory authority.
Risk Factors relating to the Indexation Methodology
The Issuer and the Guarantor LP believe that the following factors, although not exhaustive, could be material for the purpose of assessing risks associated with the use of the Index. No recourse for errors in the data in the Index
The Issuer and the Guarantor LP have received written permission from the Index providers to use the Index. The data in the Index is provided on an “as is” basis and without any warranty as to the accuracy, completeness, non-infringement, originality, timeliness or any other characteristic of the data and the Index providers disclaim any and all liability with respect to such data. Neither the Issuer nor the Guarantor LP makes any representation or warranty, express or implied, in relation to the accuracy, completeness or reliability of such information or assumes any liability for any errors or reliance placed on such information. As a result, there will not be any recourse for investors, the Issuer or the Guarantor LP for any errors in the data in the Index relied upon to determine the Market Value in respect of any Property subject to the Related Security in respect of a Loan.
The actual rate of change in the value of a Property may differ from the rate of change used to adjust the Latest Valuation for such Property in determining its Market Value
The Index does not include a representation of changes in average home prices outside of the Canadian metropolitan areas that it covers and was developed as a representation of monthly average home price changes in the Canadian metropolitan areas that it does cover. While the Index uses data from single family properties, including detached, semi-detached, townhouse/row homes and condominium properties, it is being used to determine the Market Value of all Properties included as Related Security for Loans in the Covered Bond Portfolio, which may not correspond in every case to the categories included in the Index. The actual value of a Property subject to the Related Security in respect of each Loan may change at a rate that is greater than or less than the rate of change used to determine the Market Value for such Property. This discrepancy may be magnified when the Index is used to determine the Market Value for a Property outside of the Canadian metropolitan areas covered by the Index given factors that affect housing prices may vary significantly regionally from a national average or where the Index is used to determine Market Value for a Property in a category not covered by the Index and whose value is affected by factors that are different from those that affect the value of properties in the categories used by the Index. In addition, the methodology applied to produce the Index makes certain fundamental assumptions that impose difficulties in selecting or filtering the properties that are used to produce the Index due to a lack of information about the properties, which may result in such properties being excluded and may impact the accuracy of the representation of the rate of change in the Index.
The Index may not always be available in its current form or a different Index may be used to determine Market Value for a Property subject to Related Security in respect of a LoanThe Index providers may make a change to the method used to calculate the Index, the frequency with which the Index is published may change (such that the Index no longer meets the requirements in the Guide), or the Index may cease to be available to the Issuer and the Guarantor LP for determining the the Market Value of the Property subject to Related Security in respect of a Loan. In such circumstances, the Issuer and the Guarantor LP may or will need to select one or more new indices for determining Market Value of the Property subject to Related Security in respect of a Loan. The Issuer and the Guarantor LP may also determine at any time to use a different index or indices to adjust the Latest Valuation of the Property subject to Related Security in respect of a Loan for subsequent price developments to determine the Market Value of such Property, for example, to obtain rates of changes in home prices for metropolitan or geographic areas not covered by the Index, to use an index or indices that the Issuer and Guarantor LP believe will produce better or more reliable Market Value results or that is more cost effective. The use of any such new indices to adjust Latest Valuation could result in a significant change in the Market Value of the real property subject to the Related Security in respect of each Loan. See "Housing Price Index Methodology - Indexation Methodology".
RBC Covered Bond Programme Monthly Investor Report - March 31, 2021 Page 22 of 22