monthly investment compass 04-22-2016...
TRANSCRIPT

Monthly Investment Compass
Charting The Course Of The Markets
April 22nd, 2016

1
Monthly Investment CompassExecutive Summary: April 22nd 2016
• U.S. Stock Market: The most important takeaway from the latest data is that this is an important inflection point for the US stock market, as it negotiates major resistance in several key indexes, from which its next 1‐2 month trend is likely to begin. Risk/reward does not appear to be favorable for new longs at current levels due to a number of metrics/factors including major resistance in positive correlated crude oil prices, over‐extended bullish momentum, historically low put/call ratios, too‐bullish investor sentiment, extremely low volatility, and a 60‐year seasonal tendency for US stocks to peak for the entire 2nd Quarter this week. Bigger picture, however, we would view any pullback/correction from current levels as a potential intermediate term buying opportunity due to a number of factors including bullish chart pattern in the Dow Transportation Index (DJTA) and emerging strength in positively‐correlated markets in India and Japan.
• US Market Sectors: Our own asset flow and momentum based model is currently overweight Industrials (Apr 18th) and Materials (Feb 29th).
• US Interest Rates: Chart patterns in ETFs and in related futures contracts target an additional 4% rise in long dated US Treasury prices, which suggests that the 10‐Year Treasury Note should remain below 2.00% while retesting 1.71%‐1.63% later this quarter.
• Commodities: New major uptrends are emerging in base metals prices including copper.

US Stock MarketPrice & Trend (1): Key US Indexes Are Testing Formidable Overhead Resistance
2
The benchmark SPX is testing a formidable cluster of overhead resistance at 2082 to
2116, a logical place to look for a pullback/correction to potentially begin.
Meanwhile, the PHLX Semiconductor Index is testing and holding a similarly important cluster of resistance at 682 to 693. Semis typically lead the market.
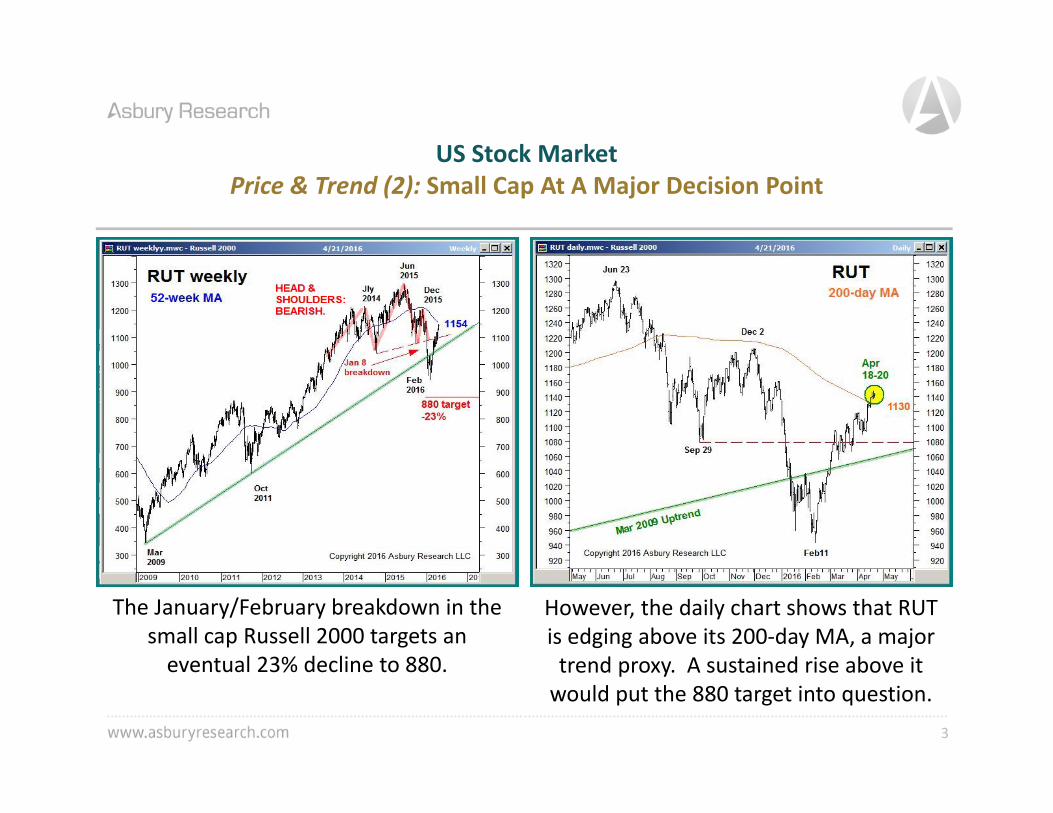
US Stock MarketPrice & Trend (2): Small Cap At A Major Decision Point
3
The January/February breakdown in the small cap Russell 2000 targets an eventual 23% decline to 880.
However, the daily chart shows that RUT is edging above its 200‐day MA, a major trend proxy. A sustained rise above it would put the 880 target into question.

US Stock MarketPrice & Trend (3): Dow Transports, Industrials Breaking Out Higher
4
The Dow Transports, which underperformed for much of 2015, appear to be making a major bullish trend change
by rising above their 200‐day MA.
Meanwhile, the Dow Industrials are breaking out higher from a year of investor
indecision. Above 17,300 the pattern targets a 14% rise to 20,400.

5
US Stock MarketIntermarket Analysis (1): WTI Crude Oil Testing Major Resistance Near $44.00
West Texas Intermediate crude oil has risen by 69% since testing major support in
February, but is now testing major overhead resistance at $43.39 to $44.53 per barrel.
The nearly lockstep positive correlation between WTI crude and the S&P 500 since January suggests that how oil reacts to this resistance is likely to influence near term
US broad market direction.

6
US Stock MarketIntermarket Analysis (2): 8‐Year Uptrend In India Indirectly Bullish For The US
This India stock index tested, held and aggressively rebounded from a March test of its 2008 uptrend line. SENSEX is positively correlated to the S&P 500.
More recently, SENSEX is challenging major overhead resistance at 25,840 to 26,469. A sustained rise above it would be indirectly bullish for the US market.

7
US Stock MarketIntermarket Analysis (3): Recent Strength In Japan Is Indirectly Bullish For The US
The Nikkei 225 rose above its 1996 secular downtrend line in Sep 2014, and in
February made a successful retest of that trend line as underlying support.
That February retest developed into a bullish pattern that targets an additional 17% rise to 19,800. The Nikkei 225 is positively correlated to the S&P 500.

US Stock MarketMomentum: Near Term Positive, Intermediate Term Negative
8
SPX’s 1‐month rate of change, a near termmetric, has been in positive (bullish) territory since Feb 16th. A negative shift would be necessary to signal a top.
However, the MACD, an intermediate termmetric, continues to warn that the S&P
500 is actually at or near a 1‐2 month top.

US Stock MarketETF Asset Flows: Turning Near Term Negative?
9
The total net assets invested in the SPDR S&P 500 ETF (SPY) began a monthly trend of expansion on Feb 11th, characteristic of
healthy near term uptrends.
Total net assets invested in the PowerShares QQQs, however, have edged below their 21‐
day MA as of Apr 21st, warning of an emerging trend of monthly contraction.

US Stock MarketCorporate Bond Spreads: Near Term Positive
10
The February 23rd trend of monthly narrowing in high yield corporate bond
spreads remains intact, and has historically coincided with US broad market strength.
Lessening credit/repayment risk according to the bond market is corroborated by the coincident trend of monthly narrowing in
BAA corporate bond spreads.

US Stock MarketOptions Volume: Near Term Negative
11
The CBOE Put/Call Ratio has reached a multi‐year least bearish extreme, indicating historically low put versus call volume, that has previously coincided with most of the
near term peaks in the S&P 500 in recent history.

12
US Stock MarketVolatility:Market Vulnerable To A 1‐2 Month Decline
A sustained rise above the VIX’s 50‐day MA, however, would be necessary to indicate that investors have collectively become fearful enough to fuel a market decline.
The CBOE Volatility Index moved to as low as 12.50 on April 20th. Previous declines into the 12.00 area have historically
coincided with or led US market peaks.

13
US Stock MarketInvestor Sentiment: Near Term Negative , Intermediate Term Positive
Meanwhile, a survey of stock market newsletter writers is reversing from an
historic least bullish extreme that suggests more intermediate term strength is ahead.
A survey of individual futures trader bullishness is hovering at a most bullishextreme on the S&P 500 that previously coincided with near termmarket tops.

US Stock MarketMarket Breadth: Near Term Negative, Intermediate Term Positive
14
The percentage of NYSE Composite stocks trading above their 40‐day MA is hovering at a
high extreme of 77% that has historically coincided with near term market peaks.
Meanwhile, the percentage of constituents trading above their 200‐day MA is rising from a February low extreme of 20% or less that has historically led intermediate term bottoms.

US Stock MarketOverbought/Oversold: Near Term Negative, Intermediate Term Positive
15
SPX is hovering at monthly overbought extremes that have previously coincided with or led every near term US broad market peak during the past year.
Meanwhile, SPX has recently rebounded from February quarterly oversold extremes that
have previously coincided with 5 intermediate term bottoms since 2008.

US Stock MarketSeasonality: Late April Strength Leads Into May Thru September Weakness
16
April is the seasonally strongest month of the year in the S&P 500, on average since 1957 closing 1.48% higher and posting a positive monthly close 69% of the time.
This chart, which plots quarterly seasonality via the same data, shows that the 3rd week of April is the strongest of the 2nd Quarter, after which the index
statistically declines into mid to late June.

The US Stock MarketSize: More Outperformance By Mid Cap? Large Cap Remains Vulnerable.
17
IJH is reversing from a quarterly oversold extreme vs. the S&P 1500 ETF (ITOT). Previous similar reversals led/coincided with relative outperformance by Mid Cap.
IVV is reversing from quarterly overbought extremes vs. ITOT. Previous similar
reversals led/coincided with periods of relative underperformance by Large Cap.

The US Stock MarketStyle: Quarterly Outperformance Trend Emerging In Value?
18
This chart suggests investor indecision following S&P 500 Value’s June 2014 trend of relative underperformance (and coincident outperformance by Growth), and a potential emerging trend of relative outperformance.

US Stock MarketAsbury Research’s Correction Protection Model: Be Invested and Protected
19
• Purpose & Key Features:•The model is a defensive hedge against market corrections and bear markets that can decimate investor portfolios.•The model utilizes 4 quantitative inputs.•The model uses the S&P 500 as a proxy for the market.•The model is binary: either in the market or out of it. There are no short positions, leveraged longs, or hedging via derivatives.•The model was designed to: 1) be in the market as much as possible, 3) exit on meaningful declines, and 4) quickly re‐enter as soon as a positive trend has been reestablished.•Since 2007, the model has been in the market 74% of the time•Since 2007, the model has averaged 4.1 signals per year or approximately 1 per quarter.

US Stock Market SectorsInvestor Assets Moving Into Technology & Utilities, Out Of Financials
20
Asbury’s sector rotation model is currently overweight Industrials
(Apr 18th) and Materials (Feb 29th).
The biggest ETF‐related sector inflowsover the past month went to Technology.
The biggest inflows over the past 3 months went to Utilities.
The biggest outflows over the past 1 month and 3 month periods came from
Financials.

US Stock Market SectorsMaterials, Energy Under‐Invested. Consumer Discretionary, Health Care Over‐Invested.
21
This chart shows the historic daily average distribution of assets invested in the original 9 Sector SPDR ETFs since the series began in
May 2006.
This chart shows the current distribution of these assets through April 15th. The most under‐invested sectors are 1) Materials ,
2) Energy and 3) Utilities.
The most over‐invested sectors are 1) Consumer Discretionary, 2) Health Care and
3) Consumer Staples.

US Interest RatesChart Pattern Warns Of A Decline Back To 1.71% ‐ 1.63% In 10‐Year Yields
22
An upcoming 4% rise in long dated Treasury prices implies that the 2.00% area will contain 10‐Year yields on the upside, and that they will
revisit the 1.71% to 1.63% area.
The February 1st resumption of the iShares 7‐10 Year Treasury Bond ETF’s 2013 advance targets an additional 4% rise to 114.00 that will remain valid above the 107.55 area.

CommoditiesEmerging Bullish Trend Change In Industrial Metals
23
A similar bullish trend change is emerging in the Global X Copper Miners ETF, which clears the way for an additional 15% rise to test the 2011
downtrend line at $18.34.
DBB’s recent rise above its 200‐day MA suggests an emerging major bullish trend change in base metals prices. A positive cross by the 50‐day MA would indicate a bullish change in momentum.

Contact Us:Phone: 1‐224‐569‐4112
Email: [email protected]
On The Web: http://asburyresearch.com/
Twitter:@asburyresearch