monthly hotel establishment report hotel... · 30 august, 2017 dear hotel partner, it gives me...
TRANSCRIPT

Monthly Hotel Establishment ReportJuly and YTD July, 2017

30 August, 2017
Dear Hotel Partner,
It gives me great pleasure to share with you highlights of July’s Hotel Establishments’ Performance
Report as part of our ongoing commitment to provide a continuous shared commentary.
Abu Dhabi sustained growth in hotel guest arrivals in July with almost 400,000 guests checking in to
the emirate’s 164 hotels and hotel apartments, representing a 4% increase over the same monthly
period in 2016. Accordingly, the cumulative guest arrivals for the first seven months of the year have
grown to reach over 2.6 million, maintaining a growth of 7% on the year.
July’s double-digit percentage growth in visitors from China, UK, and USA and the month’s UAE
visitor arrivals total of 138,000 are encouraging and compare favourably when adjusted to take into
account the Eid A Fitr boost contained in the July 2016 figures. India and Saudi Arabia continue to
perform well, but it is clear that pressure remains on the key metrics of Average Length of Stay,
Revenue Per Available Room and Occupancy.
All three regions – Abu Dhabi city, Al Ain and Al Dhafra – posted positive results, with the latter up
16% on the back of the hugely popular Liwa Date Festival. However, shorter stays in all three regions
has resulted in fewer total guest nights and lower spend. Though there is still additional ground to
cover, we have to consider that advances are being made against the backdrop of a destination
which has seen a 9% increase in hotel room inventory this year compared to last.
Tackling the challenges of declining length of stay and revenues remains a priority. We have
embarked on a strategy to leverage the increase in demand from regional visitors, specifically
targeting visitors from the Kingdom of Saudi Arabia. With a prevalence for longer summer stays in 4-
and 5-star hotels and superior quality hotel apartments, as well as a tendency to travel in larger
family groups, we anticipate an increased number of Saudis will be attracted by the emirate’s
summer offers and activities.
Over the coming months, we’ll also be extending our promotional activities overseas with
attendance at leading cruise, MICE and leisure events in Europe, USA and Asia, where your
continued support allows us to strengthen the emirate’s destination appeal to international
audiences.
Finally, following last month’s IPSOS report which stated that Abu Dhabi was named the second-best
city in the world to live, work and do business in, the emirate has now also been named the safest
city in the world by Numbeo, a website that curates and collates data to develop the largest user-
contributed database about cities and countries worldwide.
With international tourists ranking safety and security as a key decision making factor, Abu Dhabi is
well placed to benefit.
Yours sincerely,
Saif Saeed Ghobash
Director General, Abu Dhabi Tourism & Culture Authority

TABLE
OF
CONTENTS123
45
6
7
8
Monthly summary
Abu Dhabi Hotel Guests
Hospitality Performance
Hospitality Performance by Region
Hospitality Performance by Rating
YTD Monthly summary
YTD Abu Dhabi Hotel Guests
YTD Hospitality Performance
YTD Hospitality Performance by Region
YTD Hospitality Performance by Rating
Upcoming Events
TCA News
Glossary
9
10
11
12
12
13
14

Hotel Guests 396,548 4%
vs July 2016
Top 5 Nationalities
(Hotel Guests)
United Arab Emirates 138,273
China 27840
India 27,649
United Kingdom 18483 81%KSA 17308 2.22
280
Occupancy rate 63% -3%
2.34 -6%
Nights
162 -23%
AED
327 -11%
M AED
For description of the variables, please visit the glossary
Average length of stay
Revenue per available
room
Hotel revenues
ABU DHABI HOTEL
GUESTS
HOSPITALITY SECTOR
PERFORMANCE
MONTHLY
SUMMARYAbu Dhabi Emirate
July, 2017138,273
27,840
27,649
18,483
17,308
United Arab Emirates
China
India
United Kingdom
1

HOTEL GUESTS (thousands)
1 2 3 4 5 6 7 8 9 10 11 12
Jan Feb Mar Apr May Jun Jul Aug Sep Oct Nov Dec
397 353 414 437 364 307 397 - - - - -
369 340 406 379 390 243 383 379 397 354 382 417
HOTEL GUESTS BY NATIONALITY (thousands)
ALOS
1 United Arab Emirates 138 151 1.97
2 China 28 15 1.21 2.0
3 India 28 27 2.74
4 United Kingdom 18 14 3.28 1.2
5 Saudi Arabia 17 17 2.11
6 Philippines 15 20 1.66 2.7
7 Egypt 14 13 2.59
8 United States 12 10 3.87 3.3
9 Pakistan 10 10 2.06
10 Jordan 10 9 2.36 2.1
11 Other Nationalities 106 99 2.80
12 Total 396 383 2.34 1.7
2.6
3.9
2.1
287 -11% 2.4
519 -7% 2.2
2.3
For description of the variables, please visit the glossary
397 353 414 437 364 316 397 - - - - -
369340
406 379 390
243
383 379 397354
382417
Jan Feb Mar Apr May Jun Jul Aug Sep Oct Nov Dec
2017
2016
ABU DHABI HOTEL GUESTS
Other nationalities
Total
138
28
28
18
17
15
14
12
10
10
106
396
151
15
27
14
17
20
13
10
10
9
99
383
United Arab Emirates
China
India
Saudi Arabia
United Kingdom
United States
Egypt
Philippines
Germany
Jordan
Other Nationalities
Total
Chart Title 17-Jul 16-Jul
Other nationalities
Total
China
India
United Kingdom
United States
Egypt
Jordan
United Arab Emirates
2
Pakistan
Saudi Arabia
Philippines

HOSPITALITY
SECTOR PERFORMANCE
KEY INDICATORS
1 2 3 4 5 6 7 8 9 10 11 12
Jan Feb Mar Apr May Jun Jul Aug Sep Oct Nov Dec
500 527 506 520 408 273 327 - - - - -
563 530 624 556 510 322 369 367 425 446 648 570
1 2 3 4 5 6 7 8 9 10 11 12
Jan Feb Mar Apr May Jun Jul Aug Sep Oct Nov Dec
75% 77% 75% 76% 65% 52% 63% - - - - -
77% 77% 83% 77% 75% 54% 65% 70% 70% 73% 80% 75%
1 2 3 4 5 6 7 8 9 10 11 12
Jan Feb Mar Apr May Jun Jul Aug Sep Oct Nov Dec
2.70 2.75 2.60 2.50 2.55 2.39 2.34 -
2.82 2.80 2.84 2.73 2.64 2.86 2.48 2.67 2.48 2.82 2.78 2.68
1 2 3 4 5 6 7 8 9 10 11 12
287 Jan Feb Mar Apr May Jun Jul Aug Sep Oct Nov Dec
282 349 272 287 199 144 162 - - - - -
519 332 318 356 321 277 168 209 208 239 250 420 312
1 2 3 4 5 6 7 8 9 10 11 12
Jan Feb Mar Apr May Jun Jul Aug Sep Oct Nov Dec
373 451 361 377 307 277 257 - - - - -
432 411 430 416 369 310 323 297 342 345 525 416
1 2 3 4 5 6 7 8 9 10 11 12
Jan Feb Mar Apr May Jun Jul Aug Sep Oct Nov Dec
30.2 30.5 30.6 31.0 31.2 29.4 32.8 - - - - -
29.7 29.7 29.7 29.9 30.1 30.1 30.1 30.0 30.3 30.3 30.4 30.6
For description of the variables, please visit the glossary
500 527 506 520 408 291 327 - - - - -
563 530624 556 510
322 369 367 425 446
648570
2017 2016
2.70 2.75 2.60 2.50 2.55 2.35 2.34
2.82 2.80 2.84 2.73 2.64 2.862.48
2.672.48
2.82 2.78 2.68
- - - - -
282 349 272 287 199 150 162 - - - - -
332 318356
321277
168209 208 239 250
420
312
373 451 361 377 307 287 257 - - - - -
432 411 430 416369
310 323 297342 345
525416
30.2 30.5 30.6 31.0 31.2 29.4 32.8 - - - - -
29.7 29.7 29.7 29.9 30.1 30.1 30.1 30.0 30.3 30.3 30.4 30.6
Jan Feb Mar Apr May Jun Jul Aug Sep Oct Nov Dec
75% 77% 75% 76% 65% 52% 63% - - - - -
77% 77%83% 77% 75%
54%65% 70% 70% 73% 80% 75%
3

Actual Guest 349,203 3%
Guest nights 839,656 -1%
ALOS, days 2.40 -4%
Occupancy, % 64% 0%
Total revenues, M AED 293 -8%
ARR, AED 253 -19%
RevPAR, AED 163 -20%
Actual Guest 39,846 2%
Guest nights 72,538 -2%
ALOS, days 1.82 -4%
Occupancy, % 56% -14%Total revenues, M AED 25 -18%
ARR, AED 280 -24%
RevPAR, AED 156 -35%
Actual Guest 7,499 16%
Guest nights 16,308 -44%
ALOS, days 2.17 -52%
Occupancy, % 33% -50%
Total revenues, M AED 9 -54%
ARR, AED 421 -22%
RevPAR, AED 139 -61%
For description of the variables, please visit the glossary
HOSPITALITYSECTOR
PERFORMANCEKEY
INDICATORS BY REGION
Compared to July 2016
4
Al Dhafra Region
HOSPITALITY
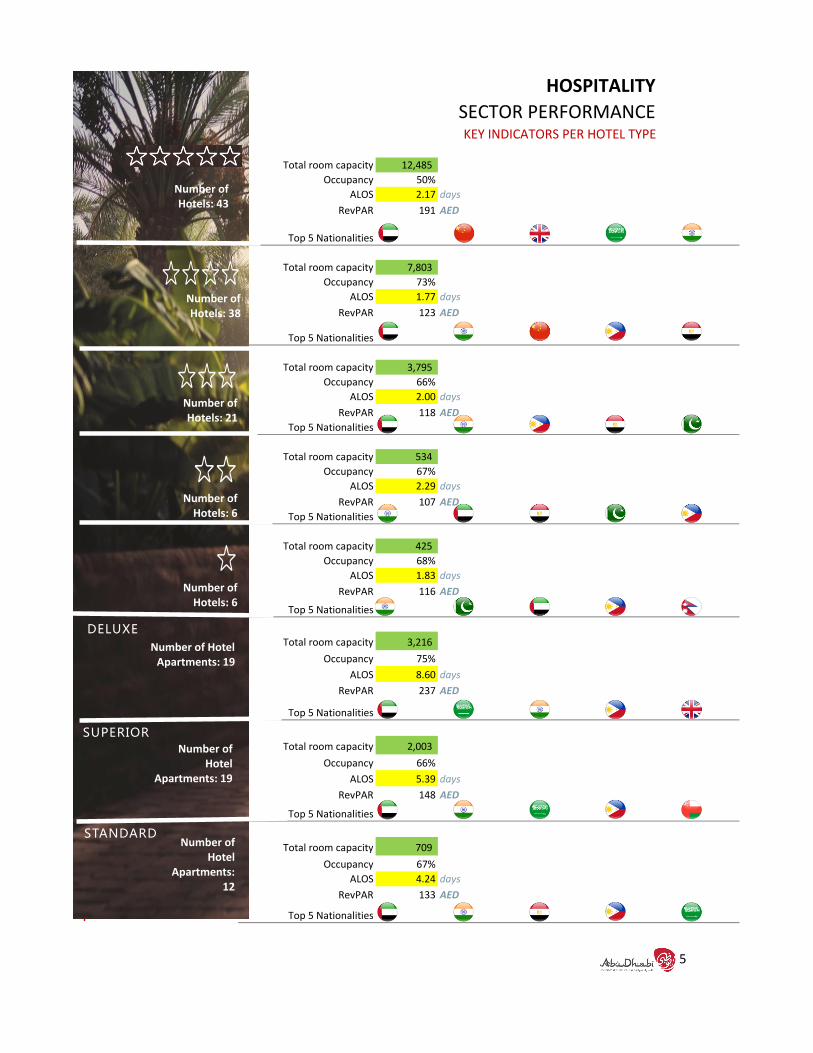
SECTOR PERFORMANCEKEY INDICATORS PER HOTEL TYPE
Total room capacity 12,485
Occupancy 50%
ALOS 2.17 days
Number of Hotels: 44 RevPAR 191 AED
Top 5 NationalitiesUnited Arab Emirates China United Kingdom United States India
Total room capacity 7,803
Occupancy 73%
ALOS 1.77 days
Number of Hotels: 37 RevPAR 123 AED
Top 5 Nationalities
Total room capacity 3,795
Occupancy 66%
ALOS 2.00 days
Number of Hotels: 24 RevPAR 118 AED
Top 5 Nationalities
Total room capacity 534
Occupancy 67%
ALOS 2.29 days
Number of Hotels: 7 RevPAR 107 AED
287 Top 5 Nationalities
Total room capacity 425
Occupancy 68%
ALOS 1.83 days
Number of Hotels: 7 RevPAR 116 AED
Top 5 Nationalities
DELUXE Total room capacity 3,216
Occupancy 75%
ALOS 8.60 days
Number of Hotel 21 RevPAR 237 AED
Apartments: Top 5 Nationalities
SUPERIOR Total room capacity 2,003
Occupancy 66%
ALOS 5.39 days
Number of Hotel 21 RevPAR 148 AED
Apartments: Top 5 Nationalities
STANDARD Total room capacity 709
Occupancy 67%
ALOS 4.24 days
Number of Hotel 16 RevPAR 133 AED
Apartments: Top 5 Nationalities
Number of Hotels: 43
Number of Hotels: 38
Number of Hotels: 21
Number of Hotels: 6
Number of Hotels: 6
DELUXE
Number of Hotel Apartments: 19
STANDARDNumber of
Hotel Apartments:
12
SUPERIORNumber of
Hotel Apartments: 19
5

Hotel Guests 2,677,953 7%
vs YTD July 2016
Top 5 Nationalities
321United Arab Emirates 839,941
China 213,381
India 192,333
United Kingdom 136,128 81%
Philippines 104,201 2.22
280
351
Occupancy rate 69% -5%
2.54 -7%
nights
242 -15%
AED
3.100 -11%
Billion AED
For description of the variables, please visit the glossary
Average length of stay
Revenue per available
room
Hotel revenues
ABU DHABI HOTEL
GUESTS
HOSPITALITY SECTOR
PERFORMANCE
MONTHLY
SUMMARYAbu Dhabi Emirate
YTD July, 2017839,941
213,381
192,333
136,128
104,201
1
2
3
4
5
6

HOTEL GUESTS
1 2 3 4 5 6 7 8 9 10 11 12
Jan Feb Mar Apr May Jun Jul Aug Sep Oct Nov Dec
397 749 1,164 1,601 1,965 2,272 2,678 - - - - -
369 709 1115 1494 1884 2127 2510 2889 3286 3641 4022 4440
414
321 -1%
HOTEL GUESTS BY NATIONALITY (Thousand)
ALOS
1 United Arab Emirates 840 836 2.09
2 China 213 134 1.35 2.1
3 India 192 179 2.77
4 United Kingdom 136 129 3.67 1.3
5 Philippines 104 101 1.79
6 Egypt 91 90 2.64 2.8
7 United States 89 83 3.73
8 Saudi Arabia 87 81 2.26 3.7
9 Germany 72 78 4.70
10 Jordan 64 64 2.51 1.8
11 Other Nationalities 790 735 2.88
12 Total 2,669 2,510 2.54 2.6
3.7
2.3
4.7
2.5
2.480 2.9
2.5
For description of the variables, please visit the glossary
213
192
136
104
91
89
87
72
64
134
179
129
101
90
83
81
78
64
United Arab Emirates
China
India
Saudi Arabia
United Kingdom
United States
Egypt
Philippines
Germany
Jordan
Other Nationalities
Total
Chart Title YTD 17-July YTD 16-July
Other nationalities
Total
397 749 1,164 1,601 1,965 2,272 2,678 - - - - -369
7091.115
1.4971.884
2.1272.510
2.8893.286
3.6414.022
4.440
Jan Feb Mar Apr May Jun Jul Aug Sep Oct Nov Dec
YTD 2017 YTD 2016
ABU DHABI HOTEL GUESTS
India
Saudi Arabia
United Kingdom
United States
Egypt
Philippines
Germany
Jordan
United Arab Emirates
7
Thousand
Million
2,678
2,510
840
836
790
735
China

HOSPITALITY SECTOR PERFORMANCE
1 2 3 4 5 6 7 8 9 10 11 12
Jan Feb Mar Apr May Jun Jul Aug Sep Oct Nov Dec
500 1,032 1,545 2,069 2,480 2,753 3,100 - - - - -
563 1,092 1,719 2,276 2,786 3,110 3,475 3,841 4,275 4,732 5,438 6,028
414
321 -1%
1 81% 3 4 5 7 8 9 10 11 12
Jan Feb Mar Apr May Jun Jul Aug Sep Oct Nov Dec
75% 76% 76% 76% 74% 70% 69% - - - - - -
77% 77% 79% 79% 78% 74% 73% 72% 72% 72% 73% 73%
351
1 2 3 4 5 6 7 8 9 10 11 12
Jan Feb Mar Apr May Jun Jul Aug Sep oct Nov Dec
2.70 2.72 2.68 2.63 2.62 2.58 2.54 - - - - -
2.82 2.81 2.82 2.80 2.77 2.78 2.73 2.72 2.69 2.71 2.71 2.71
351
1 2 3 4 5 6 7 8 9 10 11 12
Jan Feb Mar Apr May Jun Jul Aug Sep Oct Nov Dec
282 315 302 298 278 256 242 - - - - -
2.480 332 325 336 332 321 296 284 274 271 269 287 290
1 2 3 4 5 6 7 8 9 10 11 12
Jan Feb Mar Apr May Jun Jul Aug Sep Oct Nov Dec
373 413 397 392 377 365 351 - - - - -
432 421 425 423 412 401 391 379 376 374 394 397
79%
7.12
285
1 2 3 4 5 6 7 8 9 10 11 12
Jan Feb Mar Apr May Jun Jul Aug Sep Oct Nov Dec
30.2 30.3 30.4 30.4 30.6 30.4 30.9 - - - - -
29.5 29.5 29.5 29.5 29.6 29.5 29.7 29.6 29.7 29.7 29.7 29.8
500 1,032 1,545 2,069 2,480 2,753 3,096 - - - - -
5631,092
1,7192,276
2,786 3,1103,475
3,8414,275
4,7325,438 6,028
-
1,000
2,000
3,000
4,000
5,000
6,000
7,000
2.70 2.72 2.68 2.63 2.62 2.58 2.54
2.82 2.81 2.82 2.80 2.77 2.78 2.73 2.72 2.69 2.71 2.71 2.71
282 315 302 298 278 256 242 - - - - -
332 325 336 332 321 296 284 274 271 269 287 290
373 413 397 392 377 365 351 - - - - -
432 421 425 423 412 401 391 379 376 374 394 397
75% 76% 76% 76% 74% 70% 69% - - - - -
77% 77% 79% 79% 78% 74% 73% 72% 72% 72% 73% 73%
30.2 30.3 30.4 30.4 30.6 30.4 30.9 - - - - -
29.5 29.5 29.5 29.5 29.6 29.5 29.7 29.6 29.7 29.7 29.7 29.8
Jan Feb Mar Apr May Jun Jul Aug Sep Oct Nov Dec
Million
- - - - - - -

Actual Guest Arrivals 2,361,206 8%
Guest nights 6,154,000 0%
ALOS, days 2.61 -7%
Occupancy, % 71% -3%
Total revenues,M AED 2,790 -9%
ARR, AED 346 -9%
RevPAR, AED 245 -12%
Actual Guest Arrivals 243,353 0%
Guest nights 474,064 -3%
ALOS, days 1.95 -3%
Occupancy, % 58% -12%Total revenues, M AED 189 -14%
ARR, AED 325 -15%
RevPAR, AED 189 -25%
Actual Guest Arrivals 73,394 -1%
Guest nights 180,512 -20%
ALOS, days 2.46 -19%
Occupancy, % 49% -26%
Total revenues, M AED 122 -32%
ARR, AED 554 -17%
RevPAR, AED 269 -38%
2.480
For description of the variables, please visit the glossary
HOSPITALITYSECTOR
PERFORMANCEKEY
INDICATORS BY REGION
Compared to YTD July 2016
9
Al Dhafra Region
HOSPITALITY
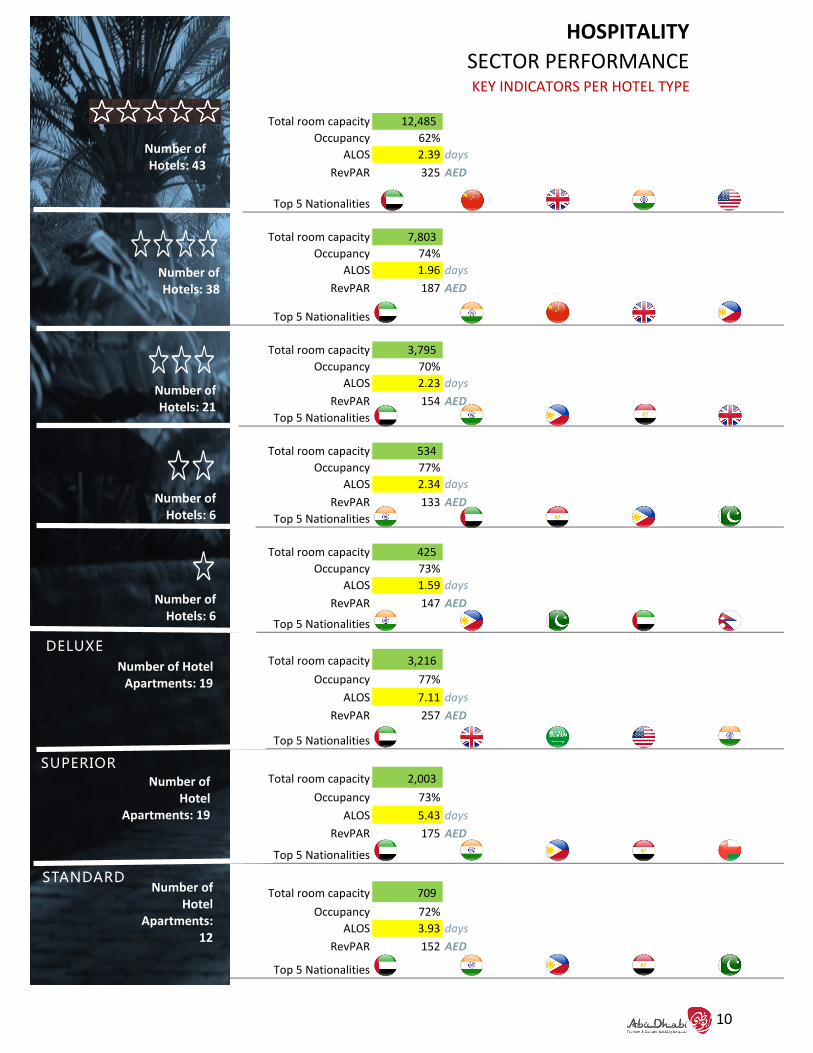
SECTOR PERFORMANCEKEY INDICATORS PER HOTEL TYPE
Total room capacity 12,485
Occupancy 62%
ALOS 2.39 days
Number of Hotels: 44 RevPAR 325 AED
414 Top 5 NationalitiesUnited Arab Emirates China United Kingdom United States India
Total room capacity 7,803
Occupancy 74%
ALOS 1.96 days
Number of Hotels: 37 RevPAR 187 AED
Top 5 Nationalities
351
Total room capacity 3,795
Occupancy 70%
ALOS 2.23 days
Number of Hotels: 24 RevPAR 154 AED
Top 5 Nationalities
Total room capacity 534
Occupancy 77%
ALOS 2.34 days
Number of Hotels: 7 RevPAR 133 AED
Top 5 Nationalities
Total room capacity 425
Occupancy 73%
ALOS 1.59 days
Number of Hotels: 7 RevPAR 147 AED
Top 5 Nationalities
DELUXE Total room capacity 3,216
Occupancy 77%
ALOS 7.11 days
Number of Hotel 21 RevPAR 257 AED
Apartments: Top 5 Nationalities
SUPERIOR Total room capacity 2,003
Occupancy 73%
ALOS 5.43 days
Number of Hotel 21 RevPAR 175 AED
Apartments: Top 5 Nationalities
STANDARD Total room capacity 709
Occupancy 72%
ALOS 3.93 days
Number of Hotel 16 RevPAR 152 AED
Apartments: Top 5 Nationalities
Number of Hotels: 43
Number of Hotels: 38
Number of Hotels: 21
Number of Hotels: 6
Number of Hotels: 6
DELUXE
Number of Hotel Apartments: 19
STANDARDNumber of
Hotel Apartments:
12
SUPERIORNumber of
Hotel Apartments: 19
10

UPCOMINGEVENTS
Oct2017
Sep2017
Sunday Monday Tuesday Wednesday Thursday Friday Saturday
Sunday Monday Tuesday Wednesday Thursday Friday Saturday
2 31 4
9 108 11
5 6 7
20 21
22
12
15
13 14
16 17 18
27 2826
29
23 24 25
19
30
2
3
1
4 9
10
8
11
5 6 7
16
17
15
18
12 13 14
23
24
22
25
19 20 21
2627 28 3029
11
Start daySep 12 to Sep 16, 2017
Abu DhabiThe International Festival of Falconry
Promote the Active Involvement of Men in Family life Program2017
Abu Dhabi
300m Sniper Rifle Competition
Abu Dhabi
Abu Dhabi International Hunting and Equestrian Exhibition 2017
Start daySep 4 to Sep 9,2017
Start daySep 1 to Sep 30,2017
Abu Dhabi
31
Abu Dhabi Junior Aquathlon 1
Abu DhabiTop Archer Competition
Abu Dhabi
Yas Marina Boat Festival
ADCB ZSC Pink 5&10k Run
Abu Dhabi
Abu Dhabi
World Skills Abu Dhabi 2017
Abu Dhabi
Smart Business Expo & India Trade Expo
Abu Dhabi

TCA ABU DHABI NEWS
Abu Dhabi Art 2017 will return this November with 48 established and
emerging galleries from 18 different countries, offering works by a diverse range ofglobally celebrated and up and coming artists. Running from November 8 – 11, the fairwill feature galleries from Europe, Asia, North America and the Middle East and will seethe introduction of a new curated section by Dr. Omar Kholeif entitled Focus: BeyondTerritory. In addition to the gallery programme, Abu Dhabi Art 2017 will present aseries of stimulating cultural talks on local and GCC-wide art histories and narratives
Abu Dhabi has been named the second-best cityin the world to live, work and do business in,overtaking both London and Paris and moving up
two places since the last Ipsos City Index.
More than 18,000 people, aged between 16 and64, in 26 countries worldwide were interviewedfor the Index, with New York maintaining theoverall world number one spot. The leadingdestinations were chosen from an overall list ofsixty cities, including major hubs like Sydney,Hong Kong, Cape Town, Moscow, Toronto, andmany more.
TCA Abu Dhabi embarked on a whirlwind three-city
United States roadshow recently to help
create more awareness about the emirate andencourage even more US visitors to experience thedestination. The delegation visited New York, Chicagoand Los Angeles, hosted meetings with major travelagents and key influencers from some of the US’sleading travel organisations including Altour, AmericanExpress Travel, BCD Travel, Omega World Travel,Signature and Virtuoso.
Meanwhile, to coincide with Manchester City FootballClub’s pre-season tour, a season-long campaign‘Extraordinary City Story’ partnership was launched withManchester City Football Club that which gives fans thechance to create their own extraordinary story on a tripto the UAE capital by sharing their own extraordinarymemories and stories about being a Manchester Cityfan.
Abu Dhabi welcomed more than2.25 million guests in the first six months
of 2017 – an increase of 7% over the first half oflast year. Abu Dhabi recorded a remarkable 30%increase in the number of hotel guest arrivalsthis June, compared to the same month in 2016,boosted by an exceptional Eid Al Fitr period,which saw many premium hotels fully booked.
1211
11

GLOSSARY
13
Disclaimer:All rights reserved. Report content is based on available information at the time of publishing and is subject to change without notice when more accurate or complete data is available
Guest arrivalsNumber of registered guest arrivals (check-ins) including those who occupied complimentary or non-revenue generating rooms either for day-stay or overnight stay
Guest nightsNumber of night guests spent in the hotel regardless of the type of rooms they occupy
Available rooms
Number of rooms available during the month covered by the report excluding out-of-order (a room status term indicating that a room is scheduled for maintenance, refurbishment, deep cleaning, etc.,)
Occupied roomsNumber of rooms used daily, including complimentary and house use
Average Length of StayALOS
Average number of nights guests spent in a single stay, calculated by dividing guest nights by guest arrivals
Total revenuesRevenue generated by hotels from all their operations, including service charge and taxes
Average room (daily) rateARR/ADR
A ratio that indicates average room rate and to what extent rooms are being up-sold or discounted; calculated by dividing room revenue by the number of occupied rooms.(Note: Based on paid rooms only, excluding complimentary and house use but service charge)
Revenue per available roomRevPAR
Revenue per Available rooms, calculated by dividing the total revenues by total rooms in hotel minus out-of-service rooms
Occupancy rate, %Occupancy is the percentage of available rooms that are occupied, calculated by dividing the number of occupied rooms by the available rooms