monthly fiscal highlights - may 2015
TRANSCRIPT
JLBC - Monthly Fiscal Highlights May 2015
Summary
Table of Contents
1716 W. Adams Phoenix, AZ 85007 Phone: (602) 926-5491 Fax: (602) 926-5416
www.azleg.gov/jlbc.htm
This report has been prepared for the Arizona Legislature by the Joint Legislative Budget Committee Staff on May 20, 2015.
April General Fund revenue totaled $1.05 billion, which was a 23.4% increase above April 2014. April collections were $145.4 million above the enacted budget forecast. The growth was fueled by a $148.9 million, or 37.7%, rise in individual income tax collections. There are 2 likely reasons for this spike: • Higher stock market capital gains and
dividend payments • The “low” FY 2014 capital gains base
associated with the federal “fiscal cliff” at the beginning of calendar year 2013.
The JLBC Staff reported more extensively on these issues in its May 4 report on April Income Tax Collections. While the final April overall results generally mirror the May 4 findings, the Department of Revenue (DOR) did make some adjustments to its earlier estimates. For example, Corporate Income Tax (CIT) collections were originally reported to have grown by 43% to $126 million. In the final numbers, CIT collections actually declined by (5.6)% to $83.2 million. Due to technical DOR accounting issues, however, the April numbers were understated by $23 million and the state will pick up the difference in May. The state’s single largest revenue and most stable revenue source, the sales tax, did not play a significant role in the April results. Growth remained very moderate in April. Sales Tax collections rose by 4.0% over the prior year and were $3.8 million above forecast.
“Compared to
the enacted
budget,
overall
[FY 2015]
collections are
$233.1 million
above
forecast.”
Summary
• State Credit Rating ............................................. 2
April Revenues ........................................................ 2
Monthly Indicators .................................................. 5
Summary of Recent Agency Reports
• DCS – Ofc. of Child Welfare Investigations .... 8
• DCS – Performance Benchmarks ..................... 8
• ACA – Healthy Forest Program ......................... 9
• ADE – Budget Status Report ............................. 9
• DEQ – E-Licensing Project ................................. 9
• DPS – Quarterly GIITEM Fund Report ............... 9
April Spending ....................................................... 10
Tracking Arizona’s Recovery ............ Appendix A
Year-to-date base revenues (excluding Urban Revenue Sharing and one-time transfers) are 7.1% above last year through April. Compared to the enacted budget, overall collections are $233.1 million above forecast. By the end of the fiscal year, this estimate will likely change further. For example, May month-to-date CIT revenues are higher than anticipated. Other factors may work in the opposite direction. Due to processing issues, there are more individual income tax refunds in the pipeline than in prior years, which could reduce some of the April gains. If sustained for the entire year, the year-to-date $233.1 million overage would offset the forecasted FY 2015 budget shortfall of $(132) million. The enacted budget required this shortfall to be covered by a transfer from the Budget Stabilization Fund (the Rainy Day Fund). As a result, a BSF transfer would not be required if current trends hold. Any assessment of the sustainability of the unexpected FY 2015 revenue gains will depend on further analysis once the fiscal year ends. Capital gain income tax collections have been very volatile over time, which creates a challenge in determining the ongoing nature of the FY 2015 returns. The state’s fiscal health can also be measured by the operating fund balance. The state pays its bills out of the operating

2 JLBC – MONTHLY FISCAL HIGHLIGHTS – MAY 2015
Summary (Continued)
fund balance, which consists of the General Fund and certain dedicated funds. The operating balance as of mid-April 2015 is $2.10 billion. In addition, the state’s Budget Stabilization Fund has a balance of $457.1 million. State Credit Rating On May 4, 2015, Moody’s Investor Service upgraded Arizona’s credit rating from Aa3 with a positive outlook to Aa2 with a stable outlook. Aa2 is the third highest rating out of 10 possible levels. In comparison to other states, 25 states have a higher rating, 9 states have a similar rating, and 15 states have a lower rating or are not rated due to a lack of state level debt. In adopting the new credit rating for Arizona, Moody’s listed some of the following positive trends: 1) budget actions to eliminate the state’s structural shortfall; 2)
improved economic conditions; and 3) below average debt and pension liabilities amongst states. Even with the ratings upgrade, Moody’s did note several concerns regarding the state’s current financial condition: 1) ongoing K-12 litigation; 2) extremely narrow budget reserves; 3) absence of authority for mid-year reductions; and 4) reduced financial flexibility due to restrictions enacted by Proposition 105 and Proposition 108. The other major credit rating agency, Standard & Poor’s, has not updated its credit rating for Arizona since November 2013. S&P’s credit rating for Arizona is AA- (the 4th highest rating level) with a positive outlook.
April Revenues
Table 1 General Fund Revenues ($ in Millions)
FY 2015 Collections
Difference From Budget Forecast
Difference From FY 2014
April $ 1,049.1 $ 145.4 $ 198.7 Year-to-Date $ 7,215.7 $ 233.1 $ 398.1
calendar year. Under this legislation, service contractors that do work related to maintenance, repair or replacement of existing property are exempt from the prime contracting tax, beginning January 1, 2015. Instead, such contractors are now required to pay the retail transaction privilege tax on materials that they purchase as a part of the service contract. Use tax collections decreased by (11.6)% in April and are up by 22.5% for the first 10 months of FY 2015. After a technical adjustment, however, the underlying year-to-date growth rate would be 1.6%.
Table 2 Sales Tax Growth Rates Compared to Prior Year
April YTD Retail 11.7% 4.9% Contracting (16.4)% (2.8)% Use (11.6)% 22.5% Restaurant & Bar 3.2% 8.5% Utilities (0.9)% (0.3)%
Sales Tax collections of $373.0 million were 4.0% above April of last year and $3.8 million above the forecast for the month. Year to date, collections have increased by 4.2% and are $25.6 million above forecast. April collections reflect March transactions. Table 2 includes the major categories of the state’s sales tax, which together account for approximately 90% of total collections. The retail category, which makes up roughly half of sales tax collections, increased by 11.7% in April compared to the same month in the prior year. Year to date, retail collections are up by 4.9%. Due to technical adjustments, however, this figure understates the underlying growth rate of 6.7%. Year over year, collections from contracting activity declined by (16.4)% in April. Year to date, contracting collections are down by (2.8)%. As noted in previous editions of the Monthly Fiscal Highlights, some of the retail increase and the contracting reduction may be related to a new law that went into effect at the beginning of the current
3 JLBC – MONTHLY FISCAL HIGHLIGHTS – MAY 2015
April Revenues (Continued)
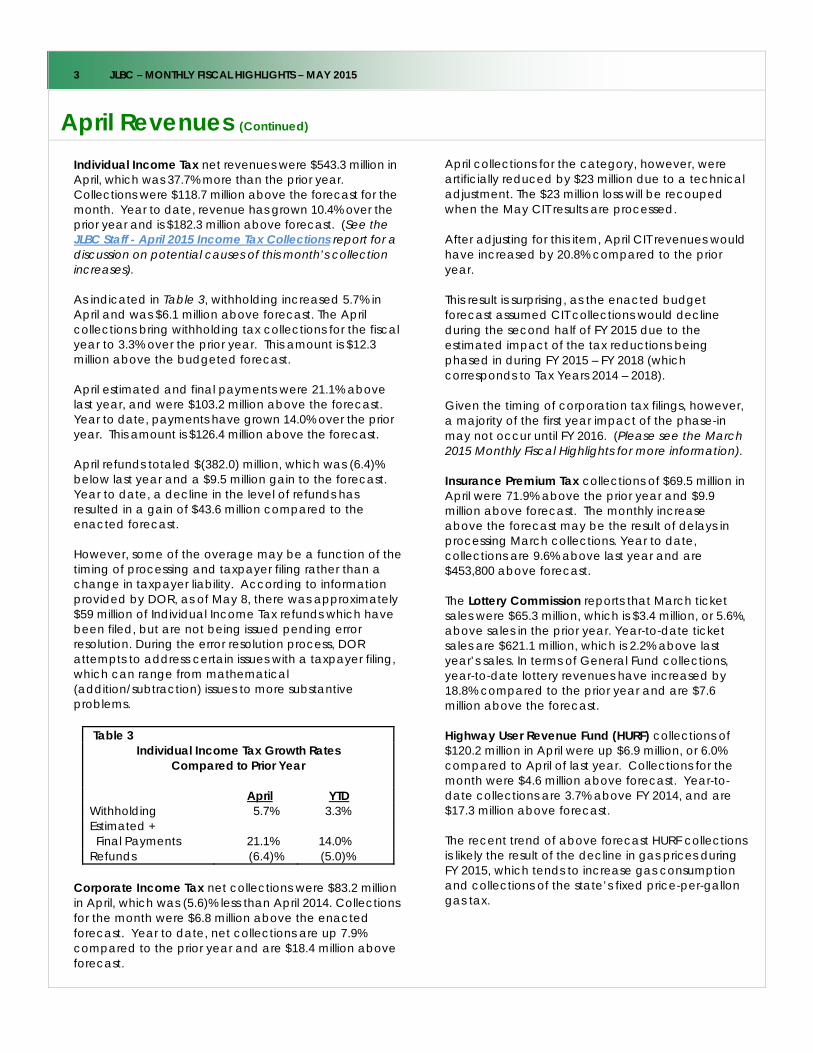
Individual Income Tax net revenues were $543.3 million in April, which was 37.7% more than the prior year. Collections were $118.7 million above the forecast for the month. Year to date, revenue has grown 10.4% over the prior year and is $182.3 million above forecast. (See the JLBC Staff - April 2015 Income Tax Collections report for a discussion on potential causes of this month’s collection increases). As indicated in Table 3, withholding increased 5.7% in April and was $6.1 million above forecast. The April collections bring withholding tax collections for the fiscal year to 3.3% over the prior year. This amount is $12.3 million above the budgeted forecast. April estimated and final payments were 21.1% above last year, and were $103.2 million above the forecast. Year to date, payments have grown 14.0% over the prior year. This amount is $126.4 million above the forecast. April refunds totaled $(382.0) million, which was (6.4)% below last year and a $9.5 million gain to the forecast. Year to date, a decline in the level of refunds has resulted in a gain of $43.6 million compared to the enacted forecast. However, some of the overage may be a function of the timing of processing and taxpayer filing rather than a change in taxpayer liability. According to information provided by DOR, as of May 8, there was approximately $59 million of Individual Income Tax refunds which have been filed, but are not being issued pending error resolution. During the error resolution process, DOR attempts to address certain issues with a taxpayer filing, which can range from mathematical (addition/subtraction) issues to more substantive problems.
Table 3 Individual Income Tax Growth Rates
Compared to Prior Year April YTD Withholding 5.7% 3.3% Estimated + Final Payments 21.1% 14.0% Refunds (6.4)% (5.0)%
Corporate Income Tax net collections were $83.2 million in April, which was (5.6)% less than April 2014. Collections for the month were $6.8 million above the enacted forecast. Year to date, net collections are up 7.9% compared to the prior year and are $18.4 million above forecast.
April collections for the category, however, were artificially reduced by $23 million due to a technical adjustment. The $23 million loss will be recouped when the May CIT results are processed. After adjusting for this item, April CIT revenues would have increased by 20.8% compared to the prior year. This result is surprising, as the enacted budget forecast assumed CIT collections would decline during the second half of FY 2015 due to the estimated impact of the tax reductions being phased in during FY 2015 – FY 2018 (which corresponds to Tax Years 2014 – 2018). Given the timing of corporation tax filings, however, a majority of the first year impact of the phase-in may not occur until FY 2016. (Please see the March 2015 Monthly Fiscal Highlights for more information). Insurance Premium Tax collections of $69.5 million in April were 71.9% above the prior year and $9.9 million above forecast. The monthly increase above the forecast may be the result of delays in processing March collections. Year to date, collections are 9.6% above last year and are $453,800 above forecast. The Lottery Commission reports that March ticket sales were $65.3 million, which is $3.4 million, or 5.6%, above sales in the prior year. Year-to-date ticket sales are $621.1 million, which is 2.2% above last year’s sales. In terms of General Fund collections, year-to-date lottery revenues have increased by 18.8% compared to the prior year and are $7.6 million above the forecast. Highway User Revenue Fund (HURF) collections of $120.2 million in April were up $6.9 million, or 6.0% compared to April of last year. Collections for the month were $4.6 million above forecast. Year-to-date collections are 3.7% above FY 2014, and are $17.3 million above forecast. The recent trend of above forecast HURF collections is likely the result of the decline in gas prices during FY 2015, which tends to increase gas consumption and collections of the state’s fixed price-per-gallon gas tax.
4
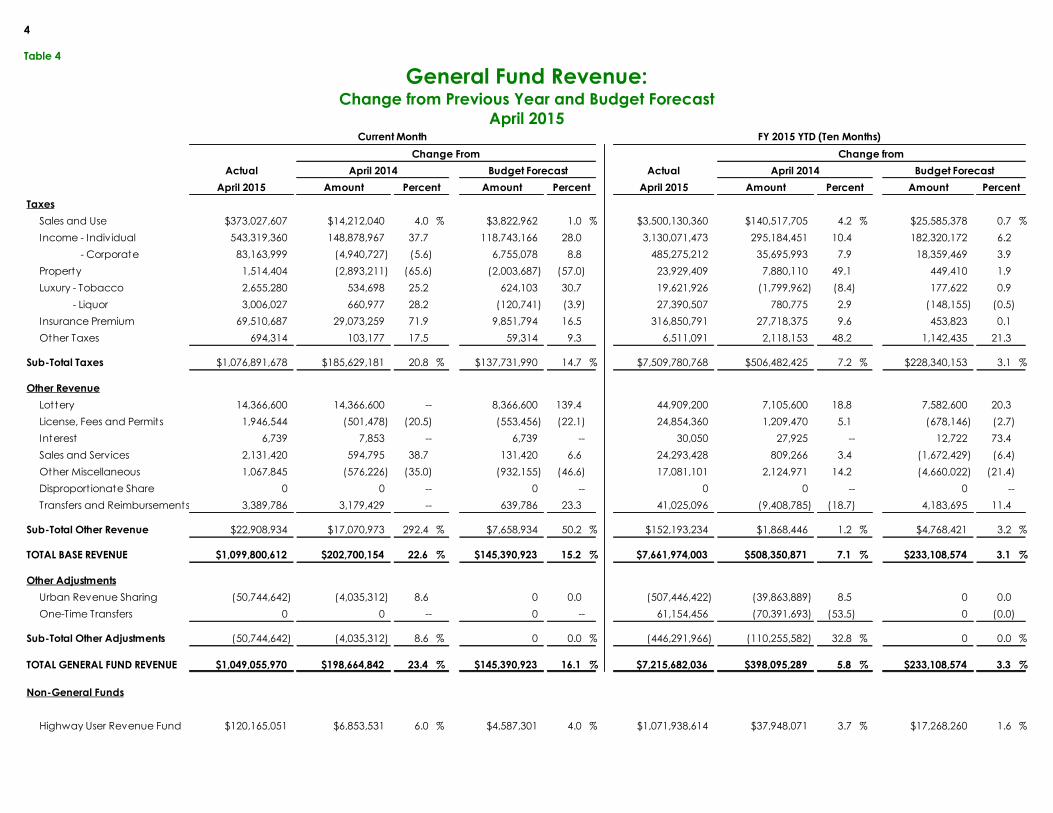
Table 4
General Fund Revenue: Change from Previous Year and Budget Forecast
April 2015
Actual Actual
April 2015 Amount Amount April 2015 Amount Amount
Taxes
Sales and Use $373,027,607 $14,212,040 4.0 % $3,822,962 1.0 % $3,500,130,360 $140,517,705 4.2 % $25,585,378 0.7 %
Income - Individual 543,319,360 148,878,967 37.7 118,743,166 28.0 3,130,071,473 295,184,451 10.4 182,320,172 6.2
- Corporate 83,163,999 (4,940,727) (5.6) 6,755,078 8.8 485,275,212 35,695,993 7.9 18,359,469 3.9
Property 1,514,404 (2,893,211) (65.6) (2,003,687) (57.0) 23,929,409 7,880,110 49.1 449,410 1.9
Luxury - Tobacco 2,655,280 534,698 25.2 624,103 30.7 19,621,926 (1,799,962) (8.4) 177,622 0.9
- Liquor 3,006,027 660,977 28.2 (120,741) (3.9) 27,390,507 780,775 2.9 (148,155) (0.5)
Insurance Premium 69,510,687 29,073,259 71.9 9,851,794 16.5 316,850,791 27,718,375 9.6 453,823 0.1
Other Taxes 694,314 103,177 17.5 59,314 9.3 6,511,091 2,118,153 48.2 1,142,435 21.3
Sub-Total Taxes $1,076,891,678 $185,629,181 20.8 % $137,731,990 14.7 % $7,509,780,768 $506,482,425 7.2 % $228,340,153 3.1 %
Other Revenue
Lottery 14,366,600 14,366,600 -- 8,366,600 139.4 44,909,200 7,105,600 18.8 7,582,600 20.3
License, Fees and Permits 1,946,544 (501,478) (20.5) (553,456) (22.1) 24,854,360 1,209,470 5.1 (678,146) (2.7)
Interest 6,739 7,853 -- 6,739 -- 30,050 27,925 -- 12,722 73.4
Sales and Services 2,131,420 594,795 38.7 131,420 6.6 24,293,428 809,266 3.4 (1,672,429) (6.4)
Other Miscellaneous 1,067,845 (576,226) (35.0) (932,155) (46.6) 17,081,101 2,124,971 14.2 (4,660,022) (21.4)
Disproport ionate Share 0 0 -- 0 -- 0 0 -- 0 --
Transfers and Reimbursements 3,389,786 3,179,429 -- 639,786 23.3 41,025,096 (9,408,785) (18.7) 4,183,695 11.4
Sub-Total Other Revenue $22,908,934 $17,070,973 292.4 % $7,658,934 50.2 % $152,193,234 $1,868,446 1.2 % $4,768,421 3.2 %
TOTAL BASE REVENUE $1,099,800,612 $202,700,154 22.6 % $145,390,923 15.2 % $7,661,974,003 $508,350,871 7.1 % $233,108,574 3.1 %
Other Adjustments
Urban Revenue Sharing (50,744,642) (4,035,312) 8.6 0 0.0 (507,446,422) (39,863,889) 8.5 0 0.0
One-Time Transfers 0 0 -- 0 -- 61,154,456 (70,391,693) (53.5) 0 (0.0)
Sub-Total Other Adjustments (50,744,642) (4,035,312) 8.6 % 0 0.0 % (446,291,966) (110,255,582) 32.8 % 0 0.0 %
TOTAL GENERAL FUND REVENUE $1,049,055,970 $198,664,842 23.4 % $145,390,923 16.1 % $7,215,682,036 $398,095,289 5.8 % $233,108,574 3.3 %
Non-General Funds
Highway User Revenue Fund $120,165,051 $6,853,531 6.0 % $4,587,301 4.0 % $1,071,938,614 $37,948,071 3.7 % $17,268,260 1.6 %
April 2014 Budget Forecast April 2014 Budget Forecast
Percent Percent Percent Percent
Current Month FY 2015 YTD (Ten Months)
Change From Change from

5 JLBC – MONTHLY FISCAL HIGHLIGHTS – MAY 2015
Monthly Indicators
NATIONAL According to the U.S. Department of Commerce Bureau of Economic Analysis, the U.S. Real Gross Domestic Product (GDP) increased at an annual rate of 0.2% in the first quarter of 2015. This estimate is a sharp deceleration from the 2.2% and 5.0% growth third and fourth quarters of 2014, respectively. The decrease relative to the prior quarter’s growth was primarily due to worsening of the trade deficit and decreases in nonresidential fixed investment and state and local government spending. Economists cite cold weather, disruptions at west coast docks and a drop in oil and gas drilling as the main drivers behind the numbers. The Conference Board’s U.S. Consumer Confidence Index decreased by (6.1)% to 95.2 in April. The April decrease included widespread decreases in the index’s sub-components, but was most negatively impacted by a loss in optimism of job prospects. With year-over-year growth of 16.5% though, the index still stands well above its April 2014 level. The Conference Board’s U.S. Leading Economic Index increased by 0.2% in March and 5.2% since March 2014. Of the index’s 10 components, 7 made positive contributions during the month. Movement in interest rates and reduced initial unemployment claims were the largest positive contributors to the index while building permits were a negative influence. Improvement in building permits for single-family units was more than offset by a drop in permits for multi-family units. According to the U.S. Department of Commerce Bureau of Economic Analysis, the U.S. Personal Consumption Expenditure Price Index (PCEPI) increased by 0.2% in March from the prior month. The index’s annual growth stands at 0.3%, which is well below the Federal Reserve Bank’s 2% annual inflation target. While a (18.5)% year-over-year decrease in energy prices has drastically reduced the overall index, the year-over-year growth in the core index (all items except food and energy) stands at 1.3% in March.
ARIZONA The Federal Reserve Bank of Philadelphia’s coincident index gauges current economic activity in each state. The index combines 4 indicators: employment, average hours worked in manufacturing, unemployment rate, and inflation-adjusted wages.
Arizona’s coincident index increased by 3.4% compared to March 2014. Over the same time period, the U.S. coincident index also increased by 3.4%. Currently, Arizona’s rate of annual coincident index growth is 24th in the nation. Last year at this time, Arizona’s rate was 38th highest among states. See Appendix A – Tracking Arizona’s Recovery for additional historical information. Housing The total housing inventory in the Greater Phoenix area is (12.6)% smaller than April of last year. Inventory levels have been steadily decreasing since March of last year. The median price of a single family home was $222,228 in April, a 2.4% increase from March. The price is 10.6% higher than April of last year. Single family housing construction appears to have stabilized, while multi-family construction may have peaked. Arizona’s 12-month total of single-family building permits is 18,078, or 0.5% more than a year ago. The comparable single-family permit growth rate for the entire U.S. is 2.6% above last year. See Appendix A – Tracking Arizona’s Recovery for historical information. In contrast, the 12-month total of multi-family building permits had been increasing strongly compared to last year, but may reached its peak. Arizona’s total of 8,979 multi-family building permits is 15.9% above 2014. Arizona’s rate of increase is still somewhat greater than the comparable multi-family permit growth for the U.S. as a whole which is 7.8% above 2014. Employment In March, the Average Weekly Hours worked by individuals in Arizona’s private sector was 34.9 hours. This workload is (0.9)% below the March 2014 level. The Average Hourly Earnings received by these private sector workers was $22.97, which is (0.2)% below the average in the prior month. The year-over-year growth rate continued to recover somewhat from (1.8)% in January to reach (0.6)% in March. The average hourly earnings nationwide in April 2015 were 2.2% above the average from a year prior. The U.S. Bureau of Labor Statistics releases estimates quarterly for a broader measure of labor underutilization called the total unemployment rate. Besides the “regularly” unemployed, the measure also includes persons who are available to work but stopped looking for a job (“discouraged workers”), and persons who had to settle for part-time employment (“underemployed workers”). The Arizona rate

6 JLBC – MONTHLY FISCAL HIGHLIGHTS – MAY 2015
Monthly Indicators (Continued)
averaged 14.3% for the second quarter of 2014 through the first quarter of 2015. This rate is (0.3)% below the average rate during 2014. The state’s total unemployment rate reading of 14.3% was the third highest of any state. The national average for the measure was 11.6% during the quarter. Tourism The number of airplane passengers traveling through Phoenix Sky Harbor International Airport reached a record of 4.25 million in March and represents a 5.5% increase above the level in March 2014. March coincides with the peak of the state’s tourism season, which was bolstered this year by strong visitation for the baseball spring training season and spring break trips. Revenue per available room increased 15.7% during the month and is 14.4% above the amount in March 2014. State Agency Data At the beginning of May 2015, the total AHCCCS caseload was 1.64 million members. Since the federal health care expansion in January 2014, the overall AHCCCS population has grown by 378,501 members. Total monthly enrollment increased 1.2% during April, continuing the recent bound from flat or decreasing enrollment during October through February. The slowdown in prior months may have been exacerbated by a change in the length of eligibility redetermination. The overall increase in May was concentrated primarily in the Traditional population of the lowest income parents and children. Enrollment in the Traditional population increased 15,800 in May to a level of 975,200 members. The May level represents an increase of 1.6% since last month and a 5.5% increase since last year. In January 2014, the state started accepting new enrollment to the Proposition 204 childless adults program. In May 2015, the childless adult population decreased by (400), or (0.1)%. Since January 2014, the childless adult population has increased by 213,300 to reach a level of 281,000. The state share of the Proposition 204 physical health cost is paid through a hospital assessment while the behavioral health costs are paid through the General Fund. The state also opted to expand adult Medicaid coverage to 133% of FPL. The 100% - 133% enrollment increased by 4,200 in May and now totals 55,100 individuals enrolled since January 2014. The federal government is currently paying 100% of this cost.
There were 24,668 TANF recipients in the state in March, representing a (4.2)% decline in monthly caseloads from February. The year-over-year number of TANF recipients has declined by (16.4)%. The statutory lifetime limit on cash assistance is 24 months. The Supplemental Nutrition Assistance Program (SNAP), formerly known as Food Stamps, provides assistance to low-income households to purchase food. This March, there were 1.0 million food stamp recipients in the state, representing a (0.9)% decrease from February caseloads. Compared to March of last year, food stamp participation declined by (3.5)%. At the end of April 2015, the Arizona Department of Corrections reported at total inmate population of 42,407. This is a 0.4% increase from the previous month, and a 2.6% increase since April 2014.

7 JLBC – MONTHLY FISCAL HIGHLIGHTS – MAY 2015
Table 5 MONTHLY INDICATORS
Indicator Time Period Current Value
Change From
Prior Period Change From
Prior Year
Arizona Employment - Regular Unemployment Rate March 6.2% (0.3)% (0.8)% - Total Unemployment Rate (discouraged/underemployed) 1st Q 2015 14.3% (0.4)% (1.8)% - Initial Unemployment Insurance Claims March 17,842 21.6% (13.3)% - Unemployment Insurance Recipients March 29,414 3.8% (17.7)% - Non-Farm Employment - Total Manufacturing Construction
March March March
2.63 million 156,100 126,700
0.2% (0.3)% 0.6%
2.6% (0.3)% 1.5%
- Average Weekly Hours, Private Sector March 34.90 (0.6)% (0.9)% - Average Hourly Earnings, Private Sector March $22.97 (0.2)% (0.9)% Sales - Retail Taxable Sales Motor Vehicles/Misc. Auto Furniture/Home Furnishings
March March
$935.8 million $314.2 million
7.2%
(7.9)%
11.1% 5.7%
Building Material/Lawn & Garden March $353.6 million 10.5% 5.6% Building - Residential Building Permits (12-month avg) Single-family Multi-family
March March
18,078 8,979
2.8%
(9.3)%
0.5% 15.9%
- Maricopa County/Other, Home Sales (ARMLS) Single-Family (Pending Sales)
April
7,095
2.5%
9.3%
- Maricopa County/Other, Median Home Price (ARMLS) Single-Family (Pending Sales)
April
$222,,228
2.4%
10.6%
- Phoenix S&P/C Home Price Index (2000 = 100) February 148.33 0.3% 2.9% - Maricopa Pending Foreclosures April 5,589 (1.3)% (21.2)% - Greater Phoenix Total Housing Inventory, (ARMLS) April 25,889 (2.2)% (12.6)% Tourism - Phoenix Sky Harbor Air Passengers March 4.25 million 28.9% 4.7% - National Park Visitors December 605,350 (34.9)% 20.5% - State Park Visitors February 266,769 42.5% 11.9% - Revenue Per Available Hotel Room March $112.38 15.7% 14.4% General Measures - Arizona Consumer Confidence Index (1985 = 100) 1st Q 2015 79.1 N/A 14.8% - Arizona Coincident Index (July 1992 = 100) March 192.12 0.7% 3.4% - Arizona Leading Index -- 6 month projected growth March 6.5% 2.3% 4.5% - Arizona Personal Income 4th Q 2014 $259.0 billion 1.1% 4.6% - Arizona Population July 2014 6.73 million N/A 1.5% - State Debt Rating Standards & Poor’s/Moody’s Outlook
Dec 09/May 15 Nov 13/May 15
AA- / Aa2
Positive/Stable
N/A N/A
N/A N/A
Agency Measures - AHCCCS Recipients May 1,636,643 1.2% 14.8% Acute Care Traditional 975,158 1.6% 5.5% Prop 204 Childless Adults 281,025 (0.1)% 42.5% Other Prop 204 168,619 (1.8)% 9.0% Adult Expansion 55,136 8.3% 237.9% Kids Care I 1,235 (4.1%) (40.7)% Long-Term Care – Elderly & DD 56,989 0.3% 3.5% Emergency Services 89,481 2.7% 30.2% - Department of Child Safety (DCS) Annual Reports of Child Maltreatment (12-month total)
DCS Out-of-Home Children
Jan. 2015 January
48,720 17,272
0.0% 1.0%
10.4% 12.6%
Filled Caseworkers (1406 Budgeted) February 1,396 1 206 - ADC Inmate Growth April 42,407 0.4% 2.6% - Department of Economic Security - TANF Recipients March 24,668 (4.2)% (16.4)% - SNAP (Food Stamps) Recipients March 1,000,684 (0.9)% (3.5)% - Judiciary Probation Caseload Non-Maricopa
Maricopa County
February February
17,889 26,629
7
126
618
1,560 United States - Gross Domestic Product (Chained 2009 dollars, SAAR)
1st Q, 2015 (1st Estimate)
$16.3 trillion 3.0% 0.2%
- Consumer Confidence Index (1985 = 100) April 95.2 (6.1)% 16.5% - Leading Indicators Index (2010 = 100) March 121.4 0.2% 5.2% - Consumer Price Index, SA (1982-84 = 100) March 235.7 0.2% 0.0% - Personal Consumption Price Index (2009 = 100) March 108.6 0.2% 0.3%
8 JLBC – MONTHLY FISCAL HIGHLIGHTS – MAY 2015
Summary of Recent Agency Reports
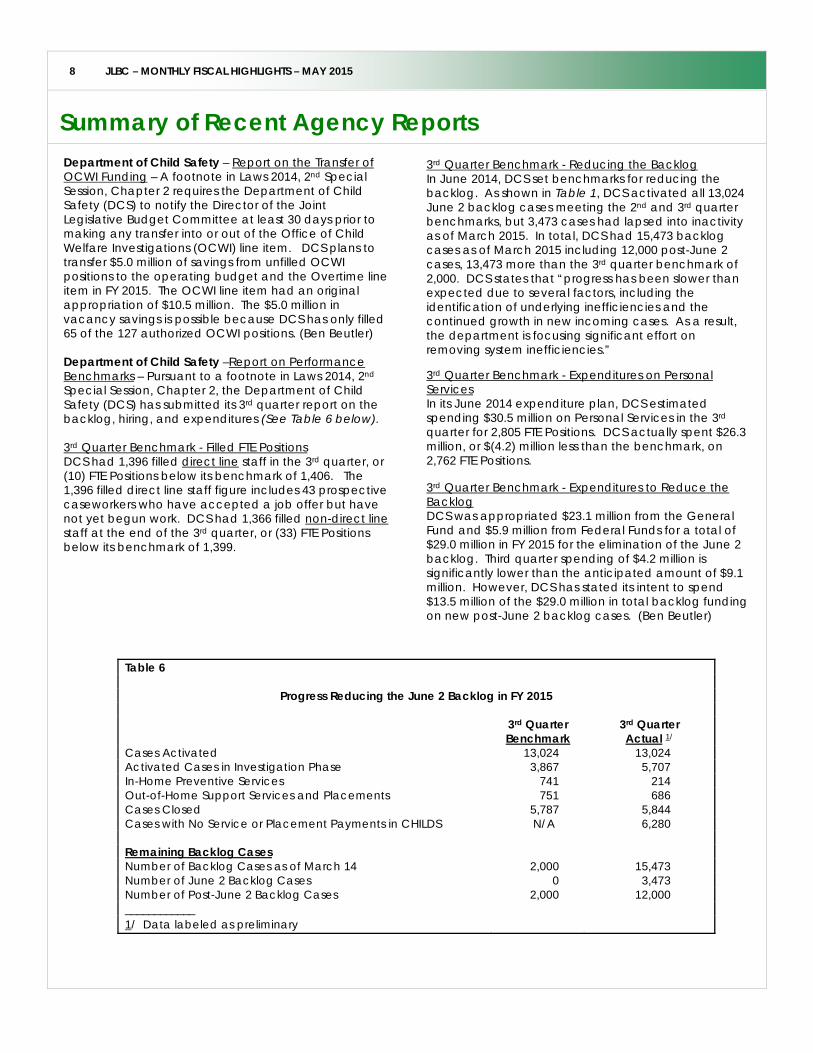
Department of Child Safety – Report on the Transfer of OCWI Funding – A footnote in Laws 2014, 2nd Special Session, Chapter 2 requires the Department of Child Safety (DCS) to notify the Director of the Joint Legislative Budget Committee at least 30 days prior to making any transfer into or out of the Office of Child Welfare Investigations (OCWI) line item. DCS plans to transfer $5.0 million of savings from unfilled OCWI positions to the operating budget and the Overtime line item in FY 2015. The OCWI line item had an original appropriation of $10.5 million. The $5.0 million in vacancy savings is possible because DCS has only filled 65 of the 127 authorized OCWI positions. (Ben Beutler) Department of Child Safety –Report on Performance Benchmarks – Pursuant to a footnote in Laws 2014, 2nd Special Session, Chapter 2, the Department of Child Safety (DCS) has submitted its 3rd quarter report on the backlog, hiring, and expenditures (See Table 6 below). 3rd Quarter Benchmark - Filled FTE Positions DCS had 1,396 filled direct line staff in the 3rd quarter, or (10) FTE Positions below its benchmark of 1,406. The 1,396 filled direct line staff figure includes 43 prospective caseworkers who have accepted a job offer but have not yet begun work. DCS had 1,366 filled non-direct line staff at the end of the 3rd quarter, or (33) FTE Positions below its benchmark of 1,399.
3rd Quarter Benchmark - Reducing the BacklogIn June 2014, DCS set benchmarks for reducing the backlog. As shown in Table 1, DCS activated all 13,024 June 2 backlog cases meeting the 2nd and 3rd quarter benchmarks, but 3,473 cases had lapsed into inactivity as of March 2015. In total, DCS had 15,473 backlog cases as of March 2015 including 12,000 post-June 2 cases, 13,473 more than the 3rd quarter benchmark of 2,000. DCS states that “progress has been slower than expected due to several factors, including the identification of underlying inefficiencies and the continued growth in new incoming cases. As a result, the department is focusing significant effort on removing system inefficiencies.” 3rd Quarter Benchmark - Expenditures on Personal Services In its June 2014 expenditure plan, DCS estimated spending $30.5 million on Personal Services in the 3rd quarter for 2,805 FTE Positions. DCS actually spent $26.3 million, or $(4.2) million less than the benchmark, on 2,762 FTE Positions. 3rd Quarter Benchmark - Expenditures to Reduce the Backlog DCS was appropriated $23.1 million from the General Fund and $5.9 million from Federal Funds for a total of $29.0 million in FY 2015 for the elimination of the June 2 backlog. Third quarter spending of $4.2 million is significantly lower than the anticipated amount of $9.1 million. However, DCS has stated its intent to spend $13.5 million of the $29.0 million in total backlog funding on new post-June 2 backlog cases. (Ben Beutler)
Table 6
Progress Reducing the June 2 Backlog in FY 2015 3rd Quarter 3rd Quarter Benchmark Actual 1/ Cases Activated 13,024 13,024 Activated Cases in Investigation Phase 3,867 5,707 In-Home Preventive Services 741 214 Out-of-Home Support Services and Placements 751 686 Cases Closed 5,787 5,844 Cases with No Service or Placement Payments in CHILDS N/A 6,280 Remaining Backlog Cases Number of Backlog Cases as of March 14 2,000 15,473 Number of June 2 Backlog Cases 0 3,473 Number of Post-June 2 Backlog Cases 2,000 12,000 ____________ 1/ Data labeled as preliminary

9 JLBC – MONTHLY FISCAL HIGHLIGHTS – MAY 2015
Summary of Recent Agency Reports (Continued)
Arizona Commerce Authority – Annual Report on the Healthy Forest Enterprise Incentives Program – Pursuant to A.R.S. § 41-1516I, the Arizona Commerce Authority is required to report on the Healthy Forest Enterprise Incentives Program by May 1 annually regarding the: 1) quantity and measured weight of qualifying forest products reported; 2) number of new full-time employees hired in qualified employment positions; and 3) number of full-time employees employed in qualified employment positions. In calendar year 2014 the total weight of qualified harvest, processed, or transported forest products was 531,751 tons; none of the 7 companies, however, participated in the income tax credit portion of the program. The Healthy Forest Enterprise Incentives Program allows businesses primarily engaged in the harvesting, initial processing, or transporting of forest products in Arizona to qualify for the following: a use and transaction privilege tax exemption on qualified purchases, a 50% reduction in the use fuel tax, a reduction in the assessment ratio of personal and real property from 25% to 5%, and an income tax credit of up to $3,000 per employee on new jobs created. (Eric Billings) Department of Education – Budget Status Report – Pursuant to A.R.S. § 35-131D, the Arizona Department of Education (ADE) recently provided an update regarding its budget status for FY 2015. In that report, ADE estimates that it will experience a $3.4 million net funding surplus for formula programs for FY 2015. ADE previously projected a $(27.3) million funding shortfall for formula programs for FY 2015, but that shortfall was eliminated through the appropriation of $26.9 million in supplemental funding to the department for FY 2015 through the recently enacted budget and through updated (lower) cost projections. ADE’s current $3.4 million surplus estimate is subject to further revision as additional data become available. (Steve Schimpp) Department of Environmental Quality – Third-Party Report on E-Licensing Project – Pursuant to a FY 2015 General Appropriation Act footnote and a provision of the Committee’s favorable review of the initial E-Licensing proposal in June 2014, the Department of Environmental Quality (DEQ) has provided an update of the E-Licensing project. DEQ provided a follow-up on the third-party assessment provided in March 2014, but did not submit a quarterly progress report as requested by the Committee in June 2014. In the report, the vendor reiterated its prior positive evaluation of DEQ’s approach in which it sees a “credible path to success.” The vendor gave an overall favorable evaluation of DEQ’s progress in incorporating recommendations from the previous third-party report. In response to customer and stakeholder feedback, the portal has been
modified in order to create a more guided online application process. The report attributed delays in Phase 1 and Phase 2 deliverables to a number of factors, including changes to the scope of the project, turnover of ADOA-ASET senior IT management, and changes in consulting partnerships. The report also provided 11 recommendations for the project, such as implementing a budget and staffing plan, quantifying operational costs, and establishing greater collaboration between DEQ and state IT agencies. No foreseeable end date to the project was provided. (Josh Hope) Department of Public Safety – Quarterly Report on the GIITEM Fund – Pursuant to A.R.S. § 41-1724, the Department of Public Safety (DPS) is required to report quarterly on Gang and Immigration Intelligence Team Enforcement Mission (GIITEM) Fund expenditures. In FY 2015, the GIITEM Fund was appropriated $2.6 million in General Fund monies for grants to local law enforcement agencies to help with border security. During the third quarter of FY 2015 DPS expended $900 for cell phone services for local GIITEM Subaccount grant participants bringing the year-to-date total to $2.1 million. Additionally, the GIITEM Border Security and Law Enforcement Subaccount received $576,400 in criminal fine and fee revenues in the third quarter of FY 2015, bringing the year-to-date revenue total to $1.7 million. DPS expended $372,200 in the third quarter bringing the year-to-date expenditure total to $1.5 million. The monies were granted to 10 local law enforcement agencies and the Arizona Department of Corrections for border security purposes. (Eric Billings)
10 JLBC – MONTHLY FISCAL HIGHLIGHTS – MAY 2015
April Spending
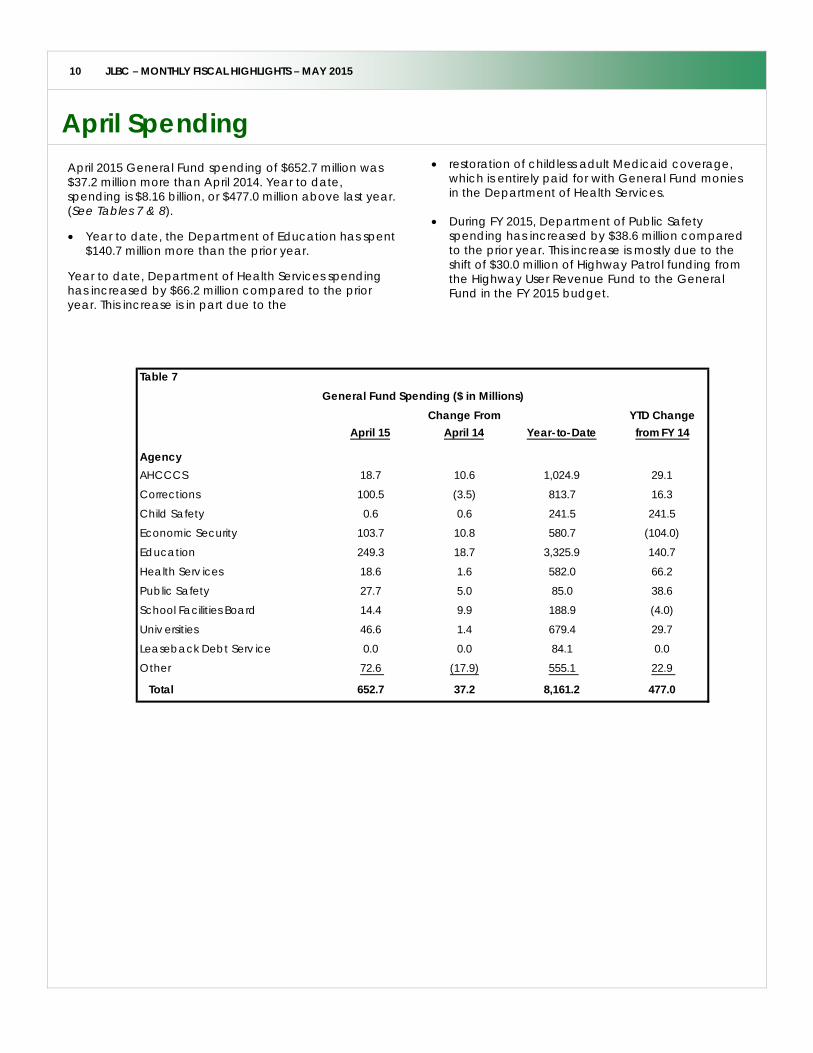
April 2015 General Fund spending of $652.7 million was $37.2 million more than April 2014. Year to date, spending is $8.16 billion, or $477.0 million above last year. (See Tables 7 & 8). • Year to date, the Department of Education has spent
$140.7 million more than the prior year.
Year to date, Department of Health Services spending has increased by $66.2 million compared to the prior year. This increase is in part due to the
• restoration of childless adult Medicaid coverage, which is entirely paid for with General Fund monies in the Department of Health Services.
• During FY 2015, Department of Public Safety spending has increased by $38.6 million compared to the prior year. This increase is mostly due to the shift of $30.0 million of Highway Patrol funding from the Highway User Revenue Fund to the General Fund in the FY 2015 budget.
April 15Change From
April 14 Year-to-DateYTD Change from FY 14
AgencyAHCCCS 18.7 10.6 1,024.9 29.1
Corrections 100.5 (3.5) 813.7 16.3
Child Safety 0.6 0.6 241.5 241.5
Economic Security 103.7 10.8 580.7 (104.0)
Education 249.3 18.7 3,325.9 140.7
Health Serv ices 18.6 1.6 582.0 66.2
Public Safety 27.7 5.0 85.0 38.6
School Facilities Board 14.4 9.9 188.9 (4.0)
Univ ersities 46.6 1.4 679.4 29.7
Leaseback Debt Serv ice 0.0 0.0 84.1 0.0
Other 72.6 (17.9) 555.1 22.9
Total 652.7 37.2 8,161.2 477.0
Table 7General Fund Spending ($ in Millions)
11 JLBC – MONTHLY FISCAL HIGHLIGHTS – MAY 2015
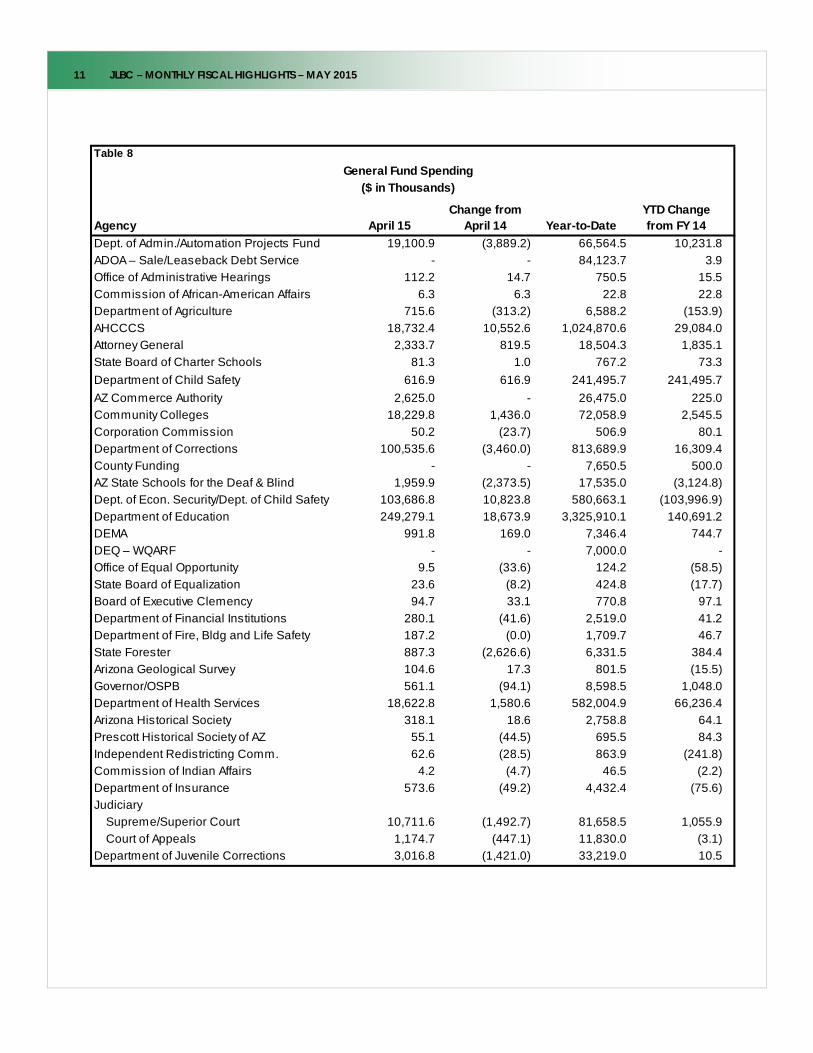
Agency April 15Change from
April 14 Year-to-DateYTD Change from FY 14
Dept. of Admin./Automation Projects Fund 19,100.9 (3,889.2) 66,564.5 10,231.8
ADOA – Sale/Leaseback Debt Service - - 84,123.7 3.9
Office of Administrative Hearings 112.2 14.7 750.5 15.5
Commission of African-American Affairs 6.3 6.3 22.8 22.8
Department of Agriculture 715.6 (313.2) 6,588.2 (153.9)
AHCCCS 18,732.4 10,552.6 1,024,870.6 29,084.0
Attorney General 2,333.7 819.5 18,504.3 1,835.1
State Board of Charter Schools 81.3 1.0 767.2 73.3
Department of Child Safety 616.9 616.9 241,495.7 241,495.7
AZ Commerce Authority 2,625.0 - 26,475.0 225.0
Community Colleges 18,229.8 1,436.0 72,058.9 2,545.5
Corporation Commission 50.2 (23.7) 506.9 80.1
Department of Corrections 100,535.6 (3,460.0) 813,689.9 16,309.4
County Funding - - 7,650.5 500.0
AZ State Schools for the Deaf & Blind 1,959.9 (2,373.5) 17,535.0 (3,124.8)
Dept. of Econ. Security/Dept. of Child Safety 103,686.8 10,823.8 580,663.1 (103,996.9)
Department of Education 249,279.1 18,673.9 3,325,910.1 140,691.2
DEMA 991.8 169.0 7,346.4 744.7
DEQ – WQARF - - 7,000.0 -
Office of Equal Opportunity 9.5 (33.6) 124.2 (58.5)
State Board of Equalization 23.6 (8.2) 424.8 (17.7)
Board of Executive Clemency 94.7 33.1 770.8 97.1
Department of Financial Institutions 280.1 (41.6) 2,519.0 41.2
Department of Fire, Bldg and Life Safety 187.2 (0.0) 1,709.7 46.7
State Forester 887.3 (2,626.6) 6,331.5 384.4
Arizona Geological Survey 104.6 17.3 801.5 (15.5)
Governor/OSPB 561.1 (94.1) 8,598.5 1,048.0
Department of Health Services 18,622.8 1,580.6 582,004.9 66,236.4
Arizona Historical Society 318.1 18.6 2,758.8 64.1
Prescott Historical Society of AZ 55.1 (44.5) 695.5 84.3
Independent Redistricting Comm. 62.6 (28.5) 863.9 (241.8)
Commission of Indian Affairs 4.2 (4.7) 46.5 (2.2)
Department of Insurance 573.6 (49.2) 4,432.4 (75.6)
Judiciary
Supreme/Superior Court 10,711.6 (1,492.7) 81,658.5 1,055.9
Court of Appeals 1,174.7 (447.1) 11,830.0 (3.1)
Department of Juvenile Corrections 3,016.8 (1,421.0) 33,219.0 10.5
Table 8
General Fund Spending
($ in Thousands)

12 JLBC – MONTHLY FISCAL HIGHLIGHTS – MAY 2015
Agency April 15Change from
April 14 Year-to-DateYTD Change from FY 14
State Land Department 773.7 (810.7) 9,813.6 (145.0)
Legislature
Auditor General 1,998.8 (120.5) 17,231.7 1,251.6
House of Representatives 1,004.6 (525.3) 11,416.1 771.2
Joint Legislative Budget Comm. 168.4 (52.4) 1,933.4 219.6
Legislative Council 434.1 (116.3) 7,095.9 1,531.8
Senate 970.0 (47.9) 7,477.8 386.9
Mine Inspector 83.1 (41.6) 958.7 (43.4)
Nav. Streams & Adjudication 10.3 (16.1) 157.6 17.6
Occupational Safety and Health Review - - 0.9 (1.4)
Phoenix Convention Center - - 20,449.0 -
Pioneers’ Home 249.5 (169.9) 1,435.1 (164.0)
Comm. for Postsecondary Ed. - - 1,396.8 -
Department of Public Safety 27,745.7 5,000.8 85,019.5 38,592.5
Public Safety Personnel Retirement System - - 6,000.0 1,000.0
Arizona Department of Racing 60.9 (47.1) 1,930.5 (53.4)
Radiation Regulatory Agency 249.9 (8.2) 1,343.2 9.0
Real Estate Department 168.4 (72.5) 2,082.9 20.6
Department of Revenue (939.6) (3,374.7) 37,607.8 (2,089.3)
School Facilities Board 14,389.1 9,902.3 188,866.6 (4,006.5)
Secretary of State 740.1 (344.0) 12,327.8 2,456.4
Tax Appeals Board 21.2 (4.7) 224.5 (1.1)
Office of Tourism 710.4 (1,066.3) 9,103.7 990.8
Universities
Board of Regents 1,029.4 (1,341.2) 24,014.3 2,325.7
Arizona State University 21,559.2 1,918.8 306,167.4 19,187.8
Northern Arizona University 7,315.5 753.0 103,650.1 7,530.2
University of Arizona 16,666.4 70.0 245,593.7 700.2
Department of Veteran Services 395.9 (196.9) 3,949.0 (376.3)
Department of Water Resources 917.4 (332.0) 9,368.1 416.2
Water Infrastructure Finance Authority - - 1,000.0 1,000.0
Department of Weights & Measures 120.0 (4.7) 1,117.6 121.0
Other - JP Salaries Distribution 81.1 (42.5) 794.7 (20.5)
Other 4.9 (167.1) 232.8 49.3
Total 652,720.6 37,181.5 8,161,227.6 476,987.1
Table 8 (Continued)

Tracking Arizona’s Recovery Contents
Page:
2……Total Non-Farm Employment
3……Average Hourly Earnings – Private Sector
4……Initial Claims for Unemployment Insurance
5……State Sales Tax Collections – Retail Category
6……State Sales Tax Collections – Contracting
Category
7……Residential Building Permits
8……Economic Activity Index
1
-10%-8%-6%-4%-2%0%2%4%6%8%
Jan
01
Jul 0
1
Jan
02
Jul 0
2
Jan
03
Jul 0
3
Jan
04
Jul 0
4
Jan
05
Jul 0
5
Jan
06
Jul 0
6
Jan
07
Jul 0
7
Jan
08
Jul 0
8
Jan
09
Jul 0
9
Jan
10
Jul 1
0
Jan
11
Jul 1
1
Jan
12
Jul 1
2
Jan
13
Jul 1
3
Jan
14
Jul 1
4
Jan
15Ye
ar O
ver
Year
Gro
wth
(%
)
JLBC
Total Non-Farm Employment
2.6% Y/Y Growth (March 2015)
$22.73 / Hour (October 2014)
2
2,100
2,200
2,300
2,400
2,500
2,600
2,700
2,800
Jan
01
Jul 0
1
Jan
02
Jul 0
2
Jan
03
Jul 0
3
Jan
04
Jul 0
4
Jan
05
Jul 0
5
Jan
06
Jul 0
6
Jan
07
Jul 0
7
Jan
08
Jul 0
8
Jan
09
Jul 0
9
Jan
10
Jul 1
0
Jan
11
Jul 1
1
Jan
12
Jul 1
2
Jan
13
Jul 1
3
Jan
14
Jul 1
4
Jan
15
Tho
usa
nd
s o
f Jo
bs
2,633,600 jobs (March 2015)
JLBC
Average Hourly Earnings – Private Sector
-6%-4%-2%0%2%4%6%8%
10%12%
Jan
07
July
07
Jan
08
July
08
Jan
09
July
09
Jan
10
July
10
Jan
11
July
11
Jan
12
Jul 1
2
Jan
13
Jul 1
3
Jan
14
Jul 1
4
Jan-
15Year
Ove
r Ye
ar G
row
th (
%)
(0.6)% Y/Y Growth (March 2015)
$19
$20
$21
$22
$23
$24
$25
Jan
07
July
07
Jan
08
July
08
Jan
09
July
09
Jan
10
July
10
Jan
11
July
11
Jan
12
Jul 1
2
Jan
13
Jul 1
3
Jan
14
Jul 1
4
Jan-
15
$ /
Hour
$22.97 / Hour (March 2015)
3
Initial Claims for Unemployment Insurance
4
Not seasonally adjusted
5,000
10,000
15,000
20,000
25,000
30,000
35,000
40,000
45,000
Jan
01
Jul 0
1
Jan
02
Jul 0
2
Jan
03
Jul 0
3
Jan
04
Jul 0
4
Jan
05
Jul 0
5
Jan
06
Jul 0
6
Jan
07
Jul 0
7
Jan
08
Jul 0
8
Jan
09
Jul 0
9
Jan
10
Jul 1
0
Jan
11
Jul 1
1
Jan
12
Jul 1
2
Jan
13
Jul 1
3
Jan
14
Jul 1
4
Jan
15
Tota
l Mo
nth
ly C
laim
s fo
r U
I B
en
efi
ts
17,842 Claims (March 2015)
JLBC

JLBC
State Sales Tax Collections – Retail Category
$100
$125
$150
$175
$200
$225
July
06
Jan
07
July
07
Jan
08
July
08
Jan
09
July
09
Jan
10
July
10
Jan
11
July
11
Jan
12
Jul 1
2
Jan
13
Jul 1
3
* Ja
n 14
Jul 1
4
Jan
15
$ in
Mill
ions
Excludes temporary 1 ¢ sales tax
$204.7 million (April 2015)
-20%
-15%
-10%
-5%
0%
5%
10%
15%
20%
July
06
Jan
07
July
07
Jan
08
July
08
Jan
09
July
09
Jan
10
July
10
Jan
11
July
11
Jan
12
Jul 1
2
Jan
13
Jul 1
3
* J
an 1
4
Jul 1
4
Jan
15Ye
ar
Ov
er
Ye
ar
Gro
wth
(%
)
11.7% Y/Y Growth (April 2015)
5 * January 2014 estimate adjusted downward by $30 million to reflect one-time category shift.
JLBC
State Sales Tax Collections – Contracting Category
$0
$25
$50
$75
$100
July
06
Jan
07
July
07
Jan
08
July
08
Jan
09
July
09
Jan
10
July
10
Jan
11
July
11
Jan
12
Jul 1
2
Jan
13
Jul 1
3
Jan
14
Jul 1
4
Jan
15
$ in
Mill
ions
Excludes temporary 1 ¢ sales tax
$32.2 million (April 2015)
-50%
-40%
-30%
-20%
-10%0%
10%
20%
30%
40%
July
06
Jan
07
July
07
Jan
08
July
08
Jan
09
July
09
Jan
10
July
10
Jan
11
July
11
Jan
12
Jul 1
2
Jan
13
Jul 1
3
Jan
14
Jul 1
4
Jan
15Ye
ar
Ov
er
Ye
ar
Gro
wth
(%
)
(16.4)% Y/Y Growth (April 2015)
6
Residential Building Permits
7
0
10,000
20,000
30,000
40,000
50,000
60,000
70,000
80,000
90,000
100,000
Jan
01
Jul 0
1
Jan
02
Jul 0
2
Jan
03
Jul 0
3
Jan
04
Jul 0
4
Jan
05
Jul 0
5
Jan
06
Jul 0
6
Jan
07
Jul 0
7
Jan
08
Jul 0
8
Jan
09
Jul 0
9
Jan
10
Jul 1
0
Jan
11
Jul 1
1
Jan
12
Jul 1
2
Jan
13
Jul 1
3
Jan
14
Jul 1
4
Jan
15
Bu
ild
ing
Pe
rmit
s
Single Family UnitMulti-Family Unit
- 18,078 Permits- 8,979 Permits
(Mar. 2015)
12-Month Moving Sum JLBC 8
Economic Activity Index
140
150
160
170
180
190
200
210
220
Jan
01
Jul 0
1
Jan
02
Jul 0
2
Jan
03
Jul 0
3
Jan
04
Jul 0
4
Jan
05
Jul 0
5
Jan
06
Jul 0
6
Jan
07
Jul 0
7
Jan
08
Jul 0
8
Jan
09
Jul 0
9
Jan
10
Jul 1
0
Jan
11
Jul 1
1
Jan
12
Jul 1
2
Jan
13
Jul 1
3
Jan
14
Jul 1
4
Jan
15
Co
inci
de
nt
Ind
ex
Val
ue
192.1 Index Value(March 2015)
Source: Coincident Index – Federal Reserve Bank of Philadelphia. Combines four state-level indicators (employment, average hours worked in manufacturing, the unemployment rate, and wage and salary disbursements) to summarize current economic conditions.
JLBC