monthly economic review - ekonomi.isbank · ... the highest level in the last three years. ......
TRANSCRIPT
MONTHLY ECONOMIC REVIEW
Economic Research Division December 2012
Our reports are also available on our website http://research.isbank.com.tr
► Although the US economy has been showing a moderate recovery recently, the concerns about the “fiscal cliff” still continue to weigh on the markets. ► The economic activity in the Euro Area has continued to be weak. In fact, the region’s economy, which contracted by 0.2% in the second quarter, fell back into recession after three years in the third quarter of 2012 by contracting 0.1%. ► On November 26th, Euro Area finance ministers and International Monetary Fund (IMF) reached agreement upon a new deal which will free the next loan installment to Greece in order to save the country from default, aiming to reduce the country’s debt stock. ► Regarding Turkey, September industrial production index increased by 6.2% compared to the same month of the previous year. The increase in the index, which was the highest since November 2011, indicated that the deceleration in Turkish economy during the third quarter might be less prominent than expected. ► CBRT, at its meeting held on November 20th, cut the O/N lending rate by a further 50 basis points to 9.0% and kept the one-week repo rate (the policy rate) at 5.75%. CBRT kept its supportive policy stance by decreasing the O/N lending rate third time in a row. ► In addition to the Fitch’s upgrade, the reinforced expectations that the CBRT would further cut the rates led the interest rate of the TL benchmark bond to decline significantly to as low as 5.93% as of November 30th.
Turkish Economy.........................................................................................................
2
Banking Sector............................................................................................................. 6
1
Economic Research Division December 2012
OVERVIEW Downward risks to global economic activity have remained due to the uncertainties regarding the coming period. Although the US economy has been showing a moderate recovery recently, the fact that the Republicans continued to hold the majority in the House of Representatives after the Presidential elections makes it difficult to do the necessary legislations in order to avoid a possible “fiscal cliff”, a combination of tax hikes and spending cuts. In the Euro Area, the borrowing costs of Spain and Italy has been declining gradually since the second half of September following the European Central Bank’s (ECB) decision to use the monetary policy instruments which allow it to buy troubled countries’ bonds from the secondary market for an unlimited time. In addition, the agreement was reached upon a new deal on November 26
th aiming to reduce
Greece’s debt burden. Despite these positive developments in Euro Area, the region has fallen back into recession in the third quarter of the year and the leading indicators of economic activity has been showing no signs of improvement for the coming period. So, the concerns about the region’s economic outlook continued to remain. In fact, EU Commission forecasts that the Euro Area economy will contract in 2012 and will grow by a modest 0.1% in 2013 according to its European Economic Forecast report. The loan tranche that will be provided to Greece in the context of the rescue package had been frozen in July as the country fell behind its budget targets. Thus, as of November, Greece reached the limits of its financial resources. In order to roll over a bond redemption of €5 billion, Greece had to auction 1-month and 3-month T-bills in November. In this context, the Greek parliament approved the 2013 budget which included sharp spending cuts in order to receive the next loan tranche. After the approval of the new austerity package, Euro Area finance ministers and International Monetary Fund (IMF) reached agreement upon a new deal which will free the next loan installment to Greece in order to save the country from default and will reduce the country’s debt stock. CBRT announced the second Financial Stability Report of the year. In the report, CBRT stressed that the Reserve Option Mechanism will be used more actively in the coming period acting as an automatic stabilizer against the volatility in external financing conditions. CBRT also noted that the decline in credit rates, which started as a result of the monetary policy mix implemented recently, will continue and the credit growth will be moderate in accordance with the year-end growth prospects and with the financial stability mandate. Besides, CBRT also added that the improvement in foreign trade and current account balance continued. Turkish markets diverged positively from the fluctuations in global markets even before Fitch’s upgrade of Turkey to investment grade as the decision has been widely expected by the markets. In addition to the credit rating upgrade, the reinforced expectations that the CBRT would further cut the rates led the interest rate of the TL benchmark bond to decline significantly to as low as 5.93% as of November 30
th.
Risks to global economy
remain.
New rescue package for Greece…
CBRT announced the
Financial Stability Report.
Benchmark interest rate declined significantly after
the rating upgrade.

2
Economic Research Division December 2012
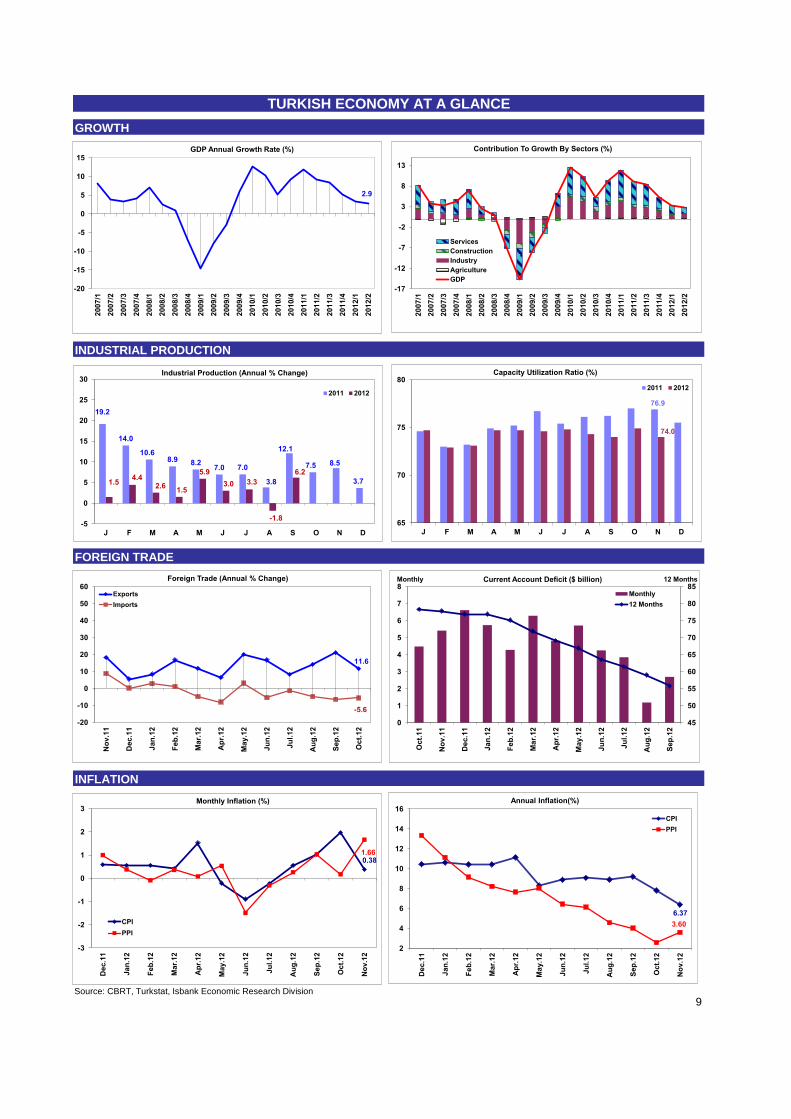
TURKISH ECONOMY In September, industrial production index increased by 6.2% compared to the same month of the previous year. The increase in index, which was the highest since November 2011, indicated that the deceleration in Turkish economy during the third quarter might be less prominent than expected. It was noteworthy that production increased in 19 sub-sectors out of the 24 sub-sectors that constitute the index. Also, seasonal and calendar adjusted industrial production index increased by 3.9% compared to the previous month.
Source: Turkstat
On the other hand, according to the figures announced by CBRT November Real Sector Confidence Index decreased by 1.4 points compared to the previous month and realized as 101. The index, which declined in the seventh consecutive month, pointed out that the slowdown in domestic economic activity continued. In addition, capacity utilization rate (CUR) declined by 2.9 points compared to the same month of the previous year and realized as 74%.
Source: CBRT
October Consumer Confidence Index fell by 3.1 points compared to the previous month and realized as 85.7. The decline in the index stemmed mainly from the deterioration in consumers’ expectations on general economic outlook and purchasing power. According to Household Labor Force Survey announced by Turkstat, the unemployment rate started to display an upward trend due to the slowdown in economic activity accompanied by some seasonal factors. In fact, August unemployment rate increased by 0.4 points compared to the previous month and realized as 8.8%. The seasonal adjusted unemployment rate also increased from
6.2
-5
0
5
10
15
20
Jan
-11
Fe
b-1
1
Ma
r-11
Ap
r-11
Ma
y-1
1
Jun
-11
Jul-1
1
Au
g-1
1
Se
p-1
1
Oct-
11
Nov-1
1
Dec-1
1
Jan
-12
Fe
b-1
2
Ma
r-12
Ap
r-12
Ma
y-1
2
Jun
-12
Jul-1
2
Au
g-1
2
Se
p-1
2
Industrial Production Index (annual % change)
70
80
90
100
110
120
130
Jan
-10
Ap
r-10
Jul-1
0
Oct-
10
Jan
-11
Ap
r-11
Jul-1
1
Oct-
11
Jan
-12
Ap
r-12
Jul-1
2
Oct-
12
Leading Indicators
Real Sector Confidence Index
Consumer Confidence Index
Industrial production index increased well above the expectations in September.
Unemployment rate increased in August.
Leading indicators continued to fall.

3
Economic Research Division December 2012
9.1% in July to 9.2% in August. The number of unemployed people also increased by 122 thousand persons compared to the previous month to 2,445 thousand persons.
Source: Turkstat
The ongoing downward trend in foreign trade deficit recorded since November 2011 also continued in October 2012. Foreign trade deficit narrowed by 31.2% compared to the same month of previous year and realized as $5.5 billion. Thus, the deficit declined to the lowest level recorded since May 2010. In October, exports increased by 11.6% compared to the same month of the previous year, while imports declined by 5.6% in the same period. As of October 2012, import coverage ratio increased to 70.7%, the highest level in the last three years. Foreign Trade
October Change Jan.-Oct. Change
($ million) 2011 2012 (%) 2011 2012 (%)
Exports 11,907 13,292 11.6 111,351 126,277 13.4
Imports 19,919 18,803 -5.6 201,598 195,783 -2.9
Foreign Trade Balance -8,012 -5,510 -31.2 -90,248 -69,505 -23.0
Coverage Ratio (%) 59.8 70.7 - 55.2 64.5 -
Source: Turkstat
Gold exports kept their high level also in October with $1.2 billion. Thus, in the first 10 months of 2012, non-monetary gold exports reached $11.9 billion, constituting 9.4% of total exports. In the same period, motor vehicles and iron/steel exports realized as $12.4 billion and $9.7 billion, respectively. During January-October period, imports of intermediate goods followed a flat course while imports of capital and consumption goods decreased by 11% and 13%, respectively, in line with the weak trend in consumption and investment expenditures throughout 2012. In the first ten months of 2012, Russia ranked first in Turkey’s imports with $21.9 billion while during the same period top export destination was Germany with $10.9 billion. In this period, the share EU countries in total exports declined by 9 points to 38% compared to the same period of the previous year while the share of Near and Middle Eastern countries increased by 8 points to 28%. When gold exports are excluded, however, the decline in the share of EU countries in total exports was 5 points bringing the EU’s share to 42%. In September, the current account deficit realized as $2.7 billion. In the first 9 months of 2012, the current account deficit decreased by 35% compared to the same period of previous year and realized as $39.3 billion as a result of the contraction in foreign trade deficit. As of September, 12-month cumulative current account deficit contracted to $55.8 billion, its lowest level in the last 18 months. On
8.8
9.2
6.0
8.0
10.0
12.0
14.0
16.0
18.0
Jan
/09
Ma
y/0
9
Se
p/0
9
Jan
/10
Ma
y/1
0
Se
p/1
0
Jan
/11
Ma
y/1
1
Se
p/1
1
Jan
/12
Ma
y/1
2
Unemployment Rate (%)
Unemployment Rate
Seasonally Adjusted Unemployment Rate
Contraction in current account deficit has become evident.
Foreign trade deficit declined to the lowest
level since May 2010.
Gold exports…
EU’s share in exports declined to 38%.
Consumption goods imports declined the most in the first 10 months.
4
Economic Research Division December 2012
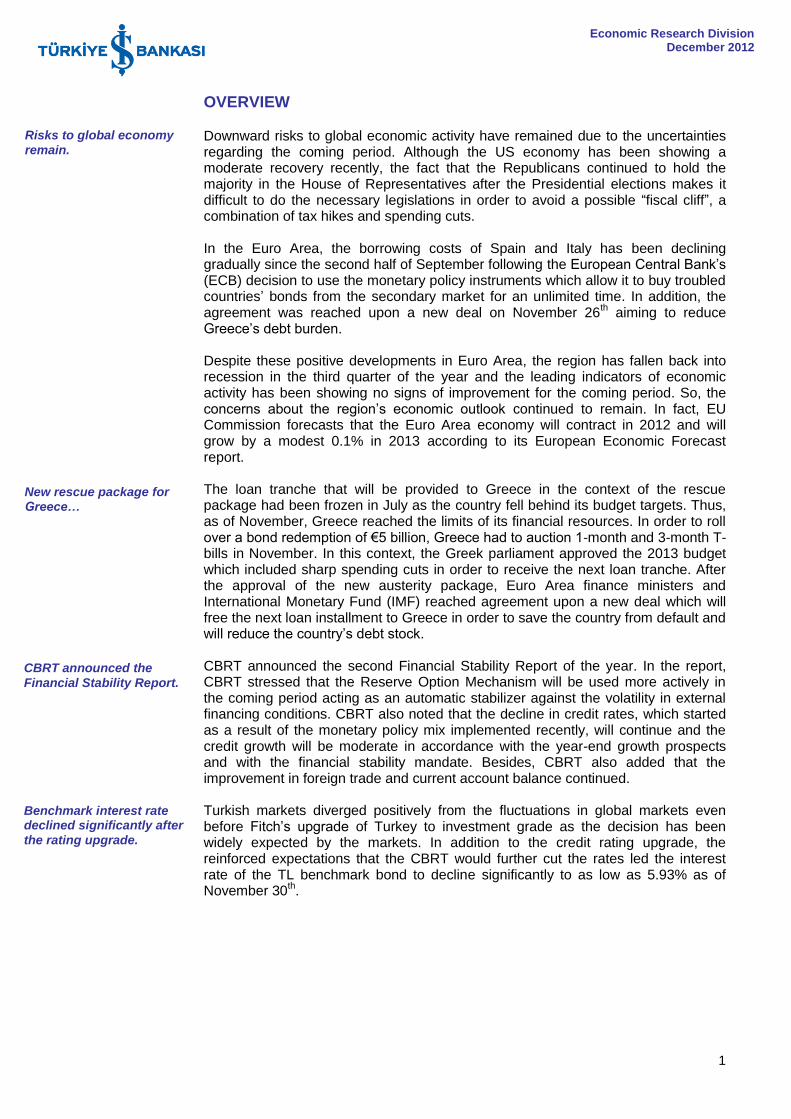
the other hand, current account balance excluding energy imports gave a surplus for the first time in two years and realized as $3.3 billion. Balance of Payments ($ million) September
January-September % Change Oct.11- Sep.12
2012 2011(I) 2012(II) (II/I) Current Account Balance -2,697 -60,466 -39,281 -35.0 -55,801 Foreign Trade Balance -5,247 -69,742 -50,736 -27.3 -70,084 Services Balance 3,015 14,302 15,816 10.6 19,510 Tourism Revenues (net) 2,741 14,244 14,529 2.0 18,329 Income Balance -569 -6,203 -5,325 -14.2 -6,748 Current Transfers 104 1,177 964 -18.1 1,521 Capital and Financial Accounts 703 50,426 32,936 -34.7 48,258 Capital Accounts 0 -25 0 - -5 Financial Accounts 703 50,451 32,936 -34.7 48,263 Direct Investments (net) 104 9,828 6,942 -29.4 10,733 Portfolio Investments (net) 4,786 15,262 24,926 63.3 31,650 Equity Securities 287 -407 2,680 - 2,101 Debt Securities 4,689 13,630 19,898 46.0 26,552 Other Investments (net) -3,419 30,754 17,571 -42.9 15,177 Assets -613 11,944 2,997 -74.9 2,363 Currency and Deposits 14 12,939 4,010 -69.0 3,913 Liabilities -2,806 18,810 14,574 -22.5 12,814 Loans 136 16,080 5,210 -67.6 8,016 Banking Sector -698 10,495 1,973 -81.2 3,926 Non-Bank Sectors 887 5,857 4,656 -20.5 6,019 Deposits -2,532 -1,457 7,188 - 4,336 Foreign Banks -2,767 -3,435 6,335 - 3,929 Foreign Exchange -3,007 3,013 4,588 52.3 3,334 Turkish Lira 240 -6,448 1,747 - 595 Non-Residents 603 3,427 2,595 -24.3 2,615 Reserve Assets (net) -768 -5,393 -16,503 206.0 -9,297 Net Errors and Omissions 1,994 10,040 6,345 -36.8 7,543
Source: CBRT
Analyzing the capital and financial accounts, it was seen that net capital inflow to Turkey in September was $3.4 billion and approximately $2 billion of this amount was reflected in net errors and omissions item. Net foreign direct investments in September were $104 million, the lowest level recorded since January 2011. Moreover, in the first 9 months, net foreign direct investments decreased by 29% compared to the same period of the previous year and realized as $6.9 billion. Analyzing the portfolio investments, non-residents’ net purchases of debt securities in September amounted to $4.7 billion bringing the net purchases in the first 9 months to $19.9 billion. In the same period, net capital inflow into equity securities reached $2.7 billion together with the $287 million inflow recorded in September. On the other investments front, $3.4 billion of outflow in September was noteworthy. This outflow was mainly stemmed from the $2.8 billion decrease in FX deposits of foreign banks held in domestic banks. In terms of loans raised from abroad, it was seen that banking sector was net credit payer with $698 million outflow while other sectors were net borrower with $887 million in September. The long-term debt rollover ratio of the banking sector was 100% in September and 89% in the first 9 months. The long-term debt rollover ratio of the non-bank sectors, on the other hand, was 131% in September and 110% in January-September period. Thanks to the rebalancing between the domestic and external demand in 2012, both the foreign trade deficit and the current account deficit contracted significantly. Besides, recent surge in gold exports also contributed to the improvement in the current account deficit. However, due to the fact that the current levels of the gold exports are not sustainable in the long term and also due to the increasing expectations that the market conditions would recover in the coming period with the support of credit rating upgrade, the improvement in the current account deficit is anticipated to lose pace during 2013.
Increase in portfolio investments, decrease in foreign banks' FX
deposits…
Improvement in the current account deficit is anticipated to lose pace.

5
Economic Research Division December 2012
Central Government Budget posted a deficit of TL4.4 billion in October. In first ten months of the year, the budget deficit and the primary surplus realized as TL18.8 billion and TL24.5 billion, respectively. Central Government Budget
October Annual %
Dişim
Jan.-Oct. Annual %
Change
Budget
Target* (TL billion) 2012 Change 2011 2012
Expenditures 31.7 29.2 245.4 289.8 18.1 362.7
Interest Exp. 3.7 37.4 37.5 43.3 15.4 49.0
Non-interest Exp. 28.0 28.2 208.0 246.5 18.5 313.7
Revenues 27.3 20.8 243.7 271.0 11.2 329.2
Tax Revenues 24.2 22.7 208.1 226.2 8.7 278.8
Other Revenues 3.1 7.7 35.6 44.9 26.0 50.4
Budget Balance -4.4 126.9 -1.7 -18.8 - -33.5
Primary Balance -0.7 - 35.8 24.5 -31.5 15.5
*2012 year-end forecasts of Central Government Budget Draft Law Source: Ministry of Finance
Tax revenues increased by 22.7% compared to the same month of the previous year thanks to the tax adjustments which have been effective since October. The 43% rise in Domestic VAT and 32% rise in Special Consumption Tax were influential in the increase of tax revenues. Despite the rapid rise in October, tax revenues recorded a limited increase of 8.7% in the first ten months of 2012 compared to the same period of the previous year due to weak course of domestic demand. During January-October 201, total budget revenues increased by 11.2%. During the first ten months of the year, budget expenditures increased by 18.1% compared to the same period of the previous year. In this period, 22.2% rise in current transfers contributed to the increase in total budget expenditures by 7.9 points. During the same period, personnel expenditures, which increased by 18.9%, were also influential on the widening of budget deficit. CBRT, at its meeting held on November 20
th, cut the O/N lending rate by a further
50 basis points to 9.0% and kept the one-week repo rate (the policy rate) at 5.75%. CBRT kept its supportive policy stance by decreasing the O/N lending rate third time in a row. In the announcement following the Monetary Policy Committee meeting, CBRT noted that year-end inflation will be lower than forecasted in the October Inflation Report (7.4%), owing to the favorable course of unprocessed food prices.
Source: CBRT
CBRT increased the Reserve Option Coefficients (ROC) to support financial stability. In this context, ROCs were increased by 0.1 point for all tranches of FX reserves (except the first tranche of 40%) and by 0.2 point for all tranches of gold
4
5
6
7
8
9
10
11
12
13
Jan
-12
Fe
b-1
2
Ma
r-12
Ap
r-12
Ma
y-1
2
Jun
-12
Jul-1
2
Au
g-1
2
Se
p-1
2
Oct-
12
Nov-1
2
Weighted Average Cost of the CBRT Funding and Interest Rate of the Benchmark Treasury Bond (%)
Weighted Average Cost of the CBRT Funding
Benchmark Treasury Bond
Budget deficit reached
TL18.8 billion in October.
Tax adjustments supported the budget
expenditures in October.
Current transfers put pressure on budget expenditures.
CBRT continued to narrow the interest rate
corridor.
Reserve option coefficients were increased.

6
Economic Research Division December 2012
reserves which might be held for Turkish Lira reserve requirements. According to
CBRT’s statement, if the facility is used at the same level, FX reserves and gold reserves are expected to increase by $500 million and $1.8 billion, respectively.
BANKING SECTOR According to the BRSA Weekly Bulletin, as of November 23
rd, total deposit volume
increased by 8.5% compared to the year-end of 2011 and reached TL793 billion. The growth rate in total deposit volume throughout 2012 was one of the lowest recorded in recent years. The deceleration in deposit growth stemmed mainly from the low rate of increase in domestic savings accompanied by the investor’s increasing demand for bank’s bond issuances. In addition, the banking sector has been tending towards finding alternative non-depositary sources in order to lower the funding costs, to reduce the maturity mismatch in the balance sheet by extending the maturity of liabilities and to diversify its funding sources. In this context, the banking sector has also increased the amount of funding via borrowing from international markets and security issues. Analyzing the deposit growth according to the currency composition, as of November 23
rd, TL deposits increased by 9.9% and FX deposits increased by
6%compared to the year-end of 2011. The increase in FX deposits in USD terms was 12.1%. Credit volume has been increasing faster than the deposit volume. As of November 23
rd, 2012, total credit volume increased by 12.3% compared to year-end and
reached TL779 billion. In this period, TL credit volume rose by 17.1% and realized as TL575 billion. FX loans in USD terms, on the other hand, expanded by 6.7% and reached $115 billion.
Source: BRSA Weekly Bulletin
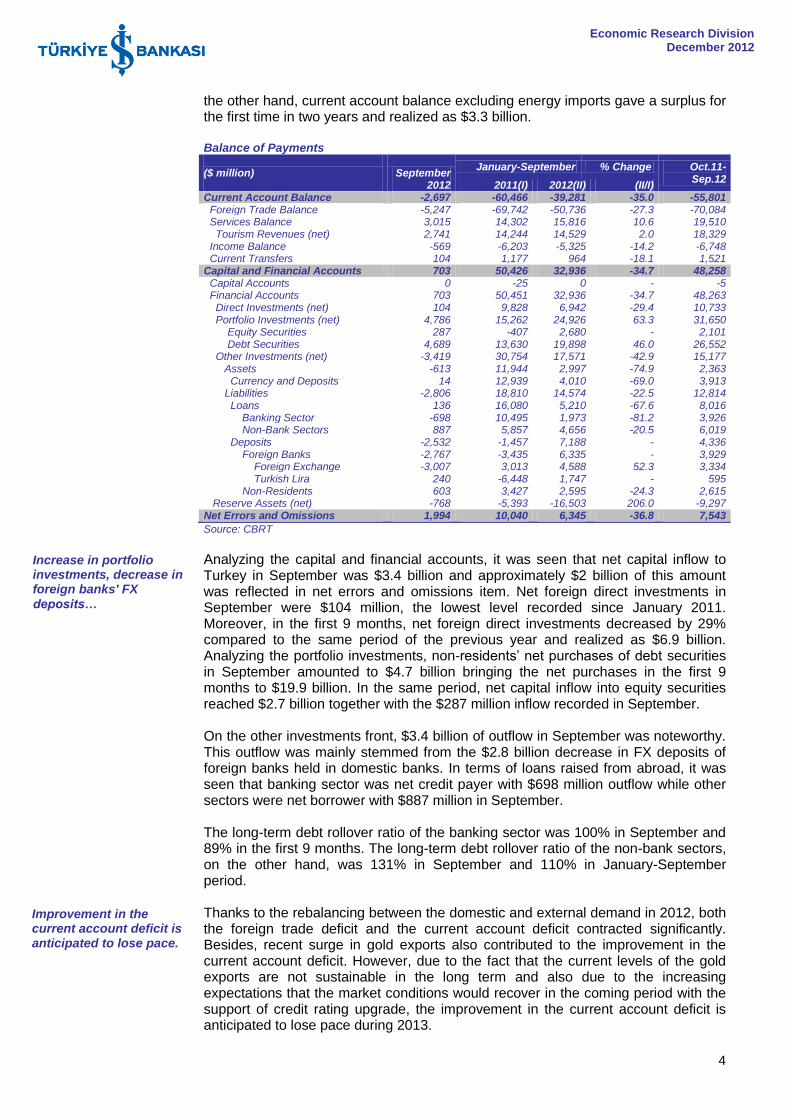
Analysis of the credit growth according to credit types revealed that consumer and commercial loans increased by 12.3% and 12.5%, respectively compared to the year-end. On the other hand, 23.8% increase in retail credit card volume was noteworthy. Non-performing loans ratio of the banking sector has started to follow an upward trend since the second half of the year reflecting the impacts of the weak domestic economic activity. Thus, the NPL ratio increased from its lowest level of 2.6% in June 2012 to 3% as of November 23
rd. According to the banking groups, the NPL
ratio of private banks followed a relatively flat course while the ratio increased more rapidly in public and foreign banks.
-4
-2
0
2
4
6
8
10
12
14
Jan
-12
Fe
b-1
2
Ma
r-12
Ap
r-12
Ma
y-1
2
Jun
-12
Jul-1
2
Au
g-1
2
Se
p-1
2
Oct-
12
Nov-1
2
Deposit and Credit Volume (year to date % change)
Kredi
Mevduat
Credit Volume
Deposit Volume
Limited increase in deposit
volume…
Credit volume increased by 12.3% compared to the
year-end.
Non-performing loans…
7
Economic Research Division December 2012
Source: BRSA Weekly Bulletin
CBRT’s monetary policy which has become more supportive of economic activity since June and the recent cuts in the upper bound of the interest rate corridor led the weighted average cost of the CBRT funding to decline significantly. The decline in funding costs also started to be reflected to the credit rates.
(*)Weighted average interest rates for Turkish Lira bank loans Source: CBRT
Due to the fact that banks leaned more towards lending rather than investing in securities and the continued sales from the portfolio, the securities portfolio has been shrinking. In fact, As of November 23
rd, 2012, banking sector securities
portfolio contracted by 4.4% compared to the year-end of 2011 and realized as TL273 billion. As of November 23
rd, 2012, volume of securities portfolio held in custody accounts
increased by 29.7% compared to the year-end of 2011 and reached TL212 billion. In this period, residents’ and non-residents’ portfolio expanded by 11.2% and 55.2%, respectively. As of November 23
rd, 2012, net FX position of the banking sector was (+) $1,805
million. Banks’ on-balance sheet FX position was (-) $13,903 million while off-balance sheet FX position was (+) $15,708 million.
Downside risks to global economic activity have remained in the last quarter of the year due to the uncertainties originating from the Euro Area and the US economies. However, the risk perception is expected to improve somewhat in the coming period as a result of the steps taken in order to the eliminate the said uncertainties.
4.0
4.1
4.2
4.3
4.4
4.5
4.6
4.7
4.8
4.9
5.0
2.0
2.2
2.4
2.6
2.8
3.0
3.2
3.4
Jan
-12
Fe
b-1
2
Ma
r-12
Ap
r-12
Ma
y-1
2
Jun
-12
Jul-1
2
Au
g-1
2
Se
p-1
2
Oct-
12
Nov-1
2
NPL ratio (%)
Kamu
Özel
Yabancı (Sağ Eksen)
Public
Private
Foreign (right axis)
10
12
14
16
18
20
22
24
Jan
-12
Fe
b-1
2
Ma
r-12
Ap
r-12
Ma
y-1
2
Jun
-12
Jul-1
2
Au
g-1
2
Se
p-1
2
Oct-
12
Nov-1
2
Credit Rates (%)* Nakit
Konut
Taşıt
Ticari
Cash
Housing
Vehicle
Commercial
Volume of securities portfolio has continued to decline.
Securities portfolio held in custody accounts…
Net FX position of the banking sector was (+) $1,805million…
Expectations…
Decline in credit rates…

8
Economic Research Division December 2012
In Turkey, on the other hand, risks related to current account deficit and inflation have eased remarkably. In addition, CBRT have started to implement monetary policy which is more supportive of economic activity since June. In this context, Fitch's upgrade of Turkey's credit rating to investment grade led to positive decoupling of domestic markets from the fluctuations in the international markets. In the case of an acceleration in capital inflows towards Turkey following the credit rating upgrade which might risk the sustainability of financial stability, additional macroprudential measures coould be taken by the CBRT in the coming period. In fact, CBRT Governor already warned that necessary policy measures would be taken depending on the level of the appreciation of Turkish Lira following Fitchs’s upgrade. Thus, CBRT is expected to manage the process preferably by using the interest rate corridor and adjusting the ROCs. Should the appreciation in the Turkish Lira accelerate, CBRT is expected to react via the policy rate.
Source: CBRT, Turkstat, Isbank Economic Research Division
9
INDUSTRIAL PRODUCTION
TURKISH ECONOMY AT A GLANCE
GROWTH
FOREIGN TRADE
INFLATION
2.9
-20
-15
-10
-5
0
5
10
15
2007/1
2007/2
2007/3
2007/4
2008/1
2008/2
2008/3
2008/4
2009/1
2009/2
2009/3
2009/4
2010/1
2010/2
2010/3
2010/4
2011/1
2011/2
2011/3
2011/4
2012/1
2012/2
GDP Annual Growth Rate (%)
-17
-12
-7
-2
3
8
13
2007
/1
2007
/2
2007
/3
2007
/4
2008
/1
2008
/2
2008
/3
2008
/4
2009
/1
2009
/2
2009
/3
2009
/4
2010
/1
2010
/2
2010
/3
2010
/4
2011
/1
2011
/2
2011
/3
2011
/4
2012
/1
2012
/2
Contribution To Growth By Sectors (%)
Services
Construction
Industry
Agriculture
GDP
11.6
-5.6
-20
-10
0
10
20
30
40
50
60
No
v.1
1
Dec.1
1
Jan
.12
Fe
b.1
2
Ma
r.12
Ap
r.1
2
May.1
2
Ju
n.1
2
Ju
l.1
2
Au
g.1
2
Sep
.12
Oct.
12
Foreign Trade (Annual % Change)
Exports
Imports
0.38 1.66
-3
-2
-1
0
1
2
3
Dec
.11
Ja
n.1
2
Feb
.12
Mar.
12
Ap
r.12
May
.12
Ju
n.1
2
Ju
l.12
Au
g.1
2
Se
p.1
2
Oc
t.1
2
No
v.1
2
Monthly Inflation (%)
CPI
PPI
6.37
3.60
2
4
6
8
10
12
14
16
De
c.1
1
Jan
.12
Fe
b.1
2
Ma
r.1
2
Ap
r.12
Ma
y.1
2
Ju
n.1
2
Ju
l.1
2
Au
g.1
2
Sep
.12
Oct.
12
No
v.1
2
Annual Inflation(%)
CPI
PPI
19.2
14.0
10.6 8.9 8.2
7.0 7.0
3.8
12.1
7.5 8.5
3.7 1.5 4.4
2.6 1.5
5.9
3.0 3.3
-1.8
6.2
-5
0
5
10
15
20
25
30
J F M A M J J A S O N D
Industrial Production (Annual % Change)
2011 2012
76.9
74.0
65
70
75
80
J F M A M J J A S O N D
Capacity Utilization Ratio (%)
2011 2012
45
50
55
60
65
70
75
80
85
0
1
2
3
4
5
6
7
8
Oct.
11
No
v.1
1
Dec.1
1
Jan
.12
Fe
b.1
2
Ma
r.12
Ap
r.1
2
May.1
2
Ju
n.1
2
Ju
l.1
2
Au
g.1
2
Sep
.12
12 Months Monthly Current Account Deficit ($ billion)
Monthly
12 Months

10
FX MARKETS
BOND-BILL MARKETS
Source: CBRT, Reuters, Ministry of Development, Istanbul Stock Exchange, JP Morgan, Chicago Board Options Exchange, Isbank Economic Research Division
1.4
1.6
1.8
2.0
2.2
2.4
2.6
Dec.1
1
Jan
.12
Fe
b.1
2
Ma
r.12
Ap
r.1
2
May.1
2
Ju
n.1
2
Ju
l.1
2
Au
g.1
2
Sep
.12
Oct.
12
No
v.1
2
FX Rates
€/TL $/TL Currency Basket (0.5*€+0.5*$)
1.15
1.20
1.25
1.30
1.35
1.40
1.45
Dec.1
1
Jan
.12
Feb
.12
Mar.
12
Ap
r.1
2
May.1
2
Ju
n.1
2
Ju
l.1
2
Au
g.1
2
Sep
.12
Oct.
12
No
v.1
2
€/$ Parity
€/$
Moving Average-30Day
7.1
7
8
9
10
11
Dec.1
1
Jan
.12
Fe
b.1
2
Ma
r.12
Ap
r.1
2
Ma
y.1
2
Ju
n.1
2
Ju
l.12
Au
g.1
2
Sep
.12
Oct.
12
No
v.1
2Average Compound Yields in Treasury Auctions (%)
-0.7
-1
0
1
2
3
4
5
Dec.1
1
Jan
.12
Fe
b.1
2
Ma
r.12
Ap
r.1
2
May.1
2
Ju
n.1
2
Ju
l.1
2
Au
g.1
2
Sep
.12
Oct.
12
No
v.1
2
Expected Real Yield of TRY GDDIs (%)
150
200
250
300
350
400
450
Dec.1
1
Jan
.12
Fe
b.1
2
Ma
r.12
Ap
r.12
Ma
y.1
2
Ju
n.1
2
Ju
l.12
Au
g.1
2
Sep
.12
Oct.
12
No
v.1
2
Risk Premiums
EMBI+
EMBI+(TR)
10
20
30
Dec.1
1
Jan
.12
Fe
b.1
2
Mar.
12
Ap
r.1
2
May.1
2
Ju
n.1
2
Ju
l.1
2
Au
g.1
2
Sep
.12
Oct.
12
No
v.1
2
Volatility Index (VIX)

Source: CBRT, Turkstat
11
SURVEY OF EXPECTATIONS AND OTHER LEADING INDICATORS
3.2
2
3
4
5
6
7
8
Dec. 1st
2n
d
2012 J
an
. 1st
2n
d
Fe
b. 1
st
2n
d
Mar.
1st
2n
d
Ap
r. 1
st
2n
d
May. 1st
2n
d
Ju
n. 1
st
2n
d
Ju
l. 1
st
2n
d
Au
g. 1.
2n
d
Sep
. 1
.
2n
d
Oct.
1.
2n
d
No
v.
1.
2n
d
Expected GDP Growth For The Current Year (%)
7.20
6
7
8
9
10
11
Dec.
1st
2n
d
2012 J
an
. 1st
2n
d
Fe
b. 1
st
2n
d
Ma
r. 1
st
2n
d
Ap
r. 1
st
2n
d
May. 1
st
2n
d
Ju
n. 1s
t
2n
d
Ju
l. 1
st
2n
d
Au
g.
1.
2n
d
Sep
. 1.
2n
d
Oct.
1.
2n
d
No
v. 1.
2n
d
Expected CPI By The End Of The Year (%)
58,327
55,000
60,000
65,000
70,000
75,000
80,000
De
c. 1
st
2n
d
2012
Ja
n. 1
st
2n
d
Feb
. 1st
2n
d
Mar.
1st
2n
d
Ap
r. 1
st
2n
d
Ma
y. 1
st
2n
d
Ju
n. 1st
2n
d
Ju
l. 1
st
2n
d
Au
g.
1.
2n
d
Sep
. 1
.
2n
d
Oct.
1.
2n
d
No
v.
1.
2n
d
Expected Current Account Deficit For The Current Year ($ million)
1.7989
1.65
1.80
1.95
Dec
. 1
st
2n
d
20
12
Jan
. 1
st
2n
d
Feb
. 1
st
2n
d
Mar.
1s
t
2n
d
Ap
r. 1
st
2n
d
May
. 1s
t
2n
d
Ju
n. 1
st
2n
d
Ju
l. 1
st
2n
d
Au
g.
1.
2n
d
Se
p. 1.
2n
d
Oc
t. 1
.
2n
d
No
v. 1
.
2n
d
Expected US Dollar Rate In The Interbank FX Market By The End Of The Year (TRY)
6.64
6
7
8
Dec
. 1
st
2n
d
20
12
Jan
. 1
st
2n
d
Fe
b. 1
st
2n
d
Mar.
1s
t
2n
d
Ap
r. 1
st
2n
d
May
. 1s
t
2n
d
Ju
n. 1
st
2n
d
Ju
l. 1
st
2n
d
Au
g.
1.
2n
d
Se
p. 1.
2n
d
Oc
t. 1
.
2n
d
No
v. 1
.
2n
d
Expected Annual CPI By The Next 12 Months (%)
85.7
No
v.1
1
Dec.1
1
Jan
.12
Fe
b.1
2
Mar.
12
Ap
r.1
2
May.1
2
Ju
n.1
2
Ju
l.1
2
Au
g.1
2
Sep
.12
Oct.
12
Consumer Confidence Index

12
ECONOMIC INDICATORS
GROWTH 2006 2007 2008 2009 2010 2011 2012Q1 2012Q2
GDP ($ million) 526,429 648,754 742,094 616,703 731,608 774,188
GDP Growth Rate (%) 6.9 4.7 0.7
-4.8 9.2 8.5 3.3 2.9
INFLATION (%) 2006 2007 2008 2009 2010 2011 Sep.12 Oct.12 Nov.12
PPI (annual) 11.58 5.94 8.11 5.93 8.87 13.33 4.03 2.57 3.60
CPI (annual) 9.65 8.39 10.06 6.53 6.40 10.45 9.19 7.80 6.37
FX RATES 2006 2007 2008 2009 2010 2011 Sep.12 Oct.12 Nov.12
CPI Based Real Effective FX Rate Index 111.9 131.3 115.0 116.8 125.7 109.5 116.2 117.4 119.2
$/TRY 1.4131 1.1647 1.5123 1.5057 1.5460 1.9065 1.7820 1.7928 1.7797
Euro/TRY 1.8586 1.7102 2.1408 2.1603 2.0491 2.4592 2.2929 2.3216 2.3108
Euro/$ 1.3196 1.4589 1.3978 1.4316 1.3377 1.2945 1.2858 1.2958 1.2984
BALANCE OF PAYMENTS(1)
($ million)
2006 2007 2008 2009
2010
2011 Sep.12
Exports 93,613 115,361 140,800 109,647 120,902 143,396 120,297
Imports 134,669 162,213 193,821 134,497 177,347 232,488 171,033
Foreign Trade Balance -41,056 -46,852 -53,021 -24,850 -56,445 -89,090 -50,736
Current Account Balance -32,249 -38,434 -41,524 -13,370 -46,643 -76,986 -39,281
CREDIT UTILIZATION FROM ABROAD
(1) ($ million)
2006 2007 2008 2009 2010 2011
Sep.12
Banks 5,814 5,609 3,267 -4,450 12,913 12,478 1,973
Long Term 9,766 7,272 928 -1,662 895 5,553 -837
Short Term -3,952 -1,663 2,339 -2,788 12,018 6,895 2,810
Other Sectors 18,812 26,612 23,407 -10,070 -4,637 7,220 4,656
Long Term 18,317 26,398 22,888 -9,368 -6,071 4,303 1,890
Short Term 495 214 519 -702 1,434 2,917 2,766
BUDGET (TRY million) (1)(2)
2006 2007 2008 2009 2010 2011 Sep.12 Oct.12 Aug.10
Expenditures 178,126 204,068 227,031 268,219 294,359 314,607 258,041 289,791
Interest Expenditures 45,963 48,753 50,661 53,201 48,299 42,232 39,533 43,256
Non-Interest Expenditures 132,163 155,315 176,369 215,018 246,060 272,375 218,508 246,534
Revenues 173,483 190,360 209,598 215,458 254,277 296,824 243,691 271,037
Tax Revenues 137,480 152,835 168,109 172,440 210,560 253,809 201,939 226,177
Other Revenues 36,003 37,525 41,490 43,018 43,715 43,014 41,752 44,860
Budget Balance -4,643 -13,708 -17,432 -52,761 -40,081 -17,783 -14,350 -18,754
Primary Balance 41,320 35,045 33,229 440 8,217 24,448 25,183 24,502
CENTRAL GOVERNMENT DEBT STOCK ($ billion)
2006 2007 2008 2009 2010 2011 Sep.12 Oct.12
Domestic Debt Stock 178.9 219.2 181.7 219.2 228.2 195.2 217.2 218.3
External Debt Stock 66.6 67.1 69.8 74.1 78.1 79.2 80.0 81.1
Total 245.5 286.3 251.5 293.2 306.3 274.4 297.2 299.4
Source: Turkstat, CBRT, Treasury, Ministry of Finance, Reuters (1) Cumulative figures (2) According to the Central Government Budget.

13
DEPOSITS 2008 2009 2010 2011(I) Oct.12 23.Nov.12(II) Change* (%)
(II/I)
Total Deposits (TRY million) 464,234 531,492 644,583 731,074 783,569 793,213 8.5
TRY 299,270 348,167 447,551 473,408 511,490 520,165 9.9
FX 164,965 183,325 197,032 257,667 272,079 273,048 6.0
FX ($ million) 111,321 123,185 128,610 137,259 152,724 153,930 12.1
FX deposits/Total deposits (%) 35.5 34.5 30.6 35.2 34.7 34.4 -
SECURITIES HELD IN CUSTODY ACCOUNTS (TRY million) (market value)
2008 2009 2010 2011(I) Oct.12 23.Nov.12(II) Change* (%)
(II/I)
Total 96,779 115,255 127,965 163,524 206,836 212,116 29.7
Residents 69,739 88,363 87,372 94,870 105,683 105,539 11.2
Non-Residents 27,040 26,892 40,593 68,654 101,154 106,577 55.2
SECURITIES PORTFOLIO (TRY million) 2008 2009 2010 2011(I) Oct.12 23.Nov.12(II) Change* (%) (II/I)
Total 192,834 262,852 287,902 285,029 276,449 272,597 -4.4
CREDITS (TRY million) 2008 2009 2010 2011(I) Oct.12 23.Nov.12(II) Change* (%)
(II/I)
Credit Volume 373,862 400,510 535,336 693,395 771,808 778,831 12.3
TRY 267,093 293,425 389,329 490,846 566,182 574,680 17.1
FX 106,770 107,085 146,007 202,549 205,626 204,151 0.8
Retail Loans 156,029 168,693 227,985 301,237 343,577 346,834 15.1
Consumer and Installment Com. Loans 121,799 131,213 182,794 243,296 270,074 273,315 12.3
Consumer Loans 83,219 93,319 129,041 168,429 187,014 189,066 12.3
Housing 39,278 44,896 60,800 74,588 82,439 83,633 12.1
Automobile 5,530 4,421 5,666 7,365 7,722 7,737 5.1
Personal Finance Loans 33,206 38,396 45,843 62,086 65,338 65,669 5.8
Consumer and Commercial Credit Cards 34,230 37,480 45,191 57,941 73,503 73,519 26.9
Retail Loans/Total Credits (%) 41.7 42.1 42.6 43.4 44.5 44.5 -
NPL RATIO (%) 2008 2009 2010 2011 Oct.12 23.Nov.12
Total Loans 3.4 5.1 3.6 2.6 2.9 3.0
Retail Loans 3.8 6.6 4.4 3.0 3.1 3.2
Consumer and Installment Com. Loans 2.9 5.4 3.5 2.4 2.6 2.6
Consumer Loans 2.2 4.1 2.7 1.9 2.1 2.2
Consumer and Commercial Credit Cards 6.7 10.4 7.9 5.7 5.3 5.5
BANKING SECTOR NET FX POSITION ($ million)
2008 2009 2010 2011 Oct.12 23.Nov.12
Total 16 408 41 315 2,076 1,805
On-Balance Sheet -3,015 -11,528 -13,917 -17,764 -16,043 -13,903
Off-Balance Sheet 3,032 11,936 13,958 18,079 18,120 15,708
Source: BRSA (*) Year to date change
BANKING SECTOR

14
Contact Info
Name Title Phone E-mail
İzlem Erdem Manager +90 (212) 316 16 52 [email protected]
Alper Gürler Assistant Manager +90 (212) 316 16 81 [email protected]
Kıvılcım Eraydın Economist +90 (212) 316 16 86 [email protected]
H. Erhan Gül Economist +90 (212) 316 16 72 [email protected]
Bora Çevik Assistant Economist +90 (212) 316 16 83 [email protected]
Eren Demir Assistant Economist +90 (212) 316 16 73 [email protected]
Mustafa Kemal Gündoğdu Assistant Economist +90 (212) 316 16 93 kemal.gundogdu@isbank,com,tr
Gamze Can Assistant Economist +90 (212) 316 16 74 gamze.can@isbank,com,tr
This report has been prepared by Türkiye İş Bankası A.Ş. economists and analysts by using the information from publicly available sources believed to be reliable, solely for information purposes; and they are not intended to be construed as an offer or solicitation for the purchase or sale of any financial instrument or the provision of an offer to provide investment services. The views, opinions and analyses expressed do not represent the official standing of Türkiye İş Bankası A.Ş. and are personal views and opinions of the analysts and economists who prepare the report. No representation or warranty, express or implied, is made as to the accuracy or completeness of the information contained in this report. All information contained in this report is subject to change without notice, Türkiye İş Bankası A,Ş, accepts no liability whatsoever for any direct or consequential loss arising from any use of this report or its contents.
This report is copyright-protected. Reproducing, publishing and/or distributing this report in whole or in part is therefore prohibited. All rights reserved.