monthly bulletin january 2012 - european central bank - europa
TRANSCRIPT

EURO
PEAN
CEN
TRAL
BAN
K M
ONTH
LY B
ULLE
TIN
EN
011201202120120312012041201205120120612012071201208120120912012101201211120121212012
MONTHLY BULLET INJANUARY
0112
012
-2012_EN

MONTHLY BULLET IN
JANUARY 2012
In 2012 all ECBpublications
feature a motiftaken from
the €50 banknote.

© European Central Bank, 2012
Address Kaiserstrasse 29
60311 Frankfurt am Main
Germany
Postal address Postfach 16 03 19
60066 Frankfurt am Main
Germany
Telephone +49 69 1344 0
Website http://www.ecb.europa.eu
Fax +49 69 1344 6000
This Bulletin was produced under the responsibility of the Executive Board of the ECB. Translations are prepared and published by the national central banks.
All rights reserved. Reproduction for educational and non-commercial purposes is permitted provided that the source is acknowledged.
The cut-off date for the statistics included in this issue was 11 January 2012.
ISSN 1561-0136 (print)
ISSN 1725-2822 (online)

3ECB
Monthly Bulletin
January 2012
EDITORIAL 5
ECONOMIC AND MONETARY
DEVELOPMENTS
The external environment of the euro area 9
Monetary and fi nancial developments 17
Prices and costs 39
Output, demand and the labour market 50
Boxes:
The recent weakness in world trade 1 14
Money growth and uncertainty 2 18
Recent improvement in the euro area’s 3
international investment position 25
The impact of the fi rst 4 three-year
longer-term refi nancing operation 30
The evolution of consumer prices 5
for oil products in 2011 39
Factors limiting the scope available 6
for increases in domestic prices 44
Revised activity classifi cation (NACE) 7
in national accounts 53
ART ICLES
The interplay of fi nancial intermediaries
and its impact on monetary analysis 59
Towards an integrated European card
payments market 75
EURO AREA STATISTICS S1
ANNEXES
Chronology of monetary policy
measures of the Eurosystem I
Publications produced by the European
Central Bank V I I
Glossary IX
CONTENTS

4ECB
Monthly Bulletin
January 2012
ABBREVIATIONS
COUNTRIES LU Luxembourg
BE Belgium HU Hungary
BG Bulgaria MT Malta
CZ Czech Republic NL Netherlands
DK Denmark AT Austria
DE Germany PL Poland
EE Estonia PT Portugal
IE Ireland RO Romania
GR Greece SI Slovenia
ES Spain SK Slovakia
FR France FI Finland
IT Italy SE Sweden
CY Cyprus UK United Kingdom
LV Latvia JP Japan
LT Lithuania US United States
OTHERS
BIS Bank for International Settlements
b.o.p. balance of payments
BPM5 IMF Balance of Payments Manual (5th edition)
CD certifi cate of deposit
c.i.f. cost, insurance and freight at the importer’s border
CPI Consumer Price Index
ECB European Central Bank
EER effective exchange rate
EMI European Monetary Institute
EMU Economic and Monetary Union
ESA 95 European System of Accounts 1995
ESCB European System of Central Banks
EU European Union
EUR euro
f.o.b. free on board at the exporter’s border
GDP gross domestic product
HICP Harmonised Index of Consumer Prices
HWWI Hamburg Institute of International Economics
ILO International Labour Organization
IMF International Monetary Fund
MFI monetary fi nancial institution
NACE statistical classifi cation of economic activities in the European Union
NCB national central bank
OECD Organisation for Economic Co-operation and Development
PPI Producer Price Index
SITC Rev. 4 Standard International Trade Classifi cation (revision 4)
ULCM unit labour costs in manufacturing
ULCT unit labour costs in the total economy
In accordance with EU practice, the EU countries are listed in this Bulletin using the alphabetical order of the country names in the national languages.

5ECB
Monthly Bulletin
January 2012
Based on its regular economic and monetary
analyses, the Governing Council decided at
its meeting on 12 January 2012 to keep the
key ECB interest rates unchanged, following
the 25 basis point decreases on 3 November
and 8 December 2011. The information that
has become available since early December
broadly confi rms the previous assessment of the
Governing Council. Infl ation is likely to stay
above 2% for several months to come, before
declining to below 2%. At the same time, the
underlying pace of monetary expansion remains
moderate. As expected, ongoing fi nancial
market tensions continue to dampen economic
activity in the euro area, while, according to
some recent survey indicators, there are tentative
signs of a stabilisation in activity at low levels.
The economic outlook remains subject to high
uncertainty and substantial downside risks.
In such an environment, cost, wage and price
pressures in the euro area should remain modest
and infl ation rates should develop in line with
price stability over the policy-relevant horizon.
Overall, it is essential for monetary policy to
maintain price stability over the medium term,
thereby ensuring a fi rm anchoring of infl ation
expectations in the euro area in line with the
Governing Council’s aim of maintaining
infl ation rates below, but close to, 2% over the
medium term. Such anchoring is a prerequisite
for monetary policy to make its contribution
towards supporting economic growth and job
creation in the euro area. A very thorough
analysis of all incoming data and developments
over the period ahead is warranted.
The provision of liquidity and the allotment
modes for the Eurosystem’s refi nancing
operations will continue to support euro
area banks, and thus the fi nancing of the real
economy. The extensive recourse to the fi rst
three-year refi nancing operation indicates
that the ECB’s non-standard monetary policy
measures are providing a substantial contribution
to improving the funding situation of banks,
thereby supporting fi nancing conditions and
confi dence. In addition, the Eurosystem is
actively working towards the implementation
of all the measures announced on 8 December,
which should provide additional support to the
economy. As stated on previous occasions, all
the non-standard monetary policy measures are
temporary in nature.
As regards the economic analysis, real GDP
in the euro area grew by 0.1% quarter on
quarter in the third quarter of 2011. At present,
a number of factors seem to be dampening the
underlying growth momentum in the euro area.
They include moderate global demand growth
and weak business and consumer confi dence in
the euro area. Domestic demand is likely to be
dampened by the ongoing tensions in euro area
sovereign debt markets, as well as the process
of balance sheet adjustment in the fi nancial
and non-fi nancial sectors. At the same time,
the Governing Council continues to expect
euro area economic activity to recover, albeit
very gradually, in the course of 2012, supported
by developments in global demand, very low
short-term interest rates and all the measures
taken to support the functioning of the fi nancial
sector.
In the Governing Council’s assessment,
substantial downside risks to the economic
outlook for the euro area continue to exist
in an environment of high uncertainty. They
notably relate to a further intensifi cation of
the tensions in euro area debt markets and
their potential spillover to the euro area real
economy. Downside risks also relate to the
global economy, protectionist pressures and the
possibility of a disorderly correction of global
imbalances.
With regard to price developments, euro
area annual HICP infl ation was 2.8% in
December 2011, according to Eurostat’s fl ash
estimate, after 3.0% in the preceding three
months. This decline was expected and refl ects
a downward base effect stemming from energy
prices. Infl ation rates have been at elevated
levels since the end of 2010, mainly driven
by higher energy and other commodity prices.
Looking ahead, they are likely to stay above 2%
for several months to come, before declining to
below 2%. This pattern refl ects the expectation
EDITORIAL

6ECB
Monthly Bulletin
January 2012
that, in an environment of weaker growth in the
euro area and globally, underlying cost, wage
and price pressures in the euro area should
remain modest.
The Governing Council continues to view the
risks to the medium-term outlook for price
developments as broadly balanced. On the
upside, the main risks relate to further increases
in indirect taxes and administered prices, owing
to the need for fi scal consolidation in the coming
years, and possible increases in commodity
prices. The main downside risks relate to the
impact of weaker than expected growth in the
euro area and globally.
Turning to the monetary analysis, taking
the appropriate medium-term perspective,
the underlying pace of monetary expansion
continues to be moderate. The annual growth
rate of M3 decreased to 2.0% in November 2011,
after 2.6% in October. As in the previous three
months, monetary developments in November
were affected by the heightened uncertainty in
fi nancial markets.
The annual growth rate of loans to the private
sector, adjusted for loan sales and securitisation,
decreased to 1.9% in November, from 3.0%
in October. The annual growth rates of loans
to non-fi nancial corporations and loans to
households, adjusted for loan sales and
securitisation, both moderated in November,
and stood at 1.8% and 2.3% respectively,
with slightly negative monthly fl ows observed
for MFI loans to non-fi nancial corporations.
Overall, despite the moderation in loan growth,
the fi gures on lending do not so far suggest that
the heightened fi nancial market tensions led to
a sizeable curtailment of credit in the euro area
as a whole in the period to November. At the
same time, given that credit supply effects can
manifest themselves with lags, close scrutiny of
credit developments is warranted in the period
ahead.
The soundness of bank balance sheets, supported
by the increase in capital positions, will be a key
factor in facilitating an appropriate provision of
credit to the economy over time. It is essential
that the implementation of banks’ recapitalisation
plans does not result in developments that are
detrimental to the fi nancing of economic activity
in the euro area.
To sum up, incoming information broadly
confi rms the previous assessment of the
Governing Council. Infl ation is likely to stay
above 2% for several months to come, before
declining to below 2%. As expected, ongoing
fi nancial market tensions continue to dampen
economic activity in the euro area, while,
according to some recent survey indicators, there
are tentative signs of a stabilisation in activity
at low levels. The economic outlook remains
subject to high uncertainty and substantial
downside risks. In such an environment, cost,
wage and price pressures in the euro area
should remain modest and infl ation rates should
develop in line with price stability over the
policy-relevant horizon. A cross-check with the
signals from the monetary analysis confi rms this
picture, with the underlying pace of monetary
expansion continuing to be moderate.
Turning to fi scal policies, euro area governments
need to do their utmost to support fi scal
sustainability by correcting excessive defi cits
in accordance with the agreed timetables and
by moving to a structural balanced budget or
surplus position over the medium term. Slippages
in the implementation of fi scal consolidation
plans of vulnerable countries must be corrected
swiftly by structural fi scal improvements. With
regard to the new provisions of the EU economic
governance framework that recently came
into force, it is crucial that all the elements be
implemented rigorously. Only ambitious policies
to prevent and correct macroeconomic and fi scal
imbalances will foster public confi dence in the
soundness of policy actions, and thus strengthen
overall economic sentiment.
The Governing Council welcomes the European
Council’s agreement to move to a stronger
economic union, which was announced on
9 December 2011. The new fi scal compact,
comprising a fundamental restatement of the

7ECB
Monthly Bulletin
January 2012
EDITORIAL
fi scal rules together with the fi scal commitments
that euro area governments have made, is an
important contribution to ensuring the long-run
sustainability of public fi nances in the euro
area countries. The wording of the rules needs
to be unambiguous and effective. The further
development of the European fi nancial stability
tools should make the operation of the European
Financial Stability Facility and the European
Stability Mechanism more effective. The swift
deployment of these tools is now urgently
needed. Concerning the involvement of the
private sector in fi nancial assistance for indebted
countries, the Governing Council welcomes the
reaffi rmation that the decisions taken on 21 July
and 26 and 27 October 2011 concerning Greek
debt are unique and exceptional.
To accompany fi scal consolidation, the
Governing Council calls for the urgent
implementation of bold and ambitious
structural reforms. Going hand in hand, fi scal
consolidation and structural reforms would
strengthen confi dence, growth prospects and
job creation. Key reforms should be rapidly
carried out to help the euro area countries to
improve competitiveness, increase the fl exibility
of their economies and enhance their longer-
term growth potential. Product market reforms
should focus on fully opening up markets to
increased competition. Labour market reforms
should focus on removing rigidities and
enhancing wage fl exibility.
This issue of the Monthly Bulletin contains two
articles. The fi rst article analyses the role and
changing patterns of fi nancial intermediation
in the euro area and examines the implications
for the conduct of monetary analysis. The
second article presents a market overview and
the economic principles and features of card
payments, identifying areas to be addressed in
order to achieve an integrated European card
payments market.


9ECB
Monthly Bulletin
January 2012
ECONOMIC AND MONETARYDEVELOPMENTS
The external
environment
of the euro area
ECONOMIC AND MONETARYDEVELOPMENTS
1 THE EXTERNAL ENVIRONMENT OF THE EURO AREA
Against a background of heightened uncertainty and continued stresses in fi nancial markets, the latest survey indicators suggest that, while global growth has been moderating in recent months, some tentative signs of stabilisation appear to be emerging. Infl ationary dynamics remain contained in advanced economies. In emerging economies, infl ation rates have lately experienced a modest decline, although underlying pressures persist.
1.1 DEVELOPMENTS IN THE WORLD ECONOMY
The global economy has experienced a loss of growth momentum in recent months, although some
tentative signs of stabilisation appear to be emerging. Looking ahead, notwithstanding the more
positive recent data releases, growth in the global economy is expected to remain sluggish. In the
medium term, the ongoing adjustment process is expected to continue to restrain the outlook for
growth. Risks mainly relate to the strains on both private and public sector balance sheets, as well
as to the continued weaknesses in labour and housing markets in some major advanced economies.
In emerging economies, the recent moderation in growth should assist in alleviating some of the
overheating pressures which have prevailed in certain economies.
In December 2011 the Purchasing Managers’ Index (PMI) for global all-industry output increased
to 53. While this is the highest reading since April 2011, it remains below the long-term average
level. The index for the global manufacturing sector nudged above the neutral 50 mark having
been below this threshold in the previous four months. Meanwhile the services sector continued
to remain in expansionary territory. The PMI component for new orders increased in December in
both the manufacturing and services sectors.
Infl ationary dynamics remain relatively contained in advanced economies. In the OECD area,
annual headline consumer price infl ation stood at 3.1% in November, compared with 3.2% in
Chart 1 Global PMI output
(diffusion index; seasonally adjusted; monthly data)
25
30
35
40
45
50
55
60
65
25
30
35
40
45
50
55
60
65
PMI output: overall
PMI output: manufacturing
PMI output: services
1999 2001 2003 2005 2007 2009 2011
Source: Markit.
Chart 2 International price developments
(monthly data; annual percentage changes)
-1
0
1
2
3
4
5
6
-1
0
1
2
3
4
5
6
1999 2001 2003 2005 2007 2009
OECD consumer prices (all items)
OECD consumer prices (all items excluding
food and energy)
2011
Source: OECD.

10ECB
Monthly Bulletin
January 2012
October. Excluding food and energy, the annual
infl ation rate remained unchanged at 2.0%
in November. In emerging economies, while
infl ation rates have lately experienced some
declines, underlying pressures persist.
UNITED STATES
In the United States, economic activity gained
momentum in the third quarter of 2011 after
growing at a slow pace in the fi rst half of the
year. According to the third estimate by the
Bureau of Economic Analysis, US real GDP
increased at an annual rate of 1.8% in the third
quarter of 2011 (0.5% on a quarter-on-quarter
basis). Although the pace of growth was
weaker than previously estimated, it was still
above the annualised rate of 1.3% recorded
in the second quarter of 2011. The expansion
in the third quarter was supported by growth
in consumer spending and by non-residential
fi xed investment, while residential investment
remained weak. Available monthly data point to
continued moderate expansion of the economy
in the fi nal quarter of 2011.
As regards price developments, annual CPI
infl ation declined to 3.4% in November 2011,
from 3.5% in the previous month. This is the
second consecutive decline from a peak of 3.9%
in September, mainly resulting from an easing in
commodity prices. Excluding food and energy,
CPI infl ation increased slightly to an annual
rate of 2.2%, compared with 2.1% in October.
Recent developments in core infl ation partly
refl ect some stabilisation in the growth of rental
costs in line with a distressed housing market,
after a sustained rise since mid-2010.
On 13 December 2011 the US Federal Open
Market Committee stated that, notwithstanding
some apparent slowing in global growth, recent
indicators point to a moderate expansion of the economy and some improvement in overall labour
market conditions. The Committee decided to maintain its target range for the federal funds rate
at 0.0% to 0.25% and continued to anticipate that economic conditions would be likely to warrant
exceptionally low levels for the federal funds rate at least until mid-2013. To enhance clarity and
transparency in public communication, the Committee would introduce several changes with effect
from its meeting in January 2012, including a decision to release participants’ projections of the
appropriate level of the target of the federal funds rate based on expectations regarding future
economic developments.
Chart 3 Main developments in major industrialised economies
euro area
United States
Japan
United Kingdom
Output growth 1)
(quarter-on-quarter percentage changes; quarterly data)
-6
-5
-4
-3
-2
-1
0
1
2
3
-6
-5
-4
-3
-2
-1
0
1
2
3
1999 2001 2003 2005 2007 2009 2011
Inflation rates 2)
(consumer prices; annual percentage changes; monthly data)
-3
-2
-1
0
1
2
3
4
5
6
-3
-2
-1
0
1
2
3
4
5
6
1999 2001 2003 2005 2007 2009 2011
Sources: National data, BIS, Eurostat and ECB calculations.1) Eurostat data are used for the euro area and the United Kingdom; national data are used for the United States and Japan. GDP fi gures have been seasonally adjusted.2) HICP for the euro area and the United Kingdom; CPI for the United States and Japan.

11ECB
Monthly Bulletin
January 2012
ECONOMIC AND MONETARYDEVELOPMENTS
The external
environment
of the euro area
JAPAN
In Japan, the recovery in economic activity from the Great East Japan Earthquake in March 2011
was confi rmed by the second release of national accounts data for the third quarter of last year,
although real GDP growth was revised downwards slightly to 1.4% quarter on quarter. For the
fourth quarter of 2011, recent indicators suggest a weakening of economic activity amid falling
global demand and supply disruptions caused by the fl oods in Thailand. Adjusted for changes in
export prices and seasonal fl uctuations, exports declined by 7.3% from September to November,
leading to a deterioration in the trade balance.
As regards consumer price developments, annual CPI infl ation dropped to -0.5% in November
(from -0.2% in October). At its latest monetary policy meeting on 21 December, the Bank of Japan
decided to maintain its target for the uncollateralised overnight call rate at around 0.0% to 0.1%.
UNITED KINGDOM
In the United Kingdom, economic activity has continued to be subdued. Most business and household
survey indicators have remained weak in recent months, although some of them improved slightly
in December 2011. The labour market situation has not shown any signs of improvement, and the
unemployment rate remained at 8.3%, on average, in the three months to October 2011. Overall,
growth in economic activity is likely to remain sluggish in the short term, although monetary stimuli
should provide support. Growth in domestic demand is expected to remain constrained by tight
credit conditions, ongoing household balance sheet adjustment and substantial fi scal tightening,
while the weakening of the outlook for external demand is likely to restrain export growth.
Infl ation has continued to ease, but remains elevated. Annual CPI infl ation and CPI infl ation
excluding energy and unprocessed food declined by 0.2 percentage point in November to 5.0% and
3.6% respectively. The gradual diminishing of certain temporary factors (higher past commodity
prices, large electricity price increases in the autumn of 2011 and the increase in the VAT rate in
January 2011), as well as the existence of spare capacity, should contribute to dampening infl ationary
pressures. The Bank of England’s Monetary Policy Committee maintained the offi cial Bank Rate
paid on commercial bank reserves at 0.5% and decided to keep the stock of asset purchases fi nanced
by the issuance of central bank reserves at GBP 275 billion in December.
CHINA
In China, economic growth is gradually slowing down, despite the economy having been largely
resilient to the worsening of the global outlook and PMIs indicating a slight improvement in
economic activity in December. However, nominal export growth declined to 13.4% year on year,
down from 13.8% in November. Fixed asset investment and industrial value added decelerated in
November, but only marginally, while retail sales growth remained robust. Macro-prudential policies
aimed at cooling the housing market are restraining real estate investment and sales volumes.
Annual CPI infl ation declined to 4.1% in December, down from 4.2% in November. The decrease
in CPI infl ation was mainly driven by non-food items. Domestic new lending and M2 accelerated
marginally in December after the People’s Bank of China reduced the reserve requirement ratio
by 50 basis points in late November. In December the central bank maintained the policy rates
and the reserve requirement ratio unchanged. At the annual Central Economic Work Conference,
authorities agreed that maintaining stable economic growth was the key policy priority for 2012,
together with economic restructuring and managing infl ation expectations.

12ECB
Monthly Bulletin
January 2012
1.2 COMMODITY MARKETS
Owing to a rally in the fi rst days of 2012, oil
prices increased overall between the beginning
of December and early January. Brent crude
oil prices stood at USD 113.4 per barrel on
11 January 2012, which is 21.6% higher than
at the beginning of 2011 and 2.4% higher than
at the beginning of December (see Chart 4).
Looking ahead, however, market participants
expect lower oil prices in the medium term, with
futures contracts for December 2013 trading at
USD 103.6 per barrel.
The overall increase in oil prices masked
an initial decline throughout the fi rst half
of December on account of worsening
macroeconomic news and a decision by OPEC
on 14 December to fi nally raise its production
quota. The decision, the fi rst in almost three
years, was expected to provide some support
to lean inventory levels. Since then, however, concerns over a major supply disruption in Iran in
relation to escalating tensions over its nuclear programme have pushed prices continuously higher.
In particular, recently imposed US sanctions and an agreed EU embargo on oil imports from Iran
from an as yet unspecifi ed date determined a rally in prices and appear to have overshadowed
concerns over the impact of uncertainty regarding the macroeconomic outlook on oil demand.
On aggregate, prices of non-energy commodities further decreased slightly in the course of
December. While both metal and food prices have to some extent been negatively affected by
concerns over slowing global growth, food prices, in particular grains, have recently been boosted
by prospects of supply disruptions related to dry weather in Latin America. In aggregate terms,
the price index for non-energy commodities (denominated in US dollars) was 14.8% lower towards
the end of December than at the beginning of 2011.
1.3 EXCHANGE RATES
During the last quarter of 2011 the nominal effective exchange rate of the euro, as measured
against the currencies of 20 of the euro area’s most important trading partners depreciated amid
continued elevated volatility. On 11 January 2012 the nominal effective exchange rate of the euro
was 4.1% below its level at the end of September 2011 and 5.0% below its average level in 2011
(see Chart 5).
In bilateral terms, over the past quarter the euro has depreciated against most major currencies.
Between 30 September 2011 and 11 January 2012 the euro declined against the US dollar by
5.8%, the pound sterling by 4.7%, the Japanese yen by 5.7%, and the Chinese renminbi by 6.8%.
The euro also depreciated against other Asian currencies, in particular against the Korean won,
the Hong Kong dollar and the Singapore dollar by 7.4%, 6.1% and 6.5% respectively, as well as
against the currencies of some commodity exporters. Over the same horizon the exchange rate of
Chart 4 Main developments in commodity prices
30
40
50
60
70
80
90
100
110
120
130
140
150
160
170
180
60
65
70
75
80
85
90
95
100
105
110
115
120
125
130
135
2008 2009 2010 2011
Brent crude oil (USD/barrel; left-hand scale)
non-energy commodities (USD; index: 2010 = 100;
right-hand scale)
Sources: Bloomberg and HWWI.

13ECB
Monthly Bulletin
January 2012
ECONOMIC AND MONETARYDEVELOPMENTS
The external
environment
of the euro area
the euro against the Swiss franc remained virtually unchanged. The single currency appreciated
vis-à-vis some other European currencies, most notably the Hungarian forint, the Czech koruna
and the Polish zloty, by 6.6%, 4.3% and 1.3% respectively (see Table 1). Market volatility,
as measured on the basis of foreign exchange option prices, increased in the period under review in
most currency pairs and currently stands well above long-term average levels.
Chart 5 Euro effective exchange rate (EER-20) and its decomposition 1)
(daily data)
Index: Q1 1999 = 100 Contributions to EER-20 changes 2)
From 30 September 2011 to 11 January 2012 (percentage points)
99
100
101
102
103
104
105
106
99
100
101
102
103
104
105
106
October JanuaryNovember
2011 2012
December
-4.0
-3.5
-3.0
-2.5
-2.0
-1.5
-1.0
-0.5
0.0
0.5
1.0
-4.5
-4.0
-3.5
-4.5
-3.0
-2.5
-2.0
-1.5
-1.0
-0.5
0.0
0.5
1.0
USD GBP JPY CNY CHF SEK OMS other EER-20
Source: ECB.1) An upward movement of the index represents an appreciation of the euro against the currencies of 20 of the most important trading partners of the euro area (including all non-euro area EU Member States). 2) Contributions to EER-20 changes are displayed individually for the currencies of the six main trading partners of the euro area. The category “Other Member States” (OMS) refers to the aggregate contribution of the currencies of the non-euro area Member States (except the pound sterling and the Swedish krona). The category “Other” refers to the aggregate contribution of the currencies of the remaining six trading partners of the euro area in the EER-20 index. Changes are calculated using the corresponding overall trade weights in the EER-20 index.
Table 1 Euro exchange rate developments 1)
(daily data; units of national currency per euro; percentage changes)
Weight in EER-20Level on
11 January 2012
Appreciation (+)/depreciation (-) of the euroas at 11 January 2012
since: compared with:30 September 2011 3 January 2011 average for 2011
US dollar 19.4 1.272 -5.8 -4.7 -8.6
Pound sterling 17.8 0.826 -4.7 -4.1 -4.8
Chinese renminbi 13.6 8.030 -6.8 -8.7 -10.7
Japanese yen 8.3 97.9 -5.7 -10.0 -11.8
Swiss franc 6.4 1.212 -0.4 -2.8 -1.7
Polish zloty 4.9 4.461 1.3 12.7 8.3
Swedish krona 4.9 8.809 -4.9 -1.4 -2.4
Czech koruna 4.1 25.82 4.3 2.9 5.0
Korean won 3.9 1,477 -7.4 -1.6 -4.2
Hungarian forint 3.1 311.9 6.6 12.0 11.7
NEER 2) 99.2 -4.1 -3.3 -5.0
Source: ECB.1) Bilateral exchange rates in descending order based on the corresponding currencies’ trade weights in the EER-20 index.2) Euro nominal effective exchange rate against the currencies of 20 of the most important trading partners of the euro area (EER-20).

14ECB
Monthly Bulletin
January 2012
Between 30 September 2011 and 11 January 2012
the currencies participating in ERM II remained
broadly stable against the euro, trading at,
or close to, their respective central rates.
The Latvian lats moved closer to its central
rate within the unilaterally set fl uctuation band
of ±1%.
1.4 OUTLOOK FOR THE EXTERNAL ENVIRONMENT
Looking ahead, global growth is expected
to remain subdued on account of heightened
uncertainty, tensions in global fi nancial markets,
as well as the ongoing economic adjustment
process in major advanced economies. In
October the OECD’s composite leading indicator
continued to suggest a slowdown in OECD
countries and other major economies, with some
variation in the strength of the slowdown across
countries. Furthermore, the latest data for global
trade also suggest slow growth in the upcoming
months. Box 1 discusses recent trends in world
trade in more detail.
In an environment of high uncertainty, risks to activity remain on the downside. These risks notably
relate to a further intensifi cation of the tensions in some segments of the fi nancial markets, as well
as to protectionist pressures and the possibility of a disorderly correction of global imbalances.
Chart 6 OECD composite leading indicators
(monthly data; amplitude-adjusted)
90
92
94
96
98
100
102
104
106
90
92
94
96
98
100
102
104
106
OECD
emerging economies
1999 2001 2003 2005 2007 2009 2011
Source: OECD.Note: The emerging market indicator is a weighted average of the composite leading indicators for Brazil, Russia and China.
Box 1
THE RECENT WEAKNESS IN WORLD TRADE
World trade has been rather weak over the past few quarters. In the second quarter of 2011
world merchandise trade contracted by 0.5% quarter on quarter and recorded only subdued
growth of 1.0% in the third quarter. The recent weakness in world trade evoked memories
of 2008-09, when world trade last contracted. At that time the decline in world trade was not
only exceptionally steep, but also signifi cantly exceeded the fall in global output. A number of
factors – such as composition and inventory effects, fi nancial constraints and vertical linkages –
were found to have amplifi ed the collapse in trade in 2008 and 2009.1 Against this backdrop,
this box investigates whether similar factors were behind the recent weakness in world trade or
whether this was broadly in line with the general cooling of global economic activity.
World trade typically rises and falls with the overall level of global economic activity.
This co-movement was also evident in the second and third quarters of 2011, when sluggish
growth in global industrial production was mirrored by weak trade dynamics (see Chart A).
1 See the article entitled “Recent developments in global and euro area trade”, Monthly Bulletin, ECB, August 2010.
15ECB
Monthly Bulletin
January 2012
ECONOMIC AND MONETARYDEVELOPMENTS
The external
environment
of the euro area
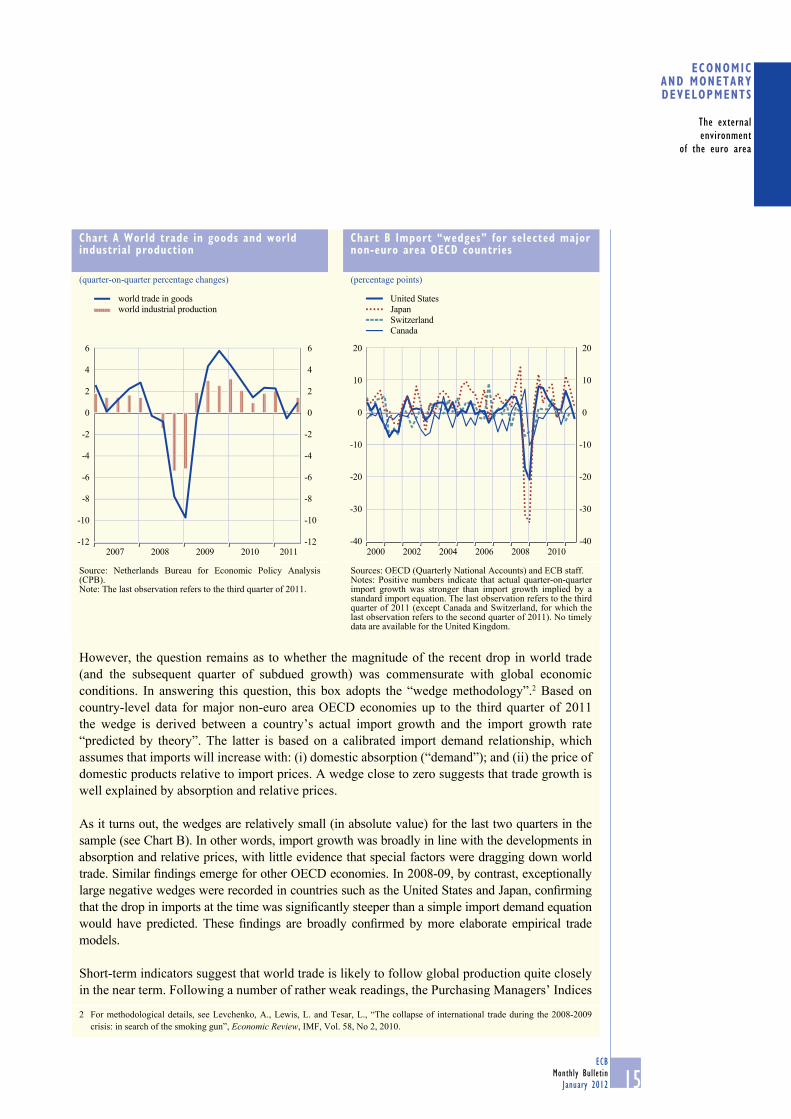
However, the question remains as to whether the magnitude of the recent drop in world trade
(and the subsequent quarter of subdued growth) was commensurate with global economic
conditions. In answering this question, this box adopts the “wedge methodology”.2 Based on
country-level data for major non-euro area OECD economies up to the third quarter of 2011
the wedge is derived between a country’s actual import growth and the import growth rate
“predicted by theory”. The latter is based on a calibrated import demand relationship, which
assumes that imports will increase with: (i) domestic absorption (“demand”); and (ii) the price of
domestic products relative to import prices. A wedge close to zero suggests that trade growth is
well explained by absorption and relative prices.
As it turns out, the wedges are relatively small (in absolute value) for the last two quarters in the
sample (see Chart B). In other words, import growth was broadly in line with the developments in
absorption and relative prices, with little evidence that special factors were dragging down world
trade. Similar fi ndings emerge for other OECD economies. In 2008-09, by contrast, exceptionally
large negative wedges were recorded in countries such as the United States and Japan, confi rming
that the drop in imports at the time was signifi cantly steeper than a simple import demand equation
would have predicted. These fi ndings are broadly confi rmed by more elaborate empirical trade
models.
Short-term indicators suggest that world trade is likely to follow global production quite closely
in the near term. Following a number of rather weak readings, the Purchasing Managers’ Indices
2 For methodological details, see Levchenko, A., Lewis, L. and Tesar, L., “The collapse of international trade during the 2008-2009
crisis: in search of the smoking gun”, Economic Review, IMF, Vol. 58, No 2, 2010.
Chart A World trade in goods and world industrial production
(quarter-on-quarter percentage changes)
-12
-10
-8
-6
-4
-2
0
2
4
6
-12
-10
-8
-6
-4
-2
0
2
4
6
2007 2008 2009 2010 2011
world industrial production world trade in goods
Source: Netherlands Bureau for Economic Policy Analysis (CPB).Note: The last observation refers to the third quarter of 2011.
Chart B Import “wedges” for selected major non-euro area OECD countries
(percentage points)
-40
-30
-20
-10
0
10
20
-40
-30
-20
-10
0
10
20
2004 2006 2008 20102000 2002
United States
Switzerland
Japan
Canada
Sources: OECD (Quarterly National Accounts) and ECB staff.Notes: Positive numbers indicate that actual quarter-on-quarter import growth was stronger than import growth implied by a standard import equation. The last observation refers to the third quarter of 2011 (except Canada and Switzerland, for which the last observation refers to the second quarter of 2011). No timely data are available for the United Kingdom.

16ECB
Monthly Bulletin
January 2012
(PMIs) tracking global output and new export orders in the manufacturing sector both showed
signs of stabilisation in the fi nal quarter of 2011. Notwithstanding this, the global PMI of new
export orders remained slightly below the theoretical expansion/contraction threshold of 50,
consistent with weak trade dynamics around the turn of the year.
To conclude, the recent weakness in world trade has been broadly in line with weak global
economic conditions, with little evidence of special factors dragging it down. Leading indicators
suggest that world trade and production are likely to continue to co-move quite closely in the
near term.

17ECB
Monthly Bulletin
January 2012
ECONOMIC AND MONETARYDEVELOPMENTS
Monetary and
financial
developments
2 MONETARY AND FINANCIAL DEVELOPMENTS
2.1 MONEY AND MFI CREDIT
The annual growth rate of M3 declined strongly in November 2011. Overall, the weak monetary developments continued to refl ect high levels of economic and fi nancial market uncertainty. This uncertainty was evident from the further decline in institutional investors’ holdings of M3 deposits and the reduction seen in interbank transactions conducted via central counterparties belonging to the money-holding sector. Furthermore, certain money-holders continued to shift their funds outside the euro area. Annual growth in MFI loans to the private sector declined markedly, mirroring a fall in lending to non-monetary fi nancial intermediaries. At the same time, the modest monthly infl ow observed for loans to households in November was largely offset by a reduction in loans to non-fi nancial corporations. Lending fi gures do not yet point to credit being curtailed to any signifi cant extent in the euro area as a whole. However, given that effects on supply could manifest themselves with lags, developments in credit and banks’ funding situation need to be monitored closely in the period ahead. Overall, underlying money and credit growth remained moderate.
THE BROAD MONETARY AGGREGATE M3
The annual growth rate of M3 declined strongly to stand at 2.0% in November 2011, down from 2.6%
in October (see Chart 7). On the one hand, three-quarters of this moderation in annual M3 growth
is explained by a base effect related to sizeable interbank transactions traded via central counterparties
(CCPs) in November 2010. On the other hand, the month-on-month growth rate was modestly
negative at -0.15% in November. The negative monthly fl ow was attributable to a contraction
in repurchase agreements. This, in turn, mirrored a decline in secured money market borrowing
conducted via CCPs located in the euro area. Adjusting for the impact of repurchase agreements
with CCPs, M3 holdings were up slightly from the previous month. Similarly, the annual growth
rate of the adjusted M3 series, albeit remaining
low, increased moderately to stand at 1.6% in
November, up from 1.4% in October.
Overall, as in October, the weak monetary
developments continued to refl ect the high levels
of economic and fi nancial market uncertainty.
On the component side, this uncertainty was
evident from the further decline in institutional
investors’ holdings of M3 deposits and the
reduction seen in transactions conducted via
CCPs. By contrast, another small infl ow was
recorded for M3 deposits held by households in
the context of the intensifi cation of the sovereign
debt crisis and the declines seen in stock prices
for most of the month. Households also shifted
some of their overnight deposits into less liquid
deposits, refl ecting the yields available on the
various types of deposit.
On the counterpart side, the annual growth
rate of MFI loans to the non-fi nancial private
sector (adjusted for the impact of loan sales and
Chart 7 M3 growth
(percentage changes; adjusted for seasonal and calendar effects)
-2
0
2
4
6
8
10
12
14
-2
0
2
4
6
8
10
12
14
M3 (annual growth rate)
M3 (three-month centred moving average of
the annual growth rate)M3 (six-month annualised growth rate)
1999 2001 2003 2005 2007 2009 2011
Source: ECB.

18ECB
Monthly Bulletin
January 2012
securitisation activity) declined somewhat in November, with the modest monthly infl ow for loans
to households being largely offset by a reduction in loans to non-fi nancial corporations. However,
the subdued developments in lending do not yet point to the supply of loans being restricted to
any signifi cant extent at the euro area level. Money-holders also continued to shift funds outside
the euro area in November, which is visible from the decline in MFIs’ net external asset position.
At the same time, banks’ funding pressures intensifi ed further as a result of limited issuance of
longer-term debt securities and the withdrawal of deposits by non-euro area residents. However,
the non-standard measures introduced by the Eurosystem in early December – particularly the
three-year longer-term refi nancing operations – should alleviate these pressures.
The main assets held by euro area MFIs (excluding the Eurosystem) recorded a second consecutive
monthly decline in November, clearly showing the impact of deleveraging pressures on banks’
balance sheets. The decline seen in November was driven predominantly by a marked reduction in
external assets, mainly loans to non-residents, but also by a decline in holdings of debt securities
issued by non-residents. In this respect, banks’ behaviour has followed a “pecking order”, whereby
assets that are highly liquid or do not represent core assets are shed before those that constitute the
banks’ main business.
MAIN COMPONENTS OF M3
The slowdown observed in the annual growth of M3 in November mainly refl ected sharp declines
in the annual growth rates of marketable instruments and, to a lesser extent, short-term deposits
other than overnight deposits. The narrow monetary aggregate M1, the annual growth rate of
which increased slightly, was the only main component supporting monetary developments in
November.
The annual growth rate of M1 increased to 2.1% in November, up from 1.7% in the previous month,
with overnight deposits accounting for the bulk of this increase. In particular, the non-monetary
fi nancial sector increased its holdings of overnight deposits in November, probably refl ecting both the
hoarding of liquidity received from sales of securities and the need to retain liquid instruments amid a
continuation of the heightened fi nancial market tensions. By contrast, both non-fi nancial corporations
and households reduced their holdings of overnight deposits. Households continued to prefer to direct
previously accumulated and new savings towards other components of M3, particularly short-term
time deposits (i.e. deposits with an agreed maturity of up to two years). A detailed investigation of
portfolio shifts into and out of M1, and the role of uncertainty, is provided in Box 2 below.
Box 2
MONEY GROWTH AND UNCERTAINTY
While there is abundant evidence that money growth has leading indicator properties for
infl ation in the medium to long term, these properties may be weaker during specifi c periods.
This is particularly the case in periods characterised by signifi cant variation in money demand
triggered by increased uncertainty regarding the economic environment, when money balances
may be held primarily for precautionary or portfolio-related reasons, rather than for transaction
purposes.1 The heightened tensions observed in sovereign bond markets since August 2011 have
1 For a detailed discussion, see the article entitled “Money demand and uncertainty”, Monthly Bulletin, ECB, October 2005.

19ECB
Monthly Bulletin
January 2012
ECONOMIC AND MONETARYDEVELOPMENTS
Monetary and
financial
developments
increased fi nancial stress in the euro area banking sector and the wider fi nancial system. These
elevated stress levels, which are a refl ection of various types of uncertainty, have also affected
monetary developments in the euro area. This box looks at the nature of the uncertainties
underlying fi nancial market stress and considers the potentially ambiguous effects that these can
have as regards monetary developments. In addition, an attempt is made to quantify the impact
that uncertainty-related fi nancial market stress has had on the narrow monetary aggregate M1
during the fi nancial and sovereign debt crisis.
Uncertainty-related portfolio shifts
Stress in fi nancial markets may be associated with increased uncertainty among lenders and
investors regarding the fundamental value of fi nancial and real assets.2 As a result, uncertainty
is likely to affect portfolio allocation decisions, with two effects partially offsetting each other.
First, a heightened degree of uncertainty may trigger shifts towards less risky domestic assets,
such as liquid monetary instruments. Second, depending on the nature of uncertainty, holdings
of monetary assets may decline, with agents wishing to exchange nominal assets for real assets
or domestic assets for non-domestic assets. The relative importance of these two effects and the
overall outcome depends, inter alia, on the monetary aggregate considered and the correlation
between asset returns.3
Generally, for broad money growth to strengthen as a result of portfolio shifts, the money-holding
sector needs to sell risky assets to euro area MFIs, the central government of a euro area country
or non-euro area residents. The portfolio shifts observed in the period from 2001 to 2003 are
one example of such a development. This period was characterised by the repatriation of funds
by euro area money holders, who sold the foreign assets they had purchased previously (mainly
equity) to non-residents, keeping the receipts in monetary assets.4 This tendency to repatriate
funds at the global level and this preference for safe and liquid assets could also be observed
during the initial phase of the fi nancial crisis in 2007 and 2008.
In the current period, with uncertainty related mainly to sovereign debt problems in some euro
area countries, in conjunction with pressures on the banking sector, the potential for a protracted
period of portfolio shifts into money may be more limited, as MFIs are attempting to deleverage
and non-resident investors may prefer to withdraw from euro area assets, contributing to
downward pressure on money growth.
Measures of uncertainty
Economic literature offers numerous defi nitions of uncertainty, which in turn give rise to a
wide range of indicators. Chart A presents a selection of indicators of uncertainty and fi nancial
market stress. Importantly, the types of underlying uncertainty captured by the various indicators
differ considerably. For example, the measure of uncertainty proposed by Bekaert, Hoerova and
2 See Hakkio, C. and Keeton, W., “Financial Stress: What Is It, How Can It Be Measured, and Why Does It Matter?”, Economic Review,
Second Quarter, Federal Reserve Bank of Kansas City, 2009.
3 See: Atta-Mensah, J., “The Demand for Money in a Stochastic Environment”, Working Papers, No 2004-7, Bank of Canada,
March 2004; and Choi, W. and Oh, S., “A money demand function with output uncertainty, monetary uncertainty, and fi nancial
innovations”, Journal of Money, Credit and Banking, Vol. 35, No 5, 2003.
4 See, for instance, the box entitled “The impact on M3 of portfolio shifts arising from heightened uncertainty” in the article referred to
in footnote 1.

20ECB
Monthly Bulletin
January 2012
Lo Duca 5 centres on the US stock market and is thus likely to refl ect the impact of uncertainty
relating to both broad economic and geopolitical events. Greiber and Lemke 6 construct a proxy
for the impact that uncertainty has on economic agents’ liquidity preferences with the aid
of : (i) medium-term returns on stocks and bonds; (ii) measures of stock market losses and volatility;
and (iii) indicators of consumer and business sentiment. A wide range of fi nancial market
indicators serve as input for the indicators of uncertainty proposed by van Roye.7 The data used
by Bekaert et al. relate to the United States, whereas the data used by Greiber and Lemke and
van Roye relate to the euro area.
Chart B breaks van Roye’s estimated measure of euro area fi nancial market stress down into
its three components, namely: (i) banking indicators; (ii) securities/stock market indicators;
and (iii) foreign exchange indicators. This shows that, following calm fi nancial market
conditions between 2004 and 2007, all three sources of uncertainty have moved in the same
direction since 2008, with banking shocks leading contributions by the other two components.
The third quarter of 2011 saw sharp increases in the contributions by banking indicators and
securities/stock market indicators, similar to the period following the collapse of Lehman
Brothers in autumn 2008. This chart also illustrates the difference between the current fi nancial
crisis and the heightened fi nancial, economic and geopolitical uncertainty underlying the portfolio
shifts into money from 2001 to 2003. In that episode, the uncertainty was transmitted to the euro
area, rather than originating here, so foreign exchange indicators made the largest contribution.
Notably, in that period, banking and securities/stock market indicators partly offset the impact
5 See Bekaert, G., Hoerova, M. and Lo Duca, M., “Risk, uncertainty and monetary policy”, NBER Working Paper Series, No 16397,
National Bureau of Economic Research, 2010. This measure also provides an estimate of risk aversion.
6 See Greiber, C. and Lemke, W., “Money demand and macroeconomic uncertainty”, Discussion Paper Series 1, No 26, Deutsche
Bundesbank, 2005.
7 See van Roye, B., “Financial stress and economic activity in Germany and the Euro Area”, Kiel Working Papers, No 1743, Kiel
Institute for the World Economy, 2011.
Chart A Selected measures of uncertainty
(scaled deviation from mean; quarterly data)
-1
0
1
2
3
4
Bekaert et al. (US data)
Greiber and Lemke (euro area data)
van Roye (euro area data)
-2
-1
0
1
2
3
4
-21999 2001 2003 2005 2007 2009 2011
Sources: See the papers referred to in footnotes 5, 6 and 7 respectively. Note: All series are mean-adjusted and normalised such that they have equal standard deviation overall.
Chart B Breakdown of an indicator of financial market stress for the euro area
(contributions in percentage points; monthly data)
-1.5
-1.0
-0.5
0.0
0.5
1.0
1.5
2.0
2.5
3.0
-1.5
-1.0
-0.5
0.0
0.5
1.0
1.5
2.0
2.5
3.0
1999 2001 2003 2005 2007 2009 2011
foreign exchange indicators
securities/stock market indicators
banking indicators
Source: See the paper referred to in footnote 7.
21ECB
Monthly Bulletin
January 2012
ECONOMIC AND MONETARYDEVELOPMENTS
Monetary and
financial
developments
of the increase in foreign exchange-related
uncertainty. By contrast, during the current
fi nancial crisis – and particularly following
the intensifi cation of the sovereign debt crisis
in August 2011 – banking and securities/stock
market indicators have both been driving
van Roye’s measure of uncertainty in the same
direction.
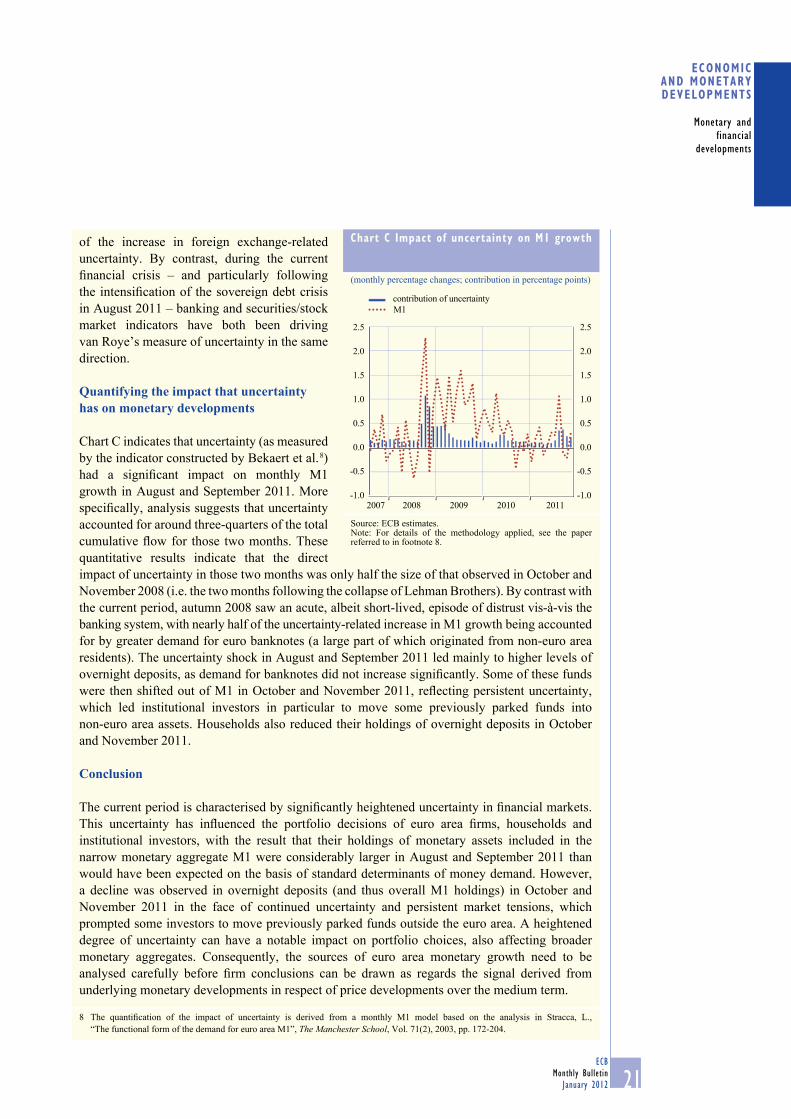
Quantifying the impact that uncertainty has on monetary developments
Chart C indicates that uncertainty (as measured
by the indicator constructed by Bekaert et al. 8)
had a signifi cant impact on monthly M1
growth in August and September 2011. More
specifi cally, analysis suggests that uncertainty
accounted for around three-quarters of the total
cumulative fl ow for those two months. These
quantitative results indicate that the direct
impact of uncertainty in those two months was only half the size of that observed in October and
November 2008 (i.e. the two months following the collapse of Lehman Brothers). By contrast with
the current period, autumn 2008 saw an acute, albeit short-lived, episode of distrust vis-à-vis the
banking system, with nearly half of the uncertainty-related increase in M1 growth being accounted
for by greater demand for euro banknotes (a large part of which originated from non-euro area
residents). The uncertainty shock in August and September 2011 led mainly to higher levels of
overnight deposits, as demand for banknotes did not increase signifi cantly. Some of these funds
were then shifted out of M1 in October and November 2011, refl ecting persistent uncertainty,
which led institutional investors in particular to move some previously parked funds into
non-euro area assets. Households also reduced their holdings of overnight deposits in October
and November 2011.
Conclusion
The current period is characterised by signifi cantly heightened uncertainty in fi nancial markets.
This uncertainty has infl uenced the portfolio decisions of euro area fi rms, households and
institutional investors, with the result that their holdings of monetary assets included in the
narrow monetary aggregate M1 were considerably larger in August and September 2011 than
would have been expected on the basis of standard determinants of money demand. However,
a decline was observed in overnight deposits (and thus overall M1 holdings) in October and
November 2011 in the face of continued uncertainty and persistent market tensions, which
prompted some investors to move previously parked funds outside the euro area. A heightened
degree of uncertainty can have a notable impact on portfolio choices, also affecting broader
monetary aggregates. Consequently, the sources of euro area monetary growth need to be
analysed carefully before fi rm conclusions can be drawn as regards the signal derived from
underlying monetary developments in respect of price developments over the medium term.
8 The quantifi cation of the impact of uncertainty is derived from a monthly M1 model based on the analysis in Stracca, L.,
“The functional form of the demand for euro area M1”, The Manchester School, Vol. 71(2), 2003, pp. 172-204.
Chart C Impact of uncertainty on M1 growth
(monthly percentage changes; contribution in percentage points)
-1.0
-0.5
0.0
0.5
1.0
1.5
2.0
2.5
-1.0
-0.5
0.0
0.5
1.0
1.5
2.0
2.5
20082007 2009 2010 2011
contribution of uncertainty
M1
Source: ECB estimates.Note: For details of the methodology applied, see the paper referred to in footnote 8.
22ECB
Monthly Bulletin
January 2012
The annual growth rate of short-term deposits other than overnight deposits declined slightly to stand
at 2.1% in November, down from 2.3% in October. However, this masks differing developments
in the annual growth rates of its two sub-components. Annual growth in short-term time deposits
declined, as non-monetary fi nancial intermediaries other than insurance corporations and pension
funds (OFIs) strongly reduced their holdings. To the extent that this concerns investment funds, it is
likely to refl ect the withdrawal of liquidity in order to reinvest funds that were temporarily parked
during the stress observed in fi nancial markets in recent months. The monthly outfl ow observed
for non-fi nancial corporations was largely offset by an infl ow for the household sector. The annual
growth rate of short-term savings deposits (i.e. deposits redeemable at notice of up to three months)
remained broadly unchanged, despite strong infl ows for OFIs and, in particular, non-fi nancial
corporations.
The annual growth rate of marketable instruments decreased sharply to stand at 1.1% in November,
down from 7.8% in October. Developments were driven entirely by a considerable decline in the
annual growth rate of repurchase agreements, mirroring both a base effect and a signifi cant monthly
outfl ow. The latter refl ects the reversal of interbank trading in repurchase agreements conducted
via CCPs. In fact, adjusting annual M3 growth for the impact of such CCP-related transactions
results in marginal growth being recorded for November. Despite continuing to face a demanding
environment, money market fund shares/units recorded a monthly infl ow in November, which
nevertheless left the annual growth rate unchanged from October. This infl ow partly refl ected a
slight increase in demand for funds investing in foreign assets. The annual growth rate of short-term
debt securities (i.e. debt securities with an original maturity of up to two years) increased strongly,
largely owing to a base effect.
The annual growth rate of M3 deposits – which comprise short-term deposits and repurchase
agreements and represent the broadest monetary aggregate for which a timely sectoral breakdown is
available – declined to 2.2% in November, down markedly from the 3.0% recorded in the previous
month. As in October, this mainly refl ected a signifi cant monthly outfl ow for the OFI sector. At the
same time, insurance corporations and pension funds and non-fi nancial corporations recorded only
small outfl ows, while the M3 deposit holdings of households and, in particular, general government
other than central government grew in November.
MAIN COUNTERPARTS OF M3
As regards the counterparts of M3, the annual growth rate of MFI credit to euro area residents
declined to 0.8% in November, down from 1.6% in the previous month (see Table 2). This masks
a strengthening in the growth of credit to general government and a moderation in the growth of
credit to the private sector.
The strengthening in the growth of credit to general government was driven by purchases of
government debt securities (including purchases made by the Eurosystem within the framework of
the Securities Markets Programme), which were partly offset by a decline in the annual growth rate
of loans to general government.
The annual growth rate of credit to the private sector declined to 1.0% in November, down
from 2.1% in the previous month. This refl ects MFIs shedding holdings of both equity and debt
securities, as well as a reduction in MFI loans. The monthly outfl ow for MFI loans to the private
sector (adjusted for sales and securitisation) almost equalled that observed for loans held on MFIs’
balance sheets, suggesting that loan sales and securitisation activity were subdued in November. The
outfl ow for loans to the private sector was largely the result of a reduction in MFI lending to OFIs.

23ECB
Monthly Bulletin
January 2012
ECONOMIC AND MONETARYDEVELOPMENTS
Monetary and
financial
developments
In particular, lending conducted via CCPs contracted sharply in November. This may, in part, refl ect
the unwinding of the strong infl ow recorded in October. However, it is also the result of a more
general decline in the trading of repurchase agreements via CCPs in certain euro area countries.
Table 2 Summary table of monetary variables
(quarterly fi gures are averages; adjusted for seasonal and calendar effects)
Outstanding amounts as a
percentage of M31)
Annual growth rates2010
Q4 2011
Q12011
Q2 2011
Q3 2011Oct.
2011Nov.
M1 49.0 4.9 3.2 1.7 1.4 1.7 2.1 Currency in circulation 8.7 5.6 4.9 4.2 4.5 6.5 6.5
Overnight deposits 40.3 4.8 2.9 1.1 0.8 0.7 1.2
M2-M1 (=other short-term deposits) 38.9 -1.1 1.3 3.4 3.5 2.3 2.1
Deposits with an agreed maturity
of up to two years 18.7 -8.7 -2.7 2.3 3.2 1.9 1.6
Deposits redeemable at notice
of up to three months 20.2 7.2 5.4 4.5 3.7 2.7 2.6
M2 87.9 2.2 2.4 2.4 2.3 1.9 2.1 M3-M2 (=marketable instruments) 12.1 -3.1 -1.7 -0.3 3.0 7.8 1.1
M3 100.0 1.5 1.9 2.1 2.4 2.6 2.0
Credit to euro area residents 3.4 3.7 3.1 2.4 1.6 0.8 Credit to general government 11.8 10.9 6.5 5.1 -0.5 0.2
Loans to general government 15.5 17.7 10.7 7.0 -1.2 -5.6
Credit to the private sector 1.5 2.1 2.3 1.7 2.1 1.0
Loans to the private sector 1.7 2.4 2.6 2.5 2.7 1.7
Loans to the private sector adjusted
for sales and securitisation2) 2.2 2.9 2.8 2.7 3.0 1.9
Longer-term fi nancial liabilities (excluding capital and reserves) 2.7 2.8 3.4 3.6 3.4 2.3
Source: ECB. 1) As at the end of the last month available. Figures may not add up due to rounding. 2) Adjusted for the derecognition of loans from the MFI statistical balance sheet owing to their sale or securitisation.
Table 3 MFI loans to the private sector
(quarterly fi gures are averages; adjusted for seasonal and calendar effects)
Outstanding amount as a percentage
of the total 1)
Annual growth rates2010
Q4 2011
Q12011
Q22011
Q32011Oct.
2011Nov.
Non-fi nancial corporations 42.3 -0.3 0.6 1.0 1.5 1.8 1.6Adjusted for sales and securitisation 2) - 0.6 1.5 1.9 2.2 2.2 1.8Up to one year 24.7 -4.6 -1.2 1.6 4.1 4.6 3.8
Over one and up to fi ve years 18.2 -2.6 -2.4 -2.9 -3.6 -3.2 -3.1
Over fi ve years 57.1 2.6 2.4 2.2 2.1 2.4 2.2
Households 3) 46.6 2.8 3.1 3.4 3.0 2.2 2.1Adjusted for sales and securitisation 2) - 3.0 3.1 3.0 2.7 2.5 2.3Consumer credit 4) 11.9 -0.9 -0.9 -1.0 -2.0 -1.9 -2.2
Lending for house purchase 4) 72.1 3.6 4.0 4.4 4.0 3.0 3.0
Other lending 16.0 2.6 2.4 2.0 2.4 2.2 1.6
Insurance corporations and pension funds 0.8 7.7 7.6 3.2 7.2 5.7 1.4Other non-monetary fi nancial intermediaries 10.3 4.8 7.1 6.0 4.0 8.5 0.4
Source: ECB.Notes: MFI sector including the Eurosystem; sectoral classifi cation based on the ESA 95. For further details, see the relevant technical notes.1) As at the end of the last month available. Sector loans as a percentage of total MFI loans to the private sector; maturity breakdown and breakdown by purpose as a percentage of MFI loans to the respective sector. Figures may not add up due to rounding.2) Adjusted for the derecognition of loans from the MFI statistical balance sheet owing to their sale or securitisation.3) As defi ned in the ESA 95.4) Defi nitions of consumer credit and lending for house purchase are not fully consistent across the euro area.
24ECB
Monthly Bulletin
January 2012
The annual growth rate of loans to non-fi nancial corporations (adjusted for sales and securitisation)
declined to 1.8% in November, down from 2.2% in the previous month, refl ecting a modest
monthly outfl ow. This negative fl ow follows three months of relatively strong borrowing activity
by non-fi nancial corporations between August and October. The bulk of the monthly outfl ow was
attributable to short-term loans (i.e. loans with an initial maturity of up to one year; see Table 3),
reversing the infl ow observed in October. Long-term loans (i.e. loans with an initial maturity of
over fi ve years) recorded only a minor infl ow. At the same time, cross-country heterogeneity in
loan developments remained signifi cant, in line with the uneven recovery in economic activity and
differences in the external fi nancing needs of the various industrial sectors, in banks’ funding stress
and in the level of indebtedness of non-fi nancial corporations in the various euro area countries.
The annual growth rate of MFI loans to households (adjusted for sales and securitisation) declined
to 2.3% in November, down from 2.5% in October, thereby continuing the gradual slowdown
observed since May 2011. Lending to households was supported by loans for house purchase,
the annual growth rate of which remained unchanged from the previous month at 3.0%. The
impact of government schemes supporting the real estate markets of certain countries remained an
important factor driving this borrowing activity. At the same time, monthly fl ows for both consumer
credit and other lending remained close to zero, as consumers’ economic expectations continued to
deteriorate. The annual growth rates of consumer credit and other lending declined to -2.2% and
1.6% respectively.
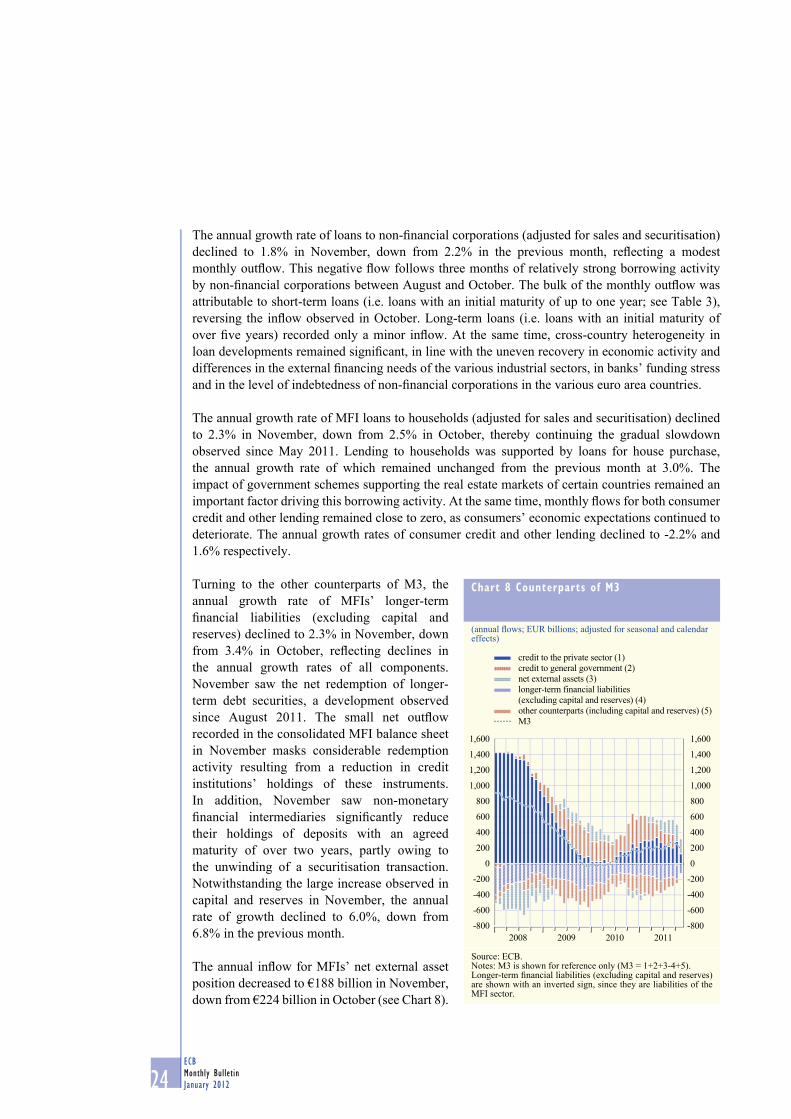
Turning to the other counterparts of M3, the
annual growth rate of MFIs’ longer-term
fi nancial liabilities (excluding capital and
reserves) declined to 2.3% in November, down
from 3.4% in October, refl ecting declines in
the annual growth rates of all components.
November saw the net redemption of longer-
term debt securities, a development observed
since August 2011. The small net outfl ow
recorded in the consolidated MFI balance sheet
in November masks considerable redemption
activity resulting from a reduction in credit
institutions’ holdings of these instruments.
In addition, November saw non-monetary
fi nancial intermediaries signifi cantly reduce
their holdings of deposits with an agreed
maturity of over two years, partly owing to
the unwinding of a securitisation transaction.
Notwithstanding the large increase observed in
capital and reserves in November, the annual
rate of growth declined to 6.0%, down from
6.8% in the previous month.
The annual infl ow for MFIs’ net external asset
position decreased to €188 billion in November,
down from €224 billion in October (see Chart 8).
Chart 8 Counterparts of M3
(annual fl ows; EUR billions; adjusted for seasonal and calendar effects)
-800
-600
-400
-200
0
200
400
600
800
1,000
1,200
1,400
1,600
-800
-600
-400
-200
0
200
400
600
800
1,000
1,200
1,400
1,600
2008 2009 2010 2011
credit to the private sector (1)
credit to general government (2)
net external assets (3)
longer-term financial liabilities
(excluding capital and reserves) (4)
other counterparts (including capital and reserves) (5)
M3
Source: ECB.Notes: M3 is shown for reference only (M3 = 1+2+3-4+5).Longer-term fi nancial liabilities (excluding capital and reserves) are shown with an inverted sign, since they are liabilities of the MFI sector.
25ECB
Monthly Bulletin
January 2012
ECONOMIC AND MONETARYDEVELOPMENTS
Monetary and
financial
developments
This partly refl ects a sizeable monthly outfl ow of €25 billion. For details on changes in the euro
area’s international investment position in recent years, see Box 3.
Overall, the developments observed in October broadly continued in November, with weak money
growth mainly refl ecting a reduction in institutional investors’ holdings of monetary assets. At the
same time, pressures on banks’ balance sheets intensifi ed in November, accompanied by a further
sizeable reduction in their net external asset position. Moreover, MFI credit to the private sector
declined, as MFIs reduced both loans and their holdings of securities. The moderation in loan
growth resulted largely from a reduction in lending to OFIs (specifi cally CCPs). The modest infl ow
for loans to households was largely offset by a reduction in loans to non-fi nancial corporations,
which followed three months of fairly robust borrowing activity. Corrected for the impact of sales
and securitisation, the dynamics of lending have moderated in annual terms over recent months.
Consequently, this does not yet point to credit being curtailed to any signifi cant extent in the euro
area as a whole. However, loan developments need to be monitored closely, particularly as credit
supply effects manifest themselves with lags.
Box 3
RECENT IMPROVEMENT IN THE EURO AREA’S INTERNATIONAL INVESTMENT POSITION
The international investment position (i.i.p.) shows the stock of both total holdings of foreign
assets by euro area residents (assets) and total holdings of euro area assets by foreign residents
(liabilities). This box reviews the main developments in the euro area i.i.p. in recent years.
The net euro area i.i.p. has improved in recent years, following the signifi cant deterioration in
2008, which had been triggered by an expansion of the net liabilities of the general government
sector. Since 2009, the euro area’s i.i.p. has moved closer to its pre-crisis levels. The reduction of
the net liability position was due mainly to signifi cant favourable changes in prices1 and exchange
rates that more than compensated for the continued net borrowing of the euro area, particularly
by the general government, on account of automatic stabilisers and the fi scal stimulus packages
that were implemented in response to the fi nancial crisis. This led to an increase in the order of
almost 10% of GDP in the general government sector’s net liability position, which was only
partly offset by an increase in the net asset position of “other sectors” 2 (see Chart A).
In order to gain a better understanding of the impact of changes in fi nancial stocks not accounted
for by fi nancial transactions, Chart B plots the i.i.p. against an external position calculated on the
basis of unchanged returns (i.e. without price and exchange rate changes and other adjustments 3).
In particular, it shows that, in the latter circumstances, the net liability position at the end of 2010
would have been more than 4% of GDP higher than it actually was.
1 Price changes in the i.i.p. refer to changes in the prices of external assets and liabilities.
2 “Other sectors” include non-fi nancial corporations, fi nancial corporations other than MFIs – i.e. investment funds, insurance
corporations, pension funds and other fi nancial corporations – and households.
3 “Other adjustments” include, for example, reclassifi cations, company write-downs, changes in the survey coverage and changes in the
residency of companies.

26ECB
Monthly Bulletin
January 2012
2.2 SECURITIES ISSUANCE
The annual growth of debt securities issuance by euro area residents increased marginally to 3.4% in October 2011. A pick-up in issuance activity by MFIs and a slower annual pace of contraction in issuance by fi nancial corporations other than MFIs compensated for the weaker annual growth of debt securities issuance by governments and non-fi nancial corporations. At the same time,
There are three explanations for the fact that the return recently observed on euro area
residents’ external assets was higher than that on the respective liabilities: the fi rst relates to
the composition of the euro area’s external balance sheet, the second to intra-asset-class return
differentials and the third to the exchange rate. First, the main source of funding for the euro area
has typically been portfolio investment, and at the same time, it has been a net exporter of
foreign direct investment. By fi nancing itself in highly rated and more liquid instruments and, at
the same time, holding riskier assets, the asymmetric distribution of instruments in both assets
and liabilities is one of the reasons for the euro area’s favourable return differential. Second,
euro area investors’ holdings of some types of instruments yielded, on average, a higher return
than the foreign holdings of the same instrument issued by euro area residents. This is manifested
in the relatively weaker equity market performance of the euro area in comparison with the rest
of the world in the period under review, as well as in the reduction of the market value of the
euro area debt securities held by foreign investors in 2010, which may to some extent have
refl ected the decrease in prices of government bonds issued by some euro area countries. Third,
the depreciation of the euro vis-à-vis other major currencies in 2010 – to the extent that this
raised the value of assets not denominated in euro – led to a sizeable increase in the value of
euro area investor’s assets.
Chart A Net international investment position of the euro area, by institutional sector
(percentages of euro area GDP)
-18
-16
-14
-12
-10
-8
-6
-4
-2
0
-40
-30
-20
-10
0
10
20
30
2007 2008 2009 2010
Eurosystem (left-hand scale)
MFIs (left-hand scale)
general government (left-hand scale)
other sectors (left-hand scale)
net i.i.p. (right-hand scale)
Sources: ECB and ECB staff calculations.Note: Financial derivatives not included.
Chart B Breakdown of changes in the net international investment position of the euro area
(percentages of euro area GDP)
-20
-19
-18
-17
-16
-15
-14
-13
-12
-4
-3
-2
-1
0
1
2
3
4
2008 2009 2010
financial transactions (left-hand scale)
exchange rate variation (left-hand scale)
price variation (left-hand scale)
other adjustments (left-hand scale)
net i.i.p. (right-hand scale)
adjusted net i.i.p. (right-hand scale)
Sources: ECB and ECB staff calculations.Note: The “adjusted i.i.p.” is the net position obtained if it is assumed that there were no price and exchange rate variations, nor other adjustments.

27ECB
Monthly Bulletin
January 2012
ECONOMIC AND MONETARYDEVELOPMENTS
Monetary and
financial
developments
the annual growth rate of quoted share issuance decreased somewhat, to 1.7%. This decrease was driven mainly by lower issuance activity on the part of MFIs, whereas equity issuance by non-fi nancial corporations and fi nancial corporations other than MFIs remained broadly unchanged.
DEBT SECURITIES
In October 2011 the annualised rate of growth
in debt securities issued by euro area residents
increased somewhat, to 3.4%, from 3.3%
in the previous month (see Table 4). This
overall development was driven mainly by a
slower year-on-year contraction of issuance of
short-term debt, while the annual rate of growth
of issuance of long-term fi xed rate debt securities
remained broadly unchanged. Looking at short-
term trends, the seasonally adjusted annualised
six-month growth rate of debt securities issuance
increased to 3.5% in October 2011, from 3.1% in the previous month (see Chart 9). The pick-up in
the rate of growth of short-term debt securities issuance refl ected an increase in all sectors except
the government.
While issuance of short-term securities has been contracting on an annual basis since the beginning
of 2010, this has been more than offset by growth in the issuance of debt securities with fi xed
long-term rates. That pattern continued in October 2011. The long-term fl oating rate segment of the
market showed signs of a moderate recovery at the end of 2010, and at the beginning of 2011. This
development was not sustained in the rest of 2011. However, the decline in issuance of long-term
debt securities with fl oating rates slowed down somewhat in October 2011.
Table 4 Securities issued by euro area residents
Issuing sector
Amount outstanding(EUR billions)2011 October
Annual growth rates 1)
2010Q4
2011Q1
2011Q2
2011Q3
2011Sep.
2011 Oct.
Debt securities 16,327 3.6 3.8 3.5 3.5 3.3 3.4MFIs 5,412 -0.1 0.6 1.1 1.9 2.3 2.9
Non-monetary fi nancial corporations 3,269 1.4 1.9 0.8 -0.3 -0.5 0.0
Non-fi nancial corporations 859 8.4 6.2 4.1 4.9 4.8 4.5
General government 6,788 7.5 7.3 6.9 6.6 5.9 5.4
of which:Central government 6,181 7.1 6.7 6.1 5.9 5.1 4.7
Other general government 607 12.4 13.0 15.8 14.6 14.2 12.9
Quoted shares 4,044 1.7 1.4 1.5 1.9 2.0 1.7 MFIs 361 6.6 6.4 7.5 12.4 13.1 10.2
Non-monetary fi nancial corporations 288 4.2 3.4 4.2 5.0 5.8 5.8
Non-fi nancial corporations 3,395 0.8 0.6 0.5 0.4 0.3 0.3
Source: ECB.1) For details, see the technical notes for Sections 4.3 and 4.4 of the “Euro area statistics” section.
Chart 9 Sectoral breakdown of debt securities issued by euro area residents
(six-month annualised growth rates; seasonally adjusted)
-10
0
10
20
30
40
50
60
70
-10
0
10
20
30
40
50
60
70
total
MFIs
non-monetary financial corporations
non-financial corporations
general government
1999 2001 2003 2005 2007 2009 2011
Source: ECB.
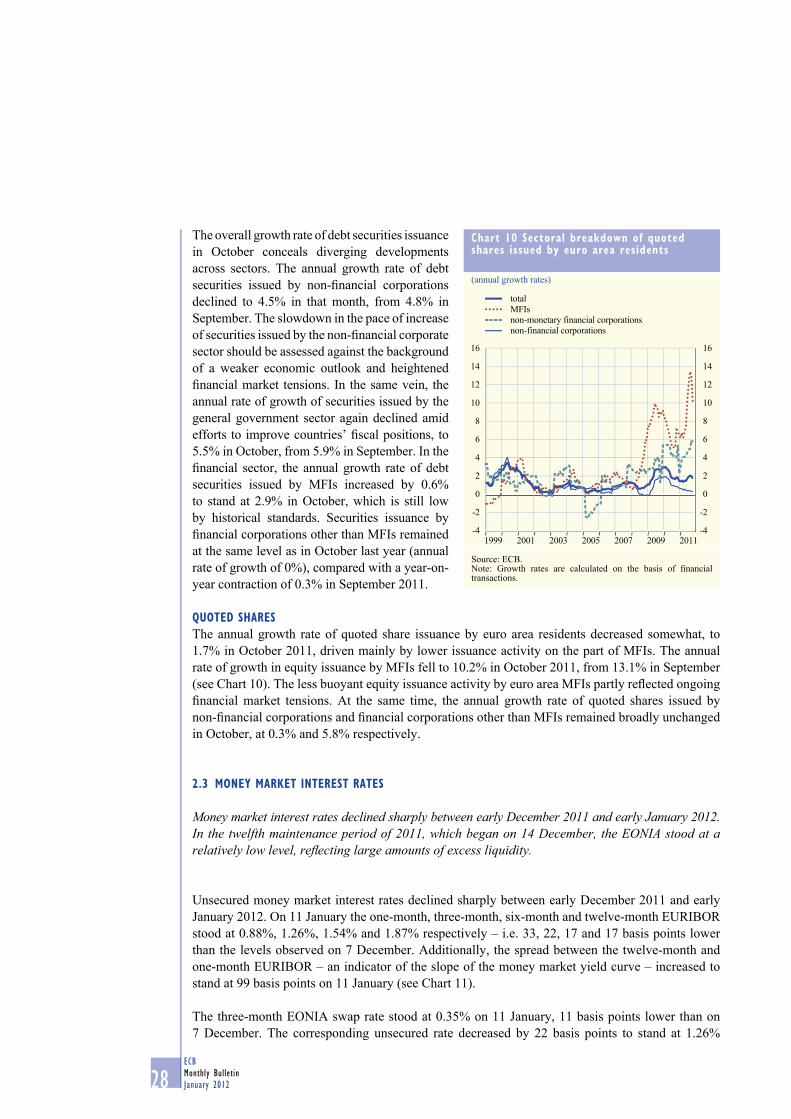
28ECB
Monthly Bulletin
January 2012
The overall growth rate of debt securities issuance
in October conceals diverging developments
across sectors. The annual growth rate of debt
securities issued by non-fi nancial corporations
declined to 4.5% in that month, from 4.8% in
September. The slowdown in the pace of increase
of securities issued by the non-fi nancial corporate
sector should be assessed against the background
of a weaker economic outlook and heightened
fi nancial market tensions. In the same vein, the
annual rate of growth of securities issued by the
general government sector again declined amid
efforts to improve countries’ fi scal positions, to
5.5% in October, from 5.9% in September. In the
fi nancial sector, the annual growth rate of debt
securities issued by MFIs increased by 0.6%
to stand at 2.9% in October, which is still low
by historical standards. Securities issuance by
fi nancial corporations other than MFIs remained
at the same level as in October last year (annual
rate of growth of 0%), compared with a year-on-
year contraction of 0.3% in September 2011.
QUOTED SHARES
The annual growth rate of quoted share issuance by euro area residents decreased somewhat, to
1.7% in October 2011, driven mainly by lower issuance activity on the part of MFIs. The annual
rate of growth in equity issuance by MFIs fell to 10.2% in October 2011, from 13.1% in September
(see Chart 10). The less buoyant equity issuance activity by euro area MFIs partly refl ected ongoing
fi nancial market tensions. At the same time, the annual growth rate of quoted shares issued by
non-fi nancial corporations and fi nancial corporations other than MFIs remained broadly unchanged
in October, at 0.3% and 5.8% respectively.
2.3 MONEY MARKET INTEREST RATES
Money market interest rates declined sharply between early December 2011 and early January 2012. In the twelfth maintenance period of 2011, which began on 14 December, the EONIA stood at a relatively low level, refl ecting large amounts of excess liquidity.
Unsecured money market interest rates declined sharply between early December 2011 and early
January 2012. On 11 January the one-month, three-month, six-month and twelve-month EURIBOR
stood at 0.88%, 1.26%, 1.54% and 1.87% respectively – i.e. 33, 22, 17 and 17 basis points lower
than the levels observed on 7 December. Additionally, the spread between the twelve-month and
one-month EURIBOR – an indicator of the slope of the money market yield curve – increased to
stand at 99 basis points on 11 January (see Chart 11).
The three-month EONIA swap rate stood at 0.35% on 11 January, 11 basis points lower than on
7 December. The corresponding unsecured rate decreased by 22 basis points to stand at 1.26%
Chart 10 Sectoral breakdown of quoted shares issued by euro area residents
(annual growth rates)
-4
-2
0
2
4
6
8
10
12
14
16
-4
-2
0
2
4
6
8
10
12
14
16
1999 2001 2003 2005 2007 2009 2011
total
MFIs
non-monetary financial corporations
non-financial corporations
Source: ECB.Note: Growth rates are calculated on the basis of fi nancial transactions.

29ECB
Monthly Bulletin
January 2012
ECONOMIC AND MONETARYDEVELOPMENTS
Monetary and
financial
developments
on 11 January. This resulted in the spread between the unsecured three-month EURIBOR and the
three-month EONIA swap rate decreasing by 11 basis points to stand at 91 basis points.
The interest rates implied by the prices of three-month EURIBOR futures maturing in March,
June, September and December 2012 stood at 1.02%, 0.91%, 0.86% and 0.86% respectively on
11 January, representing decreases of 2, 6, 9 and 15 basis points respectively by comparison with
the levels observed on 7 December.
Between 7 December and the end of the eleventh maintenance period of 2011 on 13 December,
the EONIA remained stable at around 0.70% amid continued excess liquidity, before spiking to
stand at 1.02% on the last day of the maintenance period. The EONIA was somewhat volatile
during the remainder of December, continuing the pattern observed since the beginning of the year.
On 14 December the EONIA fell sharply to stand at 0.58%, before declining sharply further on
23 December to stand at 0.42%. It then fl uctuated around that level, with the exception of the last
day of the year, when it spiked to stand at 0.63%. Overall, the negative spread between the EONIA
and the rate on the main refi nancing operations refl ected the overall amount of excess liquidity.
On 11 January the EONIA stood at 0.38%.
The Eurosystem conducted several refi nancing operations between 7 December and 11 January.
On 13 December it conducted a fi ne-tuning operation in which €258.0 billion was absorbed in order
to counter a liquidity surplus that emerged at the end of the eleventh maintenance period of the year.
In the main refi nancing operations of the twelfth maintenance period, which were conducted on 13,
20 and 27 December and 3 and 10 January, the Eurosystem allotted €291.6 billion, €169.0 billion,
€144.7 billion, €130.6 billion and €110.9 billion respectively. The Eurosystem also conducted
three longer-term refi nancing operations (LTROs) in December, all as fi xed rate tender procedures
Chart 11 Money market interest rates
(percentages per annum; spread in percentage points; daily data)
0.0
0.3
0.6
0.9
1.2
1.5
1.8
2.1
2.4
0.55
0.65
0.75
0.85
0.95
1.05
1.15
1.25
1.35
June Aug. Oct. Dec. Feb. Apr. June Aug. Oct. Dec.
2010 2011
one-month EURIBOR (left-hand scale)
three-month EURIBOR (left-hand scale)
twelve-month EURIBOR (left-hand scale)
spread between twelve-month and one-month
EURIBOR (right-hand scale)
Sources: ECB and Thomson Reuters.
Chart 12 ECB interest rates and the overnight interest rate
(percentages per annum; daily data)
0.0
0.5
1.0
1.5
2.0
2.5
0.0
0.5
1.0
1.5
2.0
2.5
fixed rate in the main refinancing operations
interest rate on the deposit facility
overnight interest rate (EONIA)
interest rate on the marginal lending facility
June Aug. Oct. Dec. Feb. Apr. June Aug. Oct. Dec.
2010 2011
Sources: ECB and Thomson Reuters.

30ECB
Monthly Bulletin
January 2012
with full allotment: a special-term refi nancing operation on 13 December with a maturity of one
maintenance period (in which €41.1 billion was allotted); a three-month LTRO on 21 December
(in which €29.7 billion was allotted); and a three-year LTRO on 21 December (in which
€489.2 billion was allotted). The decline observed in the allotment values for the main refi nancing
operations and the shorter LTROs refl ected the banking sector’s desire to receive liquidity at
the longest possible maturity. This non-standard three-year operation is playing a crucial role in
supporting the provision of credit to the economy by allowing banks to manage their liquidity risk.
Box 4 addresses this issue in more detail.
The Eurosystem also conducted fi ve one-week liquidity-absorbing operations on 13, 20 and
27 December and 3 and 10 January as variable rate tender procedures with a maximum bid rate of
1.00%. With these operations, the Eurosystem also absorbed in full the liquidity provided by means
of purchases carried out under the Securities Markets Programme.
The twelfth maintenance period of the year, which began on 14 December, was characterised
by high levels of excess liquidity, with average daily recourse to the deposit facility standing at
€378 billion on 11 January.
Box 4
THE IMPACT OF THE FIRST THREE-YEAR LONGER-TERM REFINANCING OPERATION
The aim of the additional non-standard monetary policy measures decided by the Governing
Council on 8 December 2011 was to ensure that monetary policy continues to be effectively
transmitted to the real economy, thereby supporting the ability of banks to maintain and expand
lending to euro area households and non-fi nancial corporations. This is essential to safeguard
price stability in the euro area.
As part of the agreed package of measures, two longer-term refi nancing operations (LTROs) with
a maturity of three years were announced to support the supply of credit to the euro area economy.
The fi rst operation was conducted in December 2011, while the second will be conducted in
February 2012.1 Through these operations, carried out as fi xed rate tender procedures with full
allotment, the Eurosystem is in particular ensuring that banks continue to have access to stable
funding with longer maturities. This, in turn, will limit the impact on euro area banks of the
diffi cult conditions in funding markets. Additionally, after one year banks will have the option
to repay outstanding amounts received in these operations, which gives them a high degree of
fl exibility, facilitating their liability management.
The fi rst operation, conducted on 21 December 2011, provided €489,190.75 million to 523 credit
institutions. This amount includes €45,721.45 million that was shifted from the 12-month
LTRO allotted in October. A total of 123 counterparties chose this option, whereas 58 banks
decided to retain the amounts they borrowed in the 12-month LTRO, which now has a remaining
outstanding amount of €11,213.00 million. In addition, the amount of liquidity provided via
weekly main refi nancing operations and in the three-month LTROs declined substantially.
1 The fi rst operation was allotted on 21 December 2011 and replaced the 12-month LTRO announced on 6 October. Counterparties
were permitted to shift all of the outstanding amounts received in the 12-month LTRO allotted in October into the fi rst
three-year LTRO.

31ECB
Monthly Bulletin
January 2012
ECONOMIC AND MONETARYDEVELOPMENTS
Monetary and
financial
developments
All in all, the increase in liquidity, as measured on the settlement day of the three-year LTRO,
was equal to €193.4 billion. The record amounts allotted in the three-year LTROs to the banking
system mechanically increased the quantity of base money in circulation and will therefore be
refl ected, at the aggregate level, in either the current accounts of banks or recourse to the deposit
facility, irrespective of the use that individual banks make of the newly available liquidity.
Some remarks can be made regarding the bidding behaviour in the three-year LTRO.
First, the large amount of liquidity obtained by euro area banks in this operation can be viewed
as a refl ection of their refi nancing needs over the coming three years, as shown in Chart A.
Measuring the rollover needs over a shorter horizon, for instance over the next six months, even
though it captures the large amount of refi nancing needed in the fi rst half of 2012, does not
fully explain the bidding behaviour. This suggests that medium-term funding considerations may
have had a signifi cant infl uence on the bidding behaviour. Indeed, in addition to assessing the
rollover risk faced by banks, it is useful to consider the residual maturity of banks’ outstanding
debt. The longer the residual maturity, the lower the risk that banks will need to seek market
funding under unfavourable conditions. Chart B illustrates a clear negative relationship between
the size of the bids and the residual maturity of the bidders’ debt. This also suggests that
funding considerations may have played a major role in determining the bidding behaviour.
Second, banks may have placed relatively high bids in the fi rst three-year LTRO as they
viewed the operation as attractively priced compared with the prices that could be inferred
from the EURIBOR swap curves or the spreads required by the market for bond issuance
in 2011.
Overall, the analysis suggests that funding considerations played a major role in the bidding
behaviour of banks in this fi rst three-year LTRO, supporting the Governing Council’s view that
the announced measures will help to remove impediments to access to fi nance in the economy,
stemming notably from spillovers from the sovereign debt crisis to banks’ funding markets.
Chart A Rollover needs in the next three years and bidding behaviour
(y-axis: percentage of long-term debt securities maturing in 2012-14; x-axis: bid amount in the three-year LTRO as a percentage of total assets)
100
75
50
25
0
100
75
50
25
00 2 4 6 8 10 12
Sources: ECB, Fitch Ratings and DCM Dealogic.
Chart B Residual maturity of outstanding debt and bidding behaviour
(y-axis: weighted average residual maturity of outstanding longer-term debt securities (years); x-axis: bid amount in the three-year LTRO as a percentage of total assets)
0
2
4
6
8
0
2
4
6
8
0 2 4 6 8 10 12
Sources: ECB, Fitch Ratings and DCM Dealogic.

32ECB
Monthly Bulletin
January 2012
2.4 BOND MARKETS
In the course of December 2011 and early January 2012, the decline in yields on AAA-rated long-term euro area government bonds was sharper than that observed in comparable US government bond yields. Recent developments in government bond yields refl ected mixed economic data releases, with US data generally proving to be surprisingly good, while there were signs of deterioration in the euro area. Developments in euro area bond yields and, to a certain extent, also in the United States continued to refl ect tensions associated with the euro area sovereign debt crisis. The release of worse than expected fi scal data for some euro area countries, and the fact that many euro area countries were at risk of being downgraded, weighed on market sentiment. Uncertainty about future bond market developments, as measured by implied bond market volatility, declined both in the euro area and in the United States. Intra-euro area sovereign bond yield spreads narrowed slightly for most countries. At the same time, market-based indicators of infl ation expectations suggest that market participants’ infl ation expectations remain fully consistent with price stability.
Between the end of November 2011 and 11 January 2012, AAA-rated long-term euro area
government bond yields declined by 40 basis points to stand at 2.6% at the end of the period under
review. In the United States, long-term bond yields declined by 15 basis points, and stood at 1.9%
on 11 January (see Chart 13). Consequently, the nominal interest rate differential between ten-year
government bond yields in the United States and those in the euro area narrowed over the period
under review. In Japan, ten year government bond yields declined by 10 basis points over the period
under review, standing at 1.0% on 11 January.
Overall, investors’ uncertainty about near-term bond market developments in the euro area and in the
United States, as measured by option-implied volatility, declined from the high peak levels reached
in November 2011 when tensions in sovereign
debt markets intensifi ed. Implied bond market
volatility in the United States reverted to values
more aligned to conditions prevailing prior to
the crisis. In the euro area, however, implied
bond market volatility remained high.
Over the review period, developments in
AAA-rated long-term euro area and US
government bond yields continued to refl ect
tensions associated with the euro area sovereign
debt crisis. In particular, concerns surrounding
the implementation and institutional approval
of the agreement reached at the EU Summit
in early December 2011 weighed on market
sentiment and triggered fl ight-to-safety fl ows
that brought downward pressure to bear on all
AAA-rated euro area countries’ government
bond yields. Long-term government bond yields
in the United States were partly boosted by
releases of better than expected economic data,
but concerns linked to the sovereign debt crisis
in the euro area continued to exert downward
Chart 13 Long-term government bond yields
(percentages per annum; daily data)
1.6
1.8
2.0
2.2
2.4
2.6
2.8
3.0
3.2
3.4
3.6
3.8
0.8
1.0
1.2
1.4
1.6
1.8
2.0
2.2
2.4
2.6
2.8
3.0
euro area (left-hand scale)
United States (left-hand scale)
Japan (right-hand scale)
Jan. Mar. May July Sep. Nov.2011 2012
Sources: Bloomberg and Thomson Reuters.Note: Long-term government bond yields refer to ten-year bonds or to the closest available bond maturity.

33ECB
Monthly Bulletin
January 2012
ECONOMIC AND MONETARYDEVELOPMENTS
Monetary and
financial
developments
pressure on US long-term government bond yields. On a more positive note, the measures
undertaken jointly by the ECB and fi ve other central banks to provide liquidity support to the global
fi nancial system, as well as the unconventional liquidity measures introduced by the ECB in early
December, contributed to improving market sentiment.
During the period under review, sovereign yield spreads vis-à-vis those of German sovereign
bonds narrowed slightly for most euro area countries. The release of worse than expected fi scal
data for some euro area countries, the fact that many euro area countries were deemed to be at risk
of being downgraded and market concerns about the soundness of banks and the recapitalisation
of the banking system put upward pressure on some sovereign spreads. At the same time, the
announcement of additional austerity measures by some euro area governments helped to alleviate
tensions in the markets.
Yields on both fi ve-year and ten-year infl ation-linked euro area government bonds declined
by around 50 basis points in the review period (see Chart 14). On 11 January, fi ve and ten-year
spot real yields stood at 0.0% and 0.6% respectively. Over the same period, implied forward
break-even infl ation rates (fi ve-year forward fi ve years ahead) in the euro area declined by 10 basis
points, standing at 2.5% on 11 January (see Chart 15). The corresponding infl ation swap rates
remained broadly unchanged, standing at 2.3% on the same date. Break-even infl ation rates have
remained volatile over recent months, refl ecting the high volatility of government bond markets as
well as the existence of signifi cant and volatile liquidity premia. Infl ation expectations inferred from
Chart 14 Euro area zero coupon inflation-linked bond yields
(percentages per annum; fi ve-day moving averages of daily data; seasonally adjusted)
-0.5
0.0
0.5
1.0
1.5
2.0
2.5
3.0
-0.5
0.0
0.5
1.0
1.5
2.0
2.5
3.0
Jan.
five-year forward inflation-linked bond yield
five years ahead
five-year spot inflation-linked bond yield
ten-year spot inflation-linked bond yield
Mar. May July Sep. Nov.2011 2012
Sources: Thomson Reuters and ECB calculations.Note: Since the end of August 2011, real rates have been computed as a GDP-weighted average of separate real rates for France and Germany. Before this date, real rates were computed by estimating a combined real yield curve for France and Germany.
Chart 15 Euro area zero coupon break-even inflation rates and inflation-linked swap rates
(percentages per annum; fi ve-day moving averages of daily data; seasonally adjusted)
1.8
2.0
2.2
2.4
2.6
2.8
1.8
2.0
2.2
2.4
2.6
2.8
2011 2012
five-year forward break-even inflation rate
five years ahead
five-year forward inflation-linked swap rate
five years ahead
Jan. Mar. May July Sep. Nov.
Sources: Thomson Reuters and ECB calculations.Note: Since the end of August 2011, break-even infl ation rates have been computed as a GDP-weighted average of separately estimated break-even rates for France and Germany. Before this date, break-even infl ation rates were computed by comparing yields from the nominal yield curve of AAA-rated euro area government bonds with a combined real yield curve derived from French and German infl ation-linked government bonds.

34ECB
Monthly Bulletin
January 2012
bond markets have thus been more volatile than
those based on the signals received from the
infl ation swap markets. Overall, market-based
indicators suggest that market participants’
infl ation expectations remain fully consistent
with price stability.
The general pattern of AAA-rated long-term
euro area bond yields can be decomposed into
changes in interest rate expectations (and related
risk premia) at different horizons (see Chart 16).
Compared with the end of November, the term
structure of short-term forward rates shifted
downwards across all maturities, by around
40 basis points These developments mainly
refl ected adjustments to yield expectations and a
slight deterioration in the outlook for economic
activity.
The spreads on investment-grade corporate
bonds issued by non-fi nancial corporations
remained broadly unchanged in the period under
review. Spreads on investment-grade corporate
bonds issued by fi nancial corporations declined
across all rating classes, but most markedly in
the case of the lower rating classes. Despite the
recent decline, spreads remained well above pre-crisis levels and not far from the peaks of the
summer of 2011 and November 2011. Against the background of a need for further recapitalisation,
the nominal cost of market-based debt fi nancing for euro area fi nancial corporations remains
high, and raising funds in the unsecured debt market remains very challenging for most of these
corporations.
2.5 INTEREST RATES ON LOANS AND DEPOSITS
In November 2011 MFI interest rates tended to decline across all types of loans and all maturities. Lending rates fell particularly markedly in the case of large corporate loans at short maturities, whereas the decreases in the other cases were more moderate.
In November 2011 short-term MFI interest rates tended to decline not only in the case of deposits,
but also in that of most categories of loans. Short-term interest rates on deposits fell most markedly in
the case of deposits from households with an agreed maturity of up to one year, while the decreases
in the case of both household deposits with maturities of up to three months and deposits from
non-fi nancial corporations were more modest (see Chart 17). MFI interest rates on short-
term loans to households declined only slightly, by 1 basis point, in the case of loans for house
purchase, while they decreased by about 5 basis points in the case of consumer credit. Interest
rates on overdrafts fell by about 2 basis points for non-fi nancial corporations. MFI lending rates
for small corporate loans (i.e. loans of up to €1 million) increased slightly, by 6 basis points,
Chart 16 Implied forward euro area overnight interest rates
(percentages per annum; daily data)
-0.5
0.5
1.5
2.5
3.5
4.5
5.5
-0.5
0.5
1.5
2.5
3.5
4.5
5.5
2011
11 January 2012
30 November 2011
2013 2015 2017 2019 2021
Sources: ECB, EuroMTS (underlying data) and Fitch Ratings (ratings).Notes: The implied forward yield curve, which is derived from the term structure of interest rates observed in the market, refl ects market expectations of future levels for short-term interest rates. The method used to calculate these implied forward yield curves is outlined in the “Euro area yield curve” section of the ECB’s website. The data used in the estimate are AAA-rated euro area government bond yields.

35ECB
Monthly Bulletin
January 2012
ECONOMIC AND MONETARYDEVELOPMENTS
Monetary and
financial
developments
in November 2011, while bank lending rates on large loans (i.e. loans of more than €1 million)
with a rate fi xation period of up to one year fell by 14 basis points. With the EURIBOR decreasing
by 12 basis points after the cut in key ECB interest rates in November 2011, the spread vis-à-vis
short-term MFI lending rates on loans to households increased, while that vis-à-vis large-sized
loans to non-fi nancial corporations decreased somewhat (see Chart 18).
Taking a longer-term perspective, a signifi cant pass-through of changes in market rates to
bank lending rates took place during the latest full cycle of monetary policy easing (between
October 2008 and March 2010). The subsequent increase in the three-month EURIBOR over the
period from April 2010 to July 2011 was partly refl ected in short-term bank lending rates on both
loans to non-fi nancial corporations and loans to households for house purchase, while the rate on
loans to households for consumption remained broadly stable (once the statistical reclassifi cation
of June 2010 is disregarded). As regard recent developments, historical regularities would suggest
that lower market rates should gradually be refl ected in lending rates, especially as the ECB’s most
recent non-standard measures were aimed at ensuring an adequate functioning of the monetary
policy transmission mechanism.
Chart 17 Short-term MFI interest rates and a short-term market rate
(percentages per annum; rates on new business)
0
1
2
3
4
5
6
7
8
9
10
0
1
2
3
4
5
6
7
8
9
10
2003 2004 2005 2006 2007 2008 2009 2010 2011
deposits from households redeemable at notice
of up to three months
deposits from households with an agreed maturity
of up to one year
overnight deposits from non-financial corporations
loans to households for consumption with a floating
rate and an initial rate fixation period of up to one year
loans to households for house purchase with a floating
rate and an initial rate fixation period of up to one year
loans to non-financial corporations of over €1 million
with a floating rate and an initial rate fixation period
of up to one year
three-month money market rate
Source: ECB.Note: Data as of June 2010 may not be fully comparable with those prior to that date owing to methodological changes arising from the implementation of Regulations ECB/2008/32 and ECB/2009/7 (amending Regulation ECB/2001/18).
Chart 18 Spreads of short-term MFI interest rates vis-à-vis the three-month money market rate
(percentage points; rates on new business)
-2.0
-1.0
-0.5
0.0
0.5
1.0
1.5
2.0
2.5
-2.0
-1.5 -1.5
-1.0
-0.5
0.0
0.5
1.0
1.5
2.0
2.5
loans to non-financial corporations of over €1 million
with a floating rate and an initial rate fixation period
of up to one year
loans to households for house purchase with a floating
rate and an initial rate fixation period of up to one year
deposits from households with an agreed maturity
of up to one year
2003 2004 2005 2006 2007 2008 2009 2010 2011
Source: ECB.Notes: For the loans, the spreads are calculated as the lending rate minus the three-month money market rate. For the deposits, the spread is calculated as the three-month money market rate minus the deposit rate. Data as of June 2010 may not be fully comparable with those prior to that date owing to methodological changes arising from the implementation of Regulations ECB/2008/32 and ECB/2009/7 (amending Regulation ECB/2001/18).

36ECB
Monthly Bulletin
January 2012
In the case of longer-term maturities, MFI lending
rates tended to decline for both households and
non-fi nancial corporations in November 2011
(see Chart 19). More specifi cally, the rates on
loans to households for house purchase with
an initial rate fi xation period of over fi ve and
up to ten years declined slightly, by 2 basis
points. Corporate lending rates on small-sized
loans with an initial rate fi xation period of over
fi ve years also fell slightly, while those on large
loans with similar maturity remained broadly
unchanged.
In November 2011 spreads vis-à-vis AAA-
rated seven-year government bond yields fell
substantially, driven mainly by an increase
in government bond yields amid lingering
fi scal concerns in some euro area countries. In
particular, the spread between long-term rates
on loans to households for house purchase and
the yield on AAA-rated seven-year government
bonds fell by 30 basis points, to 1.4%. For
non-fi nancial corporations, the spread of such
yields vis-à-vis large-sized loans narrowed as
well, by 27 basis points, to stand at 1.2%.
Viewed from a longer-term perspective, lending
rates to households and rates on small-sized
long-term corporate loans have generally shown a somewhat incomplete and sluggish pass-through,
while lending rates on large long-term corporate loans have evolved more in line with the yields
on AAA-rated long-term government bonds. The historical regularities between long-term lending
rates and the yields on corresponding AAA-rated government bonds may have been distorted
signifi cantly by the balance sheet vulnerabilities of euro area banks and the tensions relating to their
funding costs, as well as by the liquidity premium priced into AAA-rated sovereign bond yields.
2.6 EQUITY MARKETS
In the course of December 2011 and early January 2012, stock prices increased in the euro area and in the United States. Market sentiment in the euro area continued to be driven by the tensions in euro area sovereign debt markets, while the impact of macroeconomic data releases generally remained subdued. In the United States, by contrast, economic data releases and earnings expectations were more favourable, all in all, and supported stock prices. Stock market uncertainty, as measured by implied volatility, decreased albeit remaining at high levels on both sides of the Atlantic.
In the period under review, stock prices increased both in the euro area and in the United States.
Overall, euro area stock prices, as measured by the broad-based Dow Jones EURO STOXX index,
Chart 19 Long-term MFI interest rates and a long-term market rate
(percentages per annum; rates on new business)
1.5
2.0
2.5
3.0
3.5
4.0
4.5
5.0
5.5
6.0
1.5
2.0
2.5
3.0
3.5
4.0
4.5
5.0
5.5
6.0
2003
deposits from non-financial corporations with an
agreed maturity of over two years
deposits from households with an agreed maturity
of over two years
loans to non-financial corporations of over €1 million
with an initial rate fixation period of over five years
loans to households for house purchase with an initial
rate fixation period of over five and up to ten years
seven-year government bond yield
2004 2005 2006 2007 2008 2009 2010 2011
Source: ECB.Note: Data as of June 2010 may not be fully comparable with those prior to that date owing to methodological changes arising from the implementation of Regulations ECB/2008/32 and ECB/2009/7 (amending Regulation ECB/2001/18).

37ECB
Monthly Bulletin
January 2012
ECONOMIC AND MONETARYDEVELOPMENTS
Monetary and
financial
developments
increased by 1.0% between the end of November 2011 and 11 January 2012. At the same time,
the Standard and Poor’s 500 index in the United States increased by 3.7% (see Chart 20). Over the
same period, stock prices in Japan, as measured by the Nikkei 225 index, rose by 0.2%.
Over the review period, developments in euro area equity markets continued to be driven mainly
by tensions in sovereign bond markets. The effects of macroeconomic data releases for the
euro area generally remained subdued and prospects for growth were revised downwards by private
forecasters. Earnings announcements in the euro area did not turn out better than expected and
long-term earnings expectations remain on a declining trend. In the United States, by contrast,
economic data releases in general, and those associated with employment conditions and the
housing sector in particular, continued to offer favourable surprises. Earnings announcements in
the United States also supported the positive developments in stock prices.
In both the euro area and the United States, stock market uncertainty, as measured by implied
volatility, decreased slightly in the period under review (see Chart 21). In early January implied
volatility remained at signifi cantly higher levels in the euro area than in the United States, refl ecting
primarily the spreading of tensions in euro area sovereign debt markets to the euro area equity
markets. Implied stock market volatility remained at values close to those observed in May 2010 on
both sides of the Atlantic.
Regarding sectoral developments, the increase in euro area stock prices was driven by non-fi nancial
equities. Euro area fi nancial stock prices declined by around 1.7% over the period under review.
Chart 20 Stock price indices
(index: 1 January 2011 = 100; daily data)
70
75
80
85
90
95
100
105
110
70
75
80
85
90
95
100
105
110
euro area
United States
Japan
Jan. Mar. May July Sep. Nov.2011 2012
Source: Thomson Reuters.Note: The indices used are the Dow Jones EURO STOXX broad index for the euro area, the Standard & Poor’s 500 index for the United States and the Nikkei 225 index for Japan.
Chart 21 Implied stock market volatility
(percentages per annum; fi ve-day moving average of daily data)
10
15
20
25
30
35
40
45
10
15
20
25
30
35
40
45
euro area
United States
Japan
Jan. Mar. May July Sep. Nov.
2011 2012
Source: Bloomberg.Notes: The implied volatility series refl ects the expected standard deviation of percentage changes in stock prices over a period of up to three months, as implied in the prices of options on stock price indices. The equity indices to which the implied volatilities refer are the Dow Jones EURO STOXX 50 for the euro area, the Standard & Poor’s 500 for the United States and the Nikkei 225 for Japan.

38ECB
Monthly Bulletin
January 2012
In contrast to developments in the fi nancial sector, euro area non-fi nancial stock prices increased
by 1.8% over the same period. The credit rating downgrades for some major euro area banks,
and the announcement that the credit rating for subordinated debt issued by a large number of
euro area banks were placed on review for downgrade, weighed negatively on market sentiment.
In addition, concerns about the prospects for the recapitalisation of euro area banks in line with the
recommendation of the European Banking Authority also contributed to the decline in fi nancial
stock prices. By contrast, stock prices indices in the United States increased across all sectors.

39ECB
Monthly Bulletin
January 2012
ECONOMIC AND MONETARYDEVELOPMENTS
Prices
and costs
According to Eurostat’s fl ash estimate, euro area annual HICP infl ation was 2.8% in December 2011, after 3.0% in the preceding three months. This decline was expected and refl ects a downward base effect stemming from energy prices. Infl ation rates have been at elevated levels since the end of 2010, mainly driven by higher energy and other commodity prices. Looking ahead, they are likely to stay above 2% for several months to come, before declining to below 2%. This pattern refl ects the expectation that, in an environment of weaker economic growth in the euro area and globally, underlying cost, wage and price pressures in the euro area should remain modest. Risks to the medium-term outlook for price developments continue to be broadly balanced.
3.1 CONSUMER PRICES
According to Eurostat’s fl ash estimate, euro area annual HICP infl ation was 2.8% in December 2011,
compared with 3.0% in the previous three months (see Table 5). This decline in the annual rate
of change in the HICP refl ected a base effect of -0.2 percentage point stemming from the energy
component. Energy prices were the key factor behind the elevated rates of HICP infl ation in 2011,
accounting for almost half of the overall rate of 2.7% in the fi rst 11 months of the year – substantially
more than their weight (around one-tenth) in the HICP basket. For more detailed information on
recent developments in consumer prices for oil, see Box 5, entitled “The evolution of consumer
prices for oil products in 2011”.
3 PRICES AND COSTS
Table 5 Price developments
(annual percentage changes, unless otherwise indicated)
2010 2011 2011July
2011Aug.
2011Sep.
2011Oct.
2011Nov.
2011Dec.
HICP and its componentsOverall index 1) 1.6 . 2.5 2.5 3.0 3.0 3.0 2.8
Energy 7.4 . 11.8 11.8 12.4 12.4 12.3 .
Unprocessed food 1.3 . 1.3 1.1 1.4 1.8 1.9 .
Processed food 0.9 . 3.4 3.6 4.0 4.3 4.3 .
Non-energy industrial goods 0.5 . 0.0 0.0 1.2 1.3 1.3 .
Services 1.4 . 2.0 1.9 1.9 1.8 1.9 .
Other price indicatorsIndustrial producer prices 2.9 . 6.1 5.8 5.8 5.5 5.3 .
Oil prices (EUR per barrel) 60.7 79.7 81.7 76.7 79.8 78.9 81.4 81.7
Non-energy commodity prices 44.6 12.2 7.6 2.5 1.5 1.6 -1.9 -6.7
Sources: Eurostat, ECB and ECB calculations based on Thomson Reuters data.1) HICP infl ation in December 2011 refers to Eurostat’s fl ash estimate.
Box 5
THE EVOLUTION OF CONSUMER PRICES FOR OIL PRODUCTS IN 2011
The increase in consumer energy prices was a key factor behind the elevated rates of HICP
infl ation in 2011, accounting for almost half of the overall rate of 2.7% in the fi rst 11 months of
the year – substantially more than their weight (around one-tenth) in the HICP basket. Within
energy price infl ation over the same period (12.1%), the prices of oil products (transport and

40ECB
Monthly Bulletin
January 2012
liquid heating fuels) increased twice as much
(15.8%) as those of non-oil products (7.9%).1
This box focuses on explaining developments
in consumer prices for oil products,
decomposing their evolution in 2011 into the
main determining factors. This is done using
a stylised representation of the pricing chain
for oil products, which starts with international
crude oil prices, goes through the refi ning
process and the distribution to consumers, and
ends with the imposition of taxes.2
Crude and refi ned oil prices
The main factor behind the increase in
consumer prices for oil products in 2011 was
the development of crude oil prices, which
averaged around USD 110 per barrel in 2011,
signifi cantly up on the average levels in 2010
(USD 80 per barrel). However, although oil
products (both crude and refi ned) traded on
international markets are generally quoted in
US dollar terms, in order to understand the
impact on euro area consumer prices and,
in particular, the behaviour of distribution
margins, it is their price in euro terms that
is important. In this regard, the euro was,
on average, stronger against the US dollar
in 2011 than in 2010, although it weakened
over the course of the year. Thus, unlike the
slightly declining profi le of crude oil prices
in US dollar terms, between March and
December 2011, crude oil prices in euro terms
fl uctuated around a level slightly above €80 per
barrel (see Chart A). However, given the much
lower levels in 2010, this translated into strong
annual growth rates, which will prevail until
around March 2012. Provided oil prices do
not rise substantially in the meantime, annual
energy price infl ation should fall as a result of
negative base effects.
1 Among the oil products, the average annual rates of increase were 14.0% for transport fuels and 24.8% for liquid heating fuels.
Among the non-oil products, the average annual rates of increase were 8.7% for natural gas and 7.5% for electricity (the other two
non-oil products, namely heat energy and solid fuels, which have lower weights in the HICP, increased on average by 7.2% and 3.3%
respectively).
2 For a more detailed description and discussion, see Meyler, A., “The pass-through of oil prices into euro area consumer liquid fuel
prices in an environment of high and volatile oil prices”, Energy Economics, Vol. 31, No 6, pp. 867-881.
Chart A Crude oil (Brent) prices
(USD/EUR per barrel)
20
40
60
80
100
120
140
160
20
40
60
80
100
120
140
160
2006 2007 2008 2009 2010 2011
crude oil (USD)
crude oil (EUR)
Sources: Bloomberg, Thomson Reuters and ECB staff calculations.
Chart B Refining margins (crack spreads)
(USD per barrel)
-10
0
10
20
30
40
50
-10
0
10
20
30
40
50
2006 2007 2008 2009 2010 2011
refining margin – petrol
refining margin – diesel
Sources: Bloomberg, Thomson Reuters and ECB staff calculations.

41ECB
Monthly Bulletin
January 2012
ECONOMIC AND MONETARYDEVELOPMENTS
Prices
and costs
The next major step in the pricing chain is the refi ning process. Before crude oil can be used by
consumers, it needs to be refi ned either into petrol (gasoline) or diesel (gas oil) – the latter may be
used for both transport and home heating purposes. Chart B shows the refi ning margins (so-called
crack spreads) for refi ned petrol and refi ned diesel, which are calculated simply as the difference
between the price of the refi ned product and the price of the crude oil.3 Diesel margins fl uctuated
around a level slightly above USD 10 per barrel for most of 2011, before increasing substantially
to around USD 20 per barrel for a short period in late November and early December. Petrol
margins showed a markedly different pattern, however, fl uctuating considerably between USD 0
and USD 10 for most of 2011, but entering into negative territory in late November and early
December (i.e. the price of refi ned petrol was below that of crude oil).
One reason for the divergence between the refi ning margins towards the end of the year may be
the fact that Europe is considered to be structurally “long” in petrol (i.e. it produces more petrol
than it requires), but “short” in diesel (the share of diesel cars in new passenger car registrations
rose substantially during the 2000s; in addition, diesel is the main type of fuel used in commercial
vehicles). Being structurally long in petrol may then be accentuated by the fact that the refi ning
process generally requires that, to increase the output of diesel, refi ners also have to increase the
output of petrol (as both are products of the refi ning process). These structural market features,
combined with the onset of winter (when demand for liquid heating fuels rises), may have been
the main factors behind the recent sharp divergence in petrol and diesel refi ning margins.
Distribution and taxes
The next steps in the pricing chain are the distribution of refi ned products to consumers and
the imposition of taxes. To estimate distribution margins and the impact of taxes, the ECB uses
data on consumer prices for transport and liquid heating fuels from the European Commission’s
weekly Oil Bulletin, which, unlike HICP data are: i) available in terms of price level (i.e. euro
cent per litre) rather than as indices; ii) provided including and excluding taxes; and iii) for
transport fuel, broken down into petrol and diesel.4 Charts C and D, which plot the annual rates of
change in the weekly Oil Bulletin data alongside the monthly HICP data, illustrate that, although
the Oil Bulletin data are not offi cial statistics on consumer prices, they capture offi cial HICP
dynamics very well. Moreover, as they cover both petrol and diesel prices, it can be seen that,
on average, diesel prices increased at a higher rate (17.5%) than petrol prices (12.0%) during
2011, which may have been due to differences in refi ning margins, as discussed above. A higher
annual rate of change was also evident in the prices of liquid heating fuels (around 25% on
average). This higher percentage change was attributable not only to refi ning spreads (which also
had an impact on diesel prices), but also to there being lower excise duties on heating fuel than
on other oil products. As excise duties are fi xed amounts, higher (lower) excise duties mean that
the percentage change in consumer prices is lower (higher) in response to a given percentage
change in oil prices.
In order to quantify the contributions of the different factors to the developments in consumer
prices for oil over 2011, the table presents the estimated decomposition of consumer prices for
oil products (based on data from the weekly Oil Bulletin), with each component having been
3 The actual margin of the refi ner can depend on the specifi c grade of the crude oil used as input, the price of the other refi ned outputs
obtained, as well as non-oil cost factors.
4 These data are available at http://ec.europa.eu/energy/observatory/oil/bulletin_en.htm. In addition to being available in both pre- and
post-tax terms, these data have a number of other attractive features, namely that they are available at high frequency (weekly) and in a
timely manner (data on consumer prices on Monday are usually available by the Wednesday or Thursday of the same week).

42ECB
Monthly Bulletin
January 2012
converted into euro cent per litre terms for comparability purposes. On average across the
euro area, compared with 2010, petrol prices including taxes rose by 16 euro cent per litre to
151 euro cent per litre in 2011. By contrast, owing to lower indirect taxes, the prices of diesel
and heating fuel remained lower on average in 2011 (at 135 euro cent per litre and 91 euro cent
per litre respectively), although the price increases were larger (20 euro cent per litre and
18 euro cent per litre respectively).
The single largest and common factor behind these increases was the rise in crude oil prices
(12.7 euro cent per litre). Taxes were the second biggest factor, with a combination of rises in
excise duties and “multiplier” effects from value added tax (VAT). These multiplier effects refl ect
the fact that VAT is levied as a percentage of the pre-tax price plus the excise duty: an increase
in either pre-tax prices or excise duties will thus also give rise to an increase in VAT. The actual
Chart C Transport fuels
(annual percentage changes)
-50
-40
-30
-20
-10
0
10
20
30
40
50
60
-50
-40
-30
-20
-10
0
10
20
30
40
50
60
2006 2007 2008 2009 2010 2011
weekly Oil Bulletin data for petrol
weekly Oil Bulletin data for diesel
monthly HICP data for transport fuels
Sources: European Commission (DG ENER), Eurostat and ECB staff calculations.
Chart D Liquid heating fuels
(annual percentage changes)
-50
-40
-30
-20
-10
0
10
20
30
40
50
60
-50
-40
-30
-20
-10
0
10
20
30
40
50
60
weekly Oil Bulletin data for heating fuel
monthly HICP data for heating fuel
2006 2007 2008 2009 2010 2011
Sources: European Commission (DG ENER), Eurostat and ECB staff calculations.
Estimated decomposition of average consumer prices for oil products in the euro area
(euro cent per litre, unless otherwise indicated)
Petrol Diesel Heating fuel2010 2011 Change 2010 2011 Change 2010 2011 Change
Crude oil 38.0 50.7 12.7 38.0 50.7 12.7 38.0 50.7 12.7Refi ning costs and margins 3.5 2.0 -1.6 4.8 5.8 1.0 4.8 5.8 1.0
Distribution costs and margins 12.2 13.0 0.8 12.9 14.5 1.6 9.7 10.1 0.4
Pre-tax consumer price 53.7 65.7 12.0 55.7 71.0 15.3 52.5 66.6 14.1Taxes, of which: 81.3 85.5 4.2 59.4 64.2 4.8 21.0 24.5 3.5
Excise duty 59.3 60.5 1.2 40.9 42.1 1.2 9.1 9.6 0.5
VAT 22.0 25.0 3.0 18.5 22.1 3.6 11.9 14.9 3.0
VAT rate 19.5% 19.8% 0.3 p.p. 19.1% 19.5% 0.4 p.p. 19.4% 19.6% 0.2 p.p.
Post-tax consumer price 135.0 151.1 16.2 115.1 135.2 20.1 73.5 91.0 17.6
Source: ECB staff calculations.

43ECB
Monthly Bulletin
January 2012
ECONOMIC AND MONETARYDEVELOPMENTS
Prices
and costs
In November 2011, the last month for which an offi cial breakdown is available, the annual growth
rate of overall HICP infl ation remained stable at 3% compared with October (see Chart 22). This
was due to the slight decline in energy prices being offset by marginally higher annual rates of
change in processed food and services prices.
Looking at the main HICP components in more detail, energy infl ation fell slightly in November
to 12.3%, from 12.4% in October, owing to a downward base effect. This decline in energy
infl ation largely refl ected a lower annual rate of increase in the prices of fuels and lubricants for
personal transportation, which more than compensated for the higher annual rate of increase in
impact stemming from the hikes in VAT rates (on average between 0.2 percentage point and
0.4 percentage point) was of a smaller magnitude. In each case, taxes pushed up the consumer
price, with the strongest rise being for diesel (4.8 euro cent per litre). By comparison, refi ning
and distribution costs and margins had less of an impact. Distribution costs and margins resulted
in stronger increases for diesel (1.6 euro cent per litre) than for petrol (0.8 euro cent per litre) and
heating fuel (0.4 euro cent per litre), while refi ning costs and margins pushed the consumer price
down for petrol (by 1.6 euro cent per litre), but up for diesel and heating fuel (by 1.0 euro cent
per litre).
Looking forward, under the assumption that refi ning margins do not alter substantially and that
there are no major widespread changes in the taxes on oil products, the path for crude oil prices
implied by current futures prices is such that – mainly owing to base effects – it will have a
signifi cant dampening impact on the annual rate of change in consumer prices for oil products in
the fi rst few months of 2012.
Chart 22 Breakdown of HICP inflation: main components
(annual percentage changes; monthly data)
2004 2005 2006 2007 2008 2009 2010 2011-3
-2
-1
0
1
2
3
4
5
-15
-10
-5
0
5
10
15
20
25
total HICP (left-hand scale)
unprocessed food (left-hand scale)
energy (right-hand scale)
-1
0
1
2
3
4
-2
0
2
4
6
8
2004 2005 2006 2007 2008 2009 2010 2011
total HICP excluding energy and unprocessed food
(left-hand scale)
processed food (right-hand scale)
non-energy industrial goods (left-hand scale)
services (left-hand scale)
Source: Eurostat.

44ECB
Monthly Bulletin
January 2012
the prices of liquid fuels, while the annual rates of increase in the prices of the other energy items
remained stable.
The annual rate of change in unprocessed food prices rose by 0.1 percentage point to 1.9% in
November, mostly on account of meat prices, while that in processed food prices remained stable at
4.3%, refl ecting minor changes in the prices of several items. In the same month the annual rate of
increase in tobacco prices slowed somewhat.
Excluding all food and energy items, which represent around 30% of the HICP basket, annual HICP
infl ation remained stable at 1.6% in November. HICP infl ation excluding total food and energy is
determined predominantly by domestic factors, such as wages, profi t mark-ups and indirect taxes,
and consists of two main components, namely non-energy industrial goods and services.
The annual rate of change in non-energy industrial goods prices stood at 1.3% in November,
unchanged from the previous month. The fi gure for services infl ation grew by 0.1 percentage point,
to 1.9%, with the annual rates of change in its main sub-components (housing, transport, recreation
and personal services, and communication services) remaining stable compared with October.
Over the period from January 1999 to December 2011, average infl ation in the euro area was 2.03%
and hence very close to the Governing Council’s aim of maintaining the annual rate of change in the
euro area HICP below, but close to, 2% over the medium term. Box 6, entitled “Factors limiting the
scope available for increases in domestic prices”, looks at some special factors that have affected
infl ation since 1999.
Box 6
FACTORS LIMITING THE SCOPE AVAILABLE FOR INCREASES IN DOMESTIC PRICES
The Governing Council of the ECB aims to maintain the annual rate of change in the euro area
HICP below, but close to, 2% over the medium term. This defi nes the overall scope available
for increases in consumer prices, irrespective of the nature and origin of the increases. Over the
period from January 1999 to December 2011, average infl ation in the euro area was very close
to this objective, at 2.03%. This box looks at some special factors that have affected infl ation
since 1999, such as increases in oil prices and indirect taxes. It shows that trend increases in
these factors limit the room for other price increases that are domestic in origin, such as wage
and profi t developments, given that price stability, as defi ned above, is to be maintained over the
medium term.
Price effects implied by changes in indirect tax rates and oil prices
Looking at the fi rst 13 years of Monetary Union, from 1999 to 2011, shows that changes in
indirect taxes and oil prices have, on balance, put upward pressure on euro area HICP infl ation
that had to be counterbalanced by domestic factors.
Where indirect taxes are concerned, upward pressure is the result of, for instance, an increase in
the indirect tax rate, as this implies a stronger increase in the tax component of consumer prices

45ECB
Monthly Bulletin
January 2012
ECONOMIC AND MONETARYDEVELOPMENTS
Prices
and costs
than in the pre-tax component. Calculated
as the difference between HICP infl ation
and Eurostat’s measure of HICP infl ation at
constant tax rates, the direct impact of indirect
taxes averaged almost 0.2 percentage point
per annum over the period under review.1 The
impact was almost always positive, with only
a very short period of slightly negative values
in early 2010 (see Chart A). Stronger than
average price increases were also recorded
for administered prices, i.e. prices which are
set directly or infl uenced signifi cantly by the
government. These prices have increased, on
average, by 2.5% per annum since 1999.
In the case of oil prices, the direct impact can
be seen in consumer prices for liquid fuels
almost immediately and, with some lag, also
in consumer prices for gas and other sources
of energy. One way of gauging the direct
impact of oil price shocks is hence to look at
the growth in overall consumer energy prices.
In the period from 1999 to 2011, the annual
growth rate of the energy component of the
HICP averaged 5.2%, which is signifi cantly
above the average increase in the euro area
HICP. The indirect effects that oil price shocks have on consumer prices via higher energy input
costs along the production chain have exerted further upward pressure on overall euro area HICP
infl ation, but such effects are more diffi cult to quantify.2
Implications for domestic price and wage-setting
The price effects discussed above refl ect claims of governments and commodity producing
countries on the value added of the euro area economy. These claims reduce the room available
for wages and profi ts to grow in line with price stability. The simple quantifi cations above suggest
that in the period from 1999 to 2011, around half a percentage point of an average rate of HICP
infl ation of 2.0% was de facto absorbed by increases in both government-induced prices and oil
prices, and was thereby unavailable for domestic income growth.3
1 HICP infl ation at constant tax rates (HICP-CT), as published by Eurostat, is only available as of 2004. The average impact of taxes over
the period from 2004 to 2010 was 0.15 percentage point (see the box entitled “Gauging the impact of indirect taxation on euro area
infl ation”, Monthly Bulletin, ECB, March 2011). Estimates for the whole period from 1999 to 2010 suggest a somewhat higher average
contribution of 0.2 percentage point. This also corresponds more closely to the average contribution of indirect taxes of 0.2 percentage
point to the growth in the GDP defl ator in that period.
2 The estimation of indirect effects is subject to considerable uncertainties. Eurosystem staff computations put the indirect effect of a
10% increase in oil prices on HICP infl ation in the euro area in the range 0.1-0.3 percentage point. There is also some evidence of a
reduced impact over time, perhaps stemming from the lower energy intensity of economic activity. See Table 12 in Task Force of the
Monetary Policy Committee of the ESCB, “Energy markets and the euro area macroeconomy”, Occasional Paper Series, No 113,
ECB, June 2010, p.76.
3 Around half a percentage point roughly sums up the following impacts: i) less than 0.20 percentage point from indirect taxes (see also
note 2 in Chart A); ii) 0.05 percentage point from growth in administered prices in excess of 2.0%; iii) 0.33 percentage point from
growth in energy prices in excess of 2.0%; and iv) 0.15 percentage point from indirect effects of oil prices (see footnote 2 above).
Chart A The contribution of indirect taxes and energy prices to HICP inflation
(percentage points)
-1.2
-0.8
-0.4
0.0
0.4
0.8
1.2
1.6
-1.2
-0.8
-0.4
0.0
0.4
0.8
1.2
1.6
1999 2001 2003 2005 2007 2009 2011
contribution of indirect taxes
direct contribution of energy
Source: Eurostat. Notes: Data on the contribution of indirect taxes are not available before 2004 (see footnote 1). The last observation is that for the third quarter of 2011. It should be noted that the contributions of indirect taxes and energy prices are not strictly separable, because the latter already include some impact from indirect taxation.

46ECB
Monthly Bulletin
January 2012
3.2 INDUSTRIAL PRODUCER PRICES
Industrial producer price infl ation (excluding construction) fell to 5.3% in November 2011, from
5.5% in October (see Chart 23), thus pointing to a further easing in input price pressures. This
easing is currently more visible at the earlier stages of the pricing chain (e.g. producer prices for
intermediate goods) than at the later stages (e.g. producer prices for consumer goods excluding
food). Excluding construction and energy, industrial producer price infl ation declined to 3.0%
in November, from 3.2% in October. This was due largely to a lower annual rate of change in
intermediate goods prices, which resulted from a negative base effect.
At the later stages of the production chain, producer price infl ation in consumer goods industries
stood at 3.4% in November, thus remaining broadly unchanged in the period from April. The annual
rate of change in the non-food component increased to 1.7% in November, the highest it has been
since October 2001, signalling ongoing pipeline pressures for underlying consumer price infl ation.
These fi gures have to be compared with an
average increase of clearly less than 2% that
was accounted for by domestic cost factors.
Wages adjusted for productivity, as measured
by unit labour costs, increased by 1.6%, on
average, between 1999 and the third quarter
of 2011, and developments in the mark-up on
wages, as measured by profi t margins, added
another 0.1 percentage point (see Chart B).4
While the above analysis is backward-looking,
there are reasons to assume that changes in
indirect taxes and oil prices are likely to remain
important also when looking forward. In
particular, indirect taxes are likely to continue
to be a major element in governments’
budget policies, both with regard to the fi scal
consolidation necessary in many countries and
with respect to a general tendency to rebalance
the fi scal burden from direct to indirect taxes
in order to reduce labour costs and the tax-bias
against saving.5 In addition, in view of the
persistently strong growth in emerging markets’ demand for commodities, further upward
pressure on commodity prices cannot be ruled out looking ahead. Overall, social partners in the
euro area will therefore need to continue to take due account of the likely limitations in the scope
for domestic income distribution that are associated with indirect tax and terms-of-trade effects.
4 The profi t margin indicator is obtained from the difference between the growth rate of the GDP defl ator at basic prices and the growth
rate of unit labour costs. Note that the concepts of GDP defl ator and HICP are not directly comparable. The average annual growth rate
of the GDP defl ator at factor cost over the period from 1999 to the third quarter of 2011 was 1.8%.
5 See Box 12, entitled “Fiscal devaluation – a tool for economic adjustment”, Monthly Bulletin, ECB, December 2011. See also Johansson, Å.
et al., “Taxation and Economic Growth”, OECD Economic Department Working Papers, No 620, OECD, 2008, who fi nd that VAT
and property taxes are the least harmful taxes for growth, while labour and corporate income taxes are the most damaging.
Chart B Unit labour costs in the euro area
(year-on-year percentage changes)
7.0
6.0
5.0
4.0
3.0
2.0
1.0
0.0
-1.0
7.0
6.0
5.0
4.0
3.0
2.0
1.0
0.0
-1.01999 2001 2003 2005 2007 2009 2011
increase in unit labour costs
average increase in unit labour costs (1999-Q3 2011)
Source: Eurostat.Note: Last observation is that for the third quarter of 2011.

47ECB
Monthly Bulletin
January 2012
ECONOMIC AND MONETARYDEVELOPMENTS
Prices
and costs
By contrast, the annual rate of change in the food component declined marginally to 4.8% and is
expected to fall further in the coming months, owing to the recent strong decreases in the annual
rate of change in food commodity prices in the EU.
In December 2011 price survey indicators, which lead producer price developments, edged up
further, suggesting that the downward trend which began in the spring of that year has come to
a halt (see Chart 24). With regard to the Purchasing Managers’ Index, the input price index for
the services sector rose from 55.4 in November to 56.6 in December, which represents a slightly
stronger increase than in the manufacturing sector, where it went up from 48.9 to 49.3 over the same
months. The selling price index for the manufacturing sector increased from 50.6 in November to
50.8 in December, whereas for the services sector, it declined from 50.0 to 49.3, dropping below
the threshold level of 50, which indicates falling prices. According to the European Commission’s
business survey, industrial selling price expectations remained unchanged, but close to their
historical average.
To sum up, further downward base effects, together with lower infl ationary pressures anticipated
by price survey data, suggest further declines in producer price infl ation over the coming months.
Nevertheless, the elevated levels of producer price infl ation continue to refl ect ongoing pipeline
pressures.
Chart 23 Breakdown of industrial producer prices
(annual percentage changes; monthly data)
-8
-6
-4
-2
0
2
4
6
8
10
-20
-15
-10
-5
0
5
10
15
20
25
2004 2005 2006 2007 2008 2009 2010 2011
-10 -25
total industry excluding construction (left-hand scale)
intermediate goods (left-hand scale)
capital goods (left-hand scale)
consumer goods (left-hand scale)
energy (right-hand scale)
Sources: Eurostat and ECB calculations.
Chart 24 Producer input and output price surveys
(diffusion indices; monthly data)
20
30
40
50
60
70
80
90
20
30
40
50
60
70
80
90
2004 2005 2006 2007 2008 2009 2010 2011
manufacturing; input prices
manufacturing; prices charged
services; input prices
services; prices charged
Source: Markit.Note: An index value above 50 indicates an increase in prices, whereas a value below 50 indicates a decrease.

48ECB
Monthly Bulletin
January 2012
3.3 LABOUR COST INDICATORS
In line with the slow improvement in labour
market conditions, labour cost indicators in
the euro area increased gradually during 2011
(see Table 6 and Chart 25), with wage growth,
including compensation per employee, being
higher than expected. However, in view of the
rather weak growth prospects and the continued
slack in the labour market, labour cost pressures
are likely to remain contained in the medium
term. Preliminary data on negotiated wages in
the euro area for October show some moderation
in wage growth.
Euro area negotiated wages grew by 2.1%
year on year in the third quarter of 2011, after
1.9% in the previous quarter. The annual rate of
growth in hourly labour costs slowed to 2.7%
in the third quarter, compared with 3.2% in the
previous quarter. This deceleration was driven
primarily by developments in the industrial
sector, where annual hourly labour costs
increased by only 2.9% in the third quarter,
compared with 4.2% in the second quarter
(see Chart 26). There were also more modest decreases in hourly labour costs in the construction
and market services sectors. Overall, non-wage costs continued to grow at a faster rate than the
wages and salaries component of euro area hourly labour costs.
At the same time the annual growth rate of compensation per employee stabilised, standing at 2.4%
year on year in the third quarter of 2011, after 2.5% in the second quarter. Despite a slight fall in
employment growth, the annual growth rate of labour productivity decreased to 1.0% in the third
quarter, down from 1.3% (revised fi gure) in the second quarter. Overall, unit labour cost growth
increased further to 1.3% year on year in the third quarter, after 1.2% in the previous quarter.
Looking ahead, the latest surveys point to a slowdown in productivity in the coming quarters, which
could drive up growth in unit labour costs further.
Table 6 Labour cost indicators
(annual percentage changes, unless otherwise indicated)
2009 2010 2010Q3
2010Q4
2011Q1
2011Q2
2011Q3
Negotiated wages 2.6 1.7 1.5 1.6 1.8 1.9 2.1
Hourly labour cost index 2.7 1.6 1.1 1.7 2.5 3.2 2.7
Compensation per employee 1.4 1.6 1.5 1.6 2.4 2.5 2.4
Memo items:Labour productivity -2.5 2.4 2.3 1.9 2.2 1.3 1.0
Unit labour costs 4.0 -0.8 -0.7 -0.3 0.2 1.2 1.3
Sources: Eurostat, national data and ECB calculations.
Chart 25 Selected labour cost indicators
(annual percentage changes; quarterly data)
1.0
1.5
2.0
2.5
3.0
3.5
4.0
4.5
1.0
1.5
2.0
2.5
3.0
3.5
4.0
4.5
2004 2005 2006 2007 2008 2009 2010 2011
compensation per employee
negotiated wages
hourly labour cost index
Sources: Eurostat, national data and ECB calculations.

49ECB
Monthly Bulletin
January 2012
ECONOMIC AND MONETARYDEVELOPMENTS
Prices
and costs
3.4 THE OUTLOOK FOR INFLATION
Looking ahead, infl ation rates are likely to stay clearly above 2% for several months to come, before
declining to below 2%. This pattern refl ects the expectation that, in an environment of weaker
growth in the euro area and globally, underlying cost, wage and price pressures in the euro area
should remain modest.
Risks to the medium-term outlook for price developments continue to be seen as broadly balanced.
On the upside, the main risks relate to further increases in indirect taxes and administered prices,
owing to the need for fi scal consolidation in the coming years, and possible increases in commodity
prices. The main downside risks relate to the impact of weaker than expected economic growth in
the euro area and globally.
Chart 26 Sectoral labour cost developments
(annual percentage changes; quarterly data)
-2
-1
0
1
2
3
4
5
6
7
-2
-1
0
1
2
3
4
5
6
7
2004 2005 2006 2007 2008 2009 2010 2011
industry excluding construction, CPEconstruction, CPE
market services, CPE
services, CPE
industry excluding construction, hourly LCI
construction, hourly LCI
market services, hourly LCI
-2
-1
0
1
2
3
4
5
6
7
-2
-1
0
1
2
3
4
5
6
7
2004 2005 2006 2007 2008 2009 2010 2011
Sources: Eurostat and ECB calculations.Note: CPE stands for “compensation per employee” and LCI stands for “labour cost index”.

50ECB
Monthly Bulletin
January 2012
Real GDP in the euro area grew by 0.1% quarter on quarter in the third quarter of 2011. At present, a number of factors seem to be dampening the underlying growth momentum in the euro area. They include moderate global demand growth and weak business and consumer confi dence in the euro area. Domestic demand is likely to be dampened by the ongoing tensions in euro area sovereign debt markets, as well as the process of balance sheet adjustment in the fi nancial and non-fi nancial sectors. At the same time, euro area economic activity should recover, albeit very gradually, in the course of 2012, supported by developments in global demand, very low short-term interest rates and all the measures taken to support the functioning of the fi nancial sector. Substantial downside risks to the economic outlook for the euro area continue to exist in an environment of high uncertainty.
4.1 REAL GDP AND DEMAND COMPONENTS
Real GDP in the euro area grew by 0.1%
quarter on quarter in the third quarter of 2011,
following growth of 0.2% in the previous
quarter (see Chart 27). This outcome, which
has been revised down by 0.1 percentage point,
refl ected positive contributions from domestic
demand and net trade, while inventories made a
negative contribution. Although GDP has grown
quarter on quarter for nine consecutive quarters,
the level of output in the third quarter of 2011
was still 1.8% below its pre-recession peak in
the fi rst quarter of 2008.
Private consumption in the euro area rose by
0.2% in the third quarter of 2011. This compares
with a contraction of 0.5% in the previous
quarter. It is most likely that the third quarter
growth refl ects a positive contribution from
consumption of services, as both retail sales
and car registrations (a close correlative of car
purchases) declined quarter on quarter.
As regards the fourth quarter of 2011, information on private consumption points towards a persistent
lack of dynamism in consumer spending. Retail sales declined by 0.8% in November, and in the
fi rst two months of the fourth quarter were on average 0.7% below their third quarter average. In the
same two months, new passenger car registrations remained at the same level as in the third quarter
of 2011. Retail sector survey data, which are available for the full fourth quarter, point towards
continued weakness in consumption of retail goods (see Chart 28). The Purchasing Managers’
Index (PMI) for the retail sector declined from 48.6 in the third quarter to 46.7 in the fourth quarter,
thereby signalling shrinking sales. Moreover, according to the European Commission’s consumer
survey, the consumer confi dence indicator declined for the sixth consecutive month in December.
As a result, the average for the fourth quarter was below the average for the third quarter and
below its long-term average. Meanwhile, the indicator of expected major purchases remained at
historically low levels, suggesting that consumers are still cautious when deciding whether or not to
purchase durable goods.
4 OUTPUT, DEMAND AND THE LABOUR MARKET
Chart 27 Real GDP growth and contributions
(quarter-on-quarter growth rate and quarterly percentage point contributions; seasonally adjusted)
-0.3
-0.1
0.1
0.3
0.5
0.7
0.9
-0.3
-0.1
0.1
0.3
0.5
0.7
0.9
Q32010 2011
Q4 Q1 Q2 Q3
domestic demand (excluding inventories)
changes in inventories
net exports
total GDP growth
Sources: Eurostat and ECB calculations.

51ECB
Monthly Bulletin
January 2012
ECONOMIC AND MONETARYDEVELOPMENTS
Output,
demand and the
labour market
Gross fi xed capital formation declined quarter
on quarter by 0.1% in the third quarter of 2011,
following a similar decline in the previous
quarter. The recovery in investment has been
more sluggish than the recovery in overall
activity. This is mainly due to developments
in construction investment. With regard to the
breakdown of investment in the third quarter,
non-construction investment rose quarter on
quarter by 0.8%, while construction investment
contracted by 0.9%.
Looking ahead, industrial production of capital
goods (an indicator of future non-construction
investment) increased month on month by
0.9% in October. However, capital goods
production posted a sharp decline of 3.9% in
September, which will dampen growth in the
fourth quarter due to the negative carry-over
effect. Moreover, survey results for the non-
construction industrial sector – both the PMI
and the European Commission’s industrial
confi dence indicator – point towards a marked
slowdown in activity in the fourth quarter.
The industrial confi dence indicator is close to
its historical average, while the PMI remains
below the theoretical no-growth threshold
of 50, although it improved somewhat in
December.
In October 2011 construction production declined by 1.4% month on month, following a decline
of the same magnitude in the previous month. Meanwhile, the construction confi dence indicator
published by the European Commission remained below its historical average throughout the fourth
quarter. At the same time, the PMI for construction in the euro area was, on average, well below 50
during the fourth quarter, pointing towards continued negative growth in that quarter.
Turning to trade fl ows, both imports and exports grew moderately in the third quarter of 2011,
mainly refl ecting the slight rebound in global trade as supply chain disruptions eased. As regards
the fourth quarter, the growth rates of extra-euro area imports and exports of goods declined month
on month in October for the second consecutive month. Despite more positive developments in
three-month-on-three-month terms, the October data point towards contracting euro area trade in
goods in the last quarter of 2011. In contrast to trade in goods, trade in extra-euro area services
rebounded slightly in October (in both month-on-month and three-month-on-three-month terms).
Looking ahead, the PMI for new export orders in the euro area manufacturing sector improved
marginally in December – the fi rst improvement since April 2011. However, the level remained
below 50, pointing towards negative euro area export growth in the short term.
Chart 28 Retail sales and confidence in the retail trade and household sectors
(monthly data)
-4
-3
-2
-1
0
1
2
3
4
-40
-30
-20
-10
0
10
20
30
40
2004 2005 2006 2007 2008 2009 2010 2011
total retail sales 1) (left-hand scale)
consumer confidence 2) (right-hand scale)
retail confidence 2) (right-hand scale)
Sources: European Commission Business and Consumer Surveys and Eurostat.1) Annual percentage changes; three-month moving averages; working day-adjusted. Including fuel.2) Percentage balances; seasonally and mean-adjusted.

52ECB
Monthly Bulletin
January 2012
4.2 OUTPUT, SUPPLY AND LABOUR MARKET DEVELOPMENTS
Real value added increased by 0.1% quarter on quarter in the third quarter of 2011. Activity in industry
(excluding construction) grew by 0.3%, while activity in services rose by 0.1%. Value added in
construction contracted quarter on quarter by 0.5%. Box 7 briefl y reviews the updated classifi cation
of economic activities (NACE) in national accounts, which has recently been introduced with the
aim of giving a more refi ned breakdown of activities, particularly in the case of services.
With regard to developments in the fourth quarter of 2011, industrial production (excluding
construction) declined month on month by 0.2% in October, following a decline of 2.0% in the
previous month. The three-month-on-three-month growth rate declined from 0.6% in September
to 0.2% in October (see Chart 29). Meanwhile, euro area industrial new orders (excluding heavy
transport equipment) declined further by 0.6% month on month in October, after the sharp decline
of 5.5% in the previous month. Survey data, which are more up to date, point to weak activity
for the quarter as a whole (see Chart 30). For example, the PMI manufacturing output index
stood at 46.5 in the fourth quarter, which was lower than in the third quarter and well below the
no-growth threshold of 50. The services business activity index also declined, from 50.6 in the
third quarter to 47.6 in the fourth quarter. However, the PMIs for both manufacturing and services,
albeit remaining below 50 in December, have recently improved, which may suggest that they are
bottoming out. Other business surveys, such as those of the European Commission, are broadly in
line with developments in the PMI.
Chart 30 Industrial production, industrial confidence and the PMI
(monthly data; seasonally adjusted)
-15
-10
-5
0
5
-45
-40
-35
-30
-25
-20
-15
-10
-5
0
5
10
15
2004 2005 2006 2007 2008 2009 2010 2011
industrial production 1) (left-hand scale)
industrial confidence 2) (right-hand scale)
PMI 3) (right-hand scale)
Sources: Eurostat, European Commission Business and Consumer Surveys, Markit and ECB calculations.Note: Survey data refer to manufacturing.1) Three-month-on-three-month percentage changes.2) Percentage balances.3) Purchasing Managers’ Index; deviations from an index value of 50.
Chart 29 Industrial production growth and contributions
(growth rate and percentage point contributions; monthly data; seasonally adjusted)
-11
-10
-9
-8
-7
-6
-5
-4
-3
-2
-1
0
1
2
3
4
-11
-10
-9
-8
-7
-6
-5
-4
-3
-2
-1
0
1
2
3
4
2004 2005 2006 2007 2008 2009 2010 2011
capital goods
consumer goods
intermediate goods
energy
total (excluding construction)
Sources: Eurostat and ECB calculations.Notes: Data shown are calculated as three-month moving averages against the corresponding average three months earlier.

53ECB
Monthly Bulletin
January 2012
ECONOMIC AND MONETARYDEVELOPMENTS
Output,
demand and the
labour market
Box 7
REVISED ACTIVITY CLASSIFICATION (NACE) IN NATIONAL ACCOUNTS
When the main national accounts aggregates were released for the third quarter of 2011,
the updated classifi cation of economic activities NACE 1 Rev. 2 replaced NACE Rev. 1.1.
The “NACE” classifi cation, which is fully consistent with the International Standard Industrial
Classifi cation of all Economic Activities (ISIC), provides the mandatory statistical framework for
a wide range of European statistics, including short-term statistics, labour market statistics and
national accounts. The current publication is the culmination of a three-year process, whereby the
changeover to the new classifi cation 2 was implemented for the statistics underlying the national
accounts. From now on only data in the revised aggregation for national accounts 3 will be used
in the Monthly Bulletin.4 This box explains the changeover and the revision.
Implications of NACE Rev. 2
The revision has mainly affected the breakdown of value added, employment and compensation of
employees. The tables in the “Euro area statistics” section of the Monthly Bulletin now report ten
aggregates of economic activity, compared with six previously, according to the so-called “A10
industry breakdown”,5 giving a more refi ned breakdown of activities, particularly in the case of
services (see Table A). This is one of the major benefi ts of the new classifi cation, allowing a more
1 NACE stands for “Nomenclature statistique des activités économiques dans la Communauté Européenne” and defi nes the statistical
classifi cation of economic activites in the European Community. For more information on NACE Rev. 2 and the links to other
classifi cations, please refer to “NACE Rev. 2: Statistical classifi cation of economic activities in the European Community”, available
on the Eurostat website (http://epp.eurostat.ec.europa.eu).
2 Comprehensive information on the introduction of NACE Rev. 2 in short-term business statistics can be found in Box 4 of the
April 2009 issue of the Monthly Bulletin.
3 National accountants agreed on specifi c NACE Rev. 2 breakdowns for their use. These are specifi ed in Commission Regulation (EU)
No 715/2010 of 10 August 2010 amending ESA 95, which introduces NACE Rev. 2.
4 See revised Tables 5.2.2, 5.3.1 and 5.1.4 in the “Euro area statistics” section of this issue of the Monthly Bulletin.
5 See the tables mentioned in footnote 4. A detailed description of the breakdown can be found in the annex to Commission Regulation
(EU) No 715/2010.
Table A Broad correspondence between the sections in NACE Rev. 1.1 and NACE Rev. 2
NACE Rev. 1.1 NACE Rev. 2
Section Activities% of total
in 2010 Section Activities% of total
in 2010
1 A, B Agriculture, hunting, forestry and
fi shing activities 1.7
1 A Agriculture, forestry and fi shing 1.7
2 C, D, E Mining, manufacturing and energy 18.6 2 B, C, D, E Manufacturing, energy and utilities 18.9
3 F Construction 5.9 3 F Construction 6.2
4 G, H, I Trade, repairs, hotels and restaurants,
transport and communication 20.6
4 G, H, I Trade, transport, accommodation
and food services
19.0
5 J, K Financial, real estate, renting and
business activities 29.3
5 J Information and communication 4.4
6 L, M, N, O, P Public administration, education,
health and other services 24.1
6 K Finance and insurance 5.3
7 L Real estate 11.2
8 M, N Professional, business
and support services 10.1
9 O, P, Q Public administration, education,
health and social work 19.6
10 R, S, T, U Arts, entertainment and other services 3.7
Sources: Eurostat and ECB calculations.Note: The titles of the activities referred to in the table may differ from the offi cial titles. Shares refer to value added.
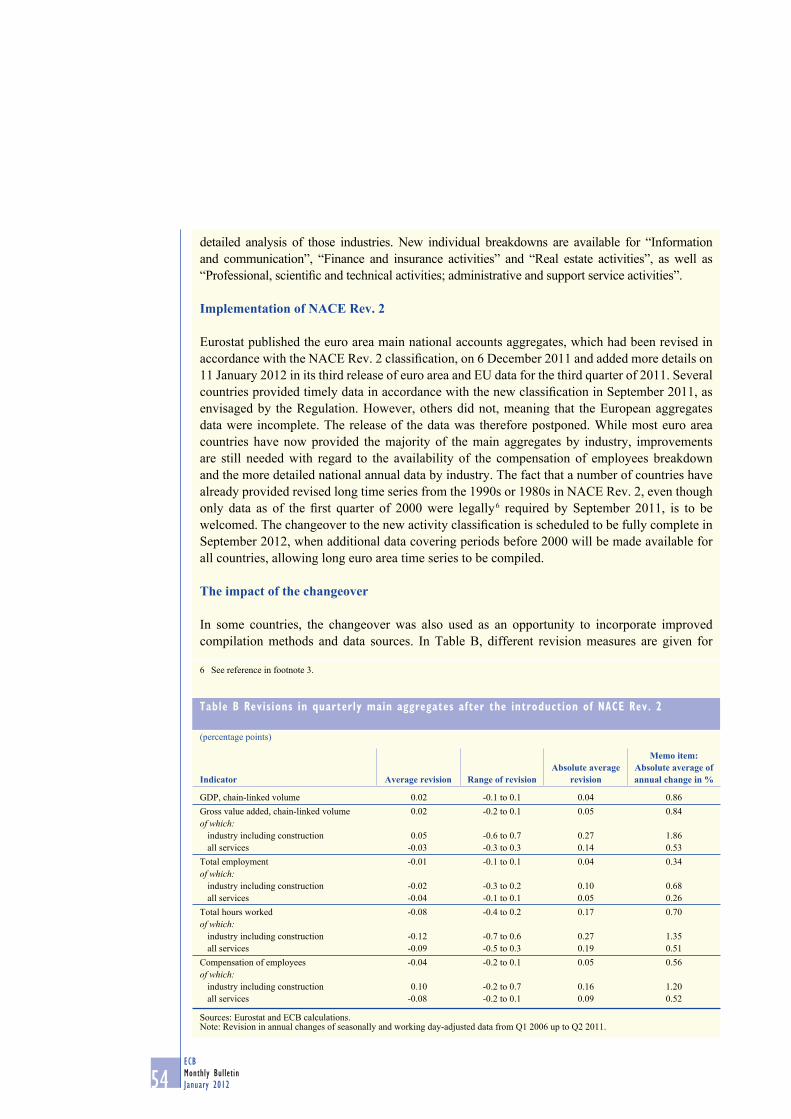
54ECB
Monthly Bulletin
January 2012
detailed analysis of those industries. New individual breakdowns are available for “Information
and communication”, “Finance and insurance activities” and “Real estate activities”, as well as
“Professional, scientifi c and technical activities; administrative and support service activities”.
Implementation of NACE Rev. 2
Eurostat published the euro area main national accounts aggregates, which had been revised in
accordance with the NACE Rev. 2 classifi cation, on 6 December 2011 and added more details on
11 January 2012 in its third release of euro area and EU data for the third quarter of 2011. Several
countries provided timely data in accordance with the new classifi cation in September 2011, as
envisaged by the Regulation. However, others did not, meaning that the European aggregates
data were incomplete. The release of the data was therefore postponed. While most euro area
countries have now provided the majority of the main aggregates by industry, improvements
are still needed with regard to the availability of the compensation of employees breakdown
and the more detailed national annual data by industry. The fact that a number of countries have
already provided revised long time series from the 1990s or 1980s in NACE Rev. 2, even though
only data as of the fi rst quarter of 2000 were legally 6 required by September 2011, is to be
welcomed. The changeover to the new activity classifi cation is scheduled to be fully complete in
September 2012, when additional data covering periods before 2000 will be made available for
all countries, allowing long euro area time series to be compiled.
The impact of the changeover
In some countries, the changeover was also used as an opportunity to incorporate improved
compilation methods and data sources. In Table B, different revision measures are given for
6 See reference in footnote 3.
Table B Revisions in quarterly main aggregates after the introduction of NACE Rev. 2
(percentage points)
Indicator Average revision Range of revisionAbsolute average
revision
Memo item: Absolute average of annual change in %
GDP, chain-linked volume 0.02 -0.1 to 0.1 0.04 0.86
Gross value added, chain-linked volume 0.02 -0.2 to 0.1 0.05 0.84
of which:industry including construction 0.05 -0.6 to 0.7 0.27 1.86
all services -0.03 -0.3 to 0.3 0.14 0.53
Total employment -0.01 -0.1 to 0.1 0.04 0.34
of which:industry including construction -0.02 -0.3 to 0.2 0.10 0.68
all services -0.04 -0.1 to 0.1 0.05 0.26
Total hours worked -0.08 -0.4 to 0.2 0.17 0.70
of which:industry including construction -0.12 -0.7 to 0.6 0.27 1.35
all services -0.09 -0.5 to 0.3 0.19 0.51
Compensation of employees -0.04 -0.2 to 0.1 0.05 0.56
of which:industry including construction 0.10 -0.2 to 0.7 0.16 1.20
all services -0.08 -0.2 to 0.1 0.09 0.52
Sources: Eurostat and ECB calculations.Note: Revision in annual changes of seasonally and working day-adjusted data from Q1 2006 up to Q2 2011.

55ECB
Monthly Bulletin
January 2012
ECONOMIC AND MONETARYDEVELOPMENTS
Output,
demand and the
labour market
LABOUR MARKET
Conditions in the euro area labour markets are deteriorating. Employment growth has turned
negative and the unemployment rate has started to edge upwards. Survey data anticipate a further
weakening.
Employment declined by 0.1% quarter on quarter in the third quarter of 2011, following three
quarters of positive growth (see Table 7). At the same time, hours worked increased by 0.1%.
At the sectoral level, on a quarter-on-quarter basis, the latest employment fi gure refl ects a sharp
decline in construction of 1.6%. Employment in both the industry (excluding construction) and
services sectors displayed fl at growth in the third quarter. Survey indicators signal a likely further
contraction in employment in the fourth quarter of 2011 (see Chart 31).
the main economic indicators for the period from the fi rst quarter of 2006 onwards. While the
average revision in the annual changes is, as expected, very small for the economy as a whole, the
changeover – which has involved improved and additional information being made available –
has led to slightly higher revisions for industry and services, especially in terms of total hours
worked and compensation of employees. The employment data were virtually unaffected by the
changeover. These results are confi rmed by the absolute average revision and the variation in the
range of revisions.
Overall, the main statistical improvements brought about by the changeover are a result
of additional information being available on the services industries. The application of the
changeover to the output, income and employment measures of GDP also restores consistency
with the short-term indicators for which NACE Rev. 2 was implemented in 2009. The
development of the time series at higher levels of aggregation is only slightly affected by the
changeover. However, further revisions in the coming months cannot be ruled out, in particular
for the compensation of employees data, which still need to include further national releases in
the new classifi cation.
Table 7 Employment growth
(percentage changes compared with the previous period; seasonally adjusted)
Persons HoursAnnual rates Quarterly rates Annual rates Quarterly rates2009 2010 2011
Q12011
Q22011
Q32009 2010 2011
Q12011
Q22011
Q3
Whole economy -1.8 -0.5 0.1 0.2 -0.1 -3.4 0.0 0.6 -0.1 0.1
of which:Agriculture and fi shing -2.2 -0.9 -1.6 0.8 -1.0 -3.1 -0.7 -0.7 -0.4 -1.6
Industry -5.6 -3.3 -0.2 0.0 -0.5 -8.7 -1.8 0.5 -0.4 -0.2
Excluding construction -5.0 -3.2 0.2 0.1 0.0 -8.9 -0.9 0.7 -0.1 0.2
Construction -6.8 -3.7 -1.2 -0.3 -1.6 -8.3 -3.6 0.2 -1.1 -1.1
Services -0.5 0.4 0.2 0.3 0.0 -1.6 0.6 0.7 0.0 0.4
Trade and transport -1.8 -0.7 0.0 0.5 0.2 -2.9 -0.3 0.5 0.2 0.6
Information and communication -0.8 -1.0 1.0 0.3 -0.2 -1.3 -0.5 1.4 0.3 0.3
Finance and insurance 0.1 -0.8 0.5 -0.2 -0.1 -1.5 -0.3 1.1 -0.5 -0.3
Real estate activities -2.7 -0.5 1.7 -0.5 -1.0 -3.7 0.9 1.0 -1.7 -0.1
Professional services -2.5 1.8 0.9 0.9 -0.3 -3.8 2.5 1.5 0.3 0.2
Public administration 1.4 1.1 -0.2 -0.1 0.0 1.1 1.3 0.3 0.0 0.1
Other services 1) 1.1 0.7 0.4 -0.1 0.2 -0.3 0.1 0.7 -0.7 1.4
Sources: Eurostat and ECB calculations.1) Also includes household services, the arts and activities of extraterritorial organisations.
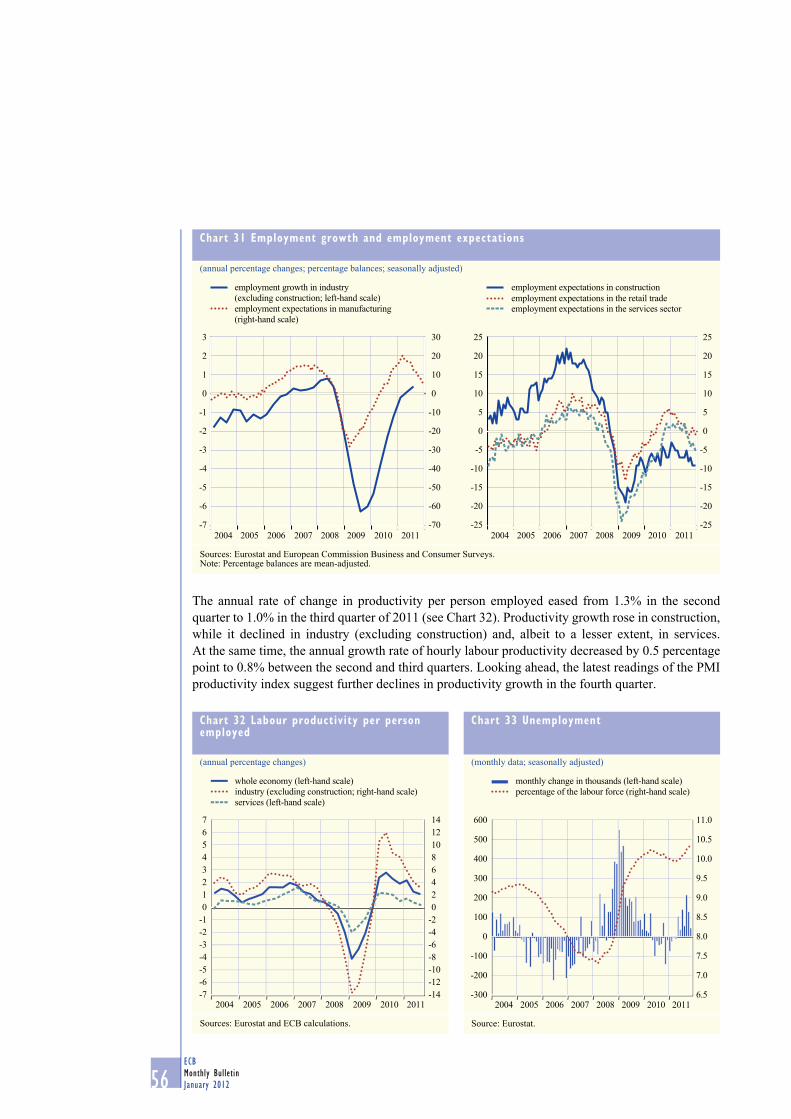
56ECB
Monthly Bulletin
January 2012
The annual rate of change in productivity per person employed eased from 1.3% in the second
quarter to 1.0% in the third quarter of 2011 (see Chart 32). Productivity growth rose in construction,
while it declined in industry (excluding construction) and, albeit to a lesser extent, in services.
At the same time, the annual growth rate of hourly labour productivity decreased by 0.5 percentage
point to 0.8% between the second and third quarters. Looking ahead, the latest readings of the PMI
productivity index suggest further declines in productivity growth in the fourth quarter.
Chart 31 Employment growth and employment expectations
(annual percentage changes; percentage balances; seasonally adjusted)
-7
-6
-5
-4
-3
-2
-1
0
1
2
3
-70
-60
-50
-40
-30
-20
-10
0
10
20
30
2004 2005 2006 2007 2008 2009 2010 2011
employment growth in industry
(excluding construction; left-hand scale)
employment expectations in manufacturing
(right-hand scale)
-25
-20
-15
-10
-5
0
5
10
15
20
25
-25
-20
-15
-10
-5
0
5
10
15
20
25
employment expectations in construction
employment expectations in the retail tradeemployment expectations in the services sector
2004 2005 2006 2007 2008 2009 2010 2011
Sources: Eurostat and European Commission Business and Consumer Surveys.Note: Percentage balances are mean-adjusted.
Chart 32 Labour productivity per person employed
(annual percentage changes)
-7
-6
-5
-4
-3
-2
-1
0
1
2
3
4
5
6
7
-14
-12
-10
-8
-6
-4
-2
0
2
4
6
8
10
12
14
2004 2005 2006 2007 2008 2009 2010 2011
whole economy (left-hand scale)
industry (excluding construction; right-hand scale)
services (left-hand scale)
Sources: Eurostat and ECB calculations.
Chart 33 Unemployment
(monthly data; seasonally adjusted)
-300
-200
-100
0
100
200
300
400
500
600
6.5
7.0
7.5
8.0
8.5
9.0
9.5
10.0
10.5
11.0
2004 2005 2006 2007 2008 2009 2010 2011
monthly change in thousands (left-hand scale)
percentage of the labour force (right-hand scale)
Source: Eurostat.

57ECB
Monthly Bulletin
January 2012
ECONOMIC AND MONETARYDEVELOPMENTS
Output,
demand and the
labour market
The unemployment rate, which rose by 0.1 percentage point in both September and October,
remained unchanged at 10.3% in November 2011. This is above the level at which it previously
peaked in the second quarter of 2010 (see Chart 33).
4.3 THE OUTLOOK FOR ECONOMIC ACTIVITY
At present, a number of factors seem to be dampening the underlying growth momentum in the euro
area. They include moderate global demand growth and weak business and consumer confi dence
in the euro area. Domestic demand is likely to be dampened by the ongoing tensions in euro area
sovereign debt markets, as well as the process of balance sheet adjustment in the fi nancial and
non-fi nancial sectors. At the same time, euro area economic activity should recover, albeit very
gradually, in the course of 2012, supported by developments in global demand, very low short-term
interest rates and all the measures taken to support the functioning of the fi nancial sector.
Substantial downside risks to the economic outlook for the euro area continue to exist in an
environment of high uncertainty. They notably relate to a further intensifi cation of the tensions
in euro area debt markets and their potential spillover to the euro area real economy. Downside
risks also relate to the global economy, protectionist pressures and the possibility of a disorderly
correction of global imbalances.


59ECB
Monthly Bulletin
January 2012
Since the start of Stage III of Economic and Monetary Union, fi nancial intermediation has evolved both in size and complexity. The fi nancial balance sheet of nearly all sectors in the euro area has grown at a faster pace than economic activity, with the largest increases taking place within the fi nancial sector. This points to an environment of intensifi ed fi nancial intermediation in the economy,with implications for the channels through which, and the lead time at which, money growth signals risks to infl ation. This article analyses the role and changing patterns of fi nancial intermediation in the euro area, and examines the implications for the conduct of monetary analysis.
ART ICLES
THE INTERPLAY OF FINANCIAL INTERMEDIARIESAND ITS IMPACT ON MONETARY ANALYSIS
1 INTRODUCTION
The monetary policy strategy of the ECB assigns
a prominent role to monetary analysis in
recognition of the robust relationship between
monetary growth and infl ation in the medium to
long run.1 Whereas the long-run link between
money growth and infl ation is well documented
across time, policy regimes and regions,2 the lead
time of money to infl ation refl ects long and
variable lags. The variability of this lead time is
rooted in the complex interaction between money,
the real economy and asset markets, in part based
on fi nancial innovation in products, processes
and institutions, but also as a result of an increase
in global interconnectedness.3 For instance, the
fast innovation process, combined with increased
wealth accumulation in an ageing society, has led
to an intensifi cation of the process of fi nancial
intermediation and a strenghthening of the link
between monetary developments and asset prices.
This has affected the importance of different
channels through which increased money growth
can lead to risks to infl ation and requires detailed
data, as well as a good understanding of changes
in the fi nancial structure.
This article describes developments in the
fi nancial intermediation environment in the euro
area, and illustrates its implications for monetary
analysis. Section 2 describes the role, evolution
and current state of fi nancial intermediation in
the euro area. Section 3 explores the available
data to extract information on interlinkages and
cross-sector balance sheet exposures between
the institutional sectors. Section 4 analyses
the effect of an increasingly complex fi nancial
environment on the task of extracting signals
for infl ation from monetary developments.
Section 5 concludes.
2 THE EVOLUTION OF FINANCIAL
INTERMEDIATION IN THE EURO AREA
This section describes the current state of
fi nancial intermediation in the euro area,
as well as its evolution since 1999. It looks fi rst
at intermediation in a conceptual framework, and
then examines the evolution of the balance sheets
of the institutional sectors in the euro area.
THE FUNCTIONS OF FINANCIAL INTERMEDIATION
The preferences of agents on how to use their
resources vary. Savers have a preference for
putting funds aside for future consumption,
while borrowers would rather increase their
consumption today or invest in projects that
will yield higher returns in the future. Typically,
savers would like easy access to their savings at
any time, while borrowers are likely to prefer
long-term funding. Reconciling the different
desires of savers and borrowers in terms of
maturity and returns is one of the aims of the
process of fi nancial intermediation.4 Financial
intermediaries perform several services:
(i) maturity transformation, which, as described,
is perhaps the most obvious; (ii) transformation of denomination, whereby, for example, small
participations in investment funds allow
households to access large-denomination assets;
(iii) monitoring and information processing,
See, for example, Papademos, L. and Stark, J. (eds.), 1 Enhancing Monetary Analysis, ECB, Frankfurt am Main, 2010.
See, for example, Benati, L., “Long-run evidence on money 2
growth and infl ation”, Working Paper Series, No 1027, ECB,
Frankfurt am Main, March 2009.
See the article entitled “The supply of money – bank behaviour 3
and the implications for monetary analysis”, Monthly Bulletin,
ECB, Frankfurt am Main, October 2011.
See, for example, Freixas, X. and Rochet, J-C., 4 Microeconomics of Banking, 2nd edition, MIT press, Cambridge, Massachusetts,
2008, for a number of examples of how fi nancial intermediations
can correct market failures.
60ECB
Monthly Bulletin
January 2012
whereby the fi nancial intermediary acts as a
delegated monitor on behalf of savers, as well as
performing the costly act of information gathering
on behalf of small-scale investors; (iv) payment services, as fi nancial intermediaries facilitate
the trade and payment of goods and services
between agents; (v) liquidity transformation,
referring, for example, to the transformation of
illiquid loans into a more liquid asset-backed
security (ABS); (vi) transaction cost reduction,
as fi nancial intermediaries exploit economies of
scale to perform fi nancial transactions at lower
marginal prices than small-scale investors.
Beyond this ability to perform the tasks outlined
above, which in most cases can be conducted by
several types of intermediaries, a clear
distinction should be made between monetary
and non-monetary fi nancial intermediaries.
Monetary fi nancial intermediaries, such as
banks, are the only intermediaries capable of
creating money and monetary liquidity. 5
FINANCIAL INTERMEDIATION IN THE EURO AREA
The fi nancial exchange between savers and
borrowers in the euro area is channelled either
directly via fi nancial markets or indirectly via
three broad groups of fi nancial intermediaries,
namely monetary fi nancial institutions
(MFIs), insurance corporations and pension
funds (ICPFs), and non-monetary fi nancial
intermediaries other than ICPFs, which are
known as other fi nancial intermediaries (OFIs).
Box 1 provides a short description of the various
fi nancial intermediaries in the euro area.
See the article entitled “The supply of money – bank behaviour 5
and the implications for monetary analysis”, Monthly Bulletin,
ECB, Frankfurt am Main, October 2011.
Box 1
FINANCIAL INTERMEDIARIES OPERATING IN THE EURO AREA
The different fi nancial intermediaries present in the euro area all perform one or more of the
services described above, depending on their core function. This box provides a short overview
of the services provided by the different types of intermediaries, using the European System of
Accounts (ESA 95) classifi cation. 1
MONETARY FINANCIAL INSTITUTIONS (MFIs)
Credit institutions
While credit institutions (or banks) perform most or all of the features described above,
the distinctive feature of banks is that they specialise in maturity transformation and providing
liquidity at the same time through their capacity to fund long-term loans by receiving short-
term deposits. This specialisation implies an inherent instability in banking business. Banks
remain able to lend to borrowers only as long as depositors are confi dent that they will be able to
withdraw their deposits at any time. Apart from maturity transformation, banks provide payment
services through, for example, cheques, debit and credit cards, and therefore play a crucial role
in facilitating the smooth functioning of day-to-day purchases of goods and services. By the end
of November 2011 there were 6,230 credit institutions in the euro area.
1 ESA 95 is a statistical standard which provides harmonised classifi cations of economic sectors within the European Union.
61ECB
Monthly Bulletin
January 2012
ARTICLES
The interplay of financial
intermediaries and its impact
on monetary analysis
Eurosystem
The Eurosystem comprises the ECB and the national central banks within the euro area. The role
of the Eurosystem in fi nancial intermediation is to implement the monetary policy of the euro area,
for example by distributing central bank liquidity, conducting foreign exchange operations
(transformation of denomination) and promoting the smooth operations of payment systems.
Additionally, the ECB has the exclusive right to authorise the issuance of banknotes within the
euro area.2
Money market funds
Money market funds are funds which raise capital from private and institutional investors by
issuing shares and/or units, and invest the proceeds in high quality money market instruments.
For example, they change denominations and conduct liquidity management. Money market
instruments comprise transferable instruments, such as treasury and local authority bills,
certifi cates of deposit, commercial paper, medium-term notes and bankers’ acceptances. These
are normally dealt on the money market, rather than on the regulated markets. Money market
funds are an important source of short-term funding, and are regarded as monetary fi nancial
institutions because the share/units issues are, in terms of liquidity, close substitutes for deposits.
By the end of November 2011 there were 1,376 money market funds in the euro area.3
In addition to credit institutions, money market funds and the Eurosystem, there are other MFIs
in the euro area. At end-November 2011, there were 30 other MFIs in the euro area in total.
These included electronic money institutions, which are institutional units that mainly provide a
means of storing money for the purpose of making payments.4
INSURANCE CORPORATIONS AND PENSION FUNDS (ICPFS)
Insurance corporations grant policy-holders benefi ts for certain specifi ed circumstances, while
(autonomous) pension funds collect, pool and invest funds to provide for the future pension
entitlements of benefi ciaries.5 As such, both types of intermediaries’ provisions include the
service of transformation of denomination to households. ICPFs play a key role in shaping
households’ asset portfolios, as nearly a third of household fi nancial assets are invested in ICPF
liabilities (insurance technical reserves). This share has increased signifi cantly over the past
decade (it was less than a quarter in 1999), refl ecting demographic trends and the perceived
need to create complementary pension schemes. In terms of balance sheets, the ICPF sector is
dominated by insurance corporations, which hold about 80% of total ICPF assets.
ICPFs are major investors in fi nancial markets. Being long-term investors, they are generally a
source of stability for fi nancial markets. However, the size of their investment portfolios implies
that markets may be moved if thier funds are reallocated or their positions unwound, as is the
2 See European Central Bank, The monetary policy of the ECB, Frankfurt am Main, 2011.
3 The statistical defi nition of money market funds has been aligned with the supervisory defi nition under Regulation ECB/2011/12 of
August 2011. The transition period to the new statistical defi nition of MMFs ends in February 2012.
4 Electronic money institutions classifi ed as MFIs are defi ned in Regulation ECB/2011/12. Some corporations (e.g. retailers) issue
electronic money. As this is not their principal activity, these are outside the fi nancial sector.
5 See the article entitled “Keeping the ECB’s monetary and fi nancial statistics fi t for use”, Monthly Bulletin, ECB, Frankfurt am Main,
August 2011.

62ECB
Monthly Bulletin
January 2012
case for other institutional investors, such as investment funds. At end-June 2011 there were an
estimated 3,400 insurance corporations and 3,200 autonomous pension funds in the euro area.
NON–MONETARY FINANCIAL INSTITUTIONS OTHER THAN ICPFS (OFIS)
Investment funds
Investment funds raise capital from private and institutional investors by issuing shares and/or
units and invest the proceeds in fi nancial and non-fi nancial assets. As fi nancial intermediaries,
investment funds perform two main functions: (a) they offer investors the opportunity to invest in
a diversifi ed pool of assets with a single purchase of shares/units (transformation of denomination),
and (b) their investments provide a source of funding to other sectors, such as MFIs, non-fi nancial
corporations and government agencies (maturity transformation).6 In the second quarter of 2011
there were 48,913 investment funds in the euro area.
Financial vehicle corporations
Financial vehicle corporations 7 (FVCs) are entities that predominantly carry out securitisation
activities (see Box 2 for more details). “Securitisation” denotes a transaction or scheme whereby
an asset or a pool of cash fl ow-producing assets, often consisting of loans, is transferred from
an originator (usually a credit institution) to an FVC. The FVC effectively converts these assets
into marketable securities by issuing debt instruments with both principal and interest serviced
with the cash fl ows produced by the asset pool. As such, securitisation is used by MFIs in order
to transform non-liquid assets into liquid assets and, by doing so, free part of their balance sheet
and obtain an additional source of funding. In the third quarter of 2011 there were 2,972 FVCs
in the euro area.
Central counterparties
A central counterparty (CCP) is an entity that legally interposes itself between counterparties to
contracts traded in fi nancial markets, becoming the buyer to every seller and the seller to every
buyer. Therefore, CCPs offer the advantage of reducing a great deal of the counterparty risk
for trading parties, compared with direct trading. These intermediaries facilitate the trading in
derivatives and equity markets, and have become an important actor in the repo market. At the
end of November 2011 there were eight CCPs in the euro area.
Other OFIs
Aside from the three types of fi nancial intermediaries described above (investment funds, FVCs
and CCPs), the OFI sector includes other types of entities, such as fi nancial holding companies,
security and derivative dealers, venture capital and other development companies, and generally
any other non-monetary and fi nancial intermediary not classifi ed elsewhere.
Finally, there are payment institutions, whose function is to provide payment services, such as
money transmission, without being a monetary institution.
6 See the article entitled “Harmonised ECB statistics on euro area investment funds and their analytical use for monetary policy
purposes”, Monthly Bulletin, ECB, Frankfurt am Main, August 2010.
7 Along with other types of OFIs, these entities are often referred to as the shadow banking industry.

63ECB
Monthly Bulletin
January 2012
ARTICLES
The interplay of financial
intermediaries and its impact
on monetary analysis
Table 1 shows the breakdown of outstanding
fi nancial assets across the various euro area
institutional sectors since 1999. Financial
corporations accounted for 58% of the total
fi nancial assets outstanding at the end of 2010.
More than half of this was held by MFIs, with
credit institutions holding by far the largest
share, while a quarter was held by OFIs and
the remainder by ICPFs. Households and non-
fi nancial corporations each held around 20%
of the total outstanding assets, while general
government accounted for only 4%.
The value of total euro area fi nancial assets
has almost doubled, compared with 1999.
The overall growth in the value of fi nancial
assets has outpaced the growth in nominal GDP,
as the value of outstanding fi nancial assets
relative to GDP has grown from around 800%
in 1999 to just over 1,000% in 2010.
The increase in outstanding fi nancial assets has
been unequal among sectors, as the fi nancial
sector has increased its asset holdings by more
than the non-fi nancial sectors. This applies in
particular to MFIs and OFIs, the fi nancial
holdings of which have more than doubled since
1999 (see Chart 1), which has resulted in an
Table 1 Total financial assets outstanding in the euro area and sectoral breakdown
(percentage)
1999 2007 2008 2009 2010
Households 24.8 21.0 20.2 20.3 20.1
Non-fi nancial corporations 18.9 18.7 17.5 17.8 17.9
Financial corporations 51.9 56.8 58.5 58.1 58.1
- Monetary fi nancial institutions 32.2 36.2 40.6 38.0 37.9
- Credit institutions 29.5 32.6 35.6 33.4 33.3
- Money market funds - 1.3 1.5 1.4 1.2
- Eurosystem 2.0 2.4 3.5 3.2 3.4
- Insurance corporations 5.7 5.6 5.4 5.7 5.7
- Pension funds 1.4 1.4 1.4 1.4 1.4
- Other fi nancial intermediaries 12.9 15.1 14.0 15.3 16.3
- Investment funds 6.6 5.9 5.2 6.1 6.7
- Financial vehicle corporations - - - 2.6 2.5
General government 4.4 3.5 3.8 3.8 4.0
Total economy 100 100 100 100 100Total economy (in EUR billions) 51,326 87,051 85,733 89,491 93,350
Total economy (as a percentage of GDP) 797 963 927 1,001 1,017
Sources: ECB and Eurostat.Note: As the data are collected from different datasets with varying accounting principles, sub-sectors may add up to more than the total sector.“-” indicates that data are not available.The data are unconsolidated, so include, for example, interbank lending.
Chart 1 Increase in financial assets from 1999 to 2010 by sector
(total percentage change)
25
50
75
100
125
150
175
25
50
75
100
125
150
175
1 households
2 non-financial corporations
4 insurance corporations
5 pension funds
6 investment funds6 investment funds
8 general government
7 OFIs excluding
investment fund3 MFIs
0 1 2 3 4 5 6 7 8
0
MFIs (Eurosystem) MFIs (money market funds)sectors
MFIs (credit institutions)
euro area total
Source: ECB.Note: Item 3 (MFIs) is broken down into the contributions of the MFI sub-sectors to the total percentage increase in the fi nancial assets of the MFI sector. The horizontal line represents the percentage increase in total fi nancial assets in the euro area.

64ECB
Monthly Bulletin
January 2012
increase in the share of these two sub-sectors’
total value of euro area fi nancial assets. Chart 1
shows that the increase in MFI asset holdings
has predominantly been driven by credit
institutions. Chart 1 also reveals that investment
funds (which include hedge funds) resident in
the euro area have not been the main driver of
the growth in total OFI asset holdings.
Market data show that securitisation activity
increased tenfold between 2000 and 2008.
This suggests that much of the increase in total
OFI holdings can be attributed to FVCs. The
increased business between MFIs and CCPs (see
Section 4) also points to CCPs as being
responsible for part of that increase. Households,
as the sector presenting the lowest balance sheet
growth, have increased their holdings of
fi nancial assets by 47%, resulting in a decreasing
share of total fi nancial assets.6 These
developments point to more and more fi nancial
interaction taking place within the fi nancial
sector itself, without the balance sheets of the
non-fi nancial sector being affected.
However, the developments in balance
sheets over the years have not been without
fl uctuations, as illustrated in Chart 2. This
depicts four-quarter cumulated transactions in
deposits with MFIs. It shows a rapid increase
during the years before the fi nancial crisis,
and an even more rapid decrease after the crisis.
The decrease was particularly strong for deposits
held by other MFIs and the external sector
(mostly non-resident MFIs), pointing to higher
volatility and instability in the interbank lending
market, as opposed to deposit funding by the
non-fi nancial sector.
3 SECTOR INTERLINKAGES AND BALANCE SHEET
EXPOSURES
Using information from the euro area accounts,
augmented by different sector-specifi c datasets,7
an “exposure map” in quantitative terms can
show the balance sheet interlinkages between
the different sectors in the euro area and the
rest of the world. The various interlinkages can
only be partially traced, as a complete account
of which sector holds the liability of each of the
sectors (the so-called “from-whom-to-whom”
accounts) is not yet fully available.
Chart 3 depicts such an exposure map. The pie
charts for the individual sectors illustrate the
extent to which the counterpart of each sector’s
liabilities can be identifi ed. In the case of non-
fi nancial corporations, it is only possible to
identify the counterparty sector for 38% of the
outstanding liabilities (the blue part of the pie
chart). Arrows between sectors represent their
cross-sector exposures, and the direction goes
from the issuer of the liabilities to the holder.
The thickness of each arrow illustrates the size
of the exposure. Thus, the arrows between non-
fi nancial corporations and MFIs show that MFIs
hold a larger amount of the liabilities issued
by non-fi nancial corporations than vice versa.
The circles within the pie charts for each
During this period an important increase in non-fi nancial wealth 6
has occurred, mainly in housing, predominantly affecting
households. Non-fi nancial assets are not, however, included in
the data discussed.
In addition to the euro area accounts, the exposure map relies on 7
the balance sheet item, ICPF, Investment Funds Balance Sheet
and FVC statistics, which are all part of the euro area monetary
and fi nancial statistics.
Chart 2 Deposits with euro area MFIs by sector
(four-quarter cumulated transactions; EUR billions)
-1,500
-1,000
-500
0
500
1,000
1,500
2,000
2,500
3,000
-1,500
-1,000
-500
0
500
1,000
1,500
2,000
2,500
3,000
2000 2002 2004 2006 2008 2010
MFIs
OFIs
ICPFs general government households non-residents
non-financial corporations
Source: ECB.

65ECB
Monthly Bulletin
January 2012
ARTICLES
The interplay of financial
intermediaries and its impact
on monetary analysis
individual sector illustrate the liabilities issued
and held by that sector. Like the arrows, the
thickness of these inner circles is proportional
to the amounts. According to the available data,
the amount of liabilities held within the same
sector is larger for MFIs than for non-fi nancial
corporations. However, as indicated by the share
of unknown counterparties (the red area in the
pie charts), the amount of liabilities issued and
held by non-fi nancial corporations can only be
determined with a very low degree of certainty.
For this reason, in the particular case of non-
fi nancial corporations, the inner circle is dashed.
For similar reasons, the pie chart for the rest of
the world does not contain an inner circle, given
that liabilities issued and held by the rest of the
world are not covered by euro area statistics.
Several key points can be derived from
the exposure map. First, all sectors
are interconnected, although the degree of
bilateral connection varies signifi cantly. Second,
there is a high degree of heterogeneity in the
share of liabilities with a known counterpart
Chart 3 Cross-sector balance sheet exposure in the euro area (2010)
non-financial corporations MFIs
OFIs
ICPF
general government
rest of the world
households
counterpart sector known
counterpart sector unknown
Sources: ECB and ECB calculations.Notes: Arrows pointing from sector A to sector B indicate that sector B holds claims on sector A, i.e. sector A liabilities are held by Sector B. The thickness of the arrows illustrates the magnitude of exposure.The circle inside each sector pie chart indicates liabilities issued and held by that same sector. The thickness of the circle illustrates the magnitude of intra-sector exposure. For NFCs, the circle is dashed, as the internal liabilities are most likely substantially underestimated. For “rest of the world”, there is no circle as, by defi nition, this is not covered by euro area statistics.
66ECB
Monthly Bulletin
January 2012
sector. For example, liabilities of households
consist almost entirely of loans, typically
granted by MFIs or held by OFIs as a
consequence of securitisation. The counterpart
of loans is well documented in offi cial statistics,
which is why the counterpart sector of 91% of
liabilities issued by households can be identifi ed.
By contrast, about half of the liabilities issued
by non-fi nancial corporations are shares and
other equity. It is harder to identify the holders
of these. All in all, when adding up the liabilities
issued in the euro area and those issued
elsewhere in the world but held within the euro
area, a counterpart sector can be identifi ed for
65% of these liabilities.8 Both the size of the
fi nancial balance sheet of each institutional
sector, as illustrated in Section 2, and the
interlinkages across sectors have increased
considerably since 1999. The balance sheet
increase has been especially apparent in the
fi nancial sectors, particularly the OFI sector.
Another important message conveyed by the
patterns in Chart 3 is that the MFI sector acts as
a fi nancial hub, especially (but not exclusively)
as regards the non-fi nancial sector. At the same
time, the MFI sector is also clearly exposed to
the rest of the world. This implies that, while
the non-fi nancial sector is highly dependent
on a well-functioning MFI sector, it is also
exposed to developments abroad through the
exposure of MFIs vis-à-vis the rest of the world.
Additionally, as the MFI sector itself is as
interlinked as documented in Chart 3, stress in
one segment of the banking sector can quickly
spread to the whole banking system and on to
the non-fi nancial sectors.
The pattern of cross-exposures in 1999 was very
similar to that of the end of 2010. However,
the counterpart to only 48% of liabilities
outstanding in 1999 can be identifi ed. The
main sources of improvement in counterparty
identifi cation have been the enhancement of
MFI and investment fund statistics, and the
introduction of statistics on ICPFs and FVCs.
This has had a positive impact, especially on
the identifi cation of holders of OFI liabilities,
but also to a lesser extent on the identifi cation
of holders of liabilities issued by ICPFs, non-
fi nancial corporations and general government.
This is also the case for the rest of the world.
Overall, the description of fi nancial
intermediation above and the data shown point
to an environment in which strong interactions
among fi nancial intermediaries have resulted
in a lengthening of the fi nancial intermediation
chain. The potential implications of this for
monetary analysis will be discussed in the next
section.
4 THE IMPLICATIONS OF THE INTERPLAY OF
FINANCIAL INTERMEDIARIES FOR MONETARY
ANALYSIS
The monetary analysis of the ECB is grounded
in the well-documented relationship between
money growth and infl ation: general increases
in money balances will eventually induce higher
consumption spending which, if not offset by
increases in output, will result in infl ation.9
This section analyses how the interactions
between the various fi nancial intermediaries –
both monetary and non-monetary – affect the
variables that are typically used for monetary
analysis (mainly money and credit aggregates),
and potentially the closeness of the link between
such variables and infl ation. The analysis is
presented in four sub-sections, which discuss
the implications of the interaction among
fi nancial intermediaries for the measurement
of money, the relationship between money and
credit (and the process of money creation), and
the link between money and consumer price
infl ation, including the asset price channel.
IMPLICATIONS FOR THE MEASUREMENT OF MONEY
There is a change in the overall amount of
money in the economy every time an MFI
Identifying the counterpart does not necessarily lead to the holder 8
of the risk being identifi ed. Through derivatives, for example,
risks can be transferred to another entity. This does not show up
on balance sheets, as the market value of a derivative contract is
usually zero or close to zero.
See, for instance, Benati, L., “Long-run evidence on money 9
growth and infl ation”, Working Paper Series, No 1027, ECB,
Frankfurt am Main, March 2009.

67ECB
Monthly Bulletin
January 2012
ARTICLES
The interplay of financial
intermediaries and its impact
on monetary analysis
liability comprised in the defi nition of money
is transferred in or out of the money-holding
sector. The same occurs if the money-holding
sector rearranges its holdings of MFI liabilities
from instruments within money to instruments
outside money or vice versa.
The amount of money in the economy decreases
when, for instance, an investment fund acquires
foreign equities from outside the euro area or
when an FVC settles its debt with a bank for
the previous purchase of a loan. However, it
increases when, for example, a credit institution
engages in a reverse repo with a CCP. This
illustrates that a longer fi nancial intermediation
chain tends to increase the short-term volatility
of broad money measures. The increased
interaction between fi nancial intermediaries
not only adds volatility to the evolution of the
monetary aggregates, it also increases the need
to understand the institutional landscape of
fi nancial intermediation and the motivation
underlying different transactions. This
knowledge helps discern between movements
in money that have more direct informational
content for the analysis of consumer price
trends and those that are of a less fundamental
nature from a monetary analysis point of view.
For example, a transaction between two banks
through a CCP is essentially an inter-MFI
transaction, which has an impact on money and
credit aggregates only because it is conducted
through an entity – the CCP – belonging to
the money-holding sector. In conjunction with
the overall information on other inter-MFI
transactions, the level of inter-MFI business
conducted via a CCP nonetheless provides
valuable information with regard to inter-MFI
funding conditions. Indeed, secured inter-MFI
transactions conducted via CCPs have increased
markedly since the onset of the fi nancial crisis,
as CCPs reduce counterparty risk and have
partially offset the decrease observed in direct
unsecured interbank business.
A more complex implication of the interactions
between MFIs and other fi nancial intermediaries
relates to the securitisation technology, whereby
an FVC – a non-monetary fi nancial intermediary,
and thus part of the money-holding sector – buys
MFI loans and issues securities backed by these
loans. While true-sale securitisation has an
immediate impact on MFI loans, as the loans are
no longer on the banks’ balance sheet,10 the
impact on money is less straightforward. On the
one hand, the purchase of MFI loans by FVCs
can eventually result in a decrease in money
aggregates.11 When an FVC buys a pool of loans
from an MFI, this is paid for by money collected
from the proceeds of the product of the
securitisation, typically ABS. If the ABS is
bought by an entity within the money-holding
sector, this entity may purchase the ABS with
money drawn from its deposits with a bank. This
would decrease the outstanding monetary
liabilities within the MFI sector, thus decreasing
money balances. Seen from another perspective,
the pool of loans sold to the FVC is funded by the
investors in the FVC securities, and no longer
funded by MFI monetary liabilities. On the other
hand, if the ABS is bought by a non-resident,
money balances do not decrease, as the transaction
involves an infl ow of money from outside the
euro area. The same occurs if the ABS is bought
by the MFI sector – a process usually referred to
as “retained securitisation”, which has become
the main purpose of securitisation since late 2008.
Here, the monetary aggregate does not decrease
either, but for a different reason: in this case, the
securitisation operation is basically reduced to a
mere change in the composition of MFI asset
holding. With regard to credit variables, retained
securitisation mechanically results in a reduction
in the stock of MFI loans (assuming derecognition)
offset by an equal increase in MFI holdings of
OFI debt securities, with no change in the stock
of total MFI credit. Box 2 provides a statistical
analysis on the interaction between the euro area
MFI and FVC sectors based on a set of statistics
which have been available since December 2009.
Following the adoption of IAS39 by euro area MFIs, a traditional 10
securitisation transaction may not lead to a one-to-one decrease
in the loan holdings if part of it is not derecognised. For more
details, see the article entitled “Securitisation in the euro area”,
Monthly Bulletin, ECB, Frankfurt am Main, February 2008.
Very short-lived movements in money and credit may occur in 11
order to fi nance the securitisation operation, for instance if the
FVC is granted a bridge loan to fi nance the process.

68ECB
Monthly Bulletin
January 2012
Box 2
SECURITISATION AND THE INTERACTION BETWEEN MFIS AND FVCS
Securitisation transactions in the euro area typically involve two types of fi nancial intermediaries:
an MFI securitises assets using an FVC. Some securitisation transactions may involve multiple
FVCs, which leads to further links in the fi nancial intermediation chain. Total assets of euro area
FVCs amounted to €2.2 trillion at the end of the third quarter of 2011, accounting for around
10% of the non-MFI fi nancial sector.
The “originate to distribute” model, whereby MFIs used securitisation to turn long-term illiquid
assets (loans) into more liquid assets that could be sold to investors, came to a halt with the
fi nancial crisis. During the fi nancial crisis, however, securitisation continued, as MFIs instead
retained the securities issued by FVCs for collateral in central bank refi nancing operations.
In addition, there have been transfers to some “bad bank” vehicles which are part of the
FVC sector.
These developments can be monitored using the new harmonised statistics on securitisation by
MFIs and FVCs which the ECB has published since June 2011, with time series dating back to
December 2009. 1
Euro area MFIs’ use of euro area FVCs in securitisation transactions
Euro area MFIs overwhelmingly use FVCs
resident in the euro area for their securitisation
transactions. Euro area MFIs carried out
loan securitisations or other transfers to a
cumulative net amount of €271 billion between
December 2009 and September 2011. Of this,
€203 billion has remained on the MFIs’ balance
sheets (see Chart A), almost all of which was
securitised through euro area FVCs.2 The
loans transferred which were removed from
the MFIs’ balance sheets during the period
amounted to €69 billion. These loans have
mainly been transferred to euro area FVCs,
to the amount of €62 billion. Transfers to or
from non-euro area FVCs and non-FVCs were
limited over the period.
Euro area FVCs’ positions vis-à-vis the euro area MFI sector
A large part of the euro area FVC balance sheet
relates to the MFI sector. In addition to the
1 See the article entitled “Keeping the ECB’s monetary and fi nancial statistics fi t for use”, Monthly Bulletin, ECB, Frankfurt am Main,
August 2011, and quarterly press releases, which are available on the ECB’s website (http://www.ecb.europa.eu).
2 Outstanding amounts of loans securitised but not derecognised by euro area MFIs are also available. 95% of these are held by euro area
FVCs.
Chart A Cumulative securitisations and other transfers by MFIs from December 2009
(EUR billions)
Nov. Feb. Feb.May MayAug. Aug. 2009 2010 2011
Nov.
-25
0
25
50
75
100
125
150
175
200
225
-25
0
25
50
75
100
125
150
175
200
225
not derecognised from MFI balance sheet
derecognised – euro area FVC as counterparty
derecognised – non-euro area FVC as counterparty
derecognised – other counterparty
Source: ECB.
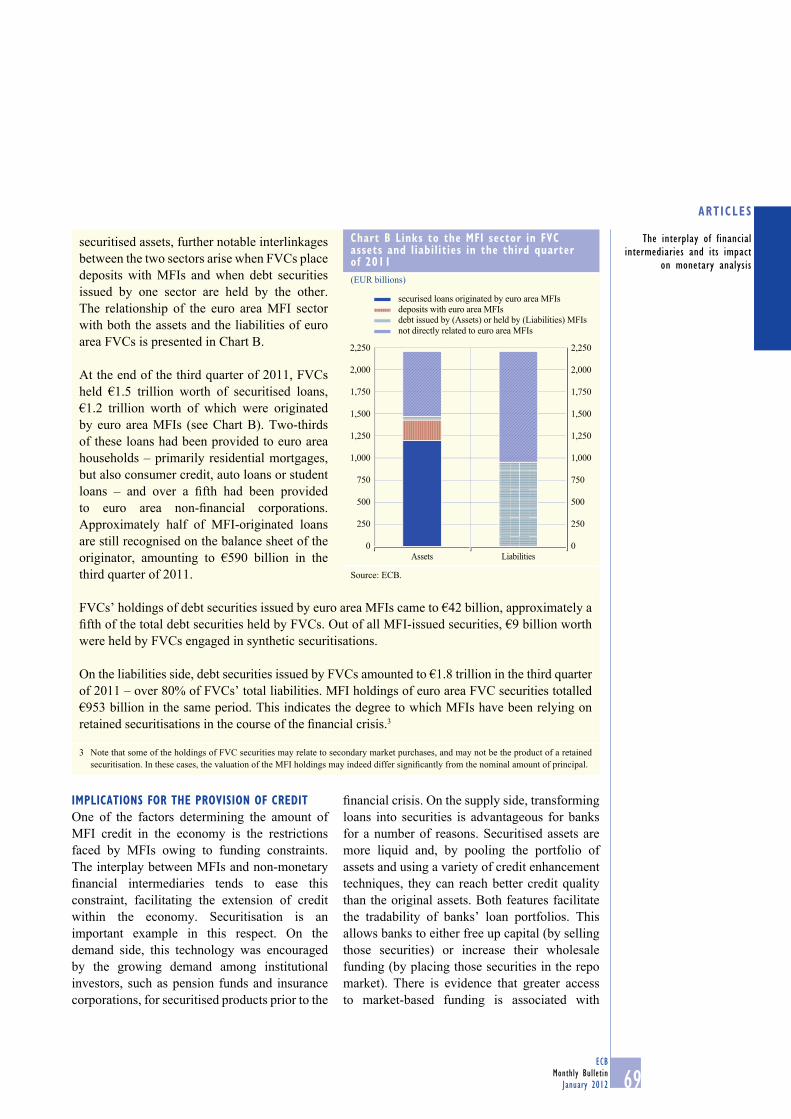
69ECB
Monthly Bulletin
January 2012
ARTICLES
The interplay of financial
intermediaries and its impact
on monetary analysis
IMPLICATIONS FOR THE PROVISION OF CREDIT
One of the factors determining the amount of
MFI credit in the economy is the restrictions
faced by MFIs owing to funding constraints.
The interplay between MFIs and non-monetary
fi nancial intermediaries tends to ease this
constraint, facilitating the extension of credit
within the economy. Securitisation is an
important example in this respect. On the
demand side, this technology was encouraged
by the growing demand among institutional
investors, such as pension funds and insurance
corporations, for securitised products prior to the
fi nancial crisis. On the supply side, transforming
loans into securities is advantageous for banks
for a number of reasons. Securitised assets are
more liquid and, by pooling the portfolio of
assets and using a variety of credit enhancement
techniques, they can reach better credit quality
than the original assets. Both features facilitate
the tradability of banks’ loan portfolios. This
allows banks to either free up capital (by selling
those securities) or increase their wholesale
funding (by placing those securities in the repo
market). There is evidence that greater access
to market-based funding is associated with
securitised assets, further notable interlinkages
between the two sectors arise when FVCs place
deposits with MFIs and when debt securities
issued by one sector are held by the other.
The relationship of the euro area MFI sector
with both the assets and the liabilities of euro
area FVCs is presented in Chart B.
At the end of the third quarter of 2011, FVCs
held €1.5 trillion worth of securitised loans,
€1.2 trillion worth of which were originated
by euro area MFIs (see Chart B). Two-thirds
of these loans had been provided to euro area
households – primarily residential mortgages,
but also consumer credit, auto loans or student
loans – and over a fi fth had been provided
to euro area non-fi nancial corporations.
Approximately half of MFI-originated loans
are still recognised on the balance sheet of the
originator, amounting to €590 billion in the
third quarter of 2011.
FVCs’ holdings of debt securities issued by euro area MFIs came to €42 billion, approximately a
fi fth of the total debt securities held by FVCs. Out of all MFI-issued securities, €9 billion worth
were held by FVCs engaged in synthetic securitisations.
On the liabilities side, debt securities issued by FVCs amounted to €1.8 trillion in the third quarter
of 2011 – over 80% of FVCs’ total liabilities. MFI holdings of euro area FVC securities totalled
€953 billion in the same period. This indicates the degree to which MFIs have been relying on
retained securitisations in the course of the fi nancial crisis.3
3 Note that some of the holdings of FVC securities may relate to secondary market purchases, and may not be the product of a retained
securitisation. In these cases, the valuation of the MFI holdings may indeed differ signifi cantly from the nominal amount of principal.
Chart B Links to the MFI sector in FVC assets and liabilities in the third quarterof 2011
(EUR billions)
Assets Liabilities0
250
500
750
1,000
1,250
1,500
1,750
2,000
2,250
0
250
500
750
1,000
1,250
1,500
1,750
2,000
2,250
securised loans originated by euro area MFIs
deposits with euro area MFIsdebt issued by (Assets) or held by (Liabilities) MFIs
not directly related to euro area MFIs
Source: ECB.

70ECB
Monthly Bulletin
January 2012
an expansion of MFI credit in the euro area.12
However, a higher level of dependence by banks
on other fi nancial intermediaries and wholesale
funding in general increases the impact of
fi nancial market conditions on banks’ ability
to obtain funds. In fact, evidence suggests that
the impact of supply-side constraints, especially
those related to disruptions to banks’ access to
wholesale funding and their liquidity positions,
has intensifi ed since the onset of the fi nancial
crisis.13 As explained in Box 2, the technology
of securitising loans has recently been almost
exclusively driven by purchases of ABS by
the same originating MFI, with the intention of
generating collateral that is eligible for central
bank liquidity-providing operations.
IMPLICATIONS FOR THE LINK BETWEEN MONEY
GROWTH AND INFLATION
While there is a long-run relationship between
money growth and infl ation, this is not necessarily
one to one. One of the main reasons is that money
is not only held for the purpose of transactions
in the goods and services markets, but also as
a store of value. Not all sectors in the economy
make use of these two functions of money to
the same extent. Households and non-fi nancial
corporations are more likely to hold money
for consumption and/or investment purposes
than non-monetary fi nancial intermediaries
(both OFIs and ICPFs), which predominantly
hold money for portfolio considerations, to
settle fi nancial transactions and to keep reserves
for potential early redemptions of liabilities. A
lengthening of the fi nancial intermediation chain
typically implies more non-monetary fi nancial
intermediaries in the economy and therefore that
more money is held by these intermediaries. This
tends to result in a decrease in the overall share of
money growth that is motivated by consumption
or real investment transactions.
Monetary transactions performed by fi nancial
intermediaries are generally motivated by
portfolio considerations. These institutions
manage their portfolios more actively than
households. As a result, the money holdings of
these intermediaries present much higher income
elasticity than those of households, and they
tend to react much faster and more aggressively
to movements in market interest rates.14 This
should naturally result in higher growth in the
money holdings of these intermediaries in
periods when the levels of earnings and activity
in the fi nancial markets are high.
Charts 4 and 5 illustrate these features. Chart 4
shows that the growth in M3 deposits held by
ICPFs and OFIs display a much higher level of
volatility than the growth in M3 deposits held by
both households and non-fi nancial corporations.
Chart 5 shows that the low-frequency
component of annual growth in households’
money holdings is more closely related to the
evolution of consumer price infl ation than that
of OFIs. The money holdings the latter are
generally higher in periods in which fi nancial
markets are more bullish, such as in the
run-up to the fi nancial crisis or in the period of
the build-up of the dot.com bubble. This feature
becomes clear when comparing stock prices and
the trends in M3 deposit holdings by OFIs, as
in Chart 5. The Eurostoxx 50 index and the OFI
money holding trends move broadly in line with
a lead of longer-term movements of OFI money
holdings in the period from 1994 to 2011. This
supports the view that OFI money holdings
are more directly linked to asset prices than to
consumer prices.
Developments in sectoral money holdings
therefore provide helpful insights into whether
changes in overall M3 growth refl ect changes
in the underlying rate of monetary expansion,
as well as into the channels through which the
link between money growth and consumer price
infl ation operates. This helps to better understand
potential risks to price stability and possible lead
times of money growth to infl ation.15 Overall,
See Gambacorta, L. and Marqués-Ibáñez D., “The bank lending 12
channel: lessons from the crisis”, Economic Policy, Vol. 26,
No 66, pp. 137-182, 2011.
See the article entitled “The supply of money – bank behaviour 13
and the implications for monetary analysis”, Monthly Bulletin,
ECB, Frankfurt am Main, October 2011.
See Papademos, L. and Stark, J. (eds.), 14 Enhancing Monetary Analysis, ECB, Frankfurt am Main, 2010, pp. 148-149.
See also the box entitled “Sectoral money holdings and the 15
information content of money with respect to infl ation”, Monthly Bulletin, ECB, Frankfurt am Main, September 2006.

71ECB
Monthly Bulletin
January 2012
ARTICLES
The interplay of financial
intermediaries and its impact
on monetary analysis
more developed fi nancial markets may result
in a clearer division between money held for
consumption/transaction purposes and money
held for portfolio and wealth reasons. Although
they act via different channels, both play their
part in signalling risks to price stability.
IMPLICATIONS FOR INFLATION AND MONETARY
VARIABLES VIA THE IMPACT ON ASSET PRICES
While the increased relative presence of fi nancial
intermediaries in the economy is likely to have
weakened the most immediate channel linking
money growth and consumer price infl ation, it is
also likely to have reinforced the asset price
channel. The empirical link between monetary
variables and asset prices has been documented
in a number of studies that have shown that
money and credit growth can affect asset prices,
particularly house prices, signifi cantly.16 The
literature tends to identify the extra demand for
assets derived from leveraged investment,
together with increases in risk appetite,17 as key
factors explaining increases in asset prices at the
aggregate level.18 Furthermore, it is argued that
this mechanism is strengthened by the active
management of leverage by some fi nancial
intermediaries, adding to the increasing asset
prices by boosting demand for fi nancial assets
fi nanced by additional debt incurrence.19 As
depicted in Chart 5, there are close
co-movements in asset prices and OFI money
See, for example, Goodhart, C. and Hofmann, B., “House 16
prices, money, credit and the macroeconomy”, Oxford Review of Economic Policy, Vol. 24, No 1, pp. 180-205, Oxford, 2008;
and Adalid, R. and Detken, C., “Liquidity shocks and asset
price boom-bust cycles”, Working Paper Series, No 732, ECB,
Frankfurt am Main, February 2007.
The increased risk appetite is associated with a search for yield 17
and an increase in asset prices, as described in the literature on the
“risk-taking channel”. See, for instance, Adrian, T., Emmanuel,
M. and Shin, H.S., “Macro Risk Premium and Intermediary
Balance Sheet Quantities”, IMF Economic Review, Vol. 58,
No 1, pp. 179-207, September 2010; and Jimenez, G., Ongena,
S., Peydro-Alcalde, J.L. and Saurina, J., “Hazardous times for
monetary policy: what do twenty-three million bank loans say
about the effects of monetary policy on credit risk?”, Discussion Paper, No 6514, Centre for Economic Policy Research, 2007.
See, for example, Adrian, T. and Shin, H.S., “Liquidity and 18
leverage”, Journal of Financial Intermediation, Vol. 19, No 3,
2010, pp.418-437.
See also the article entitled “The fi nancial crisis in the light of 19
the euro area accounts: a fl ow-of-funds perspective”, Monthly Bulletin, ECB, Frankfurt am Main, October 2011.
Chart 4 M3-deposits in the euro area by sector
(annual percentage change)
-20
-10
0
10
20
30
40
-20
-10
0
10
20
30
40
2000 2002 2004 2006 2008 2010
non-financial corporations
households
OFIs
ICPFs
Source: ECB.
Chart 5 Trends in sectoral M3, inflation and stock prices in the euro area
(annual percentage change; standardised annual percentage changes)
-3
-2
-1
0
1
2
3
-1
0
1
2
3
4
5
1994 1996 1998 2000 2002 2004 2006 2008 2010
HICP (left-hand scale)
filtered household M3 deposits (right-hand scale)
filtered OFI M3 deposits (right-hand scale)
EUROSTOXX 50 (right-hand scale)
Source: ECB.Note: The fi ltered household and OFI M3 series represent the low-frequency component derived using a Christiano-Fitzgerald asymmetric bandpass fi lter, with cycles longer than seven years considered as trend developments.

72ECB
Monthly Bulletin
January 2012
holdings with a lead of OFI money holdings for
longer-term movements. This suggests that the
increased size of the OFI sector in recent years
is likely to have strengthened the link between
money and asset prices, thereby refl ecting the
increased importance of the asset price channel
for the real economy and infl ation.
Changing fi nancial intermediation patterns and
fi nancial innovation may also change the relative
prices for assets along with the general price
level, as well as credit developments related to
this. For instance, to the extent that loans for
house purchase are considered as being more
suitable for the securitisation process, banks
may feel encouraged to increase their supply
of this type of loan, facilitating a generalised
increase in real estate prices. Furthermore, if
the credit risk is removed from their balance
sheets through securitisation, banks may lower
credit standards and monitoring efforts, possibly
resulting in higher loan-to-value ratios, putting
further upward pressure on real estate prices.
Additionally, the investment behaviour of ICPFs
has the potential to affect long-term interest
rates and pricing in the secondary market, as
they are strong investors in both government
and corporate long-term debt securities.
This in turn has the potential to affect the
yield curve and therefore money growth, as
agents may move funds to liquid instruments
given that low long-term interest rates imply
a lower opportunity cost of holding monetary
instruments. It may also affect the demand for
credit from non-fi nancial corporations. This
is because lower market interest rates induce
corporations to obtain funds in the markets
rather than via banks. In addition, it may affect
the demand for credit from households, as lower
interest rates may increase the demand for loans
for house purchase.
Developments in asset prices may, in turn, have
several implications for monetary variables,
consumer prices and macroeconomic stability.
They may affect money demand as part of the
broader portfolio allocation decision,20 namely
via wealth effects, with the consequent risks for
consumer price infl ation. They may also affect
credit developments: on the supply side, higher
asset prices imply higher value for potential
collateral for loans; on the demand side,
increases in real estate prices tend to increase
the demand for loans for house purchase, with
the consequent increase in the overall money
balances of the economy associated with an
expansion in MFI credit. Finally, asset prices
may also have an impact on investment and
consumption via confi dence effects. For
example, a rise in stock prices may signal a
positive outlook for future economic activity
and employment, which may boost consumer
confi dence and actual consumption with
subsequent price pressures. Conversely, an asset
price bust may trigger fi nancial instability,
inducing a sharp decrease in confi dence. While
such a development initially poses defl ationary
risks, it tends to induce an accommodative
policy response, which will eventually result in
higher monetary balances and the consequent
infl ationary pressures in the period ahead.
5 CONCLUSIONS
Over the past decade both the size and
complexity of the fi nancial system have
increased signifi cantly. Not only has the value
of the total amount of fi nancial assets increased
relative to GDP, the share attributable to the
fi nancial sector has also increased. It is also
clear from the evidence presented in this
article that all sectors are interlinked to various
degrees, making every sector vulnerable to
stress in other sectors, in particular the MFI
sector, which plays an important role as a
fi nancial hub vis-à-vis all the other sectors in
the euro area and the rest of the world. The
foremost role of fi nancial intermediaries is to
channel funds between lenders and borrowers in
the non-fi nancial sector. At the same time, the
MFI sector, including commercial banks and
the central bank, play a special role as deposit-
taking and deposit-creating institutions with the
See Papademos, L. and Stark, J. (eds.), 20 Enhancing Monetary Analysis, ECB, Frankfurt am Main, 2010, pp.164-180.

73ECB
Monthly Bulletin
January 2012
ARTICLES
The interplay of financial
intermediaries and its impact
on monetary analysis
unique capacity to grant loans and create money
at the same time. As more and more fi nancial
activity takes place among fi nancial institutions
themselves, there is a tendency for the fi nancial
system to disconnect itself from its original role
of providing stable funding and diversifi cation of
risk in support of the real economy, and instead
to amplify and concentrate risks emanating from
the fi nancial sector itself.
The increasing size and complexity of the
fi nancial sectors and their increased impact
on economic variables and infl ation is well
captured by a detailed monetary analysis
looking at the various transmission channels
that different sectoral behaviour might imply
for risks to infl ation. In particular, as fi nancial
market activity increases, this has implications
for developments in asset prices, which can, in
turn, affect infl ation in the longer term.


75ECB
Monthly Bulletin
January 2012
ARTICLES
Towards an integrated
European card
payments market
1 INTRODUCTION
Following the successful euro cash changeover
in 2002, the integration of the European market
for cashless retail payments has been regarded
as the logical next step in fi nancial integration.
This project is generally referred to as the Single
Euro Payments Area (SEPA) initiative. SEPA
rests on three main pillars, which are the most
commonly used cashless payment instruments 1
in Europe, i.e. credit transfers, direct debits and
card payments (see Chart 1).
While the progress made towards establishing
the SEPA credit transfer and direct debit
schemes 2 is promising and will be further
enhanced by regulatory deadlines for migration
from legacy domestic formats to the new
Europe-wide schemes,3 substantial effort is still
needed in order to achieve an integrated
European card payments market. The technical
complexity of the card payments market, which
consumers are generally not aware of, and the
high number of market participants involved,
make the establishment of a SEPA for cards a
real challenge. Owing to the prevalence of card
payments, which are second only to cash as the
means of payment used most often at the
physical point of sale, regulators, competition
authorities and the Eurosystem have a strong
interest in this integration process.
A common typology used for card payments
is based on the time of funding. In the case
of prepaid cards, the cardholder has to make
a certain amount of funding available before
the card can be used (“pay before” model).
Debit cards enable their holders to make
purchases and/or withdraw cash and have these
transactions directly and immediately charged
to their payment accounts (“pay now” model).
Credit cards, fi nally, enable cardholders to
make purchases and/or withdraw cash up to a
prearranged credit limit (“pay after” model). The
credit granted may either be settled in full by the
end of a specifi ed period (essentially a delayed
debit card), or settled in part, with the balance
comprising a form of credit on which interest is
usually charged (a revolving credit card). Credit
card brands often differentiate between basic
cards and more exclusive cards (gold, platinum,
etc.), as well as corporate cards.
This article describes the main characteristics
of the SEPA project and the mandate of the
Eurosystem in the context of retail payments.
It focuses on the cross-country differences in
the use of payment cards, describes the main
parties involved in card payments and how they
interact, and discusses the economic importance
A payment instrument is a tool or a set of procedures enabling 1
the transfer of funds from a payer to a payee. See the “Glossary
of terms related to payment, clearing and settlement systems”,
ECB, 2009. Available at http://www.ecb.int/pub/pdf/other/
glossaryrelatedtopaymentclearingandsettlementsystemsen.pdf
Payment schemes are defi ned as a set of interbank rules, practices 2
and standards necessary for the functioning of payment services. See
the “Glossary of terms related to payment, clearing and settlement
systems”, ibid.
To support the migration to the SEPA credit transfer and SEPA 3
direct debit, the EU Member States and the European Parliament
agreed in December 2011 on a deadline for the migration of
legacy credit transfer schemes and direct debit schemes to SEPA
formats of 1 February 2014.
TOWARDS AN INTEGRATED EUROPEAN CARD PAYMENTS MARKET
Over the last decade the integration of the European cashless retail payments market has been a high priority for payment service providers, regulators and central banks. This integration process focuses above all on credit transfers, direct debits and card payments, which are the non-cash payment instruments most commonly used in Europe. In the card payments domain, in particular, considerable effort is still needed to achieve an integrated European market. This article presents a market overview and the economic principles and features of card payments. It identifi es the most challenging areas which have to be addressed in order to achieve the ultimate objective of ensuring that any card can be used at any terminal throughout the euro area. While this article focuses on card payments (and especially debit card payments at the point of sale), it concludes with a short look at the future of card payments in an increasingly “online and mobile” world.
76ECB
Monthly Bulletin
January 2012
of card payments. Furthermore, the challenges
to be overcome on the way to an integrated
European card payments market are identifi ed.
While the main focus of this article is on so-
called proximity card payments (i.e. payments
at the physical point of sale, for example at the
merchant’s place of business just around the
corner), the picture would be incomplete if the
increasing importance of modern information
and communication technology (i.e. the internet
and mobile communication technology) were
not touched upon. Future developments – some
of which are, in fact, to a certain extent already
a reality – are examined in the conclusion.
2 INTEGRATION OF THE EURO RETAIL
PAYMENTS MARKET AND THE EUROSYSTEM’S
COMPETENCE
The legal basis for the Eurosystem’s competence
in the area of payment and settlement systems is
laid down in the Treaty on the Functioning of
the European Union. According to the Treaty,
one of the basic tasks of the European System
of Central Banks (ESCB) is “to promote the
smooth operation of payment systems”. This
provision is mirrored in the Protocol on the
Statute of the European System of Central Banks
and of the European Central Bank (“the Statute
of the ESCB”). Article 22 of the Statute of the
ESCB provides that “the ECB and the national
central banks may provide facilities, and the
ECB may make regulations, to ensure effi cient
and sound clearing and payment systems within
the Union and with other countries”. In order to
fulfi l its legal and statutory mandate in the fi eld
of payments, the Eurosystem acts as an operator,
overseer and catalyst.
As an operator, the Eurosystem provides
facilities for the settlement of euro payments
in central bank money and for the cross-border
delivery of collateral in Eurosystem monetary
policy operations and intraday credit operations.
As an overseer, the Eurosystem monitors
payment systems and securities clearing and
settlement systems operating in euro, assesses
them against the objectives of safety and
effi ciency and, where necessary, fosters change.
The oversight function of the Eurosystem also
extends to payment instruments, including
payment cards, as they are an integral part of the
payment system.
As a catalyst, the Eurosystem seeks to facilitate
the effi ciency and safety of the overall market
arrangements for payments, clearing and
settlement. In this role, the Eurosystem promotes
the development of an effi cient and integrated
European retail payments market for credit
transfers, direct debits and card payments –
which is generally referred to as the Single Euro
Payments Area (SEPA).4
SEPA aims to establish a single market for
retail payments in euro by overcoming the
technical, legal and market barriers that persist
from the period prior to the introduction of
the single currency. This will allow customers
to make euro payments throughout Europe as
easily, securely and effi ciently as they can
today in their own countries. Once SEPA
is completed, there will no longer be any
differentiation between national and cross-
border euro payments. SEPA not only covers
the euro area, but the whole of the European
Union as well as Iceland, Liechtenstein,
Monaco, Norway and Switzerland. This means
that SEPA communities outside the euro area
are also adopting SEPA standards and practices
for their euro payments. SEPA is thus a key
piece in the establishment of a single market for
payment services in Europe.
The European Payments Council, which is
the coordination and decision-making body
of the European banking industry with regard
to payments, has developed new European
payment schemes for credit transfers and direct
debits that are described in rulebooks. For card
payments, the European Payments Council has
established a framework, which is less binding
than a rulebook, with requirements that the
For detailed information on the SEPA project, see 4
http://www.sepa.eu

77ECB
Monthly Bulletin
January 2012
ARTICLES
Towards an integrated
European card
payments market
industry must meet in order to comply with the
SEPA objectives.
A common feature of the SEPA payment
instruments is the need for a clear separation
between the scheme management and the
infrastructures which process the payments.
In addition to establishing the new payment
instruments, SEPA also aims to harmonise the
handling of cash. In this context, the term Single
Euro Cash Area (SECA) is used.
While the progress made on SEPA credit
transfers and direct debits gives cause for
optimism, developments in the fi eld of European
card payments have been lagging behind
expectations. Issuers, acquirers, card schemes
and processors (see Section 4) will have to
comply with the set of high-level principles
for card payments developed by the European
Payments Council. These principles aim to
ensure that:
Cardholders will be able to pay with one card –
all over the euro area (limited only by brand
acceptance on the part of merchants).
Merchants will be able to accept all SEPA- –
compliant cards via a single terminal.
For increased security, cards and terminals –
will need to be based on chip and PIN 5
technology instead of magnetic stripe
technology.
Card payment processors will be able to –
compete with each other and to offer their
services throughout the euro area. This
will make the market for processing card
payments more competitive, resilient and
cost-effi cient.
These high-level objectives are largely in line
with the Eurosystem’s policy in the fi eld of card
payments, but there are a number of important
milestones to be achieved before they can be
realised and customers are able to benefi t from
SEPA in the fi eld of card payments also.
3 CROSS-COUNTRY DIFFERENCES IN THE USE
OF PAYMENT CARDS
Payment cards are the most commonly used
non-cash payment instrument in the European
Union and, while cash still dominates in terms
of the number of payments at the physical point
of sale in Europe, debit cards have been gaining
ground and are becoming increasingly important
for day-to-day transactions. According to
Capgemini,6 the euro area is the second largest
cashless payments area worldwide (21% of the
total volume of payments in 2009, after the 40%
share of the United States). As shown in
Chart 1, in the period from 2000 to 2010 the
cashless payment instrument with the highest
absolute growth in the euro area was payment
A personal identifi cation number (PIN) is defi ned as a personal 5
and confi dential numerical code which the user of a payment
instrument may need to use in order to verify his/her identity.
In electronic transactions, this is seen as the equivalent of a
signature. See the “Glossary of terms related to payment, clearing
and settlement systems”, op. cit.
World Payments Report 2011, Capgemini, p. 10.6
Chart 1 Use of payment instruments in the euro area
(millions of transactions)
2000 2002 2004 2006 2008 2010
all cards (compound annual growth rate +10.49%)
credit transfers (compound annual growth
rate +3.69%)
direct debits (compound annual growth rate +6.39%)
cheques (compound annual growth rate -4.58%)
e-money (compound annual growth rate +24.51%)
0
2,000
4,000
6,000
8,000
10,000
12,000
14,000
16,000
22,000
20,000
18,000
0
2,000
4,000
6,000
8,000
10,000
12,000
14,000
16,000
22,000
20,000
18,000
Source: ECB Statistical Data Warehouse.

78ECB
Monthly Bulletin
January 2012
cards. Accounting for over 20 billion payments
in 2010, payment cards have become the most
widely used cashless payment instrument in
Europe.7 In particular, the number of debit card
payments far exceeds the number of credit card
and deferred debit card payments, as shown in
Chart 2.
Although this general trend can be observed
throughout the European Union, the starting
point differs very widely from country to
country, owing to diverging national market
infrastructures, payment behaviours and
customer preferences.
As shown in Chart 3, within the euro area, cards
are most frequently used in Finland, Estonia,
the Netherlands and Luxembourg. In Greece
and Italy, card payments are least popular, with
the smallest increases in the number of card
payment transactions per capita over the period.
The highest growth in the use of cards for
payments has been recorded in Estonia, Slovakia,
the Netherlands, Luxembourg and Malta. It is
worth noting that, alongside the Netherlands
and Luxembourg, countries that have adopted
the euro more recently have recorded relatively
high growth rates for payment card usage.
Relatively few studies dealing with consumers’
payment behaviour were carried out between the
1960s and the early 1990s, most being purely
descriptive and focused on the use of credit
cards.8 Since then the payments landscape
has changed considerably: the use of cheques
has decreased substantially and, with the
introduction of electronic terminals at the point
of sale and progress in telecommunication, card
payments have become much quicker and more
secure.
There were 20,355 billion card transactions in the euro area in 7
2010.
For an overview of the early studies dealing with payment 8
behaviour, see Feinberg, R.A., “Credit Cards as Spending
Facilitating Stimuli – A Conditioning Interpretation”, Journal of Consumer Research, 13, 1986, No 3, S.348-56. Available at
http://www.jstor.org/stable/2489426
Chart 2 A comparison of debit card transactions with credit card and deferred debit card transactions in the euro area
(millions of transactions)
debit cards (compound annual growth rate +11.62%)
all cards (compound annual growth rate +10.49%)
0
2,500
5,000
7,500
10,000
12,500
15,000
17,500
20,000
22,500
0
2,500
5,000
7,500
10,000
12,500
15,000
17,500
20,000
22,500
2000 2002 2004 2006 2008 2010
credit cards/delayed debit cards (compound annual
growth rate +11.05%)
Source: ECB Statistical Data Warehouse.Notes: The chart shows a positive difference between the number of card transactions and the sum total of all sub-groups, broken down by type of card, i.e. credit/deferred debit cards and debit cards. In other words, the “sum of the components” is not equal to the “total” in all cases. The reason is that, although all the countries provide data on the totals, they do not all provide data on the sub-groups. The relatively large difference is due primarily to data from France, for which no breakdown is provided.
Chart 3 Number of card payment transactions per capita in the euro area
(number of transactions per capita)
0
20
40
60
80
100
120
140
160
180
200
0
20
40
60
80
100
120
140
160
180
200
2000
2005
2010
1 32 4 5 6 7 8 9 10 11 12 13 14 15 16 17
1 Belgium
2 Germany
3 Estonia
4 Ireland
5 Greece
6 Spain
7 France
8 Italy
9 Cyprus
10 Luxembourg
11 Malta
13 Austria
14 Portugal
15 Slovenia
12 Netherlands 17 Finland
16 Slovakia
Source: ECB Statistical Data Warehouse.Note: Data for 2000 are not available for Spain, Luxembourg and Slovakia.

79ECB
Monthly Bulletin
January 2012
ARTICLES
Towards an integrated
European card
payments market
This development was to a large extent fuelled
by the success of debit cards, which triggered
increased research efforts in the fi eld of
payments. Since the mid-1990s, more than
100 empirical surveys have been conducted
worldwide to identify factors infl uencing the
adoption (i.e. the decision to acquire or use a
specifi c payment instrument for the fi rst time)
and the continued use of various payment
instruments. Although the variables identifi ed
seem to differ depending on the circumstances
of the payment and the socio-demographic
characteristics of the respondents, those cited
as the most important factors are costs, security
and perceived ease of use.
4 STAKEHOLDERS IN CARD PAYMENTS
AND TYPES OF PAYMENT CARD
Card payments at the physical point of sale
involve a number of economic agents. The most
obvious ones are the cardholder (payer) and the
merchant accepting a card payment (payee). The
cardholder obtains his/her card from the issuing
entity, while the merchant has a contract with
the acquiring entity. These issuing and acquiring
entities are usually banks. The technical and
commercial arrangement set up to serve one or
more card brands and which provides the
organisation, rules and operations necessary for
the card brands to function, is called a card
scheme. If not performed in-house by the issuer
and/or acquirer, the technical processing of card
payments is usually performed by specialised
processing entities, which are often owned by
the card schemes. An issuing processor opens
and manages the cardholder’s account on behalf
of the issuer, books card transactions on these
accounts, authorises card transactions on behalf
of the issuing bank and provides statements for
the cardholder. In some cases, it also arranges
the clearing and settlement of card payments,
operates a cardholder call centre (for lost and
stolen cards) and/or handles chargeback claims
by cardholders. An acquiring processor opens
Chart 4 Meta-analysis of 130 empirical surveys on the factors influencing the adoption and use of payment instruments
0
5
10
15
20
25
30
35
40
45
0
5
10
15
20
25
30
35
40
45
1 network size
2 social influence
3 external influence
4 perceived costs
5 perceived spending control
6 perceived security
7 perceived privacy
8 perceived speed
9 perceived ease of use
10 perceived usefulness
11 funding time
12 customer behaviour
13 payment amount
14 type of goods
15 experience
16 age
17 gender
18 education
19 type of job
20 income
21 place of residence
x-axis: factors
y-axis: surveys in which the given factors were cited
adoption
use
1 2 3 4 5 6 7 8 9 10 11 12 13 14 15 16 17 18 19 20 21
Source: ECB staff calculation.

80ECB
Monthly Bulletin
January 2012
and manages the merchant’s account on behalf
of the acquirer, forwards authorisation requests
to a switch 9 (or directly to the issuer or issuing
processor), books transactions on the merchant’s
account, charges service fees to merchants,
produces statements for the merchant and, in
some cases, also supplies voice authorisation
centres.10 Finally, for the clearing and settlement
of funds between the issuer and acquirer, the
services of a clearing house are often used.
Clearing houses are entities (or processing
mechanisms) through which participants agree
to exchange transfer instructions for funds,
securities or other instruments.11
Chart 5 gives an overview of these entities,
their functions and their interaction. One legal
entity can play several roles in the card payment
process (e.g. a scheme owner can also offer
processing services in the issuing and acquiring
domain, or a card issuer can also be an acquiring
bank).
The chart shows a stylised card scheme based
on a so-called four-party model (“four-party
card scheme”), which is the model used by the
vast majority of card schemes in Europe. In a
four-party card scheme, the issuer has a
contractual relationship with the cardholder and
the acquirer has a contractual relationship with
the merchant. This is the fundamental difference
from card schemes based on a so-called
three-party model (“three-party card scheme”),
in which the card scheme acts as issuer and
acquirer and has a direct contractual relationship
with both the cardholder and the merchant; one
variant is the three-party model which also
allows other payment service providers to obtain
an issuing and/or acquiring licence (so-called
“three-party card schemes with licensees”).
Chart 6 compares the basic structures of a
four-party scheme and a three-party scheme.
To avoid the need for (costly) bilateral agreements and 9
procedures between issuing entities and acquiring entities, debit
card schemes often rely on a central routing switch, or “gateway”,
for the exchange of payments, which is often a separate legal
entity jointly owned by the commercial banks. See Bolt, W. and
Tieman, A.F., “Pricing Debit Card Payment Services: An IO
approach”, De Nederlandsche Bank, Research Memorandum
No 735, 2003. Available at http://www.dnb.nl/binaries/wo0735_
tcm46-146022.pdf
See the “Report on the retail banking sector inquiry”, a 10
European Commission staff working document accompanying
the communication from the Commission on the sector inquiry
under Article 17 of Regulation EC No 1/2003 on retail banking,
European Commission, 2007, COM(2007) 33 fi nal.
See the “Glossary of terms related to payment, clearing and 11
settlement systems”, op. cit.
Chart 5 Roles in the typical card payment process
Scheme owner
Cardholder
Terminal/tele-
communication supplier
Merchant
Issuing bank
Issuing processor
Issuing domain Acquiring domain
Switch
d i
Card manufacturer
(production, personalisation, disposal)
Clearing house Acquiring bank
Acquiring processor
Source: ECB.

81ECB
Monthly Bulletin
January 2012
ARTICLES
Towards an integrated
European card
payments market
Three-party schemes operating in the EU include
American Express and Diners Club, while
four-party schemes comprise Visa Europe,
MasterCard and the vast majority of national
schemes. It should be noted that the three-party
schemes are primarily credit card schemes, while
the four-party schemes are debit and credit card
schemes. All of the larger Member States still
have at least one domestic card scheme which
only permits domestic card payments.12 Most
commercial banks are members of at least one
international card scheme and offer cards which
bear both a national scheme brand and the brand
of an international scheme, mainly MasterCard
or Visa Europe (a practice which is called “co-
branding” or “co-badging”). Most domestic card
schemes in Europe have a governance structure
in which the members are also the “shareholders”
of the scheme, i.e. a user-governed structure,
which is also the case for Visa Europe. In some
cases, not all the members of a card scheme are
shareholders as well, but only the bigger
commercial banks. Two of the main examples of
listed card schemes are MasterCard Inc. and Visa
Inc., which are both listed on the New York
Stock Exchange.
In the EU (especially in smaller Member States) a
trend seems to have set in, in which international
schemes are replacing domestic ones and function
as quasi “national” schemes.13 While, in absolute
fi gures, the majority of card payments are still
processed via domestic schemes, the growth
rates of international schemes are higher.14 Four
initiatives15 are currently trying to establish new
card schemes, which would offer their services
on a pan-European level in competition with
the well-established international schemes of
MasterCard and Visa Europe. Similar moves can
currently be observed in other major economic
areas, such as Russia, India and Australia.
5 ECONOMIC IMPORTANCE OF CARD PAYMENTS
The card payments market is characterised by
a two-sided market structure. Other examples
of this structure that are often quoted in the
literature are newspapers and magazines (which
have to attract both readers and advertisers),
online auction platforms (sellers and buyers)
and discotheques (both male and female guests).
Two-sided markets typically feature one or
several platforms (one or more card schemes),
which make interactions between end-users
(cardholders and merchants) possible and try
to bring the two sides “on board” by setting
charges for each side at an appropriate level.16
Markets are two-sided if supply and demand
on one side of a given market are determined
by supply and demand on the other side of
This is the case, for example, in Belgium, Denmark, Germany, 12
Ireland, Spain, France, Italy and Portugal.
For example, in Estonia, Latvia, Lithuania, the Netherlands, 13
Austria, Finland and the United Kingdom.
See “SEPA Cards: success factors for sustainable card schemes 14
in Europe”, Steinbeis University, Berlin, May 2011. Available
at http://steinbeis-research.com/pdf/2011_SEPA_Cards_RFS_
Steinbeis.pdf
These initiatives comprise EAPS (Euro Alliance of Payment 15
Schemes), Monnet, PayFair and EUFISERV.
For more information on the two-sided market theory, see 16
Evans, D.S., “Essays on the Economics of Two-Sided Markets”,
Economics, Antitrust and Strategy, 2010. Available at http://
papers.ssrn.com/sol3/papers.cfm?abstract_id=1714254
Chart 6 Business models for the provision of card payments
Issuer Acquirer
Card scheme
Cardholder
Card scheme(issuer and acquirer)
Cardholder MerchantMerchant
Four-party scheme Three-party scheme
Source: ECB.

82ECB
Monthly Bulletin
January 2012
that market. The pricing in two-sided markets
should therefore take account of both sides of
the market. For example, if the pricing of card
payments is attractive for merchants but not for
cardholders, the latter will be reluctant to adopt
and/or regularly use a payment card.
In a three-party card scheme, the roles of issuing
and acquiring are performed by a single entity
(i.e. the card scheme itself), which can determine
the price charged to the merchant and the
cardholder, since it has a direct contractual
relationship with them. However, the pricing in
four-party card schemes is potentially more
complex. Four-party card schemes therefore
usually apply a so-called interchange fee, which
the cardholder’s bank receives from the
merchant’s bank every time a card payment is
made.17 This interchange fee is typically
multilateral – i.e. it is not agreed bilaterally
between every issuing and acquiring bank.
Besides interchange fees, up to four additional
fees are applied in a four-party card scheme.
First, the acquirer can charge the merchant a fee
and thus recover the interchange fee paid to the
issuer and charge for the services offered to the
merchant. Second, further sources of income for
issuing banks can comprise charges levied on
the cardholder, e.g. fees for the issuing of the
card, periodical fees per card, fees per
transaction, and account statement and billing
information fees. For both credit and debit cards,
periodical fees are the main component of
revenues from cardholders.18 Third, card
schemes can charge fees to issuers, and, fourth,
they can charge fees to acquirers. These fees are
for membership of the scheme and are generally
based on the number of cards issued and/or the
number of transactions carried out on the
acquiring side.
Empirical evidence for Europe indicates that
banks which provide retail payment services
see an improvement in their performance.
Higher usage of electronic retail payment
instruments seems to stimulate banking
business.19 In its retail banking sector inquiry
conducted in 2007, the European Commission
concluded that payment cards, and especially
credit cards, are a highly profi table business for
the fi nancial services industry. Based on fi gures
for 2004, the European Commission estimated
a weighted averaged profi t-to-cost ratio of
65% for credit card issuers on a pan-EU scale
and 47% for debit card issuers. However, one
revenue component, in particular, has recently
been the subject of heated debate and has
triggered regulatory and antitrust investigations,
i.e. the multilateral interchange fee (MIF).
While determining whether the interchange
fee restricts competition clearly falls within the
competence of competition authorities, several
central banks have also studied the issue as
far as it concerns the smooth functioning of
payment systems.20
For example, Bolt and Schmiedel (2011)
conclude that increased competition between
card schemes drives down merchant fees
and increases card acceptance by merchants.
Moreover, from a European perspective,
consumers and merchants are likely to benefi t
from the creation of SEPA when suffi cient
competition in the card payments market
counters potentially monopolistic tendencies.21
In addition, the provision of and access to
consumer credit in payment networks also
affects competition, acceptance of and fees for
payment cards.22
In recent rulings by competition authorities,
MIFs for card payments have generally been
considered to be decisions by associations of
undertakings, or agreements between
undertakings, which restrict competition.
For a comprehensive overview of interchange fees, see Börestam, 17
A. and Schmiedel, H., “Interchange fees in card payments”,
Occasional Paper Series, No 131, ECB, September 2011.
See the “Report on the retail banking sector inquiry”, European 18
Commission, 2007, op. cit.
See Hasan, I., Schmiedel, H. and Song, L., “Return to Retail 19
Banking and Payments”, Journal of Financial Services Research,
2011.
For a comprehensive overview of this topic, see Börestam, A. 20
and Schmiedel, H. “Interchange fees in card payments”, op. cit.
See Bolt, W. and Schmiedel, H., “Pricing of Payment Cards, 21
Competition and Effi ciency: A Possible Guide for SEPA”,
Annals of Finance, 2011, pp. 1-21.
See Bolt, W., Foote, E. and Schmiedel, H., “Consumer credit 22
and payment cards”, Working Paper Series, No 1387, ECB,
October 2011.

83ECB
Monthly Bulletin
January 2012
ARTICLES
Towards an integrated
European card
payments market
Owing to their multilateral nature, they limit
the possibility for bilateral negotiations between
issuers and acquirers and consequently restrict
price competition between acquiring banks by
artifi cially infl ating the basis on which these
banks set the charges they apply to merchants.
Therefore, a MIF creates a fl oor for the
merchant fee and merchants are unable to
negotiate a price below it. This can considerably
infl ate the costs of payment card usage at
merchant outlets to the detriment of merchants
and their customers.23
While competition authorities do not deny
that such agreements could theoretically bring
benefi ts as well, which could make them
compatible with competition law, in most
cases, card schemes and/or fi nancial institutions
have not been able to provide proof of such
benefi ts. In the absence of convincing analysis
and evidence justifying the charging of MIFs
and the levels they are set at by card schemes,
competition authorities have only been able to
provide limited guidance in recent decisions.
The European Commission’s introduction of the
“merchant indifference” methodology could,
however, contribute some additional guidance
with respect to this issue. This methodology
seeks to establish the MIF at a level at which
merchants are indifferent as to whether or not
a payment is made by payment card or by cash.
Further guidance is also expected to be given
in the pending ruling by the European General
Court in a case in which MasterCard has
appealed the European Commission’s fi nding
that MasterCard breached competition law 24
by, in effect, setting a minimum price (the intra-
EEA fallback interchange fee), which merchants
must pay to their acquiring bank for accepting
payment cards in the European Economic Area
(EEA).25
Other countries, e.g. Australia and recently
the United States, have fi xed a maximum cap
on MIFs. Overall, and as stated in the Seventh
SEPA Progress Report,26 the Eurosystem’s
stance on interchange fees is neutral. This is an
issue that falls within the fi eld of competence
of the European Commission. However, the
Eurosystem is of the view that it is critical for
the success of SEPA that cards can be issued,
acquired and used throughout the euro area to
make euro payments without any geographical
differentiation. Transparency and clarity with
respect to the costs and benefi ts of different
payment instruments are indispensable for a
modern and integrated European retail payments
market. Interchange fees (if any) should be set
at a reasonable level and should not prevent
the use of effi cient payment instruments.
A sharp increase in cardholder costs could
induce consumers to use less effi cient means
of payment, thereby hampering the success of,
and objectives pursued by, the SEPA project.
Therefore, in compliance with competition rules,
interchange fees (if any) should not hamper the
overall economic effi ciency of the European
payments market.
6 CHALLENGES
The lack of clarity regarding the permitted level
of MIFs is often cited by market participants
as a challenge in their preparations for a SEPA
for cards, since it gives rise to uncertainty when
planning their investment decisions. Although
important, this is only one of the challenges
which need to be overcome in order to make
progress towards an integrated and competitive
European card payments market. The areas
of card processing, standardisation and
certifi cation, security and business practices,
in particular, require further effort by the
stakeholders involved.
See “Antitrust: Commission prohibits MasterCard’s intra-EEA 23
Multilateral Interchange Fees – frequently asked questions”,
European Commission, Memo/07/590. Available at http://
europa.eu/rapid/pressReleasesAction.do?reference=MEMO/07/
590&format=PDF&aged=1&language=EN&guiLanguage=en
In particular, Article 81 of the Treaty and Article 553 of the EEA 24
Agreement.
See the European Commission’s decision of 19 December 2007 25
(cases Nos Comp/34.579 MasterCard, Comp/36.518 EuroCommerce
and Comp/38.580 Commercial Cards). Available at http://ec.
europa.eu/competi t ion/elojade/isef/case_details .cfm?
proc_code=1_34579
See the “Seventh SEPA Progress Report: Beyond Theory into 26
Practice”, ECB, October 2010.

84ECB
Monthly Bulletin
January 2012
Section 4 described the different roles involved
in the typical card payments process and the fact
that some parties play several roles. In particular,
the card schemes are often also operationally
involved in the card payments market and act
as a processing entity. In order to facilitate
competition and effi ciency, the principle of
separating the card scheme management from
the processing entities aims to guarantee open
access, as it gives issuers and acquirers a
range of options to choose from as regards the
processing of card payments.
Other important issues are standardisation and
certifi cation. Common standards are crucial
to ensure that, from a technical point of view,
any card can be used at any terminal in Europe.
A harmonised certifi cation process for cards and
terminals, generally accepted throughout the
EU, would lower the market entry barrier for
manufacturers and processors.
In the same way, clear business rules are
essential for the proper functioning of the cards
market. In 2010 the Canadian government
issued a code of conduct for the credit and debit
card industry in Canada, which promotes fair
business practices and ensures that merchants
and consumers understand the costs and
benefi ts associated with credit and debit cards.
Similar regulatory initiatives in the United
States and signifi cant efforts in Australia and
South Africa have recently been observed.
In Europe, there seem to be no plans for
extensive public intervention for the time being,
however, the European Commission is closely
monitoring the situation. Since the European
card payments market is heavily reliant on
self-regulation by the industry, the European
Payments Council, as well as individual card
schemes, have an important role to play in the
establishment of the sound business practices
that are needed for SEPA for cards to function
smoothly. Examples of such business practices
are increased transparency regarding fees;
ensuring that card schemes do not forbid co-
badging with other schemes; the elimination
of geographic restrictions in licensing, issuing
and acquiring; and the possibility for payers
and payees to freely agree during the checkout
process on the payment instrument which suits
them best.
7 CONCLUSION AND OUTLOOK
Cards have become the most widely used
cashless payment instrument within the European
Union and debit cards, in particular, are
increasingly substituting cash at the physical
point of sale. While the euro banknotes and coins
were successfully introduced in 2002, the logical
complement, i.e. a SEPA for electronic payments,
has not yet been fi nalised. For both cash and
cashless payments, it is essential that people trust
in the security of the payment instrument. While,
for euro banknotes and coins,27 comprehensive
counterfeiting data are available, this is not the
case for fraud involving electronic payments
(including card payments) in the EU. In order to
increase security and reduce fraud losses, all
stakeholders need to cooperate, take
responsibility and commit to effective measures
for fi ghting fraud. As regards cards, the European
payments industry has already taken a major step
towards improving security with the decision to
migrate from magnetic stripe technology to chip
and PIN technology. Although this migration is
approaching completion, the continuing presence
of sensitive customer data on the magnetic stripe
makes even chip cards vulnerable to skimming 28
and therefore does not allow the full benefi ts in
terms of fraud reduction to be achieved.
In the view of the public authorities, the
establishment of secure European payment
solutions requires a level playing fi eld for
security, for which reason the ESCB has created
See “Euro coin counterfeiting in 2010”, European Commission, 27
2011. Available at http://europa.eu/rapid/pressReleasesAction.
do?reference=IP/11/47; and “Biannual information on euro
banknote counterfeiting”, ECB, 2011. Available at http://www.
ecb.int/press/pr/date/2011/html/pr110718.en.html
Skimming can be defi ned as the unauthorised copying of card 28
data (e.g. contained in the magnetic stripe) via a manipulated or
fake terminal or with a hand-held reading device. The data copied
from the magnetic stripe can be used to create a counterfeit card
or in card-not-present transactions.

85ECB
Monthly Bulletin
January 2012
ARTICLES
Towards an integrated
European card
payments market
a European forum on the security of retail
payments (SecuRe Pay Forum). The SecuRe
Pay Forum is a voluntary cooperative initiative
between authorities, aimed at facilitating the
sharing of knowledge and promoting a common
understanding, in particular between overseers
and supervisors of payment service providers,
with regard to the issues surrounding the security
of retail payments. SecuRe Pay addresses issues
concerning electronic retail payment services
and retail payment instruments (excluding
cheques and cash) provided within the EEA or
by providers located in EEA countries. Its work
focuses on the whole processing chain and aims
to address areas where major weaknesses and
vulnerabilities are detected and, where needed,
recommendations are made. Owing to their
prevalence, card payments are naturally one of
the main topics of the SecuRe Pay Forum.
While this article deals with card payments at
the physical point of sale, cards are also one of
the most important payment instruments in the
growing segment of e-commerce. According to
Eurostat,29 on average 69% of all individuals in
the EU27 are internet users and 53% use the
internet almost every day. Despite the recent
economic crisis, online retailers saw continued
strong sales growth, even though high street
retail sales stopped growing or even contracted.
In the United Kingdom, the fi nal fi gures for
2009 show that, year on year, e-commerce grew
by over 14%. Similar or higher levels of growth
are indicated in the initial fi gures from Germany
and France.30 However, the vast majority of
e-commerce still comprises domestic
transactions. Currently only 8% of online
shoppers in the EU buy from merchants in
another country. According to a study by the
European Commission,31 60% of attempted
credit card payments for cross-border internet
shopping orders fail owing to the web merchants’
refusal to accept non-domestic credit cards.
Furthermore, among shoppers who were willing
to purchase online, the main reason for not doing
so was concern about the security of online
payments. One of the factors is that payment
cards have not been designed to cope with the
specifi c needs of online transactions and often
cannot be used for cross-border purchases. The
challenge is to adapt card payments to make
them a more secure means of online payment,
e.g. by rolling out secure payment protocols,
while at the same time usability should not be
adversely affected.
For half a century card payments have been
associated exclusively with plastic cards,
but nowadays technology offers new ways
to make card payments, be they proximity
payments (i.e. at the physical point of sale)
or remote payments (especially in the fi eld
of e-commerce). Moreover, the plastic card
itself has become a “smart card”, with a chip
on it. These chips are in fact small computers,
providing new ways to make payments
(e.g. contactless payments with the help of
near-fi eld technology) and offering services over
and above payments (e.g. merchants’ reward
programmes). Once a contactless point-of-sale
terminal structure is in place throughout Europe,
the mobile phone could replace the plastic
card. The oft-quoted observation that people
are more likely to forget their wallet than their
mobile phone, together with the technological
versatility of the device, has already led to the
idea of developing payment mechanisms based
on the mobile phone. However, the roll-out
of mobile payment solutions in Europe is still
at an early stage and its success depends on a
wide range of preconditions which need to be
fulfi lled. Nevertheless, if the implementation of
contactless technology is successful, the devices
used to make card payments could in future range
from a smart card to a mobile phone or even a
wristwatch. Forward-looking payment service
See “Internet Usage in 2010 – Households and Individuals”, 29
issue number 50/2010, Eurostat, 2010. Available at http://epp.
eurostat.ec.europa.eu/cache/ITY_OFFPUB/KS-QA-10-050/EN/
KS-QA-10-050-EN.PDF
See “Consumer 2020: From Digital Agenda to Digital Action”, 30
European Commission staff report, 23 May 2010. Available at
http://ec.europa.eu/information_society/newsroom/cf/document.
cfm?action=display&doc_id=750
See “Mystery Shopping Evaluation of Cross-Border E-Commerce 31
in the EU – Final Report”, European Commission. Available at
http://ec.europa.eu/consumers/strategy/docs/EC_e-commerce_
Final_Report_201009_en.pdf

86ECB
Monthly Bulletin
January 2012
providers are already taking this possibility
into consideration by developing integrated
payment platforms that offer a wide range of
access channels for customers but standardised
back-offi ce processes. Such integrated
approaches can greatly benefi t from the
standardisation and integration work achieved
by the SEPA project. The different access
channels can be combined in sophisticated
“wallet solutions” for customers, creating
additional value for consumers and merchants
and laying the foundations for future growth in
card payments.
Card payments, one of the main pillars of
SEPA, are lagging behind credit transfers and
direct debits in the move towards an integrated
European market. Certainly, the complexity of
the card payments market, with the large number
of parties involved, as well as its economic
importance, have contributed to the slow pace
of progress. However, if the main challenges
relating to processing, standardisation and
business practices are successfully overcome,
an integrated European card payments market
for the benefi t of customers and the economy as
a whole can be achieved and the basis for further
payment innovation can be created.

S 1ECB
Monthly Bulletin
January 2012
EURO AREA STATISTICS


S 3ECB
Monthly Bulletin
January 2012
CONTENTS 1
For further information, please contact us at: [email protected]. See the ECB’s Statistical Data Warehouse in the “Statistics” section of the ECB’s website 1
(http://sdw.ecb.europa.eu) for longer runs and more detailed data.
EURO AREA OVERVIEW
Summary of economic indicators for the euro area S5
1 MONETARY POLICY STATISTICS
1.1 Consolidated fi nancial statement of the Eurosystem S6
1.2 Key ECB interest rates S7
1.3 Eurosystem monetary policy operations allotted through tender procedures S8
1.4 Minimum reserve and liquidity statistics S9
2 MONEY, BANKING AND OTHER FINANCIAL CORPORATIONS
2.1 Aggregated balance sheet of euro area MFIs S10
2.2 Consolidated balance sheet of euro area MFIs S11
2.3 Monetary statistics S12
2.4 MFI loans: breakdown S14
2.5 Deposits held with MFIs: breakdown S17
2.6 MFI holdings of securities: breakdown S20
2.7 Currency breakdown of selected MFI balance sheet items S21
2.8 Aggregated balance sheet of euro area investment funds S22
2.9 Securities held by investment funds broken down by issuer of securities S23
2.10 Aggregated balance sheet of euro area fi nancial vehicle corporations S24
2.11 Aggregated balance sheet of euro area insurance corporations and pension funds S25
3 EURO AREA ACCOUNTS
3.1 Integrated economic and fi nancial accounts by institutional sector S26
3.2 Euro area non-fi nancial accounts S30
3.3 Households S32
3.4 Non-fi nancial corporations S33
3.5 Insurance corporations and pension funds S34
4 FINANCIAL MARKETS
4.1 Securities other than shares by original maturity, residency of the issuer and currency S35
4.2 Securities other than shares issued by euro area residents, by sector of the issuer and instrument type S36
4.3 Growth rates of securities other than shares issued by euro area residents S38
4.4 Quoted shares issued by euro area residents S40
4.5 MFI interest rates on euro-denominated deposits from and loans to euro area residents S42
4.6 Money market interest rates S44
4.7 Euro area yield curves S45
4.8 Stock market indices S46
5 PRICES, OUTPUT, DEMAND AND LABOUR MARKETS
5.1 HICP, other prices and costs S47
5.2 Output and demand S50
5.3 Labour markets S54
6 GOVERNMENT FINANCE
6.1 Revenue, expenditure and defi cit/surplus S56
6.2 Debt S57
6.3 Change in debt S58

S 4ECB
Monthly Bulletin
January 2012
6.4 Quarterly revenue, expenditure and defi cit/surplus S59
6.5 Quarterly debt and change in debt S60
7 EXTERNAL TRANSACTIONS AND POSITIONS
7.1 Summary balance of payments S61
7.2 Current and capital accounts S62
7.3 Financial account S64
7.4 Monetary presentation of the balance of payments S70
7.5 Trade in goods S71
8 EXCHANGE RATES
8.1 Effective exchange rates S73
8.2 Bilateral exchange rates S74
9 DEVELOPMENTS OUTSIDE THE EURO AREA
9.1 In other EU Member States S75
9.2 In the United States and Japan S76
LIST OF CHARTS S77
TECHNICAL NOTES S79
GENERAL NOTES S85
Conventions used in the tables
“-” data do not exist/data are not applicable
“.” data are not yet available
“…” nil or negligible
“billion” 109
(p) provisional
s.a. seasonally adjusted
n.s.a. non-seasonally adjusted

EURO AREA OVERVIEW
Summary of economic indicators for the euro area (annual percentage changes, unless otherwise indicated)
S 5ECB
Monthly BulletinJanuary 2012
1. Monetary developments and interest rates 1)
M1 2) M2 2) M3 2), 3) M3 2), 3) MFI loans to Securities other 3-month 10-year3-month euro area than shares issued interest rate spot rate
moving average residents in euro by non-MFI (EURIBOR; (% per annum;(centred) excluding MFIs corporations 2) % per annum; end of
and general period period) 4)
government 2) averages)
1 2 3 4 5 6 7 8
2010 8.5 1.8 0.5 - 0.6 4.1 0.81 3.362011 . . . - . . 1.39 2.65
2011 Q1 3.2 2.4 1.9 - 2.4 2.1 1.10 3.66 Q2 1.7 2.4 2.1 - 2.6 1.5 1.42 3.41 Q3 1.4 2.3 2.4 - 2.5 0.6 1.56 2.48 Q4 . . . - . . 1.50 2.65
2011 July 1.0 2.2 2.1 2.3 2.4 1.0 1.60 3.06 Aug. 1.7 2.4 2.8 2.6 2.5 0.1 1.55 2.76 Sep. 2.0 2.5 2.9 2.8 2.5 0.0 1.54 2.48 Oct. 1.7 1.9 2.6 2.5 2.7 0.8 1.58 2.79 Nov. 2.1 2.1 2.0 . 1.7 -0.7 1.48 3.07 Dec. . . . . . . 1.43 2.65
2. Prices, output, demand and labour markets 5)
HICP 1) Industrial Hourly Real GDP Industrial Capacity Employment Unemploymentproducer labour (s.a.) production utilisation in (s.a.) (% of labour
prices costs excluding manufacturing force; s.a.)construction (%)
1 2 3 4 5 6 7 8
2010 1.6 2.9 1.6 1.9 7.4 76.9 -0.5 10.12011 . . . . . . . .
2011 Q1 2.5 6.5 2.5 2.4 6.6 80.9 0.2 10.0 Q2 2.8 6.3 3.3 1.6 4.2 81.2 0.4 10.0 Q3 2.7 5.9 2.7 1.3 4.0 80.3 0.3 10.1
2011 July 2.5 6.1 - - 4.3 80.8 - 10.1 Aug. 2.5 5.8 - - 6.0 - - 10.1 Sep. 3.0 5.8 - - 2.2 - - 10.2 Oct. 3.0 5.5 - - 1.0 79.7 - 10.3 Nov. 3.0 5.3 - - . - - 10.3 Dec. 2.8 . - - . - - .
3. External statistics(EUR billions, unless otherwise indicated)
Balance of payments (net transactions) Reserve assets Net Gross Effective exchange rate of USD/EUR
(end-of-period international external debt the euro: EER-20 6) exchange rateCurrent and Combined positions) investment (as a % of GDP) (index: 1999 Q1 = 100)
capital Goods direct and positionaccounts portfolio (as a % of GDP) Nominal Real (CPI)
investment1 2 3 4 5 6 7 8 9
2010 -36.7 12.9 98.1 591.2 -13.4 120.4 104.6 103.0 1.32572011 . . . . . . 104.4 102.2 1.3920
2011 Q1 -27.8 -13.0 118.7 576.6 -13.4 117.6 103.7 101.5 1.3680 Q2 -20.1 -2.7 127.1 580.9 -14.5 119.7 106.4 104.2 1.4391 Q3 -7.4 1.7 24.2 646.7 . . 104.6 102.1 1.4127 Q4 . . . . . . 103.1 100.9 1.3482
2011 July -1.6 3.3 -20.5 621.6 . . 105.2 102.6 1.4264 Aug. -5.0 -4.5 31.7 656.4 . . 104.9 102.3 1.4343 Sep. -0.8 2.8 13.0 646.7 . . 103.8 101.4 1.3770 Oct. 3.2 1.4 -32.1 651.6 . . 104.0 101.7 1.3706 Nov. . . . 683.4 . . 103.5 101.4 1.3556 Dec. . . . . . . 101.7 99.6 1.3179
Sources: ECB, European Commission (Eurostat and Economic and Financial Affairs DG) and Thomson Reuters.Note: For more information on the data, see the relevant tables later in this section.1) Data refer to the changing composition of the euro area. For further information, see the General Notes.2) Annual percentage changes for monthly data refer to the end of the month, whereas those for quarterly and yearly data refer to the annual change in the period average.
See the Technical Notes for details.3) M3 and its components exclude holdings by non-euro area residents of money market fund shares/units and debt securities with a maturity of up to two years.4) Based on AAA-rated euro area central government bond yield curves. For further information, see Section 4.7.5) Data refer to the Euro 17, unless otherwise indicated.6) For a definition of the trading partner groups and other information, please refer to the General Notes.

1 MONETARY POLICY STATISTICS
1.1 Consolidated financial statement of the Eurosystem (EUR millions)
S 6ECBMonthly BulletinJanuary 2012
1. Assets
16 December 2011 23 December 2011 30 December 2011 6 January 2012
Gold and gold receivables 419,821 419,822 423,458 423,455 Claims on non-euro area residents in foreign currency 235,679 236,826 244,621 246,002 Claims on euro area residents in foreign currency 73,042 95,355 98,226 95,647 Claims on non-euro area residents in euro 30,452 25,982 25,355 24,565 Lending to euro area credit institutions in euro 665,008 879,130 863,568 835,978 Main refinancing operations 291,629 169,024 144,755 130,622 Longer-term refinancing operations 368,609 703,894 703,894 703,894 Fine-tuning reverse operations 0 0 0 0 Structural reverse operations 0 0 0 0 Marginal lending facility 4,549 6,131 14,823 1,391 Credits related to margin calls 221 81 97 71 Other claims on euro area credit institutions in euro 89,555 94,989 78,652 66,838 Securities of euro area residents in euro 610,164 610,629 618,637 618,969 Securities held for monetary policy purposes 272,509 273,041 273,854 274,829 Other securities 337,655 337,588 344,783 344,140 General government debt in euro 33,928 33,928 33,926 33,926 Other assets 336,156 336,574 349,184 342,491
Total assets 2,493,806 2,733,235 2,735,628 2,687,871
2. Liabilities
16 December 2011 23 December 2011 30 December 2011 6 January 2012
Banknotes in circulation 882,593 890,938 888,676 883,745 Liabilities to euro area credit institutions in euro 719,903 888,231 849,477 832,377 Current accounts (covering the minimum reserve system) 298,112 265,041 223,539 156,466 Deposit facility 214,108 411,813 413,882 463,565 Fixed-term deposits 207,500 211,000 211,000 211,500 Fine-tuning reverse operations 0 0 0 0 Deposits related to margin calls 183 377 1,056 845 Other liabilities to euro area credit institutions in euro 3,175 3,380 2,423 1,066 Debt certificates issued 0 0 0 0 Liabilities to other euro area residents in euro 55,271 77,530 79,603 90,723 Liabilities to non-euro area residents in euro 92,835 132,178 156,873 124,355 Liabilities to euro area residents in foreign currency 4,153 5,058 4,566 5,648 Liabilities to non-euro area residents in foreign currency 8,563 8,630 9,027 8,364 Counterpart of special drawing rights allocated by the IMF 54,486 54,486 55,942 55,942 Other liabilities 208,069 208,047 213,521 210,118 Revaluation accounts 383,276 383,276 394,031 394,031 Capital and reserves 81,481 81,481 81,489 81,503
Total liabilities 2,493,806 2,733,235 2,735,628 2,687,871
Source: ECB.

EURO AREASTATISTICS
Monetarypolicy
statistics
1.2 Key ECB interest rates (levels in percentages per annum; changes in percentage points)
S 7ECB
Monthly BulletinJanuary 2012
With effect from: 1) Deposit facility Main refinancing operations Marginal lending facility
Fixed rate tenders Variable rate tenders Fixed rate Minimum bid rate
Level Change Level Level Change Level Change
1 2 3 4 5 6 7
1999 1 Jan. 2.00 - 3.00 - - 4.50 - 4 2) 2.75 0.75 3.00 - ... 3.25 -1.25
22 2.00 -0.75 3.00 - ... 4.50 1.259 Apr. 1.50 -0.50 2.50 - -0.50 3.50 -1.005 Nov. 2.00 0.50 3.00 - 0.50 4.00 0.50
2000 4 Feb. 2.25 0.25 3.25 - 0.25 4.25 0.2517 Mar. 2.50 0.25 3.50 - 0.25 4.50 0.2528 Apr. 2.75 0.25 3.75 - 0.25 4.75 0.25
9 June 3.25 0.50 4.25 - 0.50 5.25 0.5028 3) 3.25 ... - 4.25 ... 5.25 ...
1 Sep. 3.50 0.25 - 4.50 0.25 5.50 0.256 Oct. 3.75 0.25 - 4.75 0.25 5.75 0.25
2001 11 May 3.50 -0.25 - 4.50 -0.25 5.50 -0.2531 Aug. 3.25 -0.25 - 4.25 -0.25 5.25 -0.2518 Sep. 2.75 -0.50 - 3.75 -0.50 4.75 -0.50
9 Nov. 2.25 -0.50 - 3.25 -0.50 4.25 -0.50
2002 6 Dec. 1.75 -0.50 - 2.75 -0.50 3.75 -0.50
2003 7 Mar. 1.50 -0.25 - 2.50 -0.25 3.50 -0.256 June 1.00 -0.50 - 2.00 -0.50 3.00 -0.50
2005 6 Dec. 1.25 0.25 - 2.25 0.25 3.25 0.25
2006 8 Mar. 1.50 0.25 - 2.50 0.25 3.50 0.2515 June 1.75 0.25 - 2.75 0.25 3.75 0.25
9 Aug. 2.00 0.25 - 3.00 0.25 4.00 0.2511 Oct. 2.25 0.25 - 3.25 0.25 4.25 0.2513 Dec. 2.50 0.25 - 3.50 0.25 4.50 0.25
2007 14 Mar. 2.75 0.25 - 3.75 0.25 4.75 0.2513 June 3.00 0.25 - 4.00 0.25 5.00 0.25
2008 9 July 3.25 0.25 - 4.25 0.25 5.25 0.258 Oct. 2.75 -0.50 - - - 4.75 -0.509 4) 3.25 0.50 - - - 4.25 -0.50
15 5) 3.25 ... 3.75 - -0.50 4.25 ... 12 Nov. 2.75 -0.50 3.25 - -0.50 3.75 -0.5010 Dec. 2.00 -0.75 2.50 - -0.75 3.00 -0.75
2009 21 Jan. 1.00 -1.00 2.00 - -0.50 3.00 ... 11 Mar. 0.50 -0.50 1.50 - -0.50 2.50 -0.50
8 Apr. 0.25 -0.25 1.25 - -0.25 2.25 -0.2513 May 0.25 ... 1.00 - -0.25 1.75 -0.50
2011 13 Apr. 0.50 0.25 1.25 - 0.25 2.00 0.2513 July 0.75 0.25 1.50 - 0.25 2.25 0.25
9 Nov. 0.50 -0.25 1.25 - -0.25 2.00 -0.2514 Dec. 0.25 -0.25 1.00 - -0.25 1.75 -0.25
Source: ECB.1) From 1 January 1999 to 9 March 2004, the date refers to the deposit and marginal lending facilities. For main refinancing operations, changes in the rate are effective from the
first operation following the date indicated. The change on 18 September 2001 was effective on that same day. From 10 March 2004 onwards, the date refers both to the depositand marginal lending facilities and to the main refinancing operations (with changes effective from the first main refinancing operation following the Governing Councildecision), unless otherwise indicated.
2) On 22 December 1998 the ECB announced that, as an exceptional measure between 4 and 21 January 1999, a narrow corridor of 50 basis points would be applied between theinterest rates for the marginal lending facility and the deposit facility, aimed at facilitating the transition to the new monetary regime by market participants.
3) On 8 June 2000 the ECB announced that, starting from the operation to be settled on 28 June 2000, the main refinancing operations of the Eurosystem would be conducted asvariable rate tenders. The minimum bid rate refers to the minimum interest rate at which counterparties may place their bids.
4) As of 9 October 2008 the ECB reduced the standing facilities corridor from 200 basis points to 100 basis points around the interest rate on the main refinancing operations.The standing facilities corridor was restored to 200 basis points as of 21 January 2009.
5) On 8 October 2008 the ECB announced that, starting from the operation to be settled on 15 October, the weekly main refinancing operations would be carried out through afixed rate tender procedure with full allotment at the interest rate on the main refinancing operations. This change overrode the previous decision (made on the same day)to cut by 50 basis points the minimum bid rate on the main refinancing operations conducted as variable rate tenders.

1.3 Eurosystem monetary policy operations allotted through tender procedures 1), 2) (EUR millions; interest rates in percentages per annum)
S 8ECBMonthly BulletinJanuary 2012
1. Main and longer-term refinancing operations 3)
Main refinancing operations
Date of Bids Number of Allotment Fixed rate tender Variable rate tender Running for
settlement (amount) participants (amount) procedures procedures (...) days
Fixed rate Minimum Marginal Weightedbid rate rate 4) average rate
1 2 3 4 5 6 7 8
2011 5 Oct. 198,881 166 198,881 1.50 - - - 712 204,939 166 204,939 1.50 - - - 719 201,182 164 201,182 1.50 - - - 726 197,438 152 197,438 1.50 - - - 6
1 Nov. 182,773 143 182,773 1.50 - - - 89 194,765 150 194,765 1.25 - - - 7
16 230,265 161 230,265 1.25 - - - 723 247,175 178 247,175 1.25 - - - 730 265,456 192 265,456 1.25 - - - 7
7 Dec. 252,100 197 252,100 1.25 - - - 714 291,629 197 291,629 1.00 - - - 721 169,024 146 169,024 1.00 - - - 728 144,755 171 144,755 1.00 - - - 7
2012 4 Jan. 130,622 138 130,622 1.00 - - - 711 110,923 131 110,923 1.00 - - - 7
Longer-term refinancing operations
2011 11 Aug. 5) 49,752 114 49,752 . - - - 2031 Sep. 49,356 128 49,356 1.50 - - - 91
14 54,222 37 54,222 1.50 - - - 2829 5) 140,628 214 140,628 1.35 - - - 8412 Oct. 59,062 39 59,062 1.50 - - - 2827 5) 56,934 181 56,934 . - - - 37127 5) 44,564 91 44,564 . - - - 91
9 Nov. 55,547 47 55,547 1.25 - - - 351 Dec. 5) 38,620 108 38,620 . - - - 91
14 41,150 42 41,150 1.00 - - - 3522 5) 29,741 72 29,741 . - - - 9822 5) 6) 489,191 523 489,191 . - - - 1,134
2. Other tender operations
Date of settlement Type of Bids Number of Allotment Fixed rate tender Variable rate tender Running
operation (amount) participants (amount) procedures procedures for(...) days
Fixed rate Minimum Maximum Marginal Weightedbid rate bid rate rate 4) average rate
1 2 3 4 5 6 7 8 9 10
2011 19 Oct. Collection of fixed-term deposits 263,579 108 165,000 - - 1.50 0.91 0.89 726 Collection of fixed-term deposits 231,364 87 169,500 - - 1.50 0.87 0.85 6
1 Nov. Collection of fixed-term deposits 197,917 71 173,500 - - 1.50 0.87 0.83 88 Collection of fixed-term deposits 284,108 165 284,043 - - 1.50 1.30 1.27 19 Collection of fixed-term deposits 214,817 99 183,000 - - 1.25 0.69 0.64 7
16 Collection of fixed-term deposits 260,476 100 187,000 - - 1.25 0.65 0.61 723 Collection of fixed-term deposits 233,094 88 194,500 - - 1.25 0.63 0.60 730 Collection of fixed-term deposits 194,199 85 194,199 - - 1.25 1.25 0.62 7
7 Dec. Collection of fixed-term deposits 246,344 113 207,000 - - 1.25 1.00 0.65 713 Collection of fixed-term deposits 260,883 137 258,029 - - 1.25 1.05 1.03 114 Collection of fixed-term deposits 241,403 110 207,500 - - 1.00 0.80 0.49 721 Collection of fixed-term deposits 257,035 106 211,000 - - 1.00 0.75 0.53 728 Collection of fixed-term deposits 263,336 95 211,000 - - 1.00 0.89 0.56 7
2012 4 Jan. Collection of fixed-term deposits 336,926 134 211,500 - - 1.00 0.44 0.36 711 Collection of fixed-term deposits 376,720 131 213,000 - - 1.00 0.34 0.32 7
Source: ECB.1) The amounts shown may differ slightly from those in Section 1.1 owing to operations that have been allotted but not settled.2) With effect from April 2002, split tender operations (i.e. operations with a one-week maturity conducted as standard tender procedures in parallel with a main refinancing
operation) are classified as main refinancing operations.3) On 8 June 2000 the ECB announced that, starting from the operation to be settled on 28 June 2000, the main refinancing operations of the Eurosystem would be conducted as
variable rate tender procedures. The minimum bid rate refers to the minimum interest rate at which counterparties may place their bids. On 8 October 2008 the ECB announcedthat, starting from the operation to be settled on 15 October 2008, the weekly main refinancing operations would be carried out through a fixed rate tender procedure with fullallotment at the interest rate on the main refinancing operations. On 4 March 2010 the ECB decided to return to variable rate tender procedures in the regular three-monthlonger-term refinancing operations, starting with the operation to be allotted on 28 April 2010 and settled on 29 April 2010.
4) In liquidity-providing (absorbing) operations, the marginal rate refers to the lowest (highest) rate at which bids were accepted.5) In this longer-term refinancing operation, the rate at which all bids are satisfied is indexed to the average minimum bid rate in the main refinancing operations over the life of the
operation. The interest rates displayed for these indexed longer-term refinancing operations have been rounded to two decimal places. For the precise calculation method,please refer to the Technical Notes.
6) After one year counterparties will have the option to repay any part of the liquidity that they have been allotted in this operation, on any day that coincides with the settlement day of a main refinancing operation.

EURO AREASTATISTICS
Monetarypolicy
statistics
1.4 Minimum reserve and liquidity statistics (EUR billions; period averages of daily positions, unless otherwise indicated; interest rates as percentages per annum)
S 9ECB
Monthly BulletinJanuary 2012
1. Reserve base of credit institutions subject to reserve requirements
Reserve Total Liabilities to which a 2% reserve coefficient is applied Liabilities to which a 0% reserve coefficient is applied
baseas at: 1) Overnight deposits and Debt securities Deposits with an agreed Repos Debt securities
deposits with an agreed maturity issued with a maturity maturity or notice period issued with a maturityor notice period of up to 2 years of up to 2 years of over 2 years of over 2 years
1 2 3 4 5 6
2008 18,169.6 10,056.8 848.7 2,376.9 1,243.5 3,643.72009 18,318.2 9,808.5 760.4 2,475.7 1,170.1 4,103.52010 18,948.1 9,962.6 644.3 2,683.3 1,335.4 4,322.5
2011 June 19,039.4 9,730.8 643.5 2,777.9 1,491.7 4,395.4 July 19,046.3 9,695.1 635.0 2,777.7 1,502.7 4,435.8 Aug. 19,095.3 9,688.3 645.8 2,782.6 1,557.4 4,421.3 Sep. 19,247.9 9,761.9 650.5 2,808.3 1,576.5 4,450.7 Oct. 19,126.2 9,718.9 657.4 2,788.5 1,562.7 4,398.7
2. Reserve maintenance
Maintenance Required Credit institutions’ Excess Deficiencies Interest rate onperiod reserves current accounts reserves minimum reserves
ending on:1 2 3 4 5
2010 211.8 212.5 0.7 0.5 1.002011 207.7 212.2 4.5 0.0 1.25
2011 9 Aug. 208.8 211.5 2.7 0.0 1.5013 Sep. 207.0 209.5 2.5 0.0 1.5011 Oct. 206.1 208.7 2.6 0.0 1.50
8 Nov. 206.2 208.9 2.8 0.0 1.5013 Dec. 207.7 212.2 4.5 0.0 1.25
2012 17 Jan. 207.0 . . . .
3. Liquidity
Maintenance Liquidity-providing factors Liquidity-absorbing factors Credit Base
period institutions’ moneyending on: Monetary policy operations of the Eurosystem current
accountsEurosystem’s Main Longer-term Marginal Other Deposit Other Banknotes Central Other
net assets refinancing refinancing lending liquidity- facility liquidity- in government factorsin gold operations operations facility providing absorbing circulation deposits (net)
and foreign operations 2) operations 3) with thecurrency Eurosystem
1 2 3 4 5 6 7 8 9 10 11 12
2010 511.1 179.5 336.3 1.9 130.4 44.7 70.8 815.9 94.4 -79.1 212.5 1,073.12011 622.1 238.0 389.0 4.4 260.3 253.7 200.5 869.4 63.8 -85.9 212.2 1,335.3
2011 12 July 533.6 146.0 311.6 0.2 134.2 29.5 76.9 846.2 73.4 -111.2 210.9 1,086.69 Aug. 541.3 171.7 321.5 0.1 133.9 56.7 79.2 854.2 71.4 -104.5 211.5 1,122.4
13 Sep. 540.3 135.1 389.8 0.3 178.0 121.8 109.8 853.2 52.3 -103.0 209.5 1,184.511 Oct. 571.0 193.0 373.6 1.5 217.4 168.7 162.9 854.9 50.0 -88.5 208.7 1,232.2
8 Nov. 612.1 196.1 387.1 2.8 231.9 204.6 178.0 861.4 57.9 -80.8 208.9 1,274.813 Dec. 622.1 238.0 389.0 4.4 260.3 253.7 200.5 869.4 63.8 -85.9 212.2 1,335.3
Source: ECB.1) End of period.2) Includes liquidity provided under the Eurosystem’s covered bond purchase programmes and the Eurosystem’s Securities Markets Programme.3) Includes liquidity absorbed as a result of the Eurosystem’s foreign exchange swap operations.
For more information, please see: http://www.ecb.europa.eu/mopo/liq/html/index.en.html

FINANCIAL CORPORATIONS2 MONEY, BANKING AND OTHER
2.1 Aggregated balance sheet of euro area MFIs 1) (EUR billions; outstanding amounts at end of period)
S 10ECBMonthly BulletinJanuary 2012
1. Assets
Eurosystem
Total Loans to euro area residents Holdings of securities other than Money Holdings External Fixed Remaining
shares issued by euro area residents market of shares/ assets assets assets 3)
fund other equityTotal General Other MFIs Total General Other MFIs shares/ issued by
government euro area government euro area units 2) euro arearesidents residents residents
1 2 3 4 5 6 7 8 9 10 11 12 13 14
2009 2,829.9 1,489.8 19.5 0.7 1,469.7 451.7 368.3 7.5 75.9 - 16.5 556.8 8.5 306.72010 3,212.4 1,551.0 18.6 0.9 1,531.5 574.4 463.8 9.6 101.1 - 18.1 684.1 8.5 376.3
2011 Q2 3,132.7 1,434.0 17.8 1.0 1,415.2 594.9 468.9 9.9 116.2 - 19.4 688.4 8.6 387.3 Q3 3,928.6 2,043.3 18.0 1.0 2,024.4 659.9 544.3 10.9 104.7 - 17.9 767.4 8.7 431.3
2011 Aug. 3,551.1 1,713.6 17.8 1.0 1,694.8 628.8 514.8 10.4 103.5 - 18.2 776.9 8.7 404.9 Sep. 3,928.6 2,043.3 18.0 1.0 2,024.4 659.9 544.3 10.9 104.7 - 17.9 767.4 8.7 431.3 Oct. 4,013.1 2,122.5 18.0 1.0 2,103.6 667.3 551.8 10.8 104.7 - 18.6 757.7 8.7 438.3 Nov. (p) 4,329.7 2,383.6 18.0 1.0 2,364.7 691.8 576.5 10.9 104.3 - 18.4 784.5 8.8 442.6
MFIs excluding the Eurosystem
2009 31,144.2 17,701.6 1,001.7 10,783.9 5,916.1 5,060.0 1,482.1 1,498.0 2,079.9 85.1 1,236.1 4,252.4 220.7 2,588.32010 32,199.5 17,763.1 1,221.8 11,026.1 5,515.2 4,938.6 1,524.2 1,528.6 1,885.8 59.9 1,233.1 4,323.4 223.5 3,658.0
2011 Q2 31,740.4 17,879.0 1,152.7 11,223.9 5,502.4 4,690.3 1,457.7 1,472.2 1,760.3 61.6 1,251.5 4,295.5 228.9 3,333.6 Q3 33,661.5 18,446.2 1,145.8 11,296.6 6,003.8 4,674.1 1,416.1 1,458.3 1,799.7 58.4 1,229.9 4,420.8 230.3 4,601.7
2011 Aug. 32,816.4 18,152.3 1,145.0 11,237.9 5,769.5 4,674.7 1,430.0 1,469.2 1,775.5 62.2 1,234.4 4,338.5 229.7 4,124.5 Sep. 33,661.5 18,446.2 1,145.8 11,296.6 6,003.8 4,674.1 1,416.1 1,458.3 1,799.7 58.4 1,229.9 4,420.8 230.3 4,601.7 Oct. 33,346.6 18,438.6 1,145.4 11,267.0 6,026.1 4,714.8 1,393.6 1,518.3 1,802.9 55.9 1,226.5 4,277.6 230.8 4,402.5 Nov. (p) 33,403.8 18,538.1 1,144.4 11,256.3 6,137.4 4,711.8 1,382.5 1,524.7 1,804.7 56.3 1,227.9 4,281.9 231.2 4,356.6
2. Liabilities
Eurosystem
Total Currency Deposits of euro area residents Money Debt Capital External Remaining
in market securities and liabilities liabilities 3)
circulation Total Central Other general MFIs fund issued 5) reservesgovernment government/ shares/
other euro units 4)
area residents
1 2 3 4 5 6 7 8 9 10 11
2009 2,829.9 829.3 1,196.1 103.6 22.1 1,070.5 - 0.1 319.8 140.2 344.42010 3,212.4 863.7 1,394.8 68.0 8.7 1,318.1 - 0.0 428.5 153.8 371.7
2011 Q2 3,132.7 871.6 1,320.1 72.5 11.2 1,236.3 - 0.0 412.2 157.5 371.4 Q3 3,928.6 882.1 1,984.0 50.1 6.6 1,927.3 - 0.0 475.8 189.4 397.3
2011 Aug. 3,551.1 874.5 1,616.6 69.5 8.7 1,538.4 - 0.0 493.7 176.4 389.9 Sep. 3,928.6 882.1 1,984.0 50.1 6.6 1,927.3 - 0.0 475.8 189.4 397.3 Oct. 4,013.1 889.2 2,068.0 66.4 10.6 1,991.0 - 0.0 477.1 177.5 401.3 Nov. (p) 4,329.7 892.7 2,367.8 60.9 12.0 2,294.9 - 0.0 489.4 178.2 401.8
MFIs excluding the Eurosystem
2009 31,144.2 - 16,469.0 146.0 10,041.4 6,281.6 732.6 4,908.5 1,921.2 4,098.5 3,014.42010 32,199.5 - 16,497.6 196.2 10,526.4 5,774.9 612.3 4,845.2 2,045.5 4,220.4 3,978.5
2011 Q2 31,740.4 - 16,614.3 266.4 10,655.6 5,692.3 607.5 4,903.1 2,156.0 3,973.3 3,486.1 Q3 33,661.5 - 17,079.4 211.4 10,783.6 6,084.4 607.5 4,952.8 2,203.5 4,033.4 4,785.0
2011 Aug. 32,816.4 - 16,818.8 187.1 10,711.5 5,920.2 622.7 4,908.7 2,198.8 3,988.7 4,278.7 Sep. 33,661.5 - 17,079.4 211.4 10,783.6 6,084.4 607.5 4,952.8 2,203.5 4,033.4 4,785.0 Oct. 33,346.6 - 17,073.5 195.5 10,763.5 6,114.5 594.0 4,920.7 2,203.2 3,953.3 4,602.0 Nov. (p) 33,403.8 - 17,117.6 204.3 10,725.2 6,188.1 606.8 4,941.4 2,203.6 3,976.4 4,558.0
Source: ECB.1) Data refer to the changing composition of the euro area. For further information, see the General Notes.2) Amounts issued by euro area residents. Amounts issued by non-euro area residents are included in external assets.3) In December 2010 a change was made to the recording practice for derivatives in one Member State, leading to an increase in this position.4) Amounts held by euro area residents.5) Amounts issued with a maturity of up to two years and held by non-euro area residents are included in external liabilities.
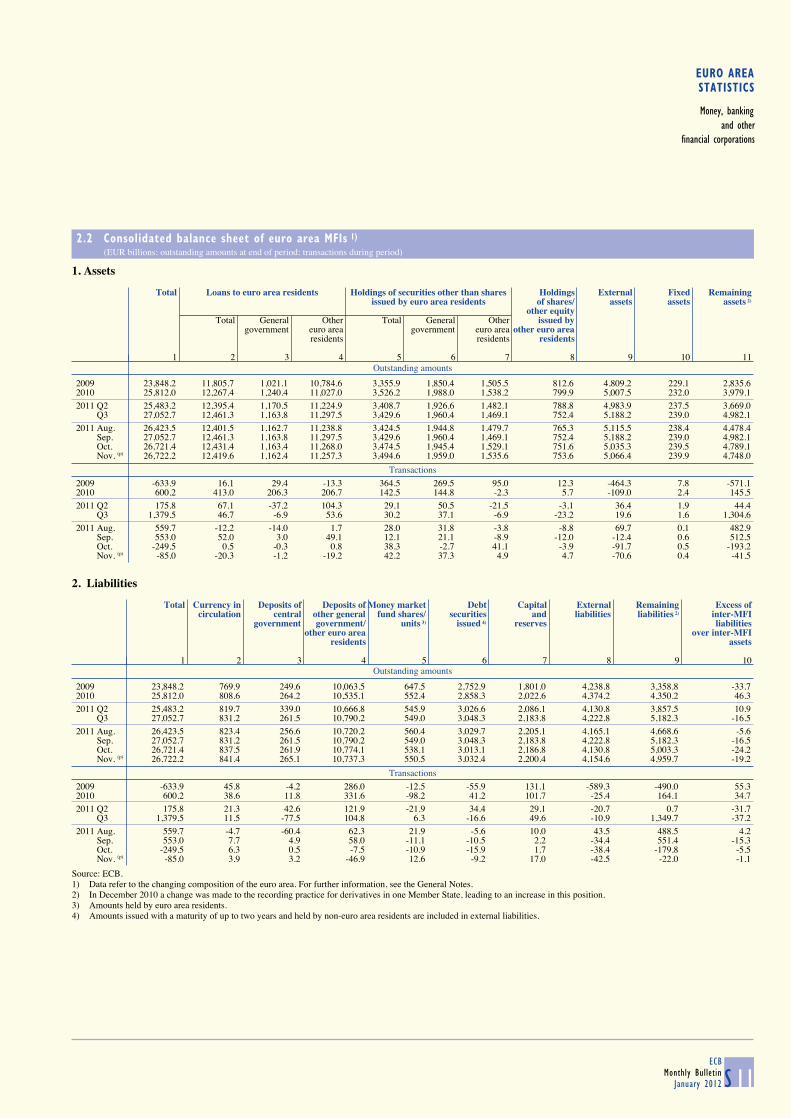
EURO AREASTATISTICS
Money, bankingand other
financial corporations
2.2 Consolidated balance sheet of euro area MFIs 1) (EUR billions; outstanding amounts at end of period; transactions during period)
S 11ECB
Monthly BulletinJanuary 2012
1. Assets
Outstanding amounts
Total Loans to euro area residents Holdings of securities other than shares Holdings External Fixed Remaining
issued by euro area residents of shares/ assets assets assets 2)
other equityTotal General Other Total General Other issued by
government euro area government euro area other euro arearesidents residents residents
1 2 3 4 5 6 7 8 9 10 11
2009 23,848.2 11,805.7 1,021.1 10,784.6 3,355.9 1,850.4 1,505.5 812.6 4,809.2 229.1 2,835.62010 25,812.0 12,267.4 1,240.4 11,027.0 3,526.2 1,988.0 1,538.2 799.9 5,007.5 232.0 3,979.1
2011 Q2 25,483.2 12,395.4 1,170.5 11,224.9 3,408.7 1,926.6 1,482.1 788.8 4,983.9 237.5 3,669.0 Q3 27,052.7 12,461.3 1,163.8 11,297.5 3,429.6 1,960.4 1,469.1 752.4 5,188.2 239.0 4,982.1
2011 Aug. 26,423.5 12,401.5 1,162.7 11,238.8 3,424.5 1,944.8 1,479.7 765.3 5,115.5 238.4 4,478.4 Sep. 27,052.7 12,461.3 1,163.8 11,297.5 3,429.6 1,960.4 1,469.1 752.4 5,188.2 239.0 4,982.1 Oct. 26,721.4 12,431.4 1,163.4 11,268.0 3,474.5 1,945.4 1,529.1 751.6 5,035.3 239.5 4,789.1 Nov. (p) 26,722.2 12,419.6 1,162.4 11,257.3 3,494.6 1,959.0 1,535.6 753.6 5,066.4 239.9 4,748.0
Transactions
2009 -633.9 16.1 29.4 -13.3 364.5 269.5 95.0 12.3 -464.3 7.8 -571.12010 600.2 413.0 206.3 206.7 142.5 144.8 -2.3 5.7 -109.0 2.4 145.5
2011 Q2 175.8 67.1 -37.2 104.3 29.1 50.5 -21.5 -3.1 36.4 1.9 44.4 Q3 1,379.5 46.7 -6.9 53.6 30.2 37.1 -6.9 -23.2 19.6 1.6 1,304.6
2011 Aug. 559.7 -12.2 -14.0 1.7 28.0 31.8 -3.8 -8.8 69.7 0.1 482.9 Sep. 553.0 52.0 3.0 49.1 12.1 21.1 -8.9 -12.0 -12.4 0.6 512.5 Oct. -249.5 0.5 -0.3 0.8 38.3 -2.7 41.1 -3.9 -91.7 0.5 -193.2 Nov. (p) -85.0 -20.3 -1.2 -19.2 42.2 37.3 4.9 4.7 -70.6 0.4 -41.5
2. Liabilities
Outstanding amounts
Total Currency in Deposits of Deposits of Money market Debt Capital External Remaining Excess ofcirculation central other general fund shares/ securities and liabilities liabilities 2) inter-MFI
government government/ units 3) issued 4) reserves liabilitiesother euro area over inter-MFI
residents assets
1 2 3 4 5 6 7 8 9 10
2009 23,848.2 769.9 249.6 10,063.5 647.5 2,752.9 1,801.0 4,238.8 3,358.8 -33.72010 25,812.0 808.6 264.2 10,535.1 552.4 2,858.3 2,022.6 4,374.2 4,350.2 46.3
2011 Q2 25,483.2 819.7 339.0 10,666.8 545.9 3,026.6 2,086.1 4,130.8 3,857.5 10.9 Q3 27,052.7 831.2 261.5 10,790.2 549.0 3,048.3 2,183.8 4,222.8 5,182.3 -16.5
2011 Aug. 26,423.5 823.4 256.6 10,720.2 560.4 3,029.7 2,205.1 4,165.1 4,668.6 -5.6 Sep. 27,052.7 831.2 261.5 10,790.2 549.0 3,048.3 2,183.8 4,222.8 5,182.3 -16.5 Oct. 26,721.4 837.5 261.9 10,774.1 538.1 3,013.1 2,186.8 4,130.8 5,003.3 -24.2 Nov. (p) 26,722.2 841.4 265.1 10,737.3 550.5 3,032.4 2,200.4 4,154.6 4,959.7 -19.2
Transactions
2009 -633.9 45.8 -4.2 286.0 -12.5 -55.9 131.1 -589.3 -490.0 55.32010 600.2 38.6 11.8 331.6 -98.2 41.2 101.7 -25.4 164.1 34.7
2011 Q2 175.8 21.3 42.6 121.9 -21.9 34.4 29.1 -20.7 0.7 -31.7 Q3 1,379.5 11.5 -77.5 104.8 6.3 -16.6 49.6 -10.9 1,349.7 -37.2
2011 Aug. 559.7 -4.7 -60.4 62.3 21.9 -5.6 10.0 43.5 488.5 4.2 Sep. 553.0 7.7 4.9 58.0 -11.1 -10.5 2.2 -34.4 551.4 -15.3 Oct. -249.5 6.3 0.5 -7.5 -10.9 -15.9 1.7 -38.4 -179.8 -5.5 Nov. (p) -85.0 3.9 3.2 -46.9 12.6 -9.2 17.0 -42.5 -22.0 -1.1
Source: ECB.1) Data refer to the changing composition of the euro area. For further information, see the General Notes.2) In December 2010 a change was made to the recording practice for derivatives in one Member State, leading to an increase in this position.3) Amounts held by euro area residents.4) Amounts issued with a maturity of up to two years and held by non-euro area residents are included in external liabilities.
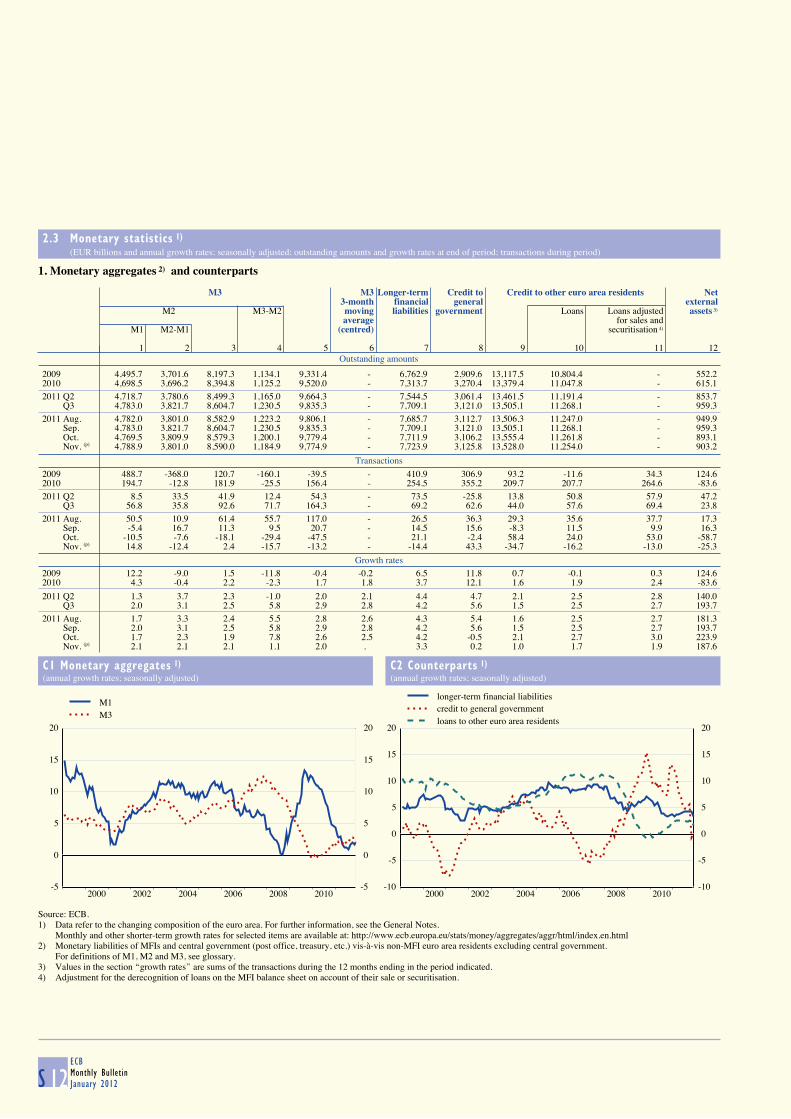
2.3 Monetary statistics 1) (EUR billions and annual growth rates; seasonally adjusted; outstanding amounts and growth rates at end of period; transactions during period)
S 12ECBMonthly BulletinJanuary 2012
1. Monetary aggregates 2) and counterparts
Outstanding amounts
M3 M3 Longer-term Credit to Credit to other euro area residents Net
3-month financial general external M2 M3-M2 moving liabilities government Loans Loans adjusted assets 3)
average for sales andM1 M2-M1 (centred) securitisation 4)
1 2 3 4 5 6 7 8 9 10 11 12
2009 4,495.7 3,701.6 8,197.3 1,134.1 9,331.4 - 6,762.9 2,909.6 13,117.5 10,804.4 - 552.22010 4,698.5 3,696.2 8,394.8 1,125.2 9,520.0 - 7,313.7 3,270.4 13,379.4 11,047.8 - 615.1
2011 Q2 4,718.7 3,780.6 8,499.3 1,165.0 9,664.3 - 7,544.5 3,061.4 13,461.5 11,191.4 - 853.7 Q3 4,783.0 3,821.7 8,604.7 1,230.5 9,835.3 - 7,709.1 3,121.0 13,505.1 11,268.1 - 959.3
2011 Aug. 4,782.0 3,801.0 8,582.9 1,223.2 9,806.1 - 7,685.7 3,112.7 13,506.3 11,247.0 - 949.9 Sep. 4,783.0 3,821.7 8,604.7 1,230.5 9,835.3 - 7,709.1 3,121.0 13,505.1 11,268.1 - 959.3 Oct. 4,769.5 3,809.9 8,579.3 1,200.1 9,779.4 - 7,711.9 3,106.2 13,555.4 11,261.8 - 893.1 Nov. (p) 4,788.9 3,801.0 8,590.0 1,184.9 9,774.9 - 7,723.9 3,125.8 13,528.0 11,254.0 - 903.2
Transactions
2009 488.7 -368.0 120.7 -160.1 -39.5 - 410.9 306.9 93.2 -11.6 34.3 124.62010 194.7 -12.8 181.9 -25.5 156.4 - 254.5 355.2 209.7 207.7 264.6 -83.6
2011 Q2 8.5 33.5 41.9 12.4 54.3 - 73.5 -25.8 13.8 50.8 57.9 47.2 Q3 56.8 35.8 92.6 71.7 164.3 - 69.2 62.6 44.0 57.6 69.4 23.8
2011 Aug. 50.5 10.9 61.4 55.7 117.0 - 26.5 36.3 29.3 35.6 37.7 17.3 Sep. -5.4 16.7 11.3 9.5 20.7 - 14.5 15.6 -8.3 11.5 9.9 16.3 Oct. -10.5 -7.6 -18.1 -29.4 -47.5 - 21.1 -2.4 58.4 24.0 53.0 -58.7 Nov. (p) 14.8 -12.4 2.4 -15.7 -13.2 - -14.4 43.3 -34.7 -16.2 -13.0 -25.3
Growth rates
2009 12.2 -9.0 1.5 -11.8 -0.4 -0.2 6.5 11.8 0.7 -0.1 0.3 124.62010 4.3 -0.4 2.2 -2.3 1.7 1.8 3.7 12.1 1.6 1.9 2.4 -83.6
2011 Q2 1.3 3.7 2.3 -1.0 2.0 2.1 4.4 4.7 2.1 2.5 2.8 140.0 Q3 2.0 3.1 2.5 5.8 2.9 2.8 4.2 5.6 1.5 2.5 2.7 193.7
2011 Aug. 1.7 3.3 2.4 5.5 2.8 2.6 4.3 5.4 1.6 2.5 2.7 181.3 Sep. 2.0 3.1 2.5 5.8 2.9 2.8 4.2 5.6 1.5 2.5 2.7 193.7 Oct. 1.7 2.3 1.9 7.8 2.6 2.5 4.2 -0.5 2.1 2.7 3.0 223.9 Nov. (p) 2.1 2.1 2.1 1.1 2.0 . 3.3 0.2 1.0 1.7 1.9 187.6
C1 Monetary aggregates 1)
(annual growth rates; seasonally adjusted)
C2 Counterparts 1)
(annual growth rates; seasonally adjusted)
-5
0
5
10
15
20
2000 2002 2004 2006 2008 2010-5
0
5
10
15
20
M1M3
-10
-5
0
5
10
15
20
2000 2002 2004 2006 2008 2010-10
-5
0
5
10
15
20
longer-term financial liabilitiescredit to general governmentloans to other euro area residents
Source: ECB.1) Data refer to the changing composition of the euro area. For further information, see the General Notes.
Monthly and other shorter-term growth rates for selected items are available at: http://www.ecb.europa.eu/stats/money/aggregates/aggr/html/index.en.html2) Monetary liabilities of MFIs and central government (post office, treasury, etc.) vis-à-vis non-MFI euro area residents excluding central government.
For definitions of M1, M2 and M3, see glossary.3) Values in the section ‘‘growth rates’’ are sums of the transactions during the 12 months ending in the period indicated.4) Adjustment for the derecognition of loans on the MFI balance sheet on account of their sale or securitisation.
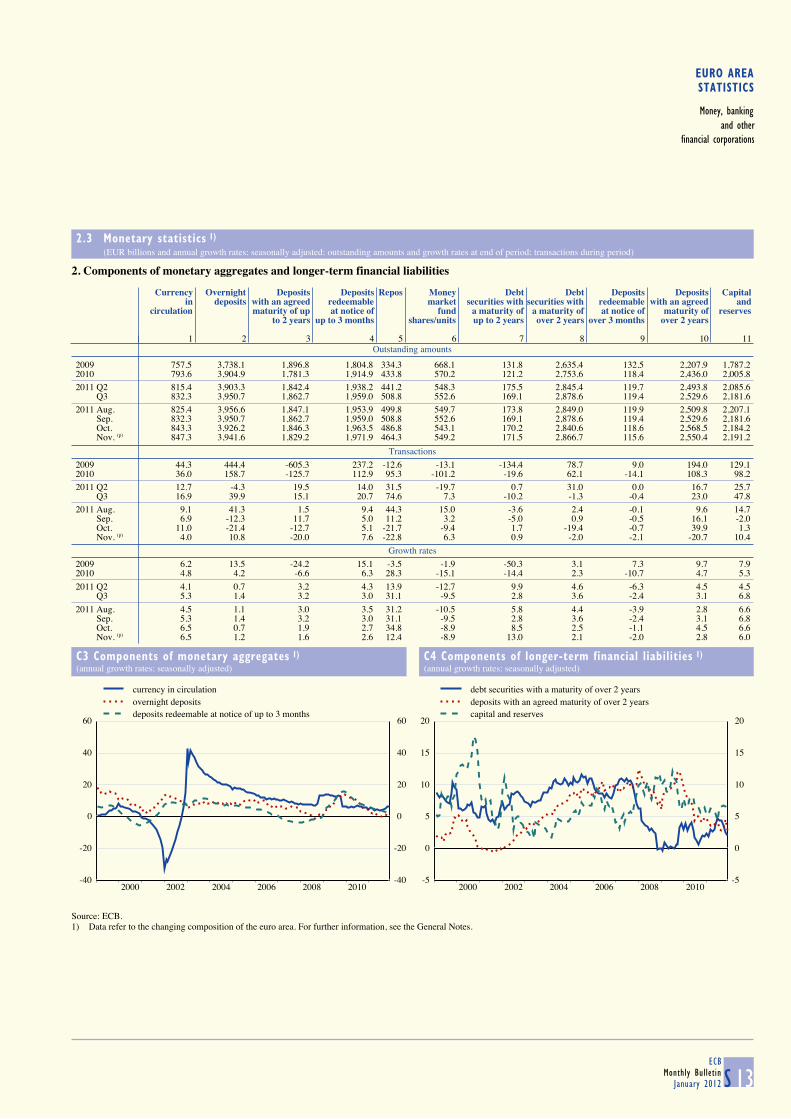
EURO AREASTATISTICS
Money, bankingand other
financial corporations
2.3 Monetary statistics 1) (EUR billions and annual growth rates; seasonally adjusted; outstanding amounts and growth rates at end of period; transactions during period)
S 13ECB
Monthly BulletinJanuary 2012
2. Components of monetary aggregates and longer-term financial liabilities
Outstanding amounts
Currency Overnight Deposits Deposits Repos Money Debt Debt Deposits Deposits Capitalin deposits with an agreed redeemable market securities with securities with redeemable with an agreed and
circulation maturity of up at notice of fund a maturity of a maturity of at notice of maturity of reservesto 2 years up to 3 months shares/units up to 2 years over 2 years over 3 months over 2 years
1 2 3 4 5 6 7 8 9 10 11
2009 757.5 3,738.1 1,896.8 1,804.8 334.3 668.1 131.8 2,635.4 132.5 2,207.9 1,787.22010 793.6 3,904.9 1,781.3 1,914.9 433.8 570.2 121.2 2,753.6 118.4 2,436.0 2,005.8
2011 Q2 815.4 3,903.3 1,842.4 1,938.2 441.2 548.3 175.5 2,845.4 119.7 2,493.8 2,085.6 Q3 832.3 3,950.7 1,862.7 1,959.0 508.8 552.6 169.1 2,878.6 119.4 2,529.6 2,181.6
2011 Aug. 825.4 3,956.6 1,847.1 1,953.9 499.8 549.7 173.8 2,849.0 119.9 2,509.8 2,207.1 Sep. 832.3 3,950.7 1,862.7 1,959.0 508.8 552.6 169.1 2,878.6 119.4 2,529.6 2,181.6 Oct. 843.3 3,926.2 1,846.3 1,963.5 486.8 543.1 170.2 2,840.6 118.6 2,568.5 2,184.2 Nov. (p) 847.3 3,941.6 1,829.2 1,971.9 464.3 549.2 171.5 2,866.7 115.6 2,550.4 2,191.2
Transactions
2009 44.3 444.4 -605.3 237.2 -12.6 -13.1 -134.4 78.7 9.0 194.0 129.12010 36.0 158.7 -125.7 112.9 95.3 -101.2 -19.6 62.1 -14.1 108.3 98.2
2011 Q2 12.7 -4.3 19.5 14.0 31.5 -19.7 0.7 31.0 0.0 16.7 25.7 Q3 16.9 39.9 15.1 20.7 74.6 7.3 -10.2 -1.3 -0.4 23.0 47.8
2011 Aug. 9.1 41.3 1.5 9.4 44.3 15.0 -3.6 2.4 -0.1 9.6 14.7 Sep. 6.9 -12.3 11.7 5.0 11.2 3.2 -5.0 0.9 -0.5 16.1 -2.0 Oct. 11.0 -21.4 -12.7 5.1 -21.7 -9.4 1.7 -19.4 -0.7 39.9 1.3 Nov. (p) 4.0 10.8 -20.0 7.6 -22.8 6.3 0.9 -2.0 -2.1 -20.7 10.4
Growth rates
2009 6.2 13.5 -24.2 15.1 -3.5 -1.9 -50.3 3.1 7.3 9.7 7.92010 4.8 4.2 -6.6 6.3 28.3 -15.1 -14.4 2.3 -10.7 4.7 5.3
2011 Q2 4.1 0.7 3.2 4.3 13.9 -12.7 9.9 4.6 -6.3 4.5 4.5 Q3 5.3 1.4 3.2 3.0 31.1 -9.5 2.8 3.6 -2.4 3.1 6.8
2011 Aug. 4.5 1.1 3.0 3.5 31.2 -10.5 5.8 4.4 -3.9 2.8 6.6 Sep. 5.3 1.4 3.2 3.0 31.1 -9.5 2.8 3.6 -2.4 3.1 6.8 Oct. 6.5 0.7 1.9 2.7 34.8 -8.9 8.5 2.5 -1.1 4.5 6.6 Nov. (p) 6.5 1.2 1.6 2.6 12.4 -8.9 13.0 2.1 -2.0 2.8 6.0
C3 Components of monetary aggregates 1)
(annual growth rates; seasonally adjusted)
C4 Components of longer-term financial liabilities 1)
(annual growth rates; seasonally adjusted)
-40
-20
0
20
40
60
2000 2002 2004 2006 2008 2010-40
-20
0
20
40
60
currency in circulationovernight depositsdeposits redeemable at notice of up to 3 months
-5
0
5
10
15
20
2000 2002 2004 2006 2008 2010-5
0
5
10
15
20
debt securities with a maturity of over 2 yearsdeposits with an agreed maturity of over 2 yearscapital and reserves
Source: ECB.1) Data refer to the changing composition of the euro area. For further information, see the General Notes.

2.4 MFI loans: breakdown 1), 2) (EUR billions and annual growth rates; seasonally adjusted; outstanding amounts and growth rates at end of period; transactions during period)
S 14ECBMonthly BulletinJanuary 2012
1. Loans to financial intermediaries, non-financial corporations and households
Outstanding amounts
Insurance Other Non-financial corporations Households 3)
corporations financial and pension inter-
funds mediaries
Total Total Total TotalUp to Over 1 Over Consumer Loans Other
Loans adjusted 1 year and up to 5 years Loans adjusted credit for house loansfor sales and 5 years for sales and purchase
securitisation 4) securitisation 4)
1 2 3 4 5 6 7 8 9 10 11 12
2009 89.0 1,072.3 4,690.9 - 1,187.8 937.6 2,565.5 4,952.2 - 631.3 3,546.6 774.32010 95.0 1,126.4 4,667.2 - 1,127.3 899.0 2,640.9 5,159.3 - 639.3 3,701.3 818.7
2011 Q2 88.8 1,114.3 4,729.2 - 1,175.8 867.3 2,686.1 5,259.1 - 629.4 3,796.5 833.2 Q3 97.0 1,140.7 4,761.0 - 1,178.0 870.3 2,712.6 5,269.4 - 627.6 3,806.2 835.6
2011 Aug. 99.1 1,148.9 4,735.2 - 1,168.5 867.8 2,699.0 5,263.7 - 629.8 3,798.2 835.7 Sep. 97.0 1,140.7 4,761.0 - 1,178.0 870.3 2,712.6 5,269.4 - 627.6 3,806.2 835.6 Oct. 93.7 1,176.6 4,760.6 - 1,180.7 868.0 2,711.9 5,230.9 - 626.7 3,768.6 835.6 Nov. (p) 93.2 1,162.9 4,757.7 - 1,176.9 865.6 2,715.2 5,240.1 - 626.0 3,777.9 836.2
Transactions
2009 -13.6 43.6 -106.7 -107.9 -181.1 -18.9 93.4 65.1 99.5 -1.0 51.4 14.72010 7.0 55.7 -2.1 45.7 -37.5 -26.2 61.6 147.1 155.7 -7.6 133.7 21.0
2011 Q2 1.0 -7.9 27.0 29.7 30.9 -17.1 13.2 30.6 34.4 -7.1 29.1 8.6 Q3 8.1 19.2 24.2 25.0 -0.7 1.4 23.4 6.1 17.6 -3.1 7.8 1.5
2011 Aug. 8.1 10.1 9.7 9.9 1.6 1.2 7.0 7.7 9.7 1.0 5.8 1.0 Sep. -2.1 -11.7 18.5 18.5 6.9 2.2 9.5 6.8 5.6 -0.7 7.6 -0.1 Oct. -3.2 38.0 7.0 8.6 4.6 -0.3 2.7 -17.7 9.7 -0.9 -17.7 0.9 Nov. (p) -0.6 -16.9 -7.2 -6.7 -5.5 -2.9 1.2 8.4 11.5 -0.5 8.2 0.7
Growth rates
2009 -13.2 4.4 -2.2 - -13.1 -2.0 3.8 1.3 - -0.2 1.5 1.92010 8.0 5.1 0.0 1.0 -3.2 -2.8 2.4 2.9 3.1 -1.2 3.8 2.7
2011 Q2 5.7 3.4 1.4 2.3 4.2 -3.7 2.0 3.3 3.0 -1.8 4.4 2.5 Q3 9.8 4.5 1.6 2.2 4.0 -3.7 2.4 2.9 2.6 -1.9 3.9 2.3
2011 Aug. 9.8 4.3 1.5 2.1 4.0 -3.5 2.1 2.9 2.7 -2.0 3.9 2.3 Sep. 9.8 4.5 1.6 2.2 4.0 -3.7 2.4 2.9 2.6 -1.9 3.9 2.3 Oct. 5.7 8.5 1.8 2.2 4.6 -3.2 2.4 2.2 2.5 -1.9 3.0 2.2 Nov. (p) 1.4 0.4 1.6 1.8 3.8 -3.1 2.2 2.1 2.3 -2.2 3.0 1.6
C5 Loans to other financial intermediaries and non-financial
corporations 2) (annual growth rates; not seasonally adjusted)
C6 Loans to households 2)
(annual growth rates; not seasonally adjusted)
-5
0
5
10
15
20
25
30
2000 2002 2004 2006 2008 2010-5
0
5
10
15
20
25
30
other financial intermediariesnon-financial corporations
-5
0
5
10
15
2000 2002 2004 2006 2008 2010-5
0
5
10
15
consumer creditloans for house purchaseother loans
Source: ECB.1) MFI sector excluding the Eurosystem; sectoral classification is based on the ESA 95.2) Data refer to the changing composition of the euro area. For further information, see the General Notes.3) Including non-profit institutions serving households.4) Adjustment for the derecognition of loans on the MFI balance sheet on account of their sale or securitisation.

EURO AREASTATISTICS
Money, bankingand other
financial corporations
2.4 MFI loans: breakdown 1), 2) (EUR billions and annual growth rates; not seasonally adjusted; outstanding amounts and growth rates at end of period; transactions during period)
S 15ECB
Monthly BulletinJanuary 2012
2. Loans to financial intermediaries and non-financial corporations
Outstanding amounts
Insurance corporations and pension funds Other financial intermediaries Non-financial corporations
Total Up to Over 1 Over Total Up to Over 1 Over Total Up to Over 1 Over
1 year and up to 5 years 1 year and up to 5 years 1 year and up to 5 years5 years Reverse repos 5 years 5 years
to centralcounterparties
1 2 3 4 5 6 7 8 9 10 11 12 13
2010 86.2 66.6 5.2 14.4 1,104.7 142.9 587.7 206.4 310.6 4,667.2 1,120.6 898.6 2,648.0
2011 Q2 91.1 71.2 5.6 14.2 1,129.3 153.1 601.4 203.6 324.3 4,737.3 1,185.1 868.6 2,683.7 Q3 98.3 78.8 5.2 14.2 1,168.0 178.1 631.3 207.4 329.3 4,754.9 1,176.5 870.6 2,707.7
2011 Sep. 98.3 78.8 5.2 14.2 1,168.0 178.1 631.3 207.4 329.3 4,754.9 1,176.5 870.6 2,707.7 Oct. 95.3 76.1 5.3 13.8 1,187.1 212.2 648.4 206.4 332.3 4,750.8 1,174.3 868.3 2,708.2 Nov. (p) 93.6 74.5 5.4 13.8 1,161.7 186.8 612.9 214.8 334.0 4,759.0 1,178.7 865.1 2,715.2
Transactions
2010 6.8 10.1 -1.8 -1.5 54.5 - 17.9 7.1 29.5 -2.3 -37.7 -26.2 61.5
2011 Q2 4.2 4.6 -0.1 -0.3 16.2 15.6 14.9 -5.0 6.2 36.1 39.3 -15.9 12.7 Q3 7.1 7.5 -0.4 0.0 31.5 25.1 26.7 1.5 3.3 10.0 -11.4 0.4 21.0
2011 Sep. -1.5 -1.3 -0.1 0.0 11.9 3.3 10.9 0.4 0.7 26.2 17.4 3.4 5.4 Oct. -3.0 -2.7 0.1 -0.4 21.2 34.1 18.8 -0.4 2.8 3.3 -0.2 -0.4 3.8 Nov. (p) -1.7 -1.7 0.0 -0.1 -28.6 -25.4 -37.3 8.0 0.8 3.8 2.6 -3.6 4.8
Growth rates
2010 8.5 17.5 -25.4 -9.1 5.0 - 2.9 3.2 10.4 0.0 -3.2 -2.8 2.4
2011 Q2 5.7 11.1 3.3 -15.9 3.5 21.2 2.6 -3.3 10.1 1.4 4.2 -3.7 2.0 Q3 9.9 15.2 -6.6 -8.1 4.5 20.1 6.4 -4.5 7.1 1.6 4.1 -3.7 2.3
2011 Sep. 9.9 15.2 -6.6 -8.1 4.5 20.1 6.4 -4.5 7.1 1.6 4.1 -3.7 2.3 Oct. 5.7 11.1 -4.8 -14.2 8.6 58.5 14.3 -4.4 7.0 1.8 4.6 -3.2 2.4 Nov. (p) 1.2 4.6 -6.8 -11.4 0.4 8.9 -1.6 -1.4 5.6 1.6 3.8 -3.1 2.2
3. Loans to households 3)
Outstanding amounts
Total Consumer credit Loans for house purchase Other loans
Total Up to Over 1 Over Total Up to Over 1 Over Total Up to Over 1 Over
1 year and up to 5 years 1 year and up to 5 years 1 year and up to 5 years5 years 5 years Sole 5 years
proprietors1 2 3 4 5 6 7 8 9 10 11 12 13 14
2010 5,168.0 641.7 147.0 186.5 308.2 3,706.9 14.7 54.9 3,637.2 819.4 402.4 146.7 85.7 587.0
2011 Q2 5,266.2 633.0 141.9 185.3 305.7 3,794.7 14.6 55.2 3,724.9 838.6 404.2 152.1 87.0 599.4 Q3 5,275.3 629.7 138.6 186.3 304.8 3,810.3 14.5 56.7 3,739.1 835.4 409.7 147.5 87.9 600.0
2011 Sep. 5,275.3 629.7 138.6 186.3 304.8 3,810.3 14.5 56.7 3,739.1 835.4 409.7 147.5 87.9 600.0 Oct. 5,233.9 629.2 138.8 185.1 305.2 3,771.5 14.4 56.5 3,700.5 833.3 408.2 145.8 87.4 600.0 Nov. (p) 5,242.0 627.2 137.7 184.8 304.7 3,775.3 14.3 56.8 3,704.1 839.5 410.0 150.5 87.3 601.7
Transactions
2010 147.4 -7.7 -4.8 -8.8 5.9 134.2 -0.6 -3.7 138.5 20.9 - -6.9 -4.5 32.3
2011 Q2 47.7 -0.2 2.5 -2.0 -0.8 32.9 0.5 1.1 31.3 15.1 1.8 5.1 0.2 9.8 Q3 4.9 -4.6 -2.4 -0.8 -1.4 13.6 -0.1 1.3 12.5 -4.1 -1.3 -5.8 -0.8 2.6
2011 Sep. 12.4 0.5 -1.5 1.1 1.0 10.4 -0.2 0.3 10.3 1.5 -0.2 1.4 -0.2 0.2 Oct. -20.6 -0.6 0.0 -0.7 0.1 -18.9 -0.1 0.1 -19.0 -1.2 -1.4 -1.5 -0.3 0.6 Nov. (p) 7.3 -1.8 -1.1 -0.3 -0.4 2.7 -0.2 0.3 2.5 6.4 1.6 4.6 -0.1 1.9
Growth rates
2010 3.0 -1.2 -3.5 -4.5 2.0 3.8 -4.2 -6.2 4.0 2.7 - -4.6 -5.1 5.9
2011 Q2 3.3 -1.8 -2.6 -5.0 0.6 4.4 0.0 2.6 4.4 2.5 0.4 0.6 -3.3 3.9 Q3 2.9 -1.9 -2.0 -3.6 -0.8 3.9 -2.5 0.6 4.0 2.3 0.0 -0.1 -3.7 3.8
2011 Sep. 2.9 -1.9 -2.0 -3.6 -0.8 3.9 -2.5 0.6 4.0 2.3 0.0 -0.1 -3.7 3.8 Oct. 2.2 -1.9 -1.9 -3.8 -0.7 3.0 -2.4 0.4 3.0 2.2 0.1 0.7 -3.2 3.4 Nov. (p) 2.1 -2.2 -3.4 -3.7 -0.7 3.0 -4.0 0.4 3.0 1.6 -0.6 -1.4 -3.4 3.2
Source: ECB.1) MFI sector excluding the Eurosystem; sectoral classification is based on the ESA 95.2) Data refer to the changing composition of the euro area. For further information, see the General Notes.3) Including non-profit institutions serving households.
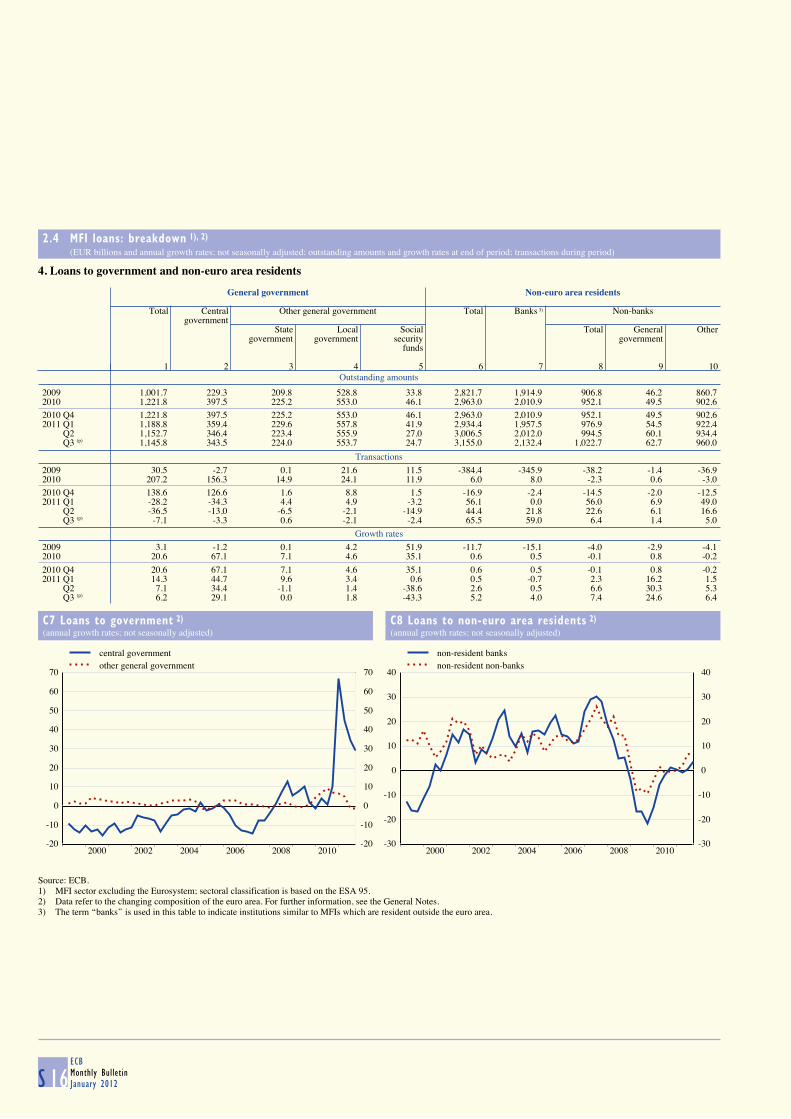
2.4 MFI loans: breakdown 1), 2) (EUR billions and annual growth rates; not seasonally adjusted; outstanding amounts and growth rates at end of period; transactions during period)
S 16ECBMonthly BulletinJanuary 2012
4. Loans to government and non-euro area residents
Outstanding amounts
General government Non-euro area residents
Total Central Other general government Total Banks 3) Non-banks
governmentState Local Social Total General Other
government government security governmentfunds
1 2 3 4 5 6 7 8 9 10
2009 1,001.7 229.3 209.8 528.8 33.8 2,821.7 1,914.9 906.8 46.2 860.72010 1,221.8 397.5 225.2 553.0 46.1 2,963.0 2,010.9 952.1 49.5 902.6
2010 Q4 1,221.8 397.5 225.2 553.0 46.1 2,963.0 2,010.9 952.1 49.5 902.62011 Q1 1,188.8 359.4 229.6 557.8 41.9 2,934.4 1,957.5 976.9 54.5 922.4 Q2 1,152.7 346.4 223.4 555.9 27.0 3,006.5 2,012.0 994.5 60.1 934.4 Q3 (p) 1,145.8 343.5 224.0 553.7 24.7 3,155.0 2,132.4 1,022.7 62.7 960.0
Transactions
2009 30.5 -2.7 0.1 21.6 11.5 -384.4 -345.9 -38.2 -1.4 -36.92010 207.2 156.3 14.9 24.1 11.9 6.0 8.0 -2.3 0.6 -3.0
2010 Q4 138.6 126.6 1.6 8.8 1.5 -16.9 -2.4 -14.5 -2.0 -12.52011 Q1 -28.2 -34.3 4.4 4.9 -3.2 56.1 0.0 56.0 6.9 49.0 Q2 -36.5 -13.0 -6.5 -2.1 -14.9 44.4 21.8 22.6 6.1 16.6 Q3 (p) -7.1 -3.3 0.6 -2.1 -2.4 65.5 59.0 6.4 1.4 5.0
Growth rates
2009 3.1 -1.2 0.1 4.2 51.9 -11.7 -15.1 -4.0 -2.9 -4.12010 20.6 67.1 7.1 4.6 35.1 0.6 0.5 -0.1 0.8 -0.2
2010 Q4 20.6 67.1 7.1 4.6 35.1 0.6 0.5 -0.1 0.8 -0.22011 Q1 14.3 44.7 9.6 3.4 0.6 0.5 -0.7 2.3 16.2 1.5 Q2 7.1 34.4 -1.1 1.4 -38.6 2.6 0.5 6.6 30.3 5.3 Q3 (p) 6.2 29.1 0.0 1.8 -43.3 5.2 4.0 7.4 24.6 6.4
C7 Loans to government 2)
(annual growth rates; not seasonally adjusted)
C8 Loans to non-euro area residents 2)
(annual growth rates; not seasonally adjusted)
-20
-10
0
10
20
30
40
50
60
70
2000 2002 2004 2006 2008 2010-20
-10
0
10
20
30
40
50
60
70
central governmentother general government
-30
-20
-10
0
10
20
30
40
2000 2002 2004 2006 2008 2010-30
-20
-10
0
10
20
30
40
non-resident banksnon-resident non-banks
Source: ECB.1) MFI sector excluding the Eurosystem; sectoral classification is based on the ESA 95.2) Data refer to the changing composition of the euro area. For further information, see the General Notes.3) The term ‘‘banks’’ is used in this table to indicate institutions similar to MFIs which are resident outside the euro area.

EURO AREASTATISTICS
Money, bankingand other
financial corporations
2.5 Deposits held with MFIs: breakdown 1), 2) (EUR billions and annual growth rates; outstanding amounts and growth rates at end of period; transactions during period)
S 17ECB
Monthly BulletinJanuary 2012
1. Deposits by financial intermediaries
Outstanding amounts
Insurance corporations and pension funds Other financial intermediaries
Total Overnight With an agreed Redeemable Repos Total Overnight With an agreed Redeemable Repos
maturity of: at notice of: maturity of: at notice of:
Up to Over 2 Up to Over Up to Over Up to Over With2 years years 3 months 3 months 2 years 2 years 3 months 3 months central
counter-parties
1 2 3 4 5 6 7 8 9 10 11 12 13 14 15
2009 738.5 84.1 86.9 543.7 2.2 1.4 20.2 1,871.2 311.7 335.1 957.5 15.9 0.0 250.9 - 2010 716.9 84.6 79.3 528.3 2.6 0.3 21.9 2,168.3 358.5 305.7 1,132.6 10.7 0.5 360.3 255.0
2011 Q2 703.4 84.6 72.1 524.0 3.2 0.2 19.3 2,216.9 370.0 297.0 1,152.4 12.5 0.3 384.8 290.8 Q3 721.6 88.4 88.6 520.2 3.6 0.2 20.6 2,309.5 382.6 305.2 1,167.4 11.4 0.5 442.4 338.7
2011 Aug. 718.0 87.1 82.6 523.3 3.7 0.2 21.1 2,256.8 370.4 305.3 1,151.9 11.7 0.5 417.0 315.0 Sep. 721.6 88.4 88.6 520.2 3.6 0.2 20.6 2,309.5 382.6 305.2 1,167.4 11.4 0.5 442.4 338.7 Oct. 724.1 93.2 87.8 520.3 3.8 0.2 18.7 2,295.9 382.0 292.9 1,187.9 10.9 0.4 421.7 325.4 Nov. (p) 709.3 88.3 79.8 518.0 4.0 0.2 19.0 2,273.7 396.1 289.3 1,181.6 12.6 0.4 393.7 303.9
Transactions
2009 -26.8 -1.0 -30.4 6.3 1.1 -0.1 -2.7 55.4 5.5 -93.6 85.8 3.7 0.0 54.0 - 2010 -26.5 -3.3 -8.4 -16.6 0.2 0.0 1.6 156.9 45.1 -37.6 52.8 -8.0 0.4 104.2 -
2011 Q2 -2.6 1.7 -3.1 -2.7 0.3 0.0 1.3 39.5 -1.7 -6.8 3.0 0.7 -0.3 44.6 50.2 Q3 17.5 3.3 16.4 -3.9 0.4 0.0 1.3 86.3 10.3 5.0 7.3 -1.1 0.2 64.7 48.6
2011 Aug. 10.3 4.3 7.1 0.0 0.0 0.0 -1.0 65.6 11.0 4.4 4.4 0.2 0.2 45.4 32.8 Sep. 3.1 0.9 6.0 -3.2 0.0 0.0 -0.5 46.2 10.1 -3.1 12.0 -0.4 0.0 27.6 24.3 Oct. 4.7 5.0 -0.7 0.1 0.1 0.0 0.2 -9.2 0.7 -10.4 21.4 -0.5 0.0 -20.4 -13.2 Nov. (p) -12.3 -5.1 -5.1 -2.3 0.2 0.0 -0.1 -30.8 12.5 -8.1 -8.7 1.7 0.0 -28.2 -21.7
Growth rates
2009 -3.5 -1.1 -26.4 1.2 96.8 - -11.8 3.1 1.5 -22.0 10.0 30.1 - 27.4 - 2010 -3.6 -3.4 -9.6 -3.0 9.7 - 7.8 8.1 14.4 -11.1 4.9 -48.5 - 41.1 -
2011 Q2 -3.7 -5.7 -10.6 -2.2 26.4 - -6.6 5.4 1.1 1.4 4.7 5.4 - 15.8 33.1 Q3 -0.5 4.3 3.6 -2.3 28.7 - 8.1 6.7 1.5 -1.3 2.6 2.8 - 33.8 47.4
2011 Aug. -1.3 2.3 -5.9 -1.9 38.3 - 17.4 6.0 1.6 -1.4 1.6 5.0 - 33.9 43.5 Sep. -0.5 4.3 3.6 -2.3 28.7 - 8.1 6.7 1.5 -1.3 2.6 2.8 - 33.8 47.4 Oct. 0.9 10.2 6.9 -1.7 37.2 - 2.1 7.6 3.3 -9.6 5.3 -3.0 - 39.3 58.9 Nov. (p) 0.6 4.3 8.9 -1.7 45.1 - 9.4 2.0 3.9 -11.6 1.7 18.7 - 13.0 17.2
C9 Total deposits by sector 2)
(annual growth rates)
C10 Total deposits and deposits included in M3
by sector 2) (annual growth rates)
-10
0
10
20
30
40
2000 2002 2004 2006 2008 2010-10
0
10
20
30
40
insurance corporations and pension funds (total)other financial intermediaries (total)
-20
-10
0
10
20
30
40
2004 2005 2006 2007 2008 2009 2010 2011-20
-10
0
10
20
30
40
insurance corporations and pension funds (total)other financial intermediaries (total)insurance corporations and pension funds (included in M3)other financial intermediaries (included in M3)
Source: ECB.1) MFI sector excluding the Eurosystem; sectoral classification is based on the ESA 95.2) Data refer to the changing composition of the euro area. For further information, see the General Notes.3) Covers deposits in columns 2, 3, 5 and 7.4) Covers deposits in columns 9, 10, 12 and 14.
3)
4)

2.5 Deposits held with MFIs: breakdown 1), 2) (EUR billions and annual growth rates; outstanding amounts and growth rates at end of period; transactions during period)
S 18ECBMonthly BulletinJanuary 2012
2. Deposits by non-financial corporations and households
Outstanding amounts
Non-financial corporations Households 3)
TotalOvernight With an agreed maturity of: Redeemable at notice of: Repos TotalOvernight With an agreed maturity of: Redeemable at notice of: Repos
Up to Over 2 Up to Over Up to Over Up to Over2 years years 3 months 3 months 2 years 2 years 3 months 3 months
1 2 3 4 5 6 7 8 9 10 11 12 13 14
2009 1,601.2 999.2 434.5 80.7 68.7 1.7 16.3 5,601.7 2,156.9 996.5 607.1 1,680.2 123.7 37.32010 1,670.7 1,036.4 455.5 87.2 75.8 1.5 14.2 5,739.1 2,244.5 901.0 665.0 1,788.5 110.3 29.8
2011 Q2 1,657.4 1,013.4 453.9 94.8 77.3 2.0 15.8 5,822.9 2,258.3 904.4 701.2 1,816.1 109.4 33.5 Q3 1,663.6 999.2 471.0 96.7 76.5 1.7 18.5 5,835.4 2,240.4 921.9 709.8 1,820.6 109.0 33.9
2011 Aug. 1,654.0 995.9 464.5 95.1 77.4 1.7 19.5 5,830.5 2,236.3 918.6 707.0 1,824.2 109.4 35.1 Sep. 1,663.6 999.2 471.0 96.7 76.5 1.7 18.5 5,835.4 2,240.4 921.9 709.8 1,820.6 109.0 33.9 Oct. 1,663.8 998.3 472.1 97.3 74.5 2.0 19.6 5,833.7 2,234.6 925.7 712.0 1,820.2 108.8 32.3 Nov. (p) 1,660.3 1,001.4 460.9 97.6 78.9 1.9 19.6 5,824.9 2,223.2 934.9 713.0 1,815.7 107.2 30.8
Transactions
2009 91.0 112.3 -70.2 15.1 40.8 0.4 -7.4 187.7 320.5 -371.5 85.9 190.5 8.6 -46.32010 78.1 40.3 23.2 9.0 7.8 -0.2 -2.1 132.9 81.7 -98.9 58.7 113.6 -14.6 -7.5
2011 Q2 11.6 12.1 -5.2 4.0 -0.9 0.0 1.5 55.9 35.1 -2.0 18.8 2.7 -0.9 2.1 Q3 2.9 -17.3 17.1 1.8 -0.9 -0.4 2.6 4.6 -19.0 15.6 3.7 4.4 -0.4 0.4
2011 Aug. 0.4 -7.3 6.5 -0.4 0.9 -0.3 0.9 -19.6 -25.6 4.7 -2.9 4.4 -0.1 -0.2 Sep. 6.9 0.6 6.8 1.5 -0.9 -0.1 -1.0 2.8 3.2 2.2 2.8 -3.8 -0.4 -1.2 Oct. 2.8 0.6 2.0 0.7 -1.9 0.3 1.1 -0.6 -5.7 4.4 2.2 0.2 -0.1 -1.6 Nov. (p) -6.3 0.8 -11.9 0.1 4.8 -0.1 0.0 -10.2 -12.1 8.6 1.0 -5.6 -0.7 -1.5
Growth rates
2009 6.0 12.7 -13.9 23.1 146.6 28.3 -31.2 3.5 17.5 -27.1 16.5 12.8 7.5 -55.42010 4.9 4.1 5.3 11.2 11.4 -10.1 -12.8 2.4 3.8 -9.9 9.7 6.8 -11.7 -20.2
2011 Q2 5.0 1.6 11.6 16.7 2.3 -1.5 6.0 2.8 1.3 -0.1 8.4 4.6 -6.4 10.2 Q3 3.2 0.3 8.3 12.0 -2.5 -19.9 31.2 2.9 1.5 2.4 7.5 3.4 -1.7 8.0
2011 Aug. 3.8 0.9 8.6 13.8 -1.7 -16.1 37.4 2.8 1.1 1.9 7.4 3.8 -3.2 10.2 Sep. 3.2 0.3 8.3 12.0 -2.5 -19.9 31.2 2.9 1.5 2.4 7.5 3.4 -1.7 8.0 Oct. 2.6 0.5 5.2 12.7 -4.4 -3.4 44.7 2.5 0.5 2.8 7.4 3.2 -0.6 4.8 Nov. (p) 1.6 0.0 3.2 11.8 -1.5 -2.8 17.2 2.6 0.8 3.9 7.4 2.7 -1.7 3.4
C11 Total deposits by sector 2)
(annual growth rates)
C12 Total deposits and deposits included in M3
by sector 2) (annual growth rates)
-2
0
2
4
6
8
10
12
14
2000 2002 2004 2006 2008 2010-2
0
2
4
6
8
10
12
14
non-financial corporations (total)households (total)
-5
0
5
10
15
20
2004 2005 2006 2007 2008 2009 2010 2011-5
0
5
10
15
20
non-financial corporations (total)households (total)non-financial corporations (included in M3)households (included in M3)
Source: ECB.1) MFI sector excluding the Eurosystem; sectoral classification is based on the ESA 95.2) Data refer to the changing composition of the euro area. For further information, see the General Notes.3) Including non-profit institutions serving households.4) Covers deposits in columns 2, 3, 5 and 7.5) Covers deposits in columns 9, 10, 12 and 14.
4)
5)

EURO AREASTATISTICS
Money, bankingand other
financial corporations
2.5 Deposits held with MFIs: breakdown 1), 2) (EUR billions and annual growth rates; outstanding amounts and growth rates at end of period; transactions during period)
S 19ECB
Monthly BulletinJanuary 2012
3. Deposits by government and non-euro area residents
Outstanding amounts
General government Non-euro area residents
Total Central Other general government Total Banks 3) Non-banks
governmentState Local Social Total General Other
government government security governmentfunds
1 2 3 4 5 6 7 8 9 10
2009 374.9 146.0 43.4 114.3 71.2 3,369.4 2,532.8 836.7 56.7 780.02010 427.6 196.2 47.7 109.6 74.1 3,488.8 2,492.0 996.9 45.9 950.9
2010 Q4 427.6 196.2 47.7 109.6 74.1 3,488.8 2,492.0 996.9 45.9 950.92011 Q1 475.6 235.8 52.3 108.7 78.8 3,314.1 2,346.8 967.4 41.4 926.0 Q2 521.5 266.4 55.0 112.6 87.5 3,280.6 2,295.8 984.8 47.7 937.1 Q3 (p) 464.8 211.4 54.3 111.4 87.8 3,346.4 2,298.8 1,047.6 50.0 997.7
Transactions
2009 -62.8 -36.2 -8.7 -2.5 -15.0 -329.9 -274.8 -55.0 -4.5 -50.52010 50.0 47.4 4.3 -4.9 2.9 0.2 -84.4 84.6 7.5 77.1
2010 Q4 5.4 19.3 -11.0 -2.3 -0.5 -102.8 -108.3 5.5 -2.7 8.22011 Q1 50.4 43.4 4.7 -2.4 4.7 -77.2 -71.7 -5.6 -3.6 -1.9 Q2 45.7 30.9 2.7 3.9 8.2 -19.8 -41.6 21.8 6.4 15.4 Q3 (p) -56.9 -55.1 -1.0 -1.2 0.2 0.4 -49.4 49.7 1.4 48.4
Growth rates
2009 -14.1 -18.9 -16.7 -2.1 -17.4 -8.7 -9.7 -6.2 -6.9 -6.12010 13.3 32.2 9.9 -4.3 4.1 0.3 -3.3 9.9 12.7 9.6
2010 Q4 13.3 32.2 9.9 -4.3 4.1 0.3 -3.3 9.9 12.7 9.62011 Q1 19.2 41.4 4.0 -1.3 9.2 -4.7 -7.8 3.4 -10.5 4.2 Q2 26.8 61.3 1.2 -2.5 14.0 -5.1 -8.3 3.2 5.0 3.1 Q3 (p) 10.5 21.6 -7.8 -1.8 17.0 -5.5 -10.5 7.4 3.3 7.6
C13 Deposits by government and non-euro area residents 2)
(annual growth rates)
-20
-15
-10
-5
0
5
10
15
20
25
30
1999 2000 2001 2002 2003 2004 2005 2006 2007 2008 2009 2010 2011-20
-15
-10
-5
0
5
10
15
20
25
30
general governmentnon-resident banksnon-resident non-banks
Source: ECB.1) MFI sector excluding the Eurosystem; sectoral classification is based on the ESA 95.2) Data refer to the changing composition of the euro area. For further information, see the General Notes.3) The term ‘‘banks’’ is used in this table to indicate institutions similar to MFIs which are resident outside the euro area.

2.6 MFI holdings of securities: breakdown 1), 2) (EUR billions and annual growth rates; outstanding amounts and growth rates at end of period; transactions during period)
S 20ECBMonthly BulletinJanuary 2012
Outstanding amounts
Securities other than shares Shares and other equity
Total MFIs General Other euro Non-euro area Total MFIs Non-MFIs Non-euro area
government area residents residents residents
Euro Non-euro Euro Non-euro Euro Non-euro
1 2 3 4 5 6 7 8 9 10 11 12
2009 6,207.8 1,970.8 109.1 1,466.1 16.0 1,458.6 39.4 1,147.8 1,516.3 435.0 801.0 280.22010 5,993.1 1,778.4 107.4 1,507.8 16.4 1,500.8 27.8 1,054.5 1,535.9 445.3 787.8 302.8
2011 Q2 5,663.4 1,669.6 90.7 1,436.9 20.7 1,448.0 24.2 973.1 1,563.3 476.0 775.5 311.8 Q3 5,635.3 1,706.9 92.8 1,393.8 22.3 1,433.2 25.0 961.2 1,530.5 489.3 740.6 300.5
2011 Aug. 5,611.5 1,690.2 85.2 1,406.3 23.8 1,442.1 27.1 936.8 1,535.3 481.2 753.1 300.9 Sep. 5,635.3 1,706.9 92.8 1,393.8 22.3 1,433.2 25.0 961.2 1,530.5 489.3 740.6 300.5 Oct. 5,653.5 1,709.9 93.0 1,371.7 21.9 1,493.4 24.9 938.7 1,522.6 487.3 739.2 296.1 Nov. (p) 5,653.3 1,707.3 97.4 1,360.6 21.9 1,498.0 26.7 941.5 1,521.3 486.5 741.4 293.4
Transactions
2009 354.9 83.5 16.6 231.0 -3.2 103.0 -12.0 -64.0 42.9 29.1 11.6 2.32010 -268.6 -167.1 -6.9 42.8 -2.0 10.2 -14.8 -130.8 54.4 28.2 5.2 20.9
2011 Q2 -29.0 -33.8 6.3 45.5 1.0 -18.1 -3.6 -26.3 44.7 36.7 -3.2 11.2 Q3 -48.5 37.0 0.3 -43.4 0.3 -7.1 -0.7 -34.9 -13.6 17.2 -23.2 -7.6
2011 Aug. -13.0 32.7 -3.4 -18.7 3.5 -6.8 2.8 -23.1 -16.0 1.9 -8.8 -9.2 Sep. -0.8 17.0 4.2 -10.8 -2.5 -6.0 -3.3 0.7 -2.4 8.8 -12.0 0.8 Oct. 19.4 1.3 2.3 -15.6 0.2 40.5 0.6 -10.0 -10.0 -2.0 -3.9 -4.2 Nov. (p) -3.8 3.5 1.9 1.4 -0.8 3.8 0.9 -14.5 3.1 0.2 4.3 -1.5
Growth rates
2009 6.0 4.4 17.5 18.7 -15.9 7.6 -23.1 -5.3 2.9 7.0 1.5 0.82010 -4.3 -8.5 -5.5 2.9 -11.1 0.7 -35.4 -11.1 3.6 6.5 0.6 7.5
2011 Q2 -4.6 -9.3 7.8 1.2 23.1 -1.9 2.1 -9.5 5.1 9.9 3.2 2.8 Q3 -5.1 -4.9 8.0 -1.0 24.8 -4.4 -16.9 -13.0 3.6 13.4 -1.0 1.0
2011 Aug. -5.6 -7.1 -0.7 -0.2 48.7 -4.1 13.3 -14.2 4.0 11.4 0.6 1.7 Sep. -5.1 -4.9 8.0 -1.0 24.8 -4.4 -16.9 -13.0 3.6 13.4 -1.0 1.0 Oct. -4.6 -2.3 6.8 -8.3 49.6 -0.1 -6.3 -10.6 2.5 12.7 -2.2 -0.5 Nov. (p) -4.3 -3.1 6.7 -5.5 28.8 -2.1 0.7 -9.3 0.9 11.8 -3.8 -3.2
C14 MFI holdings of securities 2)
(annual growth rates)
-10
-5
0
5
10
15
20
25
30
1999 2000 2001 2002 2003 2004 2005 2006 2007 2008 2009 2010 2011-10
-5
0
5
10
15
20
25
30
securities other than sharesshares and other equity
Source: ECB.1) MFI sector excluding the Eurosystem; sectoral classification is based on the ESA 95.2) Data refer to the changing composition of the euro area. For further information, see the General Notes.

EURO AREASTATISTICS
Money, bankingand other
financial corporations
2.7 Currency breakdown of selected MFI balance sheet items 1), 2) (percentages of total; outstanding amounts in EUR billions; end of period)
S 21ECB
Monthly BulletinJanuary 2012
1. Loans, holdings of securities other than shares, and deposits
Loans
MFIs 3) Non-MFIs
All Euro 4) Non-euro currencies All Euro 4) Non-euro currencies
currencies currencies (outstanding Total (outstanding Total
amount) amount)USD JPY CHF GBP USD JPY CHF GBP
1 2 3 4 5 6 7 8 9 10 11 12 13 14
To euro area residents
2009 5,916.1 - - - - - - 11,785.6 96.2 3.8 1.9 0.2 1.0 0.42010 5,515.2 - - - - - - 12,247.8 96.0 4.0 2.1 0.2 1.1 0.4
2011 Q2 5,502.4 - - - - - - 12,376.6 96.2 3.8 1.8 0.2 1.1 0.4 Q3 6,003.8 - - - - - - 12,442.4 96.1 3.9 1.9 0.3 1.1 0.4
To non-euro area residents
2009 1,914.9 45.8 54.2 29.4 2.7 2.9 12.6 906.8 40.0 60.0 42.1 1.2 3.7 8.02010 2,010.9 44.9 55.1 30.7 2.9 3.2 11.6 952.1 39.9 60.1 42.8 1.4 3.7 6.7
2011 Q2 2,012.0 45.4 54.6 31.8 2.7 3.2 10.0 994.5 41.4 58.6 39.8 1.4 3.6 6.8 Q3 2,132.4 44.2 55.8 34.7 2.8 3.3 9.0 1,022.7 40.0 60.0 41.3 2.2 3.3 7.0
Holdings of securities other than shares
Issued by euro area residents
2009 2,079.9 94.8 5.2 3.1 0.2 0.3 1.4 2,980.2 98.1 1.9 1.2 0.2 0.1 0.32010 1,885.8 94.3 5.7 3.3 0.1 0.3 1.7 3,052.8 98.6 1.4 0.8 0.1 0.1 0.4
2011 Q2 1,760.3 94.8 5.2 2.9 0.2 0.3 1.4 2,929.9 98.5 1.5 0.8 0.1 0.1 0.4 Q3 1,799.7 94.8 5.2 2.6 0.1 0.3 1.8 2,874.4 98.4 1.6 0.9 0.2 0.1 0.4
Issued by non-euro area residents
2009 552.1 55.3 44.7 27.1 0.4 0.5 14.6 595.6 35.3 64.7 37.9 4.3 0.9 15.32010 545.9 49.9 50.1 27.6 0.3 0.5 16.8 508.6 33.6 66.4 40.3 3.9 0.9 13.5
2011 Q2 493.0 53.1 46.9 24.9 0.3 0.6 15.7 480.2 33.9 66.1 38.6 5.3 0.8 12.4 Q3 478.6 54.7 45.3 21.8 0.3 0.4 17.1 482.8 32.6 67.4 39.2 6.0 0.8 12.5
Deposits
By euro area residents
2009 6,281.6 92.9 7.1 4.4 0.3 1.2 0.7 10,187.4 97.0 3.0 1.9 0.2 0.1 0.42010 5,774.9 92.9 7.1 4.1 0.3 1.3 0.8 10,722.6 97.1 2.9 1.9 0.2 0.1 0.4
2011 Q2 5,692.3 92.5 7.5 4.3 0.2 1.5 0.8 10,922.0 97.1 2.9 1.9 0.1 0.1 0.4 Q3 6,084.4 92.2 7.8 4.6 0.3 1.4 0.8 10,995.0 97.0 3.0 2.0 0.2 0.1 0.4
By non-euro area residents
2009 2,532.8 49.2 50.8 34.2 1.8 2.2 9.6 836.7 53.5 46.5 31.4 1.1 1.7 7.52010 2,492.0 52.1 47.9 31.8 2.2 1.8 8.6 996.9 58.8 41.2 29.3 1.2 1.4 5.1
2011 Q2 2,295.8 53.5 46.5 29.8 2.2 1.9 8.0 984.8 58.7 41.3 29.3 1.3 1.4 4.5 Q3 2,298.8 57.1 42.9 26.9 2.1 1.8 7.8 1,047.6 59.1 40.9 28.6 1.5 1.7 4.6
2. Debt securities issued by euro area MFIs
All Euro 4) Non-euro currencies
currencies (outstanding Total
amount)USD JPY CHF GBP
1 2 3 4 5 6 7
2009 5,168.3 83.3 16.7 8.8 1.6 1.9 2.52010 5,082.6 81.6 18.4 9.7 1.8 2.1 2.5
2011 Q2 5,155.8 81.9 18.1 9.6 1.6 2.2 2.4 Q3 5,180.3 81.8 18.2 9.7 1.7 2.1 2.5
Source: ECB.1) MFI sector excluding the Eurosystem; sectoral classification is based on the ESA 95.2) Data refer to the changing composition of the euro area. For further information, see the General Notes.3) For non-euro area residents, the term ‘‘MFIs’’ refers to institutions similar to euro area MFIs.4) Including items expressed in the national denominations of the euro.

2.8 Aggregated balance sheet of euro area investment funds 1) (EUR billions; outstanding amounts at end of period; transactions during period)
S 22ECBMonthly BulletinJanuary 2012
1. Assets
Outstanding amounts
Total Deposits and Securities other Shares and other Investment fund/ Non-financial Other assetsloan claims than shares equity (excl. money market fund assets (incl. financial
investment fund/ shares derivatives)money market fund
shares)1 2 3 4 5 6 7
2011 Apr. 6,380.6 391.4 2,353.2 1,991.8 890.8 224.3 529.0 May 6,431.0 392.2 2,399.8 1,992.2 897.8 224.9 524.0 June 6,352.7 390.6 2,386.8 1,958.6 886.8 224.9 505.0 July 6,435.7 394.8 2,420.4 1,943.8 891.5 226.5 558.6 Aug. 6,192.9 411.8 2,382.8 1,736.5 840.2 227.9 593.8 Sep. 6,072.2 420.9 2,383.0 1,632.4 830.0 229.5 576.4 Oct. (p) 6,190.4 423.1 2,370.0 1,734.1 842.7 227.5 593.1
Transactions
2011 Q1 110.1 19.2 25.2 14.9 8.4 2.4 40.0 Q2 68.9 5.6 38.2 25.9 12.3 5.8 -18.9 Q3 -6.3 29.0 -21.3 -42.0 -16.8 2.8 41.9
2. Liabilities
Outstanding amounts
Total Loans and Investment fund shares issued Other
deposits liabilitiesreceived Total Held by euro area residents Held by (incl. financial
non-euro area derivatives)Investment residents
funds1 2 3 4 5 6 7
2011 Apr. 6,380.6 126.9 5,814.3 4,507.7 676.9 1,306.6 439.3 May 6,431.0 126.8 5,861.2 4,532.4 682.9 1,328.8 443.0 June 6,352.7 121.0 5,790.3 4,466.8 672.6 1,323.5 441.4 July 6,435.7 122.3 5,825.8 4,465.3 672.8 1,360.6 487.6 Aug. 6,192.9 128.6 5,545.2 4,267.8 621.7 1,277.4 519.1 Sep. 6,072.2 125.1 5,416.4 4,162.3 602.2 1,254.1 530.7 Oct. (p) 6,190.4 130.4 5,520.5 4,224.6 613.9 1,295.9 539.5
Transactions
2011 Q1 110.1 12.0 55.4 27.1 4.1 28.3 42.8 Q2 68.9 -2.9 79.0 25.8 9.6 53.3 -7.3 Q3 -6.3 6.4 -45.2 -56.0 -32.9 10.8 32.5
3. Investment fund shares issued broken down by investment policy and type of fund
Outstanding amounts
Total Funds by investment policy Funds by type Memo item:
Money marketBond Equity Mixed Real estate Hedge Other Open-end Closed-end fundsfunds funds funds funds funds funds funds funds
1 2 3 4 5 6 7 8 9 10
2011 Mar. 5,770.5 1,799.7 1,708.3 1,410.5 267.3 112.7 471.9 5,686.0 84.4 1,077.4 Apr. 5,814.3 1,797.4 1,724.8 1,429.1 269.6 113.3 480.2 5,728.8 85.5 1,070.8 May 5,861.2 1,825.3 1,729.6 1,438.2 271.2 114.5 482.5 5,775.6 85.6 1,090.1 June 5,790.3 1,812.5 1,689.6 1,424.5 272.5 112.5 478.8 5,703.5 86.8 1,047.5 July 5,825.8 1,836.8 1,674.4 1,434.3 287.0 116.2 477.3 5,737.3 88.6 1,032.5 Aug. 5,545.2 1,807.2 1,495.2 1,381.7 286.2 114.1 460.8 5,456.9 88.4 1,060.3 Sep. 5,416.4 1,786.1 1,413.9 1,386.8 286.5 119.2 424.0 5,327.2 89.2 1,066.9 Oct. (p) 5,520.5 1,787.1 1,499.8 1,405.7 288.2 115.8 423.8 5,438.4 82.1 1,049.5
Transactions
2011 Apr. 42.4 9.4 13.4 13.3 2.0 1.0 3.4 41.1 1.4 5.8 May 27.8 9.8 9.7 5.9 -0.2 -1.0 3.6 28.1 -0.3 8.1 June 8.8 2.1 2.1 1.5 2.8 -0.3 0.6 6.8 2.0 -36.9 July 36.4 12.0 5.6 2.5 13.3 2.0 1.0 34.9 1.5 -20.0 Aug. -49.0 -14.0 -22.8 -10.8 0.8 -0.2 -2.0 -49.0 0.0 32.8 Sep. -32.6 -16.3 -11.1 -4.9 1.1 0.6 -2.0 -32.9 0.3 -12.3 Oct. (p) -25.6 -2.1 -6.6 -6.4 -0.2 -0.8 -9.5 -18.9 -6.7 -7.5
Source: ECB.1) Other than money market funds (which are shown as a memo item in column 10 in Table 3 of this section). For further details, see the General Notes.

EURO AREASTATISTICS
Money, bankingand other
financial corporations
2.9 Securities held by investment funds 1) broken down by issuer of securities (EUR billions; outstanding amounts at end of period; transactions during period)
S 23ECB
Monthly BulletinJanuary 2012
1. Securities other than shares
Outstanding amounts
Total Euro area Rest of the world
Total MFIs General Other Insurance Non-financial EU United Japangovernment financial corporations corporations Member States States
intermediaries and pension outside thefunds euro area
1 2 3 4 5 6 7 8 9 10 11
2010 Q4 2,369.5 1,432.6 375.5 692.0 193.9 6.2 165.0 936.8 247.0 365.8 16.12011 Q1 2,354.9 1,430.3 383.4 675.7 200.2 5.6 165.5 924.5 246.5 354.5 14.1 Q2 2,386.8 1,429.8 386.3 671.3 196.3 5.8 170.1 957.0 252.3 358.6 17.8 Q3 (p) 2,383.0 1,413.6 380.7 682.1 184.1 4.7 162.0 969.4 252.3 369.7 18.7
Transactions
2011 Q1 25.2 10.7 9.3 -8.3 7.9 -0.1 1.8 14.5 1.9 2.3 -1.0 Q2 38.2 -0.4 1.7 -3.5 -1.6 0.4 2.7 37.0 8.2 7.7 3.6 Q3 (p) -21.3 -16.9 -5.8 1.3 -7.7 -0.3 -4.3 -4.5 6.0 -4.1 5.3
2. Shares and other equity (other than investment fund and money market fund shares)
Outstanding amounts
Total Euro area Rest of the world
Total MFIs General Other Insurance Non-financial EU United Japangovernment financial corporations corporations Member States States
intermediaries and pension outside thefunds euro area
1 2 3 4 5 6 7 8 9 10 11
2010 Q4 1,987.7 751.1 77.8 - 39.5 25.2 608.7 1,236.5 171.4 355.8 83.82011 Q1 1,973.7 782.8 89.2 - 41.7 26.2 625.7 1,191.0 167.2 365.2 71.1 Q2 1,958.6 773.6 84.5 - 41.2 26.1 621.9 1,185.0 166.4 362.8 77.0 Q3 (p) 1,632.4 615.4 53.3 - 35.7 20.4 506.0 1,017.0 141.8 323.6 72.5
Transactions
2011 Q1 14.9 11.6 5.5 - 2.3 -0.9 4.7 3.3 -0.5 16.0 -3.9 Q2 25.9 -0.9 -0.6 - 1.3 0.3 -2.0 26.8 2.9 8.5 6.9 Q3 (p) -42.0 -8.9 -4.9 - -0.7 0.2 -3.5 -33.1 -5.1 -11.8 -3.2
3. Investment fund/money market fund shares
Outstanding amounts
Total Euro area Rest of the world
Total MFIs 2) General Other Insurance Non-financial EU United Japangovernment financial corporations corporations Member States States
intermediaries 2) and pension outside thefunds euro area
1 2 3 4 5 6 7 8 9 10 11
2010 Q4 875.6 740.5 76.0 - 664.4 - - 135.1 23.8 38.6 0.62011 Q1 882.9 746.3 78.0 - 668.3 - - 136.6 22.6 41.7 0.5 Q2 886.8 752.0 79.4 - 672.6 - - 134.8 22.1 42.8 0.5 Q3 (p) 830.0 697.5 95.3 - 602.2 - - 132.4 20.1 42.6 0.5
Transactions
2011 Q1 8.4 6.1 2.1 - 4.1 - - 2.3 -0.9 3.3 -0.1 Q2 12.3 10.8 1.2 - 9.6 - - 1.5 0.3 1.3 0.0 Q3 (p) -16.8 -16.2 16.7 - -32.9 - - -0.6 -0.5 -0.3 0.0
Source: ECB.1) Other than money market funds. For further details, see the General Notes.2) Investment fund shares (other than money market fund shares) are issued by other financial intermediaries. Money market fund shares are issued by MFIs.

2.10 Aggregated balance sheet of euro area financial vehicle corporations (EUR billions; outstanding amounts at end of period; transactions during period)
S 24ECBMonthly BulletinJanuary 2012
1. Assets
Outstanding amounts
Total Deposits Securitised loans Securities Other Shares Other
and loan other than securitised and other assetsclaims Total Originated in euro area Originated shares assets equity
outside MFIs Other financial in- Non- General euro area
termediaries, insur- financial governmentRemaining ance corporations corporationson the MFI and pension funds
balance sheet 1)
1 2 3 4 5 6 7 8 9 10 11 12 13
2010 Q2 2,285.9 363.2 1,437.5 1,131.2 570.6 140.6 25.0 6.4 134.2 278.8 101.3 41.1 64.0 Q3 2,284.9 350.2 1,467.1 1,173.3 582.4 133.7 24.8 6.4 128.8 260.4 100.3 41.4 65.6 Q4 2,350.1 373.6 1,521.9 1,237.6 606.4 124.9 22.9 6.0 130.4 251.8 92.5 41.9 68.5
2011 Q1 2,256.1 353.1 1,482.1 1,193.7 595.3 131.3 23.3 5.9 127.8 242.0 89.0 36.8 53.1 Q2 2,215.8 339.7 1,461.1 1,177.1 585.5 134.1 21.8 5.2 123.0 232.5 88.6 35.7 58.2 Q3 2,200.2 321.4 1,470.1 1,195.7 590.5 132.3 21.8 5.2 115.1 231.5 86.5 34.4 56.4
Transactions
2010 Q3 -4.5 -12.1 23.4 32.9 - -2.3 -0.6 -0.1 -6.5 -16.3 -0.5 0.4 0.7 Q4 44.8 24.5 24.2 30.1 - -4.7 -2.1 -0.4 1.3 -5.5 -0.9 -0.6 3.02011 Q1 -92.3 -23.1 -36.5 -44.2 - 8.8 0.6 0.0 -1.8 -10.0 -2.4 -4.9 -15.3 Q2 -44.6 -11.7 -26.0 -22.3 - 2.5 -0.9 -0.3 -4.9 -7.9 0.0 0.0 1.0 Q3 -23.4 -18.3 4.6 14.6 - -2.0 -0.2 0.0 -7.8 -2.3 -2.2 -1.1 -4.2
2. Liabilities
Outstanding amounts
Total Loans and deposits Debt securities issued Capital and reserves Other liabilities
receivedTotal Up to 2 years Over 2 years
1 2 3 4 5 6 7
2010 Q2 2,285.9 107.6 1,961.1 91.1 1,870.0 45.0 172.2 Q3 2,284.9 119.9 1,946.8 86.5 1,860.3 43.2 175.1 Q4 2,350.1 134.4 1,970.0 93.5 1,876.5 42.6 203.2
2011 Q1 2,256.1 133.1 1,887.6 83.9 1,803.6 37.7 197.7 Q2 2,215.8 134.0 1,844.0 82.6 1,761.4 34.8 203.1 Q3 2,200.2 131.1 1,824.8 80.0 1,744.8 34.4 209.9
Transactions
2010 Q3 -4.5 11.6 -10.9 -4.2 -6.7 -0.1 -5.1 Q4 44.8 15.9 24.0 5.7 18.3 -2.1 7.02011 Q1 -92.3 -1.0 -79.2 -9.9 -69.3 -4.5 -7.7 Q2 -44.6 0.9 -48.6 -5.7 -42.8 -1.2 4.3 Q3 -23.4 -2.2 -22.6 -4.1 -18.6 -1.7 3.1
3. Holdings of securitised loans originated by euro area MFIs and securities other than shares
Outstanding amounts
Securitised loans originated by euro area MFIs Securities other than shares
Total Euro area borrowing sector Non-euro Total Euro area residents Non-euro
area areaHouseholds Non- Other Insurance General borrowing Total MFIs Non-MFIs residents
financial financial corporations government sectorcorporations intermediaries and pension Financial
funds vehiclecorporations
1 2 3 4 5 6 7 8 9 10 11 12 13
2010 Q2 1,131.2 812.6 215.9 19.4 14.7 7.4 61.1 278.8 149.2 50.5 98.7 45.5 129.6 Q3 1,173.3 828.7 221.2 18.2 15.0 7.0 83.2 260.4 140.8 47.4 93.4 38.3 119.6 Q4 1,237.6 852.7 251.4 17.2 15.3 7.1 94.1 251.8 131.9 45.7 86.3 36.5 119.9
2011 Q1 1,193.7 804.1 250.7 17.0 15.4 7.2 99.3 242.0 125.7 42.4 83.3 36.8 116.3 Q2 1,177.1 788.8 250.9 18.8 15.4 9.8 93.4 232.5 124.5 41.1 83.4 35.4 108.2 Q3 1,195.7 795.2 257.5 18.1 15.2 9.6 100.1 231.5 121.6 41.7 79.9 33.8 109.1
Transactions
2010 Q3 32.9 9.7 1.3 -0.8 0.3 -0.4 22.8 -16.3 -9.8 -2.5 -7.4 -6.7 -6.5 Q4 30.1 16.3 14.1 -1.6 -0.2 0.1 1.4 -5.5 -5.3 -1.1 -4.2 -2.2 -0.22011 Q1 -44.2 -52.2 3.2 -0.4 0.0 0.0 5.2 -10.0 -5.9 -3.1 -2.8 0.1 -4.1 Q2 -22.3 -21.1 0.3 0.6 -0.2 2.6 -4.4 -7.9 0.6 -0.4 0.9 -0.7 -8.5 Q3 14.6 6.3 2.5 -0.7 0.0 -0.2 6.7 -2.3 -3.3 -0.2 -3.1 -1.2 1.0
Source: ECB.1) Loans securitised using euro area financial vehicle corporations which remain on the balance sheet of the relevant MFI - i.e. which have not been derecognised. Whether or notloans are derecognised from the balance sheet of the MFI depends on the relevant accounting rules. For further information, see the General Notes.

EURO AREASTATISTICS
Money, bankingand other
financial corporations
2.11 Aggregated balance sheet of euro area insurance corporations and pension funds (EUR billions; outstanding amounts at end of period)
S 25ECB
Monthly BulletinJanuary 2012
1. Assets
Total Currency Loans Securities Shares and Investment Money market Prepayments of Other Non-financialand other than other equity fund shares fund shares insurance accounts assets
deposits shares premiums and receivable/reserves for payable andoutstanding financial
claims derivatives
1 2 3 4 5 6 7 8 9 10
2008 Q4 6,158.6 800.7 478.6 2,292.9 819.1 1,088.2 93.9 245.7 184.8 154.5
2009 Q1 6,188.0 797.2 493.7 2,361.0 785.6 1,071.9 101.6 244.1 176.2 156.7 Q2 6,329.9 782.8 487.7 2,384.4 818.9 1,200.3 89.7 248.6 162.1 155.3 Q3 6,517.3 784.2 483.4 2,424.9 792.4 1,377.3 86.0 252.0 163.2 153.8 Q4 6,642.1 786.9 477.9 2,462.8 804.3 1,456.7 86.4 256.2 158.1 152.8
2010 Q1 6,864.3 784.5 486.3 2,575.8 815.3 1,534.1 83.4 267.1 169.4 148.4 Q2 6,891.1 785.5 488.9 2,613.5 792.7 1,518.4 79.8 272.1 190.2 150.1 Q3 7,060.3 783.2 498.0 2,698.8 807.4 1,559.7 75.3 272.9 215.1 149.9 Q4 6,978.8 774.1 501.6 2,642.2 823.1 1,579.1 65.3 271.8 170.0 151.5
2011 Q1 7,050.6 775.1 499.7 2,676.3 826.6 1,602.0 63.5 279.0 174.3 154.1 Q2 7,073.9 778.4 506.8 2,691.8 830.6 1,605.3 66.8 269.5 171.8 153.0 Q3 7,060.5 793.6 498.8 2,714.4 780.2 1,553.4 74.6 267.4 225.2 152.9
2. Holdings of securities other than shares
Total Issued by euro area residents Issued by non-euro
area residentsTotal MFIs General Other financial Insurance Non-financial
government intermediaries corporations and corporationspension funds
1 2 3 4 5 6 7 8
2008 Q4 2,292.9 1,874.6 505.9 1,014.0 207.0 11.4 136.4 418.3
2009 Q1 2,361.0 1,939.5 531.1 1,040.5 218.3 13.5 136.1 421.5 Q2 2,384.4 1,987.6 541.7 1,060.8 231.2 15.0 139.0 396.8 Q3 2,424.9 2,021.7 552.6 1,086.7 229.4 15.1 137.8 403.2 Q4 2,462.8 2,053.6 543.8 1,114.4 239.3 16.7 139.5 409.2
2010 Q1 2,575.8 2,157.9 578.5 1,184.6 231.7 16.2 146.9 417.9 Q2 2,613.5 2,190.3 581.7 1,196.8 244.3 16.6 150.9 423.1 Q3 2,698.8 2,271.6 593.4 1,242.3 264.1 19.5 152.4 427.2 Q4 2,642.2 2,218.7 594.3 1,215.0 236.1 17.7 155.5 423.5
2011 Q1 2,676.3 2,260.2 617.3 1,208.6 261.9 19.0 153.5 416.0 Q2 2,691.8 2,266.7 638.0 1,229.6 223.5 16.1 159.5 425.1 Q3 2,714.4 2,289.6 640.4 1,236.2 235.6 17.4 160.1 424.8
3. Liabilities and net worth
Liabilities Net worth
Total Loans Securities Shares and Insurance technical reserves Otherreceived other other equity accounts
than shares Net equity of Net equity of Prepayments of receivable/Total households households insurance payable and
in life in pension premiums and financialinsurance fund reserves for derivatives
reserves reserves outstanding claims
1 2 3 4 5 6 7 8 9 10
2008 Q4 6,123.7 348.8 31.7 422.1 5,178.6 2,909.2 1,445.8 823.6 142.6 34.8
2009 Q1 6,129.8 347.8 31.8 378.6 5,228.6 2,927.5 1,460.2 841.0 142.9 58.2 Q2 6,215.9 321.6 33.1 395.1 5,325.5 3,005.5 1,477.4 842.6 140.6 114.1 Q3 6,363.7 303.8 36.1 440.0 5,438.6 3,094.8 1,501.7 842.2 145.1 153.6 Q4 6,441.3 284.6 39.5 436.2 5,527.8 3,168.6 1,519.8 839.3 153.3 200.8
2010 Q1 6,622.5 293.6 39.5 455.4 5,676.6 3,255.9 1,560.2 860.5 157.5 241.7 Q2 6,661.4 298.9 40.9 427.9 5,733.7 3,281.4 1,589.1 863.2 160.0 229.7 Q3 6,774.7 315.0 39.8 435.7 5,829.0 3,338.9 1,629.5 860.5 155.2 285.6 Q4 6,816.8 284.5 42.3 444.6 5,895.6 3,381.8 1,651.3 862.4 149.8 162.0
2011 Q1 6,919.1 304.2 40.1 459.7 5,965.0 3,414.1 1,664.5 886.3 150.0 131.5 Q2 6,933.4 305.6 43.2 447.4 5,987.2 3,437.1 1,674.4 875.6 149.9 140.6 Q3 6,892.2 311.4 42.4 401.5 5,972.6 3,422.1 1,678.9 871.6 164.3 168.3
Source: ECB.

3 EURO AREA ACCOUNTS
3.1 Integrated economic and financial accounts by institutional sector (EUR billions)
S 26ECBMonthly BulletinJanuary 2012
Uses Euro Households Non-financial Financial General Rest ofarea corporations corporations government the world
2011 Q2
External account
Exports of goods and services 569 Trade balance 1) -10
Generation of income account
Gross value added (basic prices) Taxes less subsidies on products Gross domestic product (market prices) Compensation of employees 1,168 119 741 57 250 Other taxes less subsidies on production 31 4 19 3 4 Consumption of fixed capital 363 95 208 11 49 Net operating surplus and mixed income 1) 550 283 231 36 0
Allocation of primary income account
Net operating surplus and mixed income Compensation of employees 6 Taxes less subsidies on production Property income 982 39 489 382 73 123 Interest 396 36 71 215 73 53 Other property income 587 2 417 167 0 70 Net national income 1) 1,977 1,711 -11 51 226
Secondary distribution of income account
Net national income Current taxes on income, wealth, etc. 276 215 47 13 0 5 Social contributions 429 429 1 Social benefits other than social transfers in kind 454 1 18 34 402 1 Other current transfers 188 70 25 47 46 9 Net non-life insurance premiums 44 33 10 1 1 1 Non-life insurance claims 45 45 1 Other 99 37 15 1 45 7 Net disposable income 1) 1,957 1,535 -69 53 439
Use of income account
Net disposable income Final consumption expenditure 1,867 1,360 507 Individual consumption expenditure 1,673 1,360 313 Collective consumption expenditure 194 194 Adjustment for the change in the net equity of households in pension fund reserves 14 0 0 14 0 0 Net saving/current external account 1) 91 189 -70 39 -68 18
Capital account
Net saving/current external account Gross capital formation 472 143 261 12 56 Gross fixed capital formation 472 143 261 12 56 Changes in inventories and acquisitions less disposals of valuables 0 1 -1 0 0 Consumption of fixed capital Acquisitions less disposals of non-produced non-financial assets 0 -2 1 0 0 0 Capital transfers 32 9 1 2 20 4 Capital taxes 6 6 1 0 0 Other capital transfers 26 3 0 2 20 4 Net lending (+)/net borrowing (-) (from capital account) 1) -17 143 -109 36 -87 17 Statistical discrepancy 0 -21 21 0 0 0
Sources: ECB and Eurostat.1) For details of the calculation of the balancing items, see the Technical Notes.

EURO AREASTATISTICS
Euro areaaccounts
3.1 Integrated economic and financial accounts by institutional sector (cont'd) (EUR billions)
S 27ECB
Monthly BulletinJanuary 2012
Resources Euro Households Non-financial Financial General Rest ofarea corporations corporations government the world
2011 Q2
External account
Imports of goods and services 559 Trade balance
Generation of income account
Gross value added (basic prices) 2,113 502 1,200 108 303 Taxes less subsidies on products 236 Gross domestic product (market prices)2) 2,349 Compensation of employees Other taxes less subsidies on production Consumption of fixed capital Net operating surplus and mixed income
Allocation of primary income account
Net operating surplus and mixed income 550 283 231 36 0 Compensation of employees 1,170 1,170 3 Taxes less subsidies on production 267 267 0 Property income 971 296 247 396 32 134 Interest 385 60 45 272 8 63 Other property income 586 236 202 124 24 71 Net national income
Secondary distribution of income account
Net national income 1,977 1,711 -11 51 226 Current taxes on income, wealth, etc. 280 280 1 Social contributions 429 1 18 49 361 1 Social benefits other than social transfers in kind 452 452 3 Other current transfers 166 87 13 46 19 30 Net non-life insurance premiums 45 45 1 Non-life insurance claims 44 34 8 1 0 2 Other 77 53 5 0 19 28 Net disposable income
Use of income account
Net disposable income 1,957 1,535 -69 53 439 Final consumption expenditure Individual consumption expenditure Collective consumption expenditure Adjustment for the change in the net equity of households in pension fund reserves 14 14 0 Net saving/current external account
Capital account
Net saving/current external account 91 189 -70 39 -68 18 Gross capital formation Gross fixed capital formation Changes in inventories and acquisitions less disposals of valuables Consumption of fixed capital 363 95 208 11 49 Acquisitions less disposals of non-produced non-financial assets Capital transfers 33 9 16 1 7 3 Capital taxes 6 6 0 Other capital transfers 27 9 16 1 1 3 Net lending (+)/net borrowing (-) (from capital account) Statistical discrepancy
Sources: ECB and Eurostat.2) Gross domestic product is equal to the gross value added of all domestic sectors plus net taxes (i.e. taxes less subsidies) on products.

3.1 Integrated economic and financial accounts by institutional sector (cont'd) (EUR billions)
S 28ECBMonthly BulletinJanuary 2012
Assets Euro Households Non-financial MFIs Other Insurance General Rest ofarea corporations financial corporations govern- the world
inter- and pension ment2011 Q2 mediaries funds
Opening balance sheet, financial assets
Total financial assets 18,863 16,850 31,958 15,222 6,795 3,709 16,575 Monetary gold and special drawing rights (SDRs) 403 Currency and deposits 6,636 1,887 8,974 2,318 810 715 3,600 Short-term debt securities 59 80 515 326 43 34 680 Long-term debt securities 1,358 235 6,023 2,397 2,652 448 3,624 Loans 79 3,069 13,342 3,556 469 521 1,853 of which: Long-term 59 1,762 10,255 2,539 348 461 . Shares and other equity 4,487 7,876 1,863 6,324 2,427 1,326 6,080 Quoted shares 831 1,418 343 2,153 563 267 . Unquoted shares and other equity 2,289 6,048 1,215 3,208 292 890 . Mutual fund shares 1,366 410 305 964 1,572 169 . Insurance technical reserves 5,783 180 3 0 242 4 230 Other accounts receivable and financial derivatives 461 3,524 837 300 151 661 508 Net financial worth
Financial account, transactions in financial assets
Total transactions in financial assets 152 133 281 138 2 120 217 Monetary gold and SDRs 0 0 Currency and deposits 72 3 95 52 1 76 -11 Short-term debt securities -5 -5 -27 -2 0 -2 14 Long-term debt securities 22 -2 21 -1 8 -2 182 Loans 1 55 90 56 3 19 18 of which: Long-term 0 31 60 38 4 -3 . Shares and other equity -1 105 41 46 -5 -1 14 Quoted shares 0 23 29 9 -2 1 . Unquoted shares and other equity 8 66 12 5 1 -2 . Mutual fund shares -9 15 1 31 -4 0 . Insurance technical reserves 39 -1 0 0 -6 0 -1 Other accounts receivable and financial derivatives 25 -21 61 -14 1 30 2 Changes in net financial worth due to transactions
Other changes account, financial assets
Total other changes in financial assets -70 -61 -28 -26 26 -18 7 Monetary gold and SDRs 10 Currency and deposits 0 -6 46 0 -1 0 -16 Short-term debt securities -3 -1 -18 -8 0 0 11 Long-term debt securities 0 1 -61 -2 7 -5 59 Loans 0 1 -1 -17 0 0 4 of which: Long-term 0 -1 1 -6 0 0 . Shares and other equity -75 -75 -5 8 20 -13 -45 Quoted shares -15 -22 -5 -15 -4 -6 . Unquoted shares and other equity -57 -28 6 27 -3 -6 . Mutual fund shares -3 -26 -6 -4 27 0 . Insurance technical reserves -2 0 0 0 -3 0 5 Other accounts receivable and financial derivatives 10 20 1 -6 3 0 -11 Other changes in net financial worth
Closing balance sheet, financial assets
Total financial assets 18,944 16,923 32,212 15,333 6,823 3,811 16,799 Monetary gold and SDRs 412 Currency and deposits 6,708 1,885 9,115 2,370 811 792 3,573 Short-term debt securities 51 74 470 316 43 32 704 Long-term debt securities 1,379 233 5,982 2,394 2,667 441 3,866 Loans 80 3,124 13,431 3,595 471 540 1,874 of which: Long-term 59 1,791 10,316 2,570 352 458 . Shares and other equity 4,411 7,905 1,899 6,378 2,443 1,312 6,049 Quoted shares 817 1,420 367 2,146 557 262 . Unquoted shares and other equity 2,240 6,086 1,233 3,240 291 882 . Mutual fund shares 1,354 400 299 992 1,595 168 . Insurance technical reserves 5,820 179 3 0 233 4 234 Other accounts receivable and financial derivatives 495 3,523 899 280 155 691 499 Net financial worth
Source: ECB.

EURO AREASTATISTICS
Euro areaaccounts
3.1 Integrated economic and financial accounts by institutional sector (cont'd) (EUR billions)
S 29ECB
Monthly BulletinJanuary 2012
Liabilities Euro Households Non-financial MFIs Other Insurance General Rest ofarea corporations financial corporations govern- the world
inter- and pension ment2011 Q2 mediaries funds
Opening balance sheet, liabilities
Total liabilities 6,689 26,635 31,064 14,601 6,877 9,027 14,676 Monetary gold and special drawing rights (SDRs) Currency and deposits 31 22,055 24 0 255 2,575 Short-term debt securities 81 653 71 0 677 255 Long-term debt securities 784 4,481 2,739 30 5,876 2,826 Loans 6,094 8,472 3,310 270 1,706 3,035 of which: Long-term 5,740 6,010 1,836 119 1,378 . Shares and other equity 7 13,369 2,635 8,356 436 6 5,574 Quoted shares 3,923 490 253 130 0 . Unquoted shares and other equity 7 9,446 1,068 2,528 305 6 . Mutual fund shares 1,077 5,576 . Insurance technical reserves 35 336 68 1 6,002 1 Other accounts payable and financial derivatives 553 3,562 1,171 100 139 507 410 Net financial worth 1) -1,496 12,174 -9,785 895 620 -82 -5,318
Financial account, transactions in liabilities
Total transactions in liabilities 30 221 253 116 16 207 200 Monetary gold and SDRs Currency and deposits 0 242 -3 0 3 47 Short-term debt securities 1 -30 7 0 -5 -3 Long-term debt securities 9 43 -3 2 152 25 Loans 45 95 48 3 -4 54 of which: Long-term 38 54 29 1 26 . Shares and other equity 0 62 3 68 -2 0 68 Quoted shares 10 18 6 0 0 . Unquoted shares and other equity 0 52 5 7 -2 0 . Mutual fund shares -21 54 . Insurance technical reserves 0 0 0 0 30 0 Other accounts payable and financial derivatives -15 53 -6 -1 -18 61 9 Changes in net financial worth due to transactions 1) -17 122 -88 29 22 -14 -87 17
Other changes account, liabilities
Total other changes in liabilities -1 -59 12 0 7 -49 -91 Monetary gold and SDRs Currency and deposits 0 13 0 0 0 12 Short-term debt securities 0 0 0 0 -1 -18 Long-term debt securities 5 15 12 0 -32 -4 Loans 1 2 -4 0 0 -13 of which: Long-term 4 3 -1 0 0 . Shares and other equity 0 -76 -15 -31 -13 0 -50 Quoted shares -19 -19 -9 -8 0 . Unquoted shares and other equity 0 -57 11 19 -5 0 . Mutual fund shares -7 -42 . Insurance technical reserves 0 0 0 0 0 0 Other accounts payable and financial derivatives -1 10 -1 23 20 -16 -18 Other changes in net financial worth 1) -88 -70 -2 -40 -26 19 31 97
Closing balance sheet, liabilities
Total liabilities 6,719 26,798 31,328 14,717 6,900 9,186 14,786 Monetary gold and SDRs Currency and deposits 30 22,309 21 0 258 2,634 Short-term debt securities 83 623 79 0 671 234 Long-term debt securities 799 4,539 2,748 33 5,996 2,847 Loans 6,141 8,569 3,354 273 1,702 3,077 of which: Long-term 5,782 6,067 1,864 120 1,404 . Shares and other equity 7 13,356 2,623 8,392 421 6 5,592 Quoted shares 3,914 489 250 122 0 . Unquoted shares and other equity 7 9,442 1,084 2,554 298 6 . Mutual fund shares 1,050 5,588 . Insurance technical reserves 35 336 69 1 6,032 1 Other accounts payable and financial derivatives 536 3,625 1,164 123 141 552 401 Net financial worth 1) -1,601 12,226 -9,874 884 616 -77 -5,375
Source: ECB.

3.2 Euro area non-financial accounts (EUR billions; four-quarter cumulated flows)
S 30ECBMonthly BulletinJanuary 2012
Uses 2009 Q3- 2009 Q4- 2010 Q1- 2010 Q2- 2010 Q3-2007 2008 2009 2010 Q2 2010 Q3 2010 Q4 2011 Q1 2011 Q2
Generation of income account
Gross value added (basic prices) Taxes less subsidies on products Gross domestic product (market prices) Compensation of employees 4,280 4,462 4,442 4,458 4,472 4,492 4,523 4,557 Other taxes less subsidies on production 99 94 85 84 88 83 84 89 Consumption of fixed capital 1,294 1,360 1,385 1,398 1,407 1,417 1,427 1,437 Net operating surplus and mixed income 1) 2,393 2,358 2,111 2,159 2,179 2,207 2,234 2,249
Allocation of primary income account
Net operating surplus and mixed income Compensation of employees Taxes less subsidies on production Property income 3,678 3,925 2,957 2,762 2,763 2,808 2,847 2,917 Interest 2,129 2,378 1,603 1,424 1,404 1,415 1,440 1,483 Other property income 1,549 1,547 1,354 1,338 1,359 1,393 1,407 1,434 Net national income 1) 7,771 7,806 7,525 7,614 7,672 7,725 7,794 7,860
Secondary distribution of income account
Net national income Current taxes on income, wealth, etc. 1,136 1,145 1,028 1,036 1,042 1,053 1,070 1,077 Social contributions 1,597 1,670 1,675 1,682 1,688 1,699 1,708 1,718 Social benefits other than social transfers in kind 1,585 1,656 1,772 1,803 1,811 1,819 1,823 1,828 Other current transfers 741 774 779 780 781 774 774 776 Net non-life insurance premiums 183 188 182 181 180 180 178 178 Non-life insurance claims 184 189 183 182 181 181 179 179 Other 374 397 414 417 420 414 416 419 Net disposable income 1) 7,678 7,704 7,416 7,500 7,554 7,610 7,679 7,747
Use of income account
Net disposable income Final consumption expenditure 6,892 7,145 7,145 7,219 7,264 7,308 7,355 7,401 Individual consumption expenditure 6,192 6,407 6,374 6,446 6,490 6,534 6,580 6,625 Collective consumption expenditure 700 738 771 774 774 773 775 776 Adjustment for the change in the net equity of households in pension fund reserves 61 69 61 57 56 55 54 55 Net saving 1) 786 559 270 280 291 303 324 346
Capital account
Net saving Gross capital formation 2,055 2,059 1,707 1,730 1,759 1,785 1,836 1,858 Gross fixed capital formation 1,978 1,998 1,752 1,738 1,749 1,762 1,788 1,802 Changes in inventories and acquisitions less disposals of valuables 76 62 -44 -9 10 23 48 56 Consumption of fixed capital Acquisitions less disposals of non-produced non-financial assets -1 1 1 2 2 1 1 1 Capital transfers 153 152 185 186 220 227 215 207 Capital taxes 24 24 34 30 30 25 26 25 Other capital transfers 129 128 151 156 190 202 190 182 Net lending (+)/net borrowing (-) (from capital account) 1) 40 -132 -43 -41 -50 -55 -74 -65
Sources: ECB and Eurostat.1) For details of the calculation of the balancing items, see the Technical Notes.

EURO AREASTATISTICS
Euro areaaccounts
3.2 Euro area non-financial accounts (cont'd) (EUR billions; four-quarter cumulated flows)
S 31ECB
Monthly BulletinJanuary 2012
Resources 2009 Q3- 2009 Q4- 2010 Q1- 2010 Q2- 2010 Q3-2007 2008 2009 2010 Q2 2010 Q3 2010 Q4 2011 Q1 2011 Q2
Generation of income account
Gross value added (basic prices) 8,066 8,274 8,024 8,099 8,147 8,199 8,268 8,331 Taxes less subsidies on products 961 947 895 915 933 941 957 959 Gross domestic product (market prices)2) 9,027 9,221 8,919 9,014 9,080 9,140 9,225 9,290 Compensation of employees Other taxes less subsidies on production Consumption of fixed capital Net operating surplus and mixed income
Allocation of primary income account
Net operating surplus and mixed income 2,393 2,358 2,111 2,159 2,179 2,207 2,234 2,249 Compensation of employees 4,287 4,469 4,449 4,466 4,480 4,500 4,532 4,565 Taxes less subsidies on production 1,068 1,048 997 1,015 1,035 1,038 1,055 1,060 Property income 3,701 3,858 2,924 2,736 2,740 2,788 2,821 2,902 Interest 2,098 2,326 1,554 1,380 1,360 1,372 1,401 1,447 Other property income 1,603 1,532 1,370 1,356 1,380 1,415 1,420 1,455 Net national income
Secondary distribution of income account
Net national income 7,771 7,806 7,525 7,614 7,672 7,725 7,794 7,860 Current taxes on income, wealth, etc. 1,144 1,153 1,034 1,040 1,047 1,058 1,075 1,084 Social contributions 1,596 1,668 1,673 1,681 1,688 1,698 1,708 1,717 Social benefits other than social transfers in kind 1,577 1,648 1,766 1,798 1,805 1,812 1,816 1,821 Other current transfers 648 673 672 668 665 662 661 664 Net non-life insurance premiums 184 189 183 182 181 181 179 179 Non-life insurance claims 181 185 179 178 177 176 175 175 Other 282 299 309 308 307 305 306 310 Net disposable income
Use of income account
Net disposable income 7,678 7,704 7,416 7,500 7,554 7,610 7,679 7,747 Final consumption expenditure Individual consumption expenditure Collective consumption expenditure Adjustment for the change in the net equity of households in pension fund reserves 61 69 61 57 56 55 54 55 Net saving
Capital account
Net saving 786 559 270 280 291 303 324 346 Gross capital formation Gross fixed capital formation Changes in inventories and acquisitions less disposals of valuables Consumption of fixed capital 1,294 1,360 1,385 1,398 1,407 1,417 1,427 1,437 Acquisitions less disposals of non-produced non-financial assets Capital transfers 168 161 195 197 232 239 228 218 Capital taxes 24 24 34 30 30 25 26 25 Other capital transfers 144 137 161 167 202 214 202 193 Net lending (+)/net borrowing (-) (from capital account)
Sources: ECB and Eurostat.2) Gross domestic product is equal to the gross value added of all domestic sectors plus net taxes (i.e. taxes less subsidies) on products.

3.3 Households (EUR billions; four-quarter cumulated flows; outstanding amounts at end of period)
S 32ECBMonthly BulletinJanuary 2012
2009 Q3- 2009 Q4- 2010 Q1- 2010 Q2- 2010 Q3-2007 2008 2009 2010 Q2 2010 Q3 2010 Q4 2011 Q1 2011 Q2
Income, saving and changes in net worth
Compensation of employees (+) 4,287 4,469 4,449 4,466 4,480 4,500 4,532 4,565 Gross operating surplus and mixed income (+) 1,485 1,526 1,456 1,453 1,456 1,463 1,476 1,490 Interest receivable (+) 318 351 236 210 207 210 215 223 Interest payable (-) 221 250 148 129 127 128 131 136 Other property income receivable (+) 777 779 713 695 700 707 720 725 Other property income payable (-) 10 10 10 10 10 10 10 10 Current taxes on income and wealth (-) 836 874 843 843 846 849 859 862 Net social contributions (-) 1,592 1,665 1,670 1,677 1,683 1,694 1,703 1,713 Net social benefits (+) 1,572 1,643 1,760 1,792 1,800 1,807 1,811 1,815 Net current transfers receivable (+) 62 69 72 70 71 70 69 69 = Gross disposable income 5,842 6,037 6,015 6,027 6,048 6,077 6,119 6,166 Final consumption expenditure (-) 5,085 5,244 5,157 5,212 5,251 5,293 5,334 5,376 Changes in net worth in pension funds (+) 61 69 61 57 56 55 54 55 = Gross saving 818 862 919 872 853 838 839 845 Consumption of fixed capital (-) 356 371 373 375 377 379 380 380 Net capital transfers receivable (+) 12 0 11 7 7 12 12 12 Other changes in net worth (+) 1,239 -1,978 -457 811 1,019 1,035 720 490 = Changes in net worth 1,713 -1,486 101 1,314 1,501 1,506 1,191 967
Investment, financing and changes in net worth
Net acquisition of non-financial assets (+) 638 625 535 532 538 544 550 552 Consumption of fixed capital (-) 356 371 373 375 377 379 380 380 Main items of financial investment (+) Short-term assets 420 458 -14 -75 -23 57 118 118 Currency and deposits 351 438 121 63 89 120 141 138 Money market fund shares 37 -6 -43 -73 -84 -51 -37 -32 Debt securities 1) 32 25 -92 -65 -29 -13 14 12 Long-term assets 140 21 521 592 488 411 331 314 Deposits -31 -27 85 104 80 56 40 51 Debt securities 83 24 33 35 -4 2 44 53 Shares and other equity -121 -107 178 205 164 122 44 18 Quoted and unquoted shares and other equity 30 68 131 139 103 99 57 32 Mutual fund shares -151 -176 47 66 61 23 -13 -14 Life insurance and pension fund reserves 209 131 225 248 248 231 203 192 Main items of financing (-) Loans 384 257 111 135 135 147 148 139 of which: From euro area MFIs 283 83 65 136 135 148 170 164 Other changes in assets (+) Non-financial assets 1,176 -566 -770 511 873 916 727 297 Financial assets 114 -1,444 300 299 140 132 -3 170 Shares and other equity 96 -1,183 106 97 -2 82 36 159 Life insurance and pension fund reserves 8 -240 174 183 142 87 28 43 Remaining net flows (+) -34 47 13 -35 -2 -28 -5 36 = Changes in net worth 1,713 -1,486 101 1,314 1,501 1,506 1,191 967
Balance sheet
Non-financial assets (+) 27,755 27,443 26,835 27,371 27,759 27,916 27,799 27,840 Financial assets (+) Short-term assets 5,263 5,805 5,781 5,784 5,771 5,844 5,883 5,913 Currency and deposits 4,851 5,322 5,475 5,508 5,500 5,600 5,599 5,650 Money market fund shares 280 316 240 216 204 191 209 196 Debt securities 1) 132 167 66 59 67 54 75 66 Long-term assets 12,140 10,675 11,529 11,667 11,927 12,058 12,107 12,125 Deposits 965 915 971 1,011 1,015 1,028 1,037 1,058 Debt securities 1,272 1,296 1,379 1,354 1,349 1,331 1,342 1,364 Shares and other equity 5,116 3,785 4,101 4,050 4,195 4,304 4,279 4,215 Quoted and unquoted shares and other equity 3,741 2,864 2,996 2,924 3,036 3,113 3,121 3,057 Mutual fund shares 1,375 920 1,105 1,126 1,159 1,191 1,158 1,158 Life insurance and pension fund reserves 4,787 4,678 5,077 5,253 5,368 5,395 5,450 5,488 Remaining net assets (+) 315 315 299 279 306 294 279 329 Liabilities (-) Loans 5,569 5,820 5,925 6,002 6,030 6,087 6,094 6,141 of which: From euro area MFIs 4,831 4,914 4,968 5,140 5,159 5,213 5,256 5,301 = Net worth 39,905 38,418 38,519 39,099 39,732 40,025 39,973 40,065Sources: ECB and Eurostat.1) Securities issued by MFIs with a maturity of less than two years and securities issued by other sectors with a maturity of less than one year.

EURO AREASTATISTICS
Euro areaaccounts
3.4 Non-financial corporations (EUR billions; four-quarter cumulated flows; outstanding amounts at end of period)
S 33ECB
Monthly BulletinJanuary 2012
2009 Q3- 2009 Q4- 2010 Q1- 2010 Q2- 2010 Q3-2007 2008 2009 2010 Q2 2010 Q3 2010 Q4 2011 Q1 2011 Q2
Income and saving
Gross value added (basic prices) (+) 4,638 4,745 4,485 4,539 4,577 4,619 4,671 4,717 Compensation of employees (-) 2,712 2,833 2,773 2,776 2,786 2,805 2,832 2,861 Other taxes less subsidies on production (-) 48 45 39 35 39 33 34 38 = Gross operating surplus (+) 1,877 1,868 1,673 1,727 1,752 1,781 1,805 1,818 Consumption of fixed capital (-) 724 765 783 792 797 803 810 817 = Net operating surplus (+) 1,153 1,102 890 936 955 978 996 1,000 Property income receivable (+) 636 638 539 518 517 531 532 553 Interest receivable 222 242 173 158 154 156 158 165 Other property income receivable 414 396 366 360 362 375 374 387 Interest and rents payable (-) 365 422 300 268 264 266 272 281 = Net entrepreneurial income (+) 1,423 1,318 1,130 1,186 1,208 1,242 1,256 1,272 Distributed income (-) 990 1,021 927 905 913 934 952 958 Taxes on income and wealth payable (-) 246 233 150 156 159 165 171 173 Social contributions receivable (+) 63 67 69 68 68 68 69 69 Social benefits payable (-) 62 65 67 68 68 69 69 69 Other net transfers (-) 43 48 47 48 48 47 47 47 = Net saving 145 18 8 77 89 96 86 95
Investment, financing and saving
Net acquisition of non-financial assets (+) 421 376 87 124 148 169 207 215 Gross fixed capital formation (+) 1,068 1,085 917 924 935 950 970 982 Consumption of fixed capital (-) 724 765 783 792 797 803 810 817 Net acquisition of other non-financial assets (+) 77 57 -47 -9 9 23 47 51 Main items of financial investment (+) Short-term assets 168 70 96 24 22 16 18 38 Currency and deposits 153 15 88 58 51 68 62 66 Money market fund shares -20 33 40 -23 -29 -41 -27 -19 Debt securities 1) 35 22 -32 -11 -1 -11 -17 -9 Long-term assets 762 710 211 254 403 471 441 501 Deposits -13 40 4 -10 -7 2 11 6 Debt securities 48 -35 11 -9 -12 -9 0 13 Shares and other equity 425 357 76 72 157 211 199 269 Other (mainly intercompany loans) 302 348 119 202 265 267 231 212 Remaining net assets (+) 181 -89 72 99 54 -35 -6 -23 Main items of financing (-) Debt 917 667 84 104 232 225 262 305 of which: Loans from euro area MFIs 536 394 -114 -92 -35 -8 30 77 of which: Debt securities 33 48 90 89 73 68 44 44 Shares and other equity 402 306 289 238 226 226 238 259 Quoted shares 58 6 67 47 37 30 30 28 Unquoted shares and other equity 344 300 223 191 189 196 208 231 Net capital transfers receivable (-) 68 73 81 79 78 74 72 71 = Net saving 145 18 8 77 89 96 86 95
Financial balance sheet
Financial assets Short-term assets 1,788 1,876 1,960 1,903 1,926 1,972 1,950 1,939 Currency and deposits 1,507 1,538 1,632 1,608 1,625 1,693 1,667 1,673 Money market fund shares 163 192 214 184 182 174 179 169 Debt securities 1) 119 147 114 111 118 105 104 97 Long-term assets 10,739 9,300 10,255 10,371 10,735 11,026 11,197 11,282 Deposits 206 246 227 231 240 220 220 211 Debt securities 228 183 191 195 200 196 211 210 Shares and other equity 7,968 6,221 7,054 6,987 7,283 7,545 7,697 7,737 Other (mainly intercompany loans) 2,337 2,650 2,784 2,957 3,011 3,065 3,069 3,124 Remaining net assets 263 238 219 200 215 66 173 107 Liabilities Debt 8,649 9,337 9,461 9,600 9,642 9,648 9,674 9,787 of which: Loans from euro area MFIs 4,466 4,866 4,711 4,731 4,709 4,699 4,730 4,760 of which: Debt securities 648 704 827 887 901 889 866 882 Shares and other equity 14,250 11,063 12,381 12,026 12,622 13,091 13,369 13,356 Quoted shares 5,005 2,935 3,516 3,316 3,542 3,814 3,923 3,914 Unquoted shares and other equity 9,245 8,129 8,865 8,711 9,080 9,277 9,446 9,442
Sources: ECB and Eurostat.1) Securities issued by MFIs with a maturity of less than two years and securities issued by other sectors with a maturity of less than one year.

3.5 Insurance corporations and pension funds (EUR billions; four-quarter cumulated flows; outstanding amounts at end of period)
S 34ECBMonthly BulletinJanuary 2012
2009 Q3- 2009 Q4- 2010 Q1- 2010 Q2- 2010 Q3-2007 2008 2009 2010 Q2 2010 Q3 2010 Q4 2011 Q1 2011 Q2
Financial account, financial transactions
Main items of financial investment (+) Short-term assets 22 78 -51 -22 -3 -12 -30 -38 Currency and deposits 7 57 -33 2 6 -9 -9 -14 Money market fund shares 4 14 0 1 -2 -6 -24 -25 Debt securities 1) 11 7 -17 -25 -7 3 3 1 Long-term assets 280 92 318 281 250 219 213 204 Deposits 47 -9 21 -8 -11 -8 7 10 Debt securities 108 59 111 150 167 151 129 122 Loans -15 25 7 6 12 28 25 26 Quoted shares 20 2 -65 -68 14 17 15 9 Unquoted shares and other equity 22 15 -8 1 2 10 12 14 Mutual fund shares 98 1 253 199 66 22 25 22 Remaining net assets (+) -38 39 2 43 60 53 20 5 Main items of financing (-) Debt securities 3 4 5 5 2 0 0 2 Loans -2 24 -16 -10 7 6 11 8 Shares and other equity 3 6 1 5 5 5 4 1 Insurance technical reserves 245 125 231 282 278 259 208 184 Net equity of households in life insurance and pension fund reserves 212 121 227 273 270 248 201 184 Prepayments of insurance premiums and reserves for outstanding claims 34 4 4 9 8 11 7 0 = Changes in net financial worth due to transactions 14 50 48 20 15 -10 -21 -24
Other changes account
Other changes in financial assets (+) Shares and other equity -48 -502 188 160 122 120 41 105 Other net assets 11 34 52 78 57 -36 -44 -68 Other changes in liabilities (-) Shares and other equity -22 -172 8 20 -19 -8 -9 12 Insurance technical reserves 30 -260 186 189 146 96 39 51 Net equity of households in life insurance and pension fund reserves 18 -248 182 187 147 99 41 56 Prepayments of insurance premiums and reserves for outstanding claims 12 -11 4 2 -1 -2 -2 -5 = Other changes in net financial worth -45 -36 45 30 51 -5 -33 -26
Financial balance sheet
Financial assets (+) Short-term assets 318 398 342 367 362 335 323 325 Currency and deposits 163 224 195 206 203 190 186 186 Money market fund shares 91 103 94 103 101 89 79 81 Debt securities 1) 63 71 52 58 57 55 58 58 Long-term assets 5,473 5,077 5,658 5,841 5,979 5,983 6,079 6,110 Deposits 594 599 617 610 610 610 624 624 Debt securities 2,203 2,261 2,444 2,571 2,642 2,580 2,638 2,652 Loans 411 433 439 446 453 466 469 471 Quoted shares 750 491 523 518 539 553 563 557 Unquoted shares and other equity 347 321 301 290 284 295 292 291 Mutual fund shares 1,167 971 1,335 1,406 1,451 1,479 1,493 1,514 Remaining net assets (+) 176 238 223 266 292 253 254 247 Liabilities (-) Debt securities 19 23 30 32 30 33 30 33 Loans 244 273 256 264 277 265 270 273 Shares and other equity 578 412 422 409 413 419 436 421 Insurance technical reserves 5,295 5,160 5,577 5,797 5,911 5,932 6,002 6,032 Net equity of households in life insurance and pension fund reserves 4,472 4,345 4,754 4,956 5,074 5,101 5,158 5,196 Prepayments of insurance premiums and reserves for outstanding claims 822 814 823 841 837 831 844 836 = Net financial wealth -170 -156 -63 -27 2 -78 -82 -77
Source: ECB.1) Securities issued by MFIs with a maturity of less than two years and securities issued by other sectors with a maturity of less than one year.

4FINANCIAL MARKETS
4.1 Securities other than shares by original maturity, residency of the issuer and currency (EUR billions and period growth rates; seasonally adjusted; transactions during the month and end-of-period outstanding amounts; nominal values)
S 35ECB
Monthly BulletinJanuary 2012
Total
By euro area residents
Total in euro 1) In euro In all currencies
Outstanding Gross issues Net issues Outstanding Gross issues Net issues Outstanding Gross issues Net issues Annual Seasonally adjusted 2)
amounts amounts amounts growth rates6-month
Net issues growth rates1 2 3 4 5 6 7 8 9 10 11 12
2010 Nov. 16,457.7 993.0 183.2 14,266.7 954.0 202.1 16,063.0 1,067.0 234.7 4.3 156.2 5.5 Dec. 16,294.1 876.6 -162.2 14,120.4 843.9 -144.9 15,879.3 916.4 -176.9 3.6 -57.0 4.5
2011 Jan. 16,370.0 1,005.0 75.1 14,193.3 954.5 72.2 15,952.5 1,070.7 91.8 3.7 78.1 5.0 Feb. 16,469.4 866.8 100.3 14,284.4 813.9 92.2 16,044.6 920.2 98.0 4.1 47.7 4.1 Mar. 16,468.2 978.7 -0.9 14,275.9 911.8 -8.2 16,021.1 1,019.8 1.0 3.4 10.5 3.5 Apr. 16,489.6 889.1 22.0 14,324.0 850.3 48.7 16,048.2 934.9 52.1 3.2 26.2 3.3 May 16,592.8 922.5 101.6 14,416.6 865.9 90.9 16,196.6 963.7 118.1 3.6 41.6 1.8 June 16,623.8 848.3 30.9 14,439.0 796.4 22.3 16,213.8 893.3 22.9 3.9 49.0 3.2 July 16,745.8 852.7 -31.3 14,428.7 824.9 -10.9 16,225.3 906.8 -11.7 3.7 13.8 2.4 Aug. 16,774.4 805.8 28.9 14,459.5 771.8 31.0 16,232.8 857.7 18.7 3.2 47.4 2.4 Sep. 16,813.3 1,001.1 37.8 14,472.3 925.7 13.1 16,285.5 1,026.2 15.1 3.3 67.6 3.1 Oct. . . . 14,550.6 992.0 79.0 16,328.8 1,085.1 69.4 3.4 59.2 3.5 Nov. . . . 14,645.9 1,009.4 93.0 16,455.9 1,121.0 96.2 2.5 7.3 3.1
Long-term
2010 Nov. 14,898.4 337.5 146.7 12,798.1 321.0 161.6 14,386.8 359.5 186.8 4.8 111.3 5.5 Dec. 14,856.7 186.8 -39.1 12,774.2 179.6 -21.3 14,339.4 193.8 -41.1 4.8 19.4 5.6
2011 Jan. 14,920.1 308.9 64.9 12,823.2 278.0 50.5 14,386.7 320.1 67.4 4.8 97.2 6.2 Feb. 15,025.6 284.3 105.7 12,918.3 253.2 95.5 14,474.3 285.2 92.1 5.0 42.8 5.6 Mar. 15,036.6 305.4 11.6 12,936.0 269.2 18.2 14,468.2 303.5 15.6 4.3 21.2 5.1 Apr. 15,089.5 302.7 53.1 13,000.2 278.4 64.5 14,514.4 308.9 67.8 4.3 48.4 4.8 May 15,165.6 275.8 75.0 13,067.9 243.4 66.5 14,620.1 266.4 80.2 4.5 14.8 3.4 June 15,216.9 255.5 50.8 13,117.4 224.3 49.0 14,668.6 253.1 52.0 4.6 42.2 3.7 July 15,345.5 203.1 -21.1 13,105.9 191.7 -13.8 14,678.1 213.3 -13.4 4.4 25.3 2.7 Aug. 15,338.8 120.6 -6.4 13,105.0 112.0 -1.0 14,658.1 122.0 -9.6 4.0 28.4 2.5 Sep. 15,335.0 228.0 -3.4 13,099.2 189.8 -5.3 14,693.2 213.9 2.3 4.0 49.1 2.9 Oct. . . . 13,179.0 251.1 81.7 14,739.6 268.2 70.2 4.0 74.2 3.2 Nov. . . . 13,262.6 189.6 81.7 14,855.2 210.2 88.5 3.3 5.6 3.1
C15 Total outstanding amounts and gross issues of securities other than shares issued by euro area residents
(EUR billions)
2000
4000
6000
8000
10000
12000
14000
16000
18000
1994 1995 1996 1997 1998 1999 2000 2001 2002 2003 2004 2005 2006 2007 2008 2009 2010 20110
200
400
600
800
1000
1200
1400
1600
total gross issues (right-hand scale)total outstanding amounts (left-hand scale)outstanding amounts in euro (left-hand scale)
Sources: ECB and BIS (for issues by non-euro area residents).1) Total euro-denominated securities other than shares issued by euro area residents and non-euro area residents.2) For details of the calculation of the growth rates, see the Technical Notes. The six-month growth rates have been annualised.

4.2 Securities other than shares issued by euro area residents, by sector of the issuer and instrument type (EUR billions ; transactions during the month and end-of-period outstanding amounts; nominal values)
S 36ECBMonthly BulletinJanuary 2012
1. Outstanding amounts and gross issues
Total
Outstanding amounts Gross issues 1)
Total MFIs Non-MFI corporations General government Total MFIs Non-MFI corporations General government
(including (includingEurosystem) Financial Non-financial Central Other Eurosystem) Financial Non-financial Central Other
corporations corporations government general corporations corporations government generalother than government other than government
MFIs MFIs1 2 3 4 5 6 7 8 9 10 11 12
2009 15,287 5,371 3,226 803 5,418 469 1,126 734 68 80 215 292010 15,879 5,246 3,296 851 5,932 554 1,007 625 80 69 205 29
2010 Q4 15,879 5,246 3,296 851 5,932 554 978 566 110 63 206 322011 Q1 16,021 5,348 3,260 825 6,024 564 1,004 592 89 59 220 43 Q2 16,214 5,364 3,254 833 6,167 597 931 551 85 60 192 43 Q3 16,285 5,425 3,239 855 6,160 607 930 579 78 60 180 33
2011 Aug. 16,233 5,393 3,231 847 6,165 597 858 572 57 52 145 32 Sep. 16,285 5,425 3,239 855 6,160 607 1,026 633 92 65 202 34 Oct. 16,329 5,412 3,269 860 6,181 607 1,085 627 144 86 197 31 Nov. 16,456 5,453 3,283 870 6,229 621 1,121 729 104 63 181 45
Short-term
2009 1,639 733 90 71 714 31 876 635 25 63 133 202010 1,540 572 122 67 724 54 758 534 34 57 115 19
2010 Q4 1,540 572 122 67 724 54 716 484 38 52 117 252011 Q1 1,553 618 113 71 700 52 701 462 41 49 118 30 Q2 1,545 582 124 72 702 65 654 440 31 51 102 32 Q3 1,592 613 113 83 712 72 747 512 42 53 114 26
2011 Aug. 1,575 604 117 82 707 64 736 516 41 51 104 24 Sep. 1,592 613 113 83 712 72 812 555 54 56 120 28 Oct. 1,589 625 109 83 703 70 817 544 68 73 109 24 Nov. 1,601 651 108 82 686 74 911 665 66 54 95 31
Long-term 2)
2009 13,648 4,638 3,136 731 4,704 438 251 99 44 17 82 92010 14,339 4,674 3,174 784 5,207 499 248 91 46 12 90 9
2010 Q4 14,339 4,674 3,174 784 5,207 499 262 83 72 11 89 82011 Q1 14,468 4,730 3,148 754 5,325 512 303 130 48 10 102 13 Q2 14,669 4,781 3,130 761 5,465 532 276 111 54 9 90 12 Q3 14,693 4,812 3,126 772 5,448 535 183 67 36 7 66 7
2011 Aug. 14,658 4,789 3,113 765 5,458 533 122 56 17 1 41 8 Sep. 14,693 4,812 3,126 772 5,448 535 214 78 38 9 82 6 Oct. 14,740 4,788 3,160 777 5,478 537 268 84 76 13 88 7 Nov. 14,855 4,802 3,175 788 5,544 547 210 64 38 9 85 13
of which: Long-term fixed rate
2009 8,816 2,563 1,043 598 4,261 351 172 60 18 16 72 62010 9,481 2,634 1,103 670 4,697 377 156 50 13 10 77 6
2010 Q4 9,481 2,634 1,103 670 4,697 377 142 43 19 11 65 52011 Q1 9,640 2,700 1,111 655 4,787 387 195 78 12 8 87 9 Q2 9,865 2,743 1,144 665 4,912 401 173 62 20 8 74 8 Q3 9,887 2,773 1,150 677 4,887 400 112 35 8 6 58 5
2011 Aug. 9,850 2,748 1,143 671 4,889 399 67 27 4 0 31 5 Sep. 9,887 2,773 1,150 677 4,887 400 144 47 10 8 75 3 Oct. 9,891 2,758 1,145 682 4,903 403 132 48 4 11 66 4 Nov. 9,971 2,764 1,146 691 4,962 407 117 28 7 9 64 8
of which: Long-term variable rate
2009 4,382 1,786 2,016 123 372 85 62 28 25 1 6 22010 4,387 1,760 1,966 108 432 121 78 34 29 1 10 4
2010 Q4 4,387 1,760 1,966 108 432 121 102 33 44 1 22 22011 Q1 4,335 1,741 1,920 94 458 123 87 42 29 1 11 4 Q2 4,303 1,765 1,841 91 477 129 82 42 22 1 13 4 Q3 4,301 1,767 1,819 90 491 133 56 26 21 0 5 3
2011 Aug. 4,292 1,765 1,816 90 490 132 41 22 8 0 8 3 Sep. 4,301 1,767 1,819 90 491 133 55 26 24 0 3 3 Oct. 4,343 1,754 1,863 90 503 133 121 27 70 2 20 3 Nov. 4,371 1,762 1,873 92 507 138 80 28 27 1 19 5
Source: ECB.1) Monthly data on gross issues refer to transactions during the month. For the purposes of comparison, quarterly and annual data refer to the respective monthly averages.2) The residual difference between total long-term debt securities and fixed and variable rate long-term debt securities consists of zero coupon bonds and revaluation effects.

EURO AREASTATISTICS
Financialmarkets
4.2 Securities other than shares issued by euro area residents, by sector of the issuer and instrument type (EUR billions unless otherwise indicated; transactions during the period; nominal values)
S 37ECB
Monthly BulletinJanuary 2012
2. Net issues
Total
Non-seasonally adjusted 1) Seasonally adjusted 1)
Total MFIs Non-MFI corporations General government Total MFIs Non-MFI corporations General government
(including (includingEurosystem) Financial Non-financial Central Other Eurosystem) Financial Non-financial Central Other
corporations corporations government general corporations corporations government generalother than government other than government
MFIs MFIs1 2 3 4 5 6 7 8 9 10 11 12
2009 89.6 10.2 21.7 8.6 44.9 4.2 89.4 10.1 21.6 8.3 45.2 4.22010 45.6 -1.2 4.8 5.0 31.6 5.3 45.4 -1.4 5.0 5.0 31.8 5.1
2010 Q4 37.7 -19.9 25.5 1.5 22.9 7.7 47.0 -4.5 -1.4 4.3 44.0 4.62011 Q1 63.6 43.0 -20.4 4.2 32.5 4.3 45.5 24.0 -3.9 2.7 16.7 5.9 Q2 64.4 4.9 -1.9 2.8 47.5 11.0 39.0 0.5 -7.0 -0.2 34.2 11.5 Q3 7.4 12.6 -8.0 4.5 -3.8 2.0 42.9 20.1 7.3 6.3 5.6 3.7
2011 Aug. 18.7 27.2 -24.3 1.3 4.8 9.6 47.4 33.3 -18.0 8.4 10.1 13.6 Sep. 15.1 13.6 0.6 3.5 -8.9 6.3 67.6 31.9 42.5 4.8 -20.2 8.6 Oct. 69.4 1.5 34.2 8.3 23.2 2.2 59.2 9.4 12.9 7.4 35.1 -5.7 Nov. 96.2 25.6 8.0 6.4 45.1 11.2 7.3 18.1 -35.2 5.6 8.1 10.7
Long-term
2009 90.2 14.9 24.7 12.8 33.0 4.8 90.3 15.1 24.6 12.8 33.0 4.82010 54.1 1.8 2.1 5.4 41.3 3.5 54.5 1.9 2.3 5.4 41.4 3.5
2010 Q4 70.4 -5.3 16.4 3.0 53.1 3.3 65.6 8.2 -8.7 4.4 58.8 2.92011 Q1 58.4 27.4 -16.6 2.3 40.5 4.9 53.7 17.1 -1.6 2.5 31.2 4.6 Q2 66.6 16.6 -5.6 2.4 46.7 6.5 35.1 5.5 -9.9 -0.6 35.1 5.0 Q3 -6.9 2.8 -4.3 0.9 -6.9 0.6 34.3 10.7 9.5 2.3 9.1 2.7
2011 Aug. -9.6 0.8 -21.9 -1.3 9.0 3.9 28.4 10.2 -13.0 4.6 20.9 5.7 Sep. 2.3 6.9 5.2 2.6 -13.4 1.0 49.1 21.7 41.5 0.6 -16.9 2.2 Oct. 70.2 -10.8 38.1 8.4 31.4 3.1 74.2 -3.9 21.2 9.4 45.2 2.3 Nov. 88.5 1.4 8.6 6.7 63.4 8.4 5.6 5.7 -35.8 6.2 21.0 8.4
C16 Net issues of securities other than shares: seasonally adjusted and non-seasonally adjusted
(EUR billions; transactions during the month; nominal values)
-200
-150
-100
-50
0
50
100
150
200
250
300
2003 2004 2005 2006 2007 2008 2009 2010 2011-200
-150
-100
-50
0
50
100
150
200
250
300
net issuesseasonally adjusted net issues
Source: ECB.1) Monthly data on net issues refer to transactions during the month. For the purposes of comparison, quarterly and annual data refer to the respective monthly averages.

4.3 Growth rates of securities other than shares issued by euro area residents 1) (percentage changes)
S 38ECBMonthly BulletinJanuary 2012
Total
Annual growth rates (non-seasonally adjusted) 6-month seasonally adjusted growth rates
Total MFIs Non-MFI corporations General government Total MFIs Non-MFI corporations General government
(including (includingEurosystem) Financial Non-financial Central Other Eurosystem) Financial Non-financial Central Other
corporations corporations government general corporations corporations government generalother than government other than government
MFIs MFIs1 2 3 4 5 6 7 8 9 10 11 12
2010 Nov. 4.3 0.1 2.5 8.5 8.1 12.8 5.5 0.5 4.9 4.9 9.7 19.1 Dec. 3.6 -0.3 1.8 7.5 7.0 13.2 4.5 0.6 3.2 6.8 8.0 13.3
2011 Jan. 3.7 0.0 1.8 7.1 7.1 13.4 5.0 2.3 3.8 6.8 7.3 10.9 Feb. 4.1 1.6 2.3 5.4 6.7 11.9 4.1 2.5 1.4 6.0 6.4 9.4 Mar. 3.4 0.8 1.3 4.7 5.9 14.5 3.5 2.2 -1.0 5.2 6.3 12.1 Apr. 3.2 0.4 1.2 3.4 6.0 14.6 3.3 2.9 -0.7 2.5 5.3 12.3 May 3.6 1.7 0.4 4.3 6.1 17.4 1.8 3.0 -4.0 3.7 2.7 15.8 June 3.9 1.8 0.5 4.2 6.5 16.1 3.2 2.8 -2.0 1.8 5.2 20.1 July 3.7 1.8 0.4 4.9 6.2 13.3 2.4 1.2 -2.8 2.9 5.1 15.9 Aug. 3.2 1.9 -1.2 5.2 5.6 15.3 2.4 1.2 -3.8 4.4 4.9 22.0 Sep. 3.3 2.3 -0.4 4.8 5.1 14.2 3.1 2.3 0.1 4.4 4.0 16.8 Oct. 3.4 2.9 0.0 4.7 4.7 12.9 3.5 2.9 0.8 6.9 4.2 12.9 Nov. 2.5 3.1 -1.9 5.0 3.0 13.6 3.1 3.2 0.0 6.3 3.4 11.1
Long-term
2010 Nov. 4.8 -0.5 2.1 9.6 10.4 10.9 5.5 0.4 4.1 7.3 10.4 13.0 Dec. 4.8 0.5 0.8 8.8 10.5 9.2 5.6 1.9 1.8 7.4 11.2 6.8
2011 Jan. 4.8 0.4 0.8 8.0 11.0 8.3 6.2 3.7 2.0 7.4 10.9 7.5 Feb. 5.0 1.7 1.3 6.4 10.1 8.6 5.6 4.1 0.2 6.0 10.0 8.5 Mar. 4.3 0.8 0.3 5.7 9.4 9.0 5.1 3.3 -1.9 5.6 11.0 9.4 Apr. 4.3 0.9 0.2 5.0 9.5 9.5 4.8 3.4 -1.5 4.0 10.0 8.7 May 4.5 2.0 -0.5 5.2 9.1 12.1 3.4 3.6 -4.8 3.1 7.9 11.0 June 4.6 2.4 -0.3 4.4 9.4 9.4 3.7 2.9 -2.2 1.5 7.8 11.9 July 4.4 2.5 -0.5 4.7 8.7 9.8 2.7 1.4 -2.9 2.1 6.6 12.2 Aug. 4.0 2.6 -1.8 4.4 8.4 10.2 2.5 1.1 -3.9 2.9 6.8 12.1 Sep. 4.0 2.7 -1.0 3.4 7.9 9.4 2.9 2.1 -0.1 1.3 5.0 9.3 Oct. 4.0 2.5 -0.1 3.5 7.6 8.7 3.2 1.7 1.4 3.1 5.3 8.5 Nov. 3.3 2.7 -2.0 4.0 6.4 10.0 3.1 1.8 0.6 4.9 4.9 9.1
C17 Annual growth rates of long-term debt securities, by sector of the issuer, in all currencies combined
(annual percentage changes)
-5
0
5
10
15
20
25
30
35
1994 1995 1996 1997 1998 1999 2000 2001 2002 2003 2004 2005 2006 2007 2008 2009 2010 2011-5
0
5
10
15
20
25
30
35
general governmentMFIs (including Eurosystem)non-MFI corporations
Source: ECB.1) For details of the calculation of the growth rates, see the Technical Notes. The six-month growth rates have been annualised.

EURO AREASTATISTICS
Financialmarkets
4.3 Growth rates of securities other than shares issued by euro area residents 1) (cont'd) (percentage changes)
S 39ECB
Monthly BulletinJanuary 2012
In all currencies combined
Long-term fixed rate Long-term variable rate
Total MFIs Non-MFI corporations General government Total MFIs Non-MFI corporations General government
(including (includingEurosystem) Financial Non-financial Central Other Eurosystem) Financial Non-financial Central Other
corporations corporations government general corporations corporations government generalother than government other than government
MFIs MFIs13 14 15 16 17 18 19 20 21 22 23 24
2009 9.5 7.1 17.3 25.3 8.0 5.4 12.2 1.7 36.9 -1.8 -0.3 22.22010 8.8 5.8 6.4 19.7 9.9 8.8 -0.6 -3.9 0.7 -1.5 6.4 27.5
2010 Q4 7.0 2.8 3.2 12.4 9.8 7.2 -0.2 -3.3 -0.9 -1.0 12.1 25.72011 Q1 6.9 3.4 3.2 9.2 9.7 5.6 0.5 -1.8 -1.9 -1.2 19.0 20.0 Q2 6.5 4.6 3.7 6.4 8.2 7.9 -0.4 -2.1 -4.5 -1.5 23.5 18.4 Q3 6.6 6.2 4.3 5.2 7.4 8.9 -1.4 -1.4 -7.6 -2.3 25.7 13.0
2011 June 7.0 5.9 4.4 5.3 8.3 8.6 -0.7 -1.2 -6.2 -1.9 25.7 12.3 July 6.8 6.1 4.4 5.5 7.7 9.0 -1.3 -1.3 -7.2 -1.8 24.4 12.7 Aug. 6.5 6.3 3.9 5.2 7.2 9.4 -1.9 -1.5 -8.5 -2.2 25.6 13.4 Sep. 6.1 6.3 4.6 4.3 6.4 8.3 -1.4 -1.2 -8.1 -3.7 28.3 13.4 Oct. 5.7 5.7 3.5 4.2 6.2 7.5 -0.5 -1.0 -5.9 -2.9 25.8 12.7 Nov. 5.2 5.1 1.6 4.6 5.8 8.5 -1.6 0.0 -7.4 -2.3 14.6 15.1
In euro
2009 10.0 9.0 20.4 23.6 8.3 4.4 14.7 3.9 39.3 -2.3 -0.4 21.42010 9.1 5.6 7.4 20.1 10.0 8.3 -0.3 -3.3 0.5 -1.9 5.9 26.2
2010 Q4 7.2 1.6 4.2 12.8 10.0 6.6 0.1 -2.4 -1.3 -1.5 12.3 26.52011 Q1 7.0 2.2 3.4 9.5 9.9 4.5 1.0 -0.1 -2.7 -1.7 19.1 21.0 Q2 6.6 3.8 4.1 6.5 8.5 7.3 0.3 -0.6 -4.6 -2.6 23.5 18.1 Q3 6.7 5.4 4.5 5.9 7.6 8.6 -1.1 -0.2 -8.3 -3.4 25.6 11.1
2011 June 7.1 5.0 4.8 6.0 8.5 8.1 0.0 0.1 -6.0 -2.4 25.5 10.6 July 6.9 5.3 4.7 6.3 7.9 8.4 -1.2 -0.2 -8.2 -3.2 24.3 10.7 Aug. 6.6 5.6 4.0 6.0 7.4 9.0 -1.6 -0.5 -9.1 -3.6 25.6 11.5 Sep. 6.1 5.7 4.5 4.8 6.6 8.4 -1.4 0.0 -9.4 -4.5 28.3 11.4 Oct. 5.8 5.4 3.4 4.5 6.4 8.2 0.0 0.5 -6.5 -3.9 25.6 11.0 Nov. 5.4 5.1 1.8 4.7 6.1 9.0 -1.1 1.5 -7.9 -3.3 14.3 13.7
C18 Annual growth rates of short-term debt securities, by sector of the issuer, in all currencies combined
(annual percentage changes)
-60
-40
-20
0
20
40
60
80
1994 1995 1996 1997 1998 1999 2000 2001 2002 2003 2004 2005 2006 2007 2008 2009 2010 2011-60
-40
-20
0
20
40
60
80
general governmentMFIs (including Eurosystem)non-MFI corporations
Source: ECB.1) Annual percentage changes for monthly data refer to the end of the month, whereas those for quarterly and yearly data refer to the annual change in the period average. See the Technical Notes for details.

4.4 Quoted shares issued by euro area residents 1) (EUR billions, unless otherwise indicated; market values)
S 40ECBMonthly BulletinJanuary 2012
1. Outstanding amounts and annual growth rates(outstanding amounts as at end of period)
Total MFIs Financial corporations other than MFIs Non-financial corporations
Total Index: Annual Total Annual Total Annual Total AnnualDec. 2008 = 100 growth growth growth growth
rates (%) rates (%) rates (%) rates (%)
1 2 3 4 5 6 7 8 9
2009 Nov. 4,079.4 102.6 2.7 563.8 8.8 319.9 2.2 3,195.7 1.9 Dec. 4,410.6 103.0 3.0 566.0 9.2 350.9 5.4 3,493.7 1.8
2010 Jan. 4,242.8 103.1 2.9 516.7 8.3 340.7 5.4 3,385.4 1.9 Feb. 4,161.5 103.2 3.0 499.3 8.3 339.2 5.4 3,323.0 2.0 Mar. 4,474.4 103.4 2.8 543.6 7.5 365.2 5.4 3,565.5 1.8 Apr. 4,409.1 103.4 2.7 508.4 7.1 345.7 5.4 3,555.0 1.7 May 4,093.4 103.5 2.4 445.9 6.3 322.7 5.3 3,324.9 1.5 June 4,054.6 103.7 1.9 446.4 5.7 315.5 4.4 3,292.7 1.0 July 4,256.1 103.7 1.7 519.8 5.1 338.0 4.5 3,398.3 0.9 Aug. 4,121.2 103.7 1.7 479.3 5.1 314.4 4.1 3,327.5 0.9 Sep. 4,345.2 103.8 1.6 487.0 5.1 326.6 4.0 3,531.6 0.9 Oct. 4,531.0 104.2 1.8 514.4 7.3 333.5 4.0 3,683.1 0.8 Nov. 4,413.3 104.4 1.8 437.8 6.8 316.6 5.4 3,658.9 0.8 Dec. 4,596.2 104.4 1.4 458.4 6.5 334.0 2.3 3,803.8 0.7
2011 Jan. 4,759.8 104.6 1.4 514.3 6.2 365.8 3.0 3,879.7 0.6 Feb. 4,845.8 104.7 1.5 535.0 6.8 378.9 3.9 3,931.9 0.6 Mar. 4,767.3 104.8 1.4 491.7 6.2 363.2 4.1 3,912.5 0.5 Apr. 4,891.8 105.0 1.5 497.5 6.8 371.5 4.1 4,022.8 0.6 May 4,777.5 105.0 1.5 475.9 7.4 356.2 4.1 3,945.4 0.4 June 4,722.7 105.5 1.7 491.6 10.2 350.5 4.6 3,880.6 0.4 July 4,504.3 105.7 1.9 458.8 12.1 325.5 4.9 3,720.0 0.4 Aug. 3,975.4 105.9 2.0 383.0 13.4 281.6 4.9 3,310.7 0.4 Sep. 3,749.2 105.9 2.0 350.7 13.1 264.3 5.8 3,134.2 0.3 Oct. 4,044.0 105.9 1.7 361.3 10.2 288.0 5.8 3,394.8 0.3 Nov. 3,893.4 106.0 1.5 330.6 9.1 271.5 4.6 3,291.3 0.3
C19 Annual growth rates for quoted shares issued by euro area residents
(annual percentage changes)
-4
-2
0
2
4
6
8
10
12
14
2000 2001 2002 2003 2004 2005 2006 2007 2008 2009 2010 2011-4
-2
0
2
4
6
8
10
12
14
MFIsfinancial corporations other than MFIsnon-financial corporations
Source: ECB.1) For details of the calculation of the index and the growth rates, see the Technical Notes.

EURO AREASTATISTICS
Financialmarkets
4.4 Quoted shares issued by euro area residents (EUR billions; market values)
S 41ECB
Monthly BulletinJanuary 2012
2. Transactions during the month
Total MFIs Financial corporations other than MFIs Non-financial corporations
Gross issues Redemptions Net issues Gross issues Redemptions Net issues Gross issues Redemptions Net issues Gross issues Redemptions Net issues
1 2 3 4 5 6 7 8 9 10 11 12
2009 Nov. 11.6 0.2 11.4 9.0 0.0 9.0 1.0 0.0 1.0 1.6 0.2 1.4 Dec. 16.2 0.2 16.1 1.9 0.0 1.9 10.4 0.1 10.3 4.0 0.1 3.9
2010 Jan. 6.4 0.0 6.4 4.1 0.0 4.1 0.1 0.0 0.1 2.3 0.0 2.3 Feb. 2.2 0.3 1.9 0.0 0.0 0.0 0.2 0.0 0.2 2.0 0.3 1.7 Mar. 9.6 0.6 9.0 2.6 0.0 2.6 0.1 0.0 0.1 6.9 0.6 6.3 Apr. 1.8 0.4 1.5 0.1 0.0 0.0 0.0 0.0 0.0 1.8 0.3 1.5 May 3.2 0.8 2.4 1.9 0.0 1.9 0.1 0.0 0.1 1.3 0.8 0.4 June 8.4 0.4 8.0 2.2 0.0 2.2 0.4 0.0 0.4 5.8 0.4 5.4 July 3.6 0.8 2.7 0.7 0.0 0.7 0.5 0.0 0.5 2.4 0.8 1.6 Aug. 1.4 1.2 0.2 0.0 0.0 0.0 0.0 0.0 0.0 1.4 1.2 0.2 Sep. 1.6 0.2 1.4 0.2 0.0 0.2 0.0 0.0 0.0 1.4 0.2 1.2 Oct. 16.3 0.2 16.0 14.0 0.0 14.0 0.2 0.1 0.1 2.0 0.2 1.9 Nov. 13.5 1.5 12.0 5.9 0.0 5.9 5.5 0.1 5.4 2.1 1.4 0.7 Dec. 3.7 3.5 0.2 0.2 0.0 0.2 0.9 0.3 0.5 2.7 3.2 -0.5
2011 Jan. 6.1 1.3 4.8 1.7 0.0 1.7 2.6 0.0 2.6 1.8 1.3 0.5 Feb. 7.1 0.2 6.9 2.9 0.0 2.9 3.2 0.0 3.2 1.1 0.2 0.8 Mar. 4.4 1.0 3.5 0.1 0.0 0.1 1.0 0.2 0.8 3.3 0.7 2.6 Apr. 27.3 18.5 8.8 2.7 0.0 2.7 0.1 0.0 0.1 24.5 18.5 6.0 May 8.6 8.8 -0.2 6.8 2.1 4.6 0.2 0.0 0.2 1.6 6.6 -5.0 June 23.7 1.3 22.5 14.7 0.0 14.7 2.3 0.3 2.0 6.7 1.0 5.7 July 12.4 0.7 11.7 9.3 0.0 9.3 1.6 0.0 1.6 1.5 0.7 0.8 Aug. 7.1 1.1 6.0 5.5 0.0 5.5 0.3 0.2 0.1 1.3 0.9 0.4 Sep. 2.9 2.9 0.0 0.0 0.9 -0.9 2.3 0.0 2.3 0.5 2.0 -1.4 Oct. 3.1 0.4 2.7 0.7 0.0 0.7 0.1 0.0 0.1 2.3 0.4 1.9 Nov. 2.6 1.5 1.1 0.7 0.0 0.7 1.4 0.0 1.4 0.5 1.5 -1.0
C20 Gross issues of quoted shares by sector of the issuer
(EUR billions; transactions during the month; market values)
0
5
10
15
20
25
30
35
40
1999 2000 2001 2002 2003 2004 2005 2006 2007 2008 2009 2010 20110
5
10
15
20
25
30
35
40
MFIsfinancial corporations other than MFIsnon-financial corporations
Source: ECB.

4.5 MFI interest rates on euro-denominated deposits from and loans to euro area residents 1) (percentages per annum; outstanding amounts as at end of period, new business as period average, unless otherwise indicated)
S 42ECBMonthly BulletinJanuary 2012
1. Interest rates on deposits (new business)
Deposits from households Deposits from non-financial corporations Repos
Overnight With an agreed maturity of: Redeemable at notice of: 2) Overnight With an agreed maturity of:
Up to 1 year Over 1 and Over 2 years Up to 3 months Over 3 months Up to 1 year Over 1 and Over 2 yearsup to 2 years up to 2 years
1 2 3 4 5 6 7 8 9 10 11
2010 Dec. 0.43 2.27 2.77 2.59 1.55 1.84 0.50 1.19 2.56 2.60 1.07
2011 Jan. 0.43 2.38 2.61 2.77 1.53 1.85 0.54 1.29 2.42 2.52 1.02 Feb. 0.44 2.36 2.74 2.80 1.60 1.86 0.52 1.32 2.37 2.69 1.04 Mar. 0.45 2.34 2.78 2.90 1.61 1.88 0.54 1.37 2.53 2.81 1.14 Apr. 0.46 2.47 2.85 3.08 1.65 1.90 0.61 1.58 2.62 2.95 1.30 May 0.49 2.52 2.96 3.07 1.67 1.91 0.63 1.65 2.78 3.08 1.30 June 0.49 2.58 3.25 3.15 1.70 1.92 0.67 1.78 2.82 2.94 1.47 July 0.52 2.74 3.16 3.10 1.70 1.93 0.66 1.77 2.66 3.03 1.41 Aug. 0.54 2.73 3.16 2.99 1.77 1.93 0.68 1.64 2.69 2.99 1.42 Sep. 0.55 2.73 3.15 2.92 1.79 1.94 0.69 1.71 2.72 2.79 1.47 Oct. 0.55 2.88 3.17 3.14 1.80 1.96 0.69 1.67 2.74 3.23 1.65 Nov. 0.55 2.78 3.08 3.03 1.80 1.96 0.67 1.46 2.60 2.84 1.62
2. Interest rates on loans to households (new business)
Revolving Extended Consumer credit Lending for house purchase Lending to sole proprietors andloans and credit card unincorporated partnerships
overdrafts debt 3) By initial rate fixation APRC 4) By initial rate fixation APRC 4) By initial rate fixation
Floating rate Over 1 Over Floating rate Over 1 Over 5 Over Floating rate Over 1 Overand up to and up to 5 years and up to and up to and up to 10 years and up to and up to 5 years
1 year 5 years 1 year 5 years 10 years 1 year 5 years
1 2 3 4 5 6 7 8 9 10 11 12 13 14
2010 Dec. 8.02 16.59 5.16 5.95 7.24 6.89 2.78 3.52 3.80 3.71 3.68 3.36 4.32 3.96
2011 Jan. 8.06 16.73 5.09 6.13 7.83 7.20 2.94 3.69 3.91 3.84 3.83 3.21 4.24 4.08 Feb. 8.09 16.81 5.38 6.13 7.83 7.31 2.96 3.83 4.06 3.92 3.90 3.36 4.63 4.30 Mar. 8.04 16.88 5.44 6.22 7.82 7.32 3.01 3.82 4.15 4.01 3.93 3.43 4.69 4.43 Apr. 8.12 16.92 5.17 6.23 7.80 7.25 3.12 3.95 4.24 4.15 4.03 3.54 4.68 4.53 May 8.19 16.91 5.35 6.37 7.99 7.49 3.23 4.01 4.30 4.18 4.09 3.75 4.81 4.60 June 8.24 16.95 5.37 6.47 7.87 7.42 3.26 4.04 4.29 4.18 4.09 3.82 4.78 4.62 July 8.28 16.94 5.13 6.53 7.98 7.43 3.33 4.02 4.26 4.19 4.10 3.83 4.82 4.60 Aug. 8.31 17.10 5.34 6.54 7.97 7.57 3.47 3.96 4.20 4.15 4.16 3.95 4.96 4.39 Sep. 8.41 17.18 5.77 6.57 7.94 7.64 3.41 3.86 4.02 4.02 4.02 3.97 4.86 4.20 Oct. 8.43 17.18 5.60 6.53 7.94 7.54 3.44 3.79 3.86 3.94 3.95 3.98 4.76 4.16 Nov. 8.41 17.12 5.55 6.48 7.80 7.40 3.43 3.74 3.84 3.93 3.96 4.22 4.91 4.04
3. Interest rates on loans to non-financial corporations (new business)
Revolving Other loans of up to EUR 0.25 million Other loans of over EUR 1 millionloans and by initial rate fixation by initial rate fixation
overdraftsFloating rate Over 3 months Over 1 Over 3 Over 5 Over Floating rate Over 3 months Over 1 Over 3 Over 5 Over
and up to and up to and up to and up to and up to 10 years and up to and up to and up to and up to and up to 10 years3 months 1 year 3 years 5 years 10 years 3 months 1 year 3 years 5 years 10 years
1 2 3 4 5 6 7 8 9 10 11 12 13
2010 Dec. 3.99 3.81 3.99 4.42 4.64 4.09 3.73 2.52 2.83 2.69 3.02 3.54 3.48
2011 Jan. 4.11 3.82 4.07 4.35 4.63 4.03 3.88 2.37 2.90 2.64 3.55 3.67 3.85 Feb. 4.12 3.98 4.21 4.48 4.89 4.39 3.94 2.55 3.06 2.96 3.86 3.88 3.75 Mar. 4.12 4.02 4.39 4.63 5.00 4.49 4.02 2.53 3.26 3.00 3.61 3.84 3.84 Apr. 4.25 4.07 4.47 4.73 5.05 4.57 4.15 2.72 3.31 3.38 3.78 4.36 4.15 May 4.30 4.18 4.65 4.79 5.14 4.67 4.19 2.65 3.37 3.17 3.63 3.65 4.11 June 4.41 4.23 4.68 4.74 5.16 4.67 4.44 2.78 3.49 3.50 3.61 2.77 4.00 July 4.43 4.38 4.79 4.79 5.10 4.68 4.44 2.88 3.45 3.46 3.98 4.09 3.24 Aug. 4.49 4.44 4.94 4.85 5.03 4.58 4.35 2.80 3.56 3.70 3.99 3.87 4.06 Sep. 4.55 4.59 4.94 4.79 4.94 4.46 4.31 2.84 3.44 3.74 3.63 3.64 3.74 Oct. 4.60 4.70 5.10 4.86 4.99 4.56 4.27 2.98 3.55 3.85 3.89 3.60 3.71 Nov. 4.61 4.76 5.15 4.98 5.10 4.66 4.26 2.81 3.69 3.51 3.92 3.60 3.71
Source: ECB.1) Data refer to the changing composition of the euro area. For further information, see the General Notes.2) For this instrument category, households and non-financial corporations are merged and allocated to the household sector, since the outstanding amounts of non-financial
corporations are negligible compared with those of the household sector when all participating Member States are combined.3) This instrument category excludes convenience credit card debt, i.e. credit granted at an interest rate of 0% during the billing cycle.4) The annual percentage rate of charge (APRC) covers the total cost of a loan. The total cost comprises both an interest rate component and a component incorporating
other (related) charges, such as the cost of inquiries, administration, preparation of documents and guarantees.
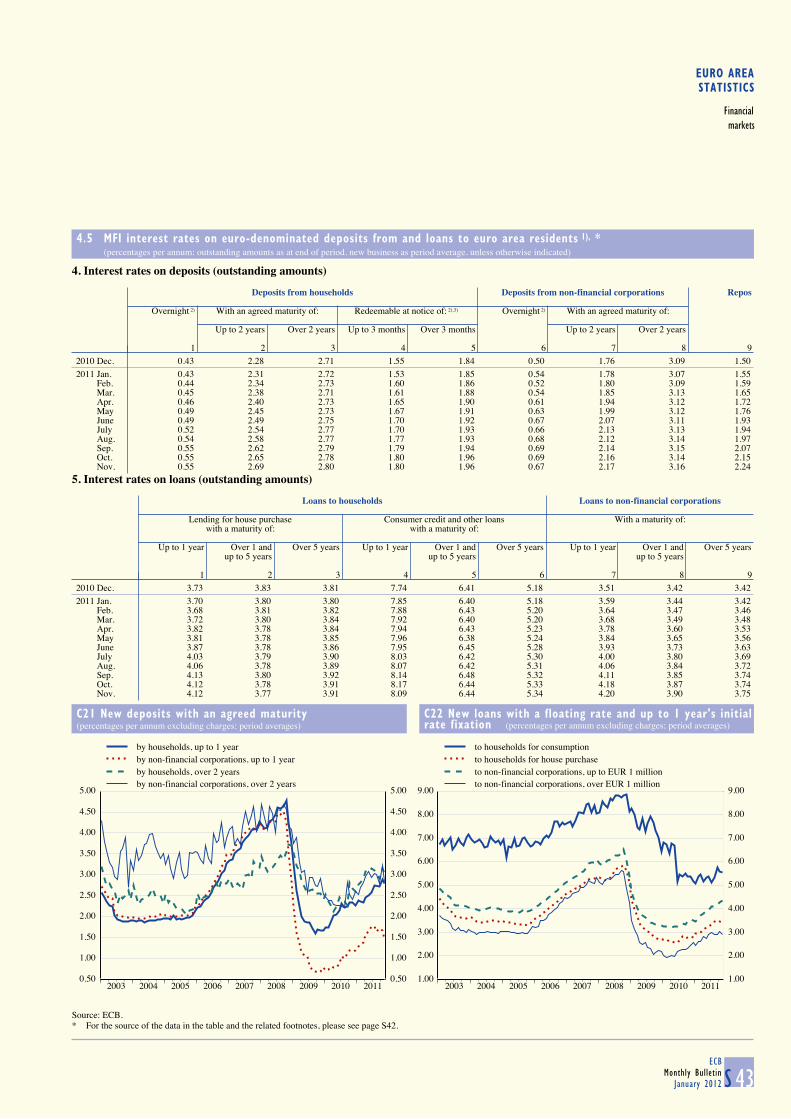
EURO AREASTATISTICS
Financialmarkets
4.5 MFI interest rates on euro-denominated deposits from and loans to euro area residents 1), * (percentages per annum; outstanding amounts as at end of period, new business as period average, unless otherwise indicated)
S 43ECB
Monthly BulletinJanuary 2012
4. Interest rates on deposits (outstanding amounts)
Deposits from households Deposits from non-financial corporations Repos
Overnight 2) With an agreed maturity of: Redeemable at notice of: 2),3) Overnight 2) With an agreed maturity of:
Up to 2 years Over 2 years Up to 3 months Over 3 months Up to 2 years Over 2 years
1 2 3 4 5 6 7 8 9
2010 Dec. 0.43 2.28 2.71 1.55 1.84 0.50 1.76 3.09 1.50
2011 Jan. 0.43 2.31 2.72 1.53 1.85 0.54 1.78 3.07 1.55 Feb. 0.44 2.34 2.73 1.60 1.86 0.52 1.80 3.09 1.59 Mar. 0.45 2.38 2.71 1.61 1.88 0.54 1.85 3.13 1.65 Apr. 0.46 2.40 2.73 1.65 1.90 0.61 1.94 3.12 1.72 May 0.49 2.45 2.73 1.67 1.91 0.63 1.99 3.12 1.76 June 0.49 2.49 2.75 1.70 1.92 0.67 2.07 3.11 1.93 July 0.52 2.54 2.77 1.70 1.93 0.66 2.13 3.13 1.94 Aug. 0.54 2.58 2.77 1.77 1.93 0.68 2.12 3.14 1.97 Sep. 0.55 2.62 2.79 1.79 1.94 0.69 2.14 3.15 2.07 Oct. 0.55 2.65 2.78 1.80 1.96 0.69 2.16 3.14 2.15 Nov. 0.55 2.69 2.80 1.80 1.96 0.67 2.17 3.16 2.24
5. Interest rates on loans (outstanding amounts)
Loans to households Loans to non-financial corporations
Lending for house purchase Consumer credit and other loans With a maturity of:
with a maturity of: with a maturity of:
Up to 1 year Over 1 and Over 5 years Up to 1 year Over 1 and Over 5 years Up to 1 year Over 1 and Over 5 yearsup to 5 years up to 5 years up to 5 years
1 2 3 4 5 6 7 8 9
2010 Dec. 3.73 3.83 3.81 7.74 6.41 5.18 3.51 3.42 3.42
2011 Jan. 3.70 3.80 3.80 7.85 6.40 5.18 3.59 3.44 3.42 Feb. 3.68 3.81 3.82 7.88 6.43 5.20 3.64 3.47 3.46 Mar. 3.72 3.80 3.84 7.92 6.40 5.20 3.68 3.49 3.48 Apr. 3.82 3.78 3.84 7.94 6.43 5.23 3.78 3.60 3.53 May 3.81 3.78 3.85 7.96 6.38 5.24 3.84 3.65 3.56 June 3.87 3.78 3.86 7.95 6.45 5.28 3.93 3.73 3.63 July 4.03 3.79 3.90 8.03 6.42 5.30 4.00 3.80 3.69 Aug. 4.06 3.78 3.89 8.07 6.42 5.31 4.06 3.84 3.72 Sep. 4.13 3.80 3.92 8.14 6.48 5.32 4.11 3.85 3.74 Oct. 4.12 3.78 3.91 8.17 6.44 5.33 4.18 3.87 3.74 Nov. 4.12 3.77 3.91 8.09 6.44 5.34 4.20 3.90 3.75
C21 New deposits with an agreed maturity
(percentages per annum excluding charges; period averages)
C22 New loans with a floating rate and up to 1 year's initial
rate fixation (percentages per annum excluding charges; period averages)
0.50
1.00
1.50
2.00
2.50
3.00
3.50
4.00
4.50
5.00
2003 2004 2005 2006 2007 2008 2009 2010 20110.50
1.00
1.50
2.00
2.50
3.00
3.50
4.00
4.50
5.00
by households, up to 1 yearby non-financial corporations, up to 1 yearby households, over 2 yearsby non-financial corporations, over 2 years
1.00
2.00
3.00
4.00
5.00
6.00
7.00
8.00
9.00
2003 2004 2005 2006 2007 2008 2009 2010 20111.00
2.00
3.00
4.00
5.00
6.00
7.00
8.00
9.00
to households for consumptionto households for house purchaseto non-financial corporations, up to EUR 1 millionto non-financial corporations, over EUR 1 million
Source: ECB.* For the source of the data in the table and the related footnotes, please see page S42.

4.6 Money market interest rates (percentages per annum; period averages)
S 44ECBMonthly BulletinJanuary 2012
Euro area 1), 2) United States Japan
Overnight 1-month 3-month 6-month 12-month 3-month 3-monthdeposits deposits deposits deposits deposits deposits deposits
(EONIA) (EURIBOR) (EURIBOR) (EURIBOR) (EURIBOR) (LIBOR) (LIBOR)
1 2 3 4 5 6 7
2009 0.71 0.89 1.22 1.43 1.61 0.69 0.472010 0.44 0.57 0.81 1.08 1.35 0.34 0.232011 0.87 1.18 1.39 1.64 2.01 0.34 0.19
2010 Q4 0.59 0.81 1.02 1.25 1.52 0.29 0.192011 Q1 0.67 0.86 1.10 1.37 1.74 0.31 0.19 Q2 1.04 1.22 1.42 1.70 2.13 0.26 0.20 Q3 0.97 1.38 1.56 1.77 2.11 0.30 0.19 Q4 0.79 1.24 1.50 1.72 2.05 0.48 0.20
2010 Dec. 0.50 0.81 1.02 1.25 1.53 0.30 0.18
2011 Jan. 0.66 0.79 1.02 1.25 1.55 0.30 0.19 Feb. 0.71 0.89 1.09 1.35 1.71 0.31 0.19 Mar. 0.66 0.90 1.18 1.48 1.92 0.31 0.20 Apr. 0.97 1.13 1.32 1.62 2.09 0.28 0.20 May 1.03 1.24 1.43 1.71 2.15 0.26 0.20 June 1.12 1.28 1.49 1.75 2.14 0.25 0.20 July 1.01 1.42 1.60 1.82 2.18 0.25 0.20 Aug. 0.91 1.37 1.55 1.75 2.10 0.29 0.19 Sep. 1.01 1.35 1.54 1.74 2.07 0.35 0.19 Oct. 0.96 1.36 1.58 1.78 2.11 0.41 0.19 Nov. 0.79 1.23 1.48 1.71 2.04 0.48 0.20 Dec. 0.63 1.14 1.43 1.67 2.00 0.56 0.20
C23 Euro area money market rates 1), 2)
(monthly averages; percentages per annum)
C24 3-month money market rates
(monthly averages; percentages per annum)
0.00
1.00
2.00
3.00
4.00
5.00
6.00
7.00
8.00
9.00
1994 1996 1998 2000 2002 2004 2006 2008 20100.00
1.00
2.00
3.00
4.00
5.00
6.00
7.00
8.00
9.00
1-month rate3-month rate12-month rate
0.00
1.00
2.00
3.00
4.00
5.00
6.00
7.00
8.00
9.00
1994 1996 1998 2000 2002 2004 2006 2008 20100.00
1.00
2.00
3.00
4.00
5.00
6.00
7.00
8.00
9.00
euro areaJapanUnited States
Source: ECB.1) Before January 1999 synthetic euro area rates were calculated on the basis of national rates weighted by GDP. For further information, see the General Notes.2) Data refer to the changing composition of the euro area. For further information, see the General Notes.
1), 2)
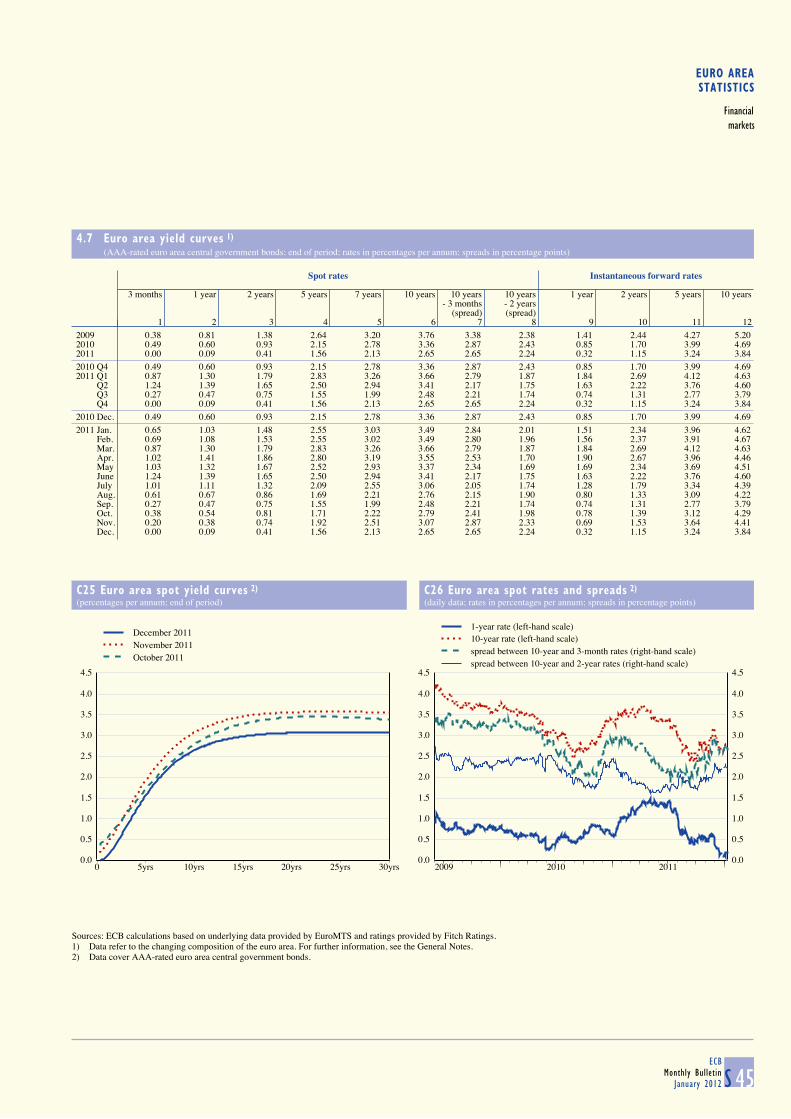
EURO AREASTATISTICS
Financialmarkets
4.7 Euro area yield curves 1)
(AAA-rated euro area central government bonds; end of period; rates in percentages per annum; spreads in percentage points)
S 45ECB
Monthly BulletinJanuary 2012
Spot rates Instantaneous forward rates
3 months 1 year 2 years 5 years 7 years 10 years 10 years 10 years 1 year 2 years 5 years 10 years- 3 months - 2 years
(spread) (spread)1 2 3 4 5 6 7 8 9 10 11 12
2009 0.38 0.81 1.38 2.64 3.20 3.76 3.38 2.38 1.41 2.44 4.27 5.202010 0.49 0.60 0.93 2.15 2.78 3.36 2.87 2.43 0.85 1.70 3.99 4.692011 0.00 0.09 0.41 1.56 2.13 2.65 2.65 2.24 0.32 1.15 3.24 3.84
2010 Q4 0.49 0.60 0.93 2.15 2.78 3.36 2.87 2.43 0.85 1.70 3.99 4.692011 Q1 0.87 1.30 1.79 2.83 3.26 3.66 2.79 1.87 1.84 2.69 4.12 4.63 Q2 1.24 1.39 1.65 2.50 2.94 3.41 2.17 1.75 1.63 2.22 3.76 4.60 Q3 0.27 0.47 0.75 1.55 1.99 2.48 2.21 1.74 0.74 1.31 2.77 3.79 Q4 0.00 0.09 0.41 1.56 2.13 2.65 2.65 2.24 0.32 1.15 3.24 3.84
2010 Dec. 0.49 0.60 0.93 2.15 2.78 3.36 2.87 2.43 0.85 1.70 3.99 4.69
2011 Jan. 0.65 1.03 1.48 2.55 3.03 3.49 2.84 2.01 1.51 2.34 3.96 4.62 Feb. 0.69 1.08 1.53 2.55 3.02 3.49 2.80 1.96 1.56 2.37 3.91 4.67 Mar. 0.87 1.30 1.79 2.83 3.26 3.66 2.79 1.87 1.84 2.69 4.12 4.63 Apr. 1.02 1.41 1.86 2.80 3.19 3.55 2.53 1.70 1.90 2.67 3.96 4.46 May 1.03 1.32 1.67 2.52 2.93 3.37 2.34 1.69 1.69 2.34 3.69 4.51 June 1.24 1.39 1.65 2.50 2.94 3.41 2.17 1.75 1.63 2.22 3.76 4.60 July 1.01 1.11 1.32 2.09 2.55 3.06 2.05 1.74 1.28 1.79 3.34 4.39 Aug. 0.61 0.67 0.86 1.69 2.21 2.76 2.15 1.90 0.80 1.33 3.09 4.22 Sep. 0.27 0.47 0.75 1.55 1.99 2.48 2.21 1.74 0.74 1.31 2.77 3.79 Oct. 0.38 0.54 0.81 1.71 2.22 2.79 2.41 1.98 0.78 1.39 3.12 4.29 Nov. 0.20 0.38 0.74 1.92 2.51 3.07 2.87 2.33 0.69 1.53 3.64 4.41 Dec. 0.00 0.09 0.41 1.56 2.13 2.65 2.65 2.24 0.32 1.15 3.24 3.84
C25 Euro area spot yield curves 2)
(percentages per annum; end of period)
C26 Euro area spot rates and spreads 2)
(daily data; rates in percentages per annum; spreads in percentage points)
0.0
0.5
1.0
1.5
2.0
2.5
3.0
3.5
4.0
4.5
0 5yrs 10yrs 15yrs 20yrs 25yrs 30yrs
December 2011November 2011October 2011
0.0
0.5
1.0
1.5
2.0
2.5
3.0
3.5
4.0
4.5
2009 2010 20110.0
0.5
1.0
1.5
2.0
2.5
3.0
3.5
4.0
4.5
1-year rate (left-hand scale)10-year rate (left-hand scale)spread between 10-year and 3-month rates (right-hand scale)spread between 10-year and 2-year rates (right-hand scale)
Sources: ECB calculations based on underlying data provided by EuroMTS and ratings provided by Fitch Ratings.1) Data refer to the changing composition of the euro area. For further information, see the General Notes.2) Data cover AAA-rated euro area central government bonds.

4.8 Stock market indices (index levels in points; period averages)
S 46ECBMonthly BulletinJanuary 2012
Dow Jones EURO STOXX indices 1) United Japan
States Benchmark Main industry indices
Broad 50 Basic Consumer Consumer Oil and Financials Industrials Technology Utilities Telecoms Health care Standard Nikkeiindex materials services goods gas & Poor’s 225
500
1 2 3 4 5 6 7 8 9 10 11 12 13 14
2009 234.2 2,521.0 353.2 140.5 244.5 293.5 172.1 269.7 200.7 353.7 380.4 363.5 946.2 9,321.62010 265.5 2,779.3 463.1 166.2 323.4 307.2 182.8 337.6 224.1 344.9 389.6 408.4 1,140.0 10,006.52011 256.0 2,611.0 493.4 158.1 351.2 311.6 152.6 349.4 222.5 301.7 358.4 432.7 1,267.6 9,425.4
2010 Q4 273.4 2,817.8 513.8 176.1 361.3 309.9 175.7 361.9 227.0 333.0 399.2 405.0 1,204.6 9,842.42011 Q1 285.5 2,932.9 532.7 175.5 366.3 341.1 185.0 388.0 249.6 347.7 396.7 415.0 1,302.5 10,285.3 Q2 281.2 2,862.7 552.0 169.6 370.7 328.8 175.2 391.5 239.7 333.7 385.0 448.4 1,318.3 9,609.4 Q3 236.0 2,381.6 463.7 146.0 341.5 282.0 133.8 323.0 199.8 270.2 333.0 435.0 1,225.3 9,246.3 Q4 222.4 2,277.8 427.1 142.1 327.1 295.5 117.2 296.6 201.8 256.5 320.3 432.4 1,225.7 8,580.6
2010 Dec. 276.5 2,825.6 540.1 176.8 376.5 316.7 170.0 379.7 234.1 332.6 385.3 404.6 1,241.5 10,254.5
2011 Jan. 282.8 2,900.7 531.1 178.1 375.3 335.1 178.0 385.8 246.1 346.2 390.7 411.8 1,282.6 10,449.5 Feb. 292.3 3,015.7 540.5 179.0 369.7 348.0 193.5 393.1 257.6 359.0 402.9 418.7 1,321.1 10,622.3 Mar. 281.9 2,890.4 527.4 170.1 355.0 340.5 184.1 385.7 245.9 339.1 396.8 414.6 1,304.5 9,852.4 Apr. 287.5 2,947.2 557.3 172.5 366.6 343.8 182.4 397.9 250.0 346.9 402.8 435.4 1,331.5 9,644.6 May 284.0 2,885.8 557.0 171.7 374.9 330.4 176.3 395.5 246.5 337.8 386.4 457.8 1,338.3 9,650.8 June 272.9 2,766.6 542.5 164.9 370.0 314.3 168.0 382.0 224.1 318.3 368.2 450.3 1,287.3 9,541.5 July 270.5 2,743.5 550.7 160.8 384.4 317.4 160.6 375.7 221.0 307.8 360.0 467.4 1,325.2 9,996.7 Aug. 226.9 2,297.2 443.7 141.1 329.7 268.6 129.0 307.3 189.7 258.4 329.3 420.7 1,185.3 9,072.9 Sep. 212.6 2,124.3 401.4 137.0 312.8 262.4 113.3 289.2 190.1 246.7 311.1 419.0 1,173.9 8,695.4 Oct. 226.1 2,312.3 424.8 142.4 325.6 290.2 123.1 302.3 203.0 269.9 334.1 426.1 1,207.2 8,733.6 Nov. 219.2 2,239.6 423.6 141.5 325.9 293.5 112.8 292.2 205.7 250.6 316.6 423.3 1,226.4 8,506.1 Dec. 222.2 2,283.3 433.2 142.4 329.9 302.9 115.9 295.5 196.6 249.3 310.3 448.4 1,243.3 8,506.0
C27 Dow Jones EURO STOXX broad index, Standard & Poor's 500 and Nikkei 225
(January 1994 = 100; monthly averages)
0
50
100
150
200
250
300
350
1994 1995 1996 1997 1998 1999 2000 2001 2002 2003 2004 2005 2006 2007 2008 2009 2010 20110
50
100
150
200
250
300
350
Dow Jones EURO STOXX broad indexStandard & Poor’s 500Nikkei 225
Source: ECB.1) Data refer to the changing composition of the euro area. For further information, see the General Notes.
1)

LABOUR MARKETS 5PRICES, OUTPUT, DEMAND AND
5.1 HICP, other prices and costs (annual percentage changes, unless otherwise indicated)
S 47ECB
Monthly BulletinJanuary 2012
1. Harmonised Index of Consumer Prices 1)
Total Total (s.a.; percentage change vis-à-vis previous period) Memo item: Administered prices 2)
Index: Total Goods Services Total Processed Unprocessed Non-energy Energy Services2005 = 100 food food industrial (n.s.a.) Total HICP Administered
Total excl. goods excluding pricesunprocessed administered
food and energy prices
% of totalin 2011 100.0 100.0 82.3 58.6 41.4 100.0 11.9 7.4 28.9 10.4 41.4 88.7 11.3
1 2 3 4 5 6 7 8 9 10 11 12 13
2007 104.4 2.1 2.0 1.9 2.5 - - - - - - 2.1 2.22008 107.8 3.3 2.4 3.8 2.6 - - - - - - 3.4 2.72009 108.1 0.3 1.3 -0.9 2.0 - - - - - - 0.1 1.82010 109.8 1.6 1.0 1.8 1.4 - - - - - - 1.6 1.5
2010 Q3 109.9 1.7 1.0 2.0 1.4 0.3 0.5 0.6 0.2 0.0 0.5 1.7 2.0 Q4 110.8 2.0 1.1 2.5 1.3 0.5 0.5 0.4 0.3 2.0 0.4 2.0 2.32011 Q1 111.3 2.5 1.3 3.1 1.6 1.0 0.8 0.4 -0.1 6.3 0.5 2.4 3.4 Q2 113.1 2.8 1.8 3.3 1.9 0.8 1.2 0.4 0.5 2.8 0.6 2.7 3.6 Q3 112.8 2.7 1.7 3.2 2.0 0.3 1.1 0.1 -0.3 0.4 0.5 2.6 3.5
2011 July 112.4 2.5 1.5 2.9 2.0 0.0 0.4 -0.1 -0.9 0.8 0.2 2.4 3.5 Aug. 112.6 2.5 1.5 3.0 1.9 0.2 0.3 0.1 0.2 -0.2 0.2 2.4 3.4 Sep. 113.5 3.0 2.0 3.7 1.9 0.5 0.4 0.2 1.2 0.9 0.1 2.9 3.5 Oct. 113.9 3.0 2.0 3.9 1.8 0.2 0.5 0.4 0.2 0.6 0.1 3.0 3.6 Nov. 114.0 3.0 2.0 3.9 1.9 0.2 0.2 0.4 0.1 0.7 0.1 3.0 3.5 Dec. 3) . 2.8 . . . . . . . . . . .
Goods Services
Food (incl. alcoholic beverages and tobacco) Industrial goods Housing Transport Communication Recreation Miscellaneous
andTotal Processed Unprocessed Total Non-energy Energy Rents personal
food food industrialgoods
% of totalin 2011 19.3 11.9 7.4 39.3 28.9 10.4 10.1 6.0 6.5 3.2 14.6 7.0
14 15 16 17 18 19 20 21 22 23 24 25
2007 2.8 2.8 3.0 1.4 1.0 2.6 2.7 2.0 2.6 -1.9 2.9 3.22008 5.1 6.1 3.5 3.1 0.8 10.3 2.3 1.9 3.9 -2.2 3.2 2.52009 0.7 1.1 0.2 -1.7 0.6 -8.1 2.0 1.8 2.9 -1.0 2.1 2.12010 1.1 0.9 1.3 2.2 0.5 7.4 1.8 1.5 2.3 -0.8 1.0 1.5
2010 Q3 1.5 0.9 2.3 2.2 0.5 7.3 1.8 1.6 2.5 -0.8 1.0 1.5 Q4 1.9 1.3 2.7 2.9 0.8 9.2 1.6 1.3 1.9 -0.8 1.2 1.52011 Q1 2.2 2.1 2.3 3.6 0.5 12.7 1.8 1.3 2.0 -0.4 1.5 1.9 Q2 2.6 3.0 1.9 3.7 1.0 11.5 1.9 1.4 3.2 -1.0 2.0 2.1 Q3 2.8 3.7 1.3 3.4 0.4 12.0 1.8 1.5 3.2 -1.8 2.2 2.1
2011 June 2.7 3.1 2.0 3.5 0.9 10.9 1.9 1.5 3.4 -1.2 2.2 2.0 July 2.6 3.4 1.3 3.1 0.0 11.8 1.9 1.5 3.4 -1.6 2.2 2.0 Aug. 2.7 3.6 1.1 3.1 0.0 11.8 1.8 1.5 3.3 -1.8 2.2 2.1 Sep. 3.0 4.0 1.4 4.1 1.2 12.4 1.8 1.4 3.1 -1.9 2.3 2.2 Oct. 3.3 4.3 1.8 4.2 1.3 12.4 1.7 1.4 2.9 -1.9 2.2 2.0 Nov. 3.4 4.3 1.9 4.1 1.3 12.3 1.7 1.3 2.9 -1.7 2.2 2.2
Sources: Eurostat and ECB calculations.1) Data refer to the changing composition of the euro area. For further information, see the General Notes.2) These experimental statistics can only provide an approximate measure of price administration, since changes in administered prices cannot be fully isolated from other influences. Please refer to Eurostat’s website (http://epp.eurostat.ec.europa.eu/portal/page/portal/hicp/introduction) for a note explaining the methodology used in the compilation of this indicator.3) Estimate based on provisional national releases, which usually cover around 95% of the euro area, as well as on early information on energy prices.

5.1 HICP, other prices and costs (annual percentage changes, unless otherwise indicated)
S 48ECBMonthly BulletinJanuary 2012
2. Industry, construction and residential property prices
Industrial producer prices excluding construction Construct- Residential
ion 1) propertyTotal Total Industry excluding construction and energy Energy prices 2)
(index: 2005 = 100) Manu- Total Intermediate Capital Consumer goods
facturing goods goodsTotal Durable Non-durable
% of totalin 2005 100.0 100.0 82.8 75.6 30.0 22.0 23.7 2.7 21.0 24.4
1 2 3 4 5 6 7 8 9 10 11 12
2007 107.9 2.7 3.0 3.2 4.6 2.2 2.2 2.4 2.2 1.2 4.2 4.72008 114.4 6.1 4.8 3.4 3.9 2.1 3.9 2.8 4.1 14.2 3.8 1.32009 108.6 -5.1 -5.4 -2.9 -5.3 0.4 -2.1 1.2 -2.5 -11.8 0.1 -2.92010 111.7 2.9 3.4 1.6 3.5 0.3 0.4 0.9 0.3 6.4 1.9 1.6
2010 Q3 112.3 4.0 3.7 2.3 4.8 0.7 0.6 1.1 0.5 8.7 2.5 2.3 Q4 113.5 4.8 4.6 3.1 5.9 0.8 1.5 1.4 1.5 9.6 2.8 2.42011 Q1 116.7 6.5 6.3 4.4 7.9 1.3 2.5 1.8 2.6 12.5 4.1 1.9 Q2 118.5 6.3 5.8 4.3 6.8 1.3 3.4 1.9 3.7 11.9 3.0 0.9 Q3 118.9 5.9 5.5 3.8 5.6 1.5 3.3 2.2 3.5 11.8 3.2 .
2011 June 118.4 5.9 5.4 4.1 6.3 1.3 3.4 1.8 3.7 10.7 - - July 118.9 6.1 5.8 4.0 6.1 1.5 3.3 1.9 3.5 11.9 - - Aug. 118.7 5.8 5.5 3.9 5.7 1.5 3.3 2.1 3.5 11.4 - - Sep. 119.0 5.8 5.4 3.5 5.0 1.5 3.4 2.5 3.5 12.2 - - Oct. 119.2 5.5 5.0 3.2 4.1 1.5 3.4 2.5 3.5 12.3 - - Nov. 119.4 5.3 4.7 3.0 3.5 1.4 3.4 2.6 3.6 12.3 - -
3. Commodity prices and gross domestic product deflators
Oil prices 3) Non-energy commodity prices GDP deflators
(EUR per barrel) Import-weighted 4) Use-weighted 5) Total Total Domestic demand Exports 6) Imports 6)
(s.a.; index:Total Food Non-food Total Food Non-food 2005 = 100) Total Private Government Gross
consump- consump- fixedtion tion capital
formation
% of total 100.0 35.0 65.0 100.0 45.0 55.0
1 2 3 4 5 6 7 8 9 10 11 12 13 14 15
2008 65.9 2.0 18.4 -4.4 -1.7 9.7 -8.6 106.2 1.9 2.6 2.7 2.8 2.3 2.4 3.92009 44.6 -18.5 -8.9 -23.0 -18.0 -11.4 -22.8 107.1 0.9 -0.1 -0.4 2.1 -0.5 -3.3 -5.92010 60.7 44.6 21.4 57.9 42.1 27.1 54.5 107.9 0.7 1.5 1.7 0.8 1.1 2.7 4.92011 79.7 12.2 22.4 7.7 12.9 20.7 7.5 . . . . . . . .
2010 Q4 64.4 48.6 36.6 54.7 48.7 48.4 48.9 108.2 0.9 1.8 2.1 0.6 1.5 3.9 6.22011 Q1 77.3 42.9 46.1 41.4 41.0 47.2 36.6 108.7 1.1 2.3 2.5 0.6 2.0 4.7 7.7 Q2 81.3 11.6 28.8 4.6 13.3 26.2 5.1 109.1 1.2 2.1 2.7 0.8 1.6 3.2 5.3 Q3 79.3 3.8 16.7 -1.6 4.9 11.7 0.3 109.5 1.3 2.2 2.6 0.8 1.6 2.8 4.8 Q4 80.7 -2.5 3.6 -5.2 -1.7 4.4 -6.0 . . . . . . . .
2011 July 81.7 7.6 18.7 2.9 9.5 15.1 5.6 - - - - - - - - Aug. 76.7 2.5 17.2 -3.6 4.1 12.7 -1.8 - - - - - - - - Sep. 79.8 1.5 14.3 -3.9 1.5 7.5 -2.6 - - - - - - - - Oct. 78.9 1.6 10.7 -2.4 2.5 10.6 -3.2 - - - - - - - - Nov. 81.4 -1.9 4.7 -4.9 -0.7 6.0 -5.5 - - - - - - - - Dec. 81.7 -6.7 -3.7 -8.1 -6.3 -2.5 -9.0 - - - - - - - -
Sources: Eurostat, ECB calculations based on Eurostat data (column 7 in Table 2 in Section 5.1 and columns 8-15 in Table 3 in Section 5.1), ECB calculations based onThomson Reuters data (column 1 in Table 3 in Section 5.1) and ECB calculations (column 12 in Table 2 in Section 5.1 and columns 2-7 in Table 3 in Section 5.1).1) Input prices for residential buildings.2) Experimental data based on non-harmonised national sources (see http://www.ecb.europa.eu/stats/intro/html/experiment.en.html for further details).3) Brent Blend (for one-month forward delivery).4) Refers to prices expressed in euro. Weighted according to the structure of euro area imports in the period 2004-06.5) Refers to prices expressed in euro. Weighted according to euro area domestic demand (domestic production plus imports minus exports) in the period 2004-06. Experimental data
(see http://www.ecb.europa.eu/stats/intro/html/experiment.en.html for details).6) Deflators for exports and imports refer to goods and services and include cross-border trade within the euro area.

EURO AREASTATISTICS
Prices, output,demand and
labour markets
5.1 HICP, other prices and costs (annual percentage changes)
S 49ECB
Monthly BulletinJanuary 2012
4. Unit labour costs, compensation per labour input and labour productivity(quarterly data seasonally adjusted; annual data unadjusted)
Unit labour costs 1)
Total Total By economic activity
(index:2005 = 100) Agriculture, Manufactu- Construction Trade, Information Finance Real estate Professional, Public admi- Arts, enter-
forestry ring, energy transport, and commu- and business and nistration, tainmentand fishing and utilities accommoda- nication insurance support education, and other
tion and services health and servicesfood social
services work1 2 3 4 5 6 7 8 9 10 11 12
2009 110.0 4.0 -0.6 8.9 5.4 5.3 -0.3 -2.7 -3.7 5.4 2.7 1.92010 109.1 -0.8 -1.4 -5.8 1.6 -1.9 -0.9 0.3 2.6 1.5 1.1 1.7
2010 Q4 109.4 -0.3 -0.9 -4.0 0.0 -1.2 -0.2 0.9 2.8 2.2 1.3 2.02011 Q1 109.6 0.2 0.8 -1.4 0.0 -1.2 1.8 2.8 4.4 3.0 0.8 2.3 Q2 110.3 1.2 -0.1 0.6 0.1 0.0 3.2 3.7 3.5 3.2 0.6 3.3 Q3 110.2 1.3 -1.2 0.1 -0.8 1.7 3.6 1.5 3.3 3.1 0.8 3.6
Compensation per employee
2009 109.8 1.4 1.2 -0.6 5.5 1.4 1.3 0.8 -0.4 0.9 2.7 1.72010 111.5 1.6 1.5 3.6 1.0 1.3 2.5 2.0 3.5 1.3 0.8 1.1
2010 Q4 112.4 1.6 2.7 3.7 1.0 1.5 3.0 1.4 3.4 1.7 0.8 0.52011 Q1 113.4 2.4 4.4 4.4 4.5 2.0 2.1 2.0 2.4 2.7 1.2 1.2 Q2 114.0 2.5 3.4 4.7 2.6 1.8 2.4 3.1 2.3 2.7 1.3 2.1 Q3 114.2 2.4 3.4 3.2 2.9 2.3 2.7 2.9 3.6 2.7 1.6 2.1
Labour productivity per person employed 2)
2009 99.8 -2.5 1.8 -8.8 0.0 -3.6 1.6 3.6 3.4 -4.2 0.0 -0.22010 102.2 2.4 3.0 10.1 -0.6 3.3 3.5 1.8 1.0 -0.1 -0.3 -0.5
2010 Q4 102.7 1.9 3.6 8.0 1.0 2.7 3.3 0.5 0.6 -0.4 -0.5 -1.42011 Q1 103.5 2.2 3.5 5.9 4.6 3.2 0.3 -0.8 -1.9 -0.2 0.4 -1.1 Q2 103.4 1.3 3.6 4.1 2.5 1.8 -0.7 -0.5 -1.2 -0.5 0.8 -1.2 Q3 103.6 1.0 4.7 3.1 3.7 0.6 -0.8 1.4 0.3 -0.3 0.7 -1.5
Compensation per hour worked
2009 112.1 3.3 2.2 3.9 7.3 2.7 1.8 2.7 1.4 2.5 3.0 3.12010 113.3 1.0 -0.1 1.1 1.2 1.1 1.9 1.7 2.5 0.6 0.7 1.8
2010 Q4 114.3 1.6 1.2 1.4 1.8 2.0 3.4 2.2 3.2 1.5 1.0 1.22011 Q1 114.7 1.8 -0.3 2.0 3.2 2.3 1.8 2.0 1.6 2.4 0.9 1.1 Q2 115.7 2.5 2.1 3.9 3.1 2.4 2.7 3.5 4.5 2.9 1.1 1.9 Q3 115.5 2.1 1.1 2.6 3.3 2.4 2.0 3.3 4.5 2.2 1.3 1.5
Hourly labour productivity 2)
2009 102.2 -0.8 2.7 -4.9 1.6 -2.5 2.1 5.4 4.5 -2.9 0.3 1.22010 104.2 1.9 2.8 7.5 -0.8 2.8 3.0 1.2 -0.5 -0.8 -0.5 0.1
2010 Q4 104.8 1.8 3.2 5.7 1.5 3.0 3.7 0.8 -0.4 -0.4 -0.3 -0.72011 Q1 105.0 1.6 1.2 3.5 3.0 3.3 0.1 -1.0 -2.5 -0.3 0.1 -0.9 Q2 105.3 1.3 4.5 3.1 2.6 2.2 -0.7 -0.3 0.6 -0.2 0.5 -1.1 Q3 105.2 0.8 5.7 2.4 3.2 0.4 -1.7 1.6 0.8 -0.7 0.5 -2.3
5. Labour cost indices 3)
Total Total By component For selected economic activities Memo item:
(s.a.; index: Indicator2008 = 100) Wages and Employers’ social Mining, Construction Services of
salaries contributions manufacturing negotiatedand energy wages 4)
% of totalin 2008 100.0 100.0 75.2 24.8 32.4 9.0 58.6
1 2 3 4 5 6 7 8
2009 102.7 2.7 2.6 3.0 3.0 3.7 2.4 2.62010 104.3 1.6 1.5 1.9 1.0 1.8 1.8 1.7
2010 Q4 105.1 1.7 1.6 2.0 1.3 1.5 2.0 1.62011 Q1 106.2 2.5 2.3 3.3 2.4 1.9 2.6 1.8 Q2 107.2 3.2 3.3 3.7 4.2 2.5 2.9 1.9 Q3 107.4 2.7 2.6 3.2 2.9 2.5 2.7 2.1
Sources: Eurostat, ECB calculations based on Eurostat data (Table 4 in Section 5.1) and ECB calculations (column 8 in Table 5 in Section 5.1).1) Compensation (at current prices) per employee divided by labour productivity per person employed.2) Total GDP and value added by economic activity (volumes) per labour input (persons employed and hours worked).3) Hourly labour cost indices for the whole economy, excluding agriculture, public administration, education, health and services not classified elsewhere. Owing to
differences in coverage, the estimates for the components may not be consistent with the total.4) Experimental data (see http://www.ecb.europa.eu/stats/intro/html/experiment.en.html for further details).

5.2 Output and demand (quarterly data seasonally adjusted; annual data unadjusted)
S 50ECBMonthly BulletinJanuary 2012
1. GDP and expenditure components
Current prices (EUR billions)
GDP
Total Domestic demand External balance 1)
Total Private Government Gross fixed Changes in Total Exports 1) Imports 1)
consumption consumption capital inventories 2)
formation
1 2 3 4 5 6 7 8 9
2007 9,030.2 8,897.4 5,050.0 1,805.3 1,965.3 76.7 132.8 3,749.6 3,616.82008 9,244.3 9,158.9 5,207.0 1,898.9 1,989.8 63.2 85.3 3,882.1 3,796.82009 8,930.8 8,812.7 5,127.1 1,986.9 1,741.4 -42.7 118.1 3,273.6 3,155.52010 9,161.5 9,045.8 5,261.2 2,013.8 1,751.0 19.9 115.6 3,748.4 3,632.7
2010 Q3 2,300.7 2,268.3 1,319.4 504.3 440.7 3.9 32.4 958.8 926.4 Q4 2,309.8 2,282.7 1,333.1 504.5 440.0 5.1 27.1 978.4 951.22011 Q1 2,337.7 2,315.1 1,342.5 507.6 451.3 13.6 22.6 1,009.7 987.0 Q2 2,350.8 2,321.9 1,346.5 507.5 453.3 14.6 28.9 1,024.6 995.7 Q3 2,362.6 2,327.0 1,354.3 508.3 453.2 11.1 35.7 1,042.4 1,006.7
percentage of GDP
2010 100.0 98.7 57.4 22.0 19.1 0.2 1.3 - -
Chain-linked volumes (prices for the previous year)
quarter-on-quarter percentage changes
2010 Q3 0.4 0.2 0.4 0.1 0.2 - - 2.1 1.7 Q4 0.3 0.2 0.3 0.0 -0.4 - - 1.5 1.32011 Q1 0.8 0.5 0.0 0.2 1.8 - - 1.8 1.1 Q2 0.2 -0.2 -0.5 -0.1 -0.1 - - 1.2 0.5 Q3 0.1 -0.1 0.2 -0.1 -0.1 - - 1.2 0.8
annual percentage changes
2007 3.0 2.8 1.7 2.2 4.7 - - 6.6 6.22008 0.4 0.3 0.4 2.3 -1.1 - - 1.0 0.92009 -4.3 -3.7 -1.2 2.5 -12.0 - - -12.8 -11.72010 1.9 1.1 0.9 0.6 -0.6 - - 11.5 9.7
2010 Q3 2.1 1.4 1.0 0.5 0.8 - - 12.2 10.6 Q4 2.0 1.5 1.1 -0.1 1.3 - - 12.0 11.22011 Q1 2.4 1.6 0.9 0.5 3.6 - - 10.4 8.5 Q2 1.6 0.7 0.2 0.1 1.6 - - 6.8 4.6 Q3 1.3 0.4 0.0 0.0 1.3 - - 5.8 3.7
contributions to quarter-on-quarter percentage changes in GDP; percentage points
2010 Q3 0.4 0.2 0.2 0.0 0.0 0.0 0.2 - - Q4 0.3 0.2 0.2 0.0 -0.1 0.1 0.1 - - 2011 Q1 0.8 0.5 0.0 0.0 0.4 0.0 0.3 - - Q2 0.2 -0.2 -0.3 0.0 0.0 0.2 0.3 - - Q3 0.1 0.0 0.1 0.0 0.0 -0.1 0.2 - -
contributions to annual percentage changes in GDP; percentage points
2007 3.0 2.8 1.0 0.4 1.0 0.3 0.2 - - 2008 0.4 0.3 0.2 0.5 -0.2 -0.1 0.1 - - 2009 -4.3 -3.7 -0.7 0.5 -2.6 -0.9 -0.6 - - 2010 1.9 1.1 0.5 0.1 -0.1 0.6 0.8 - -
2010 Q3 2.1 1.3 0.6 0.1 0.2 0.5 0.7 - - Q4 2.0 1.5 0.6 0.0 0.2 0.7 0.5 - - 2011 Q1 2.4 1.6 0.5 0.1 0.7 0.3 0.8 - - Q2 1.6 0.7 0.1 0.0 0.3 0.3 0.9 - - Q3 1.3 0.4 0.0 0.0 0.2 0.1 0.9 - -
Sources: Eurostat and ECB calculations.
1) Exports and imports cover goods and services and include cross-border intra-euro area trade. They are not fully consistent with: Section 3.1; Table 1 of Section 7.1; Table 3 of Section 7.2; or Tables 1 or 3 of Section 7.5.2) Including acquisitions less disposals of valuables.

EURO AREASTATISTICS
Prices, output,demand and
labour markets
5.2 Output and demand (quarterly data seasonally adjusted; annual data unadjusted)
S 51ECB
Monthly BulletinJanuary 2012
2. Value added by economic activity
Current prices (EUR billions)
Gross value added (basic prices) Taxes less
subsidiesTotal Agriculture, Manufactu- Construction Trade, Information Finance Real estate Professional, Public admi- Arts, enter- on
forestry ring, energy transport, and commu- and business and nistration, tainment productsand fishing and utilities accommoda- nication insurance support education, and other
tion and services health and servicesfood services social work
1 2 3 4 5 6 7 8 9 10 11 12
2007 8,071.4 144.0 1,650.2 538.6 1,550.5 352.6 393.8 889.7 821.5 1,449.8 280.7 958.82008 8,299.0 142.0 1,652.6 560.8 1,597.8 358.5 384.9 930.3 859.4 1,520.7 291.9 945.32009 8,037.8 125.5 1,465.4 537.3 1,517.8 360.5 427.3 904.4 817.8 1,581.9 300.1 893.02010 8,222.5 137.4 1,550.9 512.8 1,561.4 357.7 437.5 922.3 830.6 1,609.2 302.7 938.9
2010 Q3 2,063.8 35.0 390.3 128.5 392.2 89.6 109.9 231.9 208.9 401.8 75.6 236.9 Q4 2,072.8 35.1 395.3 127.2 395.1 88.9 108.5 234.4 209.8 402.1 76.1 237.12011 Q1 2,096.0 36.7 402.4 130.9 401.6 88.8 108.1 234.9 210.8 405.2 76.6 241.7 Q2 2,107.8 37.0 406.0 130.3 404.2 88.7 107.6 238.7 212.3 406.6 76.4 243.0 Q3 2,119.8 35.7 412.1 130.5 405.1 88.7 109.2 240.7 213.3 407.4 77.1 242.8
percentage of value added
2010 100.0 1.7 18.9 6.2 19.0 4.4 5.3 11.2 10.1 19.6 3.7 -
Chain-linked volumes (prices for the previous year)
quarter-on-quarter percentage changes
2010 Q3 0.4 -0.4 1.0 -0.8 1.1 0.2 -1.6 0.4 0.9 0.2 0.0 0.5 Q4 0.3 0.6 1.3 -1.2 0.3 0.8 -0.3 0.2 0.2 0.0 -0.2 -0.12011 Q1 0.7 1.4 1.2 1.4 1.2 -0.8 1.2 -0.2 1.0 0.3 0.0 1.0 Q2 0.2 0.3 0.6 -0.2 0.1 0.3 0.1 0.3 0.5 0.1 -0.6 -0.4 Q3 0.1 0.3 0.3 -0.5 0.0 0.0 0.5 0.1 0.1 0.2 0.2 0.2
annual percentage changes
2007 3.2 6.2 3.8 1.8 3.3 6.2 6.4 1.5 5.2 1.3 2.1 0.92008 0.6 2.1 -2.3 -1.2 1.1 2.7 1.0 1.2 1.8 2.0 1.5 -1.32009 -4.3 -0.4 -13.3 -6.8 -5.4 0.8 3.8 0.6 -6.6 1.4 0.9 -4.12010 2.0 2.1 6.6 -4.4 2.5 2.5 0.9 0.4 1.7 0.8 0.1 1.0
2010 Q3 2.1 1.2 6.2 -3.3 3.1 3.0 -1.0 0.7 2.4 0.8 0.1 2.1 Q4 2.1 2.2 6.7 -2.9 2.9 2.7 -0.5 0.5 2.4 0.3 -0.5 1.32011 Q1 2.2 1.0 5.7 0.7 3.4 1.0 -0.9 0.5 3.0 0.6 -0.1 3.7 Q2 1.7 1.9 4.2 -0.8 2.7 0.5 -0.7 0.7 2.6 0.7 -0.9 1.0 Q3 1.4 2.6 3.5 -0.6 1.7 0.4 1.5 0.3 1.8 0.6 -0.6 0.7
contributions to quarter-on-quarter percentage changes in value added; percentage points
2010 Q3 0.4 0.0 0.2 0.0 0.2 0.0 -0.1 0.0 0.1 0.0 0.0 - Q4 0.3 0.0 0.2 -0.1 0.1 0.0 0.0 0.0 0.0 0.0 0.0 - 2011 Q1 0.7 0.0 0.2 0.1 0.2 0.0 0.1 0.0 0.1 0.1 0.0 - Q2 0.2 0.0 0.1 0.0 0.0 0.0 0.0 0.0 0.0 0.0 0.0 - Q3 0.1 0.0 0.1 0.0 0.0 0.0 0.0 0.0 0.0 0.0 0.0 -
contributions to annual percentage changes in value added; percentage points
2007 3.2 0.1 0.8 0.1 0.6 0.3 0.3 0.2 0.5 0.2 0.1 - 2008 0.6 0.0 -0.5 -0.1 0.2 0.1 0.0 0.1 0.2 0.4 0.1 - 2009 -4.3 0.0 -2.6 -0.5 -1.0 0.0 0.2 0.1 -0.7 0.3 0.0 - 2010 2.0 0.0 1.2 -0.3 0.5 0.1 0.1 0.1 0.2 0.2 0.0 -
2010 Q3 2.1 0.0 1.1 -0.2 0.6 0.1 -0.1 0.1 0.2 0.2 0.0 - Q4 2.1 0.0 1.2 -0.2 0.5 0.1 0.0 0.1 0.2 0.1 0.0 - 2011 Q1 2.2 0.0 1.1 0.0 0.7 0.0 0.0 0.1 0.3 0.1 0.0 - Q2 1.7 0.0 0.8 -0.1 0.5 0.0 0.0 0.1 0.3 0.1 0.0 - Q3 1.4 0.0 0.7 0.0 0.3 0.0 0.1 0.0 0.2 0.1 0.0 -
Sources: Eurostat and ECB calculations.

5.2 Output and demand (annual percentage changes, unless otherwise indicated)
S 52ECBMonthly BulletinJanuary 2012
3. Industrial production
Total Industry excluding construction Construction
Total Total Industry excluding construction and energy Energy
(s.a.; index: 2005 = 100) Manu- Total Intermediate Capital Consumer goods
facturing goods goodsTotal Durable Non-durable
% of totalin 2005 100.0 77.8 77.8 69.2 68.7 28.1 22.3 18.3 2.6 15.7 9.1 22.2
1 2 3 4 5 6 7 8 9 10 11 12
2008 -2.4 106.6 -1.6 -1.7 -1.8 -3.4 0.0 -1.9 -5.2 -1.3 0.2 -5.22009 -13.6 90.8 -14.8 -15.9 -16.0 -19.0 -20.9 -4.9 -17.3 -2.9 -5.3 -7.82010 4.1 97.5 7.4 7.8 7.8 10.1 9.1 3.4 2.5 3.5 3.8 -8.1
2010 Q4 4.5 100.1 8.0 8.4 8.5 7.9 13.9 3.0 2.0 3.1 4.9 -9.32011 Q1 4.6 101.0 6.6 8.2 8.2 9.0 13.2 1.4 2.9 1.2 -2.2 -2.3 Q2 2.2 101.3 4.2 5.4 5.4 4.3 9.4 2.2 1.0 2.4 -5.4 -5.0 Q3 3.6 101.9 4.0 4.8 4.9 3.8 9.8 0.9 1.9 0.8 -3.1 1.7
2011 May 3.3 101.5 4.3 5.9 6.1 4.5 10.7 2.6 1.2 2.7 -7.2 -0.4 June -0.3 100.9 2.8 3.6 3.4 3.1 6.9 0.4 -2.7 0.9 -3.7 -11.0 July 4.0 101.7 4.3 5.1 5.2 4.2 11.7 -0.2 4.3 -0.7 -4.0 2.5 Aug. 5.3 103.0 6.0 7.0 7.1 5.4 12.9 3.0 2.9 3.1 -2.1 2.3 Sep. 1.8 101.0 2.2 2.8 2.9 2.2 5.9 0.2 -1.0 0.4 -3.1 0.6 Oct. 0.4 100.8 1.0 1.8 1.7 0.3 4.8 0.3 -3.4 0.8 -4.9 -2.4
month-on-month percentage changes (s.a.)
2011 May 0.1 - 0.1 0.0 -0.1 -0.2 1.1 -0.3 -0.6 -0.1 0.3 0.5 June -1.3 - -0.6 -1.1 -0.7 -0.8 -1.5 -0.6 -2.6 -0.7 1.1 -1.2 July 1.6 - 0.8 0.7 0.9 0.6 2.9 -0.2 3.5 -0.7 0.2 1.7 Aug. 1.0 - 1.3 1.5 1.1 1.4 2.3 0.9 -0.2 1.7 1.0 -0.2 Sep. -1.8 - -2.0 -2.6 -1.6 -2.2 -3.9 -0.9 -3.5 -1.3 -1.6 -1.4 Oct. -0.4 - -0.2 -0.1 -0.1 -0.9 0.9 0.1 -1.0 0.5 -0.7 -1.4
4. Industrial new orders and turnover, retail sales and new passenger car registrations
Industrial new orders Industrial turnover Retail sales (including automotive fuel) New passenger car
registrations Manufacturing 1) Manufacturing Current prices Constant prices (current prices) (current prices)
Total Total Total Total Total Total Total Food, Non-food Fuel Total (s.a.; Total
(s.a.; index: (s.a.; index: (s.a.; index: beverages, thousands) 2)
2005 = 100) 2005 = 100) 2005 = 100) tobacco Textiles, Householdclothing, equipmentfootwear
% of totalin 2005 100.0 100.0 100.0 100.0 100.0 100.0 100.0 38.4 51.0 9.0 12.8 10.6
1 2 3 4 5 6 7 8 9 10 11 12 13 14
2008 112.9 -5.6 116.9 1.4 2.4 103.1 -0.7 -1.8 -0.1 -1.9 -1.6 -1.5 891 -7.82009 87.3 -22.7 95.6 -18.3 -4.3 100.6 -2.5 -1.7 -2.2 -1.8 -3.9 -5.7 925 3.32010 102.7 17.6 105.3 10.2 2.1 101.4 0.8 0.5 1.7 2.6 0.7 -2.9 843 -8.5
2010 Q4 108.2 18.5 110.0 12.3 2.0 101.5 0.6 0.2 1.5 1.5 -0.1 -2.0 845 -11.02011 Q1 112.1 18.6 114.6 13.7 2.1 101.3 0.1 -1.1 1.2 -0.2 1.7 -1.3 868 -3.1 Q2 114.5 11.6 114.6 9.8 1.7 100.9 -0.5 -0.5 -0.1 1.7 -1.2 -3.6 825 -1.8 Q3 111.4 5.4 115.1 8.7 1.7 100.9 -0.5 -0.8 0.1 -2.3 -0.1 -4.2 823 2.9
2011 June 115.2 10.3 113.1 6.4 1.3 100.9 -0.8 -0.4 -0.7 1.1 -2.7 -3.9 824 -3.7 July 113.2 8.9 115.3 9.8 1.7 101.0 -0.4 -2.4 1.7 2.3 1.5 -5.4 816 2.3 Aug. 115.0 6.0 116.5 10.2 2.1 101.1 -0.1 0.2 0.4 -1.1 -1.3 -2.9 822 6.1 Sep. 106.0 1.6 113.4 6.6 1.5 100.5 -1.2 -0.1 -1.9 -8.4 -0.5 -4.2 832 1.3 Oct. 107.9 1.5 113.5 4.8 1.8 100.6 -0.7 -0.3 -1.0 -4.1 -0.3 -4.5 821 -0.6 Nov. . . . . 0.8 99.8 -2.5 -1.6 -3.0 . . . 825 -3.3
month-on-month percentage changes (s.a.)
2011 July - -1.7 - 2.0 0.3 - 0.2 -0.7 0.5 1.6 1.4 -0.5 - -1.0 Aug. - 1.7 - 1.0 0.1 - 0.0 0.4 -0.2 -1.5 -0.7 1.1 - 0.8 Sep. - -7.8 - -2.6 -0.4 - -0.6 0.1 -0.9 -4.2 0.0 -0.8 - 1.2 Oct. - 1.8 - 0.1 0.6 - 0.1 0.1 0.3 2.1 0.1 -1.4 - -1.3 Nov. - . - . -0.6 - -0.8 -0.8 -0.7 . . . - 0.5
Sources: Eurostat, except columns 13 and 14 in Table 4 in Section 5.2 (which comprise ECB calculations based on data from the European Automobile Manufacturers’ Association).1) Includes manufacturing industries working mainly on the basis of orders, which represented 61.2% of total manufacturing in 2005.2) Annual and quarterly figures are averages of monthly figures in the period concerned.

EURO AREASTATISTICS
Prices, output,demand and
labour markets
5.2 Output and demand (percentage balances, 1) unless otherwise indicated; seasonally adjusted)
S 53ECB
Monthly BulletinJanuary 2012
5. Business and Consumer Surveys
Economic Manufacturing industry Consumer confidence indicatorsentiment
indicator 2) Industrial confidence indicator Capacity Total 4) Financial Economic Unemployment Savings(long-term utilisation 3) situation situation situation over next
average Total 4) Order Stocks of Production (%) over next over next over next 12 months= 100) books finished expectations 12 months 12 months 12 months
products
1 2 3 4 5 6 7 8 9 10 11
2008 93.7 -8.4 -13.3 10.8 -1.0 82.1 -18.1 -9.9 -25.3 23.5 -13.62009 80.7 -28.7 -56.8 14.6 -14.8 70.9 -24.8 -7.0 -26.3 55.5 -10.32010 100.9 -4.5 -24.6 0.6 11.6 76.9 -14.0 -5.2 -12.2 31.0 -7.62011 101.5 0.3 -6.4 2.2 9.6 . -14.3 -7.4 -18.0 23.0 -8.7
2010 Q4 105.7 2.7 -9.5 -0.8 16.8 79.1 -10.4 -5.4 -8.7 20.9 -6.62011 Q1 107.4 6.5 -1.6 -2.0 19.0 80.9 -10.6 -6.0 -9.6 19.7 -7.0 Q2 105.7 4.3 -1.3 -0.9 13.4 81.2 -10.4 -6.6 -12.4 14.7 -7.9 Q3 98.8 -2.6 -8.5 4.5 5.3 80.3 -15.6 -7.3 -21.6 23.8 -9.6 Q4 94.0 -6.9 -14.1 7.1 0.6 . -20.5 -9.5 -28.4 33.6 -10.2
2011 July 103.0 0.9 -4.7 2.5 9.8 80.8 -11.2 -6.0 -14.2 16.1 -8.3 Aug. 98.4 -2.7 -9.0 5.0 5.9 - -16.5 -7.2 -23.4 25.5 -10.0 Sep. 95.0 -5.9 -11.9 6.1 0.3 - -19.1 -8.8 -27.2 29.8 -10.6 Oct. 94.8 -6.5 -13.0 6.6 0.2 79.7 -19.9 -8.9 -28.6 32.5 -9.4 Nov. 93.8 -7.1 -13.7 7.3 -0.4 - -20.4 -9.1 -28.9 33.7 -9.7 Dec. 93.3 -7.1 -15.7 7.5 1.9 - -21.1 -10.5 -27.6 34.6 -11.6
Construction confidence indicator Retail trade confidence indicator Services confidence indicator
Total 4) Order Employment Total 4) Present Volume of Expected Total 4) Business Demand in Demand inbooks expectations business stocks business climate recent the months
situation situation months ahead
12 13 14 15 16 17 18 19 20 21 22
2008 -13.4 -20.7 -6.1 -10.0 -10.6 16.0 -3.5 0.6 -3.7 0.7 4.72009 -32.7 -42.2 -23.2 -15.5 -21.0 9.9 -15.7 -15.5 -20.4 -17.9 -8.32010 -28.4 -39.6 -17.2 -4.0 -6.1 7.4 1.5 5.0 2.5 4.2 8.32011 -24.8 -33.2 -16.4 -5.3 -5.1 11.3 0.5 5.8 2.6 5.9 8.9
2010 Q4 -26.2 -36.0 -16.3 0.8 1.3 7.4 8.5 9.0 6.8 8.4 11.92011 Q1 -25.2 -36.1 -14.3 -0.7 0.1 8.2 6.0 10.6 8.3 10.5 13.2 Q2 -24.2 -32.2 -16.1 -2.3 -0.9 9.9 4.0 9.9 7.6 10.3 11.8 Q3 -24.8 -32.8 -16.6 -7.4 -6.8 12.9 -2.3 3.9 0.7 4.2 6.7 Q4 -25.1 -31.6 -18.6 -10.8 -12.8 14.2 -5.6 -1.2 -5.9 -1.3 3.7
2011 July -24.3 -31.3 -17.2 -3.6 -2.4 10.5 2.2 7.9 5.2 7.8 10.6 Aug. -23.4 -32.1 -14.6 -8.7 -7.3 13.7 -5.1 3.7 0.1 4.0 6.9 Sep. -26.6 -35.1 -18.0 -9.8 -10.6 14.6 -4.1 0.0 -3.3 0.8 2.5 Oct. -25.1 -32.8 -17.3 -9.7 -11.6 13.9 -3.8 0.1 -3.4 -0.4 4.2 Nov. -25.0 -30.6 -19.4 -11.1 -13.4 14.1 -5.8 -1.6 -6.6 -1.4 3.1 Dec. -25.2 -31.4 -19.0 -11.7 -13.3 14.5 -7.3 -2.1 -7.8 -2.2 3.8
Source: European Commission (Economic and Financial Affairs DG).1) Difference between the percentages of respondents giving positive and negative replies.2) The economic sentiment indicator is composed of the industrial, services, consumer, construction and retail trade confidence indicators; the industrial confidence indicator has
a weight of 40%, the services confidence indicator a weight of 30%, the consumer confidence indicator a weight of 20% and the two other indicators a weight of 5% each.Values for the economic sentiment indicator of above (below) 100 indicate above-average (below-average) economic sentiment, calculated for the period 1990 to 2010.
3) Data are collected in January, April, July and October each year. The quarterly figures shown are averages of two successive surveys. Annual data are derived from quarterly averages.
4) The confidence indicators are calculated as simple averages of the components shown; the assessments of stocks (columns 4 and 17) and unemployment (column 10) are used with inverted signs for the calculation of confidence indicators.

5.3 Labour markets 1)
(quarterly data seasonally adjusted; annual data unadjusted)
S 54ECBMonthly BulletinJanuary 2012
1. Employment
Persons employed
By employment status By economic activity
Total Employees Self- Agriculture, Manufactu- Construc- Trade, Information Finance Real estate Professional, Public admi- Arts,employed forestry ring, energy tion transport, and commu- and business and nistration, enter-
and fishing and utilities accommoda- nication insurance support education, tainmenttion and services health and and other
food services social work services
1 2 3 4 5 6 7 8 9 10 11 12 13
levels (thousands)
2010 146,433 125,205 21,228 5,087 23,079 10,302 35,740 3,959 4,142 1,289 17,595 34,497 10,743
percentage of total persons employed
2010 100.0 85.5 14.5 3.5 15.8 7.0 24.4 2.7 2.8 0.9 12.0 23.6 7.3annual percentage changes
2008 0.8 1.0 -0.3 -1.8 0.2 -2.2 0.9 1.0 0.3 1.3 3.3 1.2 1.22009 -1.8 -1.8 -1.8 -2.2 -5.0 -6.8 -1.8 -0.8 0.1 -2.7 -2.5 1.4 1.12010 -0.5 -0.5 -0.7 -0.9 -3.2 -3.7 -0.7 -1.0 -0.8 -0.5 1.8 1.1 0.7
2010 Q4 0.1 0.2 -0.7 -1.4 -1.2 -3.9 0.2 -0.6 -1.0 -0.2 2.8 0.8 1.02011 Q1 0.2 0.4 -0.9 -2.5 -0.2 -3.8 0.3 0.7 0.0 2.5 3.2 0.3 1.0 Q2 0.4 0.6 -0.8 -1.6 0.1 -3.2 0.9 1.2 -0.1 1.9 3.2 -0.1 0.4 Q3 0.3 0.5 -1.1 -2.0 0.4 -4.1 1.1 1.2 0.1 0.0 2.1 -0.1 0.9
quarter-on-quarter percentage changes
2010 Q4 0.1 0.2 -0.3 -0.3 0.1 -1.1 0.3 0.1 -0.1 -0.1 0.5 0.1 0.42011 Q1 0.1 0.1 0.0 -1.6 0.2 -1.2 0.0 1.0 0.5 1.7 0.9 -0.2 0.4 Q2 0.2 0.3 -0.3 0.8 0.1 -0.3 0.5 0.3 -0.2 -0.5 0.9 -0.1 -0.1 Q3 -0.1 -0.1 -0.5 -1.0 0.0 -1.6 0.2 -0.2 -0.1 -1.0 -0.3 0.0 0.2
Hours worked
levels (millions)
2010 231,190 185,633 45,556 10,516 36,433 18,211 60,091 6,363 6,521 1,974 26,791 49,145 15,145percentage of total hours worked
2010 100.0 80.3 19.7 4.5 15.8 7.9 26.0 2.8 2.8 0.9 11.6 21.3 6.6annual percentage changes
2008 0.8 1.2 -0.7 -2.1 -0.4 -2.5 1.0 1.6 1.6 1.3 3.5 1.6 1.62009 -3.4 -3.6 -2.8 -3.1 -8.9 -8.3 -2.9 -1.3 -1.5 -3.7 -3.8 1.1 -0.32010 0.0 0.1 -0.2 -0.7 -0.9 -3.6 -0.3 -0.5 -0.3 0.9 2.5 1.3 0.1
2010 Q4 0.1 0.3 -0.5 -1.0 1.0 -4.4 -0.1 -1.0 -1.3 0.9 2.8 0.6 0.32011 Q1 0.8 1.0 -0.1 -0.2 2.1 -2.3 0.1 0.9 0.1 3.1 3.3 0.5 0.8 Q2 0.3 0.6 -0.7 -2.5 1.0 -3.4 0.5 1.2 -0.4 0.0 2.9 0.1 0.2 Q3 0.6 0.8 -0.3 -2.9 1.1 -3.7 1.2 2.1 -0.2 -0.4 2.5 0.1 1.8
quarter-on-quarter percentage changes
2010 Q4 -0.1 -0.1 0.0 -0.2 0.3 -1.7 0.0 0.1 -0.5 0.3 0.5 -0.2 0.32011 Q1 0.6 0.7 0.2 -0.7 0.7 0.2 0.5 1.4 1.1 1.0 1.5 0.3 0.7 Q2 -0.1 0.0 -0.6 -0.4 -0.1 -1.1 0.2 0.3 -0.5 -1.7 0.3 0.0 -0.7 Q3 0.1 0.2 0.1 -1.6 0.2 -1.1 0.6 0.3 -0.3 -0.1 0.2 0.1 1.4
Hours worked per person employed
levels (thousands)
2010 1,579 1,483 2,146 2,067 1,579 1,768 1,681 1,607 1,575 1,531 1,523 1,425 1,410annual percentage changes
2008 0.0 0.2 -0.4 -0.2 -0.5 -0.2 0.1 0.7 1.3 0.0 0.2 0.4 0.42009 -1.7 -1.8 -1.0 -0.9 -4.1 -1.6 -1.2 -0.5 -1.6 -1.1 -1.4 -0.3 -1.32010 0.5 0.5 0.5 0.2 2.4 0.2 0.4 0.5 0.6 1.4 0.6 0.1 -0.6
2010 Q4 0.0 0.1 0.1 0.4 2.2 -0.5 -0.4 -0.4 -0.3 1.0 0.0 -0.2 -0.72011 Q1 0.5 0.6 0.7 2.4 2.3 1.5 -0.1 0.2 0.1 0.6 0.1 0.3 -0.2 Q2 -0.1 0.0 0.1 -0.9 0.9 -0.1 -0.4 -0.1 -0.2 -1.8 -0.3 0.2 -0.1 Q3 0.3 0.2 0.8 -0.9 0.7 0.5 0.1 0.9 -0.3 -0.4 0.4 0.3 0.9
quarter-on-quarter percentage changes
2010 Q4 3.1 3.6 1.5 -2.7 4.6 0.6 3.0 3.9 4.0 2.4 6.0 3.3 2.02011 Q1 0.6 0.8 -0.8 -1.7 0.5 0.3 0.4 1.0 1.9 0.7 0.2 1.7 0.6 Q2 -2.2 -3.0 1.3 4.2 -2.7 0.6 -2.0 -4.1 -4.1 -3.8 -3.9 -3.5 -1.4 Q3 -1.1 -1.0 -1.3 -0.8 -1.4 -1.0 -1.1 0.3 -1.5 0.6 -1.6 -1.3 -0.3
Source: ECB calculations based on Eurostat data.1) Data for employment are based on the ESA 95.

EURO AREASTATISTICS
Prices, output,demand and
labour markets
5.3 Labour markets (seasonally adjusted, unless otherwise indicated)
S 55ECB
Monthly BulletinJanuary 2012
2. Unemployment and job vacancies 1)
Unemployment Job vacancy
rate 2)
Total By age 3) By gender 4)
Millions % of labour Adult Youth Male Femaleforce
Millions % of labour Millions % of labour Millions % of labour Millions % of labour % of totalforce force force force posts
% of totalin 2010 100.0 79.5 20.5 54.0 46.0
1 2 3 4 5 6 7 8 9 10 11
2007 11.783 7.6 9.186 6.7 2.597 15.5 5.810 6.7 5.973 8.7 2.22008 11.973 7.6 9.294 6.6 2.678 16.0 6.049 7.0 5.923 8.5 1.92009 15.049 9.6 11.765 8.4 3.284 20.3 8.143 9.4 6.905 9.8 1.42010 15.926 10.1 12.655 8.9 3.271 20.9 8.592 10.0 7.334 10.3 1.5
2010 Q3 15.897 10.1 12.657 8.9 3.241 20.8 8.555 9.9 7.342 10.3 1.4 Q4 15.826 10.1 12.638 8.9 3.188 20.6 8.455 9.8 7.371 10.4 1.62011 Q1 15.671 10.0 12.497 8.8 3.174 20.6 8.340 9.7 7.331 10.3 1.8 Q2 15.728 10.0 12.553 8.8 3.175 20.6 8.369 9.7 7.359 10.3 1.7 Q3 16.037 10.1 12.810 9.0 3.227 20.9 8.496 9.8 7.541 10.5 1.6
2011 June 15.787 10.0 12.609 8.9 3.179 20.6 8.378 9.7 7.409 10.3 - July 15.928 10.1 12.733 8.9 3.195 20.7 8.446 9.8 7.482 10.4 - Aug. 15.984 10.1 12.781 9.0 3.202 20.8 8.457 9.8 7.527 10.5 - Sep. 16.198 10.2 12.915 9.1 3.283 21.1 8.585 9.9 7.613 10.6 - Oct. 16.327 10.3 13.000 9.1 3.327 21.4 8.720 10.1 7.607 10.6 - Nov. 16.372 10.3 12.978 9.1 3.394 21.7 8.699 10.0 7.673 10.7 -
C28 Employment - persons employed and hours worked
(annual percentage changes)
C29 Unemployment and job vacancy 2) rates
-5.0
-4.0
-3.0
-2.0
-1.0
0.0
1.0
2.0
2002 2003 2004 2005 2006 2007 2008 2009 2010 2011-5.0
-4.0
-3.0
-2.0
-1.0
0.0
1.0
2.0
employment in terms of persons employedemployment in terms of hours worked
7.0
7.5
8.0
8.5
9.0
9.5
10.0
10.5
2006 2007 2008 2009 2010 20110.0
0.5
1.0
1.5
2.0
2.5
3.0
3.5
unemployment rate (left-hand scale)job vacancy rate (right-hand scale)
Source: Eurostat.1) Data for unemployment refer to persons and follow ILO recommendations.2) Industry, construction and services (excluding households as employers and extra-territorial organisations and bodies); non-seasonally adjusted.3) Adult: 25 years of age and over; youth: below 25 years of age; rates are expressed as a percentage of the labour force for the relevant age group.4) Rates are expressed as a percentage of the labour force for the relevant gender.

6 GOVERNMENT FINANCE
6.1 Revenue, expenditure and deficit/surplus 1) (as a percentage of GDP)
S 56ECBMonthly BulletinJanuary 2012
1. Euro area _ revenue
Total Current revenue Capital revenue Memo
item:Direct Indirect Social Sales Capital Fiscaltaxes Households Corporations taxes Received by EU contributions Employers Employees taxes burden 2)
institutions1 2 3 4 5 6 7 8 9 10 11 12 13 14
2002 44.9 44.6 11.9 9.0 2.8 13.2 0.4 15.6 8.1 4.6 2.2 0.3 0.3 40.92003 44.9 44.2 11.5 8.8 2.7 13.2 0.4 15.7 8.2 4.6 2.2 0.6 0.5 40.92004 44.5 44.0 11.5 8.5 2.9 13.2 0.3 15.5 8.1 4.5 2.2 0.5 0.4 40.62005 44.8 44.3 11.7 8.6 3.0 13.3 0.3 15.4 8.1 4.5 2.3 0.5 0.3 40.72006 45.3 44.9 12.3 8.8 3.4 13.4 0.3 15.3 8.0 4.5 2.3 0.4 0.3 41.32007 45.3 45.0 12.7 8.9 3.6 13.3 0.3 15.1 8.0 4.4 2.3 0.3 0.3 41.32008 45.1 44.8 12.5 9.1 3.2 12.9 0.3 15.3 8.1 4.5 2.3 0.3 0.3 40.92009 44.8 44.5 11.6 9.2 2.3 12.8 0.3 15.8 8.3 4.5 2.5 0.4 0.4 40.52010 44.7 44.4 11.6 8.9 2.5 12.9 0.3 15.6 8.2 4.5 2.5 0.3 0.3 40.4
2. Euro area _ expenditure
Total Current expenditure Capital expenditure Memo
item:Total Compensation Intermediate Interest Current Investment Capital Primary
of consumption transfers Social Subsidies transfers Paid by EU expenditure 3)
employees payments Paid by EU institutionsinstitutions
1 2 3 4 5 6 7 8 9 10 11 12 13 14
2002 47.6 43.8 10.5 4.9 3.5 24.9 22.0 1.9 0.5 3.9 2.4 1.4 0.1 44.12003 48.0 44.1 10.6 4.9 3.3 25.2 22.3 1.8 0.5 4.0 2.5 1.4 0.1 44.72004 47.4 43.5 10.5 5.0 3.1 24.9 22.1 1.7 0.5 3.9 2.5 1.5 0.1 44.32005 47.3 43.4 10.5 5.0 3.0 24.9 22.1 1.7 0.5 3.9 2.5 1.4 0.0 44.32006 46.7 42.8 10.3 5.0 2.9 24.6 21.8 1.6 0.5 3.9 2.5 1.4 0.0 43.82007 46.0 42.2 10.1 5.0 3.0 24.2 21.4 1.6 0.4 3.8 2.6 1.2 0.0 43.12008 47.2 43.3 10.3 5.2 3.0 24.8 21.9 1.6 0.4 3.9 2.6 1.3 0.0 44.22009 51.2 46.9 11.0 5.7 2.9 27.4 24.2 1.8 0.4 4.3 2.8 1.4 0.0 48.42010 50.9 46.6 10.8 5.6 2.8 27.3 24.2 1.8 0.4 4.4 2.5 1.9 0.0 48.1
3. Euro area _ deficit/surplus, primary deficit/surplus and government consumption
Deficit (-)/surplus (+) Primary Government consumption 4)
deficit (-)/ Total Central State Local Social surplus (+) Total Collective Individual
gov. gov. gov. security Compensation Intermediate Transfers Consumption Sales consumption consumptionfunds of employees consumption in kind of fixed (minus)
via market capitalproducers
1 2 3 4 5 6 7 8 9 10 11 12 13 14
2002 -2.7 -2.3 -0.5 -0.3 0.3 0.8 20.2 10.5 4.9 5.1 1.9 2.2 8.1 12.12003 -3.1 -2.5 -0.5 -0.2 0.1 0.2 20.5 10.6 4.9 5.2 1.9 2.2 8.1 12.32004 -2.9 -2.5 -0.4 -0.3 0.2 0.2 20.4 10.5 5.0 5.1 1.9 2.2 8.1 12.32005 -2.5 -2.2 -0.3 -0.2 0.2 0.5 20.4 10.5 5.0 5.1 1.9 2.3 8.0 12.42006 -1.4 -1.5 -0.1 -0.2 0.4 1.5 20.3 10.3 5.0 5.2 1.9 2.3 7.9 12.42007 -0.7 -1.2 0.0 -0.1 0.6 2.3 20.0 10.1 5.0 5.1 1.9 2.3 7.7 12.32008 -2.1 -2.3 -0.2 -0.2 0.5 0.9 20.5 10.3 5.2 5.3 2.0 2.3 8.0 12.62009 -6.4 -5.2 -0.5 -0.3 -0.4 -3.5 22.2 11.0 5.7 5.8 2.1 2.5 8.6 13.62010 -6.2 -5.1 -0.7 -0.3 -0.1 -3.4 22.0 10.8 5.6 5.8 2.1 2.5 8.4 13.6
4. Euro area countries _ deficit (-)/surplus (+) 5)
BE DE EE IE GR ES FR IT CY LU MT NL AT PT SI SK FI1 2 3 4 5 6 7 8 9 10 11 12 13 14 15 16 17
2007 -0.3 0.2 2.4 0.1 -6.5 1.9 -2.7 -1.6 3.5 3.7 -2.4 0.2 -0.9 -3.1 0.0 -1.8 5.32008 -1.3 -0.1 -2.9 -7.3 -9.8 -4.5 -3.3 -2.7 0.9 3.0 -4.6 0.5 -0.9 -3.6 -1.9 -2.1 4.32009 -5.8 -3.2 -2.0 -14.2 -15.8 -11.2 -7.5 -5.4 -6.1 -0.9 -3.7 -5.6 -4.1 -10.1 -6.1 -8.0 -2.52010 -4.1 -4.3 0.2 -31.3 -10.6 -9.3 -7.1 -4.6 -5.3 -1.1 -3.6 -5.1 -4.4 -9.8 -5.8 -7.7 -2.5
Sources: ECB for euro area aggregated data; European Commission for data relating to countries’ deficit/surplus.1) Data refer to the Euro 17. The concepts "revenue", "expenditure" and "deficit/surplus" are based on the ESA 95. Transactions involving the EU budget are included and
consolidated. Transactions among Member States’ governments are not consolidated.2) The fiscal burden comprises taxes and social contributions.3) Comprises total expenditure minus interest expenditure.4) Corresponds to final consumption expenditure (P.3) of general government in the ESA 95.5) Includes proceeds from the sale of UMTS licences and settlements under swaps and forward rate agreements.

EURO AREASTATISTICS
Governmentfinance
6.2 Debt 1) (as a percentage of GDP)
S 57ECB
Monthly BulletinJanuary 2012
1. Euro area _ by financial instrument and sector of the holder
Total Financial instruments Holders
Currency Loans Short-term Long-term Domestic creditors 2) Other
and securities securities creditors 3)
deposits Total MFIs Other Otherfinancial sectors
corporations
1 2 3 4 5 6 7 8 9 10
2001 68.2 2.8 12.4 4.0 48.9 42.7 20.8 11.2 10.7 25.42002 68.0 2.7 11.8 4.6 48.9 41.0 19.6 10.8 10.5 27.02003 69.1 2.1 12.4 5.1 49.6 40.3 19.8 11.3 9.2 28.92004 69.5 2.2 12.1 5.0 50.3 38.8 18.9 11.1 8.8 30.72005 70.4 2.4 12.2 4.7 51.2 37.1 18.1 11.2 7.7 33.32006 68.6 2.5 11.9 4.1 50.2 35.0 18.3 9.3 7.4 33.62007 66.3 2.2 11.2 4.2 48.7 32.7 17.1 8.5 7.1 33.62008 70.1 2.3 11.5 6.7 49.6 33.1 17.8 7.8 7.6 36.92009 79.8 2.5 12.6 8.6 56.2 37.3 20.6 8.9 7.8 42.52010 85.3 2.4 15.3 7.7 60.0 40.5 23.4 9.6 7.5 44.8
2. Euro area _ by issuer, maturity and currency denomination
Total Issued by: 4) Original maturity Residual maturity Currencies
Central State Local Social Up to Over Up to Over 1 and Over Euro or Other
gov. gov. gov. security 1 year 1 year Variable 1 year up to 5 years 5 years participating currenciesfunds interest rate currencies
1 2 3 4 5 6 7 8 9 10 11 12 13
2001 68.2 56.6 6.0 4.7 0.8 7.0 61.1 5.3 13.7 26.6 27.9 66.8 1.32002 68.0 56.3 6.2 4.7 0.8 7.6 60.4 5.2 15.5 25.3 27.2 66.8 1.12003 69.1 56.6 6.5 5.0 1.0 7.8 61.3 5.0 14.9 26.0 28.2 68.3 0.92004 69.5 56.5 6.6 5.1 1.3 7.8 61.7 4.6 14.8 26.2 28.5 68.4 1.12005 70.4 57.1 6.7 5.2 1.4 7.8 62.6 4.6 14.9 25.7 29.8 69.2 1.22006 68.6 55.4 6.5 5.4 1.4 7.4 61.2 4.3 14.4 24.2 30.0 67.8 0.82007 66.3 53.5 6.2 5.3 1.4 7.4 58.9 4.3 15.0 23.4 27.8 65.9 0.42008 70.1 56.9 6.6 5.3 1.3 10.2 59.9 4.9 18.7 23.1 28.3 69.4 0.72009 79.8 64.7 7.6 5.8 1.7 12.3 67.5 5.0 21.1 26.7 32.0 79.1 0.72010 85.3 69.3 8.3 5.9 1.9 13.1 72.2 5.2 24.0 28.1 33.3 84.5 0.8
3. Euro area countries
BE DE EE IE GR ES FR IT CY LU MT NL AT PT SI SK FI
1 2 3 4 5 6 7 8 9 10 11 12 13 14 15 16 17
2007 84.1 65.2 3.7 24.8 107.4 36.2 64.2 103.1 58.8 6.7 62.1 45.3 60.2 68.3 23.1 29.6 35.22008 89.3 66.7 4.5 44.2 113.0 40.1 68.2 105.8 48.9 13.7 62.2 58.5 63.8 71.6 21.9 27.8 33.92009 95.9 74.4 7.2 65.2 129.3 53.8 79.0 115.5 58.5 14.8 67.8 60.8 69.5 83.0 35.3 35.5 43.32010 96.2 83.2 6.7 92.5 144.9 61.0 82.3 118.4 61.5 19.1 69.0 62.9 71.8 93.3 38.8 41.0 48.3
Sources: ECB for euro area aggregated data; European Commission for data relating to countries’ debt.1) Data refer to the Euro 17. Gross general government debt at nominal value and consolidated between sub-sectors of government. Holdings by non-resident governments are
not consolidated. Intergovernmental lending in the context of the financial crisis is consolidated. Data are partially estimated.2) Holders resident in the country whose government has issued the debt. 3) Includes residents of euro area countries other than the country whose government has issued the debt. 4) Excludes debt held by general government in the country whose government has issued it.

6.3 Change in debt 1) (as a percentage of GDP)
S 58ECBMonthly BulletinJanuary 2012
1. Euro area _ by source, financial instrument and sector of the holder
Total Source of change Financial instruments Holders
Borrowing Valuation Other Currency Loans Short-term Long-term Domestic Other
requirement 2) effects 3) changes and securities securities creditors 5) MFIs Other creditors 6)
in deposits financialvolume 4) corporations
1 2 3 4 5 6 7 8 9 10 11 12
2002 2.1 2.7 -0.5 -0.1 0.0 -0.2 0.7 1.6 -0.3 -0.5 0.0 2.42003 3.1 3.3 -0.2 0.0 -0.6 0.9 0.6 2.1 0.5 0.8 0.8 2.62004 3.2 3.3 -0.1 0.0 0.2 0.1 0.1 2.7 0.1 -0.2 0.3 3.02005 3.3 3.1 0.2 0.0 0.3 0.5 -0.1 2.6 -0.4 -0.1 0.5 3.62006 1.7 1.4 0.1 0.1 0.2 0.3 -0.3 1.5 -0.3 1.1 -1.4 2.02007 1.2 1.2 0.0 0.0 -0.1 0.0 0.3 1.0 -0.5 -0.3 -0.3 1.62008 5.3 5.2 0.1 0.0 0.1 0.5 2.6 2.0 1.1 1.0 -0.6 4.22009 7.2 7.5 -0.2 0.0 0.1 0.7 1.6 4.8 3.0 2.3 0.8 4.32010 7.6 7.7 -0.1 0.0 0.0 3.0 -0.7 5.2 4.2 3.3 1.0 3.3
2. Euro area _ deficit-debt adjustment
Change in Deficit (-) / Deficit-debt adjustment 8)
debt surplus (+) 7) Total Transactions in main financial assets held by general government Valuation Other Other 9)
effects Exchange changes inTotal Currency Loans Securities 10) Shares and rate volume
and other Privatisations Equity effectsdeposits equity injections
1 2 3 4 5 6 7 8 9 10 11 12 13 14
2002 2.1 -2.7 -0.6 0.1 0.1 0.0 0.0 -0.1 -0.4 0.1 -0.5 -0.1 -0.1 -0.12003 3.1 -3.1 0.0 0.1 0.1 0.0 0.0 0.1 -0.2 0.1 -0.2 -0.1 0.0 0.12004 3.2 -2.9 0.2 0.2 0.2 0.0 0.1 0.0 -0.5 0.2 -0.1 0.0 0.0 0.12005 3.3 -2.5 0.7 0.6 0.3 0.0 0.1 0.1 -0.3 0.2 0.2 0.0 0.0 -0.12006 1.7 -1.4 0.3 0.2 0.3 -0.1 0.2 -0.2 -0.4 0.1 0.1 0.0 0.1 -0.12007 1.2 -0.7 0.5 0.6 0.2 0.0 0.2 0.1 -0.3 0.2 0.0 0.0 0.0 -0.12008 5.3 -2.1 3.2 3.0 0.8 0.7 0.7 0.9 -0.1 0.7 0.1 0.0 0.0 0.02009 7.2 -6.4 0.8 1.0 0.3 0.0 0.3 0.5 -0.3 0.5 -0.2 0.0 0.0 0.12010 7.6 -6.2 1.3 1.7 0.0 0.5 1.1 0.1 0.0 0.2 -0.1 0.0 0.0 -0.3
Source: ECB.1) Data refer to the Euro 17 and are partially estimated. Annual change in gross nominal consolidated debt is expressed as a percentage of GDP, i.e. [debt(t) - debt(t-1)] ÷ GDP(t). Intergovernmental lending in the context of the financial crisis is consolidated.2) The borrowing requirement is by definition equal to transactions in debt.3) Includes, in addition to the impact of foreign exchange movements, effects arising from measurement at nominal value (e.g. premia or discounts on securities issued).4) Includes, in particular, the impact of the reclassification of units and certain types of debt assumption.5) Holders resident in the country whose government has issued the debt. 6) Includes residents of euro area countries other than the country whose government has issued the debt. 7) Including proceeds from sales of UMTS licences.8) The difference between the annual change in gross nominal consolidated debt and the deficit as a percentage of GDP. 9) Mainly composed of transactions in other assets and liabilities (trade credits, other receivables/payables and financial derivatives).10) Excluding financial derivatives.
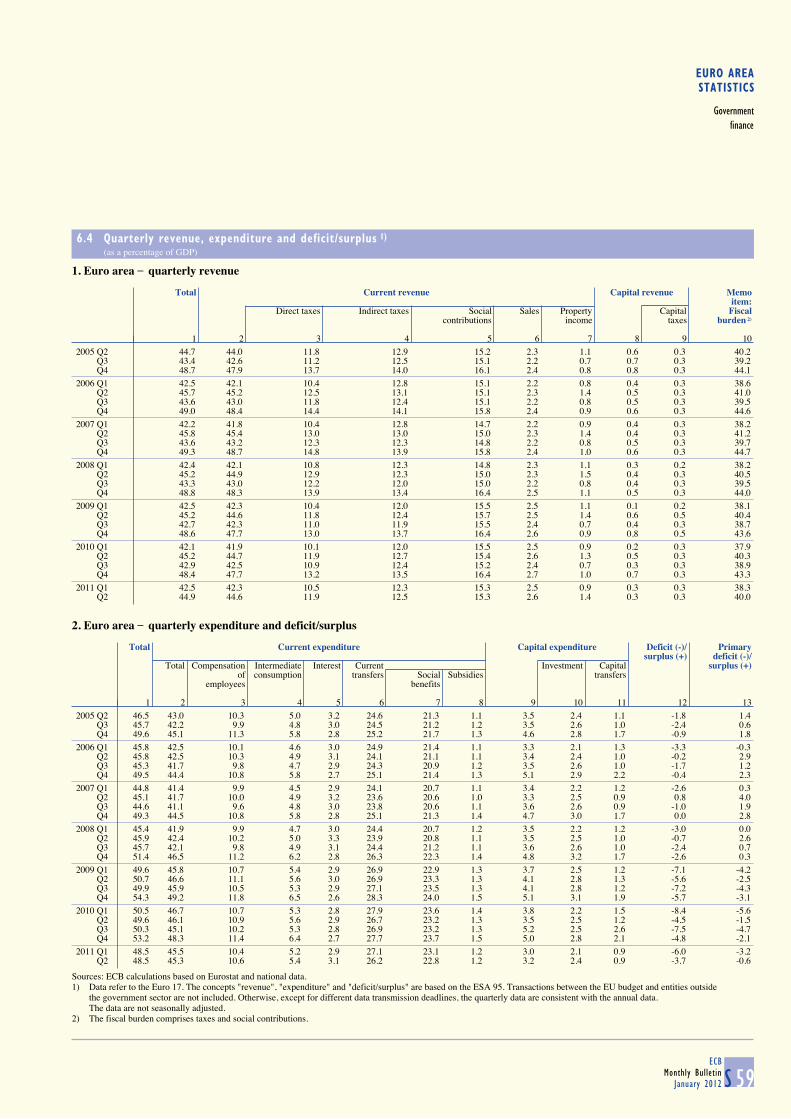
EURO AREASTATISTICS
Governmentfinance
6.4 Quarterly revenue, expenditure and deficit/surplus 1) (as a percentage of GDP)
S 59ECB
Monthly BulletinJanuary 2012
1. Euro area _ quarterly revenue
Total Current revenue Capital revenue Memo
item:Direct taxes Indirect taxes Social Sales Property Capital Fiscal
contributions income taxes burden 2)
1 2 3 4 5 6 7 8 9 10
2005 Q2 44.7 44.0 11.8 12.9 15.2 2.3 1.1 0.6 0.3 40.2 Q3 43.4 42.6 11.2 12.5 15.1 2.2 0.7 0.7 0.3 39.2 Q4 48.7 47.9 13.7 14.0 16.1 2.4 0.8 0.8 0.3 44.1
2006 Q1 42.5 42.1 10.4 12.8 15.1 2.2 0.8 0.4 0.3 38.6 Q2 45.7 45.2 12.5 13.1 15.1 2.3 1.4 0.5 0.3 41.0 Q3 43.6 43.0 11.8 12.4 15.1 2.2 0.8 0.5 0.3 39.5 Q4 49.0 48.4 14.4 14.1 15.8 2.4 0.9 0.6 0.3 44.6
2007 Q1 42.2 41.8 10.4 12.8 14.7 2.2 0.9 0.4 0.3 38.2 Q2 45.8 45.4 13.0 13.0 15.0 2.3 1.4 0.4 0.3 41.2 Q3 43.6 43.2 12.3 12.3 14.8 2.2 0.8 0.5 0.3 39.7 Q4 49.3 48.7 14.8 13.9 15.8 2.4 1.0 0.6 0.3 44.7
2008 Q1 42.4 42.1 10.8 12.3 14.8 2.3 1.1 0.3 0.2 38.2 Q2 45.2 44.9 12.9 12.3 15.0 2.3 1.5 0.4 0.3 40.5 Q3 43.3 43.0 12.2 12.0 15.0 2.2 0.8 0.4 0.3 39.5 Q4 48.8 48.3 13.9 13.4 16.4 2.5 1.1 0.5 0.3 44.0
2009 Q1 42.5 42.3 10.4 12.0 15.5 2.5 1.1 0.1 0.2 38.1 Q2 45.2 44.6 11.8 12.4 15.7 2.5 1.4 0.6 0.5 40.4 Q3 42.7 42.3 11.0 11.9 15.5 2.4 0.7 0.4 0.3 38.7 Q4 48.6 47.7 13.0 13.7 16.4 2.6 0.9 0.8 0.5 43.6
2010 Q1 42.1 41.9 10.1 12.0 15.5 2.5 0.9 0.2 0.3 37.9 Q2 45.2 44.7 11.9 12.7 15.4 2.6 1.3 0.5 0.3 40.3 Q3 42.9 42.5 10.9 12.4 15.2 2.4 0.7 0.3 0.3 38.9 Q4 48.4 47.7 13.2 13.5 16.4 2.7 1.0 0.7 0.3 43.3
2011 Q1 42.5 42.3 10.5 12.3 15.3 2.5 0.9 0.3 0.3 38.3 Q2 44.9 44.6 11.9 12.5 15.3 2.6 1.4 0.3 0.3 40.0
2. Euro area _ quarterly expenditure and deficit/surplus
Total Current expenditure Capital expenditure Deficit (-)/ Primary
surplus (+) deficit (-)/Total Compensation Intermediate Interest Current Investment Capital surplus (+)
of consumption transfers Social Subsidies transfersemployees benefits
1 2 3 4 5 6 7 8 9 10 11 12 13
2005 Q2 46.5 43.0 10.3 5.0 3.2 24.6 21.3 1.1 3.5 2.4 1.1 -1.8 1.4 Q3 45.7 42.2 9.9 4.8 3.0 24.5 21.2 1.2 3.5 2.6 1.0 -2.4 0.6 Q4 49.6 45.1 11.3 5.8 2.8 25.2 21.7 1.3 4.6 2.8 1.7 -0.9 1.8
2006 Q1 45.8 42.5 10.1 4.6 3.0 24.9 21.4 1.1 3.3 2.1 1.3 -3.3 -0.3 Q2 45.8 42.5 10.3 4.9 3.1 24.1 21.1 1.1 3.4 2.4 1.0 -0.2 2.9 Q3 45.3 41.7 9.8 4.7 2.9 24.3 20.9 1.2 3.5 2.6 1.0 -1.7 1.2 Q4 49.5 44.4 10.8 5.8 2.7 25.1 21.4 1.3 5.1 2.9 2.2 -0.4 2.3
2007 Q1 44.8 41.4 9.9 4.5 2.9 24.1 20.7 1.1 3.4 2.2 1.2 -2.6 0.3 Q2 45.1 41.7 10.0 4.9 3.2 23.6 20.6 1.0 3.3 2.5 0.9 0.8 4.0 Q3 44.6 41.1 9.6 4.8 3.0 23.8 20.6 1.1 3.6 2.6 0.9 -1.0 1.9 Q4 49.3 44.5 10.8 5.8 2.8 25.1 21.3 1.4 4.7 3.0 1.7 0.0 2.8
2008 Q1 45.4 41.9 9.9 4.7 3.0 24.4 20.7 1.2 3.5 2.2 1.2 -3.0 0.0 Q2 45.9 42.4 10.2 5.0 3.3 23.9 20.8 1.1 3.5 2.5 1.0 -0.7 2.6 Q3 45.7 42.1 9.8 4.9 3.1 24.4 21.2 1.1 3.6 2.6 1.0 -2.4 0.7 Q4 51.4 46.5 11.2 6.2 2.8 26.3 22.3 1.4 4.8 3.2 1.7 -2.6 0.3
2009 Q1 49.6 45.8 10.7 5.4 2.9 26.9 22.9 1.3 3.7 2.5 1.2 -7.1 -4.2 Q2 50.7 46.6 11.1 5.6 3.0 26.9 23.3 1.3 4.1 2.8 1.3 -5.6 -2.5 Q3 49.9 45.9 10.5 5.3 2.9 27.1 23.5 1.3 4.1 2.8 1.2 -7.2 -4.3 Q4 54.3 49.2 11.8 6.5 2.6 28.3 24.0 1.5 5.1 3.1 1.9 -5.7 -3.1
2010 Q1 50.5 46.7 10.7 5.3 2.8 27.9 23.6 1.4 3.8 2.2 1.5 -8.4 -5.6 Q2 49.6 46.1 10.9 5.6 2.9 26.7 23.2 1.3 3.5 2.5 1.2 -4.5 -1.5 Q3 50.3 45.1 10.2 5.3 2.8 26.9 23.2 1.3 5.2 2.5 2.6 -7.5 -4.7 Q4 53.2 48.3 11.4 6.4 2.7 27.7 23.7 1.5 5.0 2.8 2.1 -4.8 -2.1
2011 Q1 48.5 45.5 10.4 5.2 2.9 27.1 23.1 1.2 3.0 2.1 0.9 -6.0 -3.2 Q2 48.5 45.3 10.6 5.4 3.1 26.2 22.8 1.2 3.2 2.4 0.9 -3.7 -0.6
Sources: ECB calculations based on Eurostat and national data.1) Data refer to the Euro 17. The concepts "revenue", "expenditure" and "deficit/surplus" are based on the ESA 95. Transactions between the EU budget and entities outside
the government sector are not included. Otherwise, except for different data transmission deadlines, the quarterly data are consistent with the annual data.The data are not seasonally adjusted.
2) The fiscal burden comprises taxes and social contributions.

6.5 Quarterly debt and change in debt 1) (as a percentage of GDP)
S 60ECBMonthly BulletinJanuary 2012
1. Euro area _ Maastricht debt by financial instrument 2)
Total Financial instruments
Currency and deposits Loans Short-term securities Long-term securities1 2 3 4 5
2008 Q3 67.7 2.1 11.4 5.5 48.7 Q4 70.1 2.3 11.5 6.7 49.6
2009 Q1 73.8 2.3 11.8 7.9 51.8 Q2 77.0 2.4 12.2 8.4 54.0 Q3 78.9 2.4 12.4 9.2 54.9 Q4 79.8 2.5 12.6 8.6 56.2
2010 Q1 81.5 2.4 12.8 8.4 57.9 Q2 82.8 2.4 13.4 8.1 59.0 Q3 82.9 2.4 13.3 8.2 59.1 Q4 85.3 2.4 15.3 7.7 60.0
2011 Q1 86.1 2.4 15.1 7.6 60.9 Q2 86.9 2.4 14.9 7.6 62.0
2. Euro area _ deficit-debt adjustment
Change in Deficit (-)/ Deficit-debt adjustment Memo
debt surplus (+) item:Total Transactions in main financial assets held by general government Valuation effects Other Borrowing
and other changes requirementTotal Currency Loans Securities Shares and in volume
and deposits other equity1 2 3 4 5 6 7 8 9 10 11
2008 Q3 2.0 -2.4 -0.4 -0.6 -1.4 0.0 0.3 0.6 0.4 -0.2 1.6 Q4 9.2 -2.6 6.7 5.5 0.6 2.5 0.4 2.1 0.2 1.0 9.0
2009 Q1 12.8 -7.1 5.7 6.7 5.2 -0.1 0.9 0.7 -0.5 -0.5 13.3 Q2 9.1 -5.6 3.5 3.2 2.3 -0.6 0.2 1.2 -0.4 0.8 9.5 Q3 5.0 -7.2 -2.3 -2.9 -3.2 0.6 -0.1 -0.3 0.2 0.4 4.7 Q4 2.4 -5.7 -3.3 -2.8 -2.9 -0.1 0.1 0.1 -0.2 -0.3 2.6
2010 Q1 8.1 -8.4 -0.2 0.7 0.8 0.0 -0.4 0.3 -0.3 -0.6 8.5 Q2 7.6 -4.5 3.2 3.3 2.0 1.1 -0.2 0.4 -0.1 0.0 7.7 Q3 3.0 -7.5 -4.5 -3.0 -2.3 -0.6 -0.1 0.1 0.0 -1.5 3.0 Q4 11.3 -4.8 6.5 5.9 -0.3 1.7 4.7 -0.2 0.0 0.7 11.3
2011 Q1 6.0 -6.0 0.0 0.7 1.8 -0.4 -0.4 -0.3 -0.2 -0.5 6.3 Q2 5.9 -3.7 2.3 3.3 3.1 0.6 -0.4 -0.1 0.3 -1.3 5.7
C30 Deficit, borrowing requirement and change in debt
(four-quarter moving sum as a percentage of GDP)
C31 Maastricht debt
(annual change in the debt-to-GDP ratio and underlying factors)
0.0
1.0
2.0
3.0
4.0
5.0
6.0
7.0
8.0
9.0
10.0
2001 2002 2003 2004 2005 2006 2007 2008 2009 20100.0
1.0
2.0
3.0
4.0
5.0
6.0
7.0
8.0
9.0
10.0
deficitchange in debtborrowing requirement
-4.0
-2.0
0.0
2.0
4.0
6.0
8.0
10.0
12.0
2001 2002 2003 2004 2005 2006 2007 2008 2009 2010-4.0
-2.0
0.0
2.0
4.0
6.0
8.0
10.0
12.0
deficit-debt adjustmentprimary deficit/surplusgrowth/interest rate differentialchange in debt-to-GDP ratio
Sources: ECB calculations based on Eurostat and national data.1) Data refer to the Euro 17. Intergovernmental lending in the context of the financial crisis is consolidated.2) The stock data in quarter t are expressed as a percentage of the sum of GDP in t and the previous three quarters.

7EXTERNAL TRANSACTIONS AND POSITIONS
7.1 Summary balance of payments 1) (EUR billions; net transactions)
S 61ECB
Monthly BulletinJanuary 2012
Current account Net Financial account
Capital lending/ Errors andTotal Goods Services Income Current account borrowing Total Direct Portfolio Financial Other Reserve omissions
transfers to/from investment investment derivatives investment assetsrest of
the world(columns
1+6)
1 2 3 4 5 6 7 8 9 10 11 12 13 14
2008 -143.5 -21.8 42.1 -66.8 -97.0 10.0 -133.5 121.3 -231.1 261.4 -84.5 178.9 -3.4 12.22009 -25.9 36.0 35.1 -5.8 -91.2 7.3 -18.6 14.0 -102.8 261.4 21.1 -170.2 4.6 4.62010 -42.2 12.9 45.9 2.3 -103.3 5.5 -36.7 44.1 -49.9 148.0 17.4 -61.2 -10.3 -7.4
2010 Q3 -7.1 5.5 16.1 2.5 -31.2 0.8 -6.3 6.8 -52.2 11.0 6.3 46.8 -5.1 -0.5 Q4 3.4 5.5 10.5 4.3 -16.8 1.3 4.7 9.5 79.5 19.5 8.9 -96.8 -1.6 -14.22011 Q1 -30.2 -13.0 7.0 10.2 -34.5 2.4 -27.8 15.7 -9.9 128.5 -2.2 -89.1 -11.6 12.1 Q2 -20.8 -2.7 17.5 -14.4 -21.2 0.7 -20.1 20.6 -28.5 155.6 3.4 -114.3 4.3 -0.4 Q3 -9.9 1.7 16.1 0.3 -28.0 2.6 -7.4 10.9 -7.2 31.3 -3.9 -13.3 3.9 -3.5
2010 Oct. 3.9 5.7 3.2 3.9 -8.9 -1.3 2.6 2.0 -8.7 5.2 -0.3 5.9 -0.2 -4.6 Nov. -3.4 -0.8 3.4 0.3 -6.2 0.5 -2.9 13.4 45.4 18.4 3.1 -53.5 0.0 -10.5 Dec. 3.0 0.6 3.9 0.1 -1.7 2.0 4.9 -5.8 42.7 -4.2 6.1 -49.2 -1.3 0.9
2011 Jan. -19.9 -14.7 2.6 1.1 -8.9 0.4 -19.6 13.5 11.7 -28.9 -1.0 37.7 -6.0 6.0 Feb. -9.3 -0.8 2.6 4.2 -15.2 2.1 -7.1 2.2 -27.9 93.6 0.8 -65.3 1.0 5.0 Mar. -1.0 2.5 1.8 5.0 -10.3 -0.1 -1.1 0.0 6.3 63.9 -2.1 -61.5 -6.6 1.1 Apr. -4.9 -3.7 4.0 1.4 -6.6 -0.1 -5.0 -1.8 -30.4 18.7 2.9 1.0 5.9 6.8 May -16.1 0.6 5.4 -15.6 -6.4 0.4 -15.7 13.1 -5.9 43.2 -1.5 -19.6 -3.1 2.5 June 0.2 0.5 8.1 -0.2 -8.2 0.3 0.6 9.2 7.8 93.7 1.9 -95.7 1.5 -9.8 July -2.0 3.3 5.5 -0.7 -10.2 0.5 -1.6 2.5 0.6 -21.1 -4.6 28.5 -0.9 -0.9 Aug. -7.2 -4.5 4.0 1.1 -7.8 2.2 -5.0 6.8 -0.3 31.9 -0.7 -27.4 3.2 -1.8 Sep. -0.7 2.8 6.6 -0.1 -10.0 -0.1 -0.8 1.6 -7.5 20.5 1.4 -14.4 1.6 -0.8 Oct. 1.7 1.4 5.0 3.0 -7.6 1.5 3.2 -9.0 -7.4 -24.7 -0.4 24.6 -1.1 5.8
12-month cumulated transactions
2011 Oct. -59.7 -12.8 52.9 -0.5 -99.2 9.7 -50.0 45.8 35.3 305.0 6.1 -294.9 -5.7 4.3
12-month cumulated transactions as a percentage of GDP
2011 Oct. -0.6 -0.1 0.6 0.0 -1.1 0.1 -0.5 0.5 0.4 3.3 0.1 -3.2 -0.1 0.0
C32 Euro area b.o.p.: current account
(seasonally adjusted; 12-month cumulated transactions as a percentage of GDP)
C33 Euro area b.o.p.: direct and portfolio investment
(12-month cumulated transactions as a percentage of GDP)
-2.0
-1.5
-1.0
-0.5
0.0
0.5
1.0
2001 2002 2003 2004 2005 2006 2007 2008 2009 2010 2011-2.0
-1.5
-1.0
-0.5
0.0
0.5
1.0
current account balance
-4.0
-3.0
-2.0
-1.0
0.0
1.0
2.0
3.0
4.0
5.0
2001 2002 2003 2004 2005 2006 2007 2008 2009 2010 2011-4.0
-3.0
-2.0
-1.0
0.0
1.0
2.0
3.0
4.0
5.0
net direct investmentnet portfolio investment
Source: ECB.1) The sign convention is explained in the General Notes.

7.2 Current and capital accounts (EUR billions; transactions)
S 62ECBMonthly BulletinJanuary 2012
1. Summary current and capital accounts
Current account Capital account
Total Goods Services Income Current transfers
Credit Debit Net Credit Debit Credit Debit Credit Debit Credit Debit Credit Debit
Workers’ Workers’remit- remit-tances tances
1 2 3 4 5 6 7 8 9 10 11 12 13 14 15
2008 2,717.2 2,860.8 -143.5 1,588.5 1,610.4 513.3 471.2 523.6 590.4 91.8 6.9 188.8 21.6 24.7 14.72009 2,292.4 2,318.3 -25.9 1,302.5 1,266.5 473.9 438.8 421.5 427.3 94.5 6.4 185.7 22.5 20.6 13.42010 2,617.1 2,659.3 -42.2 1,560.0 1,547.1 518.8 472.9 450.7 448.4 87.6 6.3 190.9 22.3 21.2 15.7
2010 Q3 666.8 674.0 -7.1 402.3 396.8 139.3 123.2 109.7 107.2 15.6 1.7 46.8 5.8 4.6 3.7 Q4 705.7 702.2 3.4 421.7 416.2 135.7 125.2 117.3 113.0 31.0 1.6 47.8 6.0 7.1 5.92011 Q1 684.5 714.7 -30.2 423.3 436.4 123.0 116.0 113.5 103.3 24.7 1.5 59.1 5.4 5.0 2.6 Q2 718.0 738.8 -20.8 438.0 440.6 133.3 115.8 127.1 141.5 19.6 1.6 40.8 5.6 3.8 3.1 Q3 710.4 720.4 -9.9 442.2 440.6 140.7 124.6 110.8 110.5 16.7 . 44.7 . 5.4 2.9
2011 Aug. 228.1 235.3 -7.2 139.9 144.4 46.4 42.5 35.9 34.7 5.9 . 13.7 . 3.1 1.0 Sep. 245.7 246.4 -0.7 154.2 151.4 47.2 40.6 38.8 39.0 5.4 . 15.4 . 0.9 1.0 Oct. 244.5 242.7 1.7 152.7 151.4 46.9 41.9 37.2 34.2 7.6 . 15.3 . 2.4 1.0
Seasonally adjusted
2011 Q1 707.4 717.6 -10.2 434.4 435.7 133.6 120.7 116.7 112.6 22.7 . 48.6 . . . Q2 712.1 725.2 -13.1 436.2 440.8 132.7 118.4 120.5 118.0 22.6 . 48.0 . . . Q3 714.9 725.4 -10.5 441.2 440.7 133.0 120.1 116.8 117.7 23.9 . 46.9 . . .
2011 Aug. 238.8 244.7 -5.9 147.9 148.9 44.1 40.3 38.7 39.9 8.1 . 15.6 . . . Sep. 240.4 238.1 2.2 147.3 144.8 45.2 39.6 39.7 38.4 8.2 . 15.4 . . . Oct. 242.0 249.6 -7.5 147.4 151.8 46.7 41.6 39.2 40.4 8.8 . 15.7 . . .
12-month cumulated transactions
2011 Oct. 2,828.0 2,886.7 -58.7 1,730.2 1,744.5 535.2 482.0 469.5 468.9 93.2 . 191.3 . . .
12-month cumulated transactions as a percentage of GDP
2011 Oct. 30.2 30.8 -0.6 18.5 18.6 5.7 5.1 5.0 5.0 1.0 . 2.0 . . .
C34 Euro area b.o.p.: goods
(seasonally adjusted; 12-month cumulated transactions as a percentage of GDP)
C35 Euro area b.o.p.: services
(seasonally adjusted; 12-month cumulated transactions as a percentage of GDP)
6.0
8.0
10.0
12.0
14.0
16.0
18.0
20.0
2000 2001 2002 2003 2004 2005 2006 2007 2008 2009 2010 20116.0
8.0
10.0
12.0
14.0
16.0
18.0
20.0
exports (credit)imports (debit)
2.5
3.0
3.5
4.0
4.5
5.0
5.5
6.0
2000 2001 2002 2003 2004 2005 2006 2007 2008 2009 2010 20112.5
3.0
3.5
4.0
4.5
5.0
5.5
6.0
exports (credit)imports (debit)
Source: ECB.

EURO AREASTATISTICS
Externaltransactions
andpositions
7.2 Current and capital accounts (EUR billions)
S 63ECB
Monthly BulletinJanuary 2012
2. Income account(transactions)
Compensation of employees Investment income
Credit Debit Total Direct investment Portfolio investment Other investment
Credit Debit Equity Debt Equity Debt Credit Debit
Credit Debit Credit Debit Credit Debit Credit Debit
Reinv. Reinv.earnings earnings
1 2 3 4 5 6 7 8 9 10 11 12 13 14 15 16
2008 21.1 13.1 502.5 577.3 140.5 -7.8 117.4 20.5 31.3 26.7 39.3 111.2 119.1 128.7 172.3 193.3 2009 21.7 13.8 399.9 413.5 148.8 16.1 100.4 14.9 24.7 23.5 24.5 77.3 101.0 122.1 100.8 90.2 2010 23.3 14.2 427.3 434.2 195.6 20.1 139.6 38.4 24.0 19.9 29.1 86.3 99.3 122.7 79.3 65.6
2010 Q2 5.7 3.4 110.2 126.4 50.5 -8.5 35.7 3.6 6.0 4.9 9.3 38.5 24.8 31.0 19.6 16.2 Q3 5.6 4.1 104.1 103.1 46.5 14.6 35.0 12.5 5.7 4.6 7.4 16.8 25.4 31.1 19.1 15.6 Q4 6.4 4.1 111.0 108.9 51.2 -2.0 36.0 6.4 6.7 6.2 6.4 18.5 25.5 30.0 21.2 18.2 2011 Q1 5.7 2.7 107.8 100.6 47.7 11.1 33.8 21.5 6.5 4.3 7.4 14.2 25.4 30.8 20.9 17.5 Q2 5.8 3.2 121.3 138.4 56.5 8.8 38.1 10.6 6.4 4.8 12.3 46.3 25.2 31.3 20.9 17.8
3. Geographical breakdown(cumulated transactions)
Total EU Member States outside the euro area Brazil Canada China India Japan Russia Switzer- United Other
land StatesTotal Den- Sweden United Other EU EU
mark Kingdom countries insti-2010 Q3 to tutions
2011 Q2 1 2 3 4 5 6 7 8 9 10 11 12 13 14 15 16
Credits
Current account 2,775.0 916.7 51.1 87.3 424.1 295.6 58.7 53.1 38.3 131.5 39.9 60.3 103.8 208.5 352.9 869.9 Goods 1,685.3 539.3 32.6 57.8 219.4 229.4 0.2 28.3 19.5 106.3 29.9 36.9 76.3 110.8 193.0 544.8 Services 531.3 166.9 10.9 14.7 103.9 30.7 6.6 8.4 8.2 17.1 7.4 13.1 17.3 53.6 77.6 161.6 Income 467.6 150.1 6.5 13.1 90.6 31.7 8.3 15.9 9.8 7.5 2.4 9.3 9.6 35.8 75.8 151.4 Investment income 444.1 143.4 6.4 12.9 89.0 31.1 4.0 15.9 9.7 7.5 2.4 9.3 9.5 24.7 74.0 147.7 Current transfers 90.8 60.4 1.2 1.6 10.2 3.7 43.7 0.4 0.8 0.5 0.3 0.9 0.6 8.3 6.5 12.1 Capital account 20.5 17.2 0.0 0.0 1.2 0.4 15.6 0.1 0.0 0.0 0.0 0.2 0.1 0.4 0.4 1.9
Debits
Current account 2,829.7 861.0 43.9 84.2 366.3 262.6 104.0 - 31.9 - - 93.5 - 180.6 364.8 - Goods 1,690.0 465.8 29.0 50.6 173.8 212.4 0.0 29.5 14.2 215.1 26.8 52.7 121.6 91.0 140.3 533.1 Services 480.2 136.9 7.7 12.8 81.9 34.2 0.2 5.1 6.5 13.1 5.7 9.8 10.7 42.4 98.7 151.4 Income 465.0 141.5 6.6 19.2 98.9 11.4 5.4 - 9.3 - - 30.5 - 39.5 118.8 - Investment income 450.9 133.4 6.5 19.1 97.4 5.0 5.4 - 9.2 - - 30.3 - 39.1 117.7 - Current transfers 194.5 116.7 0.6 1.5 11.7 4.5 98.4 1.5 1.9 3.8 0.7 0.5 0.7 7.8 7.0 53.8 Capital account 15.3 1.6 0.0 0.1 0.9 0.3 0.2 0.2 0.3 0.3 0.2 0.1 0.1 0.6 1.3 10.6
Net
Current account -54.7 55.7 7.2 3.0 57.8 33.0 -45.3 - 6.4 - - -33.2 - 27.9 -12.0 - Goods -4.7 73.5 3.6 7.2 45.5 17.0 0.2 -1.1 5.3 -108.7 3.1 -15.7 -45.3 19.8 52.8 11.7 Services 51.1 30.0 3.2 1.9 22.1 -3.5 6.3 3.3 1.7 4.0 1.7 3.3 6.7 11.2 -21.2 10.2 Income 2.6 8.6 -0.1 -6.2 -8.3 20.2 2.9 - 0.5 - - -21.2 - -3.6 -43.1 - Investment income -6.8 10.0 -0.1 -6.2 -8.4 26.0 -1.3 - 0.5 - - -21.1 - -14.4 -43.7 - Current transfers -103.7 -56.4 0.6 0.1 -1.5 -0.8 -54.7 -1.2 -1.1 -3.2 -0.5 0.3 -0.1 0.5 -0.5 -41.7 Capital account 5.2 15.6 0.0 -0.1 0.2 0.0 15.4 -0.1 -0.2 -0.2 -0.2 0.1 0.0 -0.2 -0.9 -8.7
Source: ECB.

7.3 Financial account (EUR billions and annual growth rates; outstanding amounts and growth rates at end of period; transactions and other changes during period)
S 64ECBMonthly BulletinJanuary 2012
1. Summary financial account
Outstanding amounts (international investment position)
Total 1) Total Direct Portfolio Net Other Reserve
as a % of GDP investment investment financial investment assetsderivatives
Assets Liabilities Net Assets Liabilities Net Assets Liabilities Assets Liabilities Assets Liabilities
1 2 3 4 5 6 7 8 9 10 11 12 13 14
2007 13,992.8 15,266.8 -1,274.0 155.0 169.1 -14.1 3,726.7 3,221.9 4,631.1 6,538.1 -28.9 5,316.7 5,506.8 347.22008 13,377.1 14,961.4 -1,584.3 144.7 161.8 -17.1 3,878.4 3,247.8 3,834.9 5,976.8 -0.5 5,290.0 5,736.7 374.22009 13,764.1 15,170.3 -1,406.2 154.1 169.9 -15.7 4,287.2 3,403.0 4,341.3 6,781.9 0.2 4,675.9 4,985.4 459.6
2010 Q4 15,234.8 16,461.7 -1,226.9 166.3 179.7 -13.4 4,798.2 3,714.8 4,907.5 7,442.9 -61.6 5,002.9 5,304.0 587.82011 Q1 15,135.4 16,377.3 -1,241.9 163.7 177.2 -13.4 4,801.9 3,739.5 4,811.3 7,469.7 -31.6 4,977.1 5,168.1 576.6 Q2 15,241.6 16,591.9 -1,350.3 163.7 178.2 -14.5 4,861.2 3,765.7 4,768.0 7,681.2 -49.1 5,080.6 5,144.9 581.0
Changes to outstanding amounts
2007 1,608.0 1,858.8 -250.9 17.8 20.6 -2.8 572.8 486.8 258.7 591.3 -8.1 763.3 780.7 21.42008 -615.7 -305.5 -310.3 -6.7 -3.3 -3.4 151.7 25.9 -796.2 -561.3 28.4 -26.7 229.9 27.02009 387.1 208.9 178.1 4.3 2.3 2.0 408.8 155.2 506.4 805.1 0.7 -614.1 -751.4 85.42010 1,470.7 1,291.5 179.3 16.1 14.1 2.0 511.0 311.8 566.2 661.0 -61.7 327.1 318.7 128.2
2011 Q1 -99.5 -84.5 -15.0 -4.3 -3.7 -0.7 3.8 24.6 -96.2 26.8 29.9 -25.8 -135.9 -11.2 Q2 106.2 214.6 -108.4 4.5 9.1 -4.6 59.3 26.2 -43.4 211.5 -17.5 103.4 -23.2 4.4
Transactions
2007 1,940.3 1,943.2 -3.0 21.5 21.5 0.0 512.9 422.5 439.5 566.3 66.9 915.8 954.4 5.12008 429.9 551.3 -121.3 4.7 6.0 -1.3 336.6 105.5 5.0 266.4 84.5 0.5 179.4 3.42009 -128.9 -114.9 -14.0 -1.4 -1.3 -0.2 334.7 231.9 94.0 355.3 -21.1 -531.9 -702.1 -4.62010 490.0 534.1 -44.1 5.3 5.8 -0.5 174.9 125.0 145.6 293.6 -17.4 176.7 115.5 10.3
2011 Q1 217.2 233.0 -15.7 9.5 10.2 -0.7 89.3 79.5 27.1 155.6 2.2 86.9 -2.2 11.6 Q2 203.9 224.4 -20.6 8.7 9.5 -0.9 59.5 31.0 33.5 189.1 -3.4 118.7 4.4 -4.3 Q3 60.1 71.0 -10.9 2.6 3.0 -0.5 24.9 17.7 -82.6 -51.3 3.9 118.0 104.6 -3.9
2011 June -99.3 -90.1 -9.2 . . . -0.2 7.6 -19.3 74.4 -1.9 -76.4 -172.1 -1.5 July -6.6 -4.1 -2.5 . . . 12.2 12.9 -5.6 -26.7 4.6 -18.7 9.7 0.9 Aug. 40.0 46.8 -6.8 . . . -6.0 -6.3 -65.9 -34.0 0.7 114.4 87.0 -3.2 Sep. 26.8 28.4 -1.6 . . . 18.6 11.1 -11.1 9.4 -1.4 22.3 7.9 -1.6 Oct. -57.6 -66.6 9.0 . . . 17.0 9.6 -35.2 -59.9 0.4 -40.8 -16.3 1.1
Other changes
2007 -332.3 -84.4 -247.9 -3.7 -0.9 -2.7 59.9 64.3 -180.8 25.1 -75.1 -152.6 -173.8 16.32008 -1,045.7 -856.7 -188.9 -11.3 -9.3 -2.0 -184.9 -79.5 -801.2 -827.7 -56.0 -27.2 50.5 23.72009 515.9 323.8 192.2 5.8 3.6 2.2 74.1 -76.7 412.4 449.7 21.7 -82.2 -49.3 89.92010 980.7 757.4 223.3 10.7 8.3 2.4 336.1 186.8 420.6 367.4 -44.3 150.4 203.1 117.9
Other changes due to exchange rate changes
2007 -522.0 -339.7 -182.3 -5.8 -3.8 -2.0 -104.2 -17.1 -217.4 -146.8 . -186.6 -175.8 -13.72008 -49.8 27.9 -77.7 -0.5 0.3 -0.8 -25.0 -34.0 6.6 41.9 . -40.7 20.1 9.32009 -49.6 -55.2 5.5 -0.6 -0.6 0.1 -4.6 5.7 -30.5 -32.9 . -11.9 -28.0 -2.72010 535.0 323.6 211.3 5.8 3.5 2.3 160.3 57.4 179.4 101.6 . 182.2 164.6 13.0
Other changes due to price changes
2007 78.7 113.4 -34.6 0.9 1.3 -0.4 45.2 5.8 77.3 107.6 -75.1 . . 31.32008 -1,002.7 -975.7 -27.1 -10.8 -10.6 -0.3 -159.2 -60.7 -809.5 -915.0 -56.0 . . 22.02009 635.3 483.4 151.9 7.1 5.4 1.7 142.5 28.4 425.3 455.0 21.7 . . 45.82010 295.0 153.7 141.3 3.2 1.7 1.5 50.1 2.2 187.3 151.5 -44.3 . . 102.0
Other changes due to other adjustments
2007 110.9 142.0 -31.0 1.2 1.6 -0.3 118.8 75.6 -40.7 64.3 . 34.1 2.0 -1.32008 6.8 91.0 -84.1 0.1 1.0 -0.9 -0.7 15.2 1.8 45.4 . 13.4 30.4 -7.72009 -69.7 -104.4 34.7 -0.8 -1.2 0.4 -63.9 -110.8 17.6 27.7 . -70.3 -21.3 46.82010 150.8 280.1 -129.3 1.6 3.1 -1.4 125.7 127.2 53.9 114.4 . -31.8 38.5 2.9
Growth rates of outstanding amounts
2007 15.6 14.3 - . . . 15.8 15.1 10.0 9.4 . 20.2 20.2 1.62008 3.0 3.6 - . . . 9.2 3.3 -0.2 4.2 . 0.0 3.3 1.02009 -1.0 -0.8 - . . . 8.6 7.3 2.4 5.9 . -10.1 -12.2 -1.22010 3.5 3.4 - . . . 3.9 3.5 3.2 4.2 . 3.7 2.3 2.0
2011 Q1 3.4 3.4 - . . . 4.5 5.3 2.6 5.3 . 3.4 -0.4 2.9 Q2 3.8 3.8 - . . . 3.8 4.6 3.1 6.4 . 4.9 -0.3 2.4 Q3 3.5 3.6 . . . . 3.2 5.2 0.5 4.9 . 7.1 0.7 0.8
Source: ECB.1) Net financial derivatives are included in assets.

EURO AREASTATISTICS
Externaltransactions
andpositions
7.3 Financial account (EUR billions and annual growth rates; outstanding amounts and growth rates at end of period, transactions during period)
S 65ECB
Monthly BulletinJanuary 2012
2. Direct investment
Oustanding amounts (international investment position)
By resident units abroad By non-resident units in the euro area
Total Equity capital Other capital Total Equity capital Other capital and reinvested earnings (mostly inter-company loans) and reinvested earnings (mostly inter-company loans)
Total MFIs Non- Total MFIs Non- Total Into MFIs Into Total To MFIs ToMFIs MFIs non-MFIs non-MFIs
1 2 3 4 5 6 7 8 9 10 11 12 13 14
2009 4,287.2 3,305.5 236.2 3,069.3 981.7 14.8 966.9 3,403.0 2,501.9 74.2 2,427.7 901.1 18.1 883.02010 4,798.2 3,667.1 277.9 3,389.2 1,131.1 17.8 1,113.3 3,714.8 2,820.2 83.2 2,737.0 894.6 12.7 881.9
2011 Q1 4,801.9 3,680.2 273.8 3,406.4 1,121.7 17.1 1,104.6 3,739.5 2,853.3 84.4 2,768.9 886.2 11.1 875.1 Q2 4,861.2 3,732.0 281.1 3,450.9 1,129.2 14.5 1,114.7 3,765.7 2,875.9 85.1 2,790.8 889.8 9.5 880.3
Transactions
2008 336.6 193.8 9.3 184.5 142.8 -0.3 143.1 105.5 64.3 -8.2 72.5 41.1 1.6 39.62009 334.7 257.5 20.1 237.3 77.2 2.6 74.6 231.9 236.7 7.5 229.2 -4.8 -0.6 -4.22010 174.9 51.1 12.6 38.5 123.8 1.2 122.6 125.0 176.7 7.2 169.5 -51.7 -7.5 -44.2
2011 Q1 89.3 77.8 3.8 74.0 11.6 0.1 11.5 79.5 69.6 0.8 68.8 9.9 -1.5 11.4 Q2 59.5 55.4 8.9 46.4 4.1 -2.6 6.7 31.0 26.8 1.6 25.2 4.2 -1.5 5.7 Q3 24.9 11.6 1.6 10.1 13.2 -1.7 14.9 17.7 31.7 1.5 30.2 -14.0 0.2 -14.2
2011 June -0.2 8.2 3.7 4.5 -8.3 -3.7 -4.6 7.6 6.8 0.5 6.3 0.8 -1.0 1.8 July 12.2 10.3 0.0 10.3 1.9 -1.6 3.5 12.9 16.4 0.8 15.6 -3.6 -0.2 -3.4 Aug. -6.0 -7.1 1.3 -8.3 1.1 0.1 0.9 -6.3 7.8 0.2 7.6 -14.1 0.1 -14.1 Sep. 18.6 8.4 0.2 8.2 10.2 -0.2 10.5 11.1 7.5 0.5 7.0 3.6 0.3 3.3 Oct. 17.0 14.0 0.0 14.0 3.0 0.2 2.8 9.6 5.5 0.1 5.3 4.2 -0.1 4.3
Growth rates
2009 8.6 8.6 9.2 8.5 8.8 20.5 8.6 7.3 10.4 11.6 10.4 -0.5 -3.2 -0.52010 3.9 1.5 5.3 1.2 12.5 7.8 12.6 3.5 6.8 9.4 6.8 -5.7 -41.3 -5.0
2011 Q1 4.5 2.9 2.1 3.0 9.9 6.4 10.0 5.3 6.3 8.7 6.2 2.0 -48.1 3.1 Q2 3.8 3.5 5.4 3.3 4.8 -12.7 5.1 4.6 5.1 8.0 5.0 3.1 -47.9 4.1 Q3 3.2 2.6 5.4 2.4 5.4 -24.0 5.9 5.2 4.9 6.9 4.9 6.1 -46.4 7.2
C36 Euro area international investment position
(outstanding amounts at end of period; as a percentage of GDP)
C37 Euro area direct and portfolio investment position
(outstanding amounts at end of period; as a percentage of GDP)
-18.0
-16.0
-14.0
-12.0
-10.0
-8.0
-6.0
-4.0
2001 2002 2003 2004 2005 2006 2007 2008 2009 2010 2011-18.0
-16.0
-14.0
-12.0
-10.0
-8.0
-6.0
-4.0
net international investment position
-40.0
-30.0
-20.0
-10.0
0.0
10.0
20.0
2001 2002 2003 2004 2005 2006 2007 2008 2009 2010 2011-40.0
-30.0
-20.0
-10.0
0.0
10.0
20.0
net direct investmentnet portfolio investment
Source: ECB.

7.3 Financial account (EUR billions and annual growth rates; outstanding amounts and growth rates at end of period; transactions during period)
S 66ECBMonthly BulletinJanuary 2012
3. Portfolio investment assets
Outstanding amounts (international investment position)
Total Equity Debt instruments
Bonds and notes Money market instruments
Total MFIs Non-MFIs Total MFIs Non-MFIs Total MFIs Non-MFIs
Euro- General Euro- General Euro- Generalsystem government system government system government
1 2 3 4 5 6 7 8 9 10 11 12 13 14 15 16
2009 4,341.3 1,514.5 80.8 3.4 1,433.6 36.6 2,426.6 924.6 17.1 1,502.0 36.6 400.2 330.2 44.9 69.9 2.02010 4,907.5 1,914.2 93.8 3.6 1,820.5 47.6 2,588.8 810.7 15.6 1,778.1 75.7 404.5 314.9 41.7 89.6 0.2
2011 Q1 4,811.3 1,858.4 89.8 3.1 1,768.6 44.8 2,537.2 772.0 17.1 1,765.2 95.9 415.8 323.9 40.0 91.8 0.9 Q2 4,768.0 1,835.0 94.8 3.5 1,740.2 41.6 2,561.6 762.2 17.7 1,799.4 93.4 371.3 278.1 45.7 93.2 0.4
Transactions
2008 5.0 -93.7 -34.3 0.7 -59.4 -0.1 72.1 37.7 3.2 34.4 2.7 26.5 49.6 13.1 -23.0 0.42009 94.0 53.4 -1.3 0.0 54.8 2.5 45.7 -93.2 -3.8 138.9 17.5 -5.2 1.0 -12.9 -6.2 0.92010 145.6 76.5 5.6 -0.2 70.9 1.7 109.3 -124.5 -0.8 233.8 52.8 -40.3 -55.5 -11.7 15.3 -1.9
2011 Q1 27.1 -1.0 0.0 -0.4 -1.0 -1.8 5.3 -12.7 1.7 18.0 0.4 22.8 16.8 1.5 6.1 0.7 Q2 33.5 17.0 3.2 0.1 13.9 -2.3 29.4 -4.4 0.4 33.9 -0.8 -13.0 -12.4 4.8 -0.6 -0.5 Q3 -82.6 -48.7 -10.0 -0.1 -38.6 . -49.9 -37.7 -1.4 -12.2 . 15.9 18.4 4.9 -2.5 .
2011 June -19.3 1.4 -4.3 0.0 5.7 . 4.4 -9.5 0.4 13.8 . -25.0 -9.6 3.0 -15.5 . July -5.6 1.6 1.3 0.0 0.3 . -4.8 -9.2 0.2 4.5 . -2.5 -6.7 -3.9 4.2 . Aug. -65.9 -38.9 -10.3 0.0 -28.5 . -24.9 -17.4 -1.4 -7.5 . -2.2 -2.8 8.3 0.7 . Sep. -11.1 -11.4 -1.0 0.0 -10.4 . -20.2 -11.1 -0.2 -9.1 . 20.6 27.9 0.6 -7.4 . Oct. -35.2 -6.4 -3.2 -0.1 -3.2 . -11.8 -6.7 0.6 -5.1 . -17.0 -22.4 -6.3 5.4 .
Growth rates
2009 2.4 3.9 -2.4 -0.6 4.3 8.5 1.9 -9.5 -19.0 10.7 93.4 -2.0 -0.8 -22.3 -7.9 67.22010 3.2 4.8 7.0 -5.2 4.7 4.8 4.4 -13.5 -4.9 14.9 127.8 -9.5 -16.0 -25.4 21.1 -91.9
2011 Q1 2.6 2.6 1.7 -16.4 2.6 -3.2 2.9 -14.0 2.5 12.4 131.9 0.8 -6.5 -10.2 34.8 65.6 Q2 3.1 3.4 4.8 -9.8 3.3 -14.1 3.7 -12.4 9.7 12.3 126.5 -0.8 -4.4 9.2 13.7 93.4 Q3 0.5 0.5 -4.0 -10.5 0.8 . -0.6 -17.0 1.5 8.0 . 7.9 4.2 3.7 24.7 .
4. Portfolio investment liabilities
Outstanding amounts (international investment position)
Total Equity Debt instruments
Bonds and notes Money market instruments
Total MFIs Non-MFIs Total MFIs Non-MFIs Total MFIs Non-MFIs
General Generalgovernment government
1 2 3 4 5 6 7 8 9 10 11 12
2009 6,781.9 2,781.9 686.2 2,095.7 3,493.1 1,093.2 2,399.9 1,481.2 506.9 66.2 440.7 409.32010 7,442.9 3,150.7 658.0 2,492.7 3,823.0 1,165.4 2,657.5 1,680.3 469.2 77.2 392.0 352.6
2011 Q1 7,469.7 3,206.3 651.6 2,554.8 3,760.6 1,113.4 2,647.2 1,698.3 502.8 109.0 393.7 360.0 Q2 7,681.2 3,127.4 636.2 2,491.3 4,010.3 1,169.6 2,840.7 1,827.9 543.4 140.1 403.3 354.9
Transactions
2008 266.4 -108.6 78.1 -186.7 175.5 -15.6 191.0 159.4 199.5 -25.0 224.6 191.02009 355.3 121.6 10.7 110.9 143.2 -15.6 158.8 103.7 90.5 -18.3 108.9 144.32010 293.6 128.9 -14.2 143.1 174.2 57.3 116.9 189.2 -9.5 28.9 -38.4 -34.8
2011 Q1 155.6 88.2 6.9 81.4 22.1 28.8 -6.8 31.7 45.4 35.4 10.0 20.8 Q2 189.1 -12.3 -5.3 -7.0 174.8 46.0 128.9 98.3 26.5 21.9 4.6 -1.3 Q3 -51.3 -16.6 5.2 -21.8 -38.7 12.7 -51.4 . 4.0 2.9 1.1 .
2011 June 74.4 1.8 -5.8 7.6 67.8 24.8 43.0 . 4.9 0.9 3.9 . July -26.7 8.6 -15.8 24.4 -30.7 2.3 -33.0 . -4.6 -4.0 -0.6 . Aug. -34.0 -19.7 19.4 -39.1 -5.6 5.9 -11.5 . -8.6 -1.0 -7.6 . Sep. 9.4 -5.5 1.6 -7.1 -2.3 4.5 -6.8 . 17.2 7.8 9.4 . Oct. -59.9 -6.6 2.1 -8.7 -40.2 -23.6 -16.6 . -13.2 -5.1 -8.0 .
Growth rates
2009 5.9 5.2 1.6 6.6 4.2 -1.3 7.2 7.4 23.0 -28.7 33.0 53.52010 4.2 4.5 -2.1 6.7 4.9 5.0 4.8 12.6 -1.9 42.9 -8.9 -8.7
2011 Q1 5.3 7.1 1.1 8.9 3.4 5.9 2.3 8.6 9.0 68.9 -1.5 0.9 Q2 6.4 6.1 1.5 7.5 5.5 10.1 3.5 7.5 16.7 151.2 -1.8 2.9 Q3 4.9 3.5 0.0 4.5 5.4 10.2 3.4 . 10.5 77.3 -2.1 .
Source: ECB.

EURO AREASTATISTICS
Externaltransactions
andpositions
7.3 Financial account (EUR billions and annual growth rates; outstanding amounts and growth rates at end of period; transactions during period)
S 67ECB
Monthly BulletinJanuary 2012
5. Other investment assets
Outstanding amounts (international investment position)
Total Eurosystem MFIs General Other sectors
(excluding Eurosystem) government
Total Loans/ Other Total Loans/ Other Trade Loans/currency Trade Loans/currencycurrency assets currency assets credits and deposits credits and deposits
and anddeposits deposits Currency Currency
and anddeposits deposits
1 2 3 4 5 6 7 8 9 10 11 12 13 14 15
2009 4,675.9 30.2 29.8 0.4 2,834.7 2,804.2 30.5 122.1 8.4 74.9 15.9 1,688.9 201.4 1,344.7 402.62010 5,002.9 32.6 32.0 0.7 2,972.3 2,939.9 32.4 166.3 7.6 117.6 21.0 1,831.8 214.4 1,468.5 428.6
2011 Q1 4,977.1 35.3 35.1 0.2 2,963.5 2,923.3 40.2 153.1 7.5 104.7 16.8 1,825.3 223.8 1,449.8 434.7 Q2 5,080.6 40.4 40.2 0.2 3,043.7 2,994.0 49.7 147.4 7.5 99.5 19.2 1,849.1 224.4 1,480.1 443.6
Transactions
2008 0.5 -9.5 -9.5 0.0 -42.6 -59.2 16.6 -5.7 -1.1 -5.9 -4.7 58.3 -1.1 48.0 -22.02009 -531.9 0.1 0.0 0.1 -420.5 -399.9 -20.5 10.7 -0.4 9.3 1.2 -122.2 7.5 -128.0 -34.62010 176.7 -2.9 -2.9 0.0 8.5 -0.4 8.9 40.0 -0.3 39.4 4.9 131.2 7.0 100.9 46.3
2011 Q1 86.9 3.6 3.6 0.0 63.3 55.2 8.1 -7.8 -0.1 -8.2 -4.2 27.8 11.2 -0.7 2.6 Q2 118.7 4.6 4.6 0.0 61.3 54.7 6.6 1.0 0.0 0.6 2.4 51.8 0.6 49.5 22.6 Q3 118.0 -2.9 . . 88.6 . . -6.3 . . -1.6 38.5 . . 15.1
2011 June -76.4 0.6 . . -87.4 . . 1.4 . . 2.7 9.1 . . 4.9 July -18.7 -0.1 . . -19.5 . . -5.4 . . -1.7 6.2 . . 4.3 Aug. 114.4 0.5 . . 103.8 . . -3.6 . . -3.0 13.8 . . 0.0 Sep. 22.3 -3.3 . . 4.4 . . 2.7 . . 3.1 18.5 . . 10.9 Oct. -40.8 -1.4 . . -73.2 . . 6.8 . . 7.6 26.9 . . 11.4
Growth rates
2009 -10.1 -0.4 -1.4 23.4 -12.8 -12.4 -36.9 9.8 -3.5 15.3 7.9 -6.7 3.8 -8.6 -8.12010 3.7 -13.1 -13.0 -9.9 0.4 0.1 27.8 31.9 -3.1 50.8 30.6 7.6 3.4 7.3 11.1
2011 Q1 3.4 26.3 27.3 -10.9 0.5 0.1 44.7 32.3 -3.3 53.5 36.0 5.9 10.7 4.8 10.0 Q2 4.9 65.6 67.1 -1.3 2.8 2.4 37.8 18.2 -3.2 27.6 3.6 6.6 6.7 6.3 14.9 Q3 7.1 45.1 . . 6.2 . . 16.4 . . 8.5 7.3 . . 14.2
6. Other investment liabilities
Outstanding amounts (international investment position)
Total Eurosystem MFIs General Other sectors
(excluding Eurosystem) government
Total Loans/ Other Total Loans/ Other Total Trade Loans Other Total Trade Loans Othercurrency liabilities currency liabilities credits liabilities credits liabilities
and anddeposits deposits
1 2 3 4 5 6 7 8 9 10 11 12 13 14 15
2009 4,985.4 251.7 251.3 0.4 3,399.7 3,360.7 39.0 85.2 0.0 80.8 4.4 1,248.8 177.8 929.3 141.72010 5,304.0 268.8 265.7 3.1 3,508.6 3,462.6 46.0 153.9 0.0 147.2 6.6 1,372.8 200.8 1,016.2 155.8
2011 Q1 5,168.1 272.3 271.8 0.5 3,365.9 3,310.5 55.4 174.1 0.0 168.6 5.4 1,355.8 207.5 984.5 163.8 Q2 5,144.9 277.7 274.9 2.8 3,326.5 3,270.6 55.9 186.2 0.0 180.9 5.3 1,354.5 207.2 990.5 156.8
Transactions
2008 179.4 280.9 280.9 0.0 -174.7 -186.0 11.3 9.5 0.0 10.9 -1.3 63.6 9.4 44.4 9.82009 -702.1 -233.2 -233.4 0.2 -352.7 -341.5 -11.2 17.8 0.0 17.8 0.0 -134.0 0.8 -126.1 -8.72010 115.5 8.9 6.3 2.6 -10.8 -16.8 6.0 64.6 0.0 63.8 0.8 52.8 15.5 13.5 23.8
2011 Q1 -2.2 9.6 12.1 -2.6 -62.9 -73.7 10.8 27.1 0.0 28.3 -1.2 24.0 6.3 -0.4 18.0 Q2 4.4 7.2 4.9 2.4 -17.9 -19.2 1.3 12.2 0.0 12.3 -0.1 2.8 -0.2 0.1 2.9 Q3 104.6 29.9 . . 7.3 . . 23.5 . . . 44.0 . . .
2011 June -172.1 1.3 . . -168.4 . . 3.2 . . . -8.2 . . . July 9.7 14.2 . . -24.3 . . 6.9 . . . 13.0 . . . Aug. 87.0 7.1 . . 53.0 . . -2.5 . . . 29.4 . . . Sep. 7.9 8.6 . . -21.4 . . 19.0 . . . 1.6 . . . Oct. -16.3 -7.4 . . -33.8 . . 2.8 . . . 22.1 . . .
Growth rates
2009 -12.2 -48.1 -48.2 . -9.3 -9.2 -19.8 25.7 . 27.4 -0.9 -9.4 0.3 -11.5 -5.82010 2.3 3.4 2.4 . -0.2 -0.4 15.8 74.2 . 78.3 11.7 4.0 8.6 1.2 15.8
2011 Q1 -0.4 9.4 9.6 . -4.9 -5.3 26.8 99.8 . 106.7 -2.7 3.5 14.2 -0.2 14.6 Q2 -0.3 12.6 11.8 . -5.2 -5.6 23.3 93.6 . 101.8 -18.8 4.0 8.6 0.8 19.5 Q3 0.7 25.9 . . -4.8 . . 102.6 . . . 2.6 . . .
Source: ECB.

7.3 Financial account (EUR billions and annual growth rates; outstanding amounts and growth rates at end of period; transactions during period)
S 68ECBMonthly BulletinJanuary 2012
7. Reserve assets 1)
Outstanding amounts (international investment position)
Reserve assets Memo
items
Total Monetary gold SDR Reserve Foreign exchange Other Other Pre- SDR
holdings position claims foreign determined allo-In In fine in the Total Currency and Securities Financial currency short-term cations
EUR troy IMF deposits derivatives assets netbillions ounces drains
(millions) With With Total Equity Bonds Money onmonetary banks and market foreign
authorities notes instruments currencyand the BIS
1 2 3 4 5 6 7 8 9 10 11 12 13 14 15 16 17
2007 347.2 201.0 353.688 4.6 3.6 138.0 7.2 22.0 108.5 0.4 87.8 20.3 0.3 0.0 44.3 -38.5 5.32008 374.2 217.0 349.207 4.7 7.3 145.1 7.6 8.1 129.5 0.6 111.3 17.6 0.0 0.0 262.8 -245.7 5.52009 462.4 266.1 347.180 50.8 10.5 134.9 11.7 8.1 115.2 0.5 92.0 22.7 -0.1 0.0 32.1 -24.2 51.2
2010 Q4 591.2 366.2 346.962 54.2 15.8 155.0 7.7 16.1 131.3 0.5 111.2 19.5 0.0 0.0 26.3 -24.4 54.52011 Q1 576.6 351.5 346.988 51.1 21.6 152.4 5.6 18.2 128.2 0.5 108.6 19.0 0.4 0.0 21.3 -24.5 52.6 Q2 580.8 361.4 346.989 50.4 22.4 146.5 5.1 13.0 128.2 0.5 108.3 19.3 0.2 0.0 20.4 -18.1 52.2
2011 Oct. 651.6 426.6 346.843 51.8 25.6 147.6 5.1 8.7 133.8 - - - 0.0 0.0 30.4 -22.7 53.4 Nov. 683.4 451.3 346.844 52.7 26.3 153.1 5.8 8.9 138.7 - - - -0.2 0.0 32.7 -21.8 54.5
Transactions
2008 3.4 -2.7 - -0.1 3.8 2.4 5.0 -15.7 11.8 0.1 15.8 -4.1 1.3 0.0 - - - 2009 -4.6 -2.0 - 0.5 3.4 -6.4 3.1 -1.2 -9.5 0.0 -14.1 4.6 1.2 0.0 - - - 2010 10.3 0.0 - -0.1 4.9 5.4 -5.4 6.7 4.1 0.0 10.6 -6.5 0.0 0.0 - - -
2011 Q1 11.6 0.0 - -1.2 6.7 6.1 -1.8 3.1 4.8 0.0 4.0 0.7 0.0 0.0 - - - Q2 -4.3 0.0 - -0.2 0.9 -5.1 -0.5 -5.4 0.9 0.0 0.4 0.5 -0.1 0.0 - - - Q3 -3.9 - - - - - - - - - - - - - - - -
Growth rates
2007 1.6 -1.7 - 7.3 -18.3 6.3 15.0 6.4 5.7 1.1 18.6 -27.6 - - - - - 2008 1.0 -1.3 - -2.5 105.5 1.7 67.8 -68.9 10.8 28.0 17.9 -20.6 - - - - - 2009 -1.2 -0.9 - -2.6 45.5 -4.4 41.1 -21.3 -7.3 1.0 -12.8 25.3 - - - - - 2010 2.0 0.0 - -0.1 46.4 3.6 -43.3 76.2 3.4 -5.2 10.3 -25.5 - - - - -
2011 Q1 2.9 0.0 - -1.9 77.7 5.3 -44.7 68.6 4.0 -4.3 12.0 -27.9 - - - - - Q2 2.4 0.0 - -2.4 49.8 4.6 -36.6 5.3 7.4 1.9 12.4 -15.3 - - - - - Q3 0.8 - - - - - - - - - - - - - - - -
8. Gross external debt
Outstanding amounts (international investment position)
Total By instrument By sector (excluding direct investment)
Loans, Money Bonds Trade Other debt Direct investment: General Eurosystem MFIs Othercurrency market and notes credits liabilities inter-company government (excluding sectors
and instruments lending Eurosystem)deposits
1 2 3 4 5 6 7 8 9 10 11
2007 9,991.0 5,144.6 240.5 2,996.3 172.6 189.6 1,247.3 1,235.4 202.1 5,228.6 2,077.62008 10,914.5 5,340.8 398.1 3,377.9 184.1 211.8 1,401.7 1,747.0 482.7 5,006.5 2,276.52009 10,391.3 4,622.0 506.9 3,493.1 177.8 185.6 1,405.9 1,975.7 251.7 4,559.1 2,198.9
2010 Q4 11,016.4 4,891.7 469.2 3,823.0 200.8 211.5 1,420.2 2,186.8 268.8 4,751.3 2,389.42011 Q1 10,855.2 4,735.4 502.8 3,760.6 207.6 225.1 1,423.7 2,232.3 272.3 4,588.4 2,338.5 Q2 11,126.4 4,716.9 543.4 4,010.3 207.3 220.8 1,427.7 2,369.0 277.7 4,636.2 2,415.7
Outstanding amounts as a percentage of GDP
2007 110.6 57.0 2.7 33.2 1.9 2.1 13.8 13.7 2.2 57.9 23.02008 118.2 57.8 4.3 36.6 2.0 2.3 15.2 18.9 5.2 54.2 24.62009 116.4 51.8 5.7 39.1 2.0 2.1 15.7 22.1 2.8 51.1 24.6
2010 Q4 120.4 53.4 5.1 41.8 2.2 2.3 15.5 23.9 2.9 51.9 26.12011 Q1 117.6 51.3 5.4 40.7 2.2 2.4 15.4 24.2 2.9 49.7 25.3 Q2 119.7 50.7 5.8 43.1 2.2 2.4 15.4 25.5 3.0 49.9 26.0
Source: ECB.1) Data refer to the changing composition of the euro area, in line with the approach adopted for the reserve assets of the Eurosystem. For further information, see the General Notes.

EURO AREASTATISTICS
Externaltransactions
andpositions
7.3 Financial account (EUR billions; outstanding amounts at end of period; transactions during period)
S 69ECB
Monthly BulletinJanuary 2012
9. Geographical breakdown
Total EU Member States outside the euro area Canada China Japan Switzer- United Offshore Interna- Otherland States financial tional countries
Total Denmark Sweden United Other EU EU centres organisa-Kingdom countries institutions tions
1 2 3 4 5 6 7 8 9 10 11 12 13 14 15
2010 Outstanding amounts (international investment position)
Direct investment 1,083.3 116.9 3.8 -6.6 -170.8 291.8 -1.3 50.4 57.1 -3.9 178.9 -23.2 42.7 -0.3 664.8 Abroad 4,798.2 1,490.8 36.2 141.7 994.2 318.7 0.0 154.7 61.5 87.2 479.5 899.7 586.7 0.0 1,037.9 Equity/reinvested earnings 3,667.1 1,114.0 32.2 88.8 733.5 259.4 0.0 121.4 49.5 65.8 374.0 637.1 501.8 0.0 803.6 Other capital 1,131.1 376.8 4.0 52.9 260.7 59.2 0.0 33.3 12.0 21.4 105.6 262.7 85.0 0.0 234.3 In the euro area 3,714.8 1,374.0 32.5 148.4 1,165.0 26.9 1.3 104.3 4.4 91.1 300.6 922.9 544.1 0.4 373.1 Equity/reinvested earnings 2,820.2 1,121.1 22.5 133.9 958.4 4.9 1.3 91.7 3.4 73.5 201.8 702.5 387.3 0.1 238.8 Other capital 894.6 252.9 10.0 14.4 206.6 21.9 0.0 12.6 1.0 17.6 98.8 220.4 156.7 0.2 134.3 Portfolio investment assets 4,907.5 1,550.5 84.0 189.3 1,054.9 103.5 118.9 110.8 59.5 203.6 134.6 1,557.4 460.8 30.8 799.6 Equity 1,914.2 379.4 13.7 46.0 300.5 18.1 1.1 44.6 57.2 106.3 117.5 574.9 243.0 1.4 390.1 Debt instruments 2,993.3 1,171.1 70.3 143.3 754.4 85.3 117.8 66.3 2.2 97.3 17.1 982.5 217.8 29.4 409.6 Bonds and notes 2,588.8 1,031.4 63.0 121.3 646.1 83.8 117.2 61.8 1.4 44.3 11.7 836.1 208.6 29.0 364.5 Money market instruments 404.5 139.7 7.3 21.9 108.3 1.6 0.6 4.5 0.8 53.0 5.5 146.4 9.2 0.4 45.1 Other investment -301.1 -241.1 54.8 1.5 -202.0 85.9 -181.2 -7.3 -8.0 19.9 -34.4 -94.6 -5.0 -25.2 94.7 Assets 5,002.9 2,295.1 112.6 96.9 1,869.7 198.5 17.4 28.5 38.7 103.7 275.2 713.1 588.7 48.8 911.2 General government 166.3 55.0 0.8 6.5 34.6 2.1 11.0 1.9 3.2 2.6 1.2 13.7 3.6 31.8 53.2 MFIs 3,004.9 1,576.0 90.7 52.9 1,268.2 160.9 3.3 15.6 12.1 72.6 136.3 375.8 367.6 16.5 432.4 Other sectors 1,831.8 664.0 21.1 37.5 566.9 35.5 3.1 11.0 23.4 28.5 137.7 323.6 217.4 0.6 425.5 Liabilities 5,304.0 2,536.1 57.9 95.4 2,071.7 112.6 198.6 35.8 46.7 83.8 309.6 807.8 593.6 74.0 816.5 General government 153.9 92.1 0.2 0.5 57.1 0.2 34.1 0.1 0.1 0.1 0.8 27.3 1.7 27.6 4.1 MFIs 3,777.4 1,855.6 45.5 63.8 1,555.6 84.5 106.1 27.6 22.1 50.4 233.4 491.5 475.5 43.4 577.9 Other sectors 1,372.8 588.4 12.2 31.1 458.9 27.9 58.3 8.2 24.6 33.2 75.4 289.0 116.5 3.0 234.5
2010 Q3 to 2011 Q2 Cumulated transactions
Direct investment 11.1 22.6 0.6 -8.6 15.7 14.9 0.0 -29.0 6.7 1.6 -24.9 -15.3 8.0 -0.1 41.5 Abroad 179.9 47.7 1.6 2.1 25.2 18.7 0.0 1.8 6.6 1.4 -3.2 21.3 26.8 0.0 77.4 Equity/reinvested earnings 127.3 38.3 1.7 3.5 14.6 18.5 0.0 1.9 3.7 2.1 -4.8 20.1 7.0 0.0 59.0 Other capital 52.6 9.4 0.0 -1.4 10.6 0.2 0.0 0.0 2.9 -0.6 1.6 1.3 19.7 0.0 18.4 In the euro area 168.9 25.1 1.0 10.7 9.5 3.8 0.0 30.9 -0.1 -0.1 21.7 36.6 18.8 0.1 36.0 Equity/reinvested earnings 142.2 34.2 -0.2 8.1 26.1 0.2 0.0 31.7 0.4 0.4 1.3 29.1 17.5 0.0 27.6 Other capital 26.6 -9.2 1.2 2.6 -16.5 3.6 0.0 -0.8 -0.5 -0.6 20.4 7.5 1.3 0.1 8.4 Portfolio investment assets 148.8 31.3 -2.8 16.8 -0.7 6.0 11.9 -2.5 12.1 3.3 1.3 48.9 -24.8 0.6 78.6 Equity 58.4 12.7 0.7 4.7 6.5 0.8 0.1 5.4 11.3 1.2 -3.3 20.2 -7.2 -0.4 18.5 Debt instruments 90.3 18.5 -3.5 12.1 -7.2 5.3 11.9 -8.0 0.8 2.1 4.7 28.7 -17.6 1.0 60.1 Bonds and notes 94.1 42.1 -1.9 12.4 14.7 4.9 12.0 -9.0 0.7 0.8 3.3 20.2 -19.8 1.2 54.5 Money market instruments -3.7 -23.5 -1.6 -0.3 -21.9 0.4 -0.1 1.0 0.0 1.2 1.4 8.6 2.2 -0.2 5.6 Other investment 253.4 148.4 1.3 8.7 168.8 2.4 -32.7 -1.0 1.8 4.2 44.0 -4.7 126.0 -43.7 -21.6 Assets 242.2 119.0 1.6 20.4 89.8 6.3 0.9 -0.2 9.3 15.0 13.9 20.6 49.4 -11.1 26.4 General government 24.1 9.7 0.8 0.9 6.8 1.4 -0.3 1.0 0.0 2.3 0.7 7.4 0.4 0.8 1.9 MFIs 98.6 30.9 -1.8 13.7 15.0 4.0 -0.1 -1.8 7.9 11.4 0.1 9.4 38.7 -11.9 14.1 Other sectors 119.5 78.5 2.6 5.8 68.0 0.9 1.3 0.6 1.4 1.3 13.1 3.8 10.3 0.1 10.5 Liabilities -11.2 -29.3 0.3 11.8 -79.0 3.9 33.7 0.8 7.4 10.8 -30.1 25.3 -76.6 32.6 48.0 General government 90.1 51.9 0.0 0.0 32.6 0.0 19.3 0.0 0.0 -0.2 -0.9 16.2 1.2 22.7 -0.7 MFIs -157.0 -110.9 0.4 5.2 -125.5 1.8 7.3 -2.0 4.6 12.0 -35.7 20.8 -79.4 9.9 23.6 Other sectors 55.7 29.7 0.0 6.5 13.9 2.1 7.1 2.7 2.9 -1.0 6.5 -11.8 1.6 0.0 25.1
Source: ECB.

7.4 Monetary presentation of the balance of payments 1) (EUR billions; transactions)
S 70ECBMonthly BulletinJanuary 2012
B.o.p. items mirroring net transactions by MFIs
Total Current Transactions by non-MFIs Financial Errors
and derivatives andcapital Direct investment Portfolio investment Other investment omissions
account balance By By non- Assets Liabilities Assets Liabilities
resident residentunits units in Equity Debt Equity Debt
abroad euro area instruments instruments1 2 3 4 5 6 7 8 9 10 11 12
2008 -116.9 -125.2 -327.9 112.0 59.2 -11.0 -186.9 416.4 -53.1 73.5 -84.4 10.62009 105.7 -19.1 -311.9 224.8 -54.8 -132.8 111.0 268.8 111.5 -115.9 21.1 3.02010 -216.3 -37.3 -161.3 125.2 -70.7 -249.1 143.2 77.8 -170.3 117.2 17.4 -8.4
2010 Q3 -59.5 -6.4 -49.0 -3.8 -3.8 -44.6 41.0 -43.9 -23.2 68.6 6.3 -0.6 Q4 -57.3 4.2 20.2 63.1 -37.6 -113.2 54.6 -7.4 -46.9 11.1 8.9 -14.42011 Q1 69.3 -27.8 -85.5 80.2 1.0 -24.0 81.4 3.2 -20.0 51.1 -2.2 12.1 Q2 2.1 -20.1 -53.2 30.8 -13.9 -33.2 -7.0 133.4 -52.8 15.0 3.4 -0.4 Q3 -7.3 -7.4 -25.0 15.9 38.6 14.7 -21.8 -50.2 -32.2 67.5 -3.9 -3.5
2010 Oct. -84.2 2.5 5.2 -16.2 -17.2 -87.7 44.7 7.3 -26.8 9.2 -0.2 -4.9 Nov. -7.0 -3.0 7.8 39.5 -9.4 -23.4 -15.1 30.4 -23.3 -2.9 3.1 -10.6 Dec. 33.8 4.7 7.1 39.9 -11.0 -2.0 25.1 -45.1 3.1 4.8 6.1 1.0
2011 Jan. -23.6 -19.6 -29.4 37.4 0.2 -12.3 10.3 -37.0 -21.4 43.2 -1.0 6.0 Feb. 3.2 -7.1 -25.6 0.5 -1.1 -12.2 43.8 10.6 0.8 -12.3 0.8 5.0 Mar. 89.7 -1.1 -30.4 42.2 1.9 0.5 27.2 29.6 0.6 20.2 -2.1 1.1 Apr. -31.3 -5.0 -47.1 22.3 -6.9 -15.7 -3.6 21.7 -9.0 2.4 2.9 6.8 May -2.4 -15.7 -6.2 0.5 -1.2 -19.1 -11.0 64.8 -33.3 17.7 -1.5 2.5 June 35.8 0.6 0.1 8.1 -5.7 1.6 7.6 46.9 -10.5 -5.0 1.9 -9.8 July -7.9 -1.6 -13.8 12.2 -0.3 -8.6 24.4 -33.7 -0.9 19.9 -4.6 -0.9 Aug. -12.7 -5.0 7.4 -6.6 28.5 6.8 -39.1 -19.1 -10.2 27.0 -0.7 -1.8 Sep. 13.4 -0.8 -18.6 10.3 10.4 16.5 -7.1 2.5 -21.2 20.7 1.4 -0.8 Oct. -37.9 3.2 -16.8 9.6 3.2 -0.3 -8.7 -24.6 -33.8 24.9 -0.4 5.8
12-month cumulated transactions
2011 Oct. 53.1 -50.4 -165.5 216.0 8.5 -68.3 53.8 47.1 -158.9 160.5 6.1 4.3
C38 Main b.o.p. items mirroring developments in MFI net external transactions 1)
(EUR billions; 12-month cumulated transactions)
-600
-400
-200
0
200
400
600
2007 2008 2009 2010 2011-600
-400
-200
0
200
400
600
total mirroring net external transactions by MFIscurrent and capital account balancedirect and portfolio equity investment abroad by non-MFIsportfolio investment liabilities of non-MFIs in the form of debt instruments
Source: ECB.1) Data refer to the changing composition of the euro area. For further information, see the General Notes.

EURO AREASTATISTICS
Externaltransactions
andpositions
7.5 Trade in goods
S 71ECB
Monthly BulletinJanuary 2012
1. Values and volumes by product group 1) (seasonally adjusted, unless otherwise indicated)
Values (EUR billions; annual percentage changes for columns 1 and 2)
Total (n.s.a.) Exports (f.o.b.) Imports (c.i.f.)
Total Memo item: Total Memo items:
Exports Imports Intermediate Capital Consumption Manufacturing Intermediate Capital Consumption Manufacturing Oil
1 2 3 4 5 6 7 8 9 10 11 12 13
2009 -18.0 -21.7 1,280.3 628.0 264.4 355.4 1,063.0 1,267.8 734.6 194.0 317.3 842.0 182.02010 20.0 22.5 1,533.0 765.2 311.4 420.0 1,269.3 1,547.6 946.3 229.9 348.3 1,018.4 247.4
2010 Q4 22.1 25.6 404.9 202.0 84.5 109.6 333.7 407.7 253.9 59.1 89.5 266.4 66.42011 Q1 21.4 23.6 427.1 214.4 86.1 116.1 350.2 434.3 274.7 59.8 91.7 277.5 74.3 Q2 13.0 12.3 429.1 215.6 86.7 116.2 350.7 434.4 278.6 58.6 89.7 274.9 77.1 Q3 9.4 9.0 435.9 218.4 86.8 118.5 358.0 437.8 279.7 58.6 91.4 275.2 80.1
2011 May 22.4 17.7 146.1 73.2 30.3 40.0 120.6 147.2 94.2 19.6 30.5 93.9 25.3 June 3.3 3.3 138.7 70.1 28.1 36.8 113.5 141.0 90.5 18.7 29.5 89.1 24.8 July 5.1 7.2 141.9 71.5 28.1 38.3 116.4 145.0 93.0 19.4 29.9 90.6 27.3 Aug. 13.8 11.8 147.8 73.7 29.7 40.3 122.1 148.8 94.8 20.2 31.1 94.8 26.4 Sep. 9.8 8.1 146.2 73.2 29.0 39.9 119.4 144.0 91.9 19.0 30.5 89.7 26.3 Oct. 5.7 7.4 143.3 . . . 116.1 143.0 . . . 88.1 .
Volume indices (2000 = 100; annual percentage changes for columns 1 and 2)
2009 -16.5 -13.6 119.6 114.9 119.0 128.1 115.9 109.8 101.1 115.7 136.7 111.1 101.82010 14.9 10.7 136.8 132.4 138.5 143.7 133.9 120.9 113.0 131.1 143.3 127.8 100.8
2010 Q4 15.2 10.4 142.8 137.5 150.1 148.4 139.7 123.7 116.5 134.3 145.1 132.1 102.92011 Q1 13.3 7.5 146.1 141.1 149.8 152.7 143.1 124.8 117.3 132.8 145.0 133.7 97.1 Q2 8.1 2.3 146.8 140.6 152.0 154.2 144.0 123.4 115.8 133.4 143.4 134.0 92.5 Q3 5.1 2.1 147.8 141.7 151.1 155.0 145.8 124.2 116.8 134.0 142.8 133.4 98.4
2011 Apr. 8.0 4.2 147.9 140.9 149.6 156.4 143.4 124.0 116.1 139.1 142.7 134.3 95.2 May 17.3 8.0 150.0 143.4 159.1 159.2 148.6 126.6 118.8 135.2 147.3 138.6 91.0 June 0.1 -4.8 142.4 137.5 147.1 147.0 139.9 119.5 112.6 126.0 140.2 129.3 91.3 July 1.4 1.0 144.5 139.3 147.1 150.6 142.3 124.0 117.1 133.6 140.9 132.2 100.7 Aug. 9.1 3.9 150.3 143.2 155.3 158.2 149.1 125.8 118.2 138.6 143.9 137.3 97.2 Sep. 5.4 1.5 148.5 142.7 151.1 156.3 146.0 122.7 115.3 129.8 143.5 130.7 97.2
2. Prices 2) (annual percentage changes, unless otherwise indicated)
Industrial producer export prices (f.o.b.) 3) Industrial import prices (c.i.f.)
Total Total Memo Total Total Memo
(index: item: (index: item:2005 = 100) Intermediate Capital Consumer Energy Manufac- 2005 = 100) Intermediate Capital Consumer Energy Manufac-
goods goods goods turing goods goods goods turing
% of total 100.0 100.0 33.1 44.5 17.9 4.5 99.2 100.0 100.0 28.4 27.9 22.1 21.6 81.1
1 2 3 4 5 6 7 8 9 10 11 12 13 14
2009 101.5 -2.7 -4.0 0.5 0.5 -23.7 -2.6 100.1 -8.7 -4.8 1.8 1.0 -28.3 -2.62010 105.4 3.8 4.8 1.4 2.2 26.3 3.8 109.8 9.8 9.7 1.4 2.9 27.5 5.8
2011 Q1 109.1 5.8 8.5 2.1 2.9 25.8 5.8 118.3 12.0 11.0 0.8 5.7 29.5 7.0 Q2 110.0 4.1 6.0 0.8 1.8 22.0 4.0 119.0 7.8 4.6 -2.5 3.3 25.6 2.8 Q3 110.4 4.0 5.0 0.9 1.8 25.5 3.9 119.2 7.5 3.0 -3.1 2.9 26.8 2.2
2011 June 110.0 3.4 5.1 0.6 1.2 18.8 3.3 118.2 6.2 3.1 -3.6 2.3 22.8 1.5 July 110.4 4.0 5.3 0.8 1.7 25.9 3.9 119.2 7.7 4.0 -3.6 3.0 27.2 2.2 Aug. 110.3 3.8 4.8 0.8 1.8 23.4 3.7 118.7 6.8 2.6 -3.0 2.6 24.3 2.0 Sep. 110.6 4.0 4.8 1.1 1.9 27.2 4.0 119.8 8.0 2.5 -2.7 3.3 29.1 2.3 Oct. 110.5 4.1 4.4 1.8 2.4 24.4 4.0 119.8 8.3 1.6 -1.1 4.0 28.6 2.8 Nov. 110.6 3.9 3.8 1.8 2.4 22.3 3.8 120.2 7.6 0.9 -1.1 3.3 26.8 2.2
Source: Eurostat.1) Product groups as classified in the Broad Economic Categories. Unlike the product groups shown in Table 2, intermediate and consumption product groups include
agricultural and energy products.2) Product groups as classified in the Main Industrial Groupings. Unlike the product groups shown in Table 1, intermediate and consumer goods do not include
energy products, and agricultural goods are not covered. Manufacturing has a different composition compared with the data shown in columns 7 and 12 of Table 1. Data shownare price indices which follow the pure price change for a basket of products and are not simple ratios of the value and volume data shown in Table 1, which are affectedby changes in the composition and quality of traded goods. These indices differ from the GDP deflators for imports and exports (shown in Table 3 in Section 5.1), mainlybecause those deflators include all goods and services and cover cross-border trade within the euro area.
3) Industrial producer export prices refer to direct transactions between domestic producers and non-domestic customers. Contrary to the data shown for values and volumes in Table 1, exports from wholesalers and re-exports are not covered.
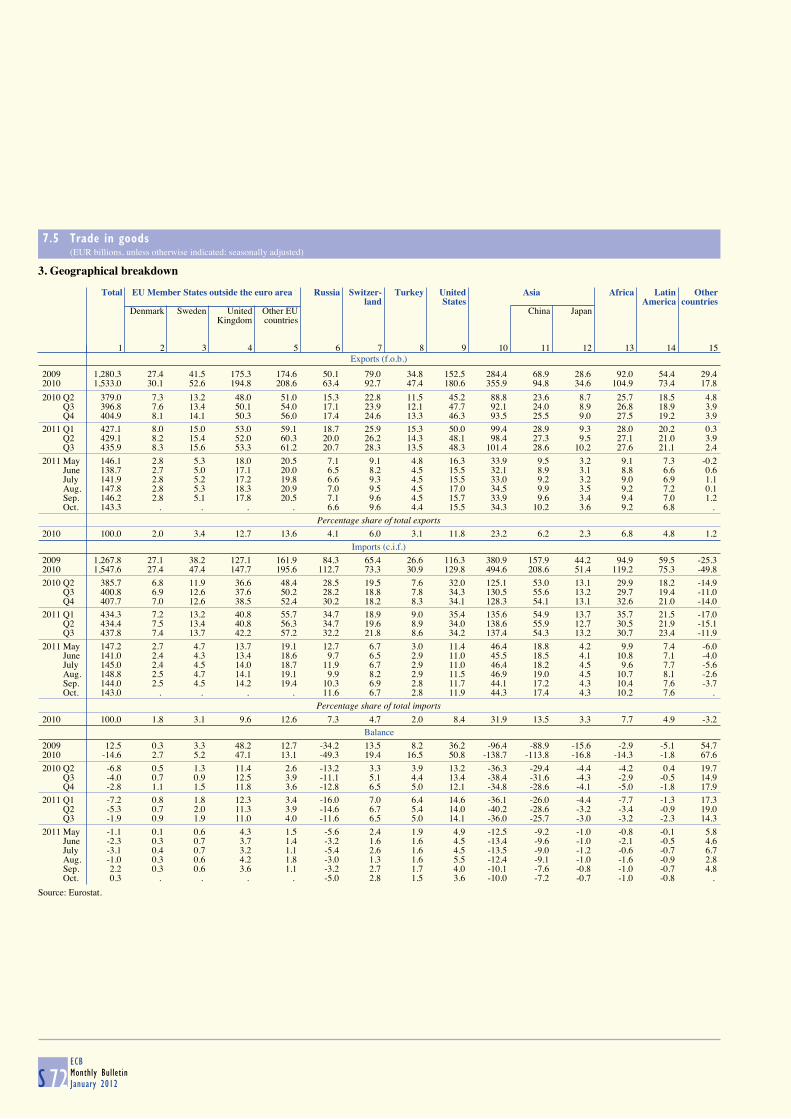
7.5 Trade in goods (EUR billions, unless otherwise indicated; seasonally adjusted)
S 72ECBMonthly BulletinJanuary 2012
3. Geographical breakdown
Exports (f.o.b.)
Total EU Member States outside the euro area Russia Switzer- Turkey United Asia Africa Latin Other
land States America countriesDenmark Sweden United Other EU China Japan
Kingdom countries
1 2 3 4 5 6 7 8 9 10 11 12 13 14 15
2009 1,280.3 27.4 41.5 175.3 174.6 50.1 79.0 34.8 152.5 284.4 68.9 28.6 92.0 54.4 29.42010 1,533.0 30.1 52.6 194.8 208.6 63.4 92.7 47.4 180.6 355.9 94.8 34.6 104.9 73.4 17.8
2010 Q2 379.0 7.3 13.2 48.0 51.0 15.3 22.8 11.5 45.2 88.8 23.6 8.7 25.7 18.5 4.8 Q3 396.8 7.6 13.4 50.1 54.0 17.1 23.9 12.1 47.7 92.1 24.0 8.9 26.8 18.9 3.9 Q4 404.9 8.1 14.1 50.3 56.0 17.4 24.6 13.3 46.3 93.5 25.5 9.0 27.5 19.2 3.9
2011 Q1 427.1 8.0 15.0 53.0 59.1 18.7 25.9 15.3 50.0 99.4 28.9 9.3 28.0 20.2 0.3 Q2 429.1 8.2 15.4 52.0 60.3 20.0 26.2 14.3 48.1 98.4 27.3 9.5 27.1 21.0 3.9 Q3 435.9 8.3 15.6 53.3 61.2 20.7 28.3 13.5 48.3 101.4 28.6 10.2 27.6 21.1 2.4
2011 May 146.1 2.8 5.3 18.0 20.5 7.1 9.1 4.8 16.3 33.9 9.5 3.2 9.1 7.3 -0.2 June 138.7 2.7 5.0 17.1 20.0 6.5 8.2 4.5 15.5 32.1 8.9 3.1 8.8 6.6 0.6 July 141.9 2.8 5.2 17.2 19.8 6.6 9.3 4.5 15.5 33.0 9.2 3.2 9.0 6.9 1.1 Aug. 147.8 2.8 5.3 18.3 20.9 7.0 9.5 4.5 17.0 34.5 9.9 3.5 9.2 7.2 0.1 Sep. 146.2 2.8 5.1 17.8 20.5 7.1 9.6 4.5 15.7 33.9 9.6 3.4 9.4 7.0 1.2 Oct. 143.3 . . . . 6.6 9.6 4.4 15.5 34.3 10.2 3.6 9.2 6.8 .
Percentage share of total exports
2010 100.0 2.0 3.4 12.7 13.6 4.1 6.0 3.1 11.8 23.2 6.2 2.3 6.8 4.8 1.2
Imports (c.i.f.)
2009 1,267.8 27.1 38.2 127.1 161.9 84.3 65.4 26.6 116.3 380.9 157.9 44.2 94.9 59.5 -25.32010 1,547.6 27.4 47.4 147.7 195.6 112.7 73.3 30.9 129.8 494.6 208.6 51.4 119.2 75.3 -49.8
2010 Q2 385.7 6.8 11.9 36.6 48.4 28.5 19.5 7.6 32.0 125.1 53.0 13.1 29.9 18.2 -14.9 Q3 400.8 6.9 12.6 37.6 50.2 28.2 18.8 7.8 34.3 130.5 55.6 13.2 29.7 19.4 -11.0 Q4 407.7 7.0 12.6 38.5 52.4 30.2 18.2 8.3 34.1 128.3 54.1 13.1 32.6 21.0 -14.0
2011 Q1 434.3 7.2 13.2 40.8 55.7 34.7 18.9 9.0 35.4 135.6 54.9 13.7 35.7 21.5 -17.0 Q2 434.4 7.5 13.4 40.8 56.3 34.7 19.6 8.9 34.0 138.6 55.9 12.7 30.5 21.9 -15.1 Q3 437.8 7.4 13.7 42.2 57.2 32.2 21.8 8.6 34.2 137.4 54.3 13.2 30.7 23.4 -11.9
2011 May 147.2 2.7 4.7 13.7 19.1 12.7 6.7 3.0 11.4 46.4 18.8 4.2 9.9 7.4 -6.0 June 141.0 2.4 4.3 13.4 18.6 9.7 6.5 2.9 11.0 45.5 18.5 4.1 10.8 7.1 -4.0 July 145.0 2.4 4.5 14.0 18.7 11.9 6.7 2.9 11.0 46.4 18.2 4.5 9.6 7.7 -5.6 Aug. 148.8 2.5 4.7 14.1 19.1 9.9 8.2 2.9 11.5 46.9 19.0 4.5 10.7 8.1 -2.6 Sep. 144.0 2.5 4.5 14.2 19.4 10.3 6.9 2.8 11.7 44.1 17.2 4.3 10.4 7.6 -3.7 Oct. 143.0 . . . . 11.6 6.7 2.8 11.9 44.3 17.4 4.3 10.2 7.6 .
Percentage share of total imports
2010 100.0 1.8 3.1 9.6 12.6 7.3 4.7 2.0 8.4 31.9 13.5 3.3 7.7 4.9 -3.2
Balance
2009 12.5 0.3 3.3 48.2 12.7 -34.2 13.5 8.2 36.2 -96.4 -88.9 -15.6 -2.9 -5.1 54.72010 -14.6 2.7 5.2 47.1 13.1 -49.3 19.4 16.5 50.8 -138.7 -113.8 -16.8 -14.3 -1.8 67.6
2010 Q2 -6.8 0.5 1.3 11.4 2.6 -13.2 3.3 3.9 13.2 -36.3 -29.4 -4.4 -4.2 0.4 19.7 Q3 -4.0 0.7 0.9 12.5 3.9 -11.1 5.1 4.4 13.4 -38.4 -31.6 -4.3 -2.9 -0.5 14.9 Q4 -2.8 1.1 1.5 11.8 3.6 -12.8 6.5 5.0 12.1 -34.8 -28.6 -4.1 -5.0 -1.8 17.9
2011 Q1 -7.2 0.8 1.8 12.3 3.4 -16.0 7.0 6.4 14.6 -36.1 -26.0 -4.4 -7.7 -1.3 17.3 Q2 -5.3 0.7 2.0 11.3 3.9 -14.6 6.7 5.4 14.0 -40.2 -28.6 -3.2 -3.4 -0.9 19.0 Q3 -1.9 0.9 1.9 11.0 4.0 -11.6 6.5 5.0 14.1 -36.0 -25.7 -3.0 -3.2 -2.3 14.3
2011 May -1.1 0.1 0.6 4.3 1.5 -5.6 2.4 1.9 4.9 -12.5 -9.2 -1.0 -0.8 -0.1 5.8 June -2.3 0.3 0.7 3.7 1.4 -3.2 1.6 1.6 4.5 -13.4 -9.6 -1.0 -2.1 -0.5 4.6 July -3.1 0.4 0.7 3.2 1.1 -5.4 2.6 1.6 4.5 -13.5 -9.0 -1.2 -0.6 -0.7 6.7 Aug. -1.0 0.3 0.6 4.2 1.8 -3.0 1.3 1.6 5.5 -12.4 -9.1 -1.0 -1.6 -0.9 2.8 Sep. 2.2 0.3 0.6 3.6 1.1 -3.2 2.7 1.7 4.0 -10.1 -7.6 -0.8 -1.0 -0.7 4.8 Oct. 0.3 . . . . -5.0 2.8 1.5 3.6 -10.0 -7.2 -0.7 -1.0 -0.8 .
Source: Eurostat.

8EXCHANGE RATES
8.1 Effective exchange rates 1) (period averages; index: 1999 Q1=100)
S 73ECB
Monthly BulletinJanuary 2012
EER-20 EER-40
Nominal Real Real Real Real Real Nominal RealCPI PPI GDP ULCM ULCT CPI
deflator
1 2 3 4 5 6 7 8
2009 111.7 110.6 104.9 106.5 120.0 106.5 120.6 108.02010 104.6 103.0 98.8 98.4 109.3 98.9 112.3 99.32011 104.4 102.2 98.4 . . . 112.9 98.9
2010 Q4 104.4 102.4 98.7 97.6 108.6 98.7 112.1 98.72011 Q1 103.7 101.5 98.0 96.6 107.1 97.3 111.6 97.9 Q2 106.4 104.2 100.2 99.0 110.5 99.9 114.5 100.5 Q3 104.6 102.1 98.5 97.2 109.2 97.9 113.3 99.0 Q4 103.1 100.9 97.0 . . . 112.3 98.2
2010 Dec. 102.6 100.6 96.9 - - - 110.1 96.8
2011 Jan. 102.4 100.4 96.9 - - - 110.1 96.7 Feb. 103.4 101.1 97.8 - - - 111.4 97.6 Mar. 105.2 103.1 99.4 - - - 113.2 99.4 Apr. 107.0 104.9 100.9 - - - 115.0 101.0 May 106.0 103.8 99.7 - - - 114.1 100.1 June 106.1 104.0 99.9 - - - 114.4 100.3 July 105.2 102.6 99.0 - - - 113.4 99.1 Aug. 104.9 102.3 98.8 - - - 113.8 99.3 Sep. 103.8 101.4 97.6 - - - 112.8 98.7 Oct. 104.0 101.7 97.8 - - - 113.3 99.1 Nov. 103.5 101.4 97.4 - - - 112.8 98.6 Dec. 101.7 99.6 95.7 - - - 110.9 96.9
Percentage change versus previous month
2011 Dec. -1.8 -1.8 -1.8 - - - -1.6 -1.7Percentage change versus previous year
2011 Dec. -0.9 -1.0 -1.3 - - - 0.8 0.1
C39 Effective exchange rates
(monthly averages; index: 1999 Q1=100)
C40 Bilateral exchange rates
(monthly averages; index: 1999 Q1=100)
70
80
90
100
110
120
130
140
150
2000 2002 2004 2006 2008 201070
80
90
100
110
120
130
140
150
nominal EER-20real CPI-deflated EER-20
70
80
90
100
110
120
130
140
150
2000 2002 2004 2006 2008 201070
80
90
100
110
120
130
140
150
USD/EURJPY/EURGBP/EUR
Source: ECB.1) For a definition of the trading partner groups and other information, please refer to the General Notes.

8.2 Bilateral exchange rates (period averages; units of national currency per euro)
S 74ECBMonthly BulletinJanuary 2012
Bulgarian Czech Danish Latvian Lithuanian Hungarian Polish New Roma- Swedish Pound Croatian New Turkishlev koruna krone lats litas forint zloty nian leu krona sterling kuna lira
1 2 3 4 5 6 7 8 9 10 11 12
2009 1.9558 26.435 7.4462 0.7057 3.4528 280.33 4.3276 4.2399 10.6191 0.89094 7.3400 2.16312010 1.9558 25.284 7.4473 0.7087 3.4528 275.48 3.9947 4.2122 9.5373 0.85784 7.2891 1.99652011 1.9558 24.590 7.4506 0.7063 3.4528 279.37 4.1206 4.2391 9.0298 0.86788 7.4390 2.3378
2011 Q2 1.9558 24.324 7.4573 0.7092 3.4528 266.42 3.9596 4.1378 9.0153 0.88274 7.3932 2.2579 Q3 1.9558 24.387 7.4506 0.7093 3.4528 275.10 4.1527 4.2587 9.1451 0.87760 7.4629 2.4535 Q4 1.9558 25.276 7.4398 0.7017 3.4528 303.47 4.4207 4.3365 9.0910 0.85727 7.4968 2.4759
2011 June 1.9558 24.286 7.4579 0.7091 3.4528 266.87 3.9702 4.1937 9.1125 0.88745 7.4065 2.3077 July 1.9558 24.335 7.4560 0.7092 3.4528 267.68 3.9951 4.2413 9.1340 0.88476 7.4316 2.3654 Aug. 1.9558 24.273 7.4498 0.7093 3.4528 272.37 4.1195 4.2505 9.1655 0.87668 7.4620 2.5147 Sep. 1.9558 24.556 7.4462 0.7093 3.4528 285.05 4.3379 4.2838 9.1343 0.87172 7.4936 2.4736 Oct. 1.9558 24.841 7.4442 0.7061 3.4528 296.79 4.3516 4.3244 9.1138 0.87036 7.4849 2.5089 Nov. 1.9558 25.464 7.4412 0.7015 3.4528 309.15 4.4324 4.3560 9.1387 0.85740 7.4923 2.4565 Dec. 1.9558 25.514 7.4341 0.6975 3.4528 304.19 4.4774 4.3282 9.0184 0.84405 7.5136 2.4632
Percentage change versus previous month
2011 Dec. 0.0 0.2 -0.1 -0.6 0.0 -1.6 1.0 -0.6 -1.3 -1.6 0.3 0.3
Percentage change versus previous year
2011 Dec. 0.0 1.4 -0.3 -1.7 0.0 9.6 12.0 0.8 -0.4 -0.5 1.7 22.2
Australian Brazilian Canadian Chinese Hong Kong Icelandic Indian Indonesian Israeli Japanese Malaysiandollar real dollar yuan renminbi dollar krona 1) rupee 2) rupiah shekel yen ringgit
13 14 15 16 17 18 19 20 21 22 23
2009 1.7727 2.7674 1.5850 9.5277 10.8114 - 67.3611 14,443.74 5.4668 130.34 4.90792010 1.4423 2.3314 1.3651 8.9712 10.2994 - 60.5878 12,041.70 4.9457 116.24 4.26682011 1.3484 2.3265 1.3761 8.9960 10.8362 - 64.8859 12,206.51 4.9775 110.96 4.2558
2011 Q2 1.3550 2.2960 1.3932 9.3509 11.1932 - 64.3809 12,364.41 4.9490 117.41 4.3451 Q3 1.3459 2.3063 1.3841 9.0653 11.0105 - 64.7000 12,181.09 5.0174 109.77 4.2666 Q4 1.3316 2.4240 1.3788 8.5682 10.4879 - 68.5352 12,111.94 5.0172 104.22 4.2458
2011 June 1.3567 2.2850 1.4063 9.3161 11.2021 - 64.5200 12,327.02 4.9169 115.75 4.3585 July 1.3249 2.2329 1.3638 9.2121 11.1104 - 63.3537 12,171.27 4.8801 113.26 4.2716 Aug. 1.3651 2.2888 1.4071 9.1857 11.1846 - 65.0717 12,249.95 5.0841 110.43 4.2822 Sep. 1.3458 2.3946 1.3794 8.7994 10.7333 - 65.5964 12,118.49 5.0788 105.75 4.2456 Oct. 1.3525 2.4336 1.3981 8.7308 10.6616 - 67.5519 12,150.54 5.0253 105.06 4.2963 Nov. 1.3414 2.4210 1.3897 8.6154 10.5495 - 68.8330 12,214.99 5.0521 105.02 4.2756 Dec. 1.3003 2.4175 1.3481 8.3563 10.2496 - 69.2066 11,965.40 4.9725 102.55 4.1639
Percentage change versus previous month
2011 Dec. -3.1 -0.1 -3.0 -3.0 -2.8 - 0.5 -2.0 -1.6 -2.4 -2.6
Percentage change versus previous year
2011 Dec. -2.3 8.0 1.2 -4.9 -0.3 - 16.0 0.3 4.4 -6.9 0.8
Mexican New Zealand Norwegian Philippine Russian Singapore South African South Korean Swiss Thai USpeso dollar krone peso rouble dollar rand won franc baht dollar
24 25 26 27 28 29 30 31 32 33 34
2009 18.7989 2.2121 8.7278 66.338 44.1376 2.0241 11.6737 1,772.90 1.5100 47.804 1.39482010 16.7373 1.8377 8.0043 59.739 40.2629 1.8055 9.6984 1,531.82 1.3803 42.014 1.32572011 17.2877 1.7600 7.7934 60.260 40.8846 1.7489 10.0970 1,541.23 1.2326 42.429 1.3920
2011 Q2 16.8752 1.7992 7.8259 62.256 40.2750 1.7842 9.7852 1,559.23 1.2514 43.592 1.4391 Q3 17.3908 1.6976 7.7652 60.371 41.1734 1.7309 10.0898 1,532.60 1.1649 42.574 1.4127 Q4 18.3742 1.7353 7.7602 58.566 42.0737 1.7348 10.9209 1,542.87 1.2293 41.791 1.3482
2011 June 16.9931 1.7666 7.8302 62.468 40.2670 1.7763 9.7807 1,555.32 1.2092 43.923 1.4388 July 16.6491 1.6877 7.7829 60.961 39.8343 1.7359 9.7000 1,510.29 1.1766 42.949 1.4264 Aug. 17.5456 1.7108 7.7882 60.836 41.2954 1.7340 10.1532 1,542.01 1.1203 42.875 1.4343 Sep. 17.9370 1.6932 7.7243 59.322 42.3239 1.7229 10.3956 1,544.04 1.2005 41.902 1.3770 Oct. 18.4315 1.7361 7.7474 59.412 42.8569 1.7493 10.9188 1,578.17 1.2295 42.297 1.3706 Nov. 18.5646 1.7584 7.7868 58.743 41.8082 1.7476 11.0547 1,537.42 1.2307 41.969 1.3556 Dec. 18.1174 1.7102 7.7451 57.537 41.5686 1.7070 10.7829 1,513.26 1.2276 41.099 1.3179
Percentage change versus previous month
2011 Dec. -2.4 -2.7 -0.5 -2.1 -0.6 -2.3 -2.5 -1.6 -0.3 -2.1 -2.8
Percentage change versus previous year
2011 Dec. 10.6 -2.8 -2.0 -0.9 2.0 -1.1 19.6 0.0 -4.2 3.3 -0.3
Source: ECB.1) The most recent rate for the Icelandic krona refers to 3 December 2008.2) For this currency the ECB computes and publishes euro reference exchange rates as from 1 January 2009. Previous data are indicative.

9DEVELOPMENTS OUTSIDE THE EURO AREA
9.1 Economic and financial developments in other EU Member States (annual percentage changes, unless otherwise indicated)
S 75ECB
Monthly BulletinJanuary 2012
HICP
Bulgaria Czech Denmark Latvia Lithuania Hungary Poland Romania Sweden UnitedRepublic Kingdom
1 2 3 4 5 6 7 8 9 10
2010 3.0 1.2 2.2 -1.2 1.2 4.7 2.7 6.1 1.9 3.32011 . 2.1 2.7 . 4.1 . . . . .
2011 Q3 3.1 2.0 2.6 4.4 4.6 3.4 3.7 4.2 1.6 4.7 Q4 . 2.8 2.5 . 4.0 . . . . .
2011 Oct. 3.0 2.6 2.7 4.3 4.2 3.8 3.8 3.6 1.1 5.0 Nov. 2.6 2.9 2.5 4.0 4.4 4.3 4.4 3.5 1.1 4.8 Dec. . 2.8 2.4 . 3.5 . . . . .
General government deficit (-)/surplus (+) as a percentage of GDP
2008 1.7 -2.2 3.2 -4.2 -3.3 -3.7 -3.7 -5.7 2.2 -5.02009 -4.3 -5.8 -2.7 -9.7 -9.5 -4.6 -7.3 -9.0 -0.7 -11.52010 -3.1 -4.8 -2.6 -8.3 -7.0 -4.2 -7.8 -6.9 0.2 -10.3
General government gross debt as a percentage of GDP
2008 13.7 28.7 34.5 19.8 15.5 72.9 47.1 13.4 38.8 54.82009 14.6 34.4 41.8 36.7 29.4 79.7 50.9 23.6 42.7 69.62010 16.3 37.6 43.7 44.7 38.0 81.3 54.9 31.0 39.7 79.9
Long-term government bond yield as a percentage per annum; period average
2011 July 5.36 3.79 3.02 5.67 5.05 7.35 5.81 7.30 2.75 2.88 Aug. 5.32 3.40 2.49 5.60 5.05 7.49 5.70 7.38 2.17 2.37 Sep. 5.30 3.00 2.07 5.60 5.09 7.64 5.74 7.43 1.83 2.41 Oct. 5.27 3.14 2.23 5.62 5.06 7.88 5.71 7.48 1.90 2.52 Nov. 5.27 3.67 2.01 5.73 5.25 8.53 5.80 7.43 1.69 2.29 Dec. 5.23 3.70 1.86 5.93 5.75 8.97 5.84 7.21 1.68 2.12
3-month interest rate as a percentage per annum; period average
2011 July 3.75 1.19 1.66 0.82 1.81 6.74 4.70 5.11 2.56 0.83 Aug. 3.74 1.19 1.60 0.83 1.86 7.12 4.72 5.60 2.58 0.86 Sep. 3.67 1.17 1.44 0.87 1.85 6.19 4.75 5.77 2.53 0.92 Oct. 3.68 1.17 1.40 0.99 1.88 6.18 4.80 5.96 2.52 0.97 Nov. 3.64 1.15 1.29 1.27 1.87 7.25 4.94 6.01 2.62 1.01 Dec. 3.64 1.16 1.08 1.86 1.78 6.50 4.98 6.05 2.69 1.06
Real GDP
2009 -5.5 -4.7 -5.8 -17.7 -14.8 -6.8 1.6 -7.1 -5.2 -4.42010 0.2 2.7 1.3 -0.3 1.4 1.3 3.9 -1.3 5.6 2.1
2011 Q1 3.3 2.8 2.2 3.1 5.4 1.9 4.5 1.3 5.8 1.7 Q2 2.0 2.0 1.7 5.3 6.5 1.7 4.6 1.9 4.8 0.6 Q3 1.6 1.2 0.0 6.1 7.3 1.5 4.2 4.4 4.6 0.5
Current and capital account balance as a percentage of GDP
2009 -7.6 -1.0 3.3 11.1 7.8 1.0 -2.2 -3.6 6.9 -1.52010 -0.5 -2.3 5.6 4.9 4.2 2.9 -2.8 -3.7 6.5 -3.1
2011 Q1 2.0 2.5 5.8 1.2 1.8 3.0 -1.7 -2.6 8.0 -1.8 Q2 1.3 -6.1 7.2 1.3 -1.7 3.3 -2.1 -6.8 6.7 -1.4 Q3 12.1 -4.1 8.5 2.4 6.1 4.2 -3.6 -3.3 9.3 -4.4
Gross external debt as a percentage of GDP
2009 108.3 51.6 188.5 156.5 87.0 144.7 59.4 69.0 210.8 416.92010 102.8 55.8 190.7 165.4 87.4 143.4 66.0 77.2 190.4 413.9
2011 Q1 98.5 55.2 185.4 158.1 85.5 137.3 68.3 74.6 188.5 416.6 Q2 96.6 55.4 181.5 154.7 85.8 137.0 68.7 78.1 190.0 418.2 Q3 93.7 57.5 182.7 151.4 82.9 146.3 72.4 77.8 197.8 435.6
Unit labour costs
2009 12.7 2.4 5.7 -7.9 -1.4 2.9 2.2 3.8 4.6 5.72010 0.8 -0.7 -1.0 -10.2 -7.3 -3.2 4.7 -4.0 -1.7 1.7
2011 Q1 1.7 -0.2 -0.5 2.6 -3.0 3.0 2.6 -1.3 -2.4 -0.7 Q2 5.3 0.6 -1.0 2.3 -0.7 . 0.6 9.4 -0.7 0.8 Q3 7.8 0.4 0.4 1.9 -2.2 . . 9.3 -1.0 2.1
Standardised unemployment rate as a percentage of labour force (s.a.)
2009 6.9 6.7 6.0 17.1 13.7 10.0 8.2 6.9 8.3 7.62010 10.2 7.3 7.4 18.6 17.8 11.1 9.6 7.3 8.4 7.8
2011 Q2 11.2 6.9 7.5 16.1 15.6 10.9 9.6 7.4 7.5 7.9 Q3 11.0 6.6 7.5 14.8 15.3 10.9 9.7 7.5 7.3 8.3
2011 Sep. 10.9 6.5 7.6 14.8 15.3 10.8 9.8 7.7 7.3 8.3 Oct. 10.8 6.6 7.7 . . 10.8 9.9 7.3 7.5 . Nov. 10.9 6.7 7.8 . . 10.7 10.0 7.3 7.4 .
Sources: ECB, European Commission (Economic and Financial Affairs DG and Eurostat), national data, Thomson Reuters and ECB calculations.

9.2 Economic and financial developments in the United States and Japan (annual percentage changes, unless otherwise indicated)
S 76ECBMonthly BulletinJanuary 2012
United States
Consumer Unit labour Real GDP Industrial Unemployment Broad 3-month 10-year Exchange Fiscal Grossprice index costs 1) production rate money 3) interbank zero coupon rate 5) deficit (-)/ public
index as a % of deposit government as national surplus (+) debt 6)
(manufacturing) labour force 2) rate 4) bond yield; 4) currency as a % of as a % of(s.a.) end of per euro GDP GDP
period
1 2 3 4 5 6 7 8 9 10 11
2008 3.8 2.8 -0.3 -4.7 5.8 7.1 2.93 2.70 1.4708 -6.6 57.02009 -0.4 -0.6 -3.5 -13.5 9.3 7.9 0.69 4.17 1.3948 -11.6 69.42010 1.6 -2.0 3.0 5.9 9.6 2.3 0.34 3.57 1.3257 -10.7 78.22011 . . . . 9.0 . 0.34 2.10 1.3920 . .
2010 Q4 1.3 -0.9 3.1 6.6 9.6 3.2 0.29 3.57 1.3583 -10.5 78.22011 Q1 2.1 1.3 2.2 6.6 9.0 4.5 0.31 3.76 1.3680 -9.9 79.1 Q2 3.4 1.0 1.6 4.4 9.0 5.4 0.26 3.46 1.4391 -10.2 79.0 Q3 3.8 0.4 1.5 4.2 9.1 9.4 0.30 2.18 1.4127 . . Q4 . . . . 8.7 . 0.48 2.10 1.3482 . .
2011 Aug. 3.8 - - 4.2 9.1 10.2 0.29 2.51 1.4343 - - Sep. 3.9 - - 4.4 9.0 10.1 0.35 2.18 1.3770 - - Oct. 3.5 - - 4.6 8.9 9.9 0.41 2.37 1.3706 - - Nov. 3.4 - - 4.2 8.7 9.8 0.48 2.30 1.3556 - - Dec. . - - . 8.5 . 0.56 2.10 1.3179 - -
Japan
2008 1.4 1.2 -1.2 -3.4 4.0 2.1 0.93 1.21 152.45 -2.2 162.02009 -1.3 2.8 -6.3 -21.9 5.1 2.7 0.47 1.42 130.34 -8.7 180.42010 -0.7 -2.6 4.1 16.6 5.1 2.8 0.23 1.18 116.24 . . 2011 . . . . . . 0.19 1.00 110.96 . .
2010 Q4 -0.3 -1.3 2.5 6.0 5.0 2.5 0.19 1.18 112.10 . . 2011 Q1 -0.5 1.2 -0.6 -2.6 4.7 2.5 0.19 1.33 112.57 . . Q2 -0.4 1.2 -1.0 -6.9 4.6 2.8 0.20 1.18 117.41 . . Q3 0.1 . -0.2 -2.1 4.4 2.8 0.19 1.04 109.77 . . Q4 . . . . . . 0.20 1.00 104.22 . .
2011 Aug. 0.2 - - 0.4 4.3 2.7 0.19 1.05 110.43 - - Sep. 0.0 - - -3.3 4.1 2.7 0.19 1.04 105.75 - - Oct. -0.2 - - 0.0 4.5 2.8 0.19 1.04 105.06 - - Nov. -0.5 - - -4.0 4.5 3.0 0.20 1.10 105.02 - - Dec. . - - . . . 0.20 1.00 102.55 - -
C41 Real gross domestic product
(annual percentage changes; quarterly data)
C42 Consumer price indices
(annual percentage changes; monthly data)
-15
-10
-5
0
5
10
2000 2002 2004 2006 2008 2010-15
-10
-5
0
5
10
euro areaUnited StatesJapan
-4
-2
0
2
4
6
2000 2002 2004 2006 2008 2010-4
-2
0
2
4
6
euro areaUnited StatesJapan
Sources: National data (columns 1, 2 (United States), 3, 4, 5 (United States), 6, 9 and 10); OECD (column 2 (Japan)); Eurostat (column 5 (Japan), euro area chart data);Thomson Reuters (columns 7 and 8); ECB calculations (column 11).1) Seasonally adjusted. The data for the United States refer to the private non-agricultural business sector.2) Japanese data from March to August 2011 exclude the three prefectures most affected by the earthquake in that country. These are reinstated as of September 2011.3) Period averages; M2 for the United States, M2+CDs for Japan.4) Percentages per annum. For further information on the three-month interbank deposit rate, see Section 4.6.5) For more information, see Section 8.2.6) Gross consolidated general government debt (end of period).7) Data refer to the changing composition of the euro area. For further information, see the General Notes.
7)

S 77ECB
Monthly Bulletin
January 2012
LIST OF CHARTS
C1 Monetary aggregates S12
C2 Counterparts S12
C3 Components of monetary aggregates S13
C4 Components of longer-term fi nancial liabilities S13
C5 Loans to other fi nancial intermediaries and non-fi nancial corporations S14
C6 Loans to households S14
C7 Loans to government S16
C8 Loans to non-euro area residents S16
C9 Total deposits by sector (fi nancial intermediaries) S17
C10 Total deposits and deposits included in M3 by sector (fi nancial intermediaries) S17
C11 Total deposits by sector (non-fi nancial corporations and households) S18
C12 Total deposits and deposits included in M3 by sector (non-fi nancial corporations and households) S18
C13 Deposits by government and non-euro area residents S19
C14 MFI holdings of securities S20
C15 Total outstanding amounts and gross issues of securities other than shares issued by euro area residents S35
C16 Net issues of securities other than shares: seasonally adjusted and non-seasonally adjusted S37
C17 Annual growth rates of long-term debt securities, by sector of the issuer, in all currencies combined S38
C18 Annual growth rates of short-term debt securities, by sector of the issuer, in all currencies combined S39
C19 Annual growth rates for quoted shares issued by euro area residents S40
C20 Gross issues of quoted shares by sector of the issuer S41
C21 New deposits with an agreed maturity S43
C22 New loans with a fl oating rate and up to 1 year’s initial rate fi xation S43
C23 Euro area money market rates S44
C24 3-month money market rates S44
C25 Euro area spot yield curves S45
C26 Euro area spot rates and spreads S45
C27 Dow Jones EURO STOXX broad index, Standard & Poor’s 500 and Nikkei 225 S46
C28 Employment – persons employed and hours worked S55
C29 Unemployment and job vacancy rates S55
C30 Defi cit, borrowing requirement and change in debt S60
C31 Maastricht debt S60
C32 Euro area b.o.p: current account S61
C33 Euro area b.o.p: direct and portfolio investment S61
C34 Euro area b.o.p: goods S62
C35 Euro area b.o.p: services S62
C36 Euro area international investment position S65
C37 Euro area direct and portfolio investment position S65
C38 Main b.o.p. items mirroring developments in MFI net external transactions S70
C39 Effective exchange rates S73
C40 Bilateral exchange rates S73
C41 Real gross domestic product S76
C42 Consumer price indices S76

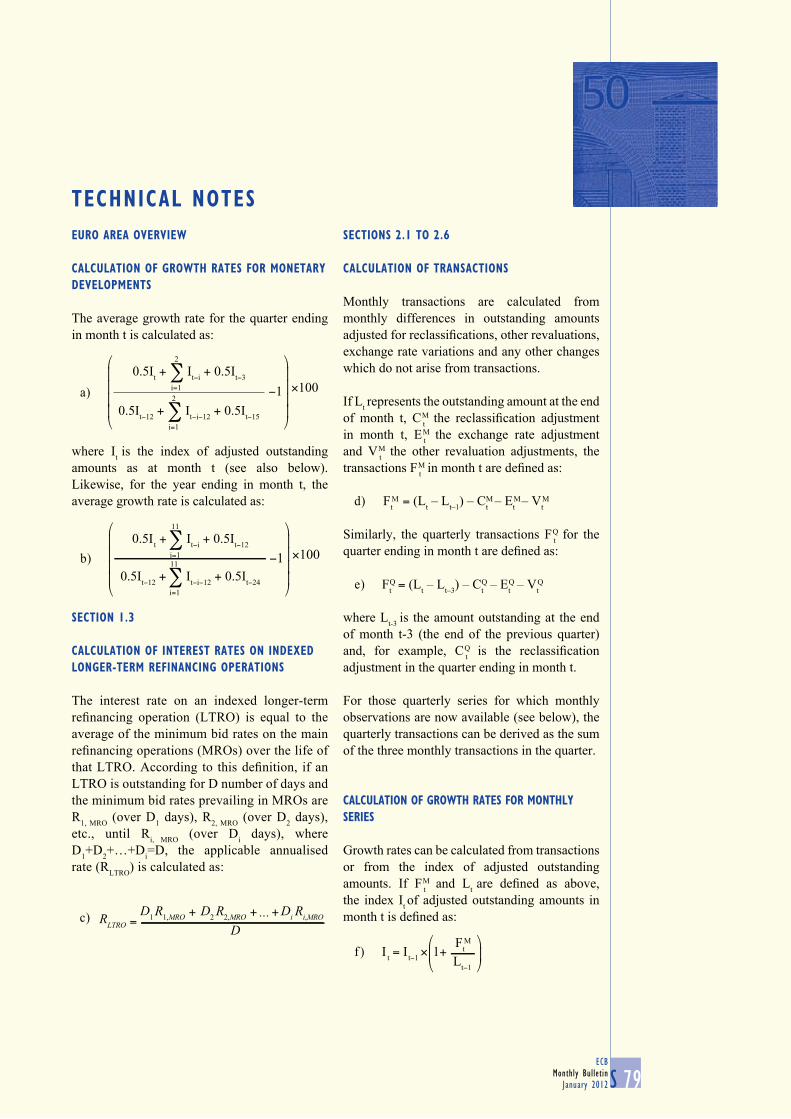
ECB
Monthly Bulletin
January 2012 S 79
TECHNICAL NOTES
EURO AREA OVERVIEW
CALCULATION OF GROWTH RATES FOR MONETARY
DEVELOPMENTS
The average growth rate for the quarter ending
in month t is calculated as:
where It is the index of adjusted outstanding
amounts as at month t (see also below).
Likewise, for the year ending in month t, the
average growth rate is calculated as:
SECTION 1.3
CALCULATION OF INTEREST RATES ON INDEXED
LONGER-TERM REFINANCING OPERATIONS
The interest rate on an indexed longer-term
refi nancing operation (LTRO) is equal to the
average of the minimum bid rates on the main
refi nancing operations (MROs) over the life of
that LTRO. According to this defi nition, if an
LTRO is outstanding for D number of days and
the minimum bid rates prevailing in MROs are
R1, MRO
(over D1 days), R
2, MRO (over D
2 days),
etc., until Ri, MRO
(over Di days), where
D1+D
2+…+D
i=D, the applicable annualised
rate (RLTRO
) is calculated as:
SECTIONS 2.1 TO 2.6
CALCULATION OF TRANSACTIONS
Monthly transactions are calculated from
monthly differences in outstanding amounts
adjusted for reclassifi cations, other revaluations,
exchange rate variations and any other changes
which do not arise from transactions.
If Lt represents the outstanding amount at the end
of month t, C t
M the reclassifi cation adjustment
in month t, E t
M the exchange rate adjustment
and V t
M the other revaluation adjustments, the
transactions F t
M in month t are defi ned as:
Similarly, the quarterly transactions F t
Q for the
quarter ending in month t are defi ned as:
Ft = (Lt – Lt–3) – Ct – Et – VtQ Q Q Qe)
where Lt-3
is the amount outstanding at the end
of month t-3 (the end of the previous quarter)
and, for example, C t
Q is the reclassifi cation
adjustment in the quarter ending in month t.
For those quarterly series for which monthly
observations are now available (see below), the
quarterly transactions can be derived as the sum
of the three monthly transactions in the quarter.
CALCULATION OF GROWTH RATES FOR MONTHLY
SERIES
Growth rates can be calculated from transactions
or from the index of adjusted outstanding
amounts. If F t
M and Lt are defi ned as above,
the index It of adjusted outstanding amounts in
month t is defi ned as:
−1
⎞
⎠
⎟⎟⎟⎟
⎞
⎠
⎟⎟⎟⎟
×100
0.5It−12 + ∑ It−i−12 + 0.5It−15
2
i=1
0.5It + ∑ It−i + 0.5It−3
2
i=1a)
⎞
⎠
⎟⎟⎟⎟
⎞
⎠
⎟⎟⎟⎟
−1 ×1000.5It + ∑ It−i + 0.5It−12
11
i=1
0.5It−12 + ∑ It−i−12 + 0.5It−24
11
i=1
b)
Ft = (Lt – Lt–1) – Ct – Et – VtM M M Md)
I t = It−1 ×Ft
Lt−1
M⎛
⎝⎜
⎞
⎠⎟1+f )
RLTRO =D
1R
1,MRO + D2R
2,MRO + + Di Ri,MRO
D. . .c)
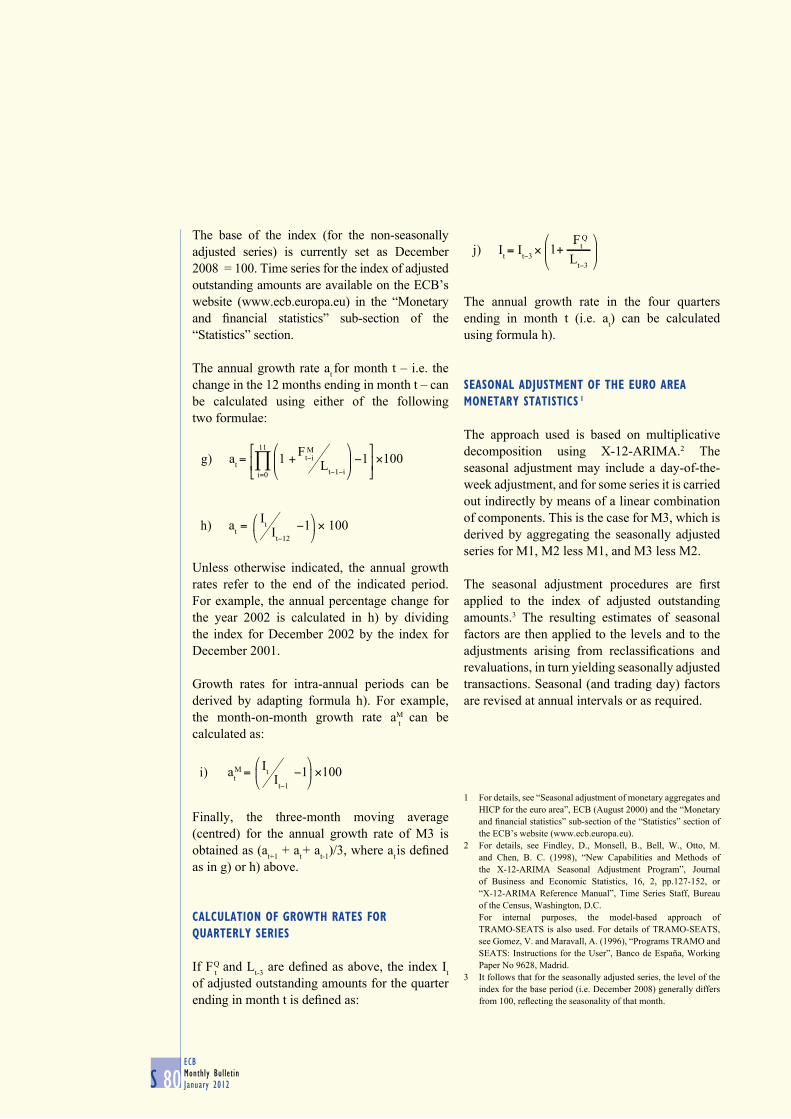
ECB
Monthly Bulletin
January 2012S 80
The base of the index (for the non-seasonally
adjusted series) is currently set as December
2008 = 100. Time series for the index of adjusted
outstanding amounts are available on the ECB’s
website (www.ecb.europa.eu) in the “Monetary
and fi nancial statistics” sub-section of the
“Statistics” section.
The annual growth rate at for month t – i.e. the
change in the 12 months ending in month t – can
be calculated using either of the following
two formulae:
Unless otherwise indicated, the annual growth
rates refer to the end of the indicated period.
For example, the annual percentage change for
the year 2002 is calculated in h) by dividing
the index for December 2002 by the index for
December 2001.
Growth rates for intra-annual periods can be
derived by adapting formula h). For example,
the month-on-month growth rate aM
t can be
calculated as:
Finally, the three-month moving average
(centred) for the annual growth rate of M3 is
obtained as (at+1
+ at + a
t-1)/3, where a
t is defi ned
as in g) or h) above.
CALCULATION OF GROWTH RATES FOR
QUARTERLY SERIES
If F t
Q and Lt-3
are defi ned as above, the index It
of adjusted outstanding amounts for the quarter
ending in month t is defi ned as:
The annual growth rate in the four quarters
ending in month t (i.e. at) can be calculated
using formula h).
SEASONAL ADJUSTMENT OF THE EURO AREA
MONETARY STATISTICS 1
The approach used is based on multiplicative
decomposition using X-12-ARIMA.2 The
seasonal adjustment may include a day-of-the-
week adjustment, and for some series it is carried
out indirectly by means of a linear combination
of components. This is the case for M3, which is
derived by aggregating the seasonally adjusted
series for M1, M2 less M1, and M3 less M2.
The seasonal adjustment procedures are fi rst
applied to the index of adjusted outstanding
amounts.3 The resulting estimates of seasonal
factors are then applied to the levels and to the
adjustments arising from reclassifi cations and
revaluations, in turn yielding seasonally adjusted
transactions. Seasonal (and trading day) factors
are revised at annual intervals or as required.
at =Ft−i
Lt−1−i
M
i=0
⎛
⎝⎜
⎞
⎠⎟
⎡
⎣⎢
⎤
⎦⎥×100∏ 1 + −1
11
g)
at =It
It−12
⎛⎝⎜
⎞⎠⎟× 100−1h)
ItIt−1
at =M −1
⎛
⎝⎜
⎞
⎠⎟ ×100i)
It = It−3 ×⎛
⎝⎜
⎞
⎠⎟Lt−3
FtQ
1+j)
For details, see “Seasonal adjustment of monetary aggregates and 1
HICP for the euro area”, ECB (August 2000) and the “Monetary
and fi nancial statistics” sub-section of the “Statistics” section of
the ECB’s website (www.ecb.europa. eu).
For details, see Findley, D., Monsell, B., Bell, W., Otto, M. 2
and Chen, B. C. (1998), “New Capabilities and Methods of
the X-12-ARIMA Seasonal Adjustment Program”, Journal
of Business and Economic Statistics, 16, 2, pp.127-152, or
“X-12-ARIMA Reference Manual”, Time Series Staff, Bureau
of the Census, Washington, D.C.
For internal purposes, the model-based approach of
TRAMO-SEATS is also used. For details of TRAMO-SEATS,
see Gomez, V. and Maravall, A. (1996), “Programs TRAMO and
SEATS: Instructions for the User”, Banco de España, Working
Paper No 9628, Madrid.
It follows that for the seasonally adjusted series, the level of the 3
index for the base period (i.e. December 2008) generally differs
from 100, refl ecting the seasonality of that month.

ECB
Monthly Bulletin
January 2012 S 81
EURO AREASTATISTICS
Technical Notes
SECTIONS 3.1 TO 3.5
EQUALITY OF USES AND RESOURCES
In Section 3.1 the data conform to a basic
accounting identity. For non-fi nancial
transactions, total uses equal total resources
for each transaction category. This accounting
identity is also refl ected in the fi nancial
account – i.e. for each fi nancial instrument
category, total transactions in fi nancial assets
equal total transactions in liabilities. In the
other changes in assets account and the fi nancial
balance sheets, total fi nancial assets equal total
liabilities for each fi nancial instrument category,
with the exception of monetary gold and special
drawing rights, which are by defi nition not a
liability of any sector.
CALCULATION OF BALANCING ITEMS
The balancing items at the end of each account
in Sections 3.1, 3.2 and 3.3 are computed as
follows.
The trade balance equals euro area imports
minus exports vis-à-vis the rest of the world for
goods and services.
Net operating surplus and mixed income
is defi ned for resident sectors only and is
calculated as gross value added (gross domestic
product at market prices for the euro area) minus
compensation of employees (uses) minus other
taxes less subsidies on production (uses) minus
consumption of fi xed capital (uses).
Net national income is defi ned for resident
sectors only and is computed as net operating
surplus and mixed income plus compensation of
employees (resources) plus taxes less subsidies
on production (resources) plus net property
income (resources minus uses).
Net disposable income is also defi ned only
for resident sectors and equals net national
income plus net current taxes on income and
wealth (resources minus uses) plus net social
contributions (resources minus uses) plus net
social benefi ts other than social transfers in kind
(resources minus uses) plus net other current
transfers (resources minus uses).
Net saving is defi ned for resident sectors and
is calculated as net disposable income plus
the net adjustment for the change in the net
equity of households in pension fund reserves
(resources minus uses) minus fi nal consumption
expenditure (uses). For the rest of the world, the
current external account is compiled as the trade
balance plus all net income (resources minus
uses).
Net lending/net borrowing is computed
from the capital account as net saving plus
net capital transfers (resources minus uses)
minus gross capital formation (uses) minus
acquisitions less disposals of non-produced
non-fi nancial assets (uses) plus consumption
of fi xed capital (resources). It can also be
calculated in the fi nancial account as total
transactions in fi nancial assets minus total
transactions in liabilities (also known as
changes in net fi nancial worth (wealth)
due to transactions). For the household and
non-fi nancial corporation sectors, there is a
statistical discrepancy between the balancing
items computed from the capital account and
the fi nancial account.
Changes in net fi nancial worth (wealth) due to
transactions are computed as total transactions
in fi nancial assets minus total transactions in
liabilities, whereas other changes in net fi nancial
worth (wealth) are calculated as (total) other
changes in fi nancial assets minus (total) other
changes in liabilities.
Net fi nancial worth (wealth) is calculated as
total fi nancial assets minus total liabilities,
whereas changes in net fi nancial worth (wealth)
are equal to the sum of changes in net fi nancial
worth (wealth) due to transactions (lending/net
borrowing from the fi nancial account) and other
changes in net fi nancial worth (wealth).

ECB
Monthly Bulletin
January 2012S 82
Changes in net worth (wealth) are calculated
as changes in net worth (wealth) due to savings
and capital transfers plus other changes in net
fi nancial worth (wealth) and other changes in
non-fi nancial assets.
The net worth (wealth) of households is
calculated as the sum of the non-fi nancial assets
and net fi nancial worth (wealth) of households.
SECTIONS 4.3 AND 4.4
CALCULATION OF GROWTH RATES FOR DEBT
SECURITIES AND QUOTED SHARES
Growth rates are calculated on the basis of
fi nancial transactions and therefore exclude
reclassifi cations, revaluations, exchange rate
variations and any other changes which do not
arise from transactions. They can be calculated
from transactions or from the index of notional
stocks. If Nt
M represents the transactions
(net issues) in month t and Lt the level outstanding
at the end of month t, the index It of notional
stocks in month t is defi ned as:
As a base, the index is set equal to 100 in
December 2008. The growth rate at for month t,
corresponding to the change in the 12 months
ending in month t, can be calculated using either
of the following two formulae:
The method used to calculate the growth rates
for securities other than shares is the same as
that used for the monetary aggregates, the only
difference being that an “N” is used instead of
an “F”. This is to show that the method used to
obtain “net issues” for securities issues statistics
differs from that used to calculate equivalent
“transactions” for the monetary aggregates.
The average growth rate for the quarter ending
in month t is calculated as:
where It is the index of notional stocks as at
month t. Likewise, for the year ending in month t,
the average growth rate is calculated as:
The calculation formula used for Section 4.3 is
also used for Section 4.4 and is likewise based on
that used for the monetary aggregates. Section 4.4
is based on market values, and the calculations
are based on fi nancial transactions, which
exclude reclassifi cations, revaluations and any
other changes that do not arise from transactions.
Exchange rate variations are not included, as all
quoted shares covered are denominated in euro.
SEASONAL ADJUSTMENT OF SECURITIES ISSUES
STATISTICS 4
The approach used is based on multiplicative
decomposition using X-12-ARIMA. The seasonal
adjustment of total securities issues is carried out
indirectly by means of a linear combination of
sector and maturity component breakdowns.
The seasonal adjustment procedures are applied
to the index of notional stocks. The resulting
estimates of seasonal factors are then applied to
the outstanding amounts, from which seasonally
I t = It−1 ×Nt
Lt−1
⎛
⎝⎜
⎞
⎠⎟1+k)
at =Nt−i
Lt−1−i
M
i=0
⎛
⎝⎜
⎞
⎠⎟
⎡
⎣⎢
⎤
⎦⎥×100∏ 1 + −1
11
l)
at =It
It−12
⎛⎝⎜
⎞⎠⎟×100−1m)
−1
⎞
⎠
⎟⎟⎟⎟
⎞
⎠
⎟⎟⎟⎟
×1002
0.5It−12 + ∑ It−i−12 + 0.5It−15i=1
0.5It + ∑ It−i + 0.5It−3
2
i=1n)
⎞
⎠
⎟⎟⎟⎟
⎞
⎠
⎟⎟⎟⎟
−1 ×1000.5It + ∑ It−i + 0.5It−12
11
i=1
0.5It−12 + ∑ It−i−12 + 0.5It−24
11
i=1
o)
For details, see “Seasonal adjustment of monetary aggregates and 4
HICP for the euro area”, ECB (August 2000) and the “Monetary
and fi nancial statistics” sub-section of the “Statistics” section of
the ECB’s website (www.ecb.europa.eu).

ECB
Monthly Bulletin
January 2012 S 83
EURO AREASTATISTICS
Technical Notes
adjusted net issues are derived. Seasonal factors
are revised at annual intervals or as required.
As in formulae l) and m), the growth rate at for
month t, corresponding to the change in the six
months ending in month t, can be calculated
using either of the following two formulae:
TABLE 1 IN SECTION 5.1
SEASONAL ADJUSTMENT OF THE HICP 4
The approach used is based on multiplicative
decomposition using X-12-ARIMA (see
footnote 2 on page S78). The seasonal
adjustment of the overall HICP for the euro
area is carried out indirectly by aggregating
the seasonally adjusted euro area series for
processed food, unprocessed food, industrial
goods excluding energy, and services. Energy
is added without adjustment, since there is no
statistical evidence of seasonality. Seasonal
factors are revised at annual intervals or as
required.
TABLE 2 IN SECTION 7.1
SEASONAL ADJUSTMENT OF THE BALANCE
OF PAYMENTS CURRENT ACCOUNT
The approach used is based on multiplicative
decomposition, using X-12-ARIMA or
TRAMO-SEATS depending on the item.
The raw data for goods, services, income and
current transfers are pre-adjusted in order to take
into account signifi cant working day effects.
The working day adjustment for goods and
services takes account of national public holidays.
The seasonal adjustment of these items is carried
out using these pre-adjusted series. The seasonal
adjustment of the total current account is carried
out by aggregating the seasonally adjusted euro
area series for goods, services, income and current
transfers. Seasonal (and trading day) factors are
revised at biannual intervals or as required.
SECTION 7.3
CALCULATION OF GROWTH RATES FOR THE
QUARTERLY AND ANNUAL SERIES
The annual growth rate for quarter t is calculated
on the basis of quarterly transactions (Ft) and
positions (Lt) as follows:
The growth rate for the annual series is equal to
the growth rate in the last quarter of the year.
at =Nt−i
Lt−1−i
M
i=0
⎛
⎝⎜
⎞
⎠⎟
⎡
⎣⎢
⎤
⎦⎥×100∏ 1 + −1
5
p)
at =ItIt−6
⎛⎝⎜
⎞⎠⎟×100−1q)
at
t
= ×100⎛⎝⎜
⎛⎝⎜
⎞⎠⎟
⎞⎠⎟
i=t–3∏ 1 + Fi
Li–l
— −1r)


ECB
Monthly Bulletin
January 2012 S 85
The “Euro area statistics” section of the
Monthly Bulletin focuses on statistics for the
euro area as a whole. More detailed and longer
runs of data, with further explanatory notes, are
available in the “Statistics” section of the ECB’s
website (www.ecb.europa.eu). This allows user-
friendly access to data via the ECB’s Statistical
Data Warehouse (http://sdw.ecb.europa.eu),
which includes search and download facilities.
Further services available in the “Data services”
sub-section include subscriptions to different
datasets and a repository of compressed Comma
Separated Value (CSV) fi les. For further
information, please contact us at: statistics@
ecb.europa.eu.
In general, the cut-off date for the statistics
included in the Monthly Bulletin is the day
preceding the Governing Council of the ECB’s
fi rst meeting of the month. For this issue,
the cut-off date was 11 January 2012.
Unless otherwise indicated, all data series
including observations for 2011 relate to the
“Euro 17” (i.e. the euro area including Estonia)
for the whole time series. For interest rates,
monetary statistics, the HICP and reserve assets
(and, for consistency reasons, the components
and counterparts of M3 and the components
of the HICP), euro area statistical series take
into account the changing composition of the
euro area.
The composition of the euro area has changed a
number of times over the years. When the euro
was introduced in 1999, the euro area comprised
the following 11 countries (the Euro 11):
Belgium, Germany, Ireland, Spain, France,
Italy, Luxembourg, the Netherlands, Austria,
Portugal and Finland. Greece then joined in
2001, forming the Euro 12. Slovenia joined in
2007, forming the Euro 13; Cyprus and Malta
joined in 2008, forming the Euro 15; and
Slovakia joined in 2009, forming the Euro 16.
Finally, Estonia joined in 2011, bringing the
number of euro area countries to 17.
EURO AREA SERIES WITH A FIXED COMPOSITION
Aggregated statistical series for fi xed
compositions of the euro area relate to a given
fi xed composition for the whole time series,
regardless of the composition at the time to which
the statistics relate. For example, aggregated
series are calculated for the Euro 17 (i.e.
aggregating the data of all 17 countries currently
in the euro area) for all years, despite the fact
that the euro area has only had this composition
since 1 January 2011. Unless otherwise
indicated, the ECB’s Monthly Bulletin provides
statistical series for the current composition.
EURO AREA SERIES WITH A CHANGING
COMPOSITION
Aggregated statistical series with a changing
composition take into account the composition
of the euro area at the time to which the statistics
relate. For example, euro area statistical series
with a changing composition aggregate the data
of the Euro 11 for the period up to the end of
2000, the Euro 12 for the period from 2001 to
the end of 2006, and so on. With this approach,
each individual statistical series covers all of the
various compositions of the euro area.
For the HICP, as well as monetary aggregates
and their counterparts, annual rates of change are
compiled from chain-linked indices, with joining
countries’ series linked to the euro area series in
the December index. Thus, if a country joins the
euro area in January of a given year, annual rates
of change relate to the previous composition of
the euro area up to and including December of the
previous year, and the enlarged composition of
the euro area thereafter. Percentage changes are
calculated on the basis of a chain-linked index,
taking account of the changing composition of
the euro area. Absolute changes for monetary
aggregates and their counterparts (transactions)
refer to the composition of the euro area at the
time to which the statistics relate.
GENERAL NOTES
ECB
Monthly Bulletin
January 2012S 86
Given that the composition of the European
currency unit (ECU) does not coincide with the
former currencies of the countries that have
adopted the single currency, pre-1999 amounts
originally expressed in the participating
currencies and converted into ECU at current
ECU exchange rates are affected by movements
in the currencies of EU Member States that have
not adopted the euro. To avoid this effect on the
monetary statistics, pre-1999 data 1 are expressed
in units converted from national currencies at
the irrevocable euro exchange rates established
on 31 December 1998. Unless otherwise
indicated, price and cost statistics before 1999
are based on data expressed in national
currency terms.
Methods of aggregation and/or consolidation
(including cross-country consolidation) have
been used where appropriate.
Recent data are often provisional and may be
revised. Discrepancies between totals and their
components may arise from rounding.
The group “Other EU Member States” comprises
Bulgaria, the Czech Republic, Denmark, Latvia,
Lithuania, Hungary, Poland, Romania, Sweden
and the United Kingdom.
In most cases, the terminology used within the
tables follows international standards, such
as those contained in the European System of
Accounts 1995 and the IMF Balance of Payments
Manual. Transactions refer to voluntary
exchanges (measured directly or derived), while
fl ows also encompass changes in outstanding
amounts owing to price and exchange rate
changes, write-offs and other changes.
In the tables, the wording “up to (x) years”
means “up to and including (x) years”.
OVERVIEW
Developments in key indicators for the euro area
are summarised in an overview table.
MONETARY POLICY STATISTICS
Section 1.4 shows statistics on minimum reserve
and liquidity factors. Maintenance periods for
minimum reserve requirements start every month
on the settlement day of the main refi nancing
operation (MRO) following the Governing
Council meeting for which the monthly
assessment of the monetary policy stance is
scheduled. They end on the day preceding the
corresponding settlement day in the following
month. Annual/quarterly observations refer to
averages for the last reserve maintenance period
of the year/quarter.
Table 1 in Section 1.4 shows the components
of the reserve base of credit institutions
subject to reserve requirements. Liabilities
vis-à-vis other credit institutions subject to the
ESCB’s minimum reserve system, the ECB
and participating national central banks are
excluded from the reserve base. When a credit
institution cannot provide evidence of the
amount of its issues of debt securities with a
maturity of up to two years which are held by
the institutions mentioned above, it may deduct
a certain percentage of these liabilities from its
reserve base. The percentage used to calculate
the reserve base was 10% until November 1999
and has been 30% since that date.
Table 2 in Section 1.4 contains average data
for completed maintenance periods. First,
the reserve requirement of each individual
credit institution is calculated by applying the
reserve ratios for the corresponding categories
of liability to the eligible liabilities, using the
balance sheet data from the end of each calendar
month. Subsequently, each credit institution
deducts from this fi gure a lump-sum allowance
of €100,000. The resulting required reserves are
then aggregated at the euro area level (column 1).
Current account holdings (column 2) are the
Data on monetary statistics in Sections 2.1 to 2.8 are available 1
for periods prior to January 1999 on the ECB’s website (http://
www.ecb.europa.eu/stats/services/downloads/html/index.
en.html) and in the SDW (http://sdw.ecb.europa.eu/browse.
do?node=2018811).

ECB
Monthly Bulletin
January 2012 S 87
EURO AREASTATISTICS
General Notes
aggregate average daily current account holdings
of credit institutions, including those that serve
to fulfi l reserve requirements. Excess reserves
(column 3) are the average current account
holdings over the maintenance period in excess
of the required reserves. Defi ciencies (column 4)
are defi ned as the average shortfalls of current
account holdings from required reserves over
the maintenance period, computed on the basis
of those credit institutions that have not fulfi lled
their reserve requirements. The interest rate on
minimum reserves (column 5) is equal to the
average, over the maintenance period, of the
ECB’s rate (weighted according to the number
of calendar days) on the Eurosystem’s MROs
(see Section 1.3).
Table 3 in Section 1.4 shows the banking
system’s liquidity position, which is defi ned
as euro area credit institutions’ current account
holdings with the Eurosystem in euro. All
amounts are derived from the consolidated
fi nancial statement of the Eurosystem. Other
liquidity-absorbing operations (column 7)
exclude the issuance of debt certifi cates
initiated by NCBs in Stage Two of EMU. Net
other factors (column 10) represent the netted
remaining items in the consolidated fi nancial
statement of the Eurosystem. Credit institutions’
current accounts (column 11) are equal to
the difference between the sum of liquidity-
providing factors (columns 1 to 5) and the sum
of liquidity-absorbing factors (columns 6 to 10).
Base money (column 12) is calculated as the
sum of the deposit facility (column 6), banknotes
in circulation (column 8) and credit institutions’
current account holdings (column 11).
MONEY, BANKING AND OTHER FINANCIAL
CORPORATIONS
Chapter 2 shows balance sheet statistics for MFIs
and other fi nancial corporations. Other fi nancial
corporations comprise investment funds (other
than money market funds, which are part of
the MFI sector), fi nancial vehicle corporations,
insurance corporations and pension funds.
Section 2.1 shows the aggregated balance
sheet of the MFI sector, i.e. the sum of the
harmonised balance sheets of all MFIs resident
in the euro area. MFIs comprise central banks,
credit institutions as defi ned under EU law,
money market funds and other institutions
whose business it is to receive deposits and/or
close substitutes for deposits from entities other
than MFIs and, for their own account (at least
in economic terms), to grant credit and/or make
investments in securities. A complete list of
MFIs is published on the ECB’s website.
Section 2.2 shows the consolidated balance
sheet of the MFI sector, which is obtained by
netting the aggregated balance sheet positions of
MFIs in the euro area. Owing to a small amount
of heterogeneity in recording practices, the sum
of the inter-MFI positions is not necessarily
zero; the balance is shown in column 10 of
the liabilities side of Section 2.2. Section 2.3
sets out the euro area monetary aggregates
and counterparts. These are derived from the
consolidated MFI balance sheet and include
positions of non-MFIs resident in the euro area
held with MFIs resident in the euro area; they
also take account of some monetary assets/
liabilities of central government. Statistics
on monetary aggregates and counterparts are
adjusted for seasonal and trading day effects.
The external liabilities item in Sections 2.1
and 2.2 shows the holdings by non-euro area
residents of: (i) shares/units issued by money
market funds located in the euro area; and
(ii) debt securities issued with a maturity of up
to two years by MFIs located in the euro area.
In Section 2.3, however, these holdings are
excluded from the monetary aggregates and
contribute to the item “net external assets”.
Section 2.4 provides analysis, broken down
by sector, type and original maturity, of loans
granted by MFIs other than the Eurosystem
(i.e. the banking system) resident in the euro
area. Section 2.5 provides analysis, broken
down by sector and instrument, of deposits held
with the euro area banking system. Section 2.6
shows the securities held by the euro area

ECB
Monthly Bulletin
January 2012S 88
banking system, broken down by type of
issuer. Section 2.7 shows a quarterly currency
breakdown for selected MFI balance sheet
items.
Sections 2.2 to 2.6 also provide growth rates
based on those transactions in the form of annual
percentage changes.
Since 1 January 1999 statistical information has
been collected and compiled on the basis of
various ECB regulations concerning the balance
sheet of the monetary fi nancial institution sector.
Since July 2010 this has been carried out on the
basis of Regulation ECB/2008/32 2. Detailed
sector defi nitions are set out in the third edition
of the “Monetary fi nancial institutions and
markets statistics sector manual – Guidance for
the statistical classifi cation of customers” (ECB,
March 2007).
Section 2.8 shows outstanding amounts and
transactions on the balance sheet of euro area
investment funds (other than money market
funds, which are included in the MFI balance
sheet statistics). An investment fund is a
collective investment undertaking that invests
capital raised from the public in fi nancial and/
or non-fi nancial assets. A complete list of euro
area investment funds is published on the ECB’s
website. The balance sheet is aggregated, so
investment funds’ assets include their holdings
of shares/units issued by other investment
funds. Shares/units issued by investment funds
are also broken down by investment policy
(i.e. into bond funds, equity funds, mixed
funds, real estate funds, hedge funds and other
funds) and by type (i.e. into open-end funds and
closed-end funds). Section 2.9 provides further
details on the main types of asset held by euro
area investment funds. This section contains
a geographical breakdown of the issuers of
securities held by investment funds, as well
as breaking issuers down by economic sector
where they are resident in the euro area.
Since December 2008 harmonised statistical
information has been collected and compiled
on the basis of Regulation ECB/2007/8 3
concerning statistics on the assets and liabilities
of investment funds. Further information on
these investment fund statistics can be found
in the “Manual on investment fund statistics”
(ECB, May 2009).
Section 2.10 shows the aggregated balance
sheet of fi nancial vehicle corporations (FVCs)
resident in the euro area. FVCs are entities which
are set up in order to carry out securitisation
transactions. Securitisation generally involves
the transfer of an asset or pool of assets to an
FVC, with such assets reported on the FVC’s
balance sheet as securitised loans, securities
other than shares, or other securitised assets.
Alternatively, the credit risk relating to an asset
or pool of assets may be transferred to an FVC
through credit default swaps, guarantees or other
such mechanisms. Collateral held by the FVC
against these exposures is typically a deposit
held with an MFI or invested in securities other
than shares. FVCs typically securitise loans
which have been originated by the MFI sector.
FVCs must report such loans on their statistical
balance sheet, regardless of whether the relevant
accounting rules allow the MFI to derecognise
the loans. Data on loans which are securitised
by FVCs but remain on the balance sheet of
the relevant MFI (and thus remain in the MFI
statistics) are provided separately. These
quarterly data are collected under Regulation
ECB/2008/30 4 as of December 2009.
Section 2.11 shows the aggregated balance sheet
of insurance corporations and pension funds
resident in the euro area. Insurance corporations
cover both the insurance and reinsurance sectors,
while pension funds include entities which have
autonomy in terms of decision-making and keep
a complete set of accounts (i.e. autonomous
pension funds). This section also contains a
geographical and sectoral breakdown of issuing
counterparties for securities other than shares
held by insurance corporations and pension
funds.
OJ L 15, 20.01.2009, p. 14.2
OJ L 211, 11.08.2007, p. 8.3
OJ L 15, 20.01.2009, p. 1.4

ECB
Monthly Bulletin
January 2012 S 89
EURO AREASTATISTICS
General Notes
EURO AREA ACCOUNTS
Section 3.1 shows quarterly integrated euro area
accounts data, which provide comprehensive
information on the economic activities of
households (including non-profi t institutions
serving households), non-fi nancial corporations,
fi nancial corporations and general government,
as well as on the interaction between these
sectors and both the euro area and the rest of the
world. Non-seasonally adjusted data at current
prices are displayed for the last available quarter,
following a simplifi ed sequence of accounts in
accordance with the methodological framework
of the European System of Accounts 1995.
In short, the sequence of accounts (transactions)
comprises: (1) the generation of income account,
which shows how production activity translates
into various categories of income; (2) the
allocation of primary income account, which
records receipts and expenses relating to various
forms of property income (for the economy as a
whole; the balancing item of the primary income
account is national income); (3) the secondary
distribution of income account, which shows
how the national income of an institutional
sector changes because of current transfers; (4)
the use of income account, which shows how
disposable income is spent on consumption or
saved; (5) the capital account, which shows how
savings and net capital transfers are spent in the
acquisition of non-fi nancial assets (the balancing
item of the capital account is net lending/
net borrowing); and (6) the fi nancial account,
which records the net acquisitions of fi nancial
assets and the net incurrence of liabilities. As
each non-fi nancial transaction is mirrored by a
fi nancial transaction, the balancing item of the
fi nancial account conceptually also equals net
lending/net borrowing as calculated from the
capital account.
In addition, opening and closing fi nancial
balance sheets are presented, which provide a
picture of the fi nancial wealth of each individual
sector at a given point in time. Finally, other
changes in fi nancial assets and liabilities
(e.g. those resulting from the impact of changes
in asset prices) are also shown.
The sectoral coverage of the fi nancial account
and the fi nancial balance sheets is more detailed
for the fi nancial corporation sector, which
is broken down into MFIs, other fi nancial
intermediaries (including fi nancial auxiliaries),
and insurance corporations and pension funds.
Section 3.2 shows four-quarter cumulated fl ows
(transactions) for the “non-fi nancial accounts”
of the euro area (i.e. accounts (1) to (5) above),
also following the simplifi ed sequence of
accounts.
Section 3.3 shows four-quarter cumulated fl ows
(transactions and other changes) for households’
income, expenditure and accumulation accounts,
as well as outstanding amounts in the fi nancial
and non-fi nancial balance sheet accounts,
presenting data in a more analytical manner.
Sector-specifi c transactions and balancing
items are arranged in a way that more clearly
depicts the fi nancing and investment decisions
of households, while respecting the accounting
identities presented in Sections 3.1 and 3.2.
Section 3.4 displays four-quarter cumulated
fl ows (transactions) for non-fi nancial
corporations’ income and accumulation
accounts, as well as outstanding amounts for the
fi nancial balance sheet accounts, presenting data
in a more analytical manner.
Section 3.5 shows four-quarter cumulated
fi nancial fl ows (transactions and other changes)
and outstanding amounts for the fi nancial
balance sheets of insurance corporations and
pension funds.
FINANCIAL MARKETS
The series on fi nancial market statistics for the
euro area cover those EU Member States that
had adopted the euro at the time to which the
statistics relate (i.e. a changing composition),

ECB
Monthly Bulletin
January 2012S 90
with the exception of statistics on securities
issues (Sections 4.1 to 4.4), which relate to the
Euro 16 for the whole time series (i.e. a fi xed
composition).
Statistics on securities other than shares and
statistics on quoted shares (Sections 4.1 to 4.4)
are produced by the ECB using data from the
ESCB and the BIS. Section 4.5 presents MFI
interest rates on euro-denominated deposits
from and loans to euro area residents. Statistics
on money market interest rates, long-term
government bond yields and stock market
indices (Sections 4.6 to 4.8) are produced by the
ECB using data from wire services.
Statistics on securities issues cover: (i) securities
other than shares, excluding fi nancial
derivatives; and (ii) quoted shares. The former
are presented in Sections 4.1, 4.2 and 4.3, while
the latter are presented in Section 4.4. Debt
securities are broken down into short-term
and long-term securities. “Short-term” means
securities with an original maturity of one year
or less (in exceptional cases, two years or less).
Securities with (i) a longer maturity, (ii) optional
maturity dates, the latest of which is more than
one year away, or (iii) indefi nite maturity dates
are classifi ed as “long-term”. Long-term debt
securities issued by euro area residents are
broken down further into fi xed and variable rate
issues. Fixed rate issues consist of issues where
the coupon rate does not change during the life
of the issue. Variable rate issues comprise all
issues where the coupon is periodically refi xed
with reference to an independent interest rate
or index. The euro-denominated securities
indicated in Sections 4.1, 4.2 and 4.3 also include
items expressed in national denominations of
the euro.
Section 4.1 shows securities other than shares,
broken down by original maturity, residency of
the issuer and currency. It presents outstanding
amounts, gross issues and net issues of
securities other than shares, broken down into:
(i) issues denominated in euro and issues in all
currencies; (ii) issues by euro area residents
and total issues; and (iii) total and long-term
maturities. Net issues differ from the changes
in outstanding amounts owing to valuation
changes, reclassifi cations and other adjustments.
This section also presents seasonally adjusted
statistics, including six-month annualised
seasonally adjusted growth rates for total and
long-term debt securities. Seasonally adjusted
data are derived from the index of notional
stocks, from which the seasonal effects have
been removed. See the Technical Notes for
details.
Section 4.2 contains a sectoral breakdown
of outstanding amounts, gross issues and net
issues for issuers resident in the euro area in line
with the ESA 95. The ECB is included in the
Eurosystem.
The total outstanding amounts for total and long-
term debt securities in column 1 of Table 1 in
Section 4.2 correspond to the data on outstanding
amounts for total and long-term debt securities
issued by euro area residents in column 7 of
Section 4.1. The outstanding amounts for total
and long-term debt securities issued by MFIs in
column 2 of Table 1 in Section 4.2 are broadly
comparable with the data on debt securities
issued on the liabilities side of the aggregated
MFI balance sheet in column 8 of Table 2 in
Section 2.1. The total net issues for total debt
securities in column 1 of Table 2 in Section 4.2
correspond to the data on total net issues by
euro area residents in column 9 of Section 4.1.
The residual difference between long-term debt
securities and total fi xed and variable rate long-
term debt securities in Table 1 of Section 4.2
consists of zero coupon bonds and revaluation
effects.
Section 4.3 shows seasonally adjusted and
non-seasonally adjusted growth rates for
debt securities issued by euro area residents
(broken down by maturity, type of instrument,
sector of the issuer and currency), which are
based on fi nancial transactions that occur
when an institutional unit incurs or redeems
liabilities. The growth rates therefore exclude
reclassifi cations, revaluations, exchange rate
variations and any other changes that do

ECB
Monthly Bulletin
January 2012 S 91
EURO AREASTATISTICS
General Notes
not arise from transactions. The seasonally
adjusted growth rates have been annualised
for presentational purposes. See the Technical
Notes for details.
Columns 1, 4, 6 and 8 in Table 1 of Section 4.4
show the outstanding amounts of quoted shares
issued by euro area residents broken down by
issuing sector. The monthly data for quoted
shares issued by non-fi nancial corporations
correspond to the quarterly series shown in
Section 3.4 (fi nancial balance sheet; quoted
shares).
Columns 3, 5, 7 and 9 in Table 1 of Section 4.4
show annual growth rates for quoted shares
issued by euro area residents (broken down by
the sector of the issuer), which are based on
fi nancial transactions that occur when an issuer
issues or redeems shares for cash, excluding
investments in the issuer’s own shares.
The calculation of annual growth rates excludes
reclassifi cations, revaluations and any other
changes that do not arise from transactions.
Section 4.5 presents statistics on all the interest
rates that MFIs resident in the euro area apply
to euro-denominated deposits and loans vis-à-
vis households and non-fi nancial corporations
resident in the euro area. Euro area MFI interest
rates are calculated as a weighted average
(by corresponding business volume) of the euro
area countries’ interest rates for each category.
MFI interest rate statistics are broken down by
type of business coverage, sector, instrument
category and maturity, period of notice or initial
period of interest rate fi xation. These MFI
interest rate statistics replaced the ten transitional
statistical series on euro area retail interest rates
that had been published in the Monthly Bulletin
as of January 1999.
Section 4.6 presents money market interest rates
for the euro area, the United States and Japan.
For the euro area, a broad spectrum of money
market interest rates is covered, ranging from
interest rates on overnight deposits to those on
twelve-month deposits. Before January 1999,
synthetic euro area interest rates were calculated
on the basis of national rates weighted by
GDP. With the exception of the overnight rate
prior to January 1999, monthly, quarterly and
yearly values are period averages. Overnight
deposits are represented by end-of-period
interbank deposit bid rates up to and including
December 1998 and period averages for the euro
overnight index average (EONIA) thereafter.
As of January 1999, euro area interest rates on
one, three, six and twelve-month deposits are
euro interbank offered rates (EURIBOR); prior
to that date, they are London interbank offered
rates (LIBOR) where available. For the United
States and Japan, interest rates on three-month
deposits are represented by LIBOR.
Section 4.7 shows end-of-period rates estimated
from nominal spot yield curves based on AAA-
rated euro-denominated bonds issued by euro
area central governments. The yield curves are
estimated using the Svensson model 5. Spreads
between the ten-year rates and the three-month
and two-year rates are also released. Additional
yield curves (daily releases, including charts and
tables) and the corresponding methodological
information are available at: http://www.ecb.
europa.eu/stats/money/yc/html/index.en.html.
Daily data can also be downloaded.
Section 4.8 shows stock market indices for the
euro area, the United States and Japan.
PRICES, OUTPUT, DEMAND AND LABOUR MARKETS
Most of the data described in this section are
produced by the European Commission (mainly
Eurostat) and national statistical authorities. Euro
area results are obtained by aggregating data
for individual countries. As far as possible, the
data are harmonised and comparable. Statistics
on labour costs indices, GDP and expenditure
components, value added by economic activity,
industrial production, retail sales passenger car
Svensson, L.E., “Estimating and Interpreting Forward Interest 5
Rates: Sweden 1992-1994”, CEPR Discussion Papers, No 1051.
Centre for Economic Policy Research, London, 1994.

ECB
Monthly Bulletin
January 2012S 92
registrations and employment in terms of hours
worked are working day-adjusted.
The Harmonised Index of Consumer Prices
(HICP) for the euro area (Table 1 in Section 5.1)
is available from 1995 onwards. It is based
on national HICPs, which follow the same
methodology in all euro area countries.
The breakdown into goods and services
components is derived from the classifi cation
of individual consumption by purpose (Coicop/
HICP). The HICP covers monetary expenditure by
households on fi nal consumption in the economic
territory of the euro area. The table includes
seasonally adjusted HICP data and experimental
HICP-based estimates of administered prices,
which are compiled by the ECB.
Industrial producer prices (Table 2 in
Section 5.1), industrial production, industrial
new orders, industrial turnover and retail sales
(Section 5.2) are covered by Council Regulation
(EC) No 1165/98 of 19 May 1998 concerning
short-term statistics 6. Since January 2009 the
revised classifi cation of economic activities
(NACE Revision 2), as covered by Regulation
(EC) No 1893/2006 of the European Parliament
and of the Council of 20 December 2006
establishing the statistical classifi cation
of economic activities NACE Revision 2
and amending Council Regulation (EEC)
No 3037/90, as well as certain EC Regulations
on specifi c statistical domains 7, has been applied
in the production of short-term statistics. The
breakdown by end use of product for industrial
producer prices and industrial production is the
harmonised sub-division of industry excluding
construction (NACE Revision 2, sections B
to E) into Main Industrial Groupings (MIGs)
as defi ned by Commission Regulation (EC)
No 656/2007 of 14 June 2007 8. Industrial
producer prices refl ect the ex-factory gate prices
of producers. They include indirect taxes except
VAT and other deductible taxes. Industrial
production refl ects the value added of the
industries concerned.
The two non-energy commodity price indices
shown in Table 3 in Section 5.1 are compiled
with the same commodity coverage, but using
two different weighting schemes: one based on
the respective commodity imports of the euro
area (columns 2-4), and the other (columns 5-7)
based on estimated euro area domestic demand,
or “use”, taking into account information on
imports, exports and the domestic production
of each commodity (ignoring, for the sake of
simplicity, inventories, which are assumed to
be relatively stable over the observed period).
The import-weighted commodity price index is
appropriate for analysing external developments,
while the use-weighted index is suitable for
the specifi c purpose of analysing international
commodity price pressures on euro area infl ation.
The use-weighted commodity price indices are
experimental data. For more details as regards
the compilation of the ECB commodity price
indices, see Box 1 in the December 2008 issue
of the Monthly Bulletin.
The labour cost indices (Table 5 in Section 5.1)
measure the changes in labour costs per hour
worked in industry (including construction) and
market services. Their methodology is laid down
in Regulation (EC) No 450/2003 of the European
Parliament and of the Council of
27 February 2003 concerning the labour cost
index 9 and in the implementing Commission
Regulation (EC) No 1216/2003 of 7 July 2003 10. A breakdown of the labour cost indices for
the euro area is available by labour cost
component (wages and salaries, and employers’
social contributions plus employment-related
taxes paid by the employer less subsidies
received by the employer) and by economic
activity. The ECB calculates the indicator of
negotiated wages (memo item in Table 3 of
Section 5.1) on the basis of non-harmonised,
national-defi nition data.
Unit labour cost components (Table 4 in
Section 5.1), GDP and its components (Tables 1
and 2 in Section 5.2), GDP defl ators (Table 3
in Section 5.1) and employment statistics
OJ L 162, 5.6.1998, p. 1.6
OJ L 393, 30.12.2006, p. 1.7
OJ L 155, 15.6.2007, p. 3.8
OJ L 69, 13.3.2003, p. 1.9

ECB
Monthly Bulletin
January 2012 S 93
EURO AREASTATISTICS
General Notes
(Tables 1, 2 and 3 in Section 5.3) are derived
from the ESA 95 11 quarterly national accounts.
The ESA 95 was amended by Commission
Regulation (EU) No 715/2010 of 10 August
2010 12 introducing NACE Revision 2, the
updated statistical classifi cation of economic
activities. The publication of euro area national
accounts data applying this new classifi cation
began in December 2011.
Industrial new orders (Table 4 in Section 5.2)
measure the orders received during the reference
period and cover industries working mainly on
the basis of orders – in particular the textile, pulp
and paper, chemical, metal, capital goods and
durable consumer goods industries. The data are
calculated on the basis of current prices.
Indices for turnover in industry and for the
retail trade (Table 4 in Section 5.2) measure the
turnover, including all duties and taxes (with
the exception of VAT), invoiced during the
reference period. Retail trade turnover covers all
retail trade (excluding sales of motor vehicles
and motorcycles), except automotive fuel. New
passenger car registrations cover registrations of
both private and commercial passenger cars.
Qualitative business and consumer survey data
(Table 5 in Section 5.2) draw on the European
Commission Business and Consumer Surveys.
Unemployment rates (Table 4 in Section 5.3)
conform to International Labour Organization
guidelines. They refer to persons actively
seeking work as a share of the labour force,
using harmonised criteria and defi nitions.
The labour force estimates underlying the
unemployment rate are different from the sum
of the employment and unemployment levels
published in Section 5.3.
GOVERNMENT FINANCE
Sections 6.1 to 6.5 show the general government
fi scal position in the euro area. The data are
mainly consolidated and are based on the
ESA 95 methodology. The annual euro area
aggregates in Sections 6.1 to 6.3 are compiled
by the ECB on the basis of harmonised data
provided by the NCBs, which are regularly
updated. The defi cit and debt data for the euro
area countries may therefore differ from those
used by the European Commission within the
excessive defi cit procedure. The quarterly euro
area aggregates in Sections 6.4 and 6.5 are
compiled by the ECB on the basis of Eurostat
and national data.
Section 6.1 presents annual fi gures on general
government revenue and expenditure on the
basis of defi nitions laid down in Commission
Regulation (EC) No 1500/2000 of 10 July 2000 13
amending the ESA 95. Section 6.2 shows details
of general government gross consolidated debt
at nominal value in line with the Treaty
provisions on the excessive defi cit procedure.
Sections 6.1 and 6.2 include summary data for
the individual euro area countries owing to their
importance within the framework of the Stability
and Growth Pact. The defi cits/surpluses
presented for the individual euro area countries
correspond to excessive defi cit procedure B.9,
as defi ned by Council Regulation (EC)
No 479/2009 as regards references to the
ESA 95. Section 6.3 presents changes in general
government debt. The difference between the
change in the government debt and the
government defi cit – the defi cit-debt adjustment –
is mainly explained by government transactions
in fi nancial assets and by foreign exchange
valuation effects. Section 6.4 presents quarterly
fi gures on general government revenue and
expenditure on the basis of defi nitions laid down
in Regulation (EC) No 1221/2002 of the
European Parliament and of the Council of
10 June 2002 on quarterly non-fi nancial accounts
for general government 14. Section 6.5 presents
quarterly fi gures on gross consolidated
government debt, the defi cit-debt adjustment
and the government borrowing requirement.
These fi gures are compiled using data provided
OJ L 169, 8.7.2003, p. 37.10
OJ L 310, 30.11.1996, p. 1.11
OJ L 210, 11.8.2010, p. 1.12
OJ L 172, 12.7.2000, p. 3. 13
OJ L 179, 9.7.2002, p. 1.14

ECB
Monthly Bulletin
January 2012S 94
by the Member States under Regulation (EC)
No 501/2004 and Regulation (EC) No 222/2004
and data provided by the NCBs.
EXTERNAL TRANSACTIONS AND POSITIONS
The concepts and defi nitions used in balance of
payments and international investment position
(i.i.p.) statistics (Sections 7.1 to 7.4) are
generally in line with the IMF Balance of
Payments Manual (fi fth edition, October 1993),
the ECB Guideline of 16 July 2004 on the
statistical reporting requirements of the ECB
(ECB/2004/15) 15 and the amending ECB
Guideline of 31 May 2007 (ECB/2007/3) 16.
Additional information regarding the
methodologies and sources used in the euro area
b.o.p. and i.i.p. statistics can be found in the
ECB publication entitled “European Union
balance of payments/international investment
position statistical methods” (May 2007) and in
the reports of the Task Force on Portfolio
Investment Collection Systems (June 2002),
the Task Force on Portfolio Investment Income
(August 2003) and the Task Force on Foreign
Direct Investment (March 2004), all of which
can be downloaded from the ECB’s website.
In addition, a report by the ECB/European
Commission (Eurostat) Task Force on Quality
looking at balance of payments and international
investment position statistics (June 2004) is
available on the website of the Committee on
Monetary, Financial and Balance of Payments
Statistics (www.cmfb.org). The annual quality
report on the euro area b.o.p./i.i.p., which is
based on the Task Force’s recommendations
and follows the basic principles of the ECB
Statistics Quality Framework published in
April 2008, is available on the ECB’s website.
The tables in Sections 7.1 and 7.4 follow
the sign convention in the IMF Balance of
Payments Manual – i.e. surpluses in the current
account and the capital account have a plus
sign, while in the fi nancial account a plus sign
denotes an increase in liabilities or a decrease
in assets. In the tables in Section 7.2, both credit
and debit transactions are presented with a plus
sign. Furthermore, as of the February 2008
issue of the Monthly Bulletin, the tables in
Section 7.3 have been restructured in order to
allow the data on the balance of payments, the
international investment position and related
growth rates to be presented together; in the new
tables, transactions in assets and liabilities that
correspond to increases in positions are shown
with a plus sign.
The euro area b.o.p. is compiled by the ECB.
Recent monthly fi gures should be regarded as
provisional. Data are revised when fi gures for
the following month and/or the detailed quarterly
b.o.p. are published. Earlier data are revised
periodically or as a result of methodological
changes in the compilation of the source data.
Table 1 in Section 7.2 also contains seasonally
adjusted data for the current account. Where
appropriate, the adjustment also covers working
day, leap year and/or Easter-related effects.
Table 3 in Section 7.2 and Table 9 in Section 7.3
present a breakdown of the euro area b.o.p. and
i.i.p. vis-à-vis major partner countries, both
individually and as a group, distinguishing
between EU Member States outside the euro
area and countries or areas outside the European
Union. The breakdown also shows transactions
and positions vis-à-vis EU institutions (which,
with the exception of the ECB, are considered
to be outside the euro area for statistical
purposes, regardless of their physical location)
and, for some purposes, offshore centres and
international organisations. The breakdown does
not cover transactions or positions in portfolio
investment liabilities, fi nancial derivatives or
international reserves. In addition, separate data
are not provided for investment income payable
to Brazil, mainland China, India or Russia.
The geographical breakdown is described in the
article entitled “Euro area balance of payments
and international investment position vis-à-vis
main counterparts” in the February 2005 issue
of the Monthly Bulletin.
OJ L 354, 30.11.2004, p. 34.15
OJ L 159, 20.6.2007, p. 48.16
ECB
Monthly Bulletin
January 2012 S 95
EURO AREASTATISTICS
General Notes
The data on the euro area b.o.p. fi nancial
account and i.i.p. in Section 7.3 are based on
transactions and positions vis-à-vis non-residents
of the euro area, regarding the euro area as
a single economic entity (see also Box 9 in the
December 2002 issue of the Monthly Bulletin,
Box 5 in the January 2007 issue of the Monthly
Bulletin and Box 6 in the January 2008 issue
of the Monthly Bulletin). The i.i.p. is valued
at current market prices, with the exception of
direct investment, where book values are used
for unquoted shares, and other investments
(e.g. loans and deposits). The quarterly
i.i.p. is compiled on the basis of the same
methodological framework as the annual i.i.p.
As some data sources are not available on
a quarterly basis (or are available with a delay),
the quarterly i.i.p. is partly estimated on the
basis of fi nancial transactions, asset prices and
foreign exchange developments.
Table 1 in Section 7.3 summarises the i.i.p. and
fi nancial transactions in the euro area b.o.p.
The breakdown of the change in the annual
i.i.p. is obtained by applying a statistical model
to i.i.p. changes other than transactions, using
information from the geographical breakdown
and currency composition of assets and
liabilities, as well as price indices for different
fi nancial assets. In this table, columns 5 and
6 refer to direct investment by resident units
abroad and direct investment by non-resident
units in the euro area.
In Table 5 in Section 7.3, the breakdown into
“loans” and “currency and deposits” is based on
the sector of the non-resident counterpart – i.e.
assets vis-à-vis non-resident banks are classifi ed
as deposits, whereas assets vis-à-vis other
non-resident sectors are classifi ed as loans. This
breakdown follows the distinction made in other
statistics, such as the MFI consolidated balance
sheet, and conforms to the IMF Balance of
Payments Manual.
The outstanding amounts for the Eurosystem’s
international reserves and related assets and
liabilities are shown in Table 7 of Section 7.3.
These fi gures are not fully comparable with
those in the Eurosystem’s weekly fi nancial
statement owing to differences in coverage
and valuation. The data in Table 7 are in line
with the recommendations for the template on
international reserves and foreign currency
liquidity. By defi nition, the assets included in
the Eurosystem’s international reserves take
account of the changing composition of the
euro area. Before countries join the euro area,
the assets of their national central banks are
included in portfolio investment (in the case of
securities) or other investment (in the case of
other assets). Changes in the gold holdings of the
Eurosystem (column 3) are due to transactions
in gold within the terms of the Central Bank
Gold Agreement of 26 September 1999, which
was updated on 27 September 2009. More
information on the statistical treatment of the
Eurosystem’s international reserves can be found
in a publication entitled “Statistical treatment
of the Eurosystem’s international reserves”
(October 2000), which can be downloaded from
the ECB’s website. The website also contains
more comprehensive data in accordance with the
template on international reserves and foreign
currency liquidity.
The euro area’s gross external debt statistics
in Table 8 of Section 7.3 represent outstanding
actual (rather than contingent) liabilities vis-à-vis
non-euro area residents that require the payment
of principal and/or interest by the debtor at one
or more points in the future. Table 8 shows a
breakdown of gross external debt by instrument
and institutional sector.
Section 7.4 contains a monetary presentation
of the euro area balance of payments, showing
the transactions by non-MFIs that mirror the net
external transactions by MFIs. Included in the
transactions by non-MFIs are b.o.p. transactions
for which a sectoral breakdown is not available.
These concern the current and capital accounts
(column 2) and fi nancial derivatives (column 11).
An up-to-date methodological note on the
monetary presentation of the euro area balance
of payments is available in the “Statistics”
section of the ECB’s website. See also Box 1 in
the June 2003 issue of the Monthly Bulletin.

ECB
Monthly Bulletin
January 2012S 96
Section 7.5 shows data on euro area external
trade in goods. The source is Eurostat. Value data
and volume indices are seasonally and working
day-adjusted. The breakdown by product
group in columns 4 to 6 and 9 to 11 of Table 1
in Section 7.5 is in line with the classifi cation
contained in the Broad Economic Categories
and corresponds to the basic classes of goods in
the System of National Accounts. Manufactured
goods (columns 7 and 12) and oil (column 13)
are in line with the SITC Rev. 4 defi nition. The
geographical breakdown (Table 3 in Section 7.5)
shows major trading partners both individually
and in regional groups. China excludes Hong
Kong. On account of differences in defi nitions,
classifi cation, coverage and time of recording,
external trade data, in particular for imports, are
not fully comparable with the goods item in the
b.o.p. statistics (Sections 7.1 and 7.2). Part of the
difference arises from the inclusion of insurance
and freight services in the recording of imported
goods in external trade data.
Industrial import prices and industrial producer
export prices (or industrial output prices for
the non-domestic market) shown in Table 2
in Section 7.5 were introduced by Regulation
(EC) No 1158/2005 of the European Parliament
and of the Council of 6 July 2005 amending
Council Regulation (EC) No 1165/98, which is
the principal legal basis for short-term statistics.
The industrial import price index covers
industrial products imported from outside the
euro area under sections B to E of the Statistical
Classifi cation of Products by Activity in the
European Economic Community (CPA) and all
institutional import sectors except households,
governments and non-profi t institutions.
It refl ects the cost, insurance and freight price
excluding import duties and taxes, and refers to
actual transactions in euro recorded at the point
when ownership of the goods is transferred.
The industrial producer export prices cover all
industrial products exported directly by euro
area producers to the extra-euro area market
under sections B to E of NACE Revision 2.
Exports from wholesalers and re-exports are
not covered. The indices refl ect the free on
board price expressed in euro and calculated
at the euro area frontier, including any indirect
taxes except VAT and other deductible taxes.
Industrial import prices and industrial producer
export prices are available by Main Industrial
Grouping as defi ned by Commission Regulation
(EC) No 656/2007 of 14 June 2007. For more
details, see Box 11 in the December 2008 issue
of the Monthly Bulletin.
EXCHANGE RATES
Section 8.1 shows nominal and real effective
exchange rate indices for the euro, which are
calculated by the ECB on the basis of weighted
averages of the euro’s bilateral exchange rates
against the currencies of the selected trading
partners of the euro area. A positive change
denotes an appreciation of the euro. Weights
are based on trade in manufactured goods with
those trading partners in the periods 1995-1997,
1998-2000, 2001-2003 and 2004-2006, and are
calculated to account for third-market effects.
The EER indices are obtained by chain-linking
the indicators based on each of these four sets
of trade weights at the end of each three-year
period. The base period of the resulting EER
index is the fi rst quarter of 1999. The EER-20
group of trading partners is composed of the 10
non-euro area EU Member States plus Australia,
Canada, China, Hong Kong, Japan, Norway,
Singapore, South Korea, Switzerland and the
United States. The EER-40 group comprises the
EER-20 plus the following countries: Algeria,
Argentina, Brazil, Chile, Croatia, Iceland,
India, Indonesia, Israel, Malaysia, Mexico,
Morocco, New Zealand, the Philippines, Russia,
South Africa, Taiwan, Thailand, Turkey and
Venezuela. Real EERs are calculated using
consumer price indices, producer price indices,
gross domestic product defl ators and unit labour
costs, both for the manufacturing sector and for
the total economy.
For more detailed information on the calculation
of the EERs, see the relevant methodological
note and ECB Occasional Paper No 2

ECB
Monthly Bulletin
January 2012 S 97
EURO AREASTATISTICS
General Notes
(“The effective exchange rates of the euro”
by Luca Buldorini, Stelios Makrydakis and
Christian Thimann, February 2002), which can
be downloaded from the ECB’s website.
The bilateral rates shown in Section 8.2 are
monthly averages of those published daily as
reference rates for these currencies.
DEVELOPMENTS OUTSIDE THE EURO AREA
Statistics on other EU Member States
(Section 9.1) follow the same principles as data
relating to the euro area. As a result, data on
current and capital accounts and gross external
debt include special-purpose vehicles. The data
for the United States and Japan contained in
Section 9.2 are obtained from national sources.


ECB
Monthly Bulletin
January 2012
14 JANUARY AND 4 FEBRUARY 2010
The Governing Council of the ECB decides
that the interest rate on the main refi nancing
operations and the interest rates on the marginal
lending facility and the deposit facility will
remain unchanged at 1.00%, 1.75% and 0.25%
respectively.
4 MARCH 2010
The Governing Council of the ECB decides
that the interest rate on the main refi nancing
operations and the interest rates on the marginal
lending facility and the deposit facility will
remain unchanged at 1.00%, 1.75% and 0.25%
respectively. It also decides on the details as
regards the tender procedures and modalities
to be applied in its refi nancing operations
up to 12 October 2010, including a return to
variable rate tender procedures in the regular
three-month longer-term refi nancing operations,
starting with the operation to be allotted
on 28 April 2010.
8 APRIL AND 6 MAY 2010
The Governing Council of the ECB decides
that the interest rate on the main refi nancing
operations and the interest rates on the marginal
lending facility and the deposit facility will
remain unchanged at 1.00%, 1.75% and 0.25%
respectively.
10 MAY 2010
The Governing Council of the ECB decides
on several measures to address severe tensions
in fi nancial markets. In particular, it decides
to conduct interventions in the euro area
public and private debt securities markets
(Securities Markets Programme) and to adopt a
fi xed rate tender procedure with full allotment in
the regular three-month longer-term refi nancing
operations in May and June 2010.
10 JUNE 2010
The Governing Council of the ECB decides that the
interest rate on the main refi nancing operations and
the interest rates on the marginal lending facility
and the deposit facility will remain unchanged at
1.00%, 1.75% and 0.25% respectively. In addition,
it decides to adopt a fi xed rate tender procedure
with full allotment in the regular three-month
longer-term refi nancing operations to be allotted
during the third quarter of 2010.
8 JULY AND 5 AUGUST 2010
The Governing Council of the ECB decides that the
interest rate on the main refi nancing operations and
the interest rates on the marginal lending facility
and the deposit facility will remain unchanged at
1.00%, 1.75% and 0.25% respectively.
2 SEPTEMBER 2010
The Governing Council of the ECB decides
that the interest rate on the main refi nancing
operations and the interest rates on the marginal
lending facility and the deposit facility will
remain unchanged at 1.00%, 1.75% and 0.25%
respectively. It also decides on the details as
regards the tender procedures and modalities to
be applied in its refi nancing operations up to 11
January 2011, notably the adoption of a fi xed
rate tender procedure with full allotment in the
three-month longer-term refi nancing operations.
7 OCTOBER AND 4 NOVEMBER 2010
The Governing Council of the ECB decides
that the interest rate on the main refi nancing
operations and the interest rates on the marginal
lending facility and the deposit facility will
remain unchanged at 1.00%, 1.75% and 0.25%
respectively.
I
ANNEXES
CHRONOLOGY OF MONETARY POLICY MEASURES OF THE EUROSYSTEM1
The chronology of monetary policy measures taken by the 1
Eurosystem between 1999 and 2009 can be found in the ECB’s
Annual Report for the respective years.

ECB
Monthly Bulletin
January 2012II
2 DECEMBER 2010
The Governing Council of the ECB decides
that the interest rate on the main refi nancing
operations and the interest rates on the marginal
lending facility and the deposit facility will
remain unchanged at 1.00%, 1.75% and 0.25%
respectively. It also decides on the details as
regards the tender procedures and modalities
to be applied in its refi nancing operations up
to 12 April 2011, notably to continue its fi xed
rate tender procedures with full allotment.
13 JANUARY AND 3 FEBRUARY 2011
The Governing Council of the ECB decides
that the interest rate on the main refi nancing
operations and the interest rates on the marginal
lending facility and the deposit facility will
remain unchanged at 1.00%, 1.75% and 0.25%
respectively.
3 MARCH 2011
The Governing Council of the ECB decides
that the interest rate on the main refi nancing
operations and the interest rates on the marginal
lending facility and the deposit facility will
remain unchanged at 1.00%, 1.75% and 0.25%
respectively. It also decides on the details as
regards the tender procedures and modalities
to be applied in its refi nancing operations up to
12 July 2011, notably to continue its fi xed rate
tender procedures with full allotment.
7 APRIL 2011
The Governing Council of the ECB decides
to increase the interest rate on the main
refi nancing operations by 25 basis points to
1.25%, starting from the operation to be settled
on 13 April 2011. In addition, it decides to
increase the interest rates on both the marginal
lending facility and the deposit facility by 25
basis points, to 2.00% and 0.50% respectively,
both with effect from 13 April 2011.
5 MAY 2011
The Governing Council of the ECB decides
that the interest rate on the main refi nancing
operations and the interest rates on the marginal
lending facility and the deposit facility will
remain unchanged at 1.25%, 2.00% and 0.50%
respectively.
9 JUNE 2011
The Governing Council of the ECB decides
that the interest rate on the main refi nancing
operations and the interest rates on the marginal
lending facility and the deposit facility will
remain unchanged at 1.25%, 2.00% and 0.50%
respectively. It also decides on the details as
regards the tender procedures and modalities
to be applied in its refi nancing operations up to
11 October 2011, notably to continue its fi xed
rate tender procedures with full allotment.
7 JULY 2011
The Governing Council of the ECB decides to
increase the interest rate on the main refi nancing
operations by 25 basis points to 1.50%, starting
from the operation to be settled on 13 July 2011. In
addition, it decides to increase the interest rates on
both the marginal lending facility and the deposit
facility by 25 basis points, to 2.25% and 0.75%
respectively, both with effect from 13 July 2011.
4 AUGUST 2011
The Governing Council of the ECB decides
that the interest rate on the main refi nancing
operations and the interest rates on the marginal
lending facility and the deposit facility will
remain unchanged at 1.50%, 2.25% and
0.75% respectively. It also decides on several
measures to address renewed tensions in some
fi nancial markets. In particular, it decides that the
Eurosystem will conduct a liquidity-providing
supplementary longer-term refi nancing operation
with a maturity of approximately six months as a
ECB
Monthly Bulletin
January 2012
CHRONOLOGY
III
fi xed rate tender procedure with full allotment.
It also decides on the details as regards the tender
procedures and modalities to be applied in its
refi nancing operations up to 17 January 2012,
notably to continue its fi xed rate tender
procedures with full allotment.
8 SEPTEMBER 2011
The Governing Council of the ECB decides
that the interest rate on the main refi nancing
operations and the interest rates on the marginal
lending facility and the deposit facility will
remain unchanged at 1.50%, 2.25% and 0.75%
respectively.
6 OCTOBER 2011
The Governing Council of the ECB decides
that the interest rate on the main refi nancing
operations and the interest rates on the marginal
lending facility and the deposit facility will
remain unchanged at 1.50%, 2.25% and 0.75%
respectively. It also decides on the details of its
refi nancing operations from October 2011 to
10 July 2012, notably to conduct two longer-
term refi nancing operations – one with a maturity
of approximately 12 months in October 2011,
and another with a maturity of approximately
13 months in December 2011 – and to continue
to apply fi xed rate tender procedures with full
allotment in all of its refi nancing operations.
In addition, the Governing Council decides to
launch a new covered bond purchase programme
in November 2011.
3 NOVEMBER 2011
The Governing Council of the ECB decides
to decrease the interest rate on the main
refi nancing operations by 25 basis points to
1.25%, starting from the operation to be settled
on 9 November 2011. In addition, it decides to
decrease the interest rates on both the marginal
lending facility and the deposit facility by
25 basis points, to 2.00% and 0.50% respectively,
both with effect from 9 November 2011.
8 DECEMBER 2011
The Governing Council of the ECB decides
to decrease the interest rate on the main
refi nancing operations by 25 basis points to
1.00%, starting from the operation to be settled
on 14 December 2011. In addition, it decides to
decrease the interest rates on both the marginal
lending facility and the deposit facility by
25 basis points, to 1.75% and 0.25% respectively,
both with effect from 14 December 2011.
It also decides to adopt further non-standard
measures, notably: (i) to conduct two longer-
term refi nancing operations with a maturity
of approximately three years; (ii) to increase
the availability of collateral; (iii) to reduce the
reserve ratio to 1%; and (iv) to discontinue, for
the time being, the fi ne-tuning operations carried
out on the last day of each maintenance period.
12 JANUARY 2012
The Governing Council of the ECB decides
that the interest rate on the main refi nancing
operations and the interest rates on the marginal
lending facility and the deposit facility will
remain unchanged at 1.00%, 1.75% and 0.25%
respectively.


ECB
Monthly Bulletin
January 2012
The ECB produces a number of publications which provide information about its core activities:
monetary policy, statistics, payment and securities settlement systems, fi nancial stability and
supervision, international and European cooperation, and legal matters. These include the
following:
STATUTORY PUBLICATIONS
Annual Report –
Convergence Report –
Monthly Bulletin –
RESEARCH PAPERS
Legal Working Paper Series –
Occasional Paper Series –
Research Bulletin –
Working Paper Series –
OTHER/TASK-RELATED PUBLICATIONS
Enhancing monetary analysis –
Financial integration in Europe –
Financial Stability Review –
Statistics Pocket Book –
The European Central Bank: history, role and functions –
The international role of the euro –
The implementation of monetary policy in the euro area (“General Documentation”) –
The monetary policy of the ECB –
The payment system –
The ECB also publishes brochures and information materials on a variety of topics, such as the euro
banknotes and coins, as well as seminar and conference proceedings.
For a complete list of documents (in PDF format) published by the ECB and the European
Monetary Institute, the ECB’s forerunner from 1994 to 1998, please visit the ECB’s website at
http://www.ecb.europa.eu/pub/. Language codes indicate the languages in which each publication
is available.
Unless otherwise indicated, hard copies can be obtained or subscribed to free of charge, stock
permitting, by contacting [email protected]
PUBLICATIONS PRODUCED BY THE EUROPEAN CENTRAL BANK
V


ECB
Monthly Bulletin
January 2012
GLOSSARY
This glossary contains selected items that are frequently used in the Monthly Bulletin. A more
comprehensive and detailed glossary can be found on the ECB’s website (www.ecb.europa.eu/
home/glossary/html/index.en.html).
Autonomous liquidity factors: liquidity factors that do not normally stem from the use of monetary
policy instruments. Such factors are, for example, banknotes in circulation, government deposits
with the central bank and the net foreign assets of the central bank.
Balance of payments (b.o.p.): a statistical statement that summarises, for a specifi c period of
time, the economic transactions of an economy with the rest of the world.
Bank lending survey (BLS): a quarterly survey on lending policies that has been conducted by
the Eurosystem since January 2003. It addresses qualitative questions on developments in credit
standards, terms and conditions of loans and loan demand for both enterprises and households to a
predefi ned sample group of banks in the euro area.
Borrowing requirement (general government): net incurrence of debt by the general
government.
Break-even inflation rate: the spread between the yield on a nominal bond and that on an infl ation-
linked bond of the same (or as similar as possible) maturity.
Capital account: a b.o.p. account that covers all capital transfers and acquisitions/disposals of
non-produced, non-fi nancial assets between residents and non-residents.
Capital accounts: part of the system of national (or euro area) accounts consisting of the change in
net worth that is due to net saving, net capital transfers and net acquisitions of non-fi nancial assets.
Central parity (or central rate): the exchange rate of each ERM II member currency vis-à-vis the
euro, around which the ERM II fl uctuation margins are defi ned.
Compensation per employee or per hour worked: the total remuneration, in cash or in kind, that
is payable by employers to employees, i.e. gross wages and salaries, as well as bonuses, overtime
payments and employers’ social security contributions, divided by the total number of employees
or by the total number of employees’ hours worked.
Consolidated balance sheet of the MFI sector: a balance sheet obtained by netting out
inter-MFI positions (e.g. inter-MFI loans and deposits) in the aggregated MFI balance sheet.
It provides statistical information on the MFI sector’s assets and liabilities vis-à-vis residents of the
euro area not belonging to this sector (i.e. the general government and other euro area residents)
and vis-à-vis non-euro area residents. It is the main statistical source for the calculation of monetary
aggregates, and it provides the basis for the regular analysis of the counterparts of M3.
Collateral: assets pledged or transferred in some form as a guarantee for the repayment of
loans, as well as assets sold under repurchase agreements. Collateral used in Eurosystem reverse
transactions must fulfi l certain eligibility criteria.
Current account: a b.o.p. account that covers all transactions in goods and services, income and
current transfers between residents and non-residents.
VII
ECB
Monthly Bulletin
January 2012
Current transfers account: a technical b.o.p. account in which the value of real resources or
fi nancial items is recorded when these are transferred without receiving anything in exchange.
Current transfers cover all transfers that are not capital transfers.
Debt (financial accounts): loans taken out by households, as well as the loans, debt securities and
pension fund reserves (resulting from employers’ direct pension commitments on behalf of their
employees) of non-fi nancial corporations, valued at market prices at the end of the period.
Debt (general government): the gross debt (currency and deposits, loans and debt securities) at
nominal value outstanding at the end of the year and consolidated between and within the sectors of
general government.
Debt security: a promise on the part of the issuer (i.e. the borrower) to make one or more
payment(s) to the holder (the lender) on a specifi ed future date or dates. Such securities usually
carry a specifi c rate of interest (the coupon) and/or are sold at a discount to the amount that will
be repaid at maturity. Debt securities issued with an original maturity of more than one year are
classifi ed as long-term.
Debt-to-GDP ratio (general government): the ratio of general government debt to GDP at
current market prices. It is the subject of one of the fi scal criteria laid down in Article 126(2) of the
Treaty on the Functioning of the European Union to defi ne the existence of an excessive defi cit.
Deficit (general government): the general government’s net borrowing, i.e. the difference between
total government revenue and total government expenditure.
Deficit-debt adjustment (general government): the difference between the general government
defi cit and the change in general government debt.
Deficit ratio (general government): the ratio of the general government defi cit to GDP at current
market prices. It is the subject of one of the fi scal criteria laid down in Article 126(2) of the Treaty
on the Functioning of the European Union to defi ne the existence of an excessive defi cit. It is also
referred to as the budget defi cit ratio or the fi scal defi cit ratio.
Deflation: a signifi cant and persistent decline in the prices of a very broad set of consumer goods
and services that becomes entrenched in expectations.
Deposit facility: a standing facility of the Eurosystem enabling eligible counterparties to make, on
their own initiative, overnight deposits with the NCB in their respective jurisdiction. Deposits are
remunerated at a pre-specifi ed rate that normally provides a fl oor for overnight market interest rates.
Disinflation: a process of decelerating infl ation that may lead to negative infl ation rates of a
temporary nature.
Direct investment: cross-border investment for the purpose of obtaining a lasting interest in an
enterprise resident in another economy (assumed, in practice, for ownership of at least 10% of
the ordinary shares or voting power). Included are equity capital, reinvested earnings and other
capital associated with inter-company operations. The direct investment account records net
transactions/positions in assets abroad by euro area residents (as “direct investment abroad”) and net
transactions/positions in euro area assets by non-residents (as “direct investment in the euro area”).
VIII

ECB
Monthly Bulletin
January 2012
GLOSSARY
Effective exchange rates (EERs) of the euro (nominal/real): weighted averages of bilateral
euro exchange rates against the currencies of the euro area’s main trading partners. The EER indices
of the euro are calculated against different groups of trading partners: the EER-20 comprises the
ten non-euro area EU Member States and ten trading partners outside the EU, and the EER-40
encompasses the EER-20 and 20 additional countries. The weights used refl ect the share of each
partner country in the euro area’s trade in manufactured goods and account for competition in
third markets. Real EERs are nominal EERs defl ated by a weighted average of foreign, relative to
domestic, prices or costs. They are thus measures of price and cost competitiveness.
Enhanced credit support: the non-standard measures taken by the ECB/Eurosystem during the
fi nancial crisis with a view to supporting fi nancing conditions and credit fl ows above and beyond
what could be achieved through reductions in key ECB interest rates alone.
EONIA (euro overnight index average): a measure of the effective interest rate prevailing in
the euro interbank overnight market. It is calculated as a weighted average of the interest rates on
unsecured overnight lending transactions denominated in euro, as reported by a panel of contributing
banks.
Equities: securities representing ownership of a stake in a corporation, e.g. shares traded on stock
exchanges (quoted shares), unquoted shares and other forms of equity. Equities usually produce
income in the form of dividends.
ERM II (exchange rate mechanism II): the exchange rate arrangement that provides the
framework for exchange rate policy cooperation between the euro area countries and the EU
Member States not participating in Stage Three of EMU.
EURIBOR (euro interbank offered rate): the rate at which what is known as a prime bank is
willing to lend funds (denominated in euro) to another prime bank. The EURIBOR is computed
daily, based on the rates of a sample of selected banks, for different maturities of up to 12 months.
Euro area: the area formed by those EU Member States in which the euro has been adopted as the
single currency in accordance with the Treaty on the Functioning of the European Union.
European Commission surveys: harmonised surveys of business and/or consumer sentiment
conducted on behalf of the European Commission in each of the EU Member States. Such
questionnaire-based surveys are addressed to managers in the manufacturing, construction, retail
and services industries, as well as to consumers. From each monthly survey, composite indicators
are calculated that summarise the replies to a number of different questions in a single indicator
(confi dence indicators).
Eurosystem: the central banking system made up of the ECB and the NCBs of those EU Member
States whose currency is the euro.
Eurozone Purchasing Managers’ Surveys: surveys of business conditions in manufacturing and
in services industries conducted for a number of countries in the euro area and used to compile
indices. The Eurozone Manufacturing Purchasing Managers’ Index (PMI) is a weighted indicator
calculated from indices of output, new orders, employment, suppliers’ delivery times and stocks
of purchases. The services sector survey asks questions on business activity, expectations of future
business activity, the amount of business outstanding, incoming new business, employment, input
IX

ECB
Monthly Bulletin
January 2012
prices and prices charged. The Eurozone Composite Index is calculated by combining the results
from the manufacturing and services sector surveys.
External trade in goods: exports and imports of goods with countries outside the euro area,
measured in terms of value and as indices of volume and unit value. External trade statistics are
not comparable with the exports and imports recorded in the national accounts, as the latter include
both intra-euro area and extra-euro area transactions, and also combine goods and services. Nor are
they fully comparable with the goods item in b.o.p. statistics. Besides methodological adjustments,
the main difference is that imports in external trade statistics are recorded including insurance and
freight services, whereas they are recorded free on board in the goods item in the b.o.p. statistics.
Financial account: a b.o.p. account that covers transactions between residents and non-residents in
direct investment, portfolio investment, other investment, fi nancial derivatives and reserve assets.
Financial accounts: part of the system of national (or euro area) accounts showing the fi nancial
positions (stocks or balance sheets), fi nancial transactions and other changes of the different
institutional sectors of an economy by type of fi nancial asset.
Financial vehicle corporation (FVC): an entity whose principal activity is to carry out
securitisation transactions. An FVC typically issues marketable securities that are offered for sale
to the general public, or sold in the form of private placements. These securities are backed by
a portfolio of assets (typically loans) which are held by the FVC. In some cases, a securitisation
transaction may involve a number of FVCs, where one FVC holds the securitised assets and another
issues the securities backed by those assets.
Fixed rate tender: a tender procedure in which the interest rate is specifi ed in advance by the
central bank and in which participating counterparties bid the amount of money they wish to
transact at the fi xed interest rate.
Fixed rate full-allotment tender procedure: a tender procedure in which the interest rate is
pre-specifi ed by the central bank (fi xed rate) and in which counterparties bid the amount of
money they want to transact at that rate, knowing in advance that all their bids will be satisfi ed
(full allotment).
General government: a sector defi ned in the ESA 95 as comprising resident entities that are
engaged primarily in the production of non-market goods and services intended for individual and
collective consumption and/or in the redistribution of national income and wealth. Included are
central, regional and local government authorities as well as social security funds. Excluded are
government-owned entities that conduct commercial operations, such as public enterprises.
Gross domestic product (GDP): the value of an economy’s total output of goods and services less
intermediate consumption, plus net taxes on products and imports. GDP can be broken down by
output, expenditure or income components. The main expenditure aggregates that make up GDP are
household fi nal consumption, government fi nal consumption, gross fi xed capital formation, changes
in inventories, and imports and exports of goods and services (including intra-euro area trade).
Gross external debt: the outstanding amount of an economy’s actual (i.e. non-contingent) current
liabilities that require payment of principal and/or interest to non-residents at some point in the
future.
X
ECB
Monthly Bulletin
January 2012
GLOSSARY
Harmonised Index of Consumer Prices (HICP): a measure of the development of consumer
prices that is compiled by Eurostat and harmonised for all EU Member States.
Hourly labour cost index: a measure of labour costs, including gross wages and salaries (in cash
and in kind, including bonuses) and other labour costs (employers’ social contributions plus
employment-related taxes paid by the employer minus subsidies received by the employer), per
hour actually worked (including overtime).
Implied volatility: the expected volatility (i.e. standard deviation) in the rates of change of the
price of an asset (e.g. a share or a bond). It can be derived from the asset’s price, maturity date and
exercise price of its options, as well as from a riskless rate of return, using an option pricing model
such as the Black-Scholes model.
Income account: a b.o.p. account that covers two types of transactions with non-residents, namely
(i) those involving compensation of employees that is paid to non-resident workers (e.g., cross-
border, seasonal, and other short-term workers) and (ii) those involving investment income receipts
and payments on external fi nancial assets and liabilities, with the latter including receipts and
payments on direct investment, portfolio investment and other investment, as well as receipts on
reserve assets.
Index of negotiated wages: a measure of the direct outcome of collective bargaining in terms of
basic pay (i.e. excluding bonuses) at the euro area level. It refers to the implied average change in
monthly wages and salaries.
Industrial producer prices: factory-gate prices (transportation costs are not included) of
all products sold by industry, excluding construction, on the domestic markets of the euro area
countries, excluding imports.
Industrial production: the gross value added created by industry at constant prices.
Inflation: an increase in the general price level, e.g. in the consumer price index.
Inflation-indexed government bonds: debt securities issued by the general government, the
coupon payments and principal of which are linked to a specifi c consumer price index.
Insurance corporations and pension funds: fi nancial corporations and quasi-corporations that are
engaged primarily in fi nancial intermediation as the consequence of the pooling of risks.
International investment position (i.i.p.): the value and composition of an economy’s outstanding
net fi nancial claims on (or fi nancial liabilities to) the rest of the world.
International reserves: external assets readily available to and controlled by monetary authorities
for directly fi nancing or regulating the magnitude of payment imbalances through intervention in
exchange markets. The international reserves of the euro area comprise non-euro-denominated
claims on non-euro area residents, gold, special drawing rights and the reserve positions in the IMF
which are held by the Eurosystem.
Investment funds (except money market funds): fi nancial institutions that pool capital raised
from the public and invest it in fi nancial and non-fi nancial assets. See also MFIs.
XI

ECB
Monthly Bulletin
January 2012
Job vacancies: a collective term covering newly created jobs, unoccupied jobs or jobs about to
become vacant in the near future, for which the employer has recently taken active steps to fi nd a
suitable candidate.
Key ECB interest rates: the interest rates, set by the Governing Council, which refl ect the
monetary policy stance of the ECB. They are the rates at the main refi nancing operations, on the
marginal lending facility and on the deposit facility.
Labour force: the sum total of persons in employment and the number of unemployed.
Labour productivity: the output that can be produced with a given input of labour. It can be
measured in several ways, but is commonly measured as GDP (volume) divided by either total
employment or total hours worked.
Liquidity-absorbing operation: an operation through which the Eurosystem absorbs liquidity
in order to reduce excess liquidity, or to create a shortage of liquidity. Such operations can be
conducted by issuing debt certifi cates or fi xed-term deposits.
Longer-term refinancing operation (LTRO): an open market operation with a maturity of more
than one week that is executed by the Eurosystem in the form of a reverse transaction. The regular
monthly operations have a maturity of three months. During the fi nancial market turmoil that started
in August 2007, supplementary operations with maturities ranging from one maintenance period to
36 months were conducted, the frequency of which varied.
M1: a narrow monetary aggregate that comprises currency in circulation plus overnight deposits
held with MFIs and central government (e.g. at the post offi ce or treasury).
M2: an intermediate monetary aggregate that comprises M1 plus deposits redeemable at a period
of notice of up to and including three months (i.e. short-term savings deposits) and deposits with an
agreed maturity of up to and including two years (i.e. short-term time deposits) held with MFIs and
central government.
M3: a broad monetary aggregate that comprises M2 plus marketable instruments, in particular
repurchase agreements, money market fund shares and units, and debt securities with a maturity of
up to and including two years issued by MFIs.
Main refinancing operation (MRO): a regular open market operation executed by the Eurosystem
in the form of reverse transactions. Such operations are carried out through a weekly standard tender
and normally have a maturity of one week.
Marginal lending facility: a standing facility of the Eurosystem enabling eligible counterparties,
on their own initiative, to receive overnight credit from the NCB in their jurisdiction at a
pre-specifi ed rate in the form of a reverse transaction. The rate on loans extended within the scope of
the marginal lending facility normally provides an upper bound for overnight market interest rates.
MFI credit to euro area residents: MFI loans granted to non-MFI euro area residents (including
general government and the private sector) and MFI holdings of securities (shares, other equity and
debt securities) issued by non-MFI euro area residents.
XII

ECB
Monthly Bulletin
January 2012
GLOSSARY
MFI interest rates: the interest rates that are applied by resident credit institutions and other MFIs,
excluding central banks and money market funds, to euro-denominated deposits and loans vis-à-vis
households and non-fi nancial corporations resident in the euro area.
MFI longer-term financial liabilities: deposits with an agreed maturity of over two years,
deposits redeemable at a period of notice of over three months, debt securities issued by euro area
MFIs with an original maturity of more than two years and the capital and reserves of the euro area
MFI sector.
MFI net external assets: the external assets of the euro area MFI sector (such as gold, foreign
currency banknotes and coins, securities issued by non-euro area residents and loans granted to
non-euro area residents) minus the external liabilities of the euro area MFI sector (such as non-euro
area residents’ deposits and repurchase agreements, as well as their holdings of money market fund
shares/units and debt securities issued by MFIs with a maturity of up to and including two years).
MFIs (monetary financial institutions): fi nancial institutions which together form the money-
issuing sector of the euro area. These include (i) the Eurosystem, (ii) resident credit institutions
(as defi ned in EU law), (iii) other fi nancial institutions whose business is to receive deposits
and/or close substitutes for deposits from entities other than MFIs and, for their own account
(at least in economic terms), to grant credit and/or invest in securities, as well as electronic money
institutions that are principally engaged in fi nancial intermediation in the form of issuing electronic
money, and (iv) money market funds, i.e. collective investment undertakings that invest in
short-term and low-risk instruments.
Minimum bid rate: the lower limit to the interest rates at which counterparties may submit bids in
the variable tenders.
Open market operation: a fi nancial market operation executed on the initiative of the central
bank. These operations include reverse transactions, outright transactions as well as the issuance of
fi xed-term deposits or debt certifi cates or foreign exchange swaps. The open market operations can
be liquidity providing or liquidity absorbing.
Other investment: an item in the b.o.p. and the i.i.p. that covers the fi nancial transactions/positions
with non-residents in trade credits, deposits and loans, and other accounts receivable and payable.
Portfolio investment: euro area residents’ net transactions and/or positions in securities issued
by non-residents of the euro area (“assets”) and non-residents’ net transactions and/or positions
in securities issued by euro area residents (“liabilities”). Included are equity securities and debt
securities (bonds and notes, and money market instruments). Transactions are recorded at the
effective price paid or received, less commissions and expenses. To be regarded as a portfolio asset,
ownership in an enterprise must be equivalent to less than 10% of the ordinary shares or voting
power.
Price stability: as defi ned by the Governing Council, a year-on-year increase in the HICP for the
euro area of below 2%. The Governing Council has also made it clear that, in the pursuit of price
stability, it aims to maintain infl ation rates below, but close to, 2% over the medium term.
Purchasing power parity (PPP): the rate at which one currency is converted into another so as
to equalise the purchasing power of the two currencies by eliminating the differences in the price
XIII

ECB
Monthly Bulletin
January 2012
levels prevailing in the countries concerned. In their simplest form, PPPs show the ratio of the
prices in national currency of the same good or service in different countries.
Reference value for M3 growth: the annual growth rate of M3 that is deemed to be compatible
with price stability over the medium term.
Reserve requirement: the requirement for institutions to hold minimum reserves with the central
bank over a maintenance period. Compliance with the requirement is determined on the basis of the
average of the daily balances in the reserve accounts over the maintenance period.
Reverse transaction: an operation whereby the NCB buys or sells assets under a repurchase
agreement or conducts credit operations against collateral.
Securitisation: a transaction or scheme whereby an asset or a pool of cash fl ow-producing assets,
often consisting of loans (mortgages, consumer loans, etc.), is transferred from an originator (usually
a credit institution) to a fi nancial vehicle corporation (FVC). The FVC effectively converts these
assets into marketable securities by issuing debt instruments with principal and interest serviced
through the cash fl ows produced by the asset pool.
Survey of Professional Forecasters (SPF): a quarterly survey that has been conducted by the
ECB since 1999 to collect macroeconomic forecasts on euro area infl ation, real GDP growth and
unemployment from a panel of experts affi liated to fi nancial and non-fi nancial organisations based
in the EU.
Unit labour costs: a measure of total labour costs per unit of output calculated for the euro area as
the ratio of total compensation per employee to labour productivity (defi ned as GDP (volume) per
person employed).
Variable rate tender: a tender procedure where the counterparties bid both the amount of money
they wish to transact with the central bank and the interest rate at which they wish to enter into the
transaction.
Volatility: the degree of fl uctuation in a given variable.
Write-down: a downward adjustment to the value of loans recorded in the balance sheets of MFIs
when it is recognised that the loans have become partly unrecoverable.
Write-off: the removal of the value of loans from the balance sheets of MFIs when the loans are
considered to be totally unrecoverable.
Yield curve: a graphical representation of the relationship between the interest rate or yield and the
residual maturity at a given point in time for suffi ciently homogenous debt securities with different
maturity dates. The slope of the yield curve can be measured as the difference between the interest
rates or yield at two selected maturities.
XIV
