montgomery county maryland€¦ · fiscal year 2015 july 1, 2014 - june 30, ... • an effective...
TRANSCRIPT

MONTGOMERY COUNTYMARYLAND
Comprehensive AnnualFinancial Report
Fiscal Year 2015
July 1, 2014 - June 30, 2015 Rockville, Maryland
Government Finance Officers Association
Certificate of Achievement for Excellence
in Financial Reporting
Presented to
Montgomery County
Maryland
For its Comprehensive Annual Financial Report
for the Fiscal Year Ended
June 30, 2014
Executive Director/CEO
MONTGOMERY COUNTY
MARYLAND
Comprehensive Annual Financial Report
Prepared by the DEPARTMENT OF FINANCE
Joseph F. Beach, Director
101 Monroe Street Rockville, Maryland 20850
240-777-8860
Fiscal Year 2015
July 1, 2014 - June 30, 2015
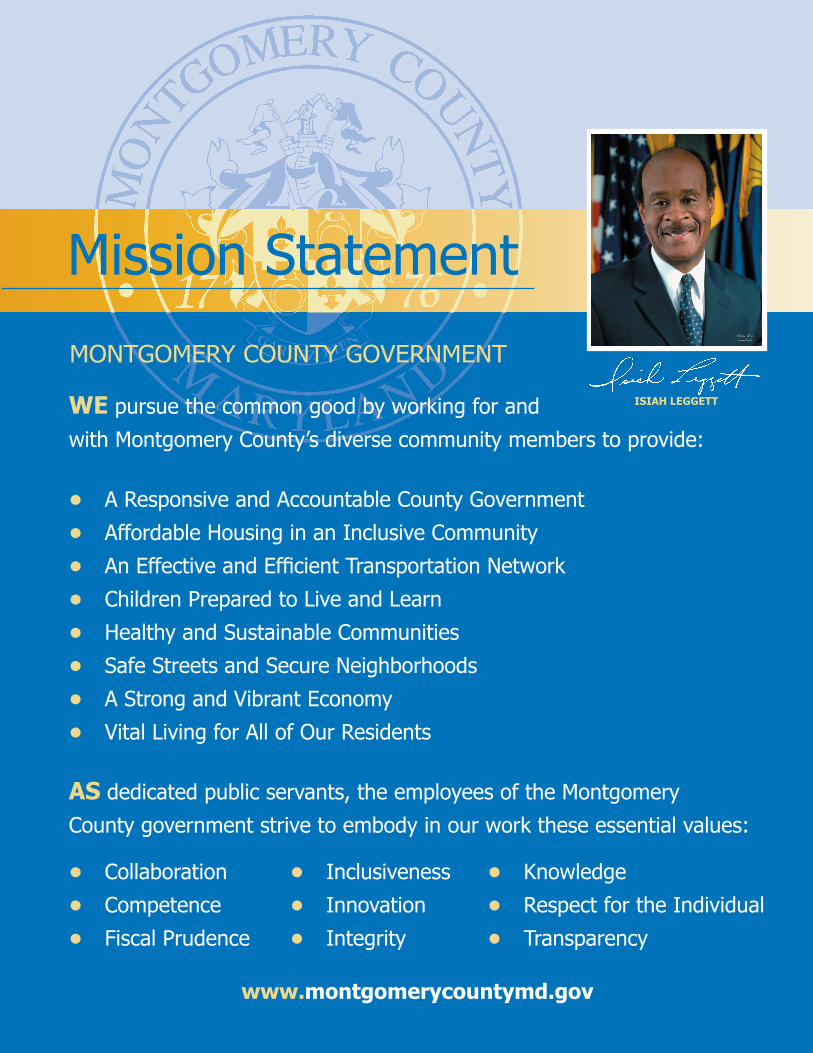
MONTGOMERY COUNTY GOVERNMENT
WE pursue the common good by working for and
with Montgomery County’s diverse community members to provide:
• A Responsive and Accountable County Government
• Affordable Housing in an Inclusive Community
• An Effective and Efficient Transportation Network
• Children Prepared to Live and Learn
• Healthy and Sustainable Communities
• Safe Streets and Secure Neighborhoods
• A Strong and Vibrant Economy
• Vital Living for All of Our Residents
AS dedicated public servants, the employees of the Montgomery
County government strive to embody in our work these essential values:
• Collaboration • Inclusiveness • Knowledge
• Competence • Innovation • Respect for the Individual
• Fiscal Prudence • Integrity • Transparency
www.montgomerycountymd.gov
Mission Statement
ISIAH LEGGETT

Montgomery County, Maryland COMPREHENSIVE ANNUAL FINANCIAL REPORT
Fiscal Year Ended June 30, 2015 TABLE OF CONTENTS
Exhibit Description Page
INTRODUCTORY SECTION Transmittal Letter ............................................................ vii Acknowledgments ........................................................... xvii Organization Chart .......................................................... xviii Listing of Officials .......................................................... xix
FINANCIAL SECTION Independent Auditors’ Report ......................................... 1 Management’s Discussion and Analysis ......................... 3
Basic Financial Statements ........................................... 27
Government-wide: A-1 Statement of Net Position ........................................ 28 A-2 Statement of Activities ............................................. 30
Funds: A-3 Balance Sheet – Governmental Funds ..................... 32 A-4 Reconciliation of the Balance Sheet of Governmental Funds to the Statement of Net Position .................... 33 A-5 Statement of Revenues, Expenditures, and Changes in Fund Balances – Governmental Funds ................ 34 A-6 Reconciliation of the Statement of Revenues, Expenditures, and Changes in Fund Balances of Governmental Funds to the Statement of Activities 35 A-7 Statement of Net Position – Proprietary Funds ........ 36 A-8 Statement of Revenues, Expenses, and Changes in Fund Net Position – Proprietary Funds ................ 38 A-9 Statement of Cash Flows – Proprietary Funds ......... 39 A-10 Statement of Fiduciary Net Position ...................... 40 A-11 Statement of Changes in Fiduciary Net Position .... 41
Component Units: A-12 Statement of Net Position – Component Units ....... 42 A-13 Statement of Activities – Component Units ........... 43
Notes to Financial Statements ...................................... 45
Required Supplementary Information ........................ 129 Schedules of Revenues, Expenditures, and Changes in Fund Balance – Budget and Actual (Non-GAAP Budgetary Basis): RSI-1 General Fund ........................................................ 131 RSI-2 Housing Initiative Special Revenue Fund ............. 138 RSI-3 Grants Special Revenue Fund ............................... 139 RSI-4 Consolidated Retiree Health Benefits Trust .......... 142 RSI-5 Employees’ Retirement System ............................ 143 RSI-6 Maryland State Retirement and Pension System .. 144
Notes to Required Supplementary Information ......... 145
Exhibit Description Page
Supplementary Data ...................................................... 147
Governmental Funds: Combining and Individual Fund Financial Statements and Supplementary Schedules: B-1 Combining Balance Sheet – Nonmajor Governmental Funds ................................................ 151 B-2 Combining Statement of Revenues, Expenditures, and Changes in Fund Balances – Nonmajor Governmental Funds ................................................ 152 B-3 Combining Balance Sheet – Nonmajor Governmental Funds - Special Taxing Districts ....... 153 B-4 Combining Statement of Revenues, Expenditures, and Changes in Fund Balances – Nonmajor Governmental Funds – Special Taxing Districts ...... 154 B-5 Combining Balance Sheet – Nonmajor Governmental Funds – Other ................................... 155 B-6 Combining Statement of Revenues, Expenditures, and Changes in Fund Balances – Nonmajor Governmental Funds – Other ................................... 156
Special Revenue Funds: Schedules of Revenues, Expenditures, and Changes in Fund Balance – Budget and Actual (Non-GAAP Budgetary Basis): B-7 Debt Service ............................................................. 157 B-8 Capital Projects ........................................................ 159 B-9 Recreation ................................................................ 160 B-10 Fire Tax District ..................................................... 161 B-11 Mass Transit Facilities ............................................ 162 B-12 Urban Districts........................................................ 163 B-13 Rehabilitation Loan ................................................ 165 B-14 Economic Development ......................................... 166 B-15 Cable TV ................................................................ 167 B-16 Drug Enforcement Forfeitures ................................ 168 B-17 Water Quality Protection ........................................ 169 B-18 Restricted Donations .............................................. 170
Enterprise Funds: C-1 Combining Statement of Net Position – Nonmajor Enterprise Funds ....................................................... 173 C-2 Combining Statement of Revenues, Expenses, and Changes in Net Position – Nonmajor Enterprise Funds ....................................................... 174 C-3 Combining Statement of Cash Flows – Nonmajor Enterprise Funds ....................................................... 175 C-4 Schedule of Expenses – Budget and Actual – Enterprise Funds (Non-GAAP Budgetary Basis) ..... 176
Internal Service Funds: D-1 Combining Statement of Net Position – Internal Service Funds ........................................................... 183 D-2 Combining Statement of Revenues, Expenses, and Changes in Net Position – Internal Service Funds ... 184

Exhibit Description Page
Supplementary Data, Continued D-3 Combining Statement of Cash Flows – Internal Service Funds ........................................................... 185 D-4 Schedule of Expenses – Budget and Actual – Internal Service Funds (Non-GAAP Budgetary Basis) ........................................................................ 186
Fiduciary Funds: E-1 Combining Statement of Fiduciary Net Position – Pension and Other Employee Benefit Trust Funds ........................................................................ 189 E-2 Combining Statement of Changes in Fiduciary Net Positions – Pension and Other Employee Benefit Trust Funds ............................................................... 190 E-3 Combining Statement of Fiduciary Net Position – Private Purpose Trust Funds ..................................... 191 E-4 Combining Statement of Changes in Fiduciary Net Position – Private Purpose Trust Funds ............. 192 E-5 Combining Statement of Changes in Assets and Liabilities – All Agency Funds ................................ 193
Nonmajor Component Units: F-1 Combining Statement of Net Position – Nonmajor Component Units ...................................................... 197 F-2 Combining Statement of Activities – Nonmajor Component Units ...................................................... 198
STATISTICAL SECTION
Tables:
Financial Trends: 1 Net Position by Component – Government-Wide (Governmental and Business-type Activities) – Last Ten Fiscal Years ............................................... 203 2-a Changes in Net Position – Government-Wide (Governmental and Business-type Activities) – Last Ten Fiscal Years ............................................... 204 2-b General Tax Revenues – Governmental Activities – Last Ten Fiscal Years ............................................... 206 3 Fund Balances – Governmental Funds – Last Ten Fiscal Years .............................................................. 207 4 Changes in Fund Balances – Governmental Funds – Last Ten Fiscal Years ............................................... 208 5 Combined Schedule of Cash and Investments and
Investment and Interest Income – All Funds ............ 210 6 Combined Schedule of Cash and Investments – By Financial Institution ............................................ 211 7 Combined Schedule of Investments ......................... 212
Revenue Capacity: 8 Assessed and Estimated Actual Value of Taxable Property – Last Ten Fiscal Years ................ 213
Exhibit Description Page
9-a Real and Personal Property Tax Rates – County Direct Rate – Last Ten Fiscal Years ........................ 214 9-b Real and Personal Property Tax Rates – County Special Taxing Districts – Last Ten Fiscal Years .... 215 9-c Real and Personal Property Tax Rates – Overlapping Governments – Cities and Towns – Last Ten Fiscal Years .............................................. 216 9-d Real and Personal Property Tax Rates – Overlapping Governments – Villages – Last Ten Fiscal Years ............................................................. 217 10 Ten Highest Commercial Property Taxpayers – Current Fiscal Year and Nine Years Ago ................ 218 11 Property Tax Levies and Collections – Last Ten Fiscal Years ............................................................. 219 12 Schedule of Fiscal Year Property Tax Levy, Property Tax Revenues, and Additional Items Related to the Property Tax Billing ......................... 220 13 Schedule of Property Taxes Receivable by Fund Type ......................................................................... 221 14 Income Tax Rates – Last Ten Tax Years ................. 222 15 Income Tax Filers Summary Information – Last Ten Tax Years ......................................................... 223 16 Income Tax Filers, Net Taxable Income, and Liability by Adjusted Gross Income Level – Last Ten Tax Years………… ......................................... 224
Debt Capacity: 17 Ratios of Outstanding Debt by Type – Last Ten Fiscal Years ............................................................. 226 18 Ratios of General Bonded Debt Outstanding – Last Ten Fiscal Years .............................................. 227 19 Direct and Overlapping Governmental Activities Debt ......................................................................... 228 20 Computation of Legal Debt Margin – Last Ten Fiscal Years ............................................................. 229 21 Pledged-Revenue Coverage – Last Ten Fiscal Years ........................................................................ 230
Demographic and Economic Information: 22 Principal Employers – Current Fiscal Year and Nine Years Ago ....................................................... 231 23 Demographic Statistics – Last Ten Years ................ 232
Operating Information: 24 Employee FTEs by Function – Last Ten Fiscal Years ............................................................. 233 25 Operating Indicators by Function – Last Ten Fiscal Years ............................................................. 234 26 Capital Asset Statistics by Function – Last Ten Fiscal Years ............................................................. 235
Index .............................................................................. 237

iNTRODUCTORY SECTION


Office of the Director
101 Monroe Street, 8th Floor · Rockville, Maryland 20850 · (240) 777-8860 www.montgomerycountymd.gov
DEPARTMENT OF FINANCE
Isiah Leggett Joseph F. Beach County Executive Director
December 16, 2015
Honorable County Executive, Members of the Montgomery County Council, Chief Administrative Officer, and Citizens of Montgomery County Ladies and Gentlemen:
I am pleased to present the Comprehensive Annual Financial Report (CAFR) of Montgomery County, Maryland (the County) for the fiscal year ended June 30, 2015.
FORMAL TRANSMITTAL OF THE CAFR
This report, presented in conformity with accounting principles generally accepted in the United States of America (GAAP), was prepared by the County’s Department of Finance in cooperation with the finance departments of the County’s component unit and joint venture organizations. The CAFR has been prepared pursuant to the provisions of Article 2, Section 214 of the Charter of the County, and includes the independent auditors’ opinion, issued by the County Council appointed independent public accounting firm, as provided by Article 3, Section 315 of the County Charter.
The County is responsible for the completeness and fairness of the information and disclosures presented in this report. We believe the information presented is complete and accurate in all material respects, and that it fairly presents the County’s financial position and results of operations. To provide a reasonable basis for making these representations, management of the County has established a comprehensive framework of internal controls. Because the cost of internal controls should not exceed the anticipated benefits, the objective is to provide reasonable, rather than absolute, assurance that the financial statements are free of any material misstatement.
The public accounting firm of CliftonLarsonAllen, LLP has performed an independent audit of, and issued an unmodified opinion on, the County’s financial statements as of and for the year ended June 30, 2015. The independent auditors’ report is located at the front of the financial section of this report. This independent audit of the County’s financial statements was part of a broader, federally mandated “Single Audit” designed to meet the special needs of federal grantor agencies. The independent auditors’ reports associated with the Single Audit are available in a separately issued Report on Expenditures of Federal Awards.
GAAP requires that management provide a narrative introduction, overview, and analysis to accompany the basic financial statements in the form of Management’s Discussion and Analysis (MD&A). This letter of transmittal is designed to complement and be reviewed in conjunction with the MD&A. The MD&A can be found immediately following the report of the independent auditors.
viii
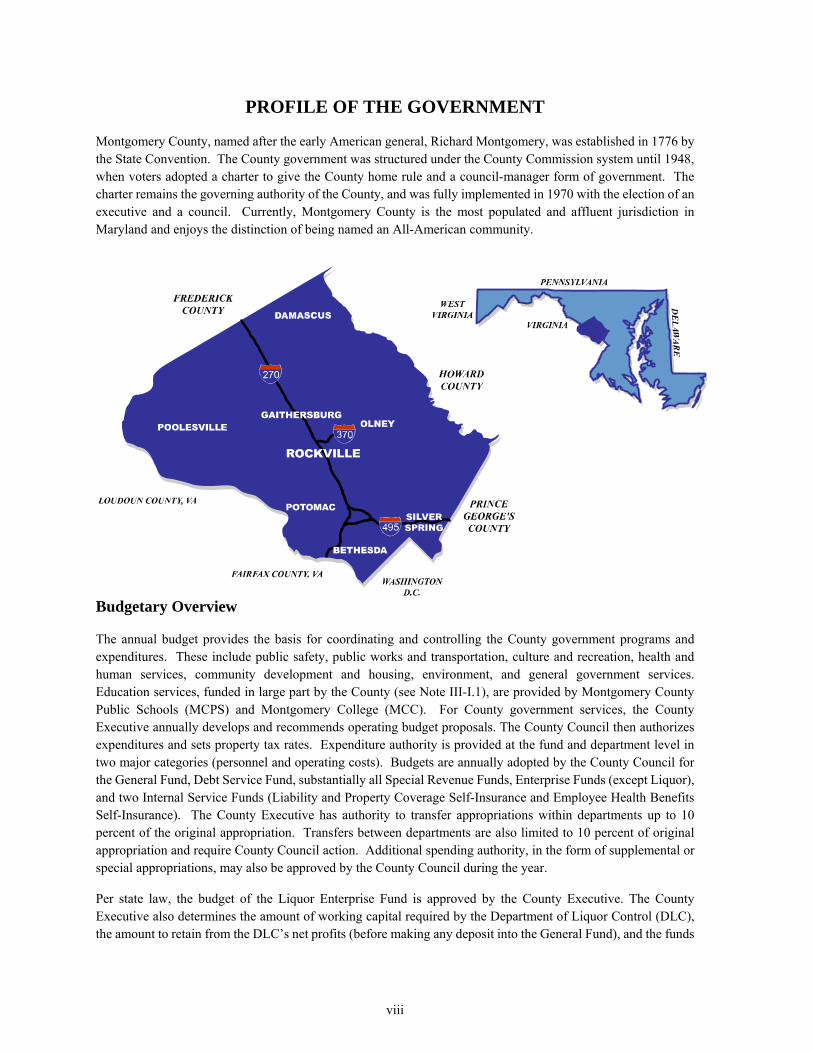
PROFILE OF THE GOVERNMENT
Montgomery County, named after the early American general, Richard Montgomery, was established in 1776 by the State Convention. The County government was structured under the County Commission system until 1948, when voters adopted a charter to give the County home rule and a council-manager form of government. The charter remains the governing authority of the County, and was fully implemented in 1970 with the election of an executive and a council. Currently, Montgomery County is the most populated and affluent jurisdiction in Maryland and enjoys the distinction of being named an All-American community.
Budgetary Overview
The annual budget provides the basis for coordinating and controlling the County government programs and expenditures. These include public safety, public works and transportation, culture and recreation, health and human services, community development and housing, environment, and general government services. Education services, funded in large part by the County (see Note III-I.1), are provided by Montgomery County Public Schools (MCPS) and Montgomery College (MCC). For County government services, the County Executive annually develops and recommends operating budget proposals. The County Council then authorizes expenditures and sets property tax rates. Expenditure authority is provided at the fund and department level in two major categories (personnel and operating costs). Budgets are annually adopted by the County Council for the General Fund, Debt Service Fund, substantially all Special Revenue Funds, Enterprise Funds (except Liquor), and two Internal Service Funds (Liability and Property Coverage Self-Insurance and Employee Health Benefits Self-Insurance). The County Executive has authority to transfer appropriations within departments up to 10 percent of the original appropriation. Transfers between departments are also limited to 10 percent of original appropriation and require County Council action. Additional spending authority, in the form of supplemental or special appropriations, may also be approved by the County Council during the year.
Per state law, the budget of the Liquor Enterprise Fund is approved by the County Executive. The County Executive also determines the amount of working capital required by the Department of Liquor Control (DLC), the amount to retain from the DLC’s net profits (before making any deposit into the General Fund), and the funds

ix
necessary to service DLC-related debt and provide adequate working capital. The Capital Projects Fund budget is appropriated at the project level on an annual basis with an annual unencumbered re-appropriation. The County Council approves the six year Capital Improvements Program (CIP) on a biennial basis with opportunities for limited amendments in the intervening years.
Budget-to-actual comparison schedules (statements) for major funds are presented in Exhibits RSI-1 to RSI-3 as part of the Required Supplementary Information section of this annual report. Non-major funds are presented in the Supplementary Data section of the report.
The Reporting Entity
The following organizations are included as component units in the accompanying financial statements: MCPS, MCC, Housing Opportunities Commission of Montgomery County (HOC), Montgomery County Revenue Authority (MCRA), and the Bethesda Urban Partnership, Inc. (BUPI). The County’s participation in the following joint ventures and jointly governed organization is also disclosed in the Notes to the Financial Statements (see Note IV-D): Maryland-National Capital Park and Planning Commission, Washington Suburban Sanitary Commission, Washington Suburban Transit Commission, Washington Metropolitan Area Transit Authority, Northeast Maryland Waste Disposal Authority, and Metropolitan Washington Council of Governments. Copies of the respective independently audited annual financial reports required by State or County law are available from the above mentioned component units, joint ventures, and jointly governed organizations.
INFORMATION USEFUL IN ASSESSING THE COUNTY’S ECONOMIC CONDITION
The information presented in the financial statements is best understood in conjunction with the broader perspective of Montgomery County’s economic environment.
The Local Economy
Montgomery County experienced an improved economic performance during fiscal year (FY) 2015 compared to the mixed economic performance in FY14. On a fiscal year basis, the major reasons for the improvement were increases in payroll employment (1.1%) and in resident employment (0.7%). Other economic indicators improved during FY15 as well. The unemployment rate declined from 4.4 percent in FY14 to 4.0 percent in FY15, and sales of existing homes increased 3.1% from 10,817 in FY14 to 11,150 in FY15. Residential construction also increased in FY15.
Personal Income and Employment
Income tax revenues for the County represented 46.4 percent of total tax revenues for the General Fund in FY15. Two economic indicators, personal income and employment, are the major contributors that drive income tax receipts. On a calendar year basis, per capita personal income increased from $67,076 in 2006 to an estimated $77,745 in 2015 – an average annual rate of 1.6 percent. However, over the past ten years, the rate of growth in per capita personal income experienced three distinct cycles. From 2006 to 2008, per capita income grew at a 3.2 percent average annual rate, declined 3.8 percent in 2009, and it is estimated to have grown at an annual rate of 2.1 percent from 2009 to 2015.

x
In 2006, resident employment in Montgomery County stood at 495,926. By CY15, employment is expected to reach approximately 521,230 ─ an average annual increase of 0.6 percent. However, growth in resident employment also experienced three distinct cycles. Between 2006 and 2008, resident employment grew at an average annual rate of 0.4 percent, decreased 1.0 percent in 2009, and is expected to have increased 0.9 percent between 2009 and 2015.
Payroll employment in the County was approximately 480,240 in 2006 and is expected to experience an increase in 2015 to approximately 484,130 – an increase of 0.1 percent. However, unlike resident employment, payroll employment experienced two distinct cycles over the ten-year period. From 2006 to 2010, payroll employment steadily decreased at an average annual rate of nearly 1.0 percent. From 2010 to 2015, payroll employment is expected to have increased at an average annual rate of over 0.9 percent.
Construction and Real Estate
The property tax (General Fund) and the transfer and recordation taxes consisted of 38.5 percent share and 5.3 percent share, respectively, of total tax revenues for the General Fund in FY15. Construction and real estate activity play a significant role in Montgomery County’s economy and their effects on the amount of property taxes and transfer and recordation taxes collected. Non-residential and residential construction help maintain the value of existing assessable property tax base by replacing technologically obsolescent property (equipment, and real estate) and grow the base by providing additional capacity to meet increases in employment and new households. Changes in home prices affect both the property tax assessments and the transfer and recordation taxes. However, changes in home prices may affect property tax revenues with a lag because of the homestead tax credit. Average prices for existing homes were down 0.7 percent in FY15, but sales of existing homes increased 3.1 percent. That increase in home sales followed a decrease of 17.6 percent in FY11, largely attributed to expiration of the federal first-time homebuyers credit, a further decline of 2.7 percent in FY12, an increase of 11.4 percent in FY13, and an increase of 5.5 percent in FY14. The decrease in average sales price was offset by an increase in sales in FY15 that resulted in an increase of 2.4 percent from residential transfer taxes. Receipts from non-residential transfer taxes also increased 7.6 percent in FY15. Overall, transfer taxes collected for the General Fund increased 1.7 percent and recordation taxes were up 2.9 percent in FY15.
$60,000 $62,000 $64,000 $66,000 $68,000 $70,000 $72,000 $74,000 $76,000 $78,000 $80,000
430,000 440,000 450,000 460,000 470,000 480,000 490,000 500,000 510,000 520,000 530,000
2006 2007 2008 2009 2010 2011 2012 2013 2014 2015 est.
Inco
me
Em
plo
ymen
t
Calendar Year
Resident, Payroll Employment, and Per Capita Income Montgomery County
Resident Employment Payroll Employment Per Capita Income
SOURCES: Bureau of Labor Statistics, U.S. Department of LaborBureau of Economic Analysis, U.S. Department of CommerceMontgomery County Department of Finance

xi
Residential construction starts of both multi-family and single-family units, which added a total value of $930.0 million in FY15, increased 4.8 percent over FY14. The number of new detached single-family units increased a modest 0.7 percent from 1,489 units in FY14 to 1,499 units in FY15. However, construction of multi-family units in FY15 of 3,275, an increase of 11.3% from FY14, was the highest number since FY05. Compared to the increase in residential sector construction, the total value of non-residential construction at $566.2 million was down 8.5 percent in FY15.
$0
$100,000
$200,000
$300,000
$400,000
$500,000
$600,000
0
5,000
10,000
15,000
20,000
25,000
30,000
2006 2007 2008 2009 2010 2011 2012 2013 2014 2015
Pri
ce
Sal
es
Fiscal Year
Home Sales and Average Home PricesMontgomery County
Sales Prices
SOURCES: Metropolitan Regional Information System, Inc. Montgomery County Department of Finance
$0
$500,000
$1,000,000
$1,500,000
$2,000,000
$2,500,000
2006 2007 2008 2009 2010 2011 2012 2013 2014 2015
Val
ue
(000
s)
Fiscal Year
Total Value of New Construction Montgomery County
Residential Non-residential
SOURCES: McGraw-Hill Construction
Montgomery County Department of Finance
xii
Future Economic Outlook
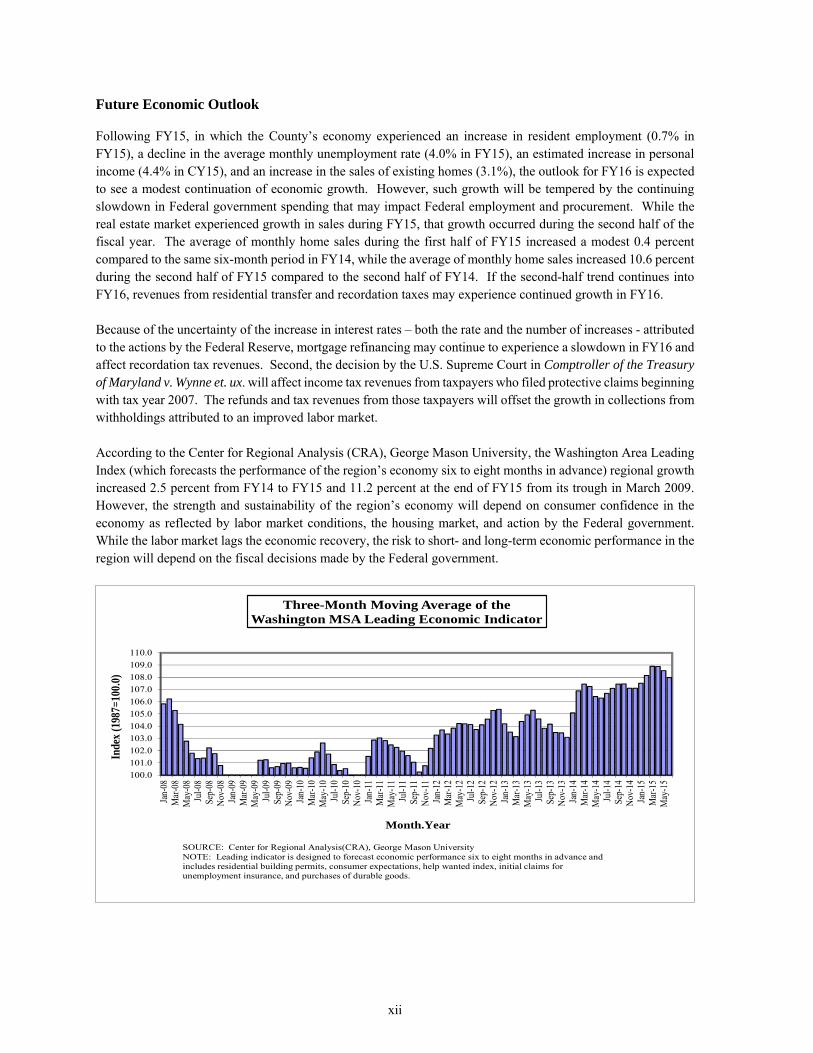
Following FY15, in which the County’s economy experienced an increase in resident employment (0.7% in FY15), a decline in the average monthly unemployment rate (4.0% in FY15), an estimated increase in personal income (4.4% in CY15), and an increase in the sales of existing homes (3.1%), the outlook for FY16 is expected to see a modest continuation of economic growth. However, such growth will be tempered by the continuing slowdown in Federal government spending that may impact Federal employment and procurement. While the real estate market experienced growth in sales during FY15, that growth occurred during the second half of the fiscal year. The average of monthly home sales during the first half of FY15 increased a modest 0.4 percent compared to the same six-month period in FY14, while the average of monthly home sales increased 10.6 percent during the second half of FY15 compared to the second half of FY14. If the second-half trend continues into FY16, revenues from residential transfer and recordation taxes may experience continued growth in FY16. Because of the uncertainty of the increase in interest rates – both the rate and the number of increases - attributed to the actions by the Federal Reserve, mortgage refinancing may continue to experience a slowdown in FY16 and affect recordation tax revenues. Second, the decision by the U.S. Supreme Court in Comptroller of the Treasury of Maryland v. Wynne et. ux. will affect income tax revenues from taxpayers who filed protective claims beginning with tax year 2007. The refunds and tax revenues from those taxpayers will offset the growth in collections from withholdings attributed to an improved labor market. According to the Center for Regional Analysis (CRA), George Mason University, the Washington Area Leading Index (which forecasts the performance of the region’s economy six to eight months in advance) regional growth increased 2.5 percent from FY14 to FY15 and 11.2 percent at the end of FY15 from its trough in March 2009. However, the strength and sustainability of the region’s economy will depend on consumer confidence in the economy as reflected by labor market conditions, the housing market, and action by the Federal government. While the labor market lags the economic recovery, the risk to short- and long-term economic performance in the region will depend on the fiscal decisions made by the Federal government.
100.0
101.0
102.0
103.0
104.0
105.0
106.0
107.0
108.0
109.0
110.0
Jan-
08M
ar-0
8M
ay-0
8Ju
l-08
Sep-
08N
ov-0
8Ja
n-09
Mar
-09
May
-09
Jul-0
9Se
p-09
Nov
-09
Jan-
10M
ar-1
0M
ay-1
0Ju
l-10
Sep-
10N
ov-1
0Ja
n-11
Mar
-11
May
-11
Jul-1
1Se
p-11
Nov
-11
Jan-
12M
ar-1
2M
ay-1
2Ju
l-12
Sep-
12N
ov-1
2Ja
n-13
Mar
-13
May
-13
Jul-1
3Se
p-13
Nov
-13
Jan-
14M
ar-1
4M
ay-1
4Ju
l-14
Sep-
14N
ov-1
4Ja
n-15
Mar
-15
May
-15
Inde
x (1
987=
100.
0)
Month.Year
Three-Month Moving Average of the Washington MSA Leading Economic Indicator
SOURCE: Center for Regional Analysis(CRA), George Mason UniversityNOTE: Leading indicator is designed to forecast economic performance six to eight months in advance and includes residential building permits, consumer expectations, help wanted index, initial claims for unemployment insurance, and purchases of durable goods.

xiii
Collective Bargaining
International Association of Fire Fighters (IAFF)
Full funding was appropriated for the following contract provisions in FY16 for the Local 1664, Montgomery County Career Fire Fighters Association of the International Association of Fire Fighters, AFL-CIO:
2% general wage adjustment for all bargaining unit members on the first full pay period after July 1, 2015.
3.5% longevity increment for bargaining unit members with either 20 or 28 years of service.
3.5% service increments for all eligible bargaining unit members.
Fraternal Order of Police (FOP)
Full funding was appropriated for the following contract provisions in FY16 for the Fraternal Order of the Police, Lodge 35:
2% general wage adjustment for all bargaining unit members on the first full pay period after July 1, 2015.
3.5% service increments for all eligible members.
3.5% longevity increments for bargaining unit members with 20 years of service.
Municipal and County Government Employees Organization (MCGEO)
Full funding was appropriated for the following contract provisions in FY16 for Local 1994, Municipal and County Government Employees Organization of the United Food and Commercial Workers, AFL-CIO (MCGEO):
2% general wage adjustment payable on the first full pay period after July 1, 2015.
3.5% service increment for all eligible bargaining unit members.
3% longevity increments for eligible bargaining unit members with 20 years of service.
Long-term Financial Planning
Montgomery County is required by its adopted fiscal policies (Council Resolutions 16-1415, June 29, 2010; and 17-312, November 29, 2011) to budget for a reserve in the General Fund. This reserve is 5 percent of General Fund revenues in the preceding fiscal year (maximum permitted under §310 of the County Charter). In addition, the County is required to maintain the sum of Unrestricted General Fund Balance and the Revenue Stabilization Fund Balance to 10% of Adjusted Governmental Fund Revenues, as required in Section 20-68 of the County Code. Adjusted Governmental Fund Revenues are defined in Section 20-65 of the County Code.
The reserves will be budgeted in order to provide sufficient funds for unanticipated revenue shortfalls or expenditure requirements. The County’s Revenue Stabilization Fund was established to accumulate funds during periods of strong economic growth in order to provide budgetary flexibility during times of funding shortfalls. Annual transfers to the Revenue Stabilization Fund must be made of the greater of: 50 percent of selected revenues in excess of budgeted amounts; or 0.5 percent of Adjusted Governmental Revenues; or the amount needed to obtain a total reserve of 10% of Adjusted Governmental Revenues. Additional discretionary contributions may also be made. Withdrawals may be used, with the vote of six or more council members, only to support appropriations which have become unfunded. The County’s Revenue Stabilization Fund is consolidated with the General Fund for financial reporting purposes.
As part of the annual operating budget process, the County develops a structurally balanced six-year fiscal plan. This plan addresses long-term structural issues in the budget, maintains the General Fund reserves at the required

xiv
policy levels, and emphasizes the priorities of education, public safety, affordable housing, transportation, and health and human services.
Significant budget challenges include rising retirement and medical costs, recognition of retiree health expenses, addressing deferred maintenance, and funding program improvements. In addition to these challenges, actions implemented at the Federal and State level may complicate the County’s ability to plan for the FY17 – FY22 period. The County Government is closely monitoring proposed changes in the federal budget and tax policy, and analyzing the potential impact on the County’s economy and financial position.
Relevant Financial Policies
The financial policies as put forth by the Executive of Montgomery County, which were again recognized by all major rating agencies with the continuation of a AAA credit rating, remain unchanged: grow the local economy and tax base, obtain a fair share of State aid, maintain strong reserves, minimize the tax burden on citizens, and carefully manage indebtedness and debt service. Spending affordability guidelines are adopted annually for the County’s capital and operating budgets. The County limits its exposure in future years to rising costs by controlling baseline costs and allocating one-time revenues to one-time expenditures, whenever possible.
Major Initiatives
Major initiatives of the County during FY15 that are expected to affect future financial position include the following:
Housing
The County invested over $43.9 million for Affordable Housing including the Montgomery Housing Initiative (MHI) fund and utilized $17.0 million from the Affordable Housing Acquisition and Preservation CIP project. This increase in dedicated funding provides for the renovation of distressed housing, the acquisition and preservation of affordable housing units, the creation of housing units for special needs residents, services to the “Building Neighborhoods to Call Home” and “Housing First” programs, and the creation of mixed income housing.
Public Safety
The County enhanced public trust by initiating the use of body cameras on police patrol officers. Montgomery County will be one of the first large jurisdictions to equip the entire patrol force with this equipment.
The County also began the consolidation of the Emergency Communications Center to enhance public safety by improving emergency call taking and dispatch services. Consolidation will result in greater efficiency and therefore decrease administrative overhead and reduce operational overtime expenditures.
Transportation
The County opened the Capital Crescent Garage in Bethesda in January 2015. This state-of-the-art facility provides for 950 public parking spaces, a security system with video cameras and call stations, electric vehicle charging stations, and bicycle parking.
In addition, the County oversaw an increased road resurfacing program. The number of lane miles resurfaced rose from 24 miles in FY14 to 145 miles in FY15. Performing road resurfacing in earlier years prevents the need for more costly road rehabilitation in later years.
xv
Environment
The County recommended a 4.0% rate decrease in solid waste charges across the single-family, multi-family and non-residential sectors, thereby providing relief to ratepayers in these sectors.
The County will retain the energy tax at the level approved by the council for FY15, thus preserving a broad-based revenue source that includes federal institutions located in the County.
Culture and Recreation
The County opened the new, five-story Silver Spring Library featuring expanded service hours, a Technology Corral, an Accessibility Resource Center, a Business Center, and a future Purple Line transit stop.
ActiveNet software was implemented to allow for a one-stop access location to register for Montgomery County Parks, Community Use of Public Facilities, and Recreation programs.
Education
The County made a contribution to MCPS of $1,826.1 million, including $33.2 million in carryover and $44.48 million of local contribution for State retirement. The County contribution meets the State Maintenance of Effort Law requirements. Additionally, the County spent $184.2 million on school construction costs in FY15.
General Government
The Oracle ERP system for the Department of Liquor Control went live in February, 2015. The system will dramatically improve many of the department’s business processes and operational practices as it offers tighter inventory controls, County-approved inventory valuation methodology, and enhanced reporting capabilities which enable customers, suppliers, and employees access to more valuable information.
AWARDS AND ACKNOWLEDGMENTS
Certificate of Achievement for Excellence in Financial Reporting
The Government Finance Officers Association (GFOA) of the United States and Canada awarded a Certificate of Achievement for Excellence in Financial Reporting to Montgomery County, Maryland for its CAFR for the fiscal year ended June 30, 2014. Montgomery County has received the Certificate of Achievement more than any other county in the nation; 45 times since 1951, and consecutively for 43 years since 1972.
The Certificate of Achievement is a prestigious national award recognizing conformance with the highest standards for preparation of state and local government financial reports. In order to be awarded a Certificate of Achievement, a government must publish an easily readable and efficiently organized CAFR. This report must satisfy both generally accepted accounting principles and applicable legal requirements.
A Certificate of Achievement is valid for a period of one year only. The Department of Finance believes its current report continues to meet the Certificate of Achievement Program’s requirements and is submitting it to GFOA to determine its eligibility for another certificate.
Distinguished Budget Presentation
GFOA presented the Distinguished Budget Presentation Award to Montgomery County, Maryland for its annual budget for the fiscal year beginning July 1, 2015. In order to receive this award, a government must publish a
xvi
document that meets program criteria as a policy document, as an operations guide, as a financial plan, and as a communications device. The award is valid for a period of one year only. Montgomery County has received this award every year since 1984, the year the program was established. The Office of Management and Budget believes the current budget continues to conform to program requirements and is submitting it to GFOA to determine its eligibility for another award.
Acknowledgments
The preparation of this report on a timely basis could not be accomplished without the efficient and dedicated services of the staff of the County's Department of Finance. I express my appreciation to all participants who assisted and contributed to its preparation. I particularly express my sincerest appreciation to Karen Hawkins, Chief Operating Officer; Lenny Moore, Controller; Kim Williams, General Accounting Manager; and the staff of the General Accounting, Grants Accounting, Account Receivable, Accounts Payable, and Administration Section for their outstanding performance in the preparation of this report. A list of individuals whose dedicated efforts produced this report is provided separately after this letter. A special appreciation is extended to the finance and accounting managers of the component units whose cooperation greatly facilitated the preparation of this report. I express my appreciation to the County Executive, the members of the County Council, and the Chief Administrative Officer who served the County during the reporting period, and their staffs, for their interest and support in planning and conducting the financial operations of the County in a responsible and progressive manner.
USE OF THIS REPORT
This report, and other financial information prepared by the Montgomery County Department of Finance, can be accessed on the County’s website at http://www.montgomerycountymd.gov (see Governments, Departments, Finance, Financial Reports). Copies of this report are also placed in the County Library System for use by the general public.
Respectfully submitted,
Joseph F. Beach Director of Finance

xvii
ACKNOWLEDGMENTS
The following individuals’ efforts were instrumental in performing the year-end closing of the County’s funds and in preparing this Comprehensive Annual Financial Report:
Department of Finance, The Division of the Controller
Chander Chadha Sheenu Chopra Sean D’Costa William Davis Estela de Gomes Mauricio Delgado Jason Hsu Rachel Hsu
Tim Hughes Joelle Kabala Susan Kaplan Jonathan Kugel Chong Lee Xuerong Liu Farrah Malik Priti Mehta
Heidi Metzger Ah-Young Moon Lenny Moore Jay Narang Courtney Orsini Leonard Raymo Lal Sangliani Stephanie Sawyer
Lisa Sesny Laleh Shabani Philip Smith Sarita Swar Almon Turner Kim Williams Sarah Xue Rami Zackaria
Department of General Services Department of Liquor Control Bill Griffiths Michelle West Melissa Chui Sunil Pandya Quinton McHenry Rick Taylor Gary Tillman and the Print Shop
The following individuals provided data, special research and information for inclusion in this report:
Jacqueline Carter Sing Chan Phavann Chhuan Michael Coveyou Dennis Denisov
Robert Hagedoorn Amanda Hardy-Konkus Karen Hawkins Molly Hayward-Koert Lih Jiang
Karen Michalak David Platt Karen Plucinski Uday Ravipati Matthew Rosenstock
Pam Schroeder Karla Thomas Marty Utermohle Pamela Vaughn Erin Von Nessen
Department of Environmental Protection Office of Management and Budget Richard Hands Peter Karasik
Scott McClure Anthony Skinner
Alex Espinosa Chris Mullin
Rao Malladi
Department of Transportation
Office of Public Information Michael Lee Flor Reichers Thomas Whorton Carolyn McKenzie Luz Rodriguez
Office of Human Resources Montgomery County Employee Retirement Plans George Lacy Linda Herman Dongmei Li Akiko Kawashima
Component Units
Bethesda Urban Partnership, Inc. Montgomery County Public Schools Jeff Oyer Bei (Susan) Chen Jack Dodson Susanne G. DeGraba Dr. Andrew M Zuckerman Housing Opportunities Commission Eugenia Pascual Gail Willison Belle Seyoum Montgomery College Montgomery County Revenue Authority Phillip Howard Monica Wong Michael Boone Ruby Sherman Appreciation is also extended to employees in all County departments and agencies who participate in the year-end process.

xviii
Libraries, Culture & Recreation
County CouncilBoard of AppealsInspector GeneralLegislative OversightMerit System Protection
BoardZoning and Administrative
Hearings
County ExecutiveBoard of ElectionsCommunity EngagementCounty AttorneyEthics CommissionFinanceGeneral ServicesHuman ResourcesHuman RightsIntergovernmental RelationsManagement and BudgetProcurementPublic InformationTechnology ServicesUrban Districts
Community Use of Public FacilitiesLibrariesRecreation
Health and Human Services
Transportation
Chief Administrative Officer
Economic DevelopmentHousing and Community AffairsPermitting Services
County Council County Executive Board of Education
Circuit Court
Montgomery County Public Schools
State's Attorney
Sheriff
TransportationGeneral Government
Health & Human Services
Community Development & Housing
Public Safety
Consumer ProtectionCorrection and RehabilitationEmergency Management and Homeland Security Fire and Rescue ServicePolice
Legislative
Conservation of Natural Resources
Environmental Protection
Liquor Control
Housing Opportunities Commission
Montgomery College
Maryland-National Capital Park & Planning
Commission
Revenue Authority
Washington Suburban Sanitary Commission
Washington Suburban Transit Commission
Residents
Montgomery County, MarylandFunctional Organization Chart
Legislative Branch Judicial BranchExecutive Branch
Other Agencies
Boards, Committees, and Commissions
Liquor Control

xix
MONTGOMERY COUNTY, MARYLAND ELECTED OFFICIALS
June 30, 2015
COUNTY EXECUTIVE Isiah Leggett
COUNTY COUNCIL
President George Leventhal Vice President Nancy Floreen
Roger Berliner Marc Elrich Tom Hucker Sidney Katz
Nancy Navarro Craig Rice Hans Riemer
Other Elected Officials
Administrative Judge Circuit Court John W. Debelius, III Clerk of the Circuit Court Barbara H. Meiklejohn Register of Wills Joseph M. Griffin Sheriff Darren M. Popkin State’s Attorney John McCarthy
APPOINTED OFFICIALS
Chief Administrative Officer Timothy L. Firestine Board of Appeals Katherine Freeman Consumer Protection Correction and Rehabilitation
Eric Friedman Robert Green
County Attorney Marc Hansen County Council Stephen B. Farber Economic Development Sally Sternbach, Acting Environmental Protection Lisa Feldt Ethics Commission Robert Cobb Finance Joseph F. Beach Fire and Rescue Service Scott Goldstein General Services David E. Dise Health and Human Services Uma S.Ahluwalia Housing and Community Affairs Clarence J. Snuggs Human Resources Shawn Y. Stokes Inspector General Edward L. Blansitt, III Intergovernmental Relations Melanie L. Wenger Legislative Oversight Dr. Chris Cihlar Liquor Control George F. Griffin Management and Budget Jennifer Hughes Merit System Protection Board Bruce P. Martin Permitting Services Diane Schwartz Jones Police J. Thomas Manger Procurement Cherri Branson Public Information Patrick Lacefield Public Libraries Parker Hamilton Recreation Gabriel Albornoz Technology Services Sonny Segal Transportation Al Roshdieh, Acting Zoning and Administrative Hearings Martin L. Grossman

xx
COMPONENT UNIT OFFICIALS
Montgomery County Public Schools Montgomery College
Board of Education: Board of Trustees: Patricia O’Neill, President Marsha Suggs Smith, Chair Michael A. Durso, Vice President Michael J. Knapp, First Vice-Chair Gloria Aparicio Blackwell, Second Vice-Chair Christopher S. Barclay Jill Ortman-Fouse Judith Docca Rebecca Smondrowski Dr. Kenneth J. Hoffman Dr. Leslie S. Levine Philip Kauffman Dr. Robert J. Hydorn Michael D. Priddy Eric Guerci, Student Member Robert F. Levey Benjamin H. Wu Luis D. Rosales, Student Trustee Larry Bowers, Interim Superintendent of Schools Dr. DeRionne Pollard, President and Secretary-Treasurer
Montgomery County Revenue Authority Housing Opportunities Commission of Montgomery County
Board of Directors: Commissioners:Stephen H. Edwards, Chairman Sally Roman, Chair Herbert L. Tyson, Secretary-Treasurer Jackie Simon, Vice Chair Jean Banks, Chair Pro Tem David Freishtat Jonathan Powell Christopher Hatcher Scott W. Reilly Margaret McFarland Ramona Bell-Pearson, Ex-Officio Member Richard Y. Nelson Jr. Roberto R. Pinero Keith Miller, Chief Executive Officer Stacy L. Spann, Executive Director Bethesda Urban Partnership, Inc.
Board of Directors: Patrick O’Neil, Chair Elein Joost, Vice Chair Robert Donohoe, Jr., Treasurer Jack Alexander, Secretary Kenneth B. Hartman Andy O’Hare Rich Jordan Jonathan Sachs Mark Kramer Len Simon Jane G. Mahaffie W. David Dabney, Executive Director
INDEPENDENT AUDITORS
CliftonLarsonAllen LLP 1966 Greenspring Drive, Suite 300
Timonium, Maryland 21093

xxi

xxii

fiNANCiAL sECTiON


INDEPENDENT AUDITORS' REPORT The Honorable County Council of Montgomery County, Maryland Report on the Financial Statements
We have audited the accompanying financial statements of the governmental activities, the business-type activities, the aggregate discretely presented component units, each major fund, and the aggregate remaining fund information of Montgomery County, Maryland (the County), as of and for the year ended June 30, 2015, and the related notes to the financial statements, which collectively comprise the County’s basic financial statements as listed in the table of contents. Management’s Responsibility for the Financial Statements
Management is responsible for the preparation and fair presentation of these financial statements in accordance with accounting principles generally accepted in the United States of America; this includes the design, implementation, and maintenance of internal control relevant to the preparation and fair presentation of financial statements that are free from material misstatement, whether due to fraud or error. Auditors’ Responsibility
Our responsibility is to express opinions on these financial statements based on our audit. We did not audit the financial statements of the Montgomery County Revenue Authority and Bethesda Urban Partnership, Inc., which represent 16 percent, 6 percent, and 6 percent, respectively, of the assets, net position and revenues of the non-major component units. Those statements were audited by other auditors whose report has been furnished to us, and our opinion, insofar as it relates to the amounts included for the Montgomery County Revenue Authority and Bethesda Urban Partnership, Inc., is based solely on the report of the other auditors. We conducted our audit in accordance with auditing standards generally accepted in the United States of America and the standards applicable to financial audits contained in Government Auditing Standards, issued by the Comptroller General of the United States. Those standards require that we plan and perform the audit to obtain reasonable assurance about whether the financial statements are free from material misstatement. The financial statements of Bethesda Urban Partnership, Inc. were not audited in accordance with Government Auditing Standards. An audit involves performing procedures to obtain audit evidence about the amounts and disclosures in the financial statements. The procedures selected depend on the auditors’ judgment, including the assessment of the risks of material misstatement of the financial statements, whether due to fraud or error. In making those risk assessments, the auditor considers internal control relevant to the entity’s preparation and fair presentation of the financial statements in order to design audit procedures that are appropriate in the circumstances, but not for the purpose of expressing an opinion on the effectiveness of the entity’s internal control. Accordingly, we express no such opinion. An audit also includes evaluating the appropriateness of accounting policies used and the reasonableness of significant accounting estimates made by management, as well as evaluating the overall presentation of the financial statements. We believe that the audit evidence we have obtained is sufficient and appropriate to provide a basis for our audit opinions. Opinions
In our opinion, based on our audit and the reports of other auditors, the financial statements referred to above present fairly, in all material respects, the respective financial position of the governmental activities, the business-type activities, the aggregate discretely presented component units, each major fund, and the aggregate remaining fund information of Montgomery County, Maryland as of June 30, 2015, and the respective changes in financial position and, where applicable, cash flows thereof for the year then ended in accordance with accounting principles generally accepted in the United States of America.
CliftonLarsonAllen LLP CLAconnect.com
An independent member of Nexia International
1

The Honorable County Council of Montgomery County, Maryland
Emphasis of Matter
Change in Accounting Principle During the fiscal year ended June 30, 2015, the County adopted GASB Statement No. 68, Accounting and Financial Reporting for Pensions and the related GASB Statement No. 71, Pension Transition for Contributions Made Subsequent to the Measurement Date – an amendment of GASB Statement No. 68. As a result of the implementation of these standards, the County reported a restatement for change in accounting principle (See Note I). Our auditors’ opinion was not modified with respect to the restatement. Other Matters Required Supplementary Information Accounting principles generally accepted in the United States of America require that the management’s discussion and analysis on pages 3 through 25 and the budgetary comparison information for the general, housing initiative and grants funds, the Consolidated Retiree Health Benefits Trust, Employees’ Retirement System, Maryland State Retirement and Pension System, and the notes to required supplementary information on pages 131 through 146 be presented to supplement the basic financial statements. Such information, although not a part of the basic financial statements, is required by the Governmental Accounting Standards Board who considers it to be an essential part of financial reporting for placing the basic financial statements in an appropriate operational, economic, or historical context. We and other auditors have applied certain limited procedures to the required supplementary information in accordance with auditing standards generally accepted in the United States of America, which consisted of inquiries of management about the methods of preparing the information and comparing the information for consistency with management’s responses to our inquiries, the basic financial statements, and other knowledge we obtained during our audit of the basic financial statements. We do not express an opinion or provide any assurance on the information because the limited procedures do not provide us with sufficient evidence to express an opinion or provide any assurance. Other Information Our audit was conducted for the purpose of forming opinions on the financial statements that collectively comprise the County’s basic financial statements. The combining and individual fund financial statements and supplementary schedules are presented for purposes of additional analysis and are not a required part of the basic financial statements. The combining and individual fund financial statements and supplementary schedules are the responsibility of management and were derived from and relates directly to the underlying accounting and other records used to prepare the basic financial statements. Such information has been subjected to the auditing procedures applied in the audit of the basic financial statements and certain additional procedures, including comparing and reconciling such information directly to the underlying accounting and other records used to prepare the basic financial statements or to the basic financial statements themselves, and other additional procedures in accordance with auditing standards generally accepted in the United States of America by us and other auditors. In our opinion, based on our audit, the procedures described above, and the report of the other auditors, the combining and individual fund financial statements and supplementary schedules are fairly stated, in all material respects, in relation to the basic financial statements as a whole. The introductory and statistical sections have not been subjected to the auditing procedures applied in the audit of the basic financial statements, and accordingly, we do not express an opinion or provide any assurance on it. Other Reporting Required by Government Auditing Standards
In accordance with Government Auditing Standards, we have also issued our report dated December 16, 2015, on our consideration of the County's internal control over financial reporting and on our tests of its compliance with certain provisions of laws, regulations, contracts, and grant agreements and other matters. The purpose of that report is to describe the scope of our testing of internal control over financial reporting and compliance and the result of that testing, and not to provide an opinion on internal control over financial reporting or on compliance. That report is an integral part of an audit performed in accordance with Government Auditing Standards in considering the County’s internal control over financial reporting and compliance.
a CliftonLarsonAllen LLP
Baltimore, Maryland December 16, 2015
2

3
MANAGEMENT’S DISCUSSION AND ANALYSIS
Introduction
This discussion and analysis (MD&A) is designed to a) assist readers in understanding Montgomery County, Maryland’s (the County’s) basic financial statements, the relationship of different types of statements, and the significant differences in the information they provide; b) assist the reader in focusing on significant financial issues; c) provide an overview of the County’s current financial activity; d) identify changes in the County’s financial position (i.e., its ability to address the next and subsequent years’ financial needs, based on currently known facts); e) identify any material deviations from the approved budget for the fiscal year, and f) identify individual fund issues or concerns. The MD&A is best understood if read in conjunction with the Transmittal Letter and the County’s basic financial statements.
Financial Highlights
The government-wide assets and deferred outflows of the County exceeded its liabilities and deferred inflows of resources at the close of FY15 by $1,001.7 million. That amount is net of a $1,825.3 million unrestricted deficit. The deficit occurs mainly because the County issues debt to fund construction costs for Montgomery County Public Schools (MCPS) and Montgomery College (MCC), two of its component units, and for Maryland-National Capital Park and Planning Commission (M-NCPPC), a joint venture. Debt outstanding for these entities amounted to $1,634.7 million at June 30, 2015. Absent the effect of this relationship, the County would have reported a deficit government-wide unrestricted net position of $190.6 million.
The County’s total government-wide net position increased by $21.2 million.
As of the close of FY15, the County’s governmental funds reported combined ending fund balances of $985.1 million; an increase of $113.7 million over the prior year’s ending fund balances. Of the total ending fund balances, $156.4 million is available for spending at the County’s discretion.
At the end of FY15, unassigned fund balance for the General Fund was $156.5 million, or 5.6 percent of total General Fund expenditures.
The County’s government-wide long-term debt and obligations increased by $38.9 million during FY15. The key factors in this increase are:
- The issuance of $856.5 million in general obligation (GO) bonds, used to refund $389.3 million in existing GO bonds. Proceeds were also used to refund $500 million in bond anticipation notes (BANS). Included in this issuance was an addition of $156.4 in GO premiums.
- The issuance of an additional $500 million in BANS. - A reduction in the Net Pension Liability of $344.8 million - The retirement of $193 million in GO bond principal and amortization of related premiums of
$37.9 million
Overview of the Financial Statements
The County’s financial statements focus on both the County as a whole (government-wide), and on the major individual funds. “Funds” are resources segregated for the purposes of implementing specific activities or achieving certain objectives in accordance with special regulations, restrictions, or limitations. Both the government-wide and fund perspectives allow users to address relevant questions and understand changes in financial conditions. The structure of the financial statements is presented below. This MD&A is intended to be an introduction to Montgomery County’s basic financial statements. Montgomery County’s basic financial statements comprise three components, including government-wide financial statements, fund financial
4
statements, and notes to financial statements. This report also contains other supplementary information in addition to the basic financial statements.
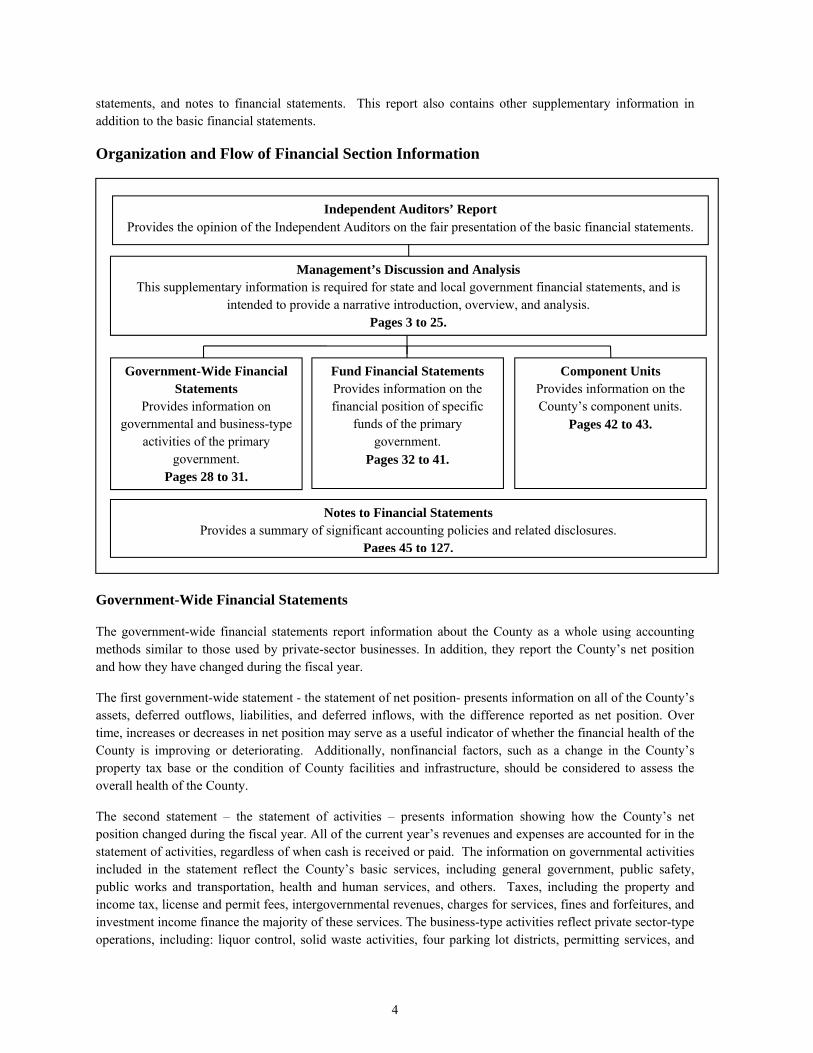
Organization and Flow of Financial Section Information
Government-Wide Financial Statements
The government-wide financial statements report information about the County as a whole using accounting methods similar to those used by private-sector businesses. In addition, they report the County’s net position and how they have changed during the fiscal year.
The first government-wide statement - the statement of net position- presents information on all of the County’s assets, deferred outflows, liabilities, and deferred inflows, with the difference reported as net position. Over time, increases or decreases in net position may serve as a useful indicator of whether the financial health of the County is improving or deteriorating. Additionally, nonfinancial factors, such as a change in the County’s property tax base or the condition of County facilities and infrastructure, should be considered to assess the overall health of the County.
The second statement – the statement of activities – presents information showing how the County’s net position changed during the fiscal year. All of the current year’s revenues and expenses are accounted for in the statement of activities, regardless of when cash is received or paid. The information on governmental activities included in the statement reflect the County’s basic services, including general government, public safety, public works and transportation, health and human services, and others. Taxes, including the property and income tax, license and permit fees, intergovernmental revenues, charges for services, fines and forfeitures, and investment income finance the majority of these services. The business-type activities reflect private sector-type operations, including: liquor control, solid waste activities, four parking lot districts, permitting services, and
Notes to Financial Statements Provides a summary of significant accounting policies and related disclosures.
Pages 45 to 127.
Fund Financial Statements Provides information on the financial position of specific
funds of the primary government.
Pages 32 to 41.
Management’s Discussion and Analysis This supplementary information is required for state and local government financial statements, and is
intended to provide a narrative introduction, overview, and analysis. Pages 3 to 25.
Component Units Provides information on the County’s component units.
Pages 42 to 43.
Government-Wide Financial Statements
Provides information on governmental and business-type
activities of the primary government.
Pages 28 to 31.
Independent Auditors’ Report Provides the opinion of the Independent Auditors on the fair presentation of the basic financial statements.

5
community use of public facilities, where fees for services or products are required or designed to recover the cost of operation, including depreciation.
The government-wide financial statements include not only the County itself (known as the Primary Government), but also legally separate entities known as Component Units. Component units, which are other governmental units over which the County Council can exercise influence and/or may be obligated to provide financial subsidy, are presented as a separate column in the government-wide statements and as individual activities in the basic and fund financial statements. The County has five component units – Montgomery County Public Schools (MCPS), Housing Opportunities Commission (HOC), Montgomery College (MCC), Montgomery County Revenue Authority (MCRA), and Bethesda Urban Partnership, Inc. (BUPI).
Fund Financial Statements
Traditional users of governmental financial statements may find the fund financial statement presentation more familiar. Funds are accounting devices that the County uses to keep track of specific sources of funding and spending for particular purposes. The County uses fund accounting to ensure and demonstrate compliance with finance-related legal requirements. In the fund financial statements, the focus is on major funds rather than the County as a whole. Major funds are separately reported while all others are combined into a single, aggregated presentation. The County has the following three types of funds:
Governmental Funds
Most of the County’s basic services are included in governmental funds, which focus on (1) cash and other financial assets that can readily be converted to cash and how they flow in and out, and (2) the balances remaining at year-end that are available for spending. The governmental funds financial statements provide a detailed short-term view that helps the reader determine whether there are more or fewer financial resources that can be spent in the near future to finance the County’s programs. Because this information does not encompass the additional long-term focus of the government-wide financial statements, a reconciliation of the fund financial statements to the government-wide financial statements is presented immediately after the fund financial statements. For example, the fund financial statements reflect bond proceeds and interfund transfers as other financing sources, as well as capital expenditures and bond principal payments as expenditures. The reconciliation will reflect the elimination of these transactions and will incorporate the capital assets and long-term obligations (bonds and others) that are presented in the governmental activities column (in the government-wide statements). The County has five major governmental funds – General, Debt Service, Housing Initiative, Grants and Capital Projects – and 11 non-major special revenue funds.
Proprietary Funds
Proprietary funds, which consist of enterprise funds and internal service funds, are used to account for operations that are financed and operated in a manner similar to private business enterprises in which costs are recovered primarily through user charges. Proprietary fund financial statements, like the government-wide financial statements, provide both long-term and short-term financial information. The fund financial statements provide more detail and additional information, such as cash flows, for the County’s enterprise funds. The County has three major enterprise funds – liquor control, solid waste activities, and parking lot districts – and two nonmajor funds. The internal service funds, which are presented in a single, aggregated column in the proprietary fund financial statements, are used to account for the provision of liability and property insurance coverage, employee health benefits, motor pool services, and central duplicating services, to County departments on a cost reimbursement basis. Although both the fund and government-wide financial statements provide a long-term and short-term focus, reconciliations between these two sets of statements are still required. This is due to the fact that the excess income/loss for the internal service funds has been

6
redistributed to the customers, including business-type activities; such reconciliations are reflected on the bottom of the proprietary fund financial statements.
Fiduciary Funds
Fiduciary funds are used to account for resources held for the benefit of parties outside the government. Fiduciary funds are not reflected in the government-wide financial statements because the resources of those funds are not available to support the County’s programs. The County’s fiduciary funds consist of pension and other employee benefit trusts, an investment trust, private purpose trusts, and agency funds.
Financial Analysis of Montgomery County, Maryland: Government-Wide Financial Statements
A comparative analysis of government-wide financial information is presented below.
Statement of Net Position
The following presents a summary of the Statements of Net position for the County as of June 30, 2015 and 2014:
Summary of Net Position *
June 30, 2015 and 2014
Governmental Activities Business-type Activities Total
2015 2014 2015 2014 2015 2014
Assets and Deferred Outflows of Resources:
Current and other assets $ 1,696,582,643 $ 1,622,212,695 $ 220,135,223 $ 228,447,367 $ 1,916,717,866 $ 1,850,660,062
Capital assets, net 4,075,212,346 3,864,096,152 280,760,328 280,050,637 4,355,972,674 4,144,146,789
Deferred outflows of resources 188,194,999 20,284,009 6,369,148 151,134 194,564,147 20,435,143
Total Assets and Deferred
Outflows of Resources 5,959,989,988 5,506,592,856 507,264,699 508,649,138 6,467,254,687 6,015,241,994
Liabilities and Deferred Inflows of Resources:
Long-term liabilities outstanding 4,681,801,356 3,991,981,135 162,056,261 151,483,512 4,843,857,617 4,143,464,647
Other liabilities 343,067,659 333,818,882 43,564,919 41,103,399 386,632,578 374,922,281
Deferred inflows of resources 225,285,936 - 9,803,898 - 235,089,834 -
Total Liabilities and Deferred
Inflows of Resources 5,250,154,951 4,325,800,017 215,425,078 192,586,911 5,465,580,029 4,518,386,928
Net position:
Net investment in capital assets 2,099,290,326 2,112,879,507 186,001,533 181,965,592 2,285,291,859 2,294,845,099
Restricted 493,320,702 315,878,315 48,386,118 64,810,807 541,706,820 380,689,122
Unrestricted (deficit) (1,882,775,991) (1,247,964,983) 57,451,970 69,285,828 (1,825,324,021) (1,178,679,155)
Total Net Position $ 709,835,037 $ 1,180,792,839 $ 291,839,621 $ 316,062,227 $ 1,001,674,658 $ 1,496,855,066
* Primary Government

7
The County’s current and other assets increased by $66.1 million or 3.6 percent from FY14. The County’s assets and deferred outflows of resources exceeded its liabilities and deferred inflows of resources at the close of FY15 by $1,001.7 million. By far the largest portion of the County’s net position reflects its investment in capital assets (e.g., land, buildings, improvements, furniture and equipment, infrastructure), less any related outstanding debt used to construct or acquire those assets. The County uses these capital assets to provide services to citizens; consequently, these assets are not available for future spending. Although the County’s investment in its capital assets is reported net of related debt, it should be noted that the resources needed to repay this debt must be provided from other sources since the capital assets themselves cannot be used to liquidate these liabilities.
It is also important to note that although counties in the state of Maryland issue debt for the construction of schools, those school buildings are owned by each county’s Board of Education. The County also funds projects for MCC and M-NCPPC. Therefore, while the County’s financial statements include this outstanding debt, they do not include the capital assets funded by the debt. Debt outstanding for these entities amounted to $1,634.7 million at June 30, 2015. Absent the effect of this relationship, the County would have reported a deficit government-wide unrestricted net position of $190.6 million. An additional portion of the County’s net position ($541.7 million or 54.1 percent) represents resources that are subject to restrictions on how they may be used.
The County’s total net position increased by $21.2 million for FY15 or 2.2 percent over FY14.
Additionally, the County implemented GASB Statement No. 68 during FY15. This change resulted in a reduction in beginning net position for FY15 as shown below. Additional information on the implementation of new accounting standards can be found in Notes to Financial Statements, Note I-E.
Restatement of Beginning Net Position*
For the Fiscal Year Ended June 30, 2015
Governmental Business-type
Activities Activities
Net Position, June 30, 2014 $ 1,180,792,839 $ 316,062,227
Net Pension Liability (634,472,966) (26,981,609)
Deferred Outflow of Resources 139,109,961 6,002,847
Net Position, as restated $ 685,429,834 $ 295,083,465
* Primary Government
(Rest of page intentionally left blank.)

8
Statement of Activities
The following table summarizes the County’s change in net position for the years ended June 30, 2015 and 2014:
Summary of Changes in Net Position *
For the Fiscal Years Ended June 30, 2015 and 2014
Governmental Activities Business-type Activities Total
2015 2014 2015 2014 2015 2014
REVENUES
Program Revenues:
Charges for services $ 237,757,263 $ 189,491,439 $ 474,835,325 $ 464,403,897 $ 712,592,588 $ 653,895,336
Operating grants and contributions 201,925,033 211,052,724 - - 201,925,033 211,052,724
Capital grants and contributions 34,370,853 40,010,775 - - 34,370,853 40,010,775
General revenues:
Property taxes 1,528,093,085 1,528,302,790 10,903,699 10,391,101 1,538,996,784 1,538,693,891
Income taxes 1,276,415,595 1,329,827,192 - - 1,276,415,595 1,329,827,192
Other taxes 423,734,468 432,455,794 - - 423,734,468 432,455,794
Investment income 6,787,434 6,457,962 215,823 100,857 7,003,257 6,558,819
Grants, contributions, and other revenues
not restricted to specific programs - 588,567 - - - 588,567
Gain/(loss) on sale of capital assets 3,882,648 (3,529,635) 175,100 (1,241,279) 4,057,748 (4,770,914)
Total Revenues 3,712,966,379 3,734,657,608 486,129,947 473,654,576 4,199,096,326 4,208,312,184
EXPENSES
Governmental Activities:
General government 470,405,790 474,084,799 - - 470,405,790 474,084,799
Public safety 591,702,869 607,555,402 - - 591,702,869 607,555,402
Public works and transportation 288,226,716 273,021,015 - - 288,226,716 273,021,015
Health and human services 296,567,081 291,657,233 - - 296,567,081 291,657,233
Culture and recreation 95,703,122 95,084,426 - - 95,703,122 95,084,426
Community development and housing 32,001,034 38,160,065 - - 32,001,034 38,160,065
Environment 30,905,863 31,590,141 - - 30,905,863 31,590,141
Education 1,826,117,289 1,770,301,285 - - 1,826,117,289 1,770,301,285
Interest on long-term debt 112,420,639 101,268,081 - - 112,420,639 101,268,081
Business-type Activities:
Liquor control - - 248,982,109 239,218,758 248,982,109 239,218,758
Solid waste activities - - 109,351,706 129,531,260 109,351,706 129,531,260
Parking lot districts - - 37,103,525 30,140,788 37,103,525 30,140,788
Permitting services - - 29,002,673 29,486,839 29,002,673 29,486,839
Community use of public facilities - - 9,444,551 8,997,721 9,444,551 8,997,721
Total Expenses 3,744,050,403 3,682,722,447 433,884,564 437,375,366 4,177,934,967 4,120,097,813
Net Position Before Transfers (31,084,024) 51,935,161 52,245,383 36,279,210 21,161,359 88,214,371
Transfers 55,489,227 46,858,508 (55,489,227) (46,858,508) - -
Change in Net Position 24,405,203 98,793,669 (3,243,844) (10,579,298) 21,161,359 88,214,371
Net Position, beginning of year as restated 685,429,834 1,081,999,170 295,083,465 326,641,525 980,513,299 1,408,640,695
Net Position, end of year $ 709,835,037 $ 1,180,792,839 $ 291,839,621 $ 316,062,227 $ 1,001,674,658 $ 1,496,855,066
* Primary Government
9
Governmental Activities
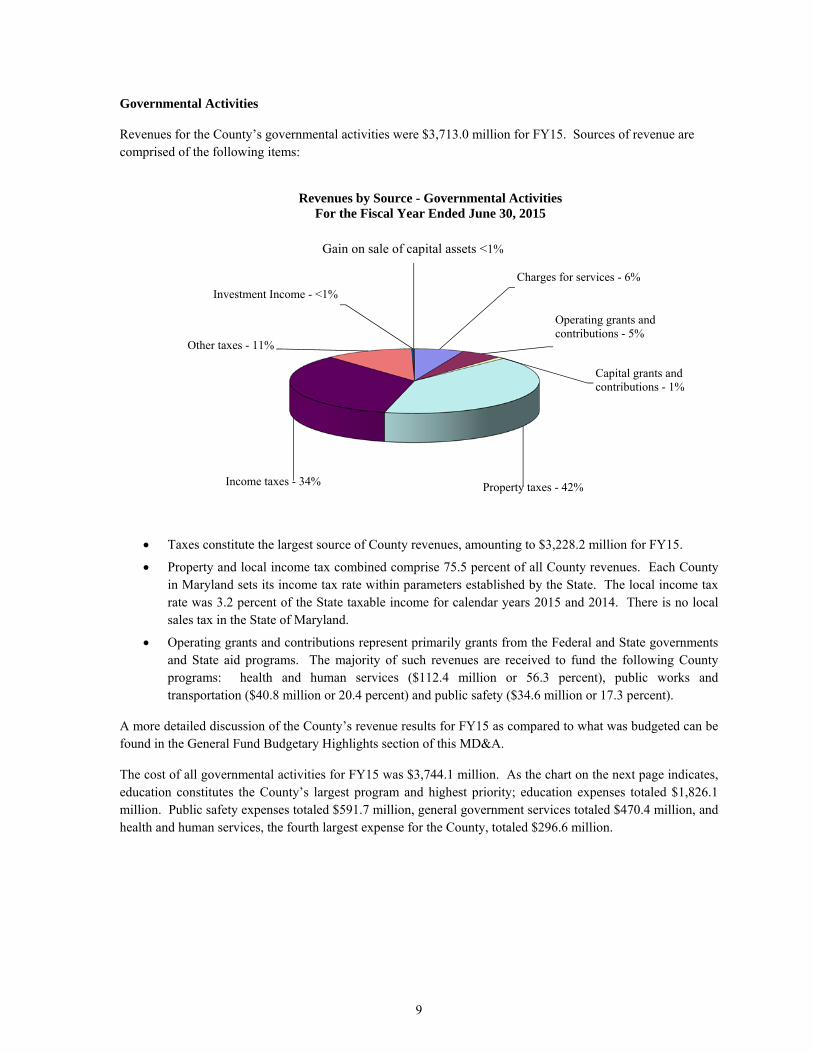
Revenues for the County’s governmental activities were $3,713.0 million for FY15. Sources of revenue are comprised of the following items:
Taxes constitute the largest source of County revenues, amounting to $3,228.2 million for FY15.
Property and local income tax combined comprise 75.5 percent of all County revenues. Each County in Maryland sets its income tax rate within parameters established by the State. The local income tax rate was 3.2 percent of the State taxable income for calendar years 2015 and 2014. There is no local sales tax in the State of Maryland.
Operating grants and contributions represent primarily grants from the Federal and State governments and State aid programs. The majority of such revenues are received to fund the following County programs: health and human services ($112.4 million or 56.3 percent), public works and transportation ($40.8 million or 20.4 percent) and public safety ($34.6 million or 17.3 percent).
A more detailed discussion of the County’s revenue results for FY15 as compared to what was budgeted can be found in the General Fund Budgetary Highlights section of this MD&A.
The cost of all governmental activities for FY15 was $3,744.1 million. As the chart on the next page indicates, education constitutes the County’s largest program and highest priority; education expenses totaled $1,826.1 million. Public safety expenses totaled $591.7 million, general government services totaled $470.4 million, and health and human services, the fourth largest expense for the County, totaled $296.6 million.
Charges for services - 6%
Operating grants and contributions - 5%
Capital grants and contributions - 1%
Property taxes - 42%Income taxes - 34%
Other taxes - 11%
Investment Income - <1%
Gain on sale of capital assets <1%
Revenues by Source - Governmental ActivitiesFor the Fiscal Year Ended June 30, 2015

10
The following table presents the cost and program revenues of the County as a whole and each of the County’s six largest programs – education, public safety, general government, public works and transportation, health and human services, and culture and recreation – as well as each program’s net cost (total cost less fees generated by the activities and program-specific intergovernmental aid).
For the Fiscal Years Ended June 30, 2015 and 2014
Expenses Revenues Net Cost of Services
2015 2014 2015 2014 2015 2014
Education $ 1,826,117,289 $ 1,770,301,285 $ - $ - $ 1,826,117,289 $ 1,770,301,285
Public safety 591,702,869 607,555,402 88,107,998 87,023,148 503,594,871 520,532,254
General government 470,405,790 474,084,799 89,903,682 49,785,788 380,502,108 424,299,011
Public works and transportation 288,226,716 273,021,015 91,011,178 103,397,968 197,215,538 169,623,047
Health and human services 296,567,081 291,657,233 117,357,408 116,947,500 179,209,673 174,709,733
Culture and recreation 95,703,122 95,084,426 49,774,679 45,360,701 45,928,443 49,723,725
Other 175,327,536 171,018,287 37,898,204 38,039,833 137,429,332 132,978,454
Total $ 3,744,050,403 $ 3,682,722,447 $ 474,053,149 $ 440,554,938 $ 3,269,997,254 $ 3,242,167,509
Of the total cost of governmental activities of $3,744.1 million, $474.1 million was paid by those who directly benefited from the programs ($237.8 million) and other governments and organizations that subsidized certain programs with operating and capital grants and contributions ($236.3 million). Of the $3,270.0 million net cost of services, our taxpayers paid for these activities through County taxes which totaled $3,228.2 million; also
General government - 13%
Public safety - 16%
Public works and transportation - 7%
Health and human services - 8%
Culture and recreation -3%
Community development and
housing - 1%
Environment - 1%
Education - 48%
Interest on long-term debt 3%
Expenses by Function - Governmental ActivitiesFor the Fiscal Year Ended June 30, 2015

11
available to contribute towards such net costs were investment income and other contributions not restricted to a specific program.
Highlights of significant changes in governmental activities, including the effect of implementing GASB Statement No. 68, compared to last year are:
Education: $55.8 million increase in resources spent on education
Public Works and Transportation: $15.2 million increase in expenses primarily due to increased road maintenance
Health and Human Services: $4.9 million increase in expenses including a significant increase in adult English literacy programs, Title XIX programs, and an increase in Earned Income Tax Credit refunds
Business-type Activities
Highlights of the County’s business-type activities for FY15 are as follows:
Business-type activities experienced a decrease in net position of $3.2 million for FY15. This amount is reported after total net transfers out of $55.5 million. The most significant components of the change include: - $4.6 million decrease in net position related to liquor control, - $5.6 million decrease in net position related to parking lot districts; and - $5.6 million increase related to permitting services.
Charges for services to users comprise 97.7 percent of revenues, with $278.8 million (58.7 percent of charges for services revenue) attributable to liquor control operations and $111.6 million (23.5 percent) attributable to solid waste activities. The remaining charges for services are generated from operations relating to parking lot districts, permitting services, and community use of public facilities.
Parking lot district property taxes of $10.9 million is the second largest source of revenue at only 2.2 percent of total revenues.
Investment income of $0.22 million reflects an increase of $0.12 million or 120 percent from FY14, primarily because of the increase in pooled cash and investments during the year.
(Rest of page intentionally left blank.)

12
Business-type activities are shown below comparing costs to revenues generated by related services:
Business-type revenues by source are comprised of the following:
Financial Analysis of the Government’s Funds
As noted earlier, the County uses fund accounting to ensure and demonstrate compliance with finance-related legal requirements.
-101030507090
110130150170190210230250270
LiquorControl
Solid WasteActivities
Parking LotDistricts
PermittingServices
CommunityUse of Public
Facilities
$ (i
n M
illi
ons)
Expenses and Program Revenues – Business-type ActivitiesFor the Fiscal Year Ended June 30, 2015
Revenues
Expenses
Charges for services & Gain on Sale of Capital Assets
98%
Property taxes<2%
Investment income<1%
Revenues by Source - Business-type ActivitiesFor the Fiscal Year Ended June 30, 2015

13
Governmental Funds
The focus of the County’s governmental funds is to provide information on near-term inflows, outflows and balances of spendable resources. Such information is valuable in assessing the County’s financing requirements. In particular, the unassigned fund balance may serve as a useful measure of a government’s net resources available for spending at the end of the fiscal year.
At the end of FY15, the County’s governmental funds reported combined ending fund balances of $985.1 million, an increase of $113.7 million from the end of FY14. Of the total ending fund balances, $156.4 million constitutes the unassigned fund balance, which is available for spending at the County’s discretion. The remainder of the fund balances of $828.7 million is unavailable for new spending because it has been set aside for prior period commitments and legal restrictions.
The General Fund
The General Fund is the primary operating fund of the County. At the end of FY15, the General Fund had $156.5 million of unassigned fund balance and total fund balance was $491.7 million. As a measure of the General Fund’s liquidity, it may be useful to compare total fund balance to total fund expenditures. Total fund balance represents 17.6 percent of total General Fund expenditures.
The fund balance of the County’s General Fund decreased by $108.0 million during FY15, primarily due to decreased income and property tax revenues, despite the consolidation of $230.6 million from the Revenue Stabilization Fund (RSF). Additional information pertaining to the RSF consolidation can be found in Notes to Financial Statements, Note II-B.
Housing Initiative Fund
The Housing Initiative Fund (HI) is used to account for the fiscal activity of financing, supplementing, and constructing affordable residential facilities for eligible participants. At the end of FY15, HI had a fund balance of $243.7 million, which is entirely restricted for legal reasons. The HI fund balance represents an increase of $2.3 million over FY14. Mortgage Receivables for this fund, which is a measure of its financing activities, increased $9.3 million or 0.5 percent over FY14.
Grants Fund
The Grants Fund is used to account for Federal and State grant-funded activities of the tax-supported General and special revenue funds. The Grants Fund by design has no fund balance at the end of each fiscal year as revenues equal expenditures - that is, expenditures of this fund are either billable to one or more federal or state agencies or paid via a transfer from another fund. In FY15, there was an exception and the Grants Fund has a restricted fund balance of $216,033. This was due to a restricted donation for an agricultural easement that was deemed to be a grant. The Grants Fund received $107.7 million in revenues for FY15. This is a $4.5 million decrease from FY14.
Debt Service Fund
The Debt Service Fund accumulates resources for the payment of general long-term debt principal, interest, and related costs. This fund does not maintain an unassigned fund balance; the restricted fund balance of $17.6 million represents a debt service reserve account.

14
Capital Projects Fund
The Capital Projects Fund (CIP) has a total fund balance of $150.2 million, an increase of $194.5 million from the end of FY14. The negative fund balance in FY14 had been primarily due to a delay in the issuance of new debt to fund certain capital projects.
A more detailed discussion of General Fund revenues can be found in the General Fund Budgetary Highlights section of MD&A. Other factors concerning the finances of the governmental funds are addressed in the discussion of the County’s governmental activities.
Proprietary Funds
The County’s proprietary funds provide the same type of information found in the government-wide statements, but include more detail.
The unrestricted net position of the Liquor Fund at the end of FY15 amounted to $17.0 million, and operating income was $31.3 million. After a subsidy transfer to the General Fund of $34.1 million, the fund ended FY15 with a decrease in net position of $4.6 million.
The Solid Waste Activities Fund total net position amounted to $52.6 million, of which the unrestricted net position was $14.1 million. Restricted net position of $38.5 million is attributable to the net investment of capital assets.
The Parking Lot Districts Fund decrease in net position amounted to $5.6 million in FY15, resulting in a total ending net position of $176.5 million. Of this amount, $142.1 million (80.6 percent) represents the net investment in capital assets; $8.7 million (4.9 percent) is restricted for debt service on revenue bonds; and $25.7 million (14.5 percent) is unrestricted.
A discussion of enterprise fund long-term debt can be found in the Long-Term Debt section presented later in this MD&A. Other factors concerning the finances of the enterprise funds are addressed in the discussion of the County’s business-type activities.
General Fund Budgetary Highlights
Revisions to the General Fund expenditure original budget (excluding transfers) to arrive at the final budget amounted to $50.0 million, which included County Council approved supplemental and special appropriations and the year-end County Council transfer and County Executive supplemental appropriations. Major components of the appropriation increases include the following:
$24.8 million increase for snow removal and wind and rain storm cleanup relating to 27 snow/ice events with a total accumulation of approximately 46.6 inches.
$.4 million to establish a Network Operations Center (NOC) to monitor FiberNet, which provides critical County infrastructure and services to the six agencies (County Government, MCPS, Montgomery College, M-NCPPC, HOC, and WSSC) represented on the Interagency Technology Coordination and Policy Committee.
$.3 million to engage Project Management, Strategy Development, and Economic Research consulting services for the Comprehensive Economic Strategy being developed by the Department of Economic Development.
Actual revenues were less than budget amounts by $32.9 million, while actual expenditures and net transfers out were less than final budget by $11.4 million and $43.2 million, respectively. Highlights of the comparison of

15
final budget to actual figures for expenditures and net transfers for the fiscal year-ended June 30, 2015, include the following:
Actual expenditures of $1,168.2 million were $11.4 million less than the final budget, which represents 1.0 percent of the final budget, and is attributable to savings achieved across numerous departments.
Actual transfers to the Capital Projects Fund and component units for capital purposes were less than budgeted by $70.6 million. This is due both to the multi-year nature of capital projects, and to time delays that can be encountered for certain projects.
A more detailed comparison of final budget to actual figures for revenues is presented below:
Overview
Actual revenues for the General Fund totaled $2,942.3 million and were 1.1 percent below the budget estimate for the fiscal year and 2.9 percent below actual revenues for FY14. The three largest contributors to the variance in dollars between the budget estimate and actual revenues were the income tax (-$29.8 million), recordation tax (-$7.3 million), followed by the transfer tax (-$5.8 million). Revenues from the property tax amounted to $1,088.4 million (-$521,966), or 0.05 percent, below the budget estimate and 1.8 percent below actual tax revenues for FY14. The decline in actual revenues from FY14 to FY15 is attributed to the cut in the tax rate for the General Fund from $0.759 per $100 assessed value to $0.732 per $100 assessed value. Revenues from consumption/excise taxes which include fuel/energy, telephone, hotel/motel, and other taxes, were $278.1 million in FY15. That amount was $391,227 or 0.1 percent above the budget estimate and that increase was mostly driven by the hotel-motel tax (+$1.5 million or 8.7%) and telephone taxes (+$1.0 million or 2.1%) partially offset by a $2.0 million shortfall in fuel/energy taxes (-0.9%). Investment income was $164,112 below the budget estimate. Licenses and Permits came in below the budget estimate (10.2%), while Charges for Services came in above the budget estimate (4.8%). Intergovernmental revenues were $4.5 million (or 11.6%) above the budget estimate. This increase was attributed to federal and other (non-state) reimbursements, which came in 32.0 percent and 105.6 percent above budget estimates, respectively.
Income Taxes
One of the largest revenue sources for the General Fund is the County income tax. Revenues from the income tax were $1,310.8 million and represented 46.4 percent of actual tax revenues in FY15 and 44.5 percent of total actual revenues. The increased reliance on the income tax as a major source of revenue in recent years can be attributed to three factors: growth in the employment base as reflected in resident employment, steady increases in wage and salary income in the County, and growth in capital gains. This contrasts with the County’s second largest revenue source – property taxes – which is held at the Charter Limit and thus generally represents revenue growth limited to the rate of inflation. However, while capital gains, on average, increases over time, the Standard & Poor’s 500 index, representing a proxy for capital gains, experienced significant volatility over the past ten calendar years (2005 – 2014) - ranging from an increase of 29.6 percent in 2013, to a very slight decrease of 0.0032 percent in 2011, to a decrease of 38.5 percent in 2008. In addition, resident employment experienced volatility during this period - an average annual growth rate of 0.5 percent in the County’s resident employment during the 2005-2008 period and a decline of 1.0 percent in 2009, followed by an increase of 0.9 percent between 2009 and 2014. As the following chart illustrates, total quarterly distributions for withholding and estimated payments decreased 5.9 percent in FY15, which followed an increase of 4.1 percent in FY14, an increase of 4.9 percent in FY13, an increase of 11.5 percent in FY12, a decrease of 0.3 percent in FY11, another decrease of 9.0 percent in FY10, and an increase of 0.2 percent in FY09.

16
On May 18, 2015, the U.S. Supreme Court made a final ruling in the long-standing court case of Comptroller of the Treasury of Maryland v. Wynne et. ux. The case involved a dispute over the credit a state taxpayer should get for taxes paid to other states for income earned in those states. The State of Maryland gave credit for the state portion of income taxes, but not for the local portion. The U.S. Supreme Court ruled in favor of the litigants. This means that the State of Maryland owes refunds to all taxpayers who filed amended returns requesting the additional credit. Based on preliminary protective claim data from the Comptroller for the State of Maryland (Comptroller), the County estimates that the total amount of income tax refunds for tax years 2007 through 2014, including interest, attributable to the Wynne case could be $135.7 million for Montgomery County. As the Comptroller issues refunds to eligible taxpayers, the refunds will be paid from the Local Reserve Account (Account), which is maintained by the State, and the State will replenish the fund through financial transactions with counties and municipalities. As it relates to Montgomery County, the Comptroller will replenish the Account by reducing distributions in nine (9) quarterly income tax distributions starting in November 2016 until the Account is fully reimbursed. The County estimates that the impact for Montgomery County from the reduction in four quarterly distributions in fiscal year 2017 (FY17) and four in FY18 will be $60.3 million in each fiscal year, and a single reduction of $15.1 million in FY19. In addition to refunds for prior tax years, there is an estimated annual impact of $16.4 million starting with tax year 2015 – and impacting FY17 - as eligible taxpayers reduce their income tax payment to the County to reflect the deductibility of out-of-state income taxes against the local income tax. This estimated annual impact will be a permanent reduction of County income tax collections going forward.
Property Taxes
Property tax collections, which represent another major contributor of actual tax revenues to the General Fund and the second largest in FY15, amounted to $1,088.4 million in FY15, which were only $521,966 (0.05%) below the budget estimate and 1.8 percent below actual revenues in FY14. The decline in actual revenues from FY14 to FY15 is attributed to the rate cut in the General Fund from $0.759 per $100 assessed value to $0.732 per $100 per assessed value. Actual property taxes, excluding penalties and interest and other items, were $1,086.8 million in FY15 – a decrease of 1.8 percent from the previous fiscal year. Collections from penalties and interest and other items were $1.6 million – a 23.0 percent decrease from FY14.
-10.0%
-5.0%
0.0%
5.0%
10.0%
15.0%
20.0%
25.0%
$0
$250,000
$500,000
$750,000
$1,000,000
$1,250,000
$1,500,000
$1,750,000
FY06 FY07 FY08 FY09 FY10 FY11 FY12 FY13 FY14 FY15
Qu
arte
rly
Dis
trib
uti
ons
Rev
enu
es
(Th
ousa
nd
s)
Income Tax Revenues andPercent Change in Total Quarterly Distribution
Montgomery County
Income Tax Revenues Total Quarterly Distributions
SOURCE: Montgomery County Department of Finance

17
The taxable assessments for real property increased 2.4 percent from FY14 to FY15. This was the second consecutive increase since FY11 (0.4%). New construction, which added $1.409 billion to the base in FY15, was 7.6 percent higher than in FY14. Following the real estate market boom and bust cycle in the previous decade, the triennial reassessment rates experienced the same trend albeit with a lag. The recent residential and commercial real estate market recovery resulted also in a recovery of property assessments. After an unprecedented four-year decline in triennial reassessment rates (levy year LY09 - LY12), reassessments increased 4.1 percent (LY13 or FY14), 11.0 percent in LY14, and 18.7 percent in LY15.
The homestead tax credit limits annual increases in homeowners’ taxable assessments to 10 percent per year, although other taxable assessments such as commercial and investment residential properties are not limited by this credit. The homestead credit is the amount of annual assessment growth above the 10 percent limit.
$435,613 $441,517 $427,067
$353,091 $339,438 $351,217 $356,429 $379,975 $397,646 $398,838
$0 $50,000
$100,000 $150,000 $200,000 $250,000 $300,000 $350,000 $400,000 $450,000 $500,000
FY06 FY07 FY08 FY09 FY10 FY11 FY12 FY13 FY14 FY15
Med
ian
Pri
ce
Fiscal Year
Median Sales Price for Existing HomesMontgomery County
SOURCES: Metropolitan Regional Information System, Inc.Montgomery County Department of Finance
63.3%
43.4%
16.2%
-10.6%-17.0% -14.5%
-8.6%
4.1%11.0%
18.7%
-40.0%
-20.0%
0.0%
20.0%
40.0%
60.0%
80.0%
2006 2007 2008 2009 2010 2011 2012 2013 2014 2015
Rea
sses
smen
t R
ate
Levy Year
Real Property Reassessments by Levy Year(Three-Year Phase-In)
Montgomery County
SOURCE: State Department of Assessments and Taxation

18
Following several years of declining reassessments, most properties that had built up a significant amount of homestead credit during the housing boom cycle, used up their homestead credit during the housing bust cycle. As a result, the remaining amount of the aggregate homestead credit added only $26.6 million to the assessable base in FY15 down from $106.2 million in FY14.
Assessments of personal property decreased 1.5 percent in FY15 due to weakness in all three tax categories: individual, public utility, and corporate. Personal property assessments increased 2.9 percent in FY14 attributed to increases in corporate personal property and public utility assessments. For the previous five fiscal years (FY10 - FY14), taxable assessments for personal property averaged $3.803 billion ranging from a low of $3.605 billion in FY13 to a high of $4.124 billion in FY10.
Transfer and Recordation Taxes
Another major tax revenue category in the County is the combination of real property transfer and recordation taxes. The combined tax receipts from these sources in FY15 were $147.6 million (excluding recordation tax revenues earmarked for CIP funding of school construction, rental assistance, and CIP funding for the County; and transfer tax revenues from condominium conversions). Although actual revenues increased in FY15, they were 10.1 percent below the budget estimate. As the accompanying chart illustrates, the total amount collected from these taxes increased to a peak of $241.7 million in FY06 before declining to $107.2 million in FY09. In FY10, taxes from the combined transfer and recordation taxes rebounded to $122.0 million, increased further to $129.5 million in FY11, declined to $127.3 million in FY12, and began a steady increase to $142.0 million in FY13, 144.5 million in FY14, and $147.6 million in FY15.
$0
$200,000,000
$400,000,000
$600,000,000
$800,000,000
$1,000,000,000
$1,200,000,000
FY06 FY07 FY08 FY09 FY10 FY11 FY12 FY13 FY14 FY15
Property Tax Revenues* Montgomery County
SOURCE: Montgomery County Department of Finance * General Fund only and excludes penalties and interest

19
General Fund revenues from the transfer tax experienced an increase of 1.7 percent in FY15 and a 2.9 percent increase in the recordation tax. Because of the increase in existing home sales in FY15 (3.1%) and a modest increase in median sales prices (0.3%), revenues from the residential sector for both taxes were $105.4 million, an increase of 3.5 percent from FY14. The number of residential transfers increased to 14,736 (1.1%).
Based on the amount of revenues from the non-residential transfer tax, the commercial market increased 13.7 percent in FY15 from FY14 with revenues at $17.5 million. The increase in revenues from the commercial market was attributed to strong growth in the average transfer tax of $110,498 in FY15 compared to $82,535 in FY14 (33.9%) even though the number of transactions decreased from 186 in FY14 to 158 in FY15.
$0
$50,000,000
$100,000,000
$150,000,000
$200,000,000
$250,000,000
$300,000,000
FY06 FY07 FY08 FY09 FY10 FY11 FY12 FY13 FY14 FY15
Fiscal Year
Collections from the Transfer* and Recordation Taxes** Montgomery County
Transfer* Recordation**
SOURCE: Montgomery County Department of Finance
* Excludes condominium conversions ** Excludes School CIP, rental assistance, and County CIP
23,803 18,389
13,066 12,57216,440
12,779 12,060 13,420 14,569 14,736
0
5,000
10,000
15,000
20,000
25,000
FY06 FY07 FY08 FY09 FY10 FY11 FY12 FY13 FY14 FY15
Nu
mb
er
Fiscal Year
Number of Residential Transfers Montgomery County
SOURCE: Selected Operations Summary Reports, Montgomery County Department of Finance
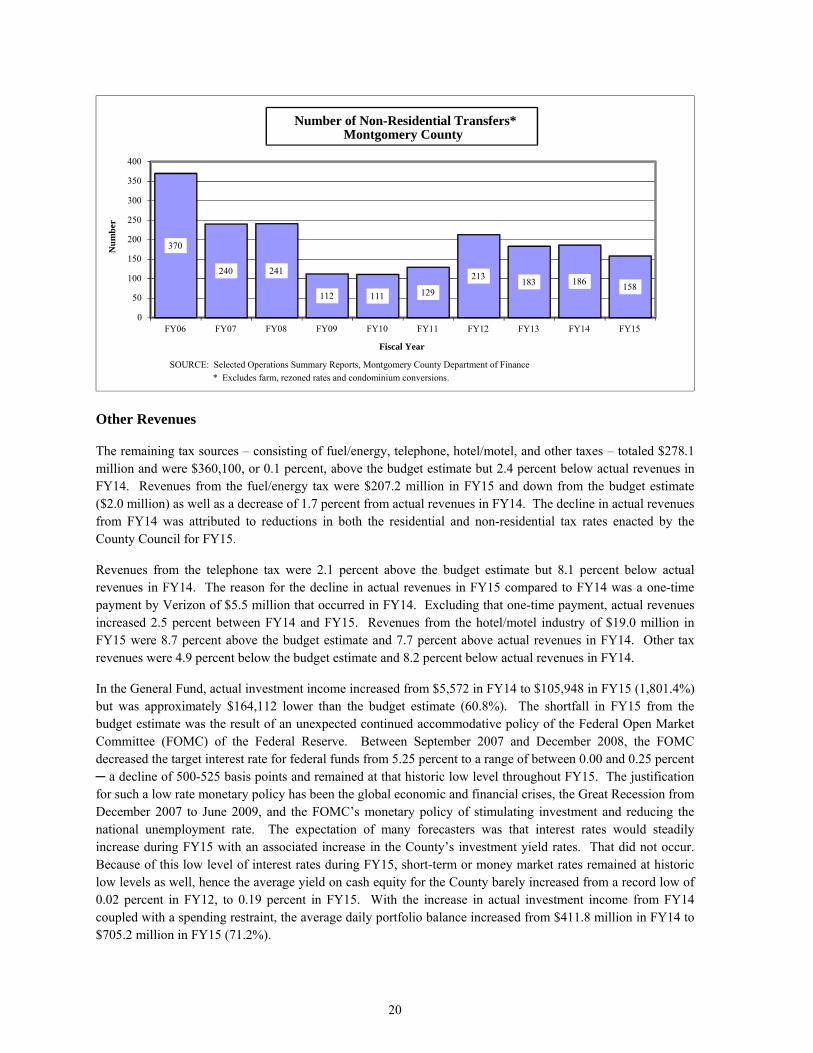
20
Other Revenues
The remaining tax sources – consisting of fuel/energy, telephone, hotel/motel, and other taxes – totaled $278.1 million and were $360,100, or 0.1 percent, above the budget estimate but 2.4 percent below actual revenues in FY14. Revenues from the fuel/energy tax were $207.2 million in FY15 and down from the budget estimate ($2.0 million) as well as a decrease of 1.7 percent from actual revenues in FY14. The decline in actual revenues from FY14 was attributed to reductions in both the residential and non-residential tax rates enacted by the County Council for FY15.
Revenues from the telephone tax were 2.1 percent above the budget estimate but 8.1 percent below actual revenues in FY14. The reason for the decline in actual revenues in FY15 compared to FY14 was a one-time payment by Verizon of $5.5 million that occurred in FY14. Excluding that one-time payment, actual revenues increased 2.5 percent between FY14 and FY15. Revenues from the hotel/motel industry of $19.0 million in FY15 were 8.7 percent above the budget estimate and 7.7 percent above actual revenues in FY14. Other tax revenues were 4.9 percent below the budget estimate and 8.2 percent below actual revenues in FY14.
In the General Fund, actual investment income increased from $5,572 in FY14 to $105,948 in FY15 (1,801.4%) but was approximately $164,112 lower than the budget estimate (60.8%). The shortfall in FY15 from the budget estimate was the result of an unexpected continued accommodative policy of the Federal Open Market Committee (FOMC) of the Federal Reserve. Between September 2007 and December 2008, the FOMC decreased the target interest rate for federal funds from 5.25 percent to a range of between 0.00 and 0.25 percent ─ a decline of 500-525 basis points and remained at that historic low level throughout FY15. The justification for such a low rate monetary policy has been the global economic and financial crises, the Great Recession from December 2007 to June 2009, and the FOMC’s monetary policy of stimulating investment and reducing the national unemployment rate. The expectation of many forecasters was that interest rates would steadily increase during FY15 with an associated increase in the County’s investment yield rates. That did not occur. Because of this low level of interest rates during FY15, short-term or money market rates remained at historic low levels as well, hence the average yield on cash equity for the County barely increased from a record low of 0.02 percent in FY12, to 0.19 percent in FY15. With the increase in actual investment income from FY14 coupled with a spending restraint, the average daily portfolio balance increased from $411.8 million in FY14 to $705.2 million in FY15 (71.2%).
370
240 241
112 111 129
213183 186
158
0
50
100
150
200
250
300
350
400
FY06 FY07 FY08 FY09 FY10 FY11 FY12 FY13 FY14 FY15
Nu
mb
er
Fiscal Year
Number of Non-Residential Transfers* Montgomery County
SOURCE: Selected Operations Summary Reports, Montgomery County Department of Finance
* Excludes farm, rezoned rates and condominium conversions.

21
Capital Asset and Debt Administration
Capital Assets
The County’s investment in capital assets at June 30, 2015, amounted to $4,356 million (net of accumulated depreciation and amortization), as summarized below:
Capital Assets, Net of Depreciation
June 30, 2015
Governmental Business-type Total Total
Activities Activities FY15 FY14
Land $ 907,939,533 $ 59,158,993 $ 967,098,526 $ 947,359,029
Buildings 427,101,124 158,606,950 585,708,074 544,842,197
Improvements other than buildings 33,248,117 47,356,935 80,605,052 83,359,645
Furniture, fixtures, equipment and machinery 47,950,968 13,145,829 61,096,797 62,841,077
Leasehold improvements 5,046,547 - 5,046,547 5,604,816
Automobiles and trucks 124,110,284 653,864 124,764,148 124,513,583
Infrastructure 1,149,023,975 9,328 1,149,033,303 1,175,430,667
Other assets 24,506,321 - 24,506,321 28,534,757
Construction in progress 1,356,285,477 1,828,429 1,358,113,906 1,171,661,018
Total $ 4,075,212,346 $ 280,760,328 $ 4,355,972,674 $ 4,144,146,789
Changes in the County’s capital assets for FY15 are summarized as follows:
Change in Capital Assets
For the Fiscal Year Ended June 30, 2015
Governmental Business-type Total Total
Activities Activities FY15 FY14
Beginning Balance $ 3,864,096,152 $ 280,050,637 $ 4,144,146,789 $ 3,829,857,962
Additions* 301,680,530 15,464,152 317,144,682 418,812,346
Retirements, net* 972,558 46,199 1,018,757 3,746,002
Depreciation expense 89,591,778 14,708,262 104,300,040 100,777,517
Ending Balance $ 4,075,212,346 $ 280,760,328 $ 4,355,972,674 $ 4,144,146,789
* Presented net of transfers from construction in progress; retirements are also net of related accumulated depreciation.
Major capital asset events during the current fiscal year included the following:
Roads, including underlying land, valued at $4.2 million were transferred to the County by various developers.
The Judicial Center Annex project accumulated $10.0 million in cost this fiscal year. This project provided for the planning, design, and construction of the Montgomery County Judicial Center annex,

22
the Montgomery County Judicial Center HVAC renovation, and other needed renovations to the Montgomery County Judicial Center.
The PSTA & Multi Agency Service Park – Site Development project accumulated $20.1 million in cost. This project is part of the Smart Growth Initiative and provides for land acquisition and site improvements on a site on Snouffer School Road known as the Webb Tract, or Centerpark.
Montgomery County funded Montgomery County Public Schools $175.29 million, and Montgomery College $35.52 million for construction, renovations of school facilities, and other capital expenditures.
Additional information pertaining to the County’s capital assets can be found in Notes to Financial Statements, Notes I-D5 and III-C.
Long-Term Debt
The following is a summary of the County’s gross outstanding long-term debt as of June 30, 2015:
Long-Term Debt
June 30, 2015
Governmental Business-type Total Total Activities Activities FY15 FY14
General obligation bonds $ 2,544,750,000 $ - $ 2,544,750,000 $ 2,270,500,000
Variable rate demand obligation 100,000,000 - 100,000,000 100,000,000
Bond anticipation notes 500,000,000 - 500,000,000 500,000,000
Revenue bonds 100,925,323 86,849,677 187,775,000 196,875,000
Lease revenue bonds 27,225,000 - 27,225,000 29,285,000
HUD loan 397,000 - 397,000 440,000
WSSC promissory note 9,738,106 - 9,738,106 9,708,040
Equipment notes 46,413,987 4,655,348 51,069,335 42,808,811
Certificates of participation 17,685,000 - 17,685,000 24,305,000
Capital leases 13,817,910 - 13,817,910 16,432,750
Energy performance lease 3,950,019 - 3,950,019 4,164,250
Taxable ltd. obligation certificates 86,320,000 - 86,320,000 90,020,000
Compensated absences 76,771,177 6,058,928 82,830,105 78,865,457
Other postemployment benefits 436,494,415 3,965,222 440,459,637 425,820,960
Claims payable self-insurance 141,444,612 - 141,444,612 140,205,964
Claims and judgments 1,116,395 - 1,116,395 -
Net pension liability - county 286,187,949 12,563,335 298,751,284 -
Net pension liability - state 17,878,357 - 17,878,357 -
Landfill closure costs - 15,405,918 15,405,918 15,047,140
Gude landfill remediation - 28,500,000 28,500,000 28,500,000
Total $ 4,411,115,250 $ 157,998,428 $ 4,569,113,678 $ 3,972,978,372
At June 30, 2015, the County had outstanding general obligation (GO) bonds of $2,544.7 million, with outstanding variable rate demand obligations (VRDOs) of $100 million and bond anticipation notes (BANs) of $500 million. Over the last ten years, the County issued its GO bonds once a year, with the exception of FY08, when no GO “new money” bonds were issued. The County currently finances capital construction projects with BANs. BANs are subsequently paid off by the issuance of the County’s GO bonds. Montgomery County also
23
issues bonds to finance the capital construction of MCPS, MCC, and M-NCPPC not otherwise financed by the State of Maryland.
The County continues to maintain its status as a top rated issuer of municipal securities, with the highest credit ratings possible for a local government. For its GO bonds, the County is a ‘Triple AAA’ rated County, and received ratings of Aaa from Moody’s Investors Service, Inc., AAA from Standard and Poor’s, and AAA from Fitch Ratings. County GO bonds have been consistently awarded the highest credit rating from Moody’s and Standard and Poor’s since 1973 and 1976, respectively, and from Fitch since 1991. Montgomery County is one of only 13 ‘Triple AAA’ rated counties in the nation with a population greater than 900,000.
In October 2014, the County received its annual credit ratings. Fitch cited “key rating drivers” of healthy financial fundamentals, solid operating performance, a balanced fiscal plan, a strong economic core and moderate debt ratios. Fitch also reported that the County has a sophisticated management team that uses conservative budgeting and has established debt and reserve policies that have resulted in healthy reserve and liquidity levels.
Moody’s stated that their ratings rationale reflected the County’s sizeable, strong and diverse tax base, affluent demographics, and manageable debt burden. Moody’s also cited the County’s recently improved healthier reserve position that resulted from the implementation of various new fiscal policies, and a multi-year plan to restore the County’s financial flexibility.
Standard and Poor’s rating reflected their opinion of the County’s strong economy, budgetary flexibility, budgetary performance, liquidity, management and financial policies. Standard and Poor’s also cited adequacy of the County’s debt and contingent liability profile, demonstrated resilience to economic pressure and strong management conditions.
The rating category, by definition, represents extremely strong capacity to pay principal and interest. Typically, ‘AAA’ rated counties demonstrate an ability to weather all economic cycles by maintaining tight budgetary controls, articulating and executing well-designed capital plans, maintaining sufficient reserves, and planning for future contingencies.
Significant bond-related debt activities during FY15 were:
General Obligation Bonds and Refunding Bonds – In November 2014, the County’s annual general obligation bond issue was in the amount of $500.0 million. The proceeds of this bond issue were used to pay off an equivalent amount of the County’s BANs which funded capital expenditures for transportation, education, and other County facilities. Concurrent with this annual bond sale, the County issued $297.9 million of general obligation refunding bonds to refund outstanding County bonds for debt service savings. In March 2015, the County issued an additional $58.5 million of general obligation refunding bonds to refund outstanding County bonds for debt service savings.
Bond Anticipation Notes (BANs) – Over the course of FY15, the County retired $500.0 million in BANs with general obligation bond proceeds and issued $500.0 million in BANs.
Additional information pertaining to the County’s long-term debt can be found in Notes to Financial Statements, Notes I-D8, III-E3, and III-F.
24
Economic Factors and Next Year’s Budgets and Rates
The following economic factors are reflected in the County’s FY16 budget with updates based on revised economic data subsequent to the approval of the County’s budget:
Montgomery County experienced positive economic performance during fiscal year FY15 compared to FY14. The major reasons for this were a decrease in the unemployment rate, an increase in resident employment (labor force series), an increase in payroll employment (establishment series), and an increase in the sales of existing homes. Residential construction also picked up in FY15.
The County’s economic projections in the FY16 budget assume a modest, yet improving, economic performance in CY15 with the County continuing to experience a decline in the unemployment rate in CY15. On the same calendar basis, the County projects a modest increase in total resident employment (0.9%) and in payroll employment (1.5%).
During the past ten years (CY05 – CY14), total payroll employment in Montgomery County, which is based on the survey of establishments and derived by the Department of Finance, experienced three distinct cycles: growth from CY05 to CY06 at an average annual rate of 1.2 percent, a decline from CY06 to CY10 at an average annual rate of 1.0 percent, and an increase at an average annual rate of 0.8 percent from CY10 to CY14. The Department of Finance estimates that total payroll employment is expected to increase 1.5 percent in CY15 and 1.8 percent in CY16.
Resident employment in the County, which is based on a survey of County households, provides a slightly different picture of employment growth. For example, resident employment grew at an average annual rate of 0.5 percent between CY05 and CY08 and declined 1.0 percent in CY09. From CY09 through CY14, resident employment in the County experienced an increase at an average annual rate of 0.9 percent. Resident employment is expected to increase 0.9 percent in CY15 and 2.9 percent in CY16.
The employment projections in CY15 and CY16 assume that personal income will increase 4.4 percent in CY15 and 5.1 percent in CY16 with per capita income increasing 4.2 percent in CY15 and 4.2 percent in CY16. Income data for CY15 and CY16 are based on estimates derived by the Department of Finance.
The actual and estimated increases in employment and personal income in CY14 and CY15 along with the decline in the unemployment rate reflect a positive performance in the County’s economy in FY15 and should continue into FY16.
The Federal Open Market Committee (FOMC) of the Board of Governors of the Federal Reserve System is expected to maintain the targeted federal funds rate within the target range of 0.00-0.25 percent through most of CY15 – based on the policy statement of the FOMC dated July 29, 2015. However, members of the FOMC have discussed the possibility of raising the target rate before the end of CY15 should economic data on employment and inflation warrant such an increase. Because of that uncertain policy by the FOMC, the County’s budget projections include only a modest increase in the yield on its investments from 0.17 percent in FY15 to 0.65 percent in FY16.
Inflation, as measured by the Consumer Price Index, is expected to increase 2.00 percent in FY16.

25
Other Significant Matters
The Water Quality Protection Charge (WQPC) is part of Montgomery County property tax bills. All property owners in Montgomery County pay the WQPC, including businesses, home owners’ associations, and non-profit organizations. In Paul Chod v. Montgomery County Board of Appeals (Civil No. 398704-V, entered July 23, 2015) the Montgomery County Circuit Court opined that the WQPC “is invalid per se because this charge need not reasonably relate to the stormwater management services provided by the County”. The court’s ruling reversed a decision by the Board of Appeals which had ruled that the WQPC was not at variance with state law. The County has appealed the Circuit Court’s decision to the Maryland Court of Special Appeals. In the meantime, the County Council has passed legislation explicitly designating the WQPC as an excise tax imposed under the County’s general taxing authority and making the legislation retroactive to July 1, 2013.
The County Executive introduced an FY16 Savings Plan because of a predicted revenue loss due to a shortfall in income tax distribution. This is due in part to the recent Supreme Court decision in the case of Wynne v. Comptroller for the State of Maryland. The plan targets the County Government, Montgomery County Public Schools, Montgomery College and the Maryland National Capital Park and Planning Commission. The total reduction will amount to $54.0 million spread among the various agencies in operating and capital reductions.
Requests for Information
The financial report is designed to provide a general overview of Montgomery County’s finances for all those with an interest in the County’s finances. Questions concerning any of the information provided in this report or requests for additional financial information should be addressed to Montgomery County Government, Department of Finance, 101 Monroe Street, Rockville, Maryland, 20850. This report can also be found on the County’s website, http://www.montgomerycountymd.gov (see Governments, Departments, Finance, Financial Reports).
(Rest of page intentionally left blank.)

26

BASIC FINANCIAL STATEMENTS
27
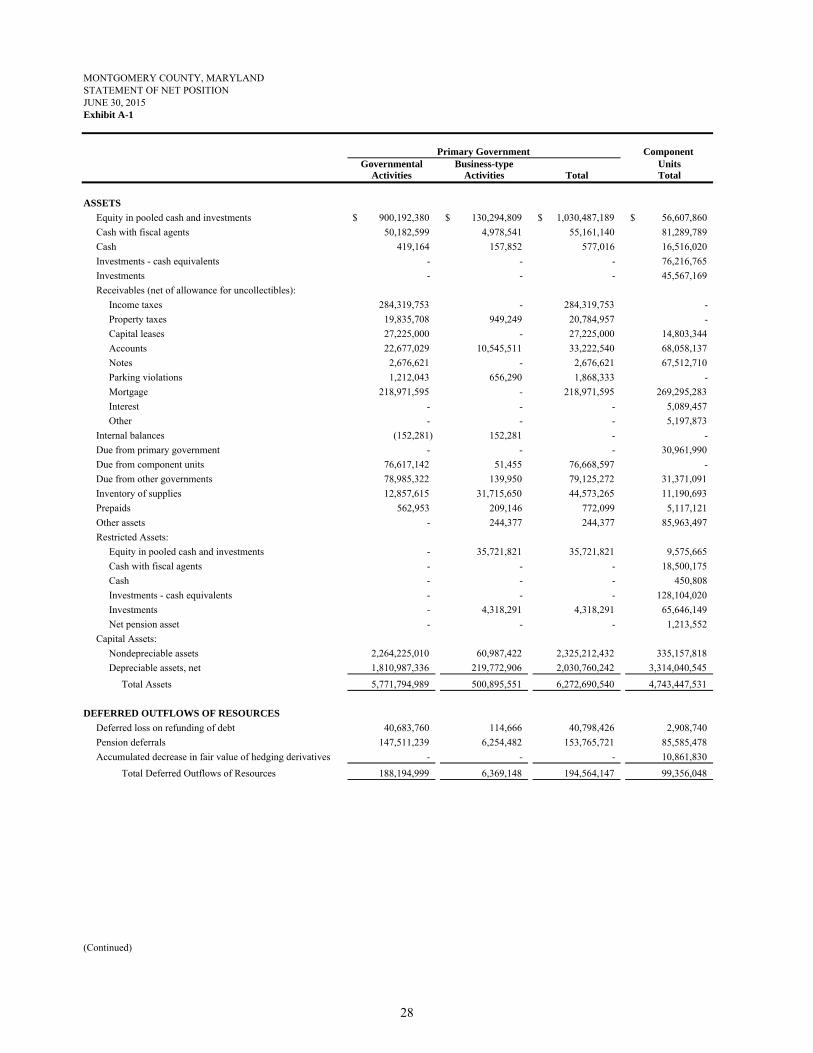
MONTGOMERY COUNTY, MARYLANDSTATEMENT OF NET POSITIONJUNE 30, 2015Exhibit A-1
Primary Government Component Governmental Business-type Units
Activities Activities Total Total
ASSETS
Equity in pooled cash and investments 900,192,380$ 130,294,809$ 1,030,487,189$ 56,607,860$
Cash with fiscal agents 50,182,599 4,978,541 55,161,140 81,289,789
Cash 419,164 157,852 577,016 16,516,020
Investments - cash equivalents - - - 76,216,765
Investments - - - 45,567,169
Receivables (net of allowance for uncollectibles):
Income taxes 284,319,753 - 284,319,753 -
Property taxes 19,835,708 949,249 20,784,957 -
Capital leases 27,225,000 - 27,225,000 14,803,344
Accounts 22,677,029 10,545,511 33,222,540 68,058,137
Notes 2,676,621 - 2,676,621 67,512,710
Parking violations 1,212,043 656,290 1,868,333 -
Mortgage 218,971,595 - 218,971,595 269,295,283
Interest - - - 5,089,457
Other - - - 5,197,873
Internal balances (152,281) 152,281 - -
Due from primary government - - - 30,961,990
Due from component units 76,617,142 51,455 76,668,597 -
Due from other governments 78,985,322 139,950 79,125,272 31,371,091
Inventory of supplies 12,857,615 31,715,650 44,573,265 11,190,693
Prepaids 562,953 209,146 772,099 5,117,121
Other assets - 244,377 244,377 85,963,497
Restricted Assets:
Equity in pooled cash and investments - 35,721,821 35,721,821 9,575,665
Cash with fiscal agents - - - 18,500,175
Cash - - - 450,808
Investments - cash equivalents - - - 128,104,020
Investments - 4,318,291 4,318,291 65,646,149
Net pension asset - - - 1,213,552
Capital Assets:
Nondepreciable assets 2,264,225,010 60,987,422 2,325,212,432 335,157,818
Depreciable assets, net 1,810,987,336 219,772,906 2,030,760,242 3,314,040,545
Total Assets 5,771,794,989 500,895,551 6,272,690,540 4,743,447,531
DEFERRED OUTFLOWS OF RESOURCES
Deferred loss on refunding of debt 40,683,760 114,666 40,798,426 2,908,740
Pension deferrals 147,511,239 6,254,482 153,765,721 85,585,478
Accumulated decrease in fair value of hedging derivatives - - - 10,861,830
Total Deferred Outflows of Resources 188,194,999 6,369,148 194,564,147 99,356,048
(Continued)
28

MONTGOMERY COUNTY, MARYLANDSTATEMENT OF NET POSITIONJUNE 30, 2015Exhibit A-1 (Concluded)
Primary Government Component Governmental Business-type Units
Activities Activities Total Total
LIABILITIES
Accounts payable 66,711,896 8,500,886 75,212,782 91,109,806
Interest payable 48,113,400 785,171 48,898,571 15,798,465
Retainage payable 29,957,091 221,203 30,178,294 5,146,735
Accrued liabilities 83,375,555 16,331,786 99,707,341 44,138,567
Deposits 164,125 10,351,969 10,516,094 20,382,415
Due to primary government - - - 78,970,161
Due to component units 30,170,796 784,870 30,955,666 -
Due to other governments 9,026,147 3,097,191 12,123,338 640,043
Unearned revenue 75,548,649 3,391,843 78,940,492 25,617,266
Other liabilities - 100,000 100,000 30,489,003
Noncurrent Liabilities:
Due within one year 964,844,069 17,805,299 982,649,368 156,760,709
Due in more than one year 3,716,957,287 144,250,962 3,861,208,249 1,899,643,976
Total Liabilities 5,024,869,015 205,621,180 5,230,490,195 2,368,697,146
DEFERRED INFLOWS OF RESOURCES
Deferred gain on refunding of debt - - - 3,570,000
Pension deferrals 225,285,936 9,803,898 235,089,834 122,685,108
Accumulated increase in fair value of hedging derivatives - - - 153,811
Total Deferred Outflows of Resources 225,285,936 9,803,898 235,089,834 126,408,919
NET POSITION
Net investment in capital assets 2,099,290,326 186,001,533 2,285,291,859 3,029,170,375
Restricted for:
Capital projects 150,178,193 - 150,178,193 123,771
General government 6,455,693 - 6,455,693 -
Public safety 29,694,100 - 29,694,100 -
Public works and transportation 15,782,586 - 15,782,586 -
Recreation 9,714,883 - 9,714,883 -
Community development and housing 248,327,371 - 248,327,371 -
Environment 15,530,356 - 15,530,356 -
Debt service 17,637,520 48,386,118 66,023,638 76,465,422
Other purposes - - - 36,222,441
Unrestricted (deficit) (1,882,775,991) 57,451,970 (1,825,324,021) (794,284,495)
Total Net Position 709,835,037$ 291,839,621$ 1,001,674,658$ 2,347,697,514$
Notes to Financial Statements are an integral part of this statement.
29
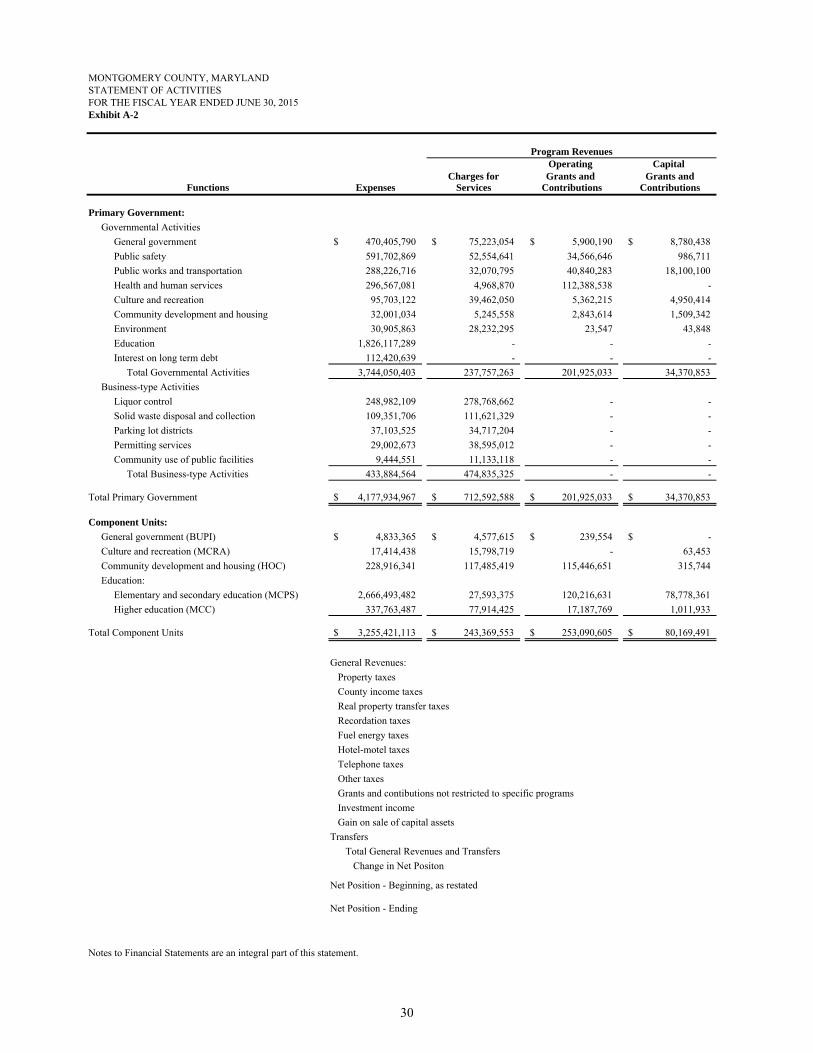
Exhibit A-2
Operating Capital Charges for Grants and Grants and
Expenses Services Contributions Contributions
Primary Government:
Governmental Activities
General government 470,405,790$ 75,223,054$ 5,900,190$ 8,780,438$
Public safety 591,702,869 52,554,641 34,566,646 986,711
Public works and transportation 288,226,716 32,070,795 40,840,283 18,100,100
Health and human services 296,567,081 4,968,870 112,388,538 -
Culture and recreation 95,703,122 39,462,050 5,362,215 4,950,414
Community development and housing 32,001,034 5,245,558 2,843,614 1,509,342
Environment 30,905,863 28,232,295 23,547 43,848
Education 1,826,117,289 - - -
Interest on long term debt 112,420,639 - - -
Total Governmental Activities 3,744,050,403 237,757,263 201,925,033 34,370,853
Business-type Activities
Liquor control 248,982,109 278,768,662 - -
Solid waste disposal and collection 109,351,706 111,621,329 - -
Parking lot districts 37,103,525 34,717,204 - -
Permitting services 29,002,673 38,595,012 - -
Community use of public facilities 9,444,551 11,133,118 - -
Total Business-type Activities 433,884,564 474,835,325 - -
Total Primary Government 4,177,934,967$ 712,592,588$ 201,925,033$ 34,370,853$
Component Units:
General government (BUPI) 4,833,365$ 4,577,615$ 239,554$ -$
Culture and recreation (MCRA) 17,414,438 15,798,719 - 63,453
Community development and housing (HOC) 228,916,341 117,485,419 115,446,651 315,744
Education:
Elementary and secondary education (MCPS) 2,666,493,482 27,593,375 120,216,631 78,778,361
Higher education (MCC) 337,763,487 77,914,425 17,187,769 1,011,933
Total Component Units 3,255,421,113$ 243,369,553$ 253,090,605$ 80,169,491$
General Revenues:
Property taxes
County income taxes
Real property transfer taxes
Recordation taxes
Fuel energy taxes
Hotel-motel taxes
Telephone taxes
Other taxes
Grants and contibutions not restricted to specific programs
Investment income
Gain on sale of capital assets
Transfers
Total General Revenues and Transfers
Change in Net Positon
Net Position - Beginning, as restated
Net Position - Ending
Notes to Financial Statements are an integral part of this statement.
Functions
MONTGOMERY COUNTY, MARYLANDSTATEMENT OF ACTIVITIESFOR THE FISCAL YEAR ENDED JUNE 30, 2015
Program Revenues
30

Governmental Business-type ComponentActivities Activities Total Units
(380,502,108)$ -$ (380,502,108)$ -$
(503,594,871) - (503,594,871) -
(197,215,538) - (197,215,538) -
(179,209,673) - (179,209,673) -
(45,928,443) - (45,928,443) -
(22,402,520) - (22,402,520) -
(2,606,173) - (2,606,173) -
(1,826,117,289) - (1,826,117,289) -
(112,420,639) - (112,420,639) -
(3,269,997,254) - (3,269,997,254) -
- 29,786,553 29,786,553 -
- 2,269,623 2,269,623 -
- (2,386,321) (2,386,321) -
- 9,592,339 9,592,339 -
- 1,688,567 1,688,567 -
- 40,950,761 40,950,761 -
(3,269,997,254)$ 40,950,761$ (3,229,046,493)$ -$
-$ -$ -$ (16,196)$
- - - (1,552,266)
- - - 4,331,473
- - - (2,439,905,115)
- - - (241,649,360)
-$ -$ -$ (2,678,791,464)$
1,528,093,085 10,903,699 1,538,996,784 -
1,276,415,595 - 1,276,415,595 -
92,068,495 - 92,068,495 -
55,530,762 - 55,530,762 -
207,195,218 - 207,195,218 -
19,007,650 - 19,007,650 -
48,839,958 - 48,839,958 -
1,092,385 - 1,092,385 -
- - - 2,752,044,530
6,787,434 215,823 7,003,257 5,759,908
3,882,648 175,100 4,057,748 231,705
55,489,227 (55,489,227) - -
3,294,402,457 (44,194,605) 3,250,207,852 2,758,036,143
24,405,203 (3,243,844) 21,161,359 79,244,679
685,429,834 295,083,465 980,513,299 2,268,452,835
709,835,037$ 291,839,621$ 1,001,674,658$ 2,347,697,514$
Primary GovernmentNet (Expense) Revenue and Changes in Net Position
31

MONTGOMERY COUNTY, MARYLANDBALANCE SHEETGOVERNMENTAL FUNDS JUNE 30, 2015Exhibit A-3
Nonmajor Total General Housing Debt Capital Governmental Governmental
Fund Initiative Grants Service Projects Funds Funds
ASSETS
Equity in pooled cash and investments 370,105,907$ 18,040,557$ 987,468$ 10,337,434$ 250,486,616$ 71,542,768$ 721,500,750$
Cash with fiscal agents 5,660,772 - - 6,931,557 37,590,270 - 50,182,599
Cash 168,664 212,450 - - - 37,750 418,864
Receivables (net of allowances for uncollectibles):
Income taxes 284,319,753 - - - - - 284,319,753
Property taxes 15,573,609 - - - 101 4,261,998 19,835,708
Capital leases - - - 27,225,000 - - 27,225,000
Accounts 8,272,579 - 1,456 1,025,787 71,074 11,307,420 20,678,316
Notes - - 1,982,881 - - 693,740 2,676,621
Parking violations 898,323 - - - - 313,720 1,212,043
Mortgages 118,021 183,020,616 32,717,031 - 305,664 2,810,263 218,971,595
Due from other funds 84,998,707 - - - - 1,484,577 86,483,284
Due from component units 113,034 48,011,715 10,991,065 - 16,489,178 419,333 76,024,325
Due from other governments 32,858,671 - 26,324,512 - 2,473,196 17,234,314 78,890,693
Inventory of supplies 6,558,337 - - - 1,842,076 - 8,400,413
Prepaids 241,589 - - - - - 241,589
Total Assets 809,887,966$ 249,285,338$ 73,004,413$ 45,519,778$ 309,258,175$ 110,105,883$ 1,597,061,553$
LIABILITIES, DEFERRED INFLOWS OF RESOURCES, AND FUND BALANCES
Liabilities:
Accounts payable 18,560,087$ 445,093$ 8,678,123$ 646,383$ 26,865,265$ 3,607,398$ 58,802,349$
Retainage payable 2,578 - - - 29,885,597 68,916 29,957,091
Accrued liabilities 49,236,445 256,521 1,571,888 10,875 3,012,296 13,053,922 67,141,947
Deposits - - - - - 164,125 164,125
Due to other funds 9,861,697 25,232 14,856,636 - 72,063,719 4,495,364 101,302,648
Due to component units 13,612,801 441,189 50,674 - 15,921,417 144,715 30,170,796
Due to other governments 1,385,967 1,545 1,940,083 - 5,336,900 251,172 8,915,667
Unearned revenue - 4,417,794 45,690,976 27,225,000 4,237,470 1,476 81,572,716
Total Liabilities 92,659,575 5,587,374 72,788,380 27,882,258 157,322,664 21,787,088 378,027,339
Deferred Inflows of Resources:
Unavailable income taxes 201,439,394 - - - - - 201,439,394
Unavailable property taxes 14,111,016 - - - - 5,762,470 19,873,486
Unavailable revenues 9,944,893 - - - 1,757,318 965,333 12,667,544
Total Deferred Inflows of Resources 225,495,303 - - - 1,757,318 6,727,803 233,980,424
Fund Balances:
Nonspendable 6,799,926 - - - 1,842,076 - 8,642,002
Restricted 231,233,570 243,697,964 216,033 17,637,520 148,336,117 81,714,835 722,836,039
Committed 70,586,279 - - - - - 70,586,279
Assigned 26,575,194 - - - - - 26,575,194
Unassigned 156,538,119 - - - - (123,843) 156,414,276
Total Fund Balances 491,733,088 243,697,964 216,033 17,637,520 150,178,193 81,590,992 985,053,790
Total Liabilities, Deferred Inflows ofof Resources, and Fund Balances 809,887,966$ 249,285,338$ 73,004,413$ 45,519,778$ 309,258,175$ 110,105,883$ 1,597,061,553$
Notes to Financial Statements are an integral part of this statement.
32

MONTGOMERY COUNTY, MARYLANDRECONCILIATION OF THE BALANCE SHEET OF GOVERNMENTAL FUNDS TO THE STATEMENT OF NET POSITIONJUNE 30, 2015Exhibit A-4
Total fund balance - governmental funds (see Exhibit A-3) 985,053,790$
Amounts reported for governmental activities in the statement of net position are difference because:
Capital assets uses in governmental fund activities are not financial resourcesand therefore not reported in the funds:
Nondepreciable capital assets:Land 907,917,027$ Construction in progress 1,356,285,477
Depreciable capital assets:Buildings 825,280,452 Improvements other than buildings 58,993,572 Furniture, fixtures, equipment and machinery 246,012,849 Automobiles and trucks 194,763,883 Infrastructure 1,838,566,022 Other capital assets 40,359,973
Total capital assets 5,468,179,255 Less accumulated depreciation (1,424,557,212) 4,043,622,043
Long-term liabilities related to governmental fund activities are not due andpayable in the current period and therefore not reported in the funds:
General obligation bonds payable (2,544,750,000) Variable rate demand obligations (100,000,000) Bond anticipation notes payable (500,000,000) Lease revenue bonds payable (27,225,000) Accrued interest payable (48,113,400) Capital leases payable (13,817,910) Taxable limited obligation (86,320,000) Certificates of participation (17,685,000) Notes payable (60,437,565) Revenue bonds (100,925,323) Net pension liability (301,273,789) Other postemployment benefits (435,353,201) Claims and judgements (1,116,395) Compensated absences (74,389,423) (4,311,407,006)
Certain costs related to long-term liabilities are recognized as expenditures in the fund statements, but are deferred in the government-wide statements:
Unamortized premiums (270,686,106) Unrecognized amount on refunding 40,683,760 Pension related deferrals, net (76,994,934) (306,997,280)
Internal service funds are used by management to provide certain goods andservices to governmental funds. The assets and liabilities of internal servicefunds are included in the government-wide statement of net position:
Assets:Current and non current assets 192,252,071 Capital assets 87,733,863 Less accumulated depreciation (56,143,560)
Deferred outflows of resources 1,399,399 Liabilities (162,867,476) Deferred inflows of resources (2,179,162) Cumulative gain/loss for certain activities of internal service funds that is reported with business-type activities (670,952) 59,524,183
Revenues in the statement of activities that do not provide current financial resources are not reported as revenues in the funds:
Income taxes 201,439,394
Property taxes 19,873,486 Intergovernmental revenue 9,693,920 Other revenue 9,032,507 240,039,307
Net position of governmental activities (See Exhibit A-1) 709,835,037$
Notes to Financial Statements are an integral part of this statement.
33

GOVERNMENTAL FUNDS
Exhibit A-5
Nonmajor TotalHousing Debt Capital Governmental Governmental
General Initiative Grants Service Projects Funds Funds
REVENUESTaxes 2,824,916,005$ 8,630,004$ -$ -$ 87,509,458$ 341,369,129$ 3,262,424,596$ Licenses and permits 10,315,894 - - - - 1,010,113 11,326,007 Intergovernmental 62,972,046 - 106,561,926 8,780,438 20,886,364 40,143,327 239,344,101 Charges for services 27,338,198 - - - 745,347 110,259,433 138,342,978 Fines and forfeitures 27,538,162 - - - - 1,989,106 29,527,268 Investment income (loss) 373,677 2,039,820 196,060 13,698 298,462 218,585 3,140,302 Miscellaneous 13,994,838 315,902 963,193 3,589,630 1,640,987 1,594,796 22,099,346
Total Revenues 2,967,448,820 10,985,726 107,721,179 12,383,766 111,080,618 496,584,489 3,706,204,598
EXPENDITURESCurrent:
General government 418,808,265 - 4,031,737 - - 13,629,965 436,469,967 Public safety 395,772,952 - 12,606,675 - - 230,487,380 638,867,007 Public works and transportation 76,675,794 - 4,953,572 - - 119,783,470 201,412,836 Health and human services 225,280,973 - 82,618,514 - - - 307,899,487 Culture and recreation 41,713,019 - 128,675 - - 44,548,109 86,389,803 Community development and housing 12,364,542 26,358,028 3,712,274 - - 31 42,434,875 Environment 1,778,768 - 23,881 - - 20,025,958 21,828,607 Education 1,615,305,046 - - - - - 1,615,305,046
Debt Service:Principal retirement - - - 197,878,016 - - 197,878,016 Leases and other obligations - - - 27,134,321 - - 27,134,321 Interest - - - 124,957,396 - - 124,957,396 Issuing costs - - - 5,669,380 - - 5,669,380
Capital projects - - - - 556,683,579 - 556,683,579 Total Expenditures 2,787,699,359 26,358,028 108,075,328 355,639,113 556,683,579 428,474,913 4,262,930,320
Excess (Deficiency) of Revenuesover (under) Expenditures 179,749,461 (15,372,302) (354,149) (343,255,347) (445,602,961) 68,109,576 (556,725,722)
OTHER FINANCING SOURCES (USES)Transfers in 71,260,768 28,964,534 570,182 333,003,054 66,817,294 17,740,440 518,356,272 Transfers (out) (359,252,986) (12,795,711) - - (10,392,257) (70,272,568) (452,713,522) Sale of property - 1,526,002 - - 2,070,265 - 3,596,267 Financing under notes and leases payable 231,235 - - - 17,897,176 - 18,128,411 Payment to refunded bond escrow agent - - - (429,855,226) - - (429,855,226) Debt Issued:
General obligation bonds - - - 500,000,000 - - 500,000,000 Premium on original issue debt - - - 18,150,223 63,703,027 - 81,853,250 Bond anticipation notes - - - (500,000,000) 500,000,000 - - General obligation refunding bonds - - - 356,510,000 - - 356,510,000 Premium on general obligation refunding bonds - - - 74,595,486 - - 74,595,486
Total Other Financing Sources (Uses) (287,760,983) 17,694,825 570,182 352,403,537 640,095,505 (52,532,128) 670,470,938 Net Change in Fund Balances (108,011,522) 2,322,523 216,033 9,148,190 194,492,544 15,577,448 113,745,216
Fund Balances - Beginning of Year 599,744,610 241,375,441 - 8,489,330 (44,314,351) 66,013,544 871,308,574
Fund Balances - End of Year 491,733,088$ 243,697,964$ 216,033$ 17,637,520$ 150,178,193$ 81,590,992$ 985,053,790$
Notes to Financial Statements are an integral part of this statement.
MONTGOMERY COUNTY, MARYLANDSTATEMENT OF REVENUES, EXPENDITURES, AND CHANGES IN FUND BALANCE
FOR THE FISCAL YEAR ENDED JUNE 30, 2015
34
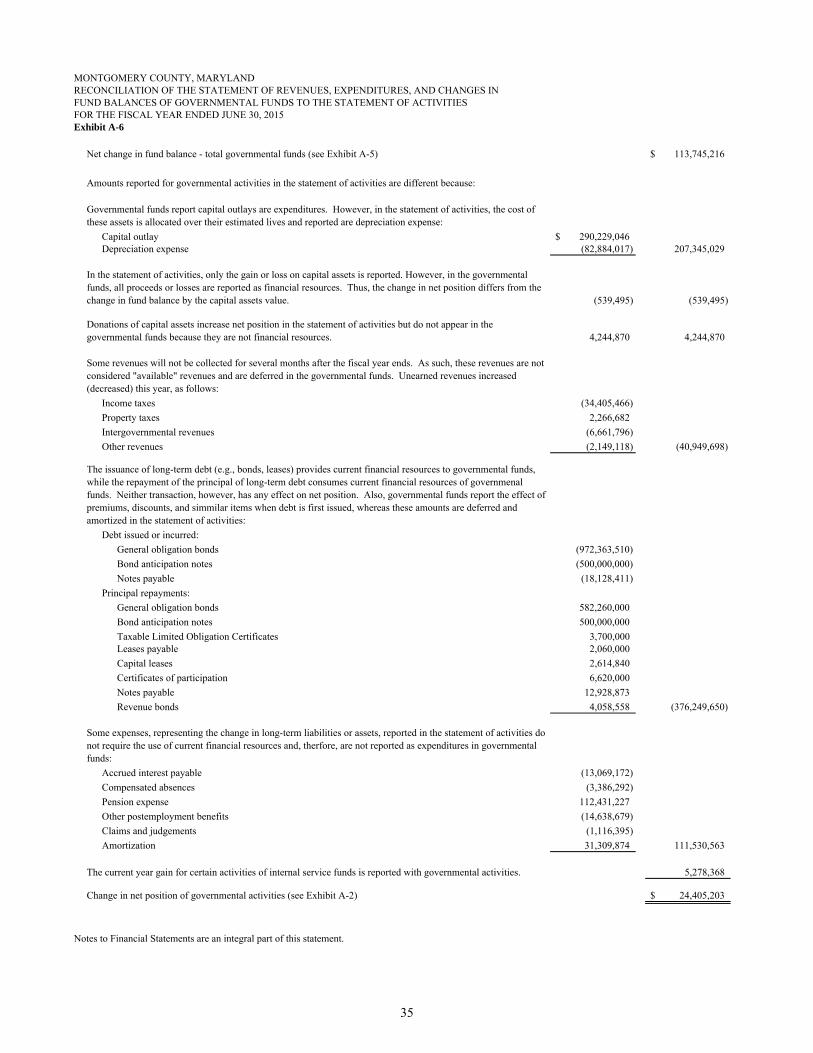
MONTGOMERY COUNTY, MARYLANDRECONCILIATION OF THE STATEMENT OF REVENUES, EXPENDITURES, AND CHANGES IN FUND BALANCES OF GOVERNMENTAL FUNDS TO THE STATEMENT OF ACTIVITIESFOR THE FISCAL YEAR ENDED JUNE 30, 2015Exhibit A-6
Net change in fund balance - total governmental funds (see Exhibit A-5) 113,745,216$
Amounts reported for governmental activities in the statement of activities are different because:
Capital outlay 290,229,046$ Depreciation expense (82,884,017) 207,345,029
(539,495) (539,495)
4,244,870 4,244,870
Income taxes (34,405,466)
Property taxes 2,266,682
Intergovernmental revenues (6,661,796)
Other revenues (2,149,118) (40,949,698)
Debt issued or incurred:
General obligation bonds (972,363,510)
Bond anticipation notes (500,000,000)
Notes payable (18,128,411)
Principal repayments:
General obligation bonds 582,260,000
Bond anticipation notes 500,000,000
Taxable Limited Obligation Certificates 3,700,000 Leases payable 2,060,000
Capital leases 2,614,840
Certificates of participation 6,620,000
Notes payable 12,928,873
Revenue bonds 4,058,558 (376,249,650)
Accrued interest payable (13,069,172)
Compensated absences (3,386,292)
Pension expense 112,431,227
Other postemployment benefits (14,638,679)
Claims and judgements (1,116,395)
Amortization 31,309,874 111,530,563
5,278,368
Change in net position of governmental activities (see Exhibit A-2) 24,405,203$
Notes to Financial Statements are an integral part of this statement.
Some expenses, representing the change in long-term liabilities or assets, reported in the statement of activities do not require the use of current financial resources and, therfore, are not reported as expenditures in governmental funds:
The current year gain for certain activities of internal service funds is reported with governmental activities.
Governmental funds report capital outlays are expenditures. However, in the statement of activities, the cost of these assets is allocated over their estimated lives and reported are depreciation expense:
In the statement of activities, only the gain or loss on capital assets is reported. However, in the governmental funds, all proceeds or losses are reported as financial resources. Thus, the change in net position differs from the change in fund balance by the capital assets value.
Donations of capital assets increase net position in the statement of activities but do not appear in the governmental funds because they are not financial resources.
Some revenues will not be collected for several months after the fiscal year ends. As such, these revenues are not considered "available" revenues and are deferred in the governmental funds. Unearned revenues increased (decreased) this year, as follows:
The issuance of long-term debt (e.g., bonds, leases) provides current financial resources to governmental funds, while the repayment of the principal of long-term debt consumes current financial resources of governmenal funds. Neither transaction, however, has any effect on net position. Also, governmental funds report the effect of premiums, discounts, and simmilar items when debt is first issued, whereas these amounts are deferred and amortized in the statement of activities:
35

MONTGOMERY COUNTY, MARYLANDSTATEMENT OF NET POSITIONPROPRIETARY FUNDS
Exhibit A-7
Business-Type Activities - Enterprise Funds GovernmentalParking Nonmajor Activities-
Solid Waste Lot Enterprise InternalLiquor Activities Districts Funds Totals Service Funds
ASSETS
Current Assets:
Equity in pooled cash and investments 4,256,413$ 34,843,117$ 29,870,947$ 61,324,332$ 130,294,809$ 178,691,630$
Cash with fiscal agents 4,953,589 - 24,952 - 4,978,541 -
Cash 50,500 3,000 104,352 - 157,852 300
Receivables (net of allowance for uncollectibles):
Property taxes - - 949,249 - 949,249 -
Accounts 5,910,374 4,426,110 - 209,027 10,545,511 1,679,910
Parking violations - - 656,290 - 656,290 -
Due from other funds 4,198 - - - 4,198 6,414,219
Due from component units - 51,455 - - 51,455 592,817
Due from other governments - 139,950 - - 139,950 94,629
Inventory of supplies 31,715,650 - - - 31,715,650 4,457,202
Prepaids 209,146 - - - 209,146 321,364
Other assets 244,377 - - - 244,377 -
Total Current Assets 47,344,247 39,463,632 31,605,790 61,533,359 179,947,028 192,252,071
Noncurrent Assets:
Restricted Assets:
Equity in pooled cash and equivalents - 31,379,774 4,342,047 - 35,721,821 -
Investments - - 4,318,291 - 4,318,291 -
Restricted Assets - 31,379,774 8,660,338 - 40,040,112 -
Capital Assets:
Land, improved and unimproved 7,033,656 17,834,755 34,290,582 - 59,158,993 22,506
Improvements other than buildings 15,054,010 81,554,468 80,074,181 - 176,682,659 268,565
Infrastructure - 14,351 - - 14,351 -
Buildings 26,208,903 32,750,237 236,227,000 - 295,186,140 -
Furniture, fixtures, equipment, and machinery 13,243,556 13,438,280 1,060,733 2,352,077 30,094,646 3,858,514
Automobiles and trucks 3,409,382 293,766 122,153 342,136 4,167,437 83,584,278
Construction in progress - - 1,828,429 - 1,828,429 -
Subtotal 64,949,507 145,885,857 353,603,078 2,694,213 567,132,655 87,733,863
Less: Accumulated depreciation 11,643,387 107,375,646 165,303,465 2,049,829 286,372,327 56,143,560
Total Capital Assets (net of
accumulated depreciation) 53,306,120 38,510,211 188,299,613 644,384 280,760,328 31,590,303
Total Noncurrent Assets 53,306,120 69,889,985 196,959,951 644,384 320,800,440 31,590,303
Total Assets 100,650,367 109,353,617 228,565,741 62,177,743 500,747,468 223,842,374
DEFERRED OUTFLOWS OF RESOURCES
Deferred loss on refunding of debt - - 114,666 - 114,666 -
Pension deferrals 1,726,287 1,092,062 413,152 3,022,981 6,254,482 1,399,399
Total Deferred Outflows of Resources 1,726,287 1,092,062 527,818 3,022,981 6,369,148 1,399,399
(Continued)
JUNE 30, 2015
36
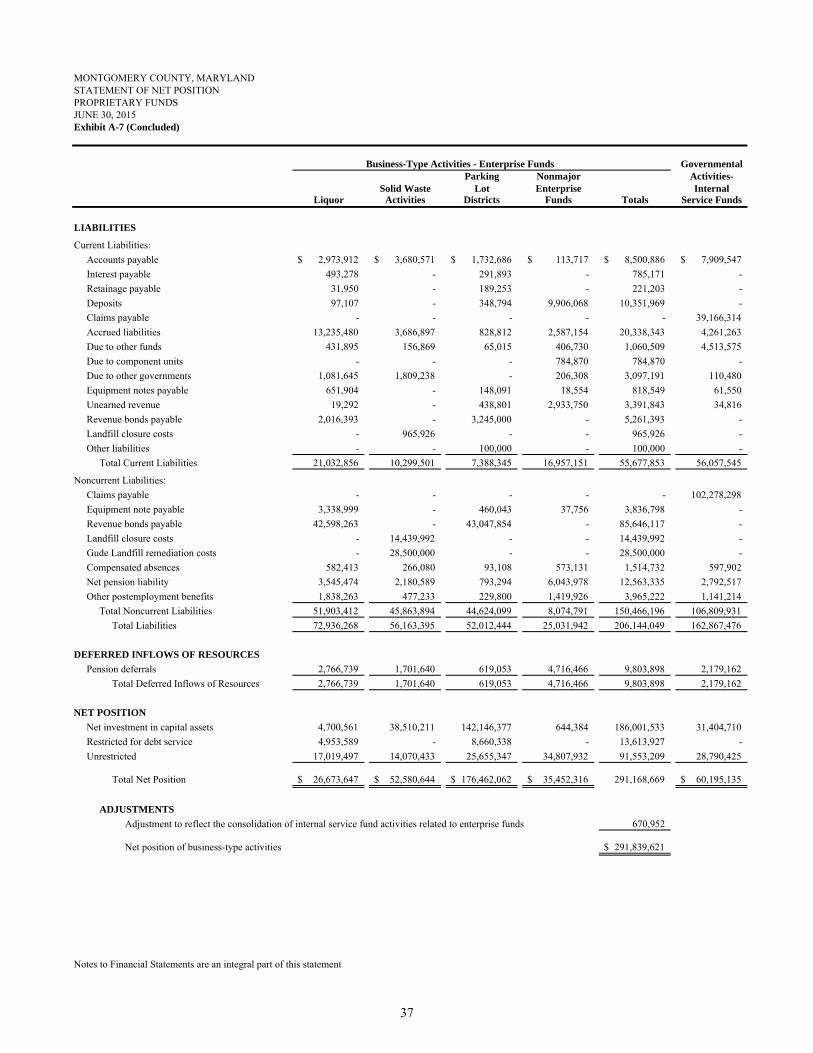
MONTGOMERY COUNTY, MARYLANDSTATEMENT OF NET POSITIONPROPRIETARY FUNDS
Exhibit A-7 (Concluded)
Business-Type Activities - Enterprise Funds GovernmentalParking Nonmajor Activities-
Solid Waste Lot Enterprise InternalLiquor Activities Districts Funds Totals Service Funds
LIABILITIES
Current Liabilities:
Accounts payable 2,973,912$ 3,680,571$ 1,732,686$ 113,717$ 8,500,886$ 7,909,547$
Interest payable 493,278 - 291,893 - 785,171 -
Retainage payable 31,950 - 189,253 - 221,203 -
Deposits 97,107 - 348,794 9,906,068 10,351,969 -
Claims payable - - - - - 39,166,314
Accrued liabilities 13,235,480 3,686,897 828,812 2,587,154 20,338,343 4,261,263
Due to other funds 431,895 156,869 65,015 406,730 1,060,509 4,513,575
Due to component units - - - 784,870 784,870 -
Due to other governments 1,081,645 1,809,238 - 206,308 3,097,191 110,480
Equipment notes payable 651,904 - 148,091 18,554 818,549 61,550
Unearned revenue 19,292 - 438,801 2,933,750 3,391,843 34,816
Revenue bonds payable 2,016,393 - 3,245,000 - 5,261,393 -
Landfill closure costs - 965,926 - - 965,926 -
Other liabilities - - 100,000 - 100,000 -
Total Current Liabilities 21,032,856 10,299,501 7,388,345 16,957,151 55,677,853 56,057,545
Noncurrent Liabilities:
Claims payable - - - - - 102,278,298
Equipment note payable 3,338,999 - 460,043 37,756 3,836,798 -
Revenue bonds payable 42,598,263 - 43,047,854 - 85,646,117 -
Landfill closure costs - 14,439,992 - - 14,439,992 -
Gude Landfill remediation costs - 28,500,000 - - 28,500,000 -
Compensated absences 582,413 266,080 93,108 573,131 1,514,732 597,902
Net pension liability 3,545,474 2,180,589 793,294 6,043,978 12,563,335 2,792,517
Other postemployment benefits 1,838,263 477,233 229,800 1,419,926 3,965,222 1,141,214
Total Noncurrent Liabilities 51,903,412 45,863,894 44,624,099 8,074,791 150,466,196 106,809,931
Total Liabilities 72,936,268 56,163,395 52,012,444 25,031,942 206,144,049 162,867,476
DEFERRED INFLOWS OF RESOURCES
Pension deferrals 2,766,739 1,701,640 619,053 4,716,466 9,803,898 2,179,162
Total Deferred Inflows of Resources 2,766,739 1,701,640 619,053 4,716,466 9,803,898 2,179,162
NET POSITION
Net investment in capital assets 4,700,561 38,510,211 142,146,377 644,384 186,001,533 31,404,710
Restricted for debt service 4,953,589 - 8,660,338 - 13,613,927 -
Unrestricted 17,019,497 14,070,433 25,655,347 34,807,932 91,553,209 28,790,425
Total Net Position 26,673,647$ 52,580,644$ 176,462,062$ 35,452,316$ 291,168,669 60,195,135$
ADJUSTMENTS
Adjustment to reflect the consolidation of internal service fund activities related to enterprise funds 670,952
Net position of business-type activities 291,839,621$
Notes to Financial Statements are an integral part of this statement
JUNE 30, 2015
37

MONTGOMERY COUNTY, MARYLANDSTATEMENT OF REVENUES, EXPENSES, AND CHANGES IN FUND NET POSITIONPROPRIETARY FUNDSFOR THE FISCAL YEAR ENDED JUNE 30, 2015Exhibit A-8
Business-Type Activities - Enterprise Funds GovernmentalParking Nonmajor Activities-
Solid Waste Lot Enterprise InternalLiquor Activities Districts Funds Totals Service Funds
OPERATING REVENUES
Sales - net 276,691,515$ -$ -$ -$ 276,691,515$ -$
Charges for services 15,222 111,447,010 26,313,744 13,044,135 150,820,111 284,793,584
Licenses and permits 1,756,197 13,940 1,107 36,573,945 38,345,189 -
Fines and penalties 159,606 69,534 7,589,091 114,445 7,932,676 2,028,838
Claim recoveries - - - - - -
Total Operating Revenues 278,622,540 111,530,484 33,903,942 49,732,525 473,789,491 286,822,422
OPERATING EXPENSES
Cost of goods sold 199,491,617 - - - 199,491,617 -
Personnel costs 28,827,501 12,668,127 4,351,889 24,051,623 69,899,140 26,426,440
Other post employment contributions 1,520,450 378,920 249,420 1,069,600 3,218,390 1,155,930
Postage 12,232 65,885 7,867 11,998 97,982 1,181,040
Self-insurance incurred and estimated claims - - - - - 170,602,742
Insurance 772,318 1,011,313 49,239 306,250 2,139,120 6,543,604
Supplies and materials 514,512 1,258,668 546,378 596,016 2,915,574 28,637,625
Contractual services 3,763,178 88,744,000 6,747,380 6,186,214 105,440,772 13,621,870
Communications 458,371 202,358 191,525 344,047 1,196,301 897,704
Transportation 1,140,515 1,927,292 273,002 682,297 4,023,106 342,780
Public utility services 748,157 150,031 2,306,089 1,916,754 5,121,031 628,198
Rentals 6,498,225 16,273 1,926,641 2,657,586 11,098,725 2,018,239
Maintenance 864,620 871,254 3,823,079 330,747 5,889,700 13,671,810
Depreciation 2,118,550 1,494,418 10,950,555 144,736 14,708,259 6,876,103
Landfill closure expense - 358,778 - - 358,778 -
Other 564,350 224,382 4,330,460 94,998 5,214,190 129,600
Total Operating Expenses 247,294,596 109,371,699 35,753,524 38,392,866 430,812,685 272,733,685
Operating Income (Loss) 31,327,944 2,158,785 (1,849,582) 11,339,659 42,976,806 14,088,737
NONOPERATING REVENUES (EXPENSES)
Property taxes - - 10,903,699 - 10,903,699 -
Gain (loss) on disposal of capital assets (46,198) 175,100 - - 128,902 825,876
Investment income 23,735 63,194 48,444 80,450 215,823 253,562
Interest expense (1,884,215) - (1,375,988) (809) (3,261,012) (4,499)
Miscellaneous - - - (3,356) (3,356) -
Other revenue 46,048 50,845 801,539 (1,039) 897,393 -
Insurance recoveries 100,074 40,000 11,723 - 151,797 503,547
Total Nonoperating Revenues (Expenses) (1,760,556) 329,139 10,389,417 75,246 9,033,246 1,578,486
Income (Loss) Before Capital
Contributions and Transfers 29,567,388 2,487,924 8,539,835 11,414,905 52,010,052 15,667,223
Transfers In (Out):
Transfers in - - - 25,000 25,000 592,388
Transfers out (34,147,753) (2,555,079) (14,157,772) (4,653,623) (55,514,227) (10,745,911)
Total Transfers In (Out) (34,147,753) (2,555,079) (14,157,772) (4,628,623) (55,489,227) (10,153,523)
Change in Net Position (4,580,365) (67,155) (5,617,937) 6,786,282 (3,479,175) 5,513,700
Total Net Position - Beginning of Year, as restated 31,254,012 52,647,799 182,079,999 28,666,034 54,681,435
Total Net Position - End of Year 26,673,647$ 52,580,644$ 176,462,062$ 35,452,316$ 60,195,135$
ADJUSTMENTS
Adjustment to reflect the consolidation of internal service fund activities related to enterprise funds 235,331
Change in net position of business-type activities (3,243,844)$
Notes to Financial Statements are an integral part of this statement
38

MONTGOMERY COUNTY, MARYLANDSTATEMENT OF CASH FLOWSPROPRIETARY FUNDSFOR THE FISCAL YEAR ENDED JUNE 30, 2015Exhibit A-9
GovernmentalParking Nonmajor Activities -
Solid Waste Lot Enterprise InternalLiquor Activities Districts Funds Totals Service Funds
CASH FLOWS FROM OPERATING ACTIVITIESReceipts from customers 276,130,398$ 110,803,332$ 35,038,021$ 48,567,829$ 470,539,580$ 284,811,091$ Payments to suppliers (210,497,630) (95,934,437) (17,124,741) (14,495,626) (338,052,434) (91,891,741) Payments to employees (30,934,543) (11,657,220) (4,577,128) (26,399,181) (73,568,072) (27,710,737) Internal activity - payments from other funds - - - 1,153,770 1,153,770 - Other operating receipts 46,048 - 801,539 5,063,522 5,911,109 - Other operating payments (564,350) - (4,330,460) (4,665,998) (9,560,808) - Miscellaneous - - - (3,356) (3,356) - Claims paid - - - - - (147,089,695) Other revenue - 50,845 - (1,039) 49,806 542,457
Net Cash Provided (Used) by Operating Activities 34,179,923 3,262,520 9,807,231 9,219,921 56,469,595 18,661,375
CASH FLOWS FROM NONCAPITAL FINANCING ACTIVITIESProperty tax collections - - 10,903,701 - 10,903,701 - Insurance reimbursement claims 100,074 40,000 11,723 - 151,797 503,547 Operating subsidies and transfers from other funds - - - 25,000 25,000 - Operating subsidies and transfers to other funds (34,147,753) (2,555,079) (14,157,772) (4,653,623) (55,514,227) (10,745,911)
Net Cash Provided (Used) by Noncapital Financing Activities (34,047,679) (2,515,079) (3,242,348) (4,628,623) (44,433,729) (10,242,364)
CASH FLOWS FROM CAPITAL AND RELATED FINANCING ACTIVITIESProceeds from equipment note - - 608,130 - 608,130 - Proceeds from sale of capital assets - 175,100 - - 175,100 922,258 Retirement of equipment note payable (262,956) - - - (262,956) - Acquisition and construction of capital assets (436,595) (1,017,151) (13,638,575) - (15,092,321) (7,038,275) Principal paid on capital debt (1,921,442) - (3,120,000) - (5,041,442) (120,422) Interest paid on capital debt (2,090,538) - (1,818,922) (809) (3,910,269) (4,499) Internal activity - payments from other funds - - - - - 592,388
Net Cash Provided (Used) by Capital and Related Financing Activities (4,711,531) (842,051) (17,969,367) (809) (23,523,758) (5,648,550)
CASH FLOWS FROM INVESTING ACTIVITIESInvestment income from pooled investments 23,735 63,194 45,583 80,450 212,962 253,562
Net Cash Provided (Used) by Investing Activities 23,735 63,194 45,583 80,450 212,962 253,562 Net Increase (Decrease) in Cash and Cash Equivalents (4,555,552) (31,416) (11,358,901) 4,670,939 (11,274,930) 3,024,023
Balances - Beginning of Year 13,816,054 66,257,307 45,701,199 56,653,393 182,427,953 175,667,907
Balances - End of Year 9,260,502$ 66,225,891$ 34,342,298$ 61,324,332$ 171,153,023$ 178,691,930$
Reconciliation of operating income (loss) to net cash provided by operating activities:Operating income (loss) 31,327,944$ 2,158,785$ (1,849,582)$ 11,339,659$ 42,976,806$ 14,088,737$ Adjustments to reconcile operating income (loss) to net cash provided (used) by operating activities:
Depreciation and amortization 2,118,550 1,494,418 10,950,555 144,736 14,708,259 6,876,103 Other revenue 46,048 50,845 801,539 (1,039) 897,393 - Other operating expenses - 3,100 - - 3,100 - Pension expense (1,334,448) (851,067) (325,479) (2,355,013) (4,866,007) (1,090,774) Miscellaneous - - - (3,356) (3,356) - Effect of changes in operating assets and liabilities:
Receivables, net (2,484,428) (730,252) 694,452 (114,402) (2,634,630) (1,468,875) Inventories, prepaids and other assets 4,805 928 3,040 - 8,773 307,736 Accounts payable and other liabilities 3,766,114 (705,464) (814,739) (150,337) 2,095,574 (968,968) Claims payable - - - - - 181,574 Accrued expenses 735,338 1,841,227 347,445 359,673 3,283,683 735,842
Net Cash Provided (Used) by Operating Activities 34,179,923$ 3,262,520$ 9,807,231$ 9,219,921$ 56,469,595$ 18,661,375$
Noncash investing, capital and financing activities:Change in fair value of investments that are not cash and cash equivalents -$ -$ 2,862$ -$ 2,862$ -$
Capital asset disposals (46,198)$ -$ -$ -$ (46,198)$ -$
Notes to Financial Statements are an integral part of this statement.
Business Type Activities - Enterprise Funds
39

MONTGOMERY COUNTY, MARYLANDSTATEMENT OF FIDUCIARY NET POSITIONFIDUCIARY FUNDSJUNE 30, 2015Exhibit A-10
Pension andOther Employee Private-
Benefit Investment Purpose AgencyTrusts Trust Trusts Funds
ASSETSCurrent Assets:
Equity in pooled cash and investments 2,343,846$ 33,951,853$ 60,024$ 34,313,582$ Cash - - - 132,871 Investments:
Government and agency obligations 395,527,073 - - - Asset-backed securities 3,464,339 - - - Municipal/Provincial bonds 12,358,783 - - - Corporate bonds 656,471,268 - - - Common and preferred stock 1,579,564,329 - - - Mutual and commingled funds 1,482,242,915 - - - Short-term investments 123,719,444 - - - Cash collateral received under securities lending agreements 302,098,311 - - - Real assets 384,276,512 - - - Private equity 269,370,516 - - -
Total Investments 5,209,093,490 - - - Receivables (net of allowances for uncollectibles):
Receivables and accured interest 7,079,900 - - - Property taxes - - - 5,137,786 Accounts 326,661 - - 584,433
Due from other funds 14,302,665 - - - Due from component units 2,301,564 - - - Due from other governments 109,408 - - 295,332
Total Current Assets 5,235,557,534 33,951,853 60,024 40,464,004 Noncurrent Assets:
Capital assets:Miscellaneous 900,043 - - -
Less: Accumulated depreciation 300,014 - - - Total Capital Assets (net of accumulated depreciation) 600,029 - - -
Total Assets 5,236,157,563 33,951,853 60,024 40,464,004$
LIABILITIESCurrent Liabilities:
Accounts payable 302,839,486 - 44,585 130,586 Accrued liabilities 5,589,983 - - - Deposits - - - 3,927,371 Claims payable 4,253,303 - - - Due to other funds 17,634 - - 310,000 Due to component units - - - 6,324 Due to other governments - - - 1,395,642 Uncollected property taxes due to governments - - - 4,812,994 Undistributed taxes and refunds - - - 3,423,955 Unearned revenue 77,121 - - - Tax sale surplus and redemptions payable - - - 3,744,750 Other liabilities - - - 22,712,382
Total Current Liabilities 312,777,527 - 44,585 40,464,004 Noncurrent Liabilities:
Compensated absences 49,588 - - -
Total Liabilities 312,827,115 - 44,585 40,464,004$
NET POSITIONHeld in trust for pension and other postemployment benefits,external investment pool participants, and other purposes 4,923,330,448$ 33,951,853$ 15,439$
Notes to the Financial Statements are an integral part of this statement.
40
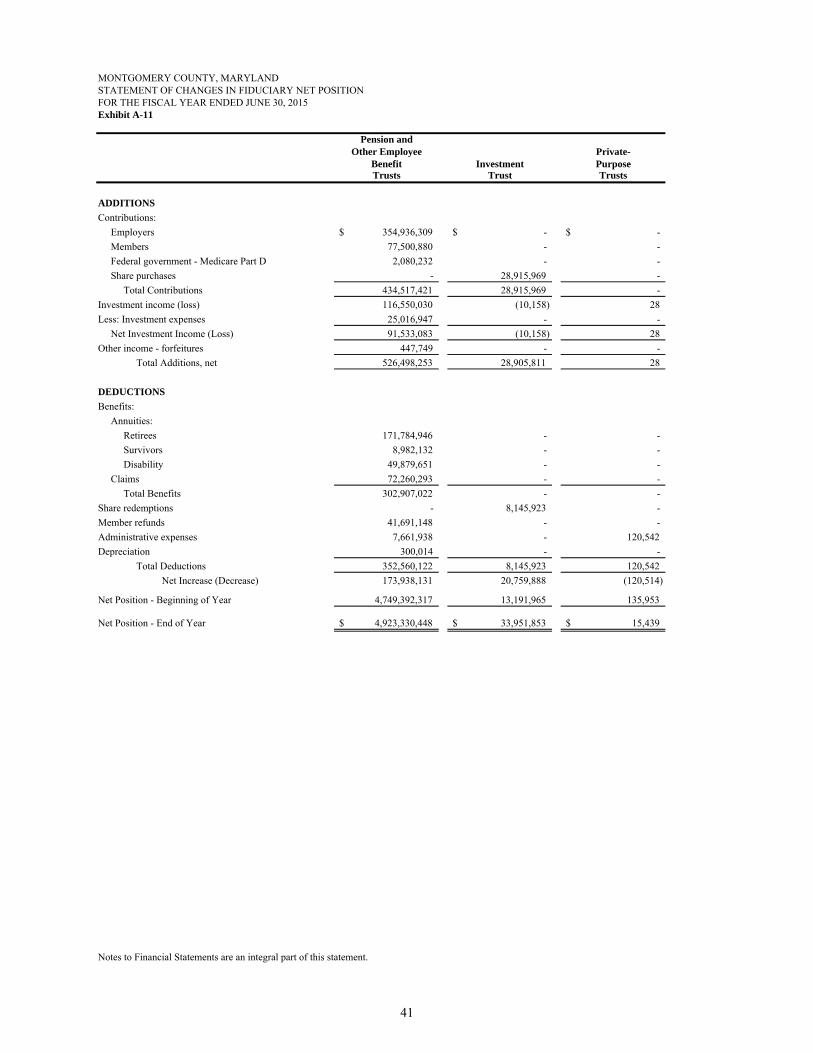
MONTGOMERY COUNTY, MARYLANDSTATEMENT OF CHANGES IN FIDUCIARY NET POSITIONFOR THE FISCAL YEAR ENDED JUNE 30, 2015Exhibit A-11
Pension andOther Employee Private-
Benefit Investment PurposeTrusts Trust Trusts
ADDITIONS
Contributions:
Employers 354,936,309$ -$ -$
Members 77,500,880 - -
Federal government - Medicare Part D 2,080,232 - -
Share purchases - 28,915,969 -
Total Contributions 434,517,421 28,915,969 -
Investment income (loss) 116,550,030 (10,158) 28
Less: Investment expenses 25,016,947 - -
Net Investment Income (Loss) 91,533,083 (10,158) 28
Other income - forfeitures 447,749 - -
Total Additions, net 526,498,253 28,905,811 28
DEDUCTIONS
Benefits:
Annuities:
Retirees 171,784,946 - -
Survivors 8,982,132 - -
Disability 49,879,651 - -
Claims 72,260,293 - -
Total Benefits 302,907,022 - -
Share redemptions - 8,145,923 -
Member refunds 41,691,148 - -
Administrative expenses 7,661,938 - 120,542
Depreciation 300,014 - -
Total Deductions 352,560,122 8,145,923 120,542
Net Increase (Decrease) 173,938,131 20,759,888 (120,514)
Net Position - Beginning of Year 4,749,392,317 13,191,965 135,953
Net Position - End of Year 4,923,330,448$ 33,951,853$ 15,439$
Notes to Financial Statements are an integral part of this statement.
41

COMPONENT UNITS
Exhibit A-12
NonmajorMCPS HOC Component Units Total
ASSETSEquity in pooled cash and investments 26,949,059$ 936,416$ 28,722,385$ 56,607,860$ Cash with fiscal agents - 61,440,083 19,849,706 81,289,789 Cash 9,642,379 14,942 6,858,699 16,516,020 Investments - cash equivalents 21,869,772 30,143,387 24,203,606 76,216,765 Investments 5,116,965 - 40,450,204 45,567,169 Receivables (net of allowance for uncollectibles):
Capital leases - - 14,803,344 14,803,344 Accounts 56,610,342 359,521 11,088,274 68,058,137 Notes - - 67,512,710 67,512,710 Mortgage - 269,295,283 - 269,295,283 Interest - 5,089,457 - 5,089,457 Other 231,993 3,766,587 1,199,293 5,197,873
Due from primary government 17,094,574 3,652,845 10,214,571 30,961,990 Due from other governments 25,567,271 3,112,916 2,690,904 31,371,091 Inventory of supplies 8,926,517 428,985 1,835,191 11,190,693 Prepaids 327,335 2,919,961 1,869,825 5,117,121 Other assets - 29,542,638 56,420,859 85,963,497 Restricted Assets:
Equity in pooled cash and investments - 4,376,234 5,199,431 9,575,665 Cash with fiscal agents - 18,500,175 - 18,500,175 Cash - - 450,808 450,808 Investments - cash equivalents - 128,104,020 - 128,104,020 Investments - 64,172,551 1,473,598 65,646,149 Net Pension asset - - 1,213,552 1,213,552
Capital Assets: Nondepreciable assets 226,279,131 22,294,620 86,584,067 335,157,818 Depreciable assets, net 2,356,849,764 478,556,768 478,634,013 3,314,040,545
Total Assets 2,755,465,102 1,126,707,389 861,275,040 4,743,447,531
DEFERRED OUTFLOWS OF RESOURCESDeferred loss on refunding of debt - - 2,908,740 2,908,740 Pension deferrals 84,228,762 1,099,247 257,469 85,585,478 Accumulated decrease in fair value of hedging derivatives - 10,504,981 356,849 10,861,830
Total Deferred Outflow of Resources 84,228,762 11,604,228 3,523,058 99,356,048
LIABILITIESAccounts payable 61,075,043 4,948,024 25,086,739 91,109,806 Interest payable - 15,501,407 297,058 15,798,465 Retainage payable 5,146,735 - - 5,146,735 Accrued liabilities 35,646,109 7,668,785 823,673 44,138,567 Deposits - 20,044,249 338,166 20,382,415 Due to primary government 58,031 78,255,349 656,781 78,970,161 Due to other governments - - 640,043 640,043 Unearned revenue 7,267,771 12,464,923 5,884,572 25,617,266 Other liabilities - 30,376,068 112,935 30,489,003 Noncurrent Liabilities:
Due within one year 52,256,641 93,878,649 10,625,419 156,760,709 Due in more than one year 974,207,491 689,013,345 236,423,140 1,899,643,976
Total Liabilities 1,135,657,821 952,150,799 280,888,526 2,368,697,146
DEFERRED INFLOWS OF RESOURCESDeferred gain on refunding of debt - - 3,570,000 3,570,000 Pension deferrals 117,515,233 3,467,783 1,702,092 122,685,108 Accumulated increase in fair value of hedging derivatives - - 153,811 153,811
Total Deferred Intflow of Resources 117,515,233 3,467,783 5,425,903 126,408,919
NET POSITIONNet investment in capital assets 2,550,647,383 (10,442,753) 488,965,745 3,029,170,375 Restricted for:
Capital projects - - 123,771 123,771 Debt service - 74,991,824 1,473,598 76,465,422 Other purposes 1,039,020 3,487,191 31,696,230 36,222,441
Unrestricted (deficit) (965,165,593) 114,656,773 56,224,325 (794,284,495)
Total Net Position 1,586,520,810$ 182,693,035$ 578,483,669$ 2,347,697,514$
Notes to Financial Statements are an integral part of this statement.
MONTGOMERY COUNTY, MARYLANDSTATEMENT OF NET POSITION
JUNE 30, 2015
42

MONTGOMERY COUNTY, MARYLANDSTATEMENT OF ACTIVITIESCOMPONENT UNITSFOR THE FISCAL YEAR ENDED JUNE 30, 2015Exhibit A-13
Operating CapitalCharges for Grants and Grants and Nonmajor
Functions Expenses Services Contributions Contributions MCPS HOC Component Units Total
Component Units:
General government 4,833,365$ 4,577,615$ 239,554$ -$ -$ -$ (16,196)$ (16,196)$
Culture and recreation 17,414,438 15,798,719 - 63,453 - - (1,552,266) (1,552,266)
Community development
and housing 228,916,341 117,485,419 115,446,651 315,744 - 4,331,473 - 4,331,473
Education:
Secondary education 2,666,493,482 27,593,375 120,216,631 78,778,361 (2,439,905,115) - - (2,439,905,115)
Higher education 337,763,487 77,914,425 17,187,769 1,011,933 - - (241,649,360) (241,649,360)
Total component units 3,255,421,113$ 243,369,553$ 253,090,605$ 80,169,491$ (2,439,905,115) 4,331,473 (243,217,822) (2,678,791,464)
General revenues:
Grants and contributions not restricted to specific programs 2,490,409,622 - 261,634,908 2,752,044,530
Investment income 16,722 1,017,145 4,726,041 5,759,908
Gain on sale of capital assets 184,579 - 47,126 231,705
Total general revenues 2,490,610,923 1,017,145 266,408,075 2,758,036,143
Change in net assets 50,705,808 5,348,618 23,190,253 79,244,679
Net position - beginning, as restated 1,535,815,002 177,344,417 555,293,416 2,268,452,835
Net position - ending 1,586,520,810$ 182,693,035$ 578,483,669$ 2,347,697,514$
Notes to the Financial Statements are an integral part of this statement.
Program Revenues Net (Expense) Revenue and Changes in Net Position
43

44

MONTGOMERY COUNTY, MARYLAND
NOTES TO FINANCIAL STATEMENTS
JUNE 30, 2015
NOTE I. SUMMARY OF SIGNIFICANT ACCOUNTING POLICIES ................................................. 47
A) Reporting Entity ........................................................................................................................... 47
B) Government-Wide and Fund Financial Statements ...................................................................... 49
C) Measurement Focus, Basis of Accounting, and Financial Statement Presentation ...................... 50
D) Assets, Deferred Outflows of Resources, Liabilities, Deferred Inflows of Resources, and Net
Position or Equity ................................................................................................................ 53
E) New Accounting Standards .......................................................................................................... 58
NOTE II. STEWARDSHIP, COMPLIANCE, AND ACCOUNTABILITY ............................................ 59
A) Deficit Fund Equity ...................................................................................................................... 59
B) Additional Fund Information ....................................................................................................... 59
NOTE III. DETAILED NOTES ON ALL FUNDS .................................................................................... 60
A) Cash and Investments................................................................................................................... 60
B) Receivables .................................................................................................................................. 75
C) Capital Assets ............................................................................................................................... 77
D) Interfund Receivables, Payables, and Transfers ........................................................................... 80
E) Leases ........................................................................................................................................... 82
F) Long-Term Debt ........................................................................................................................... 85
G) Segment Information.................................................................................................................. 105
H) Fund Equity ................................................................................................................................ 107
I) Significant Transactions with Discretely Presented Component Units ....................................... 109
NOTE IV. OTHER INFORMATION ........................................................................................................ 110
A) Risk Management ....................................................................................................................... 110
B) Significant Commitments and Contingencies ............................................................................. 111
C) Subsequent Events ...................................................................................................................... 113
D) Joint Ventures and Jointly Governed Organizations ................................................................... 113
E) Employee Benefits ...................................................................................................................... 116
F) Pension Plan Obligations ............................................................................................................. 117
G) Other Postemployment Benefits (OPEB) .................................................................................... 124
45

46

NOTE I. SUMMARY OF SIGNIFICANT ACCOUNTING POLICIES
The accounting policies of the County conform to accounting principles generally accepted in the United States of America (GAAP) applicable to local government entities. The following is a summary of significant policies:
A) Reporting Entity
Background
Montgomery County, Maryland (County) is a charter government under the constitution and general laws of the State of Maryland (State). The charter provides for separate legislative and executive branches with legislative responsibility vested in an elected nine-member county council and executive responsibility vested in an elected county executive. The County provides its citizens with services in areas of general government, public safety, public works and transportation, health and human services, education, culture and recreation, community development and housing, and environment.
As required by GAAP, these financial statements present the primary government and its component units, which are entities for which the primary government is considered financially accountable. The County reporting entity is determined by criteria established by the Governmental Accounting Standards Board (GASB). The judgment to include or exclude activities is dependent on evaluation of the GASB criteria. Various departments and agencies governed directly by the County Executive and the County Council of Montgomery County are included in the reporting entity as the primary government and are referred to hereafter as the Primary Government. The component units (as discussed below) are included in the reporting entity because the Primary Government approves the budget requests, provides a significant amount of funding for each of these units, and/or appoints the governing boards.
Discretely Presented Component Units
The financial data of the County’s component units are discretely presented in a column separate from the financial data of the primary government, to emphasize that the component units are legally separate from the Primary Government. Financial information regarding the component units is included in the component units’ combining statements. The following are the County’s component units, each of which has a June 30 fiscal year-end:
Montgomery County Public Schools (MCPS)
MCPS provides public education in kindergarten through twelfth grade to children residing within Montgomery County. Members of the Board of Education, including one student member, are elected by the voters. However, MCPS is fiscally dependent upon the Primary Government because the Primary Government approves the budget, levies taxes to provide the majority of the fiscal support, and issues debt for construction of school facilities.
Montgomery Community College (Montgomery College or MCC)
MCC provides educational services to County citizens by offering two-year associate degrees and a continuing education program. MCC is responsible for post secondary education within the government's jurisdiction. The Montgomery County Board of Community College trustees is the governing authority. The State Governor appoints the trustees from a list of candidates supplied by a nominating committee. The nominating committee is controlled by the County Executive and the County Council. Therefore, essentially the Primary Government and the State Governor must agree upon the trustees to serve on the College's Governing Board. In addition, the County Council reviews and approves both the operating and capital budgets and budgetary amendments of MCC.
47

The Primary Government contributes substantial funding for both the operating and capital budgets, as well as issues debt for the construction of college facilities.
Montgomery County Revenue Authority (MCRA)
MCRA is governed by a five-member Board of Directors. All members are appointed by the County Executive subject to the confirmation of the County Council. The County Council approves the capital budget of MCRA. MCRA approves its own operating budget. MCRA is an instrumentality of the Primary Government for the purpose of constructing, improving, and maintaining self-sustaining projects devoted to public use, good or welfare.
Housing Opportunities Commission of Montgomery County (HOC)
HOC is governed by seven commissioners who are appointed by the County Executive with the approval of the County Council. In addition, the County Council provides for a subsidy to the operating budget of HOC and guarantees a relatively small portion of its debt (up to $50,000,000). The HOC operating budget approval occurs on a project basis, with the County Council having authority to approve project budgets that include County funding. HOC presents its proposed budget to the Council for review and comment only, as required by Article 44A, Section 2 of the Annotated Code of Maryland. Even though there is a large dependence on the U.S. Department of Housing and Urban Development (HUD), HOC has sufficient financial accountability to the Primary Government to be included as a component unit.
Bethesda Urban Partnership, Inc (BUPI)
BUPI has its entire eleven-member Board of Directors appointed by the County Executive with the approval of the County Council. The primary purpose of BUPI is to execute service contracts for the benefit of one of the Primary Government's special taxing districts (Bethesda Urban District). Substantially all of BUPI’s funding is granted through the Primary Government's operating budget. The County Council annually approves the BUPI operating budget and is able to modify it in a manner similar to the way Primary Government agency budgets are modified.
Complete financial statements can be obtained at the component units’ administrative offices listed below:
Montgomery County Public Schools Montgomery College Bethesda Urban Partnership, Inc. 850 Hungerford Drive 900 Hungerford Drive 7700 Old Georgetown Road Rockville, MD 20850 Rockville, MD 20850 Bethesda, MD 20814
Housing Opportunities Commission of Montgomery County, Maryland
Montgomery County Revenue Authority
10400 Detrick Avenue 101 Monroe Street, 4th Floor Kensington, MD 20895-2484 Rockville, MD 20850
Joint Ventures and Jointly Governed Organizations
The following organizations are considered joint ventures of the County: Maryland-National Capital Park and Planning Commission (M-NCPPC), Washington Suburban Sanitary Commission (WSSC), Washington Suburban Transit Commission (WSTC), Washington Metropolitan Area Transit Authority (WMATA), and Northeast Maryland Waste Disposal Authority (NEMWDA). Metropolitan Washington Council of Governments (COG) is a jointly governed organization. Disclosure of the County's participation in these joint entities is presented in Note IV-D. Complete financial statements can be obtained at the joint entities’ offices as follows:
48

Maryland-National Capital Park and Planning Commission 6611 Kenilworth Avenue Riverdale, MD 20737
Washington Suburban Sanitary Commission 14501 Sweitzer Lane Laurel, MD 20707
Washington Suburban Transit Commission 4351 Garden City Drive, Suite 305 Hyattsville, MD 20785
Washington Metropolitan Area Transit Authority
Northeast Maryland Waste Disposal Authority
Metropolitan Washington Council of Governments
600 Fifth Street, NW 100 South Charles St, Tower II-Suite 402
777 N. Capitol Street, NE, #300 Washington, DC 20001 Washington, DC 20002 Baltimore, MD 21201
B) Government-Wide and Fund Financial Statements
Government-Wide Financial Statements
The government-wide financial statements report information on all of the nonfiduciary activities of the Primary Government and its component units. Since by definition, assets of fiduciary funds are held for the benefit of a third party (other local governments, private parties, pension participants, etc.) and cannot be used to address activities or obligations of the County, these funds are not incorporated into the government-wide statements. For the most part, the effect of interfund activity has been removed from these statements. Governmental activities of the Primary Government, which normally are supported by taxes and intergovernmental revenues, are reported separately from business-type activities, which rely to a significant extent on fees and charges for support.
Statement of Net Position
This statement is designed to display the financial position of the reporting entity as of year-end. Governments report all capital assets, including infrastructure, in the government-wide Statement of Net Position and report depreciation expense – the cost of “using up” capital assets – in the Statement of Activities. Net position is divided into three categories – 1) net investment in capital assets; 2) restricted; and 3) unrestricted.
Statement of Activities
This statement demonstrates the degree to which the direct expenses of a given function or segment for the fiscal year are offset by program revenues. Therefore, this statement reflects both the gross and net costs per functional category (general government, public safety, public works and transportation, health and human services, culture and recreation, community development and housing, environment, and education) that are otherwise being supported by general revenues. Direct expenses (including depreciation) are those that are clearly identifiable with a specific function or segment. Program revenues include 1) charges to customers or applicants who purchase, use, or directly benefit from goods, services, or privileges provided by a given function or segment, and 2) grants and contributions that are restricted to meeting the operational or capital requirements of a particular function or segment. Taxes and other items not properly included among program revenues are reported as general revenues. The County does not allocate indirect expenses. The operating grants column includes operating-specific and discretionary (either operating or capital) grants while the capital grants column reflects capital-specific grants.
Fund Financial Statements
Separate financial statements are provided for governmental funds, proprietary funds, and fiduciary funds, even though the latter are excluded from the government-wide financial statements. Major individual governmental funds and major individual enterprise funds are reported as separate columns in the fund financial statements.
49
In the fund financial statements, financial transactions and accounts of the County are organized on the basis of funds, each of which is considered a separate accounting entity. The operations of each fund are accounted for with a separate set of self-balancing accounts that comprise of assets, liabilities, fund balance/net position, revenues, and expenditures/expenses.
Budget-to-Actual Comparison Schedules
Demonstrating compliance with the adopted budget is an important component of a government’s accountability to the public. Many citizens participate in the process of establishing the annual operating budgets of state and local governments, and have a keen interest in following the financial progress of their governments over the course of the year. Budget-to-actual comparison schedules for the General Fund and the County’s major special revenue funds, (Housing Initiative and Grants) are presented as Required Supplementary Information.
C) Measurement Focus, Basis of Accounting, and Financial Statement Presentation
Measurement Focus and Basis of Accounting
Full Accrual Basis Financial Statements
The government-wide, proprietary fund, and certain fiduciary fund (pension and other employee benefit trusts, investment trust, and private-purpose trusts) financial statements are reported using the economic resources measurement focus and the accrual basis of accounting. Revenues are recorded when earned and expenses are recorded when a liability is incurred, regardless of the timing of related cash flows. Property taxes are recognized as revenue in the year in which they are levied. Grants and similar items are recognized as revenues as soon as all eligibility requirements imposed by the provider have been met. Capital assets and related depreciation are also recorded in these statements. The agency funds, which do not have a measurement focus, use the accrual basis of accounting to recognize assets and liabilities.
Modified Accrual Basis Financial Statements
Governmental fund financial statements are reported using the current financial resources measurement focus and the modified accrual basis of accounting. In the governmental funds, revenues are recorded as soon as they are susceptible to accrual (both measurable and available). Revenues are considered to be available when they are collectible within the current period or soon enough thereafter to pay liabilities of the current period. Expenditures generally are recorded when a liability is incurred, as under accrual accounting. However, debt service expenditures are recorded only when payment has matured and is due. Similarly, expenditures related to claims and judgments and compensated absences are recorded only to the extent that they are expected to be liquidated with expendable available financial resources. Also, capital assets and related depreciation and long-term liabilities are not recorded in these statements.
In applying the susceptible to accrual concept to income taxes (distributed by the State), property taxes, and intergovernmental revenues other than grants, the County defines “available” to mean received within 30 days after year-end.
In the State of Maryland, the State has assumed the responsibility for the collection of all income taxes and for distributing those collections to the respective counties. The counties set their individual tax rates within limits provided by State law. However, collections and pursuit of delinquent taxes are the responsibility of the State. The County records estimated receivables relating to income taxes when the underlying income is earned. Amounts not received within 30 days are reported as deferred inflows. At year-end, unearned revenue relating to income taxes primarily includes amounts related to late filers, delinquent returns and audits, and unallocated withholding, not received within the County’s availability period. Amounts relating to late filers are expected to
50

be received from the State within the next fiscal year; however, collections related to delinquent returns and audits and unallocated withholding may not occur and be remitted to the County for several years.
In applying the susceptible to accrual concept to operating and capital grants, classified with intergovernmental revenues in the fund financial statements, the County records receivables when the applicable eligibility requirements including time requirements are met. Related revenues are recognized to the extent that cash is expected to be received within one year of year-end. Resources received before the eligibility requirements are met are reported as unearned revenue within the governmental funds and unearned revenue in the government-wide financial statements.
Charges for services, licenses and permits, fines and penalties, and miscellaneous revenues (except earnings on investments) are generally recorded as revenues when received in cash during the year. At year-end, receivables are recorded for significant amounts due. If such amounts are received in cash after year-end within the County’s 30 day availability period, they are recognized as revenue; if not, such amounts are reported as unearned revenue.
Financial Statement Presentation
Major Governmental Funds
General Fund This fund is the general operating fund of the County. It is used to account for all financial resources except those required to be accounted for in another fund. For financial reporting purposes, the General Fund also includes amounts maintained in a legally separate Revenue Stabilization Fund. (See Note II-B.) The Revenue Stabilization Fund was created to establish a “rainy day” or reserve account to accommodate future funding shortfalls. It was designed to accrue a balance during periods of economic growth and prosperity, when revenue collections exceed estimates. The Fund may be drawn upon during periods of economic slowdown, when collections fall short of revenue estimates.
Housing Initiative Fund This fund is used to account for the fiscal activity for financing, supplementing, and constructing affordable residential facilities for eligible participants. The Fund’s revenue sources consist of a portion of each County-owned property sold, repayments on loans, and recordation taxes. All of these revenue sources are restricted, as all funds received must be used to finance, supplement, and construct affordable residential housing for eligible participants.
Grants Fund This fund accounts for the Federal and State grant-funded activities of the tax supported General Fund and special revenue funds. These grant funds must be spent according to the restrictions prescribed by the respective funding agencies.
Debt Service Fund This fund is used to account for the accumulation of resources for, and the payment of, general long-term debt principal, interest, and related costs.
Capital Projects Fund This fund accounts for financial resources to be used for the acquisition or construction of major capital facilities (other than those financed by proprietary funds).
51

Major Enterprise Funds
Liquor Enterprise Fund This fund accounts for the operations of twenty-five liquor stores and one Montgomery County liquor warehouse. Under State law, the Montgomery County Department of Liquor Control has sole control of the distribution of alcoholic beverages, and the sale of spirits, within the County.
Solid Waste Activities Enterprise Fund This fund accounts for the fiscal activity of all solid waste disposal operations, including recycling and leaf vacuuming. The fund utilizes the Dickerson, Maryland Resource Recovery Facility for refuse incineration, in combination with the out-of-County landfill haul and local recycling operations, to meet its disposal and recycling requirements. The fund also accounts for the fiscal activity related to County contracted refuse collection within the Solid Waste Collection District. This district is essentially comprised of the higher density, non-municipal, residential areas of the County. The Vacuum Leaf Collection program provides leaf collection services to down county residents during the late fall and winter months.
Parking Lot Districts Enterprise Fund This fund accounts for the fiscal activity related to serving the parking needs of the people who work and shop in the four central business districts zoned for commercial or industrial use identified as Silver Spring, Bethesda, Wheaton, and Montgomery Hills.
Other Fund Types
Other Governmental Funds The other governmental fund types used by the County are special revenue and permanent. Special revenue funds are used to account for specific revenues that are legally restricted for particular purposes. The County periodically uses permanent funds to account for resources that are legally restricted to the extent that only earnings, and not principal, may be used for purposes that support the County’s programs.
Internal Service Funds These funds are used to account for the financing of goods or services provided by one department or agency to other departments or to other governmental units, on a cost-reimbursement basis. There are four internal service funds reported by the County: Motor Pool, Liability and Property Coverage Self-Insurance, Employee Health Benefits Self-Insurance, and Central Duplicating.
Fiduciary Fund Types
Pension and Other Employee Benefit Trust Fund This fund is used to account for all activities of the Employees’ Retirement System of Montgomery County (defined benefit plan), Employees’ Retirement Savings Plan (defined contribution plan), Deferred Compensation Plan, and Retiree Health Benefits Trust, including accumulation of resources for, and payment of, retirement annuities or other benefits and administrative costs.
Investment Trust Fund This fund accounts for the portion of the external investment pool, sponsored by the County that belongs to participating governments that are not part of the County reporting entity.
Private-Purpose Trust Funds These funds account for arrangements under which principal and interest are legally held in trust for parties outside of the County and must be expended in accordance with their designated purposes.
52
Agency Funds These funds are used to account for assets, such as property taxes, held in a purely custodial capacity, where the County receives, temporarily invests, and remits such resources to individuals, private organizations, or other governments.
In the process of aggregating data for the Statement of Net Position and the Statement of Activities, some amounts reported as interfund activity and balances in the funds are eliminated or reclassified. As a general rule, the effect of interfund activity has been eliminated from the government-wide financial statements. Assets and liabilities of internal service funds are included in governmental activities in the Statement of Net Position. The effect of interfund services provided and used between functions has not been eliminated in the Statement of Activities, since to do so would distort the direct costs and program revenues reported for the various functions concerned.
Proprietary funds distinguish operating revenues and expenses from non-operating items. Operating revenues and expenses generally result from providing services and producing and delivering goods in connection with a proprietary fund’s principal ongoing operations. The principal operating revenues of the enterprise funds and of the internal service funds are charges to customers for sales and services. Operating expenses for enterprise funds and internal service funds include the cost of sales and services, administrative expenses, and depreciation on capital assets. All revenues and expenses not meeting this definition are reported as non-operating revenues and expenses.
The County generally first uses restricted assets for expenses incurred for which both restricted and unrestricted assets are available. The County may defer the use of restricted assets based on a review of the specific transaction.
D) Assets, Deferred Outflows of Resources, Liabilities, Deferred Inflows of Resources, and Net Position or Equity
1) Cash and Investments
Pooled Cash and Investment
The County sponsors an external investment pool. Participants in the pool include the County, certain component unit agencies, and other legally separate entities. The portion of pooled cash and investments applicable to other legally separate entities (not included in the County reporting entity) is accounted for in a separate Investment Trust Fund. During the year, investments are stated at cost plus accrued interest and are adjusted for amortization of premiums and accretion of discounts. At year-end, investments in the pool are adjusted to fair value plus accrued interest. See Note III-A for additional information.
Non-pooled Investments
Proprietary Fund Types
The Parking Lot District enterprise fund investments in U.S. Government securities are stated at fair value plus accrued interest.
Pension and Other Employee Benefit Trust Fiduciary Fund Type
Investments are stated at fair value. The fair value is generally based on quoted market prices at June 30, 2015. Fair value for private investments funds, including private equity, and private real assets, is determined using unit values supplied by the fund managers, which are based upon the fund managers’ appraisals of the funds’ underlying holdings. Such values involve subjective judgment and may differ from amounts which would be
53
realized if such holdings were actually sold. The fair value of limited partnership investments are based on valuations of the underlying assets of the limited partnerships as reported by the general partner. Cash received as collateral on securities lending transactions and investments made with such cash are reported as assets along with a related liability for collateral received.
Cash and Cash Equivalents
For Statement of Cash Flows reporting purposes, “cash equivalents” are defined as short-term, highly liquid investments that are both readily convertible to known amounts of cash and so near their maturity that they present insignificant risk of changes in value because of changes in interest rates. Generally, only investments with original maturities of three months or less, at the time of purchase, meet this definition. The balance sheet classification for “cash and cash equivalents” in the Statement of Cash Flows includes the following: “Equity in pooled cash and investments,” “Cash,” “Cash with fiscal agents,” and “Restricted Equity in pooled cash and investments.”
2) Receivables and Payables
Due From/To Other Funds and Internal Balances
Activity between funds that are representative of lending/borrowing arrangements that are outstanding at the end of the year and where repayment is expected within a reasonable time are referred to as “due from/to other funds.” Such outstanding balances not expected to be repaid within a reasonable time are included in interfund “transfers in/out.” Any residual balances of “due from/to other funds” outstanding between governmental activities and business-type activities are reported in the government-wide financial statements as “internal balances.”
Trade Accounts Receivable
Trade and other receivables are shown net of an allowance for uncollectibles. The allowance for uncollectibles is calculated based on historical collection data and, in some cases, specific account analysis.
3) Inventories and Prepaids
Inventories
Inventories are valued at the lower of cost (principally first-in, first-out) or market in the Liquor Enterprise Fund and consist of goods held for sale. Inventories valued at cost (principally moving-average) are carried in the Motor Pool Internal Service Fund and the governmental fund types. All inventories are maintained by perpetual records and adjusted by annual physical counts. Inventories in the governmental funds and Motor Pool Internal Service Fund consist of items held for consumption. The cost is recorded as an expenditure at the time individual items are withdrawn for use. In governmental funds, fund balance equivalent to the year-end inventory value is classified as nonspendable to indicate that portion of fund balance which is not available in a spendable form.
Prepaids
The County uses the consumption method to account for prepaids. Prepaids include payments made to vendors for services that will benefit periods beyond the end of the fiscal year.
4) Restricted Assets
Certain proceeds of the County’s bonds, as well as certain resources set aside for revenue bond repayment, are classified as restricted assets because their use is limited by applicable bond covenants.
54
5) Capital Assets
Capital assets, which include property, plant, equipment, computer software, and infrastructure assets (e.g., roads, bridges, curbs and gutters, streets and sidewalks, drainage systems, lighting systems, and similar items) are reported in the applicable governmental or business-type activities columns in the government-wide financial statements. The County defines capital assets as assets with an initial, individual cost of $10,000 or more, and an estimated useful life in excess of one year. Such assets are valued at cost where historical records are available and at estimated historical cost where no historical records exist. Donated capital assets are recorded at estimated fair market value at the date of donation.
An asset’s cost basis may be adjusted after acquisition due to improvements or impairments to the asset. However, the costs of normal maintenance and repairs that do not add to the value of the asset or materially extend asset lives are not capitalized.
Major outlays for capital assets and improvements are capitalized as projects are constructed. Interest is capitalized on proprietary fund assets acquired with tax-exempt debt. The amount of interest to be capitalized is calculated by offsetting interest expense incurred from the date of the borrowing until completion of the project with interest earned on invested proceeds over the same period.
Capital assets are depreciated using the straight-line method over the following estimated useful lives:
Assets Years Buildings and structures 20 – 40 Improvements other than buildings 3 – 40 Infrastructure 20 – 60 Furniture, fixtures, equipment and machinery 3 – 20 Automobiles and trucks 2 – 15 Intangibles 3 – 20
For Statement of Cash Flows reporting purposes, proceeds from insurance on capital assets that are stolen or destroyed are classified as proceeds from sale of capital assets.
6) Deferred Outflows of Resources
Deferred outflows are the consumption of net position by the County that is applicable to a future reporting period. The County’s deferred outflows of resources consist of deferred charges on refunding of debt and changes relating to pension expenses. Deferred charges on refunding are being amortized over the term of the respective bonds using the bonds outstanding method which approximates the effective interest method. Deferred outflows of resources relating to pensions are described in Note IV-F1. For the County’s Component Units deferred outflows consists of accumulated decreases in fair value of hedging derivatives.
7) Compensated Absences
Vested or accumulated vacation leave that is expected to be liquidated with expendable available financial resources has been determined by the County to be immaterial and is therefore not reported as an expenditure and a liability of the governmental fund that will pay the leave. Vested or accumulated vacation leave is reported as a liability and expense in the government-wide financial statements and proprietary fund types in the fund financial statements, along with the corresponding employer’s share of social security and medicare taxes. Based on a historical analysis of leave usage, accrued leave is classified as current and long-term. In the proprietary fund financial statements, the current portion of compensated absences is classified as accrued liabilities. Such amounts have been reclassified to non-current liabilities (due within one year and due in more than one year) in
55

the government-wide financial statements. No liability is recorded for nonvesting accumulating rights to receive sick pay benefits.
8) Long-Term Obligations
In the government-wide financial statements and proprietary fund types in the fund financial statements, long-term debt and other long-term obligations are reported as liabilities in the applicable governmental activities, business-type activities, or proprietary fund type statements of net position. Bond premiums and discounts are deferred and amortized over the life of the bonds using the bonds outstanding method. Bonds payable in the proprietary fund financial statements and noncurrent liabilities in the government-wide financial statements are reported net of the applicable bond premium or discount.
In the fund financial statements, governmental fund types recognize bond premiums and discounts, as well as bond issuance costs, during the current period. The face amount of debt issued is reported as other financing sources. Premiums received on debt issuances are reported as other financing sources while discounts on debt issuances are reported as other financing uses. Issuance costs, whether or not withheld from the actual debt proceeds received, are reported as expenditures.
9) Deferred Inflows of Resources
Deferred inflows are the acquisition of net position by the County that is applicable to a future reporting period. As of June 30, 2015, the County’s deferred inflows consist of unavailable income taxes, unavailable property taxes, unavailable revenues, and changes relating to pension expenses (see Note IV-F1).
10) Fund Equity/Net Position
In the government-wide financial statements, the County has reported negative unrestricted net position. This is due to the fact that the County issues general obligation bonded debt for purposes of capital construction on behalf of MCPS, MCC, and M-NCPPC. The related capital assets are reported on the financial statements of these governments. For MCPS and MCC, component units of the County, this amount is also classified as net investment in capital assets in the Component Units column of the government-wide Statement of Net Position (Exhibit A-1). For Primary Government purposes, since the issuance of such debt has not resulted in a capital asset, the effect of this debt is reflected in unrestricted net position (deficit) in the Governmental Activities column of the government-wide Statement of Net Position. At June 30, 2015, the County has reported outstanding general obligation bond, variable rate demand obligation, and bond anticipation note debt related to MCPS, MCC, and M-NCPPC amounting to $1,634,742,350. Absent the effect of this relationship, the County would have reported a deficit in unrestricted net position of governmental activities in the amount of $248,033,641.
Classification of Fund Balance
The County classifies fund balance based on the extent to which the County is bound to honor constraints on the specific purposes for which amounts in the respective governmental funds can be spent. The constraints are a hierarchy of five classifications. First identified are nonspendable fund balances including amounts that are not in spendable form or the government is legally or contractually required to maintain the resources intact. The next four classifications are based on the relative strength of the constraints that control how specific amounts can be spent:
The restricted fund balance category includes amounts that can be spent only for the specific purposes stipulated by constitution, external resource providers, or through enabling legislation.
56

The committed fund balance classification includes amounts that can be used only for the specific purposes determined by a formal action of the government’s highest level of decision-making authority. In the County’s case this would be the County Council. The highest act of this body is for it to pass a bill, which becomes a public law.
Amounts in the assigned fund balance classification are intended to be used by the government for specific purposes but do not meet the criteria to be classified as restricted or committed. The County Council may make assignments of fund balance or can delegate this authority to the Chief Administrative Officer (CAO). The CAO may then make additional assignments of fund balance, but only at the direction of the County Council.
Unassigned fund balance is the residual classification for the County’s general fund and includes all spendable amounts not contained in the other classifications. In other funds, the unassigned classification can only be used to report a deficit balance resulting from overspending for specific purposes for which amounts had been restricted, committed, or assigned.
The County has established a fund balance spending policy for those instances where an expenditure is incurred for a purpose for which amounts in any of the restricted or unrestricted fund balance classifications (committed, assigned, or unassigned) could be used. The County will apply expenditures against restricted amounts first, followed by committed, assigned and unassigned amounts.
11) Property Taxes
Real and personal property taxes are levied at rates enacted by the County Council in the tax levy resolution on the assessed value as determined by the Maryland State Department of Assessments and Taxation. State law stipulates that the constant yield tax rate furnished by the Maryland State Department of Assessments and Taxation cannot be exceeded without public notice of the intent to exceed, and only after public hearings. The general property tax rate was levied below the constant yield rate for FY15. Following the Fairness in Taxation (FIT) legislation, the County Charter requires an affirmative vote of nine members of the Council to increase the real property tax rate to a level that will produce total revenues exceeding the total revenue produced by the tax on real property in the preceding year, plus 100 percent of any increase in the Consumer Price Index with exemptions for revenue from newly constructed, rezoned property and development district tax to fund capital improvement projects. The tax rate adopted for Levy Year 2014 (i.e., FY15), in conjunction with a one-time income tax offset credit, generated revenues below the Charter limit for that year.
Generally, property taxes are levied as of July 1 and become delinquent on October 1. Interest and penalty amounts are assessed annually at 20 percent on delinquent tax bills. Owner-occupied residential and “small business” property owners pay their tax on a semi-annual schedule, with the first and second installments due on September 30 and December 31, respectively. Taxpayers may opt to make both semi-annual payments on or before September 30.
The County collects delinquent real property taxes through a public tax lien sale. Tax liens, representing delinquent taxes on real property are sold in random groups, utilizing a sealed bid process, on the second Monday in June, when taxes have remained overdue since the preceding October 1 or in the case of a semi-annual schedule, January 1.
12) Pensions
For purposes of measuring the net pension liability, deferred outflows of resources and deferred inflows of resources related to pensions, and pension expense, information about the fiduciary net position of the Pension Plans (Plans) and additions to/deductions from their fiduciary net position have been determined on the same basis as they are reported by Plans. For this purposes, benefit payments (including refunds of employee
57
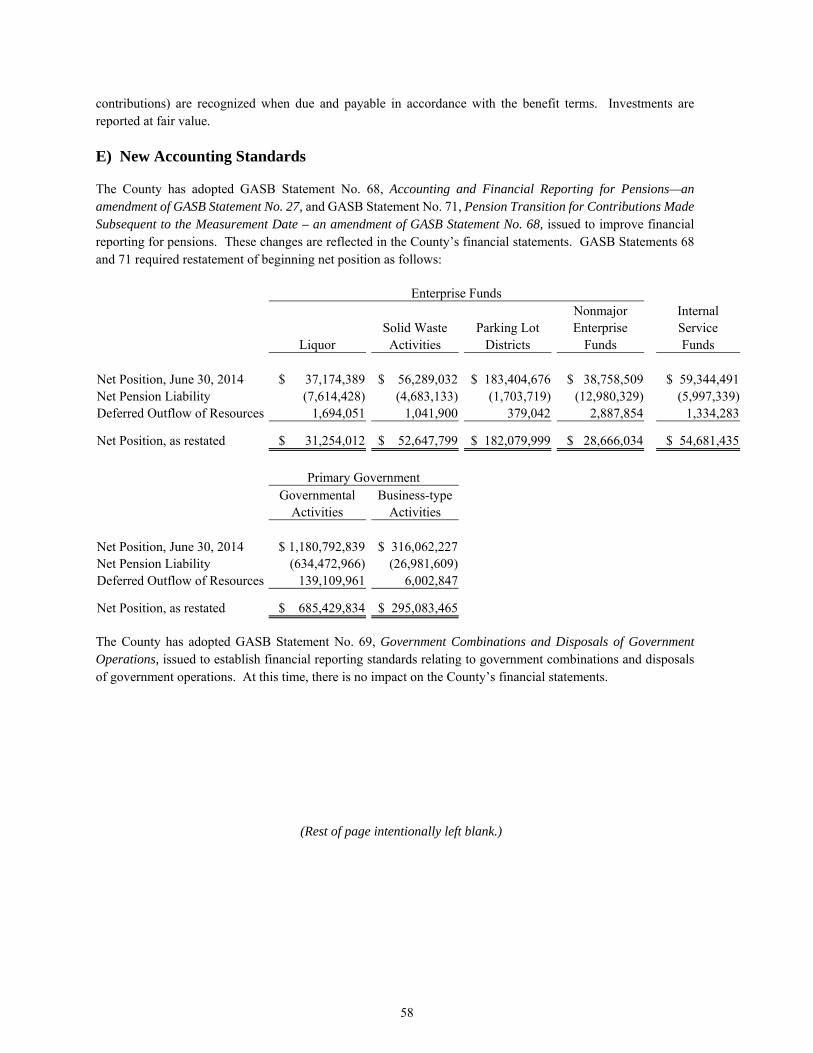
contributions) are recognized when due and payable in accordance with the benefit terms. Investments are reported at fair value.
E) New Accounting Standards
The County has adopted GASB Statement No. 68, Accounting and Financial Reporting for Pensions—an amendment of GASB Statement No. 27, and GASB Statement No. 71, Pension Transition for Contributions Made Subsequent to the Measurement Date – an amendment of GASB Statement No. 68, issued to improve financial reporting for pensions. These changes are reflected in the County’s financial statements. GASB Statements 68 and 71 required restatement of beginning net position as follows:
Enterprise Funds Nonmajor Internal Solid Waste Parking Lot Enterprise Service Liquor Activities Districts Funds Funds
Net Position, June 30, 2014 $ 37,174,389 $ 56,289,032 $ 183,404,676 $ 38,758,509 $ 59,344,491 Net Pension Liability (7,614,428) (4,683,133) (1,703,719) (12,980,329) (5,997,339)Deferred Outflow of Resources 1,694,051 1,041,900 379,042 2,887,854 1,334,283
Net Position, as restated $ 31,254,012 $ 52,647,799 $ 182,079,999 $ 28,666,034 $ 54,681,435
Primary Government Governmental Business-type Activities Activities Net Position, June 30, 2014 $ 1,180,792,839 $ 316,062,227 Net Pension Liability (634,472,966) (26,981,609) Deferred Outflow of Resources 139,109,961 6,002,847
Net Position, as restated $ 685,429,834 $ 295,083,465 The County has adopted GASB Statement No. 69, Government Combinations and Disposals of Government Operations, issued to establish financial reporting standards relating to government combinations and disposals of government operations. At this time, there is no impact on the County’s financial statements.
(Rest of page intentionally left blank.)
58

NOTE II. STEWARDSHIP, COMPLIANCE, AND ACCOUNTABILITY
A) Deficit Fund Equity
Recreation Special Revenue Fund
The $123,843 deficit in the Recreation Fund was caused by a shortfall in activity fee revenue. To address the shortfall, management will recommend a property tax rate adjustment and other expenditure and revenue adjustments in FY17.
Central Duplicating Internal Service Fund
In FY15, the Central Duplicating Internal Service Fund adjusted its chargeback collections in order to recover overhead costs that had caused a net deficit in FY14. Using this adjustment, the fund would have shown a positive net position. Instead, due to the recognition of a pension liability required by GASB Standard No. 68, the fund ended FY15 with a $449,564 net deficit.
B) Additional Fund Information
Revenue Stabilization Fund
This fund is used to account for the accumulation of resources at a targeted reserve level sufficient to address unexpected increases or decreases in revenues and expenditures. For financial reporting purposes this fund is included within the General Fund. Below is the change in the Revenue Stabilization Fund (RSF) balance for the fiscal year ended June 30, 2015.
Revenue Stabilization Fund (RSF) Balance Beginning of Year $ 207,986,941 Investment Income 267,729 FY15 Statutory Contribution 22,392,995
Balance – End of Year $ 230,647,665
White Flint Special Taxing District
The White Flint Special Taxing District (WFSTD) is used to account for property tax collections and investment income earnings related to the White Flint Sector. These revenues are used to fund transportation infrastructure improvements and other development costs in the WFSTD. This fund is included within the Capital Projects Fund. Below is the change in the WFSTD balance for the fiscal year ended June 30, 2015.
White Flint Special Taxing District (WFSTD) Balance Beginning of Year $ 2,147,805 Property Taxes 1,510,678 Investment Income 4,686
Balance – End of Year $ 3,663,169
59

NOTE III. DETAILED NOTES ON ALL FUNDS
A) Cash and Investments
1) Overview
The Montgomery County reporting entity total cash and investments as of June 30, 2015, totaled $6,904,635,543 of which $6,406,161,123 is related to the Primary Government, as presented below and in the government-wide financial statements. These funds are held in several pools, various non-pooled investments, and cash funds. The following is a schedule of total cash and investments:
Primary Component Total Government Units * Reporting EntityStatement of Net Position Amounts: Equity in pooled cash and investments $ 1,101,156,494 $ 56,607,860 $ 1,157,764,354 Cash with fiscal agents 55,161,140 81,289,789 136,450,929 Cash 709,887 16,516,020 17,225,907 Investments - cash equivalents - 76,216,765 76,216,765 Investments 5,209,093,490 45,567,169 5,254,660,659 Restricted equity in pooled cash and investments 35,721,821 9,575,665 45,297,486 Restricted cash with fiscal agents - 18,500,175 18,500,175 Restricted cash - 450,808 450,808 Restricted investments - cash equivalents - 128,104,020 128,104,020 Restricted investments 4,318,291 65,646,149 69,964,440
Total $ 6,406,161,123 $ 498,474,420 $ 6,904,635,543
Deposit and Investment Summary: Deposits $ 460,293,804 $ 131,956,720 $ 592,250,524 Investments 5,889,996,292 208,131,389 6,098,127,681 Cash on hand, fiscal agents, safe deposit escrow 55,871,027 158,386,311 214,257,338
Total $ 6,406,161,123 $ 498,474,420 $ 6,904,635,543 * Includes $381,831 in County Investment Pool
Primary Government cash and investments reconciles to the basic financial statements as follows:
Government-wide $ 1,126,265,457 Fiduciary funds 5,279,895,666
Total $ 6,406,161,123
Primary Government
2) External Investment Pool
Overview:
The County maintains an external investment pool that is subject to oversight by the County’s Internal Investment Committee, but is not subject to regulatory oversight by the Securities and Exchange Commission (SEC).
60

Participants in the pool include the County, certain component unit agencies, and other legally separate entities. The equity position of each fund and component unit is reported as an asset by the funds and component units. The external portion of the pool (i.e., participation by legally separate entities) is reported as the Investment Trust Fund in the accompanying financial statements. Participants’ shares redeemed during the year are based on actual cost; participants’ shares are then adjusted to fair value at year-end. The County has not provided or obtained any legally binding guarantees during the year to support the value of shares.
During the year, investments are stated at cost plus accrued interest and are adjusted for amortization of premiums and accretion of discounts. Investments are marked-to-market at year-end, since the pool does not meet the strict definition of the Securities and Exchange Commission Rule 2a-7 (“2a-7 like”). The fair value of U. S. Government securities, repurchase agreements, commercial paper and bankers’ acceptances are provided by the County’s custodian, which are based on various industry standard pricing sources. For interest-bearing investments, market value quotations do not include accrued interest. However, for reporting purposes, immaterial amounts of accrued interest are typically classified with the fair value of investments in the accompanying financial statements.
Investment income during the year, and any adjustment to fair value at year-end, is allocated to pool participants based upon their average equity in the pool. The adjustment to fair value related to all County funds (exclusive of legally separate entities’ accounts reflected in the Investment Trust Fund) is typically recorded in the General Fund, since this amount is not material. At year-end, based on the nature of investments held, there was no adjustment to fair value, since fair value was the same as cost.
External investment pool amounts, included in the schedule above, are as follows:
Primary Component Total Government Units Reporting Entity
Statement of Net Position Amounts: Equity in pooled cash and investments $ 1,101,156,494 $ 381,831 $ 1,101,538,325 Restricted equity in pooled cash and investments 35,721,821 - 35,721,821
Total $ 1,136,878,315 $ 381,831 $ 1,137,260,146
Deposit and Investment Summary: Deposits $ 460,293,804 $ - $ 460,293,804 Investments, including accrued interest 676,584,511 381,831 676,966,342
Total $ 1,136,878,315 $ 381,831 $ 1,137,260,146 Deposits:
Custodial Credit Risk
Custodial credit risk for deposits is the risk that, in the event of the failure of a depository financial institution, the County will not be able to recover deposits or will not be able to recover collateral securities that are in the possession of an outside party. State statute requires that securities underlying certificates of deposit have a market value that equals or exceeds the cost of the deposit while County investment policy requires a market value of at least 102 percent of the cost of the deposit. Appropriate sections of these cited statutes also require that funds on deposit in financial institutions be fully secured. The form of such security shall be in compliance with State statute and the County Code. Collateral pledged for protection of these banking deposits is held in the County’s name at a third party depository, in the trust department of pledging banks, or insured by a surety bond by a State approved insurance company.
61

Deposits typically include bank accounts and non-negotiable certificates of deposit; at year-end the County held no non-negotiable certificates of deposit. Deposits at financial institutions were fully insured or collateralized at year-end. Therefore, the County has no significant exposure to custodial credit risk.
Investments
The County, through its external investment pool, maintains an active and sophisticated cash and investment management program. The primary objectives of the program are the preservation of capital, providing liquidity to meet financial obligations, and maximization of the investment yield on short-term working capital. Working capital is managed pursuant to the Annotated Code of Maryland, the County Code, and the County’s investment policies as approved by the County Council. At year-end, the investment portfolio was comprised of commercial paper and the Maryland Local Government Investment Pool (MLGIP). During the year, the County also invested in U.S. Government securities. The County was in compliance with all applicable investment statutes throughout the fiscal year.
The Maryland Local Government Investment Pool (MLGIP) provides all local government units of the State a safe investment vehicle for the short-term investment of funds. The State Legislature created the Maryland Local Government Investment Pool within the Annotated Code of Maryland. The Pool's purpose is to assist the public finance officer by providing an investment medium in which the participants may invest their idle balances. A pooled fund strategy is utilized creating a money market fund for municipalities that is a very safe, highly efficient, programmed approach to investing. Participants are provided professional money management, a well-diversified portfolio and reduced cost. The MLGIP is rated “AAAm” by Standard and Poor's (their highest rating). The MLGIP, under the administrative control of the State Treasurer, is managed by PNC Capital Investors, LLC and custodied by PNC Bank, N.A. A MLGIP Advisory Committee of current participants was formed to review, on a semi-annual basis, the activities of the Fund and to provide suggestions to enhance the Pool.
Investment Type: Fair Value Principal Maturity Range Interest Range U.S. Government Securities $ 454,177,227 $ 455,420,629 July 2015-March 2016 0.16%-0.34% Commercial paper 70,484,237 70,484,237 July 2015-October 2015 0.38%-0.54% State pool 150,778,507 150,778,507 n/a 0.07%
Total $ 675,439,971 $ 676,683,373
Interest Rate Risk
Interest rate risk is the risk that changes in interest rates will adversely affect the fair value of an investment. As a means of limiting its exposure to fair value losses arising from rising interest rates, the County’s investment policy limits investments to maturities of one year or less. However, a portion of the portfolio may be invested in investments with longer maturities (up to two years); any investment with a maturity of over 12 months must be approved by the Director of Finance prior to execution. At June 30, 2015 the County had no investments with a maturity over 12 months.
Credit Risk
Credit risk is the risk that an issuer or other counterparty to an investment will not fulfill its obligations. The County is authorized to invest in: a) obligations for which the United States has pledged its full faith and credit for the payment of principal and interest, b) obligations that a federal agency or instrumentality issues in accordance with an act of Congress, or c) repurchase agreements that any of the foregoing listed obligations secures. Cited statutes also authorize investments in bankers’ acceptances, secured certificates of deposit issued
62

by Maryland banks, commercial paper of the highest investment grade, the MLGIP, and money market mutual funds that are registered and operate in accordance with Rule 2a-7 and in accordance with Maryland State Code. State statutes and County policies require that these money market mutual funds invest only in obligations of U.S. Treasuries, U.S. agencies and repurchase agreements collateralized by an obligation of the United States, its agencies or instrumentalities.
The County’s investments held at year-end or during the year were rated as follows:
Ratings Standard &
Investment Type: Poor's Fitch Moody's
Repurchase agreements 1 N/R N/R N/R U.S. Government securities 2: Short Term Debt/ Discount Notes A-1+ F1+ P-1
Farmer Mac (FAMCA) Long Term Debt N/R N/R N/R Federal Farm Credit (FFCB) Long Term Debt AA+ AAA Aaa Federal Home Loan Bank (FHLB) Long Term Debt AA+ N/R Aaa Federal Home Loan Mortgage Corporation "Freddie Mac" AA+ AAA Aaa (FHLMC) Long Term Debt Fannie Mae (FNMA) Long Term Debt AA+ AAA Aaa
Commercial paper 3 A-1 F1 P-1 Bankers’ acceptances 4 N/R N/R N/R Certificates of deposit 5 N/R N/R N/R Local Government Investment Pool (MLGIP) AAAm N/R N/R Money market mutual funds AAA AAA Aaa
N/R - Not Rated 1 - Disclosure of the credit risk for the County’s repurchase agreements is required since the underlying
securities are not issued or explicitly guaranteed by the U.S. Government.
2 - Only includes securities implicitly guaranteed by the U.S. Government. 3 - Not all commercial paper is rated by all agencies. However, each commercial paper is rated by at least
one rating agency. Each such rating is of the highest investment grade.
4 - While the bankers’ acceptances are not rated, County policy requires that the underlying issuer is of the highest short-term investment grade.
5 - While the certificates of deposit are not rated, County policy requires that the underlying issuer is of the highest short-term investment grade.
Custodial Credit Risk
Custodial credit risk for investments is the risk that, in the event of failure of the counterparty to a transaction, the County will not be able to recover the value of the investment or collateral securities that are in the possession of an outside party. Investment securities are exposed to custodial credit risk if the securities are uninsured, or not registered in the name of the government, and are held by either the counterparty or the counterparty’s trust department or agent, but not in the government’s name.
County and State statutes require that securities underlying repurchase agreements have a market value of at least 102 percent of the cost of the investment. County policies require that a third party custodian hold investment
63

securities and the collateral underlying all repurchase agreements. At June 30, 2015, the County’s investments were not exposed to custodial credit risk.
Concentration of Credit Risk
Concentration of credit risk for investments is the risk that, in the event of failure of an issuer, the County will not be able to recover the value of the investment or suffer a loss as a result of the magnitude of the County’s investment in that single issuer. It is the County’s practice to manage the investment portfolio according to the County’s investment policy and the guidelines, as outlined in the Annotated Code of Maryland, to insure diversification by investment type and institution in order to avoid unreasonable and foreseeable risks but in conjunction with the need to ensure safety, liquidity and return in an ever changing economic environment. The County’s policy provides the maximum limits as follows:
Diversification by Investment Type: Maximum percent of Portfolio* U. S. Treasury obligations 100 % U. S. Government agencies 75 Repurchase agreements 50 Bankers’ acceptances 25 Money market mutual fund 50 Local government investment pool 50 Collateralized certificates of deposit** 25 Commercial paper 10 Diversification by Institution: Maximum percent of Portfolio* Approved broker/dealers 30 % Money market mutual funds by fund 25 Bankers’ acceptances by country 15 Commercial Banks (Certificates of Deposit**) 10 U.S. Government agencies by agency 20 Commercial Paper by Issuer 5 * At time of purchase ** Certificates of deposit are classified as deposits for financial reporting purposes.
Certain types of investments were over the County’s requirements for maximum percentage of the portfolio at year-end. The investments over the maximum allowed in the investment pool are the U. S. Government agencies at 62.7% (limited to 75%) and commercial paper at 9.7% (limited to 10%). The maximum allocation at the time of investment purchase was consistent with the County’s Investment Policy. Other than US Agency Debt (16.0% Federal Home Loan Banks (FHLB), 13.0% Farmer Mac (FAMCA),13% Federal Farm Credit Bank (FFCB), 7.0% Federal Home Loan Mortgage Corp (FHLMC), 13.0% Federal National Mortgage Association (FNMA)) and MLGIP, the County’s investments are all under 5% for any one issuer. However, US Obligations (US Treasury and Agency Debt), mutual funds, and external investment pools (MLGIP) are exempt from the 5% of any one issuer maximum.
64
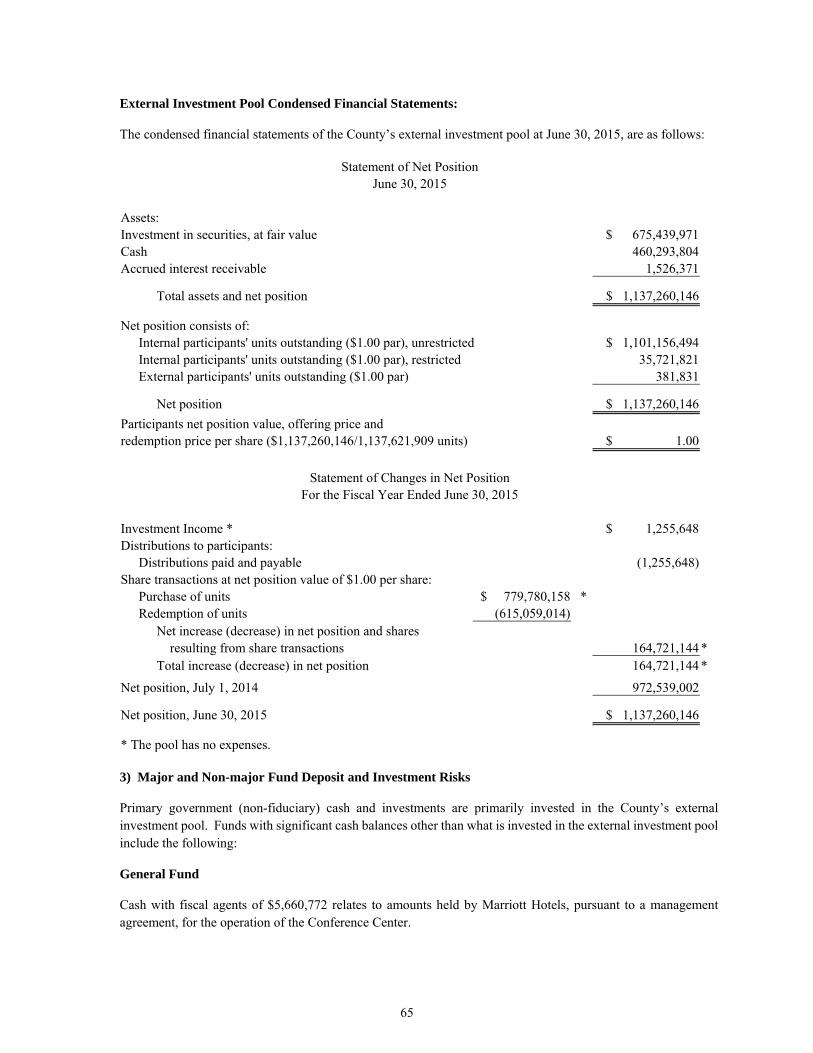
External Investment Pool Condensed Financial Statements:
The condensed financial statements of the County’s external investment pool at June 30, 2015, are as follows:
Statement of Net Position June 30, 2015
Assets: Investment in securities, at fair value $ 675,439,971 Cash 460,293,804 Accrued interest receivable 1,526,371
Total assets and net position $ 1,137,260,146
Net position consists of: Internal participants' units outstanding ($1.00 par), unrestricted $ 1,101,156,494 Internal participants' units outstanding ($1.00 par), restricted 35,721,821 External participants' units outstanding ($1.00 par) 381,831
Net position $ 1,137,260,146
Participants net position value, offering price and redemption price per share ($1,137,260,146/1,137,621,909 units) $ 1.00
Statement of Changes in Net Position
For the Fiscal Year Ended June 30, 2015 Investment Income * $ 1,255,648 Distributions to participants: Distributions paid and payable (1,255,648) Share transactions at net position value of $1.00 per share: Purchase of units $ 779,780,158 * Redemption of units (615,059,014) Net increase (decrease) in net position and shares resulting from share transactions 164,721,144 * Total increase (decrease) in net position 164,721,144 *
Net position, July 1, 2014 972,539,002
Net position, June 30, 2015 $ 1,137,260,146
* The pool has no expenses. 3) Major and Non-major Fund Deposit and Investment Risks
Primary government (non-fiduciary) cash and investments are primarily invested in the County’s external investment pool. Funds with significant cash balances other than what is invested in the external investment pool include the following:
General Fund
Cash with fiscal agents of $5,660,772 relates to amounts held by Marriott Hotels, pursuant to a management agreement, for the operation of the Conference Center.
65

Debt Service Fund
Cash with fiscal agents of $6,931,557 represents lease revenue bond, revenue bond and certificates of participation debt service reserve funds which are held in money market mutual funds and U.S Government securities.
Capital Projects Fund
Cash with fiscal agents of $37,590,270 is held in money market mutual funds for the purpose of reimbursing construction expenditures incurred for various capital projects in the County.
Liquor Fund
Cash with fiscal agents of $4,953,589 is held in money market funds for the purpose of reimbursing design, planning and renovation costs for a warehouse and for debt service. At the end of FY15, the County had incurred and paid renovation expenses that were to be reimbursed from cash from fiscal agents which occurred subsequent to year-end.
4) Fiduciary Funds
Employees’ Retirement System:
Investment Overview
Section 33-61C of the County Code (Code) authorizes the Board of Investment Trustees (Board) (see Note IV-F) to act with the care, skill, prudence and diligence under the circumstances that a prudent person acting in a similar capacity and familiar with the same matters would use to conduct a similar enterprise with similar purposes. The Code also requires that such investments be diversified so as to minimize the risk of large losses unless it is clearly not prudent to diversify under the circumstances. The Board has adopted an investment policy that works to control the extent of downside risk to which the Employees’ Retirement System (System) is exposed while maximizing the potential for long term increases in the value of assets. The overall investment policies do not address specific levels of credit risk, interest rate risk or foreign currency risk. The Board believes that risks can be managed, but not eliminated, by establishing constraints on the investment portfolios and by monitoring the financial markets, the System’s asset allocation and the investment managers hired by the System. Each investment manager has a specific benchmark and investment guidelines appropriate for the type of investments they are managing.
Credit Risk/Concentration of Credit Risk
Credit risk is the risk that an issuer or other counterparty to an investment will not fulfill its obligations. The Board’s investment policies and guidelines limit the percentage of the total fund and individual manager’s account which can be invested in fixed income securities rated below investment grade. In addition, the Board’s investment policies and guidelines, for the majority of public fund managers, limit the percentage of each investment manager’s account that may be allocated to any one security, position, issuer or affiliated issuer, to less than 5 percent of the fair value of the investment manager’s account. The System does not have investments (other than those issued or explicitly guaranteed by the U.S. Government or pooled investments) in any one company that represents 5 percent or more of net position held in trust for pension benefits.
66

The quality ratings of investments in fixed income securities as described by nationally recognized rating organizations as of June 30, 2015, are as follows:
Quality Percentage of Type of Investment Rating Fair Value Portfolio
U.S. Government Obligations* AAA $ 128,828,385 10.86 %Foreign Government Obligations AAA 783,288 0.07 AA 398,286 0.03 A 4,446,272 0.37 BBB 1,833,805 0.15 CCC 51,018 0.01 Unrated 3,023,349 0.26Asset-Backed Securities AAA 3,464,339 0.29Municipal/Provincial Bonds AAA 1,665,080 0.14 AA 9,383,201 0.79 A 1,310,502 0.11Corporate Bonds AAA 5,801,132 0.49 AA 34,339,675 2.89 A 142,478,179 12.01 BBB 133,990,218 11.29 BB 96,243,298 8.11 B 115,243,787 9.71 CCC 41,528,208 3.50 CC 128,500 0.01 D 764,862 0.07 Unrated 18,349,238 1.55Fixed Income Pooled Funds Unrated 323,766,841 27.28Short-term Investments and Other Unrated 118,827,948 10.01
Total Fixed Income Securities $ 1,186,649,411 100.00 %
* Obligations of the U.S. government or obligations explicitly guaranteed by the U.S. government are not considered to have credit risk and do not have purchase limitations.
Interest Rate Risk
Interest rate risk is the risk that changes in interest rates will adversely affect the fair value of the investment. The Board’s investment policies and guidelines manage interest rate risk by establishing duration constraints on each fixed income manager’s portfolio based on the duration of each manager’s respective benchmark. Duration is a measure of interest rate risk based on a bond price’s sensitivity to a 100-basis point change in interest rates. The greater the duration of a bond, or a portfolio of bonds, the greater its price volatility will be in response to a change in interest rates and vice-versa. Duration of eight would mean that, given a 100-basis point change up/down in rates, a bond’s price would move down/up by 8 percent.
67

As of June 30, 2015, the System’s fixed income portfolio had the following sensitivity to changes in interest rates:
Effective Duration Percentage Type of Investment in Years Fair Value of Portfolio
U.S. Government Obligations 16.10 $ 128,828,385 10.86 % Foreign Government Obligations 3.35 10,536,018 0.89Asset-Backed Securities 12.98 3,464,339 0.29Municipal/Provincial Obligations 13.93 12,358,783 1.04Corporate Bonds 7.03 588,867,097 49.63Fixed Income Pooled Funds N/A 323,766,841 27.28Short-term Investments and Other * N/A 118,827,948 10.01
Total Fixed Income Securities $ 1,186,649,411 100.00 % * Short-term investments consist of U.S. Treasury and government sponsored securities, money market funds, commercial paper, certificates of deposit, repurchase agreements, asset backed securities, notes and bonds issued by U.S. corporations, and other allowable instruments that meet short-term maturity or average life, diversification, and credit quality restricts.
Foreign Currency Risk
Foreign currency risk is the risk that changes in exchange rates will adversely affect the fair value of an investment. The Board’s International Investing Policy’s objective is to achieve long-term capital appreciation and current income by investing in diversified portfolios of non-U.S. equities and bonds. The System has indirect exposure to foreign currency risk as follows:
Short-term Total Non- International Securities Equity Fixed Income and Other U.S. Dollar
Euro $ 136,581,467 $ 1,247,131 $ 71,856,795 $ 209,685,393 Japanese yen 137,758,990 - 62,341,850 200,100,840 Norwegian Krone 1,899,876 - 45,255,217 47,155,093 Australian Dollar 3,035,321 1,190,470 34,703,717 38,929,508 Swiss Franc 34,528,124 - - 34,528,124 British Pound Sterling 91,823,952 - (67,060,362) 24,763,590 Danish Krone 14,882,743 - - 14,882,743 Hong Kong Dollar 13,431,089 - 462,787 13,893,876 Swedish Krona 15,768,783 - (9,415,951) 6,352,832 Mexican Peso - 4,056,504 - 4,056,504 Other Currencies 6,092,024 4,786,649 (142,773,148) (131,894,475)
Total International Securities $ 455,802,369 $ 11,280,754 $ (4,629,095) $ 462,454,028
Derivatives
In accordance with the Board’s Statement of Investment Policy and Objectives, the System regularly invests in derivative financial instruments in the normal course of its investing activities to manage exposure to certain risks within the fund. During FY15, the System invested directly in various derivatives including, exchange-traded future contracts, forward currency contracts, and swaps. Investment managers are prohibited from purchasing securities on margin or using leverage unless specifically permitted within the investment manager’s guidelines.
68

These investments generally contain market risk resulting from fluctuations in interest and currency rates. The credit risk of these investments is associated with the creditworthiness of the related parties to the contracts. The System could be exposed to risk if the counterparties to the contracts are unable to meet the terms of the contracts. The Board’s Statement of Investment Policy and Objectives seeks to control this risk through counterparty credit evaluations and approvals, counterparty credit limits and exposure monitoring procedures. In addition, the System has indirect exposure to market and credit risk through its ownership interests in certain mutual and commingled funds which may hold derivative financial instruments. The system is not a dealer, but an end-user of these instruments.
The notional or contractual amounts of derivatives indicate the extent of the System’s involvement in the various types of derivative financial instruments and do not measure the System’s exposure to credit or market risk and do not necessarily represent amounts exchanged by the parties. The amounts exchanged are determined by reference to the notional amounts and the other terms of the derivatives.
As permitted by the Board’s policies, the System holds off-balance sheet derivatives in the form of exchange-traded financial futures, and foreign currency exchange contracts.
Futures contracts are contracts in which the buyer agrees to purchase and the seller agrees to make delivery of a specified financial instrument at a predetermined date and price. Gains and losses on future contracts are settled daily. Futures contracts are standardized and are traded on exchanges. The exchange assumes the risk that a counterparty will not pay. As of June 30, 2015, the System held 427 long US Treasury futures contracts with a fair value of $54,890,820 and 561 short US Treasury futures contracts with a fair value of ($110,485,125).
Foreign exchange contracts involve an agreement to exchange the currency of one country for the currency of another country at an agreed-upon price and settlement date. Foreign exchange contracts contain market risk resulting from fluctuations in currency rates. The credit risk is associated with the creditworthiness of the related parties to the contracts. As of June 30, 2015, the System held $653,090,415 buy foreign exchange contracts and ($673,033,045) sell foreign exchange contracts. The unrealized gain on the System’s contracts was $1,534,370.
Securities Lending
Board policy permits the System to lend its securities to broker-dealers and other entities (borrowers) for collateral that will be returned for the same securities in the future. The System’s custodian is the agent in lending the System’s securities for collateral of 102 percent for domestic and 105 percent for international securities. The custodian receives cash, securities or irrevocable bank letters of credit as collateral. All securities loans can be terminated on demand by either the System or the borrower. Cash collateral received from the borrower is invested by the lending agent, as an agent for the System, in a short-term investment pool in the name of the System, with guidelines approved by the Board. Such investments are considered a collateralized investment pool. The relationship between the maturities of the investment pool and the System’s loans is affected by the maturities of securities loans made by other plan entities that invest cash collateral in the investment pool, which the System cannot determine. The System records a liability for the return of the cash collateral shown as collateral held for securities lending in the statement of net position. The agent indemnifies the System by agreeing to purchase replacement securities, or return the cash collateral thereof, in the event a borrower fails to return loaned securities or pay distributions thereon. There were no such failures by any borrower during the fiscal year, nor were there any losses during the period resulting from a default of the borrower or lending agent.
As of June 30, 2015, the fair value of securities on loan was $390,940,192. Cash received as collateral and the related liability of $273,912,882 as of June 30, 2015, is shown on the Statement of Plan Net Position. Securities received as collateral are not reported as assets since the System does not have the ability to pledge or sell the collateral securities absent borrower default. Securities lending revenues and expenses amounting to $1,156,632
69

and $68,012, respectively, have been classified with investment income and investment expenses, respectively, in the accompanying financial statements.
The following represents the balances relating to the securities lending transactions at June 30, 2015:
Underlying Non-Cash Cash Collateral Securities Lent Securities Collateral Value Investment Value
Lent for Cash Collateral: U.S. Government Obligations $ 87,710,859 $ - $ 89,511,877 Corporate Bonds 80,386,134 - 82,053,823 Equities 100,063,899 - 102,347,182 Lent for Non-Cash Collateral: U.S. Government Obligations 2,199,242 2,243,149 - Corporate Bonds 4,383,667 4,477,281 - Equities 116,196,391 124,743,197 -
Total $ 390,940,192 $ 131,463,627 $ 273,912,882
At year-end, the System has no credit risk exposure to borrowers because the amounts the System owes the borrowers exceeded the amounts the borrowers owe the System. The System is fully indemnified by its custodial bank against any losses incurred as a result of borrower default.
Custodial Credit Risk
Custodial credit risk is the risk that, in the event of the failure of the counterparty, the System will not be able to recover the value of its investments or collateral securities that are in the possession of an outside party. At June 30, 2015, there were no funds held by a counterparty that was acting as the System’s agent in securities lending transactions.
Employees’ Retirement Savings Plan:
Section 33-125 of the Code authorizes the Board to establish a diversified slate of mutual and commingled investment funds from which participants may select an option. The Board exercises the Standard of Care as delineated in Section 33-61 of the Code. As of June 30, 2015, the fair value of the mutual and commingled investment funds was $313,170,346. The fair value of the investments in international mutual funds was $75,654,256.
Employees’ Deferred Compensation Plan:
The Board is required to establish a diversified slate of mutual and commingled funds from which participants may select investment options. The Board exercises the Standard of Care as delineated in Section 33-61 of the Code. As of June 30, 2015, the fair value of the mutual and commingled investment funds was $351,892,072. The fair value of the investments in international mutual funds included in the County Plan was $43,773,219.
Consolidated Retiree Health Benefits Trust:
Section 33-163 of the Code authorizes the Board of Trustees of the Consolidated Retiree Health Benefits Trust (Trust) to act with the care, skill, prudence and diligence under the circumstances that a prudent person acting in a similar capacity and familiar with the same matters would use to conduct a similar enterprise with similar purposes. The Code also requires that such investments be diversified so as to minimize the risk of large losses
70
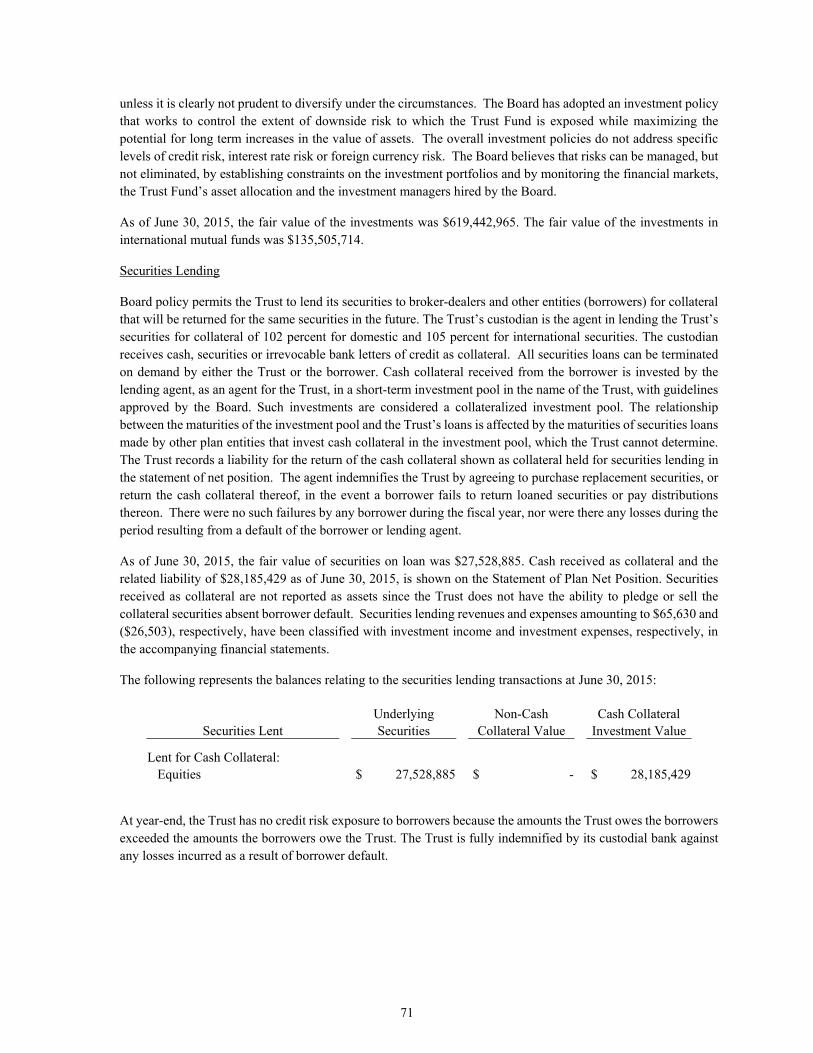
unless it is clearly not prudent to diversify under the circumstances. The Board has adopted an investment policy that works to control the extent of downside risk to which the Trust Fund is exposed while maximizing the potential for long term increases in the value of assets. The overall investment policies do not address specific levels of credit risk, interest rate risk or foreign currency risk. The Board believes that risks can be managed, but not eliminated, by establishing constraints on the investment portfolios and by monitoring the financial markets, the Trust Fund’s asset allocation and the investment managers hired by the Board.
As of June 30, 2015, the fair value of the investments was $619,442,965. The fair value of the investments in international mutual funds was $135,505,714.
Securities Lending
Board policy permits the Trust to lend its securities to broker-dealers and other entities (borrowers) for collateral that will be returned for the same securities in the future. The Trust’s custodian is the agent in lending the Trust’s securities for collateral of 102 percent for domestic and 105 percent for international securities. The custodian receives cash, securities or irrevocable bank letters of credit as collateral. All securities loans can be terminated on demand by either the Trust or the borrower. Cash collateral received from the borrower is invested by the lending agent, as an agent for the Trust, in a short-term investment pool in the name of the Trust, with guidelines approved by the Board. Such investments are considered a collateralized investment pool. The relationship between the maturities of the investment pool and the Trust’s loans is affected by the maturities of securities loans made by other plan entities that invest cash collateral in the investment pool, which the Trust cannot determine. The Trust records a liability for the return of the cash collateral shown as collateral held for securities lending in the statement of net position. The agent indemnifies the Trust by agreeing to purchase replacement securities, or return the cash collateral thereof, in the event a borrower fails to return loaned securities or pay distributions thereon. There were no such failures by any borrower during the fiscal year, nor were there any losses during the period resulting from a default of the borrower or lending agent.
As of June 30, 2015, the fair value of securities on loan was $27,528,885. Cash received as collateral and the related liability of $28,185,429 as of June 30, 2015, is shown on the Statement of Plan Net Position. Securities received as collateral are not reported as assets since the Trust does not have the ability to pledge or sell the collateral securities absent borrower default. Securities lending revenues and expenses amounting to $65,630 and ($26,503), respectively, have been classified with investment income and investment expenses, respectively, in the accompanying financial statements.
The following represents the balances relating to the securities lending transactions at June 30, 2015:
Underlying Non-Cash Cash Collateral Securities Lent Securities Collateral Value Investment Value
Lent for Cash Collateral: Equities $ 27,528,885 $ - $ 28,185,429
At year-end, the Trust has no credit risk exposure to borrowers because the amounts the Trust owes the borrowers exceeded the amounts the borrowers owe the Trust. The Trust is fully indemnified by its custodial bank against any losses incurred as a result of borrower default.
71
Component Units
HOC
At year-end, HOC’s cash and investments are significant in relation to the total component unit cash and investments. HOC’s cash balances as of June 30, 2015, were entirely insured or collateralized with securities held by HOC’s agent in HOC’s name. HOC’s investments are subject to interest rate, credit, and custodial risk as described below:
Interest Rate Risk
HOC’s investment policy which applies to the General Fund, Public Fund and the Opportunity Housing Fund, requires that the majority of HOC’s investments must be on a short-term basis (less than one year); however a portion of the portfolio may be invested in investments with longer maturities (up to two years). The investment requirements for the Multi-Family Fund and Single Family Fund are specified within each of the bond trust indentures. The bond trustee is required to invest money in obligations with the objective that sufficient money will be available to pay the interest due on the bonds and will mature or be subject to redemption with the objective that sufficient money will be available for the purposes intended in accordance with the Indenture.
Credit Risk
HOC’s investment policy for the General Fund, Public Fund and the Opportunity Housing Fund permits the following investment types: U.S. government and federal agencies; repurchase agreements; banker’s acceptances; money market mutual funds; Maryland local government investment pool; Montgomery County investment pool; certificate of deposits and time deposits; and commercial paper. Bankers Acceptances of domestic banks and commercial paper must maintain the highest rating from one of the Nationally Recognized Statistical Rating Organizations (NRSRO) as designated by the SEC or State Treasurer. Repurchase agreements require collateralization at 102% of the principal amount by an obligation of the United States, its agencies or instrumentalities provided the collateral is held by a custodian, other than the seller. Certificates of deposit or time deposits must be collateralized at 102% of the fair value and held by a custodian other than the seller. HOC invests in the Maryland State Local Government Investment Pool (MLGIP). The MLGIP is not subject to regulatory oversight by the SEC, however the MGLIP is operated pursuant to the annotated code of Maryland.
The Single Family and Multi-Family Bond Funds require that the trustee invest moneys on deposit under the indenture in investment obligations as defined by the respective bond indenture agreements. Investment obligations are defined as the following: (i) Government obligations; (ii) bond debentures or other obligations issued by government agencies or corporations; (iii) time deposits or certificate of deposits insured by the Federal Deposit Insurance Corporation; (iv) repurchase agreements backed by obligations described in (i) and (ii) above; (v) investment agreements; (vi) tax exempt obligations; and (vii) money market funds.
Custodial Risk
Amounts held in trust accounts and other demand accounts are covered by federal depository insurance, or collateralized at a level of at least 102% of fair value of principal and accrued interest. Repurchase agreement collateral for the MLGIP is segregated and held in the name of PNC Bank Safe Deposit and Trust’s account at the Federal Reserve Bank. The cash and cash equivalents held by PNC Bank for the General Fund, Housing Opportunity Fund and Public Fund are in bank money market accounts and interest bearing accounts. These amounts are unrated by an independent rating agency. The Moody’s rating for PNC Bank short-term deposits as of June 30, 2015 was P-1.
72

At June 30, 2015, HOC had the following cash, cash equivalents, investments and maturities:
Fair Value Rating Cash Equivalents:
General Sub Fund: Money Market Accounts $ 18,430,336 N/A
Opportunity Housing Sub Fund: Investment in MLGIP 214,706 AAAm Money Market Accounts 15,900,233 N/A
Public Sub Fund: Investment in MLGIP 4,024,768 AAAm Money Market Accounts 3,146,933 N/A
Multi-Family Sub Fund: Money Market Accounts 45,498,424 N/A
Single Family Fund: Money Market Accounts 69,551,670 N/A
Real Estate Limited Partnership: Investment in MLGIP 1,073,176 AAAm Certificate of Deposit 1,921,984 N/A Money Market Accounts 10,991,864 N/A
Total cash equivalents $ 170,754,094
Short-term Investments:
Single-Family Sub Fund: GNMA Pass through Certificates 842,115 AAA US Treasuries 2,345,800 N/A
Total short-term investments $ 3,187,915
(Rest of page intentionally left blank.)
73

Greater than Fair Value 1-5 years 6-10 years 10 years Rating
Long-term Investments:
Opportunity Housing Sub Fund:
Certificate of Deposit $ 44,479 $ 44,479 $ - $ - N/A
Multi-Family Fund: U. S. Treasuries 2,353,816 1,334,300 1,019,516 - Aaa Fannie Mae 3,174,891 - - 3,174,891 Aaa Freddie Mac 889,687 - - 889,687 Aaa Federal Farm Credit Banks 1,599,920 - 1,599,920 - Aaa Federal Home Loan Banks 934,354 - 934,354 - Aaa Israel ST Bonds 448,857 - - 448,857 Aaa Federal Home Loan Mortgage 908,818 - - 908,818 Aaa Bank One Investment Agreement 591,525 - - 591,525 AA/Aa2
Single Family Fund: Federal Farm Credit Banks 6,694,447 - - 6,694,447 Aaa Federal Home Loan Banks 9,192,023 - - 9,192,023 Aaa Federal Home Loan Mtg Corp 1,680,039 - - 1,680,039 Aaa Fannie Mae 1,060,450 - - 1,060,450 Aaa GNMA Pass-through certificates 16,853,950 - - 16,853,950 AAA U. S. Treasuries 8,034,142 2,092,112 4,617,895 1,324,135 N/A Tennessee Valley Authority 6,523,239 2,422,503 - 4,100,736 Aaa
Total long-term investments 60,984,637 5,893,394 8,171,685 $ 46,919,558
Cash balances 72,761,162
Total Cash, Cash Equivalents and Investments $ 307,687,808
(Rest of page intentionally left blank.)
74

B) Receivables
1) Accounts Receivable
Receivables at June 30, 2015 for the County’s major funds and internal service funds in the aggregate, including the allowances for uncollectible accounts, were as follows:
Other Total General Housing Debt Capital Governmental Governmental Fund Initiative Grants Service Projects Funds Funds
Receivables Income taxes $ 284,319,753 $ - $ - $ - $ - $ - $ 284,319,753
Property taxes 15,573,609 - - - 101 4,261,998 19,835,708
Capital leases - - - 27,225,000 - - 27,225,000
Accounts 9,898,885 - 1,456 1,025,787 71,074 19,998,390 30,995,592
Notes - - 1,982,881 - - 776,004 2,758,885
Parking violations 898,323 - - - - 313,720 1,212,043
Mortgages 118,021 191,554,677 35,283,490 - 305,664 2,810,263 230,072,115
Total receivables 310,808,591 191,554,677 37,267,827 28,250,787 376,839 28,160,375 596,419,096
Allowance for uncollectible accounts (1,626,306) (8,534,061) (2,566,459) - - (8,773,234) (21,500,060)
Total receivable (net) $ 309,182,285 $ 183,020,616 $ 34,701,368 $ 28,250,787 $ 376,839 $ 19,387,141 $ 574,919,036
Amounts not scheduled for collection during the subsequent year $ 118,021 $ 191,554,677 $ 37,266,371 $ 27,225,000 $ 305,664 $ 3,586,267 $ 260,056,000
Governmental Parking Other Total Activities - Solid Waste Lot Enterprise Enterprise Internal
Liquor Activities Districts Funds Funds Service Funds
Receivables
Property taxes $ - $ - $ 949,249 $ - $ 949,249 $ -
Accounts 5,954,742 4,427,879 - 213,971 10,596,592 1,681,588
Parking violations - - 3,547,306 - 3,547,306 -
Total receivables 5,954,742 4,427,879 4,496,555 213,971 15,093,147 1,681,588
Allowance for uncollectible accounts (44,368) (1,769) (2,891,016) (4,944) (2,942,097) (1,678)
Total receivable (net) $ 5,910,374 $ 4,426,110 $ 1,605,539 $ 209,027 $ 12,151,050 $ 1,679,910
Amounts not scheduled for collection during the subsequent year $ - $ - $ - $ - $ - $ -
(Rest of page intentionally left blank.)
75

2) Due from/to Component Units
The balances at June 30, 2015, were:
Due from Component Units / Due to Primary Government: Due from Component Units: MCPS MCC MCRA HOC BUPI Total
Due to Primary Government: General $ - $ 77,679 $ - $ 35,355 $ - $ 113,034
Grants - - - 10,991,065 - 10,991,065
Capital Projects - - - 16,489,178 - 16,489,178
Housing Initiative - - - 48,011,715 - 48,011,715
Nonmajor Governmental - 419,333 - - - 419,333
Solid Waste Activities Enterprise 48,122 1,014 - 265 2,054 51,455
Internal Service 9,909 8,522 98,789 458,799 16,798 592,817
Fiduciary - - 32,592 2,268,972 - 2,301,564
Total Due to Primary Government $ 58,031 $ 506,548 $ 131,381 $78,255,349 $ 18,852 $ 78,970,161
Due to Component Units / Due from Primary Government: Due to Component Units: MCPS MCC MCRA HOC BUPI Total
Due from Primary Government: General $ 11,884,600 $ - $ - $ 1,710,956 $ 17,245 $ 13,612,801
Grants 45,483 - - 5,191 50,674
Capital Projects 4,246,641 10,179,267 - 1,495,509 - 15,921,417
Housing Initiative - - - 441,189 - 441,189
Nonmajor Governmental 126,656 - - - 18,059 144,715
Nonmajor Enterprise 784,870 - - - - 784,870
Fiduciary 6,324 - - - - 6,324
Total Due from Primary Government $ 17,094,574 $10,179,267 $ - $ 3,652,845 $ 35,304 $ 30,961,990
In the major governmental funds, $48,011,715 due from HOC to the Housing Initiative Special Revenue Fund represents mortgage loans, which are generally repayable based on project cash flows, specified future dates, or sales of the respective properties. Included in this amount is a loan of $1,744,838, for which payments are based on cash flows. Terms of the note stipulate that the balance of the note will be forgiven at the termination of the ground lease in December 2035. In FY15, $181,241 was paid based on cash flows generated by the project. Also included in the amount above is a ground lease, upon which is located affordable housing owned by HOC. The ground lease provides for lease payments from HOC for $1 per year for 83 years, amounting to $57 at year-end. These two loans are offset by unearned revenue. Fund balance has been reserved for the remaining loans.
3) Due from Other Governments
The total amount due from other governments at June 30, 2015, was comprised of the following:
Capital Solid Waste Nonmajor Internal General Grants Projects Activities Governmental Service Fiduciary Total
Federal government $ - $ 16,366,867 $ 317,050 $ 810 $ - $ - $ 96,423 $ 16,781,150 State of Maryland 32,853,912 9,903,033 1,085,242 13,182 17,234,314 60,877 8,732 61,159,292 Other 4,759 54,612 1,070,904 125,958 - 33,752 299,585 1,589,570
Total $ 32,858,671 $ 26,324,512 $ 2,473,196 $ 139,950 $ 17,234,314 $ 94,629 $ 404,740 $ 79,530,012
76

C) Capital Assets
Primary Government
Capital asset activity for the year ended June 30, 2015, was as follows:
Balance Balance July 1, 2014 Increases Decreases June 30, 2015
Governmental Activities Nondepreciable Capital Assets: Land $ 888,200,036 $ 19,739,497 $ - $ 907,939,533
Construction in progress 1,128,317,714 252,517,330 24,549,567 1,356,285,477
Total Nondepreciable Capital Assets 2,016,517,750 272,256,827 24,549,567 2,264,225,010
Depreciable Capital Assets: Buildings 807,569,893 17,710,559 - 825,280,452
Improvements other than buildings 57,063,813 2,198,324 - 59,262,137
Furniture, fixtures, equipment and machinery 236,431,524 2,332,499 1,849,503 236,914,520
Leasehold improvements 12,956,842 - - 12,956,842
Automobiles and trucks 275,277,985 20,831,223 17,761,046 278,348,162
Infrastructure 1,827,665,357 10,900,665 - 1,838,566,022
Other assets 40,359,973 - - 40,359,973
Total Capital Assets being Depreciated 3,257,325,387 53,973,270 19,610,549 3,291,688,108
Less Accumulated Depreciation for: Buildings 378,920,869 19,258,459 - 398,179,328
Improvements other than buildings 24,536,002 1,478,018 - 26,014,020
Furniture, fixtures, equipment and machinery 183,267,437 7,375,137 1,679,022 188,963,552
Leasehold improvements 7,352,026 558,269 - 7,910,295
Automobiles and trucks 151,600,843 19,596,004 16,958,969 154,237,878
Infrastructure 652,244,592 37,297,455 - 689,542,047
Other assets 11,825,216 4,028,436 - 15,853,652
Total Accumulated Depreciation 1,409,746,985 89,591,778 18,637,991 1,480,700,772
Total Depreciable Assets, net 1,847,578,402 (35,618,508) 972,558 1,810,987,336
Governmental Activities Capital Assets, net $ 3,864,096,152 $ 236,638,319 $ 25,522,125 $ 4,075,212,346
Business-Type Activities Nondepreciable Capital Assets: Land $ 59,158,993 $ - $ - $ 59,158,993
Construction in progress 43,343,304 1,361,466 42,876,341 1,828,429
Total Nondepreciable Capital Assets 102,502,297 1,361,466 42,876,341 60,987,422
Depreciable Capital Assets: Buildings 244,478,692 50,707,448 - 295,186,140
Improvements other than buildings 175,758,514 924,145 - 176,682,659
Furniture, fixtures, equipment and machinery 25,381,694 5,347,434 634,482 30,094,646
Infrastructure 14,351 - - 14,351
Automobiles and trucks 4,221,323 - 53,886 4,167,437
Total Capital Assets being Depreciated 449,854,574 56,979,027 688,368 506,145,233
Less Accumulated Depreciation for: Buildings 128,285,519 8,293,671 - 136,579,190
Improvements other than buildings 124,926,680 4,399,044 - 129,325,724
Furniture, fixtures, equipment and machinery 15,704,704 1,832,397 588,284 16,948,817
Infrastructure 4,449 574 - 5,023
Automobiles and trucks 3,384,882 182,576 53,885 3,513,573
Total Accumulated Depreciation 272,306,234 14,708,262 642,169 286,372,327
Total Depreciable Assets, net 177,548,340 42,270,765 46,199 219,772,906
Business-Type Activities Capital Assets, net $ 280,050,637 $ 43,632,231 $ 42,922,540 $ 280,760,328
77

Depreciation expense was charged to the functions of the primary government as follows:
Governmental activities: General government $ 7,362,115 Public safety 9,934,449 Public works and transportation 61,810,802 Health and human services 2,193,111
Culture and recreation 7,049,540 Community development and housing 1,229,087 Environment 181,016
Total depreciation expense-governmental activities $ 89,760,120 *
Business-type activities: Liquor $ 2,118,550 Solid waste activities 1,494,418 Parking lot districts 10,950,555 Permitting services 143,902 Community use of public facilities 834
Total depreciation expense-business-type activities $ 14,708,259
* Depreciation expense does not include transfers of assets of $168,342 completed during the
fiscal year.
Construction commitments as of June 30, 2015 are as follows:
General Government $ 175,032,929 Public Safety 4,567,424 Public Works and Transportation 194,989,030
Health and Human Services 18,054,492 Culture & Recreation 1,582,850 Community Development & Housing 109,061 Environment 30,203,759
Total $ 424,539,545
(Rest of page intentionally left blank.)
78
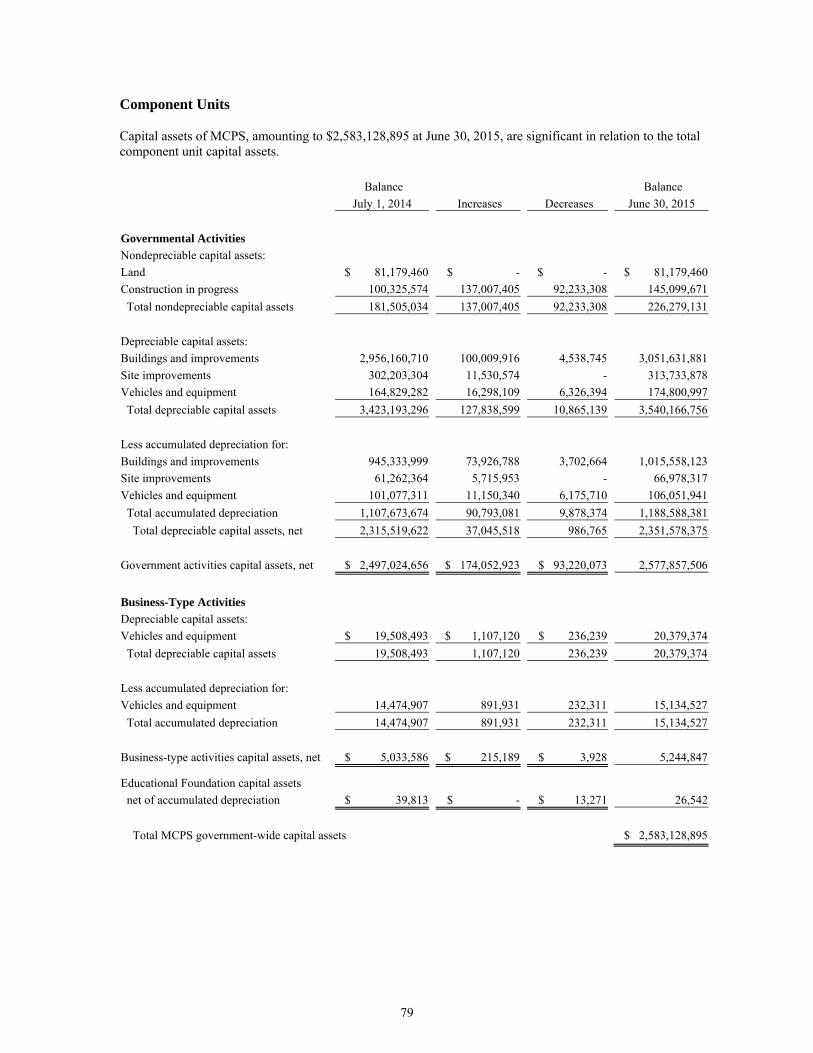
Component Units
Capital assets of MCPS, amounting to $2,583,128,895 at June 30, 2015, are significant in relation to the total component unit capital assets.
Balance
Balance
July 1, 2014 Increases Decreases June 30, 2015
Governmental Activities Nondepreciable capital assets: Land $ 81,179,460 $ - $ - $ 81,179,460
Construction in progress 100,325,574 137,007,405 92,233,308 145,099,671
Total nondepreciable capital assets 181,505,034 137,007,405 92,233,308 226,279,131
Depreciable capital assets: Buildings and improvements 2,956,160,710 100,009,916 4,538,745 3,051,631,881
Site improvements 302,203,304 11,530,574 - 313,733,878
Vehicles and equipment 164,829,282 16,298,109 6,326,394 174,800,997
Total depreciable capital assets 3,423,193,296 127,838,599 10,865,139 3,540,166,756
Less accumulated depreciation for: Buildings and improvements 945,333,999 73,926,788 3,702,664 1,015,558,123
Site improvements 61,262,364 5,715,953 - 66,978,317
Vehicles and equipment 101,077,311 11,150,340 6,175,710 106,051,941
Total accumulated depreciation 1,107,673,674 90,793,081 9,878,374 1,188,588,381
Total depreciable capital assets, net 2,315,519,622 37,045,518 986,765 2,351,578,375
Government activities capital assets, net $ 2,497,024,656 $ 174,052,923 $ 93,220,073 2,577,857,506
Business-Type Activities Depreciable capital assets: Vehicles and equipment $ 19,508,493 $ 1,107,120 $ 236,239 20,379,374
Total depreciable capital assets 19,508,493 1,107,120 236,239 20,379,374
Less accumulated depreciation for: Vehicles and equipment 14,474,907 891,931 232,311 15,134,527
Total accumulated depreciation 14,474,907 891,931 232,311 15,134,527
Business-type activities capital assets, net $ 5,033,586 $ 215,189 $ 3,928 5,244,847
Educational Foundation capital assets net of accumulated depreciation $ 39,813 $ - $ 13,271 26,542
Total MCPS government-wide capital assets $ 2,583,128,895
79

Depreciation expense of MCPS was charged to functions/programs as follows:
Governmental activities: Regular instruction $ 75,042,641 Special education 139,457 School administration 89,526 Student transportation 8,751,072 Operation of plant 165,085 Maintenance of plant 5,950,935 Administration 654,365
Total depreciation expense-governmental activities $ 90,793,081
Business-type activities: Food services $ 879,244 Real estate management 12,687
Total depreciation expense-business type activities $ 891,931 Commitments for ongoing construction in progress at June 30, 2015, were $146,017,726.
D) Interfund Receivables, Payables, and Transfers
The composition of interfund receivables and payables as of June 30, 2015, is as follows:
Due From Fund
Nonmajor Internal
Due To Fund General Liquor Governmental Service Fiduciary Total
General $ - $ - $ - $ 3,858,451 $ 6,003,246 $ 9,861,697
Housing Initiative - - - 10,384 14,848 25,232
Grants 14,508,406 - - 163,211 185,019 14,856,636
Capital Projects 70,490,301 - 1,174,577 155,085 243,756 72,063,719
Liquor - - - 271,377 160,518 431,895
Solid Waste Activities - - - 69,109 87,760 156,869
Parking Lot Districts - - - 28,072 36,943 65,015
Nonmajor Governmental - 4,198 - 1,520,060 2,971,106 4,495,364
Nonmajor Enterprise - - - 154,311 252,419 406,730
Internal Service - - - 175,356 4,338,219 4,513,575
Fiduciary - - 310,000 8,803 8,831 327,634
Total $ 84,998,707 $ 4,198 $ 1,484,577 $ 6,414,219 $ 14,302,665 $ 107,204,366
Included in the amounts presented above are the following short-term loans from the General Fund that were, or will be, repaid during FY15:
$14.5 million to the Grants Special Revenue Fund to cover vendor payments prior to revenues being received from other government agencies; and
$70.5 million to the Capital Projects Fund to cover construction payments, due primarily to the timing of reimbursements from Federal, State and other agencies, and the lag time between programming and collection of certain impact taxes.
80

Remaining balances resulted from the time lag between the dates that (1) interfund goods and services are provided or reimbursable expenditures occur, (2) transactions are recorded in the accounting system, (3) payments between funds are made, and (4) payroll accrual charges to fiduciary funds.
Interfund transfers for the year ended June 30, 2015, consisted of the following:
Transfers In Fund
Housing Debt Capital Subtotal
Transfers Out Fund General Initiative Grants Service Projects Major
General $ - $ 18,572,277 $ - $ 281,282,150 $ 54,521,679 $ 354,376,106
Housing Initiative 295,481 - - 7,395,785 5,104,445 12,795,711
Capital Projects - 10,392,257 - - - 10,392,257
Liquor 28,300,046 - - 5,847,707 - 34,147,753
Solid Waste Activities 2,555,079 - - - - 2,555,079
Parking Lot Districts 801,217 - - - - 801,217
Nonmajor Governmental 24,018,229 - 570,182 38,477,412 7,191,170 70,256,993
Nonmajor Enterprise 4,544,805 - - - - 4,544,805
Internal Service Funds 10,745,911 - - - - 10,745,911
Total $ 71,260,768 $ 28,964,534 $ 570,182 $ 333,003,054 $ 66,817,294 $ 500,615,832
Transfers In Fund Nonmajor Nonmajor Internal Subtotal Transfers Out Fund Governmental Enterprise Service Major Total
General $ 4,275,067 $ 25,000 $ 576,813 $ 354,376,106 $ 359,252,986 Housing Initiative - - - 12,795,711 12,795,711 Capital Projects - - - 10,392,257 10,392,257 Liquor - - - 34,147,753 34,147,753 Solid Waste Activities - - - 2,555,079 2,555,079 Parking Lot Districts 13,356,555 - - 801,217 14,157,772 Nonmajor Governmental - - 15,575 70,256,993 70,272,568 Nonmajor Enterprise 108,818 - - 4,544,805 4,653,623 Internal Service Funds - - - 10,745,911 10,745,911
Total $ 17,740,440 $ 25,000 $ 592,388 $ 500,615,832 $ 518,973,660 Primary activities include:
Transfers from major and non-major governmental funds to the Debt Service Fund to provide funding for debt service principal and interest payments;
Transfers of current receipts and pay-go from the General Fund to the Capital Projects Fund;
Transfer of Liquor Enterprise Fund profits to the General Fund; and
Transfers from Capital Projects to Housing Initiative to build multi-family housing.
81

E) Leases
1) Operating Leases
The County leases buildings and office facilities and other equipment under non-cancelable operating leases. Lease agreements typically provide for automatic termination on July 1 of any year in which funds to meet subsequent rental payments are not appropriated. Total costs for operating leases were approximately $24,279,231 for FY15. Future minimum lease payments under significant non-cancelable operating leases are as follows.
Fiscal Year Ending June 30
2016 $ 25,701,787 2017 23,092,080 2018 22,531,687 2019 20,458,989 2020 17,699,435
2021 - 2025 53,307,266 2026 - 2030 15,791,768
Total $ 178,583,012
2) Capital Lease Receivable
Pursuant to the issue of the 2002 Lease Revenue Bonds and 2004 Lease Revenue Bonds (See Note III-F9), the County is obligated to lease the Shady Grove and Grosvenor Metrorail Garage Projects to WMATA at amounts calculated to be sufficient in both time and amount to pay, when due, the principal of and interest on the bonds. Separate lease agreements were executed in conjunction with each bond issue. The leases associated with the 2002 and 2004 bond issues have original terms of 22 years and 20 years, respectively, both ending on June 1, 2024.
On October 13, 2011, the County issued Series 2011 Bonds to finance a portion of the costs, and construction of the parking structure and related facilities at the Glenmont Metrorail Station within the County; and refunded the County’s outstanding Lease Revenue Bonds Series 2002 and Series 2004 Lease Revenue Bonds.
The composition of the capital lease receivable is as follows:
Minimum Lease Receivable Unearned Income Net Investment Shady Grove $ 14,093,200 $ (3,203,200) $ 10,890,000 Grosvenor 13,740,870 (3,123,120) 10,617,750 Glenmont 7,398,930 (1,681,680) 5,717,250
Total $ 35,233,000 $ (8,008,000) $ 27,225,000
82

At June 30, 2015, the minimum future lease payments due under the direct financing capital lease agreements are as follows:
Fiscal Year Ending June 30
2016 $ 3,478,613 2017 3,490,613 2018 3,491,613 2019 3,496,862 2020 3,510,862
2021-2025 14,368,312 2026-2030 2,829,325
2031 566,800
Total minimum lease payments $ 35,233,000
3) Capital Lease Obligations
The County has entered into various lease agreements as lessee with the Montgomery County Revenue Authority (MCRA) for financing the construction or acquisition of certain County facilities. These lease agreements qualify as capital leases for accounting purposes and, therefore, have been recorded at the present value of their future minimum lease payments as of the inception dates of the leases.
The assets acquired and placed in service through MCRA capital leases are as follows:
Land $ 13,449,033 Land improvements 1,673,621 Buildings 53,783,181 Furniture, fixtures, equipment and machinery 159,291 Subtotal 69,065,126 Less accumulated depreciation (29,485,864)
Total asset value under capital leases $ 39,579,262
The leases have maturity dates ranging from April 15, 2017 to April 15, 2023. The County makes annual principal payments and semi-annual interest payments. The future minimum lease obligations and the net present value of these minimum lease payments as of June 30, 2015, are as follows:
Fiscal Year Ending June 30
2016 $ 2,904,450 2017 2,908,772 2018 2,512,988 2019 2,515,077 2020 991,834
2021-2023 2,970,224 Total minimum lease payments 14,803,345 Less: amount representing interest (985,435)
Present value of minimum lease payments $ 13,817,910
83

Included in the preceding schedules are amounts relating to the Montgomery County Conference Center, which was opened during FY05. The Maryland Stadium Authority (MSA) also participated in financing the construction through the issuance of long-term debt. The County recognized the MSA contribution of $19,719,328 as revenue when the Conference Center opened. The ownership of the Conference Center will transfer to the County at the end of the MCRA lease term. During FY13, the County entered into a new capital lease with MCRA related to the October 18, 2012 refunding of Montgomery County Revenue Authority Taxable Lease Revenue bonds issued for the construction of the Conference Center.
During FY14, the County entered into a new capital lease with MCRA related to the April 30, 2014 refunding of Montgomery County Revenue Authority Taxable Lease Revenue bonds issued for the Germantown Indoor Swim Center Project and the Human Services Headquarters Project.
(Rest of page intentionally left blank.)
84
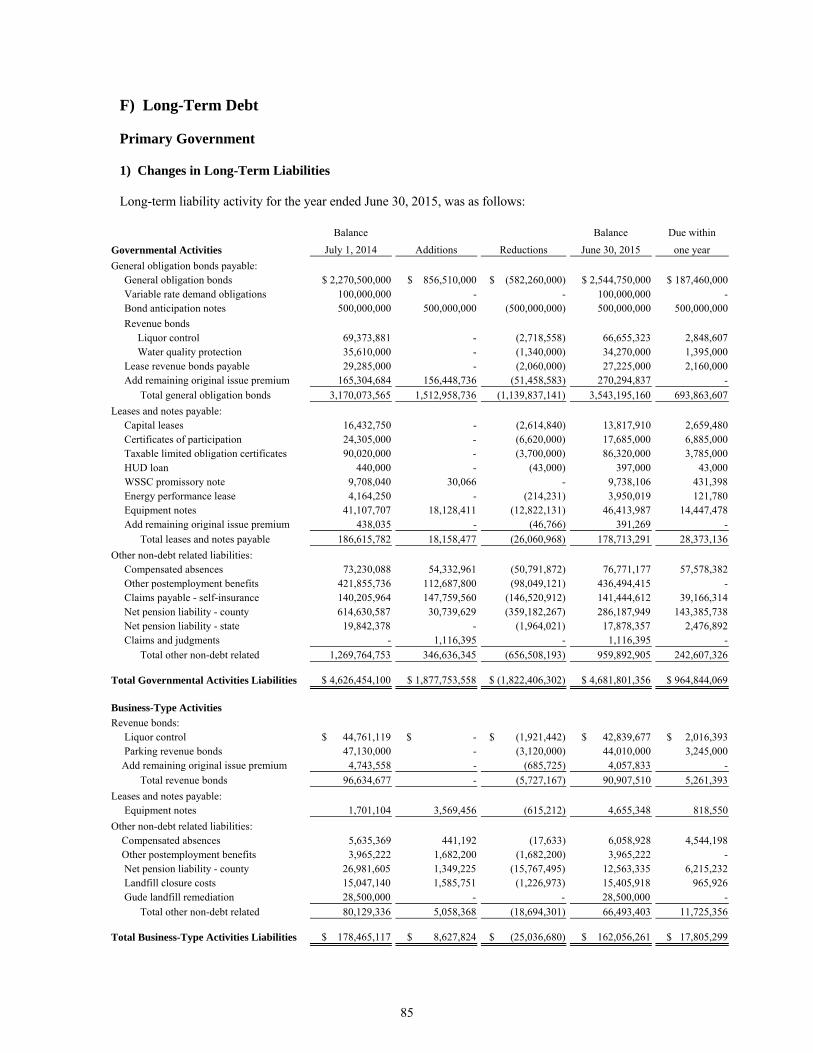
F) Long-Term Debt
Primary Government
1) Changes in Long-Term Liabilities
Long-term liability activity for the year ended June 30, 2015, was as follows:
Balance Balance Due within
Governmental Activities July 1, 2014 Additions Reductions June 30, 2015 one year
General obligation bonds payable: General obligation bonds $ 2,270,500,000 $ 856,510,000 $ (582,260,000) $ 2,544,750,000 $ 187,460,000 Variable rate demand obligations 100,000,000 - - 100,000,000 - Bond anticipation notes 500,000,000 500,000,000 (500,000,000) 500,000,000 500,000,000
Revenue bonds Liquor control 69,373,881 - (2,718,558) 66,655,323 2,848,607 Water quality protection 35,610,000 - (1,340,000) 34,270,000 1,395,000 Lease revenue bonds payable 29,285,000 - (2,060,000) 27,225,000 2,160,000 Add remaining original issue premium 165,304,684 156,448,736 (51,458,583) 270,294,837 -
Total general obligation bonds 3,170,073,565 1,512,958,736 (1,139,837,141) 3,543,195,160 693,863,607
Leases and notes payable: Capital leases 16,432,750 - (2,614,840) 13,817,910 2,659,480 Certificates of participation 24,305,000 - (6,620,000) 17,685,000 6,885,000 Taxable limited obligation certificates 90,020,000 - (3,700,000) 86,320,000 3,785,000 HUD loan 440,000 - (43,000) 397,000 43,000 WSSC promissory note 9,708,040 30,066 - 9,738,106 431,398 Energy performance lease 4,164,250 - (214,231) 3,950,019 121,780 Equipment notes 41,107,707 18,128,411 (12,822,131) 46,413,987 14,447,478 Add remaining original issue premium 438,035 - (46,766) 391,269 -
Total leases and notes payable 186,615,782 18,158,477 (26,060,968) 178,713,291 28,373,136
Other non-debt related liabilities: Compensated absences 73,230,088 54,332,961 (50,791,872) 76,771,177 57,578,382 Other postemployment benefits 421,855,736 112,687,800 (98,049,121) 436,494,415 - Claims payable - self-insurance 140,205,964 147,759,560 (146,520,912) 141,444,612 39,166,314 Net pension liability - county 614,630,587 30,739,629 (359,182,267) 286,187,949 143,385,738 Net pension liability - state 19,842,378 - (1,964,021) 17,878,357 2,476,892 Claims and judgments - 1,116,395 - 1,116,395 -
Total other non-debt related 1,269,764,753 346,636,345 (656,508,193) 959,892,905 242,607,326
Total Governmental Activities Liabilities $ 4,626,454,100 $ 1,877,753,558 $ (1,822,406,302) $ 4,681,801,356 $ 964,844,069
Business-Type Activities Revenue bonds: Liquor control $ 44,761,119 $ - $ (1,921,442) $ 42,839,677 $ 2,016,393 Parking revenue bonds 47,130,000 - (3,120,000) 44,010,000 3,245,000 Add remaining original issue premium 4,743,558 - (685,725) 4,057,833 -
Total revenue bonds 96,634,677 - (5,727,167) 90,907,510 5,261,393
Leases and notes payable: Equipment notes 1,701,104 3,569,456 (615,212) 4,655,348 818,550
Other non-debt related liabilities: Compensated absences 5,635,369 441,192 (17,633) 6,058,928 4,544,198 Other postemployment benefits 3,965,222 1,682,200 (1,682,200) 3,965,222 - Net pension liability - county 26,981,605 1,349,225 (15,767,495) 12,563,335 6,215,232 Landfill closure costs 15,047,140 1,585,751 (1,226,973) 15,405,918 965,926 Gude landfill remediation 28,500,000 - - 28,500,000 -
Total other non-debt related 80,129,336 5,058,368 (18,694,301) 66,493,403 11,725,356
Total Business-Type Activities Liabilities $ 178,465,117 $ 8,627,824 $ (25,036,680) $ 162,056,261 $ 17,805,299
85

Funding Source for Other Non-debt Related Liabilities
Long-term liabilities for internal service funds are included as part of the above totals for governmental activities. At year-end, $2,381,753 ($1,786,316 due within one year and $595,437 due in more than one year) of internal service fund compensated absences were included in the above amounts. Compensated absences liabilities of governmental activities are generally liquidated by the governmental funds that incurred the associated personnel cost.
Other post-employment benefit liabilities are liquidated with General Fund resources.
Claims and judgments are liquidated with resources from the General Fund or the fund to which the claim relates.
Landfill related obligations are liquidated from the Solid Waste activities funds.
Net pension liabilities are liquidated with General Fund resources.
2) General Obligation Bonds Payable
General obligation bonds are authorized, issued, and outstanding for the following purposes: (1) General County Facilities, (2) Roads and Storm Drainage, (3) Parks, (4) Public Schools, (5) Community College, (6) Consolidated Fire Tax District, (7) Mass Transit Facilities, (8) Public Housing Facilities, and (9) Parking Facilities. All bonds are valid and legally binding general obligations of the County, and constitute an irrevocable pledge of its full faith and credit and unlimited taxing power. Such bonds are payable from ad valorem taxes, unlimited as to rate or amount, on all real, tangible personal, and certain intangible property that is subject to taxation at full rates for local purposes in the County.
Proceeds from general obligation bonds for public schools and the community college are appropriated by the County Council to MCPS and MCC (component units), respectively, and remitted to such component units by the County. For GAAP purposes, proceeds from debt issuance for these purposes and any related expenditures incurred and reimbursed to the component units are reflected as other financing sources and expenditures, respectively, in the accompanying fund financial statements. These amounts are not budgeted by the County since this activity is appropriated for budget purposes to the component units. Any general obligation bond proceeds, not yet expended by the component units at year end, are reflected as Committed Fund Balance of the Capital Projects Fund.
The County issued $500,000,000 in new money general obligation bonds dated November 19, 2014; the County received a premium on the issue of $81,853,250. The County issued $297,990,000 in general refunding bonds dated November 19, 2014; the County received a premium on the issue of $65,004,548. The total net proceeds were used to advance refund $323,010,000 of general obligation (GO) refunding bonds that were previously issued. These bonds were issued with a true interest cost of 2.34%. The County also issued $58,520,000 in general refunding bonds dated March 26, 2015; the County received a premium on the issue of $9,590,938. The total net proceeds were used to advance refund $66,250,000 of general obligation (GO) refunding bonds that were previously issued. These bonds were issued with a true interest cost of 1.23%.
86

A detail listing of these refunded bonds is as follows:
Dated Original True
Interest Originally Years Amount Date Maturity Cost Issued Refunded Refunded
GO Bonds 08/15/04 2008-17 3.7208 $ 97,690,000 2015-17 $ 50,610,000 GO Bonds 06/01/05 2011-21 3.7817 120,355,000 2015, 2018-21 66,250,000 GO Bonds 05/01/07 2008-27 4.0821 250,000,000 2023-27 62,500,000 GO Bonds 07/15/08 2009-29 4.1809 250,000,000 2018-28 113,900,000 GO Bonds 08/11/11 2012-31 3.2268 320,000,000 2021-26 96,000,000
$ 1,038,045,000 $ 389,260,000
Net proceeds of the general obligation refunding bonds were used to purchase direct obligation, or obligations on which the timely payment of principal and interest is unconditionally guaranteed by the U.S government. These government obligations have been deposited in an irrevocable trust with an escrow agent to provide for all future debt service payments on the advance bond refundings of $323,010,000 and $58,520,000 which will mature in FY2016 and beyond. As a result, we consider the debt to be defeased and it has been removed from the financial statements.
The reacquisition price of the November 19, 2014 refunding exceeded the net carrying amount of the old debt by $26,290,209. The reacquisition price of the March 26, 2015 refunding exceeded the net carrying amount of the old debt by $843,637. These amounts are reported as deferred outflows of resources and amortized over the remaining life of the new debts.
The debt service savings from the November refunding is $22,829,600 as shown below. The present value of the debt service savings (or economic gain) on the refunding is $23,572,450.
Refunded Refunding Fiscal Debt Service Debt Service Debt Service Year Requirements Requirements Savings
2015 $ 7,621,825 $ 6,704,775 $ 917,050 2016 32,920,400 14,899,500 18,020,900 2017 32,042,738 28,183,875 3,858,863 2018 27,652,537 27,648,875 3,662 2019 13,639,250 13,636,750 2,500
2020-2024 179,942,125 179,930,625 11,500 2025-2029 162,737,500 162,722,375 15,125
Total $ 456,556,375 $ 433,726,775 $ 22,829,600
87

The debt service savings from the March refunding is $8,719,772 as shown below. The present value of the debt service savings (or economic gain) on the refunding is $8,696,987.
Refunded Refunding Fiscal Debt Service Debt Service Debt Service Year Requirements Requirements Savings
2016 $ 10,849,250 $ 2,129,478 $ 8,719,772 2017 2,926,000 2,926,000 - 2018 2,926,000 2,926,000 - 2019 23,444,875 23,444,875 -
2020-2022 39,926,125 39,926,125 -
Total $ 80,072,250 $ 71,352,478 $ 8,719,772
General obligation bond issues outstanding as of June 30, 2015, are as follows:
Dated Originally Balance Unamortized Carrying Value Date Maturity Interest Rate Issued June 30, 2015 Premium June 30, 2015
06/01/05* 2005-16 3.781 $ 120,355,000 $ 34,605,000 $ 1,845,870 $ 36,450,870 05/01/06 2006-17 3.871 100,000,000 10,000,000 82,760 10,082,760 05/01/07 2007-27 4.082 250,000,000 25,000,000 2,070,573 27,070,573 07/15/08 2009-29 3.000 - 5.000 250,000,000 61,100,000 2,108,554 63,208,554 11/03/09* 2011-20 2.000 - 5.000 161,755,000 108,325,000 6,518,164 114,843,164 11/03/09 2015-29 3.750 - 5.500 232,000,000 232,000,000 1,048,260 233,048,260 07/26/10 2011-22 2.000 - 5.000 195,000,000 130,000,000 9,709,858 139,709,858 07/26/10 2023-30 4.750 - 5.400 106,320,000 106,320,000 147,978 106,467,978 07/26/10 2023-30 4.750 - 5.400 23,680,000 23,680,000 32,958 23,712,958 08/11/11 2012-31 2.000 - 5.000 320,000,000 176,000,000 16,483,368 192,483,368 08/11/11* 2012-22 2.000 - 5.000 237,655,000 199,985,000 20,362,277 220,347,277 10/24/12 2013-32 2.500 - 5.000 295,000,000 265,500,000 24,381,651 289,881,651 10/24/12* 2013-16 2.500 - 5.000 23,360,000 10,560,000 327,049 10,887,049 11/26/13 2014-34 3.000 - 5.000 295,000,000 280,250,000 26,005,642 306,255,642 11/26/13* 2023-24 5.000 24,915,000 24,915,000 4,295,120 29,210,120 11/19/14 2015-35 4.000 - 5.000 500,000,000 500,000,000 76,658,361 576,658,361 11/19/14* 2016-28 5.000 297,990,000 297,990,000 60,272,217 358,262,217 03/26/15* 2018-21 5.000 58,520,000 58,520,000 8,053,191 66,573,191
Total $ 3,491,550,000 $ 2,544,750,000 $ 260,403,851 $ 2,805,153,851
* Issue represents refunding bonds.
88

Changes in general obligation bonds during FY15 are as follows:
Balance Bonds Bonds Bonds Balance July 1, 2014 Issued Retired Refunded June 30, 2015
Governmental Activities: General County $ 408,227,434 $ 161,252,560 $ 35,591,846 $ 48,368,082 $ 485,520,066 Roads and Storm Drainage 481,690,785 162,845,240 44,368,219 99,597,047 500,570,759 Parks 66,467,488 16,726,260 6,578,153 11,662,070 64,953,525 Public Schools 980,496,664 376,961,980 85,389,223 192,574,954 1,079,494,467 Community College 146,706,496 71,330,050 10,282,375 18,459,813 189,294,358 Consolidated Fire Tax District 59,754,809 13,191,160 5,377,992 7,642,386 59,925,591 Mass Transit 126,456,324 54,202,750 5,377,192 10,955,648 164,326,234
Public Housing 700,000 - 35,000 - 665,000
$ 2,270,500,000 $ 856,510,000 $ 193,000,000 $ 389,260,000 $ 2,544,750,000
General obligation bond debt service requirements to maturity are as follows:
Fiscal Year General Obligation Bond Requirements Ending June 30 Principal Interest Total
2016 $ 187,460,000 $ 114,542,250 $ 302,002,250 2017 193,025,000 105,857,911 298,882,911 2018 185,930,000 96,233,919 282,163,919 2019 180,230,000 87,187,134 267,417,134 2020 174,295,000 78,451,563 252,746,563
2021-2025 760,870,000 275,954,870 1,036,824,870 2026-2030 586,440,000 118,868,137 705,308,137 2031-2035 276,500,000 20,930,000 297,430,000
Total $ 2,544,750,000 $ 898,025,784 $ 3,442,775,784
Article 25A, Section 5(P), of the Annotated Code of Maryland, authorizes borrowing of funds and issuance of bonds to a maximum of six percent of the assessable base of real property and 15 percent of the assessable base of personal property and operating real property. The legal debt margin as of June 30, 2015 is $6,962,522,614.
Prior-Year Defeasance of Debt
In prior years, the County defeased certain general obligations and other bonds by placing the proceeds of new bonds in an irrevocable trust to provide for all future debt service payments on the old bonds. Accordingly, the trust account assets and the liability for the defeased bonds are not included in the County’s financial statements. At June 30, 2015, $386,611,125 of bonds outstanding are considered defeased.
89
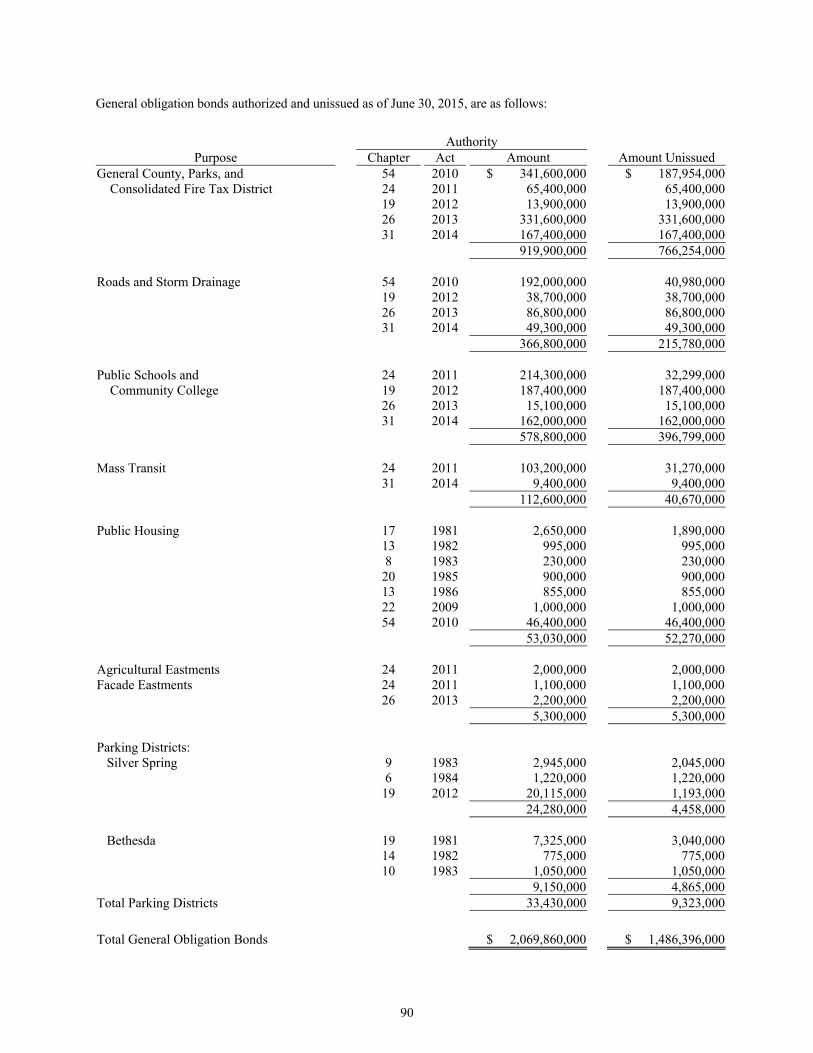
General obligation bonds authorized and unissued as of June 30, 2015, are as follows:
Authority Purpose Chapter Act Amount Amount Unissued
General County, Parks, and 54 2010 $ 341,600,000 $ 187,954,000 Consolidated Fire Tax District 24 2011 65,400,000 65,400,000
19 2012 13,900,000 13,900,000 26 2013 331,600,000 331,600,000 31 2014 167,400,000 167,400,000 919,900,000 766,254,000 Roads and Storm Drainage 54 2010 192,000,000 40,980,000 19 2012 38,700,000 38,700,000 26 2013 86,800,000 86,800,000 31 2014 49,300,000 49,300,000 366,800,000 215,780,000 Public Schools and 24 2011 214,300,000 32,299,000
Community College 19 2012 187,400,000 187,400,000 26 2013 15,100,000 15,100,000 31 2014 162,000,000 162,000,000 578,800,000 396,799,000 Mass Transit 24 2011 103,200,000 31,270,000 31 2014 9,400,000 9,400,000 112,600,000 40,670,000 Public Housing 17 1981 2,650,000 1,890,000 13 1982 995,000 995,000 8 1983 230,000 230,000 20 1985 900,000 900,000 13 1986 855,000 855,000 22 2009 1,000,000 1,000,000 54 2010 46,400,000 46,400,000 53,030,000 52,270,000 Agricultural Eastments 24 2011 2,000,000 2,000,000 Facade Eastments 24 2011 1,100,000 1,100,000 26 2013 2,200,000 2,200,000 5,300,000 5,300,000 Parking Districts: Silver Spring 9 1983 2,945,000 2,045,000 6 1984 1,220,000 1,220,000 19 2012 20,115,000 1,193,000 24,280,000 4,458,000 Bethesda 19 1981 7,325,000 3,040,000 14 1982 775,000 775,000 10 1983 1,050,000 1,050,000 9,150,000 4,865,000 Total Parking Districts 33,430,000 9,323,000
Total General Obligation Bonds $ 2,069,860,000 $ 1,486,396,000
90
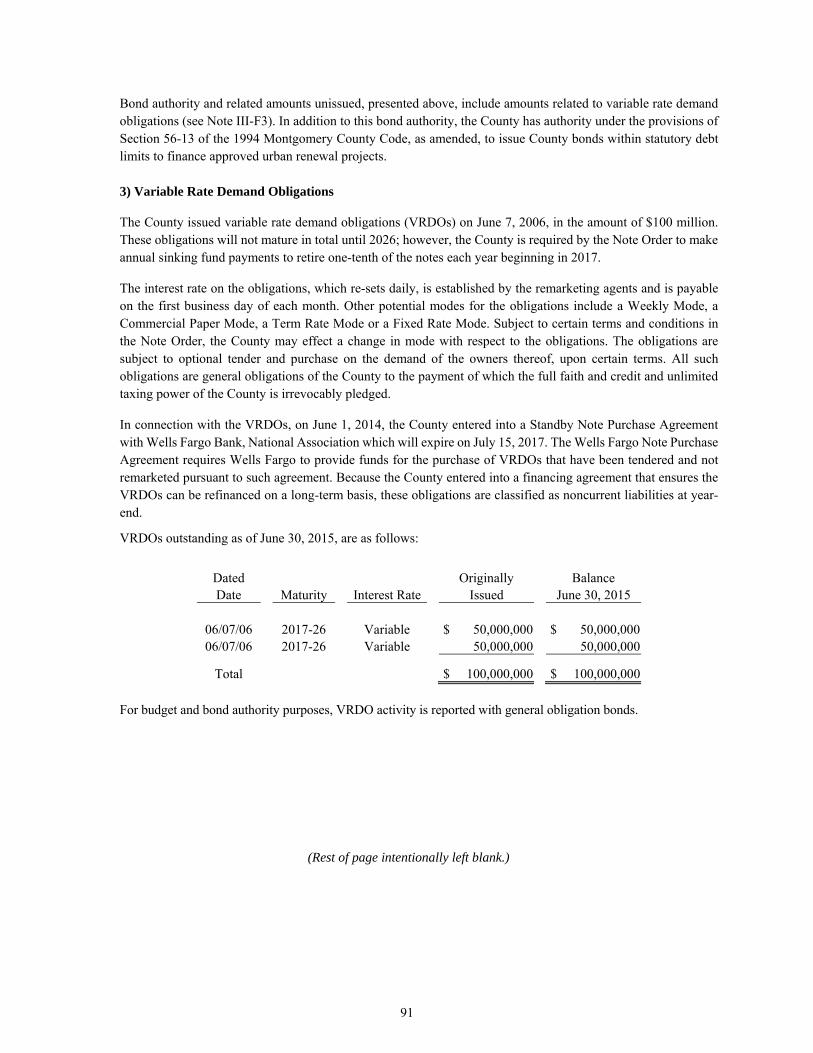
Bond authority and related amounts unissued, presented above, include amounts related to variable rate demand obligations (see Note III-F3). In addition to this bond authority, the County has authority under the provisions of Section 56-13 of the 1994 Montgomery County Code, as amended, to issue County bonds within statutory debt limits to finance approved urban renewal projects. 3) Variable Rate Demand Obligations
The County issued variable rate demand obligations (VRDOs) on June 7, 2006, in the amount of $100 million. These obligations will not mature in total until 2026; however, the County is required by the Note Order to make annual sinking fund payments to retire one-tenth of the notes each year beginning in 2017.
The interest rate on the obligations, which re-sets daily, is established by the remarketing agents and is payable on the first business day of each month. Other potential modes for the obligations include a Weekly Mode, a Commercial Paper Mode, a Term Rate Mode or a Fixed Rate Mode. Subject to certain terms and conditions in the Note Order, the County may effect a change in mode with respect to the obligations. The obligations are subject to optional tender and purchase on the demand of the owners thereof, upon certain terms. All such obligations are general obligations of the County to the payment of which the full faith and credit and unlimited taxing power of the County is irrevocably pledged.
In connection with the VRDOs, on June 1, 2014, the County entered into a Standby Note Purchase Agreement with Wells Fargo Bank, National Association which will expire on July 15, 2017. The Wells Fargo Note Purchase Agreement requires Wells Fargo to provide funds for the purchase of VRDOs that have been tendered and not remarketed pursuant to such agreement. Because the County entered into a financing agreement that ensures the VRDOs can be refinanced on a long-term basis, these obligations are classified as noncurrent liabilities at year-end.
VRDOs outstanding as of June 30, 2015, are as follows:
Dated Originally Balance Date Maturity Interest Rate Issued June 30, 2015
06/07/06 2017-26 Variable $ 50,000,000 $ 50,000,000 06/07/06 2017-26 Variable 50,000,000 50,000,000
Total $ 100,000,000 $ 100,000,000
For budget and bond authority purposes, VRDO activity is reported with general obligation bonds.
(Rest of page intentionally left blank.)
91

There was no change in VRDO balances during FY15. The VRDOs outstanding as of June 30, 2015 are as follows:
Balance June 30, 2015
Governmental Activities: General County $ 2,500,000 Roads and Storm Drainage 26,000,000 Parks 1,000,000 Public Schools 64,000,000 Community College 4,000,000 Consolidated Fire Tax District 2,100,000 Mass Transit 400,000
Total $ 100,000,000
VRDO requirements to maturity are as follows:
Fiscal Year Variable Rate Demand Obligation Requirements Ending June 30 Principal Interest* Total
2016 $ - $ 600,000 $ 600,000 2017 10,000,000 600,000 10,600,000 2018 10,000,000 540,000 10,540,000 2019 10,000,000 480,000 10,480,000 2020 10,000,000 420,000 10,420,000
2021-2025 50,000,000 1,200,000 51,200,000 2026 10,000,000 60,000 10,060,000
Total $ 100,000,000 $ 3,900,000 $ 103,900,000
* Includes interest on VRDOs at estimated rates of 0.600 percent for Series A and 0.600 percent for series B, respectively, for the June 7, 2006 issue. The interest rate on the notes is calculated daily and due monthly. The estimated rates used for this calculation were based on the proposed budget.
4) Revenue Bonds Payable
Revenue bonds are authorized, issued, and outstanding to finance specific projects such as parking garages for the Bethesda Parking Lot District, Department of Liquor Control facilities, and Water Quality stormwater management facilities. Net revenues of Bethesda Parking Lot District including parking fees, fines, dedicated property taxes, and Department of Liquor Control revenues are pledged against the timely repayment of principal and interest of the outstanding revenue bonds of the respective funds. Net revenues of the Water Quality Protection fund are pledged against the timely repayment of principal and interest of the outstanding revenue bonds of the respective funds.
92
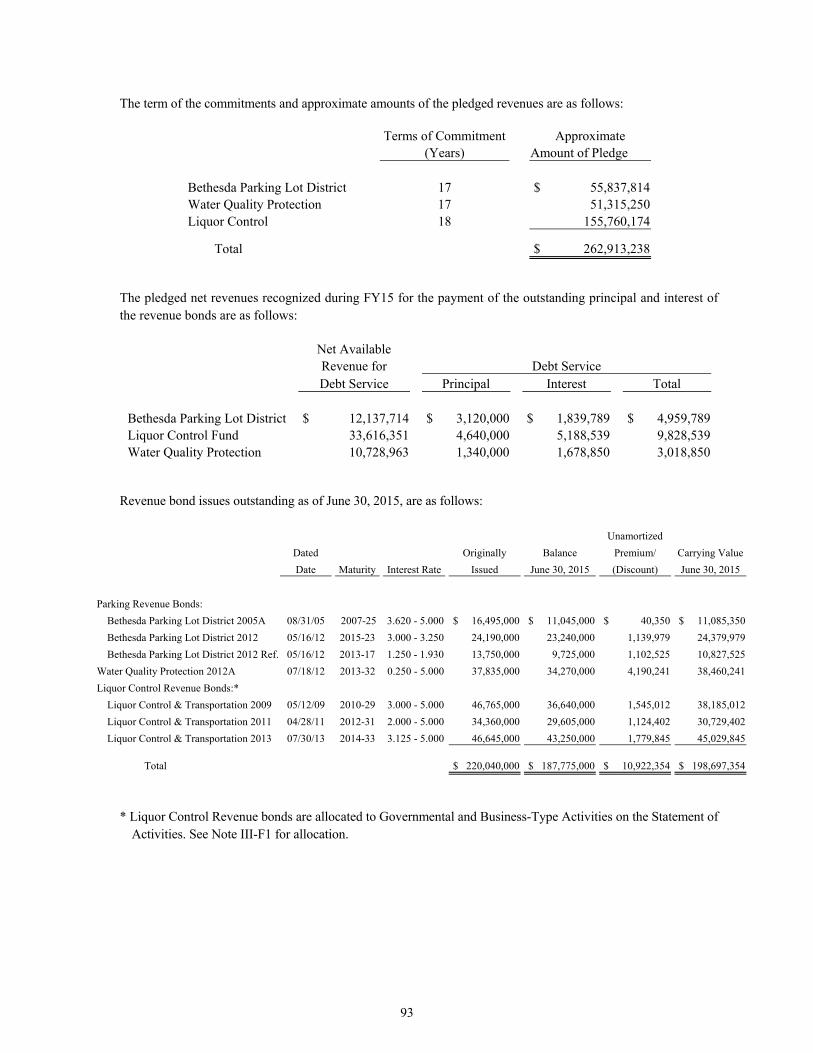
The term of the commitments and approximate amounts of the pledged revenues are as follows:
Terms of Commitment Approximate
(Years) Amount of Pledge Bethesda Parking Lot District 17 $ 55,837,814 Water Quality Protection 17 51,315,250 Liquor Control 18 155,760,174
Total $ 262,913,238
The pledged net revenues recognized during FY15 for the payment of the outstanding principal and interest of the revenue bonds are as follows:
Net Available Revenue for Debt Service
Debt Service Principal Interest Total
Bethesda Parking Lot District $ 12,137,714 $ 3,120,000 $ 1,839,789 $ 4,959,789 Liquor Control Fund 33,616,351 4,640,000 5,188,539 9,828,539 Water Quality Protection 10,728,963 1,340,000 1,678,850 3,018,850
Revenue bond issues outstanding as of June 30, 2015, are as follows:
Unamortized Dated Originally Balance Premium/ Carrying Value
Date Maturity Interest Rate Issued June 30, 2015 (Discount) June 30, 2015
Parking Revenue Bonds: Bethesda Parking Lot District 2005A 08/31/05 2007-25 3.620 - 5.000 $ 16,495,000 $ 11,045,000 $ 40,350 $ 11,085,350
Bethesda Parking Lot District 2012 05/16/12 2015-23 3.000 - 3.250 24,190,000 23,240,000 1,139,979 24,379,979
Bethesda Parking Lot District 2012 Ref. 05/16/12 2013-17 1.250 - 1.930 13,750,000 9,725,000 1,102,525 10,827,525
Water Quality Protection 2012A 07/18/12 2013-32 0.250 - 5.000 37,835,000 34,270,000 4,190,241 38,460,241
Liquor Control Revenue Bonds:* Liquor Control & Transportation 2009 05/12/09 2010-29 3.000 - 5.000 46,765,000 36,640,000 1,545,012 38,185,012
Liquor Control & Transportation 2011 04/28/11 2012-31 2.000 - 5.000 34,360,000 29,605,000 1,124,402 30,729,402
Liquor Control & Transportation 2013 07/30/13 2014-33 3.125 - 5.000 46,645,000 43,250,000 1,779,845 45,029,845
Total $ 220,040,000 $ 187,775,000 $ 10,922,354 $ 198,697,354
* Liquor Control Revenue bonds are allocated to Governmental and Business-Type Activities on the Statement of
Activities. See Note III-F1 for allocation.
93

Changes in revenue bond principal during FY15 are as follows:
Balance Bonds Bonds Balance July 1, 2014 Issued Retired June 30, 2015
Bethesda Parking Lot District $ 47,130,000 $ - $ 3,120,000 $ 44,010,000 Liquor Control* 114,135,000 - 4,640,000 109,495,000 Water Quality Protection 35,610,000 - 1,340,000 34,270,000
Total $ 196,875,000 $ - $ 9,100,000 $ 187,775,000
* Liquor Control Revenue bonds are allocated to Governmental and Business-Type Activities on the Statement
of Activities. See Note III-F1 for allocation.
Revenue bond debt service requirements to maturity are as follows:
Fiscal Year Bethesda Parking Lot District Liquor Control
Ending June 30 Principal Interest Principal Interest
2016 $ 3,245,000 $ 1,715,917 $ 4,865,000 $ 4,923,013 2017 3,375,000 1,588,008 5,060,000 4,716,076 2018 3,525,000 1,438,470 5,295,000 4,484,189 2019 3,695,000 1,270,220 5,520,000 4,258,989 2020 3,865,000 1,093,970 5,750,000 4,016,289
2021-2025 13,890,000 3,269,059 33,140,000 15,651,554 2026-2030 8,975,000 1,285,776 37,715,000 7,365,867 2031-2033 3,440,000 166,394 12,150,000 849,197
Total $ 44,010,000 $ 11,827,814 $ 109,495,000 $ 46,265,174
Fiscal Year Water Quality Protection Total Revenue Bond Requirements Ending June 30 Principal Interest Principal Interest Total
2016 $ 1,395,000 $ 1,625,250 $ 9,505,000 $ 8,264,180 $ 17,769,180 2017 1,435,000 1,583,400 9,870,000 7,887,484 17,757,484 2018 1,490,000 1,526,000 10,310,000 7,448,659 17,758,659 2019 1,550,000 1,466,400 10,765,000 6,995,609 17,760,609 2020 1,615,000 1,404,400 11,230,000 6,514,659 17,744,659
2021-2025 9,320,000 5,776,300 56,350,000 24,696,913 81,046,913 2026-2030 11,850,000 3,239,000 58,540,000 11,890,643 70,430,643 2031-2033 5,615,000 424,500 21,205,000 1,440,091 22,645,091
Total $ 34,270,000 $ 17,045,250 $ 187,775,000 $ 75,138,238 $ 262,913,238
94

Revenue bonds authorized and unissued as of June 30, 2015, are as follows:
Resolution Amount Amount Purpose Number Year Authorized Unissued
Parking Lot Districts 11-1383 1989 $ 51,163,000 $ 1,403,000 Parking Lot Districts 14-921 2001 35,000,000 9,000,000 Solid Waste Disposal 12-1010 1993 56,635,000 6,255,000 Public Housing 16-675 2008 50,000,000 50,000,000 Liquor & Transportation 16-863 2009 138,000,000 10,230,000 Parking Lot Districts 17-403 2012 46,000,000 46,000,000 Public Housing 17-227 2012 40,000,000 40,000,000 Water Quality Protection Bill 12-12 2012 95,000,000 57,165,000
Total $ 511,798,000 $ 220,053,000 Restricted assets classified as “Investments” or “Equity in Pooled Cash and Investments” for statement of net asset purposes, include the following: Bethesda Solid
Parking Waste Purpose Lot District Disposal
Operation and Maintenance Account - Available to pay current expenses $ 1,600,570 $ -Debt Service Account - Used to pay debt service on bonds 1,241,477 -Debt Service Reserve Account - (including accrued interest) - Available to pay debt service on bonds if there is insufficient money available 4,318,291 -Renewal and Renovation Account - Available for payment of renewals, replacements, renovations, and unusual and extraordinary repairs 1,500,000 3,717,626 Rate Covenant Cash Reserve - Available to fund operating activities for a minimum of three months - 26,352,979 Rate Stabilization Account - In case of short-term extraordinary expenses - 1,309,169
Total $ 8,660,338 $ 31,379,774 5) Bond Anticipation Notes Payable
Commercial paper bond anticipation notes (BANs) are authorized, issued, and outstanding as financing sources for capital construction and improvements. Changes in BANs during FY15 are as follows:
Balance Balance July 1, 2014 BANs Issued BANs Retired June 30, 2015
BAN Series 2009-A $ 100,000,000 $ 100,000,000 $ 100,000,000 $ 100,000,000 BAN Series 2009-B 100,000,000 100,000,000 100,000,000 100,000,000 BAN Series 2010-A 150,000,000 150,000,000 150,000,000 150,000,000 BAN Series 2010-B 150,000,000 150,000,000 150,000,000 150,000,000
Total $ 500,000,000 $ 500,000,000 $ 500,000,000 $ 500,000,000
Interest earned on BAN proceeds totaling $8,957 was accounted for in the Debt Service Fund. During FY15 interest rates varied from 0.1307 to 0.2452 percent.
95

BANs totaling $500 million were issued during FY15; $300 million Series 2010 and $200 million Series 2009 respectively. BANs are issued at varying maturities to a maximum of 270 days, under a program whose authority was adopted on September 15, 2009, as amended, to consolidate additional authority to borrow money and incur indebtedness. The County reissued the notes upon maturity and continues to do so, until they are replaced with long-term bonds. The County will issue long-term bonds in FY16, and intends to use a portion of the proceeds to replace short-term notes that were issued to fund capital construction and improvements.
In connection with the BANs, the County entered into three-year credit agreements with State Street Bank and PNC Bank to provide liquidity with respect to the 2010 Series BANs for $150,000,000 each. The agreements will expire on July 31, 2016. With respect to the 2009 Series BANs, the County has a credit agreement with JP Morgan Chase which expires on August 24, 2016. All credit agreements provide liquidity for the principal amount of the notes and approximately one month of interest. Any principal advances under the line of credit must be repaid in semi-annual installments over five years after the advance occurs. No amounts were advanced against this line of credit. Because the County entered into a financing agreement that ensures the BANs can be refinanced on a long-term basis, these BANs are classified as noncurrent liabilities at year-end.
During FY15, the County Council passed Resolution No. 17-1247 dated October 14, 2014 to increase the County’s authority to issue BANs by $388.1 million. Cumulative BANs authorized and unissued as of June 30, 2015, including amounts authorized and unissued from prior years, is $902,013,000.
6) Certificates of Participation
In April 2010, the County issued Certificates of Participation (certificates) for Equipment Acquisition in the public transportation Program dated April 7, 2010, in the amount of $23.0 million. In October 2007, the County issued certificates for its Equipment Acquisition in the fire and rescue Program dated October 24, 2007, in the amount of $33.58 million. The certificates represent proportionate interest in a Conditional Purchase Agreement (CPA) between the County, as purchaser and U.S. Bank National Association, as the seller. The CPA requires the County, as purchaser, to make periodic purchase installments in amounts sufficient to pay the scheduled debt service on the certificates until the County pays the entire price necessary to acquire the equipment, which shall be equal to the amount necessary to pay the principal and interest on all outstanding certificates. The ability of the County, as purchaser, to pay the purchase installments due under the CPA depends upon sufficient funds being appropriated each year by the County Council for such purpose. The County Council is under no obligation to make any appropriation with respect to the CPA. The CPA is not a general obligation of the County and does not constitute an indebtedness of the County within the meaning of any constitutional or statutory limitation or charge against the general credit or taxing powers of the County.
The Certificates were issued at interest rates ranging from 2.4 to 5.0 percent and have maturity schedules as follows:
Fiscal Year Certificates of Participation Ending June 30 Principal Interest Total
2016 $ 6,885,000 $ 500,000 $ 7,385,000 2017 7,155,000 289,100 7,444,100 2018 3,645,000 145,800 3,790,800
Total $ 17,685,000 $ 934,900 $ 18,619,900
96

7) Master Lease/Equipment Notes
The County has entered into a lease agreement in the amount of $22.6 million to finance the acquisition and implementation of new software systems – the County’s 311 constituent resource management system, ERP financial management system, and the MCtime – timecard management system. The lease agreement represents proportionate interests in a funding agreement between the County and Chase Equipment Finance, Inc.
The following is a schedule by fiscal year for the debt service requirement at June 30, 2015:
Fiscal Year Ending June 30
2016 $ 5,659,960 2017 3,844,415 2018 2,028,873 2019 1,014,437
Total minimum lease payments 12,547,685 Less: amount representing interest (523,891)
Present value of minimum lease payments $ 12,023,794
The County has entered into purchase agreements to provide financing for the acquisition of capital asset equipment such as Ride On buses, fire trucks, and ambulances. The agreements have terms of two to five years with interest rates identified in the agreements. Arrangements provide that proceeds are to be held by a trustee and disbursed to vendors. If assets are acquired prior to the note agreement, the trustee reimburses the County.
The following is a schedule by fiscal year for the agreements as of June 30, 2015:
Fiscal Year Equipment Notes Requirements Ending June 30 Principal Interest Total
2016 $ 2,200,115 $ 188,686 $ 2,388,801 2017 1,828,881 147,203 1,976,084 2018 1,795,256 110,792 1,906,048 2019 1,796,852 74,380 1,871,232 2020 1,645,094 38,431 1,683,525
2021-2022 703,596 13,312 716,908
Total $ 9,969,794 $ 572,804 $ 10,542,598
On July 7, 2011, the County issued a Master Lease Purchase Agreement to finance public safety system communication equipment. The following is a schedule by fiscal year for the agreement as of June 30, 2015:
Fiscal Year Safety Equipment Notes Requirements Ending June 30 Principal Interest Total
2016 $ 4,283,421 $ 90,118 $ 4,373,539 2017 2,168,626 18,144 2,186,770
Total $ 6,452,047 $ 108,262 $ 6,560,309
97

On January 31, 2014, the County issued Master Lease Purchase Agreement to finance Ride On buses. On December 30, 2014, the County issued a Master Lease Purchase Agreement to finance additional Ride On buses. The following is a schedule by fiscal year for the agreements as of June 30, 2015:
Fiscal Year Ride On Bus Requirements
Ending June 30 Principal Interest Total
2016 $ 3,430,863 $ 418,758 $ 3,849,622 2017 3,497,270 352,352 3,849,622 2018 3,564,963 284,658 3,849,622 2019 3,633,969 215,653 3,849,622 2020 3,704,311 145,311 3,849,622
2021-2022 4,792,324 83,084 4,875,409
Total $ 22,623,700 $ 1,499,816 $ 24,123,517
8) WSSC Promissory Note
In April 2007, the County entered into a Purchase and Sale Contract with Washington Suburban Sanitary Commission (WSSC) to acquire property for $10,000,000. On January 15, 2009, the County signed a promissory note evidencing its obligation to fulfill the terms of the Contract. The note has a term of 15 years; interest accrues at a rate of 4.43%, commencing six months after the execution of the promissory note. Under the provisions of the promissory note, the minimum annual payment by the County is $400,000 and is due on July 15 each year. The County must make additional payments equal to the net of proceeds of parcels sold in a given year; payments should be allocated first to interest then to principal. If in a given year, net proceeds for the sale of parcels equal or exceed the debt service payment, the County will not be required to make a separate debt service payment. The minimum annual loan payment is less than the interest accrued during the fiscal period; the difference between the interest and the debt service paid is added to the total principal amount owed. Consequently, a negative balance is shown on the principal column of the amortization schedule. However, the first debt service payment did not include interest expense, thereby, reducing the principal outstanding to $9,600,000.
The note will mature upon its 15th anniversary when all unpaid principal and accrued interest shall be due and payable by the County or upon the date of the “Payment Event” for the last parcel for which an additional annual payment is due to WSSC.
The following is a schedule by fiscal year for the debt service requirement at June 30, 2015:
Fiscal Year Promissory Note Requirements Ending June 30 Principal Interest Total
2016 $ (31,398) $ 431,398 $ 400,000 2017 (32,789) 432,789 400,000 2018 (34,242) 434,242 400,000 2019 (35,759) 435,759 400,000 2020 (37,343) 437,343 400,000
2021-2025 9,909,637 1,989,863 11,899,500
Total $ 9,738,106 $ 4,161,394 $ 13,899,500
98

9) Lease Revenue Bonds
In June 2002, the County issued Lease Revenue Bonds dated June 1, 2002, in the amount of $37.88 million for its Metrorail garage projects. These bonds were issued to finance the costs of the planning, design, construction, and placing into commercial operation, of garages at the Shady Grove and Grosvenor Metrorail Stations. The County has leased these metrorail garage projects to the Washington Metropolitan Area Transit Authority (WMATA).
The County issued $4,745,000 in lease revenue bonds (Metrorail Garage Projects) on September 1, 2004. The bonds were issued due to certain cost increases incurred since the issuance of the Series 2002 Bonds. The County needed an additional $2,100,000 to complete construction of the Shady Grove Metro Garage and an additional $2,110,000 to complete construction of the Grosvenor Metro Garage. The Series 2004 bonds were delivered on September 28, 2004. The lease has a term of 20 years ending on June 1, 2024.
On October 13, 2011, the County issued Series 2011 Bonds to finance a portion of the costs, and construction of the parking structure and related facilities at the Glenmont Metrorail Station within the County; and refunded the County’s outstanding Lease Revenue Bonds Series 2002 and Series 2004 Lease Revenue Bonds.
The bonds are payable from and secured by a pledge of revenues from WMATA’s lease payments and certain reserve funds. The approximate amount of the pledge is $35,233,000. WMATA’s obligation to make payments under the leases is payable solely from amounts held in a Surcharge Reserve Account which is funded by revenues from a surcharge on the parking facilities.
In the event that the County’s Reserve Subfund of $3,126,047, included in Debt Service Fund cash with fiscal agents in the accompanying financial statements, is less than the required amount, the County Executive is obligated to include, in the next subsequent appropriation request to the County Council, a request for sufficient resources to reimburse the Reserve Subfund. The Lease Revenue Bonds are not a debt of the County within the meaning of any constitutional, compact, charter or statutory debt limit or restriction. Neither the faith and credit nor the taxing power of the County is pledged to the payment of the bonds.
In FY15, pledged revenue of $3,481,613 equals the principal and interest on the lease revenue bonds.
Lease revenue bonds outstanding as of June 30, 2015, are as follows: Unamortized Carrying
Dated Interest Originally Balance Premium Value Date Maturity Rate Issued June 30, 2015 (Discount) June 30, 2015
Lease Revenue Bonds 10/13/11 2011-31 2.6687% $ 35,465,000 $ 27,225,000 $ 3,026,465 $ 30,251,465
Lease revenue bond debt service requirements to maturity are as follows:
Fiscal Year Lease Revenue Bond Requirements Ending June 30 Principal Interest Total
2016 $ 2,160,000 $ 1,318,613 $ 3,478,613 2017 2,280,000 1,210,613 3,490,613 2018 2,395,000 1,096,613 3,491,613 2019 2,520,000 976,862 3,496,862 2020 2,660,000 850,862 3,510,862
2021-2025 12,235,000 2,133,312 14,368,312 2026-2030 2,430,000 399,325 2,829,325
2031 545,000 21,800 566,800
Total $ 27,225,000 $ 8,008,000 $ 35,233,000
99

10) Taxable Limited Obligation Certificates
In April 2010, the County issued Taxable Limited Obligation Certificates, dated April 6, 2010, in the amount of $30.4 million to finance the Montgomery Housing Initiative Program to promote a broad range of housing opportunities in the County. The certificates represent proportionate interests in a Funding Agreement between the County and U.S. Bank National Association; the Certificates, and the interest on them, are limited obligations of the County. The principal or redemption price of and interest on the Certificates shall be payable solely from the Contract Payments and other funds pledged for the payment thereof under the Trust Agreement. The Funding Agreement is not a general obligation of the County and shall never constitute an indebtedness of the County within the meaning of any constitutional or statutory limitation or charge against the general credit or taxing power of the County. The Certificates were issued at interest rates ranging from 4.0 to 5.9 percent and will mature on May 1, 2030.
In August 2011, the County issued Taxable Limited Obligation Certificates in the amount of $28.8 million; the County issued the certificates to finance and promote a broad range of housing opportunities and a community and recreational facility. The Certificates were issued at interest rates ranging from 3.0 to 4.8 percent and will mature on May 1, 2031.
In November 2013, the County issued Taxable Limited Obligation Certificates in the amount of $38 million; the County issued the certificates to finance the Montgomery Housing Initiative program established by the County to promote a broad range of housing opportunities in the County. The Certificates were issued at interest rates ranging from 0.3 to 4.8 percent and will mature on November 1, 2033.
The following is a schedule by fiscal year for the debt service requirement at June 30, 2015:
Fiscal Year Taxable Limited Obligation Requirements Ending June 30 Principal Interest Total
2016 $ 3,785,000 $ 3,706,126 $ 7,491,126 2017 3,875,000 3,614,700 7,489,700 2018 3,995,000 3,501,862 7,496,862 2019 4,110,000 3,382,454 7,492,454 2020 4,255,000 3,241,114 7,496,114
2021-2025 23,980,000 13,480,791 37,460,791 2026-2030 30,050,000 7,417,862 37,467,862 2031-2034 12,270,000 1,100,231 13,370,231
Total $ 86,320,000 $ 39,445,140 $ 125,765,140
11) HUD Loan
During 2002, the County Council authorized the Department of Housing and Community Affairs (DHCA) to participate in the HUD Section 108 program for the purpose of acquiring twenty-one units at the Chelsea Tower which provides affordable housing for income qualified persons. On July 16, 2003, the County signed a loan agreement with HUD in the amount of $870,000. The County subsequently received approval from the County Council to disburse and re-loan these funds to HOC. HOC will repay the County, through the Housing Initiative Special Revenue Fund, the principal of $870,000 with interest thereon on a semi-annual basis at 4.59 percent over a twenty-year period, which is consistent with the HUD repayment terms. The principal amount payable at June 30, 2015, for this loan is $397,000 and will mature on August 1, 2023.
100

The following is a schedule by fiscal year for the debt service requirement at June 30, 2015:
Fiscal Year HUD Loan Requirements Ending June 30 Principal Interest Total
2016 $ 43,000 $ 20,480 $ 63,480 2017 43,000 18,274 61,274 2018 43,000 16,021 59,021 2019 43,000 13,727 56,727 2020 43,000 11,396 54,396
2021-2024 182,000 21,413 203,413
Total $ 397,000 $ 101,311 $ 498,311
12) Energy Performance Lease
In October 2013, the County entered into a lease agreement in the amount of $4.2 million to finance energy efficiency projects within the County.
The Lease has an interest rate of 5.17 percent and will mature on July 1, 2033. The following is a schedule by fiscal year for the debt service requirement at June 30, 2015:
Fiscal Year Energy Performance Lease Ending June 30 Principal Interest Total
2016 $ 121,780 $ 202,648 $ 324,428 2017 129,074 196,258 325,332 2018 136,639 189,487 326,126 2019 144,479 182,322 326,801 2020 146,462 174,826 321,288
2021-2025 908,267 748,287 1,656,554 2026-2030 1,214,309 474,340 1,688,649 2031-2034 1,149,009 133,147 1,282,156
Total $ 3,950,019 $ 2,301,315 $ 6,251,334
13) Conduit Debt Obligations
Conduit debt obligations refer to certain limited-obligation revenue bonds or similar debt instruments issued by the County for the purpose of providing capital financing for a third party that is not part of the County’s reporting entity (see Note I-A). From time to time, the County issued Industrial Revenue Bonds and Economic Development Revenue Bonds for the purposes of financing or refinancing costs of acquiring and/or renovating facilities for third party facility users. Facility users may be individuals, public or private corporations, or other entities. The bonds are sometimes secured by the facilities financed or by a financial institution and are payable from the revenues or monies to be received by the County under loan agreements with the facility users and from other monies made available to the County for such purpose. The bonds do not constitute a debt or charge against the general credit or taxing powers of the County, the State, or any political subdivision thereof. Accordingly, the bonds are not reported as liabilities in the accompanying financial statements.
As of June 30, 2015, there were 28 issues of Industrial Revenue Bonds and Economic Development Revenue Bonds outstanding. Of these, 8 were issued prior to July 1, 1996. The aggregate principal amount payable at June
101
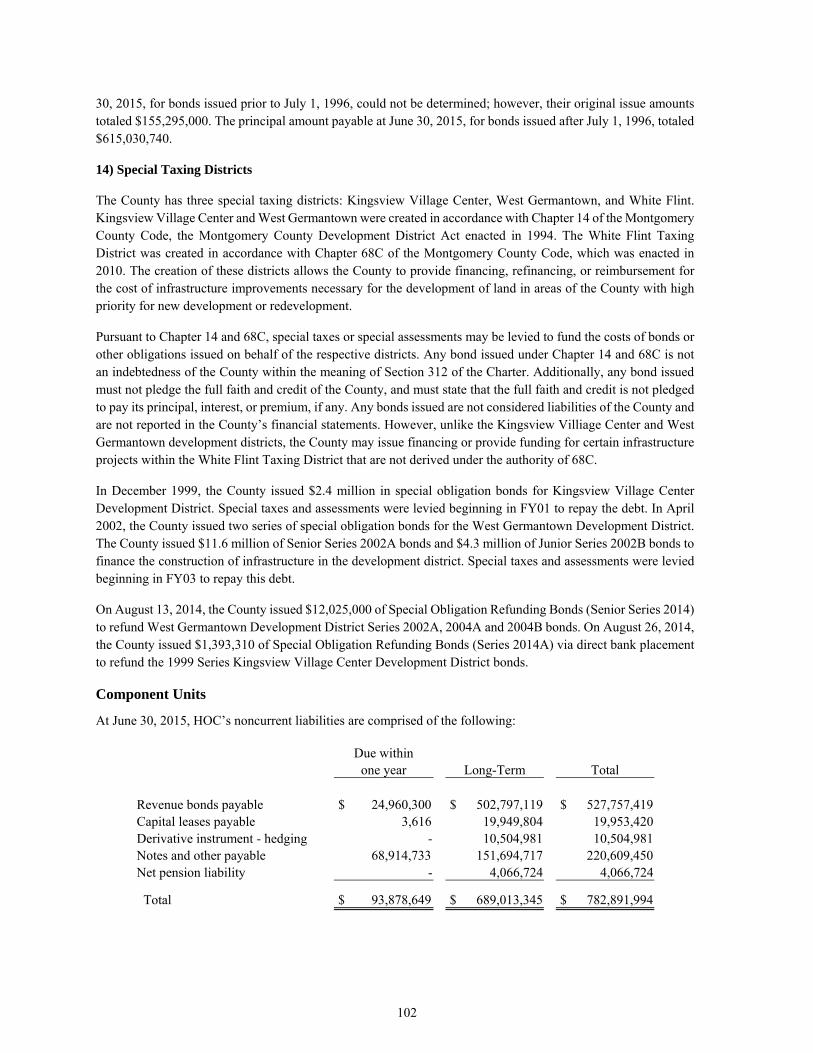
30, 2015, for bonds issued prior to July 1, 1996, could not be determined; however, their original issue amounts totaled $155,295,000. The principal amount payable at June 30, 2015, for bonds issued after July 1, 1996, totaled $615,030,740.
14) Special Taxing Districts
The County has three special taxing districts: Kingsview Village Center, West Germantown, and White Flint. Kingsview Village Center and West Germantown were created in accordance with Chapter 14 of the Montgomery County Code, the Montgomery County Development District Act enacted in 1994. The White Flint Taxing District was created in accordance with Chapter 68C of the Montgomery County Code, which was enacted in 2010. The creation of these districts allows the County to provide financing, refinancing, or reimbursement for the cost of infrastructure improvements necessary for the development of land in areas of the County with high priority for new development or redevelopment.
Pursuant to Chapter 14 and 68C, special taxes or special assessments may be levied to fund the costs of bonds or other obligations issued on behalf of the respective districts. Any bond issued under Chapter 14 and 68C is not an indebtedness of the County within the meaning of Section 312 of the Charter. Additionally, any bond issued must not pledge the full faith and credit of the County, and must state that the full faith and credit is not pledged to pay its principal, interest, or premium, if any. Any bonds issued are not considered liabilities of the County and are not reported in the County’s financial statements. However, unlike the Kingsview Villiage Center and West Germantown development districts, the County may issue financing or provide funding for certain infrastructure projects within the White Flint Taxing District that are not derived under the authority of 68C.
In December 1999, the County issued $2.4 million in special obligation bonds for Kingsview Village Center Development District. Special taxes and assessments were levied beginning in FY01 to repay the debt. In April 2002, the County issued two series of special obligation bonds for the West Germantown Development District. The County issued $11.6 million of Senior Series 2002A bonds and $4.3 million of Junior Series 2002B bonds to finance the construction of infrastructure in the development district. Special taxes and assessments were levied beginning in FY03 to repay this debt.
On August 13, 2014, the County issued $12,025,000 of Special Obligation Refunding Bonds (Senior Series 2014) to refund West Germantown Development District Series 2002A, 2004A and 2004B bonds. On August 26, 2014, the County issued $1,393,310 of Special Obligation Refunding Bonds (Series 2014A) via direct bank placement to refund the 1999 Series Kingsview Village Center Development District bonds.
Component Units
At June 30, 2015, HOC’s noncurrent liabilities are comprised of the following:
Due within one year Long-Term Total
Revenue bonds payable $ 24,960,300 $ 502,797,119 $ 527,757,419 Capital leases payable 3,616 19,949,804 19,953,420 Derivative instrument - hedging - 10,504,981 10,504,981 Notes and other payable 68,914,733 151,694,717 220,609,450 Net pension liability - 4,066,724 4,066,724
Total $ 93,878,649 $ 689,013,345 $ 782,891,994
102

HOC revenue bonds, which are significant in relation to the total component unit long-term debt, are outstanding as follows:
Purpose
Multi-Family Mortgage Purchase Program Fund $ 290,891,798 Single Family Mortgage Purchase Program Fund 236,865,621
Total $ 527,757,419
Interest rates on the HOC Multi-Family and Single Family Mortgage Purchase Program Fund bonds ranged from 0.60 to 11.25 percent and 0.625 to 5.75 percent, respectively, as of June 30, 2015.
Pursuant to Section 15 of Article 44A of the Annotated Code of Maryland, the County may, by local law, provide its full faith and credit as guarantee of bonds issued by HOC in principal amount not exceeding $50,000,000. Section 20-32 of the Montgomery County Code provides the method by which the County has implemented the guarantee.
The debt service requirements by fiscal year for the HOC debt guaranteed by the Primary Government are as follows:
Fiscal Year Guaranteed Revenue Bond Requirements Ending June 30 Principal Interest Total
2016 $ 425,000 $ 407,590 $ 832,590 2017 445,000 385,840 830,840 2018 465,000 363,090 828,090 2019 490,000 339,215 829,215 2020 515,000 314,090 829,090
2021-2025 2,990,000 1,144,700 4,134,700 2026-2030 2,980,000 310,323 3,290,323
Total $ 8,310,000 $ 3,264,848 $ 11,574,848 The total debt service requirements for HOC revenue bonds, which include the portion guaranteed by the Primary Government (presented above), are as follows:
Fiscal Year Total Revenue Bond Requirements Ending June 30 Principal Interest Total
2016 $ 24,960,300 $ 15,219,968 $ 40,180,268 2017 21,547,645 14,650,715 36,198,360 2018 22,290,266 14,001,897 36,292,163 2019 18,388,191 13,539,461 31,927,652 2020 19,001,450 12,995,363 31,996,813
2021-2025 100,040,995 55,403,215 155,444,210 2026-2030 98,801,659 39,194,516 137,996,175 2031-2035 89,895,000 21,816,397 111,711,397 2036-2040 90,665,000 9,104,243 99,769,243 2041-2045 30,935,000 2,306,538 33,241,538 2046-2050 9,400,000 79,170 9,479,170
Unamortized Bond Discount 1,831,913 - 1,831,913
Total $ 527,757,419 $ 198,311,483 $ 726,068,902
103
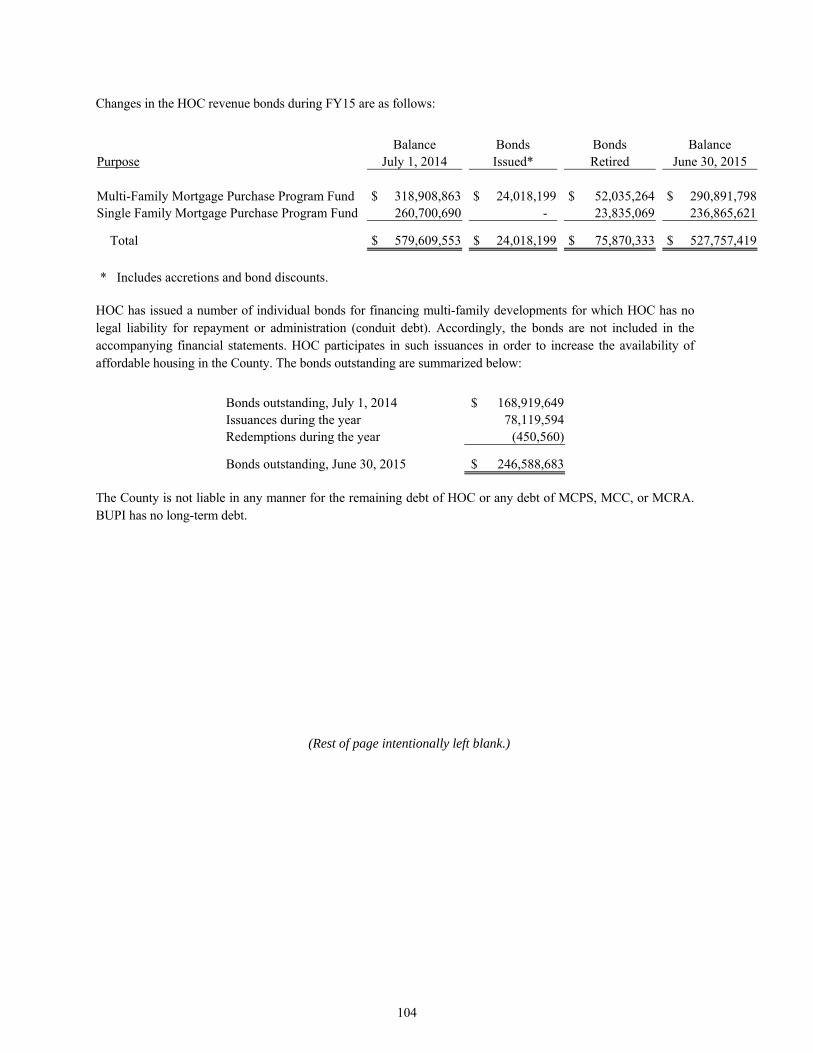
Changes in the HOC revenue bonds during FY15 are as follows:
Balance Bonds Bonds Balance Purpose July 1, 2014 Issued* Retired June 30, 2015
Multi-Family Mortgage Purchase Program Fund $ 318,908,863 $ 24,018,199 $ 52,035,264 $ 290,891,798 Single Family Mortgage Purchase Program Fund 260,700,690 - 23,835,069 236,865,621
Total $ 579,609,553 $ 24,018,199 $ 75,870,333 $ 527,757,419
* Includes accretions and bond discounts. HOC has issued a number of individual bonds for financing multi-family developments for which HOC has no legal liability for repayment or administration (conduit debt). Accordingly, the bonds are not included in the accompanying financial statements. HOC participates in such issuances in order to increase the availability of affordable housing in the County. The bonds outstanding are summarized below:
Bonds outstanding, July 1, 2014 $ 168,919,649 Issuances during the year 78,119,594 Redemptions during the year (450,560)
Bonds outstanding, June 30, 2015 $ 246,588,683
The County is not liable in any manner for the remaining debt of HOC or any debt of MCPS, MCC, or MCRA. BUPI has no long-term debt.
(Rest of page intentionally left blank.)
104
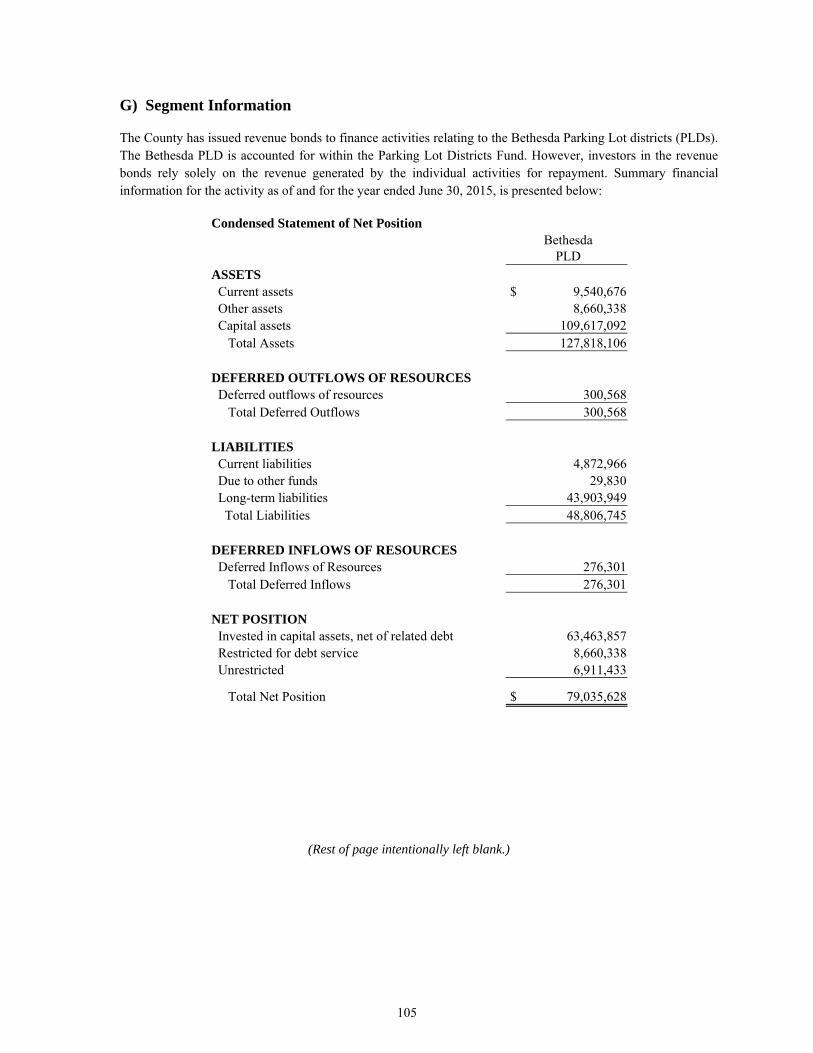
G) Segment Information
The County has issued revenue bonds to finance activities relating to the Bethesda Parking Lot districts (PLDs). The Bethesda PLD is accounted for within the Parking Lot Districts Fund. However, investors in the revenue bonds rely solely on the revenue generated by the individual activities for repayment. Summary financial information for the activity as of and for the year ended June 30, 2015, is presented below:
Condensed Statement of Net Position Bethesda
PLD
ASSETS Current assets $ 9,540,676 Other assets 8,660,338 Capital assets 109,617,092 Total Assets 127,818,106
DEFERRED OUTFLOWS OF RESOURCES Deferred outflows of resources 300,568 Total Deferred Outflows 300,568
LIABILITIES Current liabilities 4,872,966 Due to other funds 29,830 Long-term liabilities 43,903,949 Total Liabilities 48,806,745
DEFERRED INFLOWS OF RESOURCES Deferred Inflows of Resources 276,301 Total Deferred Inflows 276,301
NET POSITION Invested in capital assets, net of related debt 63,463,857 Restricted for debt service 8,660,338 Unrestricted 6,911,433
Total Net Position $ 79,035,628
(Rest of page intentionally left blank.)
105

Condensed Statement of Revenues, Expenses, and Changes in Fund Net Position Bethesda PLD OPERATING REVENUES (EXPENSES): Operating Revenues: Charges for services $ 14,144,307 Licenses and permits 1,106 Fines and penalties 4,261,637 Total Operating Revenues (pledged against bonds) 18,407,050 Depreciation 5,359,678 Other operating expenses 11,033,296 Operating Income (Loss) 2,014,076 NONOPERATING REVENUES (EXPENSES): Property taxes 2,746,026 Investment income 15,243 Interest expense (1,375,988) Other revenue 667,359 Transfers in 1,500,000 Transfers out (7,539,300) Change in Net Position (1,972,584) Beginning Net Position, as restated 81,008,212
Ending Net Position $ 79,035,628
Condensed Statement of Cash Flows Bethesda PLD
Net Cash Provided (Used) By: Operating activities $ 7,667,943 Noncapital financing activities (3,293,274) Capital and related financing activities (16,607,902) Investing activities 12,382 Net Increase (Decrease) (12,220,851) Beginning Cash and Cash Equivalents 25,665,114
Ending Cash and Cash Equivalents $ 13,444,263
106
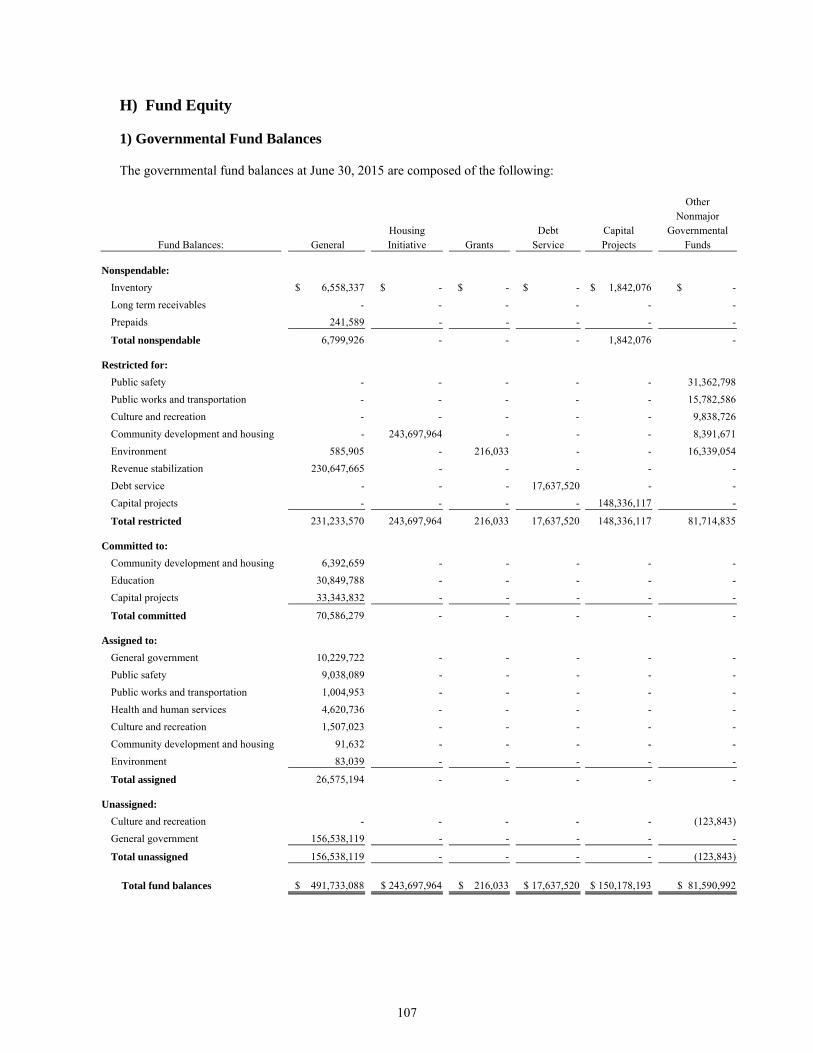
H) Fund Equity
1) Governmental Fund Balances
The governmental fund balances at June 30, 2015 are composed of the following:
Other Nonmajor Housing Debt Capital Governmental
Fund Balances: General Initiative Grants Service Projects Funds
Nonspendable: Inventory $ 6,558,337 $ - $ - $ - $ 1,842,076 $ -
Long term receivables - - - - - -
Prepaids 241,589 - - - - -
Total nonspendable 6,799,926 - - - 1,842,076 -
Restricted for: Public safety - - - - - 31,362,798
Public works and transportation - - - - - 15,782,586
Culture and recreation - - - - - 9,838,726
Community development and housing - 243,697,964 - - - 8,391,671
Environment 585,905 - 216,033 - - 16,339,054
Revenue stabilization 230,647,665 - - - - -
Debt service - - - 17,637,520 - -
Capital projects - - - - 148,336,117 -
Total restricted 231,233,570 243,697,964 216,033 17,637,520 148,336,117 81,714,835
Committed to: Community development and housing 6,392,659 - - - - -
Education 30,849,788 - - - - -
Capital projects 33,343,832 - - - - -
Total committed 70,586,279 - - - - -
Assigned to: General government 10,229,722 - - - - -
Public safety 9,038,089 - - - - -
Public works and transportation 1,004,953 - - - - -
Health and human services 4,620,736 - - - - -
Culture and recreation 1,507,023 - - - - -
Community development and housing 91,632 - - - - -
Environment 83,039 - - - - -
Total assigned 26,575,194 - - - - -
Unassigned: Culture and recreation - - - - - (123,843)
General government 156,538,119 - - - - -
Total unassigned 156,538,119 - - - - (123,843)
Total fund balances $ 491,733,088 $ 243,697,964 $ 216,033 $ 17,637,520 $ 150,178,193 $ 81,590,992
107

2) Encumbrances
Encumbrance accounting is employed as part of the budgetary integration for all governmental funds. As of June 30, 2015, certain amounts which were available for specific purposes have been encumbered in the governmental funds. Encumbrances are included in the County’s governmental fund balances as follows:
Fund Balance Governmental Fund Amount Classification
General Fund $ 26,575,194 Assigned Housing Initiative 528,068 Restricted Non-major Governmental Funds 17,864,510 Restricted
Total Governmental Funds $ 44,967,772
The fund balances of the following governmental funds do not include encumbrances:
Encumbrances not Governmental Fund included in Fund Balance
Grants $ 4,659,531 Debt Service 468,470 Capital Projects 424,539,966
Total Governmental Funds $ 429,667,967
3) Net Position Restricted by Enabling Legislation
Net position restricted by enabling legislation represent legislative restrictions that a party external to the government can compel the government to honor. For the County, such amounts represent primarily accumulated net position attributed to revenue streams, such as taxes or fees, which are restricted for specified purposes in the County Code. This generally includes Capital Project Fund recordation and impact tax collections on hand for a component unit and municipal governments, ending fund balances of substantially all special revenue funds, and ending unrestricted net position of the Solid Waste Activities and Parking Lot Districts enterprise funds. Such amounts, which are included with restricted net position in the government-wide Statement of Net Position, are as follows at year-end:
Governmental activities $ 492,271,947 Business-type activities 39,725,780
Total $ 531,997,727
108

I) Significant Transactions with Discretely Presented Component Units
1) Operating and Capital Funding
Expenditures incurred for operating and capital funding of discretely presented component units amounted to the following for the year ended June 30, 2015:
General Fund Capital Operating Capital * Total Projects Total
MCPS $ 1,478,450,933 $ 8,953,638 $ 1,487,404,571 $ 175,293,003 $ 1,662,697,574 MCC 118,813,727 9,086,748 127,900,475 35,519,240 163,419,715 HOC 7,360,143 - 7,360,143 - 7,360,143
Total $ 1,604,624,803 $ 18,040,386 $ 1,622,665,189 $ 210,812,243 $ 1,833,477,432
* Represents current receipt and pay-go funding transferred from the General Fund for component units' use towards their capital projects.
For GAAP financial statement reporting purposes, General Fund expenditures incurred for funding of MCPS and MCC are classified as education expenditures; HOC funding is classified under community development and housing.
2) Other Transactions
BUPI charges for services revenue includes $4,387,103 earned under contracts with the County. For capital leases with MCRA, see Note III-E3. For mortgages receivable due from HOC, see Note III-B2.
(Rest of page intentionally left blank.)
109
NOTE IV. OTHER INFORMATION
A) Risk Management
The County, for itself and certain component units and other governments, maintains two self-insurance internal service funds. County management believes it is more economical to manage its risks internally and set aside assets for claim settlements in these internal service funds.
One fund is maintained for Liability and Property Coverage under which participants share the costs of workers' compensation, comprehensive general, automobile and professional liability (errors and omissions), property coverage including fire and theft, and other selected areas which require coverage. Commercial insurance is purchased for claims in excess of coverage provided by the self-insurance fund and for other risks not covered by the fund. In addition to all funds of the County, participants in this program include MCPS, HOC, MCC, MCRA, BUPI, M-NCPPC, the independent fire/rescue corporations, the Bethesda-Chevy Chase Rescue Squad, the Rockville Housing Enterprises, the Town of Somerset, the City of Gaithersburg, the Village of Drummond, Chevy Chase Village, and the Village of Friendship Heights. The liability for claims with respect to all participants transfers to the self-insurance fund, except for M-NCPPC which retains ultimate liability for its own claims.
The second fund is maintained for Employee Health Benefits under which participants share medical, prescription, dental, vision, and life insurance. While the majority of coverage is self-insured, certain fully insured plan options, including health maintenance organizations (HMO’s), are offered to participants. WSTC, BUPI, Montgomery Community Television, the Strathmore Hall Foundation, Inc., Arts and Humanities Council of Montgomery County, Montgomery County Volunteer Fire & Rescue Association, and certain employees of the State of Maryland in addition to some of the participants in the Liability and Property Coverage Program, participate in this program.
Both internal service funds use the accrual basis of accounting. Payments to the Liability and Property Coverage Self-Insurance Fund by participants and recognition of the fund's liability for unpaid claims including those incurred but not reported are based on actuarial estimates. For the Employee Health Benefits Fund, charges to participants are based on actuarial estimates. Liabilities are reported when it is probable that a loss has occurred and the amount of that loss can be reasonably estimated. Liabilities include an amount for claims that have been incurred but not reported which incorporate incremental claims adjustment expenses incurred only because of the claim, but do not include non-incremental claims adjustment expenses such as internal salary costs. Because actual claims liabilities depend on complex factors such as inflation, changes in legal doctrines, and damage awards, the process used in computing claims liability does not necessarily result in an exact amount. Claims liabilities are reevaluated periodically to take into consideration recently settled claims, the frequency of claims, and other economic and social factors. During the year, there were no significant reductions in commercial insurance coverage in the Liability and Property Coverage Self-Insurance Fund from the prior year. For the past three years, no insurance settlements exceeded commercial insurance coverage in either fund.
(Rest of page intentionally left blank.)
110

Changes in the balances of Claims Payable for the self-insurance funds for FY15 and FY14 are as follows:
Liability and Property Employee Health Coverage Benefits Total
Balance July 1, 2013 $ 127,051,728 $ 14,661,904 $ 141,713,632 Claims and changes in estimates 39,493,342 98,351,337 137,844,679 Claim payments 1 (38,584,144) (100,768,203) (139,352,347)Balance June 30, 2014 127,960,926 12,245,038 140,205,964 Claims and changes in estimates 37,905,495 109,854,065 147,759,560 Claim payments 1 (37,723,921) (108,796,991) (146,520,912)
Balance June 30, 2015 2 $ 128,142,500 $ 13,302,112 $ 141,444,612
1 Includes non-monetary settlements. 2 Includes incurred but not reported (IBNR) claims of $63,525,144 and $13,302,112 for the Liability and Property
Coverage and the Employee Health Benefits Self-Insurance Funds, respectively.
B) Significant Commitments and Contingencies
1) Landfill
The County, in its effort to provide for estimated landfill capping and postclosure maintenance costs, accrues such costs and recognizes those costs as expenses as the landfill is utilized. The October 9, 1991 U.S. Environmental Protection Agency (EPA) rule, “Solid Waste Disposal Criteria,” established closure requirements for all municipal solid waste landfills (MSWLFs) that receive waste after October 9, 1991. The County has been accruing closure expenses since FY91 in an attempt to match the costs of closure against the revenues associated with the use of the landfill. The Oaks Landfill closed on October 22, 1997, and the County began using out-of-County waste hauling during FY98. At the time the landfill was closed, total cumulative capacity used was 6,990,437 tons. The total closure and postclosure costs are estimated at $64,168,663, which have been fully accrued through June 30, 2015. Of the total amount accrued, $47,535,772 in actual costs have been paid out in prior years, and $1,226,973 was paid in FY15, resulting in a net liability of $15,405,918 at June 30, 2015. The current and non-current portions of the adjusted liability at year-end are estimated at $965,926 and $14,439,992 respectively. These costs are subject to change based on cost differences, changes in technology, or applications of laws and regulations. The County plans to use primarily operating cash to pay for these closure and postclosure costs as they are incurred in the future.
2) Pollution Remediation
In FY09, the County identified the Gude Landfill as requiring pollution remediation or additional post-closure costs due to ground water and surface contamination. The landfill was used for the disposal of County municipal solid waste from 1965 to 1982. It received approximately 4.8 million tons of municipal waste from 1965 until the site was closed in 1982. The estimated remediation liability recorded as of FY15 is $28.5 million. The amount is based on the expected cash flow technique, which measures the liability as the sum of the probability-weighted amounts. In this case there is a 50% probability (based on the engineer’s assessment) that the total estimated remediation cost is $57 million. The County will be submitting an updated plan in February 2016 to the Maryland Department of Environment (MDE). Based on their review, the liability may increase. This liability is also subject to change based on cost differences, changes in technology, or applications of laws and regulations. There are no expected recoveries to reduce the liability.
111

3) Litigation
In addition to those suits in which claims for liability are adequately covered by insurance, the County may be a defendant in various suits involving tort claims, violations of civil rights, breach of contract, inverse condemnation, and other suits arising in the normal course of business. In the opinion of the County Attorney, the estimated liability of the County in the resolution of these cases will not exceed $4,330,140. In accordance with generally accepted accounting principles, $1,116,395 of this amount has been reflected as a liability in the accompanying financial statements, as the County’s liability on these claims is determined to be probable. The remaining $3,213,745 has not been reflected as a liability in the accompanying financial statements, as the County’s liability on these claims is determined to be reasonably possible.
4) Grants, Entitlements, and Shared Revenues
The County participates in a number of Federal and State assisted grant, entitlement, and/or reimbursement programs, principal of which are the Community Development Block Grant, the Head Start Grant, Community Mental Health Grant, and the Medical Assistance Grant. These programs are subject to financial and compliance audits by the grantors or their representatives. The audits of most of these programs for, or including, the year-ended June 30, 2015, have not yet been completed. In accordance with the provisions of the Single Audit Act of 1984 and Circular A-133, issued by the U.S. Office of Management and Budget, the County participates in single audits of federally assisted programs. The amount of expenditures which may be disallowed by the granting agencies cannot be determined at this time, although management does not believe amounts ultimately disallowed, if any, would be material.
5) Other Commitments
County proprietary funds have entered into contract commitments that remain uncompleted as of year-end. The amounts of outstanding commitments at June 30, 2015, are as follows:
Enterprise Funds: Operating Capital Inventory Total Major Funds: Liquor $ 399,060 $ - $ - $ 399,060 Solid Waste Activities: Disposal operations 6,816,420 - - 6,816,420 Collection operations 163,901 - - 163,901 Leafing operations 250,739 - - 250,739 Parking Lot Districts: Silver Spring 397,603 1,359,283 - 1,756,886 Bethesda 324,988 393,130 - 718,118 Wheaton 55,839 51,300 - 107,139 Montgomery Hills 12,660 - - 12,660 Subtotal 8,421,210 1,803,713 - 10,224,923 Nonmajor Funds: Permitting Services 818,748 - - 818,748 Community Use of Public Facilities 33,662 - - 33,662 Subtotal 852,410 - - 852,410 Total Enterprise Funds 9,273,620 1,803,713 - 11,077,333
Internal Service Funds: Motor Pool 5,147,200 - 667,825 5,815,025 Central Duplicating 116,306 - - 116,306 Liability & Property Coverage Self-Insurance 445,132 - - 445,132 Employee Health Benefits Self-Insurance 5,681 - - 5,681 Total Internal Service Funds 5,714,319 - 667,825 6,382,144
Total Proprietary Funds $ 14,987,939 $ 1,803,713 $ 667,825 $ 17,459,477
112

As of June 30, 2015, the County has $45,143,600 in outstanding offers of loans and/or grants that have been extended to various companies under its Economic Development Fund programs. To help fund such offers, the designated fund balance of the Economic Development Special Revenue Fund at the end of the year is typically reappropriated in the following year.
C) Subsequent Events
On October 19, 2015, the County issued $9.2 million of Bethesda Parking Lot District (PLD) bonds via direct bank placement to refund the outstanding 2005 Bethesda PLD bonds for debt service savings.
On November 18, 2015, the County issued General Obligation Bonds (Tax-Exempt Series B) in the amount of $300,000,000.
D) Joint Ventures and Jointly Governed Organizations
Joint Ventures
The Primary Government participates in five joint ventures and one jointly governed organization which are not included as part of the reporting entity. The Primary Government does not have a separable financial interest in any of the joint ventures. Therefore, no “Investment in Joint Ventures” is included in the accompanying financial statements. Audited financial statements are available from each of the six organizations. A general description of each entity follows:
Maryland-National Capital Park and Planning Commission (M-NCPPC)
M-NCPPC is a body corporate of the State of Maryland established by the Maryland General Assembly in 1927. M-NCPPC is a bi-county agency. The Board of Commissioners consists of ten members, five each from Montgomery and Prince George’s Counties. The Montgomery County members are appointed by the County Council with the approval of the County Executive. The counties' oversight of M-NCPPC also includes budget approval over their respective shares of the operating and capital budgets. Each county is also required by law to guarantee the general obligation bonds of M-NCPPC issued for its jurisdiction.
At June 30, 2015, M-NCPPC had outstanding notes payable and bonds payable in the amount of $101,524,379, of which zero dollars were self-supporting. Of the total amount payable, $10,433,171 represented debt due within one year. Generally, debt of M-NCPPC is payable from its resources; however, the participating counties must guarantee payment of interest and principal on the debt that is not self-supporting. Montgomery County’s contingent liability for non self-supporting M-NCPPC debt at June 30, 2015 is $42,663,946, which represents general obligation bonds outstanding for the Montgomery County jurisdiction at year-end.
Washington Suburban Sanitary Commission (WSSC)
WSSC is a bi-county instrumentality of the State of Maryland created to provide water supply and sewage disposal services for Montgomery and Prince George's Counties. The two participating counties share equal control over WSSC in the selection of the six-member governing body, budgeting authority, and financing responsibility.
At June 30, 2015, WSSC had outstanding notes payable and bonds payable in the amount of $2,198,567,000 which were fully self-supporting. Of the total amount payable, $348,542,000 represented debt due within one year. Pursuant to Section 4-101 of Article 29 of the Annotated Code of Maryland, the County must guarantee payment of principal and interest on WSSC bonds, unless WSSC waives such guarantee requirement in accordance with Section 4-103 of Article 29. WSSC has waived such guarantee requirement with respect to all outstanding WSSC bonds. At June 30, 2015, all WSSC debt relating to the County is self-supporting.
113

Washington Suburban Transit Commission (WSTC)
The Washington Suburban Transit District (WSTD) encompasses Prince George's and Montgomery Counties, Maryland, and was chartered by the State of Maryland in 1965 to coordinate and participate in the formulation of the transit plan of the Washington Metropolitan Area Transit Authority. The WSTD is governed by the WSTC, which is composed of three representatives each from Prince George's and Montgomery Counties and one representative from the Maryland Department of Transportation. One commissioner from each county is appointed by the Governor of the State of Maryland, and the other two commissioners are appointed by the chief executive officer of the organizations they represent. The two participating counties have equal budgetary authority and financial responsibility for WSTC; however, both are required to act in consultation with the Maryland Department of Transportation. WSTC's liabilities are limited to funds payable from the participating counties and the State under outstanding grant agreements and State legislation. Montgomery County made an operating contribution totaling $142,207 to WSTC during FY15.
Washington Metropolitan Area Transit Authority (WMATA)
WMATA was created in 1967 by interstate compact among the State of Maryland, the Commonwealth of Virginia, and the District of Columbia. WMATA’s primary function is to plan, construct, finance, and operate transit facilities serving the Washington metropolitan area. The governing authority of WMATA is a sixteen- member Board of Directors. Maryland, Virginia, the District of Columbia, and the federal government each appoint four directors. Of Maryland's four directors, two are appointed by the Governor of the State of Maryland, and one each is appointed by the respective county from among its appointees to WSTC. Since WSTC is a joint venture of Montgomery and Prince George's Counties, Montgomery County participates in WMATA through WSTC.
Montgomery County is committed to participation in WMATA and its regional Metrorail, Metrobus, and Metro Access programs. Pursuant to Section 87-13 of the County Code, the County guarantees its obligations imposed on WSTD by contracts or agreements with WMATA. As a result of State legislation, the State of Maryland is required to fund 100 percent of the County's share of rail, bus, and paratransit expenses. In addition, the State is required to fund 100 percent of the annual debt service on revenue bonds issued by WMATA in connection with the construction of the Metro Rail System. The County's share of the cost of construction of the Metro Rail System has been totally assumed by the State. In addition, State legislation mandates that the State provide 100 percent of the County's share of WMATA capital equipment replacement costs.
Under State statutes, the State of Maryland is required to cover its related 100 percent of the combined operating deficit of WMATA and County Ride On operations (that began on or after June 30, 1989), assuming that 35 percent (effective in FY09) of gross operating costs are recovered by revenues.
(Rest of page intentionally left blank.)
114

A summary reflecting WMATA’s expenditures incurred for the County's share of WMATA's activities for FY15, which are fully funded by the State and not reflected in the accompanying financial statements, is as follows:
Bus operating subsidy $ 60,418,225 Rail operating subsidy 46,923,369 Americans with Disabilities Act service 21,034,871 MetroMatters program 4,969,151 Capital Improvement Program 34,511,000 Project Development Program 506,000 Debt service on WMATA revenue bonds (30,888) Local bus program 38,089,000
Total $ 206,420,728
At June 30, 2015, WMATA had outstanding bonds payable of $264,095,000, of which $22,329,256 represented bonds payable due within one year. This debt is payable from the resources of WMATA.
Northeast Maryland Waste Disposal Authority (NEMWDA)
NEMWDA is a body politic and corporate, and a public instrumentality of the State of Maryland. NEMWDA was established to assist the political subdivisions in the Northeast Maryland Region, the private sector in waste management, and the development of waste disposal facilities adequate to accommodate the region’s requirements for disposal of solid waste. NEMWDA has the following eight member jurisdictions from the State of Maryland: Montgomery County, Anne Arundel County, Baltimore City, Baltimore County, Carroll County, Frederick County, Harford County, and Howard County. The Maryland Environmental Service is an ex-officio member.
NEMWDA issued bonds in 1993 to fund the construction of the Montgomery County Resource Recovery Project (Project). In April 2003, NEMWDA refinanced $205,078,908 of the 1993 bonds. On February 28, 2013, NEMWDA issued $77,685,000 in Series 2013 bonds to refund the Series 2003 bonds. On April 1, 2013, $113,720,000 were redeemed pursuant to an advanced refunding. At June 30, 2015, NEMWDA had outstanding bonds payable in the amount of $37,280,000, all debt due within one year. These bonds are limited obligations of NEMWDA, payable solely from the Project revenues and other sources. Since the Project is owned and operated by NEMWDA, the bonds and related activities are included in the financial statements of NEMWDA.
This Project became operational in August 1995. NEMWDA has entered into a service contract with the County under which the County pays a waste disposal fee calculated in accordance with the agreement. The waste disposal fee is comprised of an amount equal to debt service, facility fees, alternative disposal costs, NEMWDA administrative costs, operating costs, and NEMWDA component revenue. Waste disposal fee expense incurred by the Solid Waste Activities Enterprise Fund during FY15 amounted to $41,234,387.
Jointly Governed Organization
Metropolitan Washington Council of Governments (COG)
COG is a multi-governmental regional planning organization, in partnership with State and Federal government agencies, to create and implement solutions to regional issues. The County is a COG member along with other Washington metropolitan area governments. The governing body of COG is a Board of Directors. Each participating governmental unit is allotted a member or members on the Board in accordance with a specified population formula. Budgetary authority rests with the Board. Member dues finance approximately 13 percent of
115

the total funding for COG, with State and Federal grants and private contributions providing the remainder. COG does not utilize debt financing. As a participating government in COG, the County paid FY15 membership dues and fees for services amounting to $815,579.
E) Employee Benefits
1) Deferred Compensation
During FY05, the Montgomery County Council passed legislation enabling the County to establish and maintain one or more additional deferred compensation plans for employees covered by a collective bargaining agreement. All county non-represented employees, those County represented employees who elected to participate, and employees who were retired at the time of transfer continue to participate in the Montgomery County Deferred Compensation Plan administered by the County (the County Plan). County represented employees who elected and all represented employees hired after March 1, 2005 participate in the newly created Montgomery County Union Employees Deferred Compensation Plan (the Union Plan) administered by the bargaining units. The purpose of these Plans is to extend to employees deferred compensation plans pursuant to Section 457 of the Internal Revenue Code of 1986, as amended.
During FY99, in accordance with Federal legislation, the assets of the County Plan were placed in trust for the sole benefit of participants and their beneficiaries. Trust responsibilities were assigned to the Board of Investment Trustees (Board). The County Plan therefore is accounted for and included in the accompanying financial statements as a pension and other employee benefit trust fund. The assets of the Union Plan are not included in the accompanying financial statements since the County has no fiduciary or other responsibility for the Union Plan except as required by federal law, including any regulation, ruling, or other guidance issued under law.
Under Section 33-11 of the Code, all employees hired after July 1, 2008 are automatically enrolled in the Plan with a 1% contribution unless they elect out within 60 days from the date of hire. All eligible participants are automatically enrolled in the Plan as of the date of hire. If they do not opt out of the Plan within 60 days from the date of hire, they begin making a contribution equivalent to 1% of their salary.
Under both Plans, contributions are sent to contracted third party administrator investment vendors for different types of investments as selected by participants. A separate account, which reflects the monies deferred, the investment of the monies, and related investment earnings, is maintained for each participant. Withdrawals are made upon retirement, termination of employment, death, and/or in unforeseeable emergencies. Administrative expenses relating to the County Plan, which are not significant to the County Plan, have been paid by the General Fund.
2) Annual, Sick Leave, and Other Compensated Absences
Employees of the County earn annual, compensatory, and sick leave in varying amounts. Employees who are part of the County Management Leadership Service and participate in the Retirement Savings Plan earn only Paid Time Off (PTO) leave. In the event of termination, employees are reimbursed for accumulated annual, PTO (where applicable), and compensatory leave (up to a limit if applicable). Under the Employees’ Retirement System of Montgomery County, covered employees are given credited service toward retirement benefits for accumulated sick leave at retirement. Earned but unused annual, PTO, and compensatory leave is accounted for in the proprietary funds as a liability. The liability for unused annual, PTO, and compensatory leave payable from governmental fund types is reflected only at the government-wide level because it will be paid from future periods' resources. Liabilities for compensated absences have not been recorded in governmental funds since the portion expected to be liquidated with expendable available financial resources has been determined to be immaterial. Earned but unused sick leave is not recorded as a liability because upon termination, sick leave is not paid. Sick
116

leave is paid only in the event of employee illness, at which time the payments will be made from current resources.
3) Group Insurance Benefits
The County provides comprehensive group insurance programs to its employees. These benefits include, but are not limited to, medical, dental, and vision benefits, long-term disability, term life, and accidental death and dismemberment insurance. The cost of each insurance program is shared between the employer and the employees. During FY15, the County and its employees contributed $98,944,980 and $40,153,733, respectively. Employees of MCRA, HOC, and BUPI participate in the comprehensive insurance program of the County. Employer contributions totaled $730,365, $4,052,044, and $207,230 for these component units, respectively, for FY15.
F) Pension Plan Obligations
1) Defined Benefit Pension Plan
Plan Description
The Employees' Retirement System of Montgomery County (System) is a cost-sharing multiple-employer defined benefit pension plan sponsored by the County. Other agencies and political subdivisions have the right to elect participation. Montgomery County Employee Retirement Plans has the exclusive authority to manage the assets of the System. The Board of Investment Trustees consists of thirteen trustees and functions as part of the County. A publicly available annual report that includes financial statements and required supplementary information for the System, the Defined Contribution Plan (see Note IV-F2), and the Deferred Compensation Plan (see Note IV-E1), can be accessed on the County’s website at http://www.montgomerycountymd.gov/mcerp, or can be obtained by writing the Montgomery County Employee Retirement Plans, 101 Monroe Street, Rockville, Maryland 20850.
This Plan is closed to employees hired on or after October 1, 1994, except public safety bargaining unit employees and Guaranteed Retirement Income Plan (GRIP) participants. Substantially all employees hired prior to October 1, 1994, of the County, MCRA, HOC, the Town of Chevy Chase, the Strathmore Hall Foundation, Inc., WSTC, Montgomery County Employees Federal Credit Union, certain employees of the State Department of Assessments and Taxation, and the District Court of Maryland are provided retirement benefits under the System. The System, established under Section 33 of Montgomery County Code, 2001, as amended, is a contributory plan with employees contributing a percentage of their base annual salary, depending on their group classification which determines retirement eligibility.
Benefit provisions are established under the Montgomery County Code beginning with Section 33-35. All benefits vest at five years of service. There are different retirement groups and retirement membership classes within the System. Members enrolled before July 1, 1978, belong to either the optional non-integrated group or the optional integrated group. Members enrolled on or after July 1, 1978, belong to the mandatory integrated group. Within the groups are different retirement membership classes. The retirement class assigned depends upon the job classification of the member (i.e., non-public safety, police, fire, sheriffs and correctional staff). Normal and early retirement eligibility, the formula for determining the amount of benefit, and the cost of living adjustment varies depending upon the retirement group and retirement membership class. Normal retirement is a percentage of earnings multiplied by years of credited service. Earnings for optional non-integrated group members and optional integrated group members is defined as the high 12 months and for mandatory integrated group members, the high 36 months. The percentage of earnings, the maximum years of credited service and the cost of living adjustment varies depending upon the retirement membership class and group.
117

Members who retire early receive normal retirement benefits reduced by a minimum of 2 percent to a maximum of 60 percent depending on the number of years early retirement precedes normal retirement. Disability benefits are contingent upon service-connected or nonservice-connected occurrences and total or partial permanent disablement. Death benefits are contingent upon service-connected or nonservice-connected occurrences. Effective July 1, 1989, when members terminate employment before their retirement date and after completion of five years of credited service, they may elect to leave their member contributions in the System and receive a pension upon reaching their normal retirement date, based on the amount of their normal retirement pension that has accrued to the date of termination. Vested benefits and eligibility requirements are described under Section 33-45 of the Montgomery County Code of 2001, as amended. A member who terminates employment prior to five years of credited service is refunded their accumulated contributions with interest.
Deferred Retirement Option (DROP) Plans, established in FY00, allow any employee who is a member of a specified membership class or bargaining unit, and who meets certain eligibility requirements, to elect to “retire” but continue to work for a specified time period, during which pension payments are deferred. When the member’s participation in the DROP Plan ends, the member must stop working for the County, draw a pension benefit based on the member’s credited service and earnings as of the date that the member began to participate in the DROP Plan, and receive the value of the DROP Plan payoff.
For members of the GRIP, employee contributions vest immediately and employer contributions are vested after three years of service or upon death, disability, or reaching retirement age. Members are fully vested upon reaching normal retirement (age 62) regardless of years of service. At separation, a participant’s benefit is determined based upon the account balance which includes contributions and earnings.
Funding Policy
Required employee contribution rates varying from 6 to 11.25 percent of regular earnings are fixed and specified under Section 33-39 (a) of the Montgomery County Code of 2001, as amended. Employee contributions for the Elected Officials’ Plan are 4 percent of regular earnings. The County and each participating agency are required to contribute the remaining amounts necessary to fund the System, using the actuarial basis as specified in Section 33-40 of the Montgomery County Code of 2001, as amended. Under the current procedures, an actuarial valuation is performed to determine the employer contribution rate for the System. The contribution rate developed is a percentage of active member payroll. The dollar amount of each year’s employer contribution is determined by applying the contribution rate to the actual payroll for each year. Funding of the System during the period is the sum of the normal costs and amortization of the unfunded accrued liability over a twenty-year period.
The GRIP, as defined in Section 33-35 of the Code, requires non-public safety employees to contribute 4 percent of regular earnings up to the Social Security wage base and 8 percent above the Social Security wage base. Public safety employees are required to contribute 3 percent of regular earnings up to the Social Security wage base and 6 percent above the Social Security wage base. Section 33-40 of the Code requires the County and each participating agency to contribute 8 percent and 10 percent of regular earnings for non-public safety and public safety employees, respectively.
Pension Liabilities, Pension Expense, and Deferred Outflows of Resources and Deferred Inflows of Resources Related to Pensions
At June 30, 2015, the County reported a liability of $298,751,284 for its proportionate share of the net pension liability. The net pension liability was measured as of June 30, 2014, and the total pension liability used to calculate the net pension liability was determined by an actuarial valuation as of that date. The County’s proportion of the net pension liability was based on the County’s proportion of Unfunded Accrued Actuarial
118

Liability (UAAL) relative to the UAAL of all agencies, actuarially determined. At June 30, 2014, the County’s proportion was 97.79%.
For the fiscal year ended June 30, 2015, the County recognized pension expense of $32,088,852. At June 30, 2015, the County reported deferred outflows of resources and deferred inflows of resources related to pensions from the following resources:
Deferred Outflows of Deferred Inflows of Resources Resources
Net difference between projected and actual earnings on pension plan investments $ - $ 233,132,931 Changes in proportion and differences between County contributions and proportionate share of contributions 948,328 -County contributions subsequent to the measurement date 149,600,970 -
Total $ 150,549,298 $ 233,132,931
The $149,600,970 reported as deferred outflows of resources related to pensions resulting from the County contributions subsequent to the measurement date will be recognized as a reduction of the net pension liability in the year ended June 30, 2016. Other amounts reported as deferred outflows of resources and deferred inflows of resources related to pensions will be recognized in pension expense as follows:
Fiscal Year Ending June 30 Amount
2016 $ (57,978,304) 2017 (57,978,304) 2018 (57,978,304) 2019 (58,249,691)
Actuarial Assumptions
The total pension liability in the June 30, 2014 actuarial valuation was determined using the following actuarial assumptions, applied to all periods included in the measurement:
Valuation date June 30, 2014
Actuarial cost method Entry age normal
Amortization method for funding Level percentage of payroll assuming 4% annual payroll growth
Amortization period for funding Closed amortization approach. The period was reset to 18 years as of June30, 2010. Amortization bases created in the future will be amortized over20 years.
Inflation 3% per year
Salary increases 4% - 9.25% per year
Cost-of-living adjustments 3% on the benefit attributable to credited service earned prior to June 30,2011. 2.3% on the benefit attributable to credited service earned thereafter,reflecting the 2.5% cap.
Post-retirement increases Consumer Price Index – by Group
119

Investment rate of return 7.5% per year
Mortality RP2000 Mortality Table, gender-distinct, projected to the year 2030 for healthy mortality and projected to the year 2010 for disabled mortality.Rates are set forward five years for the disabled mortality assumption.
The last experience study covered the period from July 1, 2005 to July 1, 2009 and was performed in November 2010. An actuarial experience study is conducted every five years. The experience study for the period from July 1, 2009 to July 1, 2014 has just concluded and the results of which will be reflected in the next valuation.
The long term rate of return on pension plan investments was determined using a building-block method in which best-estimate ranges of expected future real rates of return (expected returns, net of pension plan investment expense and inflation) are developed for each major asset class. These ranges are combined to produce the long-term expected rate of return by weighing the expected future real rates of return by the target asset allocation percentage and by adding expected inflation. Best estimates of arithmetic real rates of return for each major asset class included in the pension plan’s target asset allocation as of June 30, 2014 (see Note III. A4 for discussion of the System’s investment policy) are summarized in the following table:
Long-Term Expected Asset Class Real Rate of Return
Long Duration Fixed Income 1.45 % High Yield Fixed Income 2.35 Credit Opportunities 5.30 TIPS 1.05 Domestic Equity 4.40 International Equity 4.40 Emerging Equity 4.40 Global Equity 4.60 Private Markets 7.30 Global REITs 3.05 Commodities 2.00 Master Limited Partnerships 6.45 Cash - Hedge Funds 3.85
Discount Rate
The discount rate used to measure the total liability was 7.5%. The projection of cash flows to determine the discount rate assumed that contributions from plan members will be made at the current contribution rate and contributions from the County and other participating agencies will be made at a contractually required rates, actuarially determined. Based on those assumptions, the pension plan’s fiduciary net position was projected to be available to make all projected future benefit payments of current plan members. Therefore, the long-term expected rate of return on pension plan investments was applied to all periods of projected benefit payments to determine the total pension liability.
Sensitivity of the County’s Proportionate Share of the Net Pension Liability to Changes in the Discount Rate
The following presents the County’s proportionate share of the net pension liability calculated using the discount rate of 7.5%, as well as what the County’s proportionate share of the net pension liability would be if it were
120

calculated using a discount rate that is 1-percentage-point lower (6.5%) or 1-percentage-point higher (8.5%) than the current rate:
1% Decrease Discount Rate 1% Increase (6.5%) (7.5%) (8.5%)
County's proportionate share of the net pension liability $ 719,492,488 $ 298,751,284 $ (56,592,443)
Pension Plan Fiduciary Net Position
Detailed information about the pension plan’s fiduciary net position is available in the separately issued financial report by the Montgomery County Employee Retirement Plans.
Allocated Insurance Contract
On August 1, 1986, the County entered into an agreement with Aetna Life Insurance Company (Aetna) wherein Aetna accepted future responsibility for monthly payments to all members retired prior to January 1, 1986, in exchange for a lump sum payment. The County is liable for cost of living increases effective January 1, 1986, and later. The transactions related to this agreement have not been recognized in the System’s financial statements.
2) Defined Contribution Plan
Plan Description
The Employees’ Retirement Savings Plan (Plan) is a cost-sharing multiple-employer defined contribution plan established by the County under Section 33-114 of the County Code. Other agencies or political subdivisions have the right to elect participation. All non-public safety and certain public safety employees not represented by a collective bargaining agreement and hired on or after October 1, 1994, are covered under this Plan, unless they elect to participate in the GRIP. In addition to the County, other participant agencies include MCRA, HOC, the independent fire/rescue corporations, the Town of Chevy Chase, the Strathmore Hall Foundation, Inc., WSTC, and Montgomery County Employees Federal Credit Union. Employees covered under the defined benefit plan may make an irrevocable decision to move into this Plan, provided they are unrepresented employees, or represented by a collective bargaining agreement that allows for participation in this Plan.
Under Section 33-116 of the Code, the Plan requires non-public safety employees to contribute 4 percent of regular earnings up to the Social Security wage base and 8 percent above the Social Security wage base. Public safety employees are required to contribute 3 percent of regular earnings up to the Social Security wage base and 6 percent above the Social Security wage base. Section 33-117 of the Code requires the County and each participating agency to contribute 8 percent and 10 percent of regular earnings for non-public safety and public safety employees, respectively. Employee contributions and earnings thereon are always vested under this Plan and employer contributions and earnings thereon are vested after 3 years of service or upon death, disability, or retirement age of the employee. Members are fully vested upon reaching normal retirement age (62) regardless of years of service. At separation, a participant’s benefit is determined based upon the account balance which includes contributions and investment gains or losses. The Board of Investment Trustees monitors the Plan and offers investment options to the participating employees. Required employer and employee contributions to this Plan for FY15 were $18,502,353 and $9,728,222, respectively.
The Montgomery County Council passed legislation in FY09 enabling the County to establish and maintain a Guaranteed Retirement Income Plan (GRIP), a cash balance plan that is part of the Employees’ Retirement
121

System, for employees. During FY10, eligible County employees who were members of the Retirement Savings Plan (Plan) were granted the option to elect to participate in the GRIP and to transfer their Plan member account balance to the GRIP and cease being a member of the Plan.
3) State Retirement Plan
Plan Description
Certain employees of the County participate in the cost sharing multi-employer defined benefit retirement plans sponsored by the Maryland State Retirement Agency and administered by the Maryland State Retirement and Pension System (MSRP System). The MSRP System was established by the State Personnel and Pensions Article of the Annotated Code of Maryland to provide retirement allowances and other benefits to the employees of the State and participating governmental units. The MSRP System is administered by a 15-member Board of Trustees. The MSRP System issues a publically available financial report that can be obtained at http://www.sra.state.md.us.
Benefit Provided
The MSRP System provides retirement allowances and other benefits to the covered employees. For employees who became members of the Employees Retirement and Pension System on or before June 30, 2011, retirement/pension allowances are computed using both the highest three years Average Final Compensation (AFC) and the actual number of years of accumulated creditable service. For employees, who become members on or after July 1, 2011, pension allowances are computed using both the highest five years AFC and the actual number of years of accumulated creditable service.
A member is generally eligible for full retirement benefits upon the earlier of attaining age 60 or accumulating 30 years of creditable service regardless of age. The annual retirement allowance equals 1/55 (1.81%) of the member’s AFC multiplied by the number of years of accumulated creditable service. An individual who is a member on or before June 30, 2011 is eligible for full retirement benefits upon the earlier of attaining age 62 , with specified years of eligibility service, or accumulating 30 years of eligibility service regardless of age. An individual who becomes a member on or after July 1, 2011 is eligible for full retirement benefits if the member’s combined age and eligibility service equals at least 90 years or if the member is at least 65 and has accrued at least 10 years of eligibility service.
Contributions
The County and its covered employees are required by the State statute to contribute to the MSRP System. The required FY15 employee contributions vary from 5-7% of salary. The required employer contribution rate for FY15 vary from 9.73 – 11.20% of annual payroll, actuarially determined. The contribution requirements of the County and its covered employees are established and may be amended by the Board of Trustees of the MSRP System.
Pension Liabilities, Pension Expense, and Deferred Outflows of Resources and Deferred Inflows of Resources Related to Pensions
At June 30, 2015, the County reported a liability of $17,878,357 for its proportionate share of the net pension liability of the MSRP System. The net pension liability was measured as of June 30, 2014, and the total pension liability used to calculate the net pension liability was determined by an actuarial valuation as of that date.
122

As of June 30, 2014, the County’s total proportionate share was as follows:
Montgomery County 0.0509975933819850000 % Montgomery County Public Library 0.0001610909247812840 Montgomery County (Supplemental) 0.0492975133985048000 Bethesda Fire Department 0.0000936764754388767 Chevy Chase Fire Department 0.0001918157788418590
Total 0.1007416899595518197 %
Montgomery County has four withdrawn Participating Governmental Units (PGU) - Montgomery County, Montgomery County Public Library, Bethesda Fire Department and Chevy Chase Fire Department. The County is paying amortized amounts each fiscal year for these four withdrawn units over a forty-year period ending June 30, 2020.
For the year ended June 30, 2015, the County recognized pension expense of $1,600,996. At June 30, 2015, the County reported the total amount of deferred outflows of resources and deferred inflows of resources related to pensions from the following sources:
Deferred Outflows of Deferred Inflows of Resources Resources
Changes in assumptions $ 258,624 $ -Net difference between projected and actual earnings on pension plan investments - 1,956,903 Difference between actual employer contributions and proportionate share of contributions 480,907 -County contributions subsequent to the measurement date 2,476,892 -
Total $ 3,216,423 $ 1,956,903
The $2,476,892 reported as deferred outflows of resources related to pensions resulting from the County subsequent to the measurement date will be recognized as a reduction in net pension liability in the year ended June 30, 2016. Other amounts reported as deferred outflows of resources and deferred inflows of resources related to pensions will be recognized in pension expense as follows:
Fiscal Year Amount
2016 $ (304,343) 2017 (304,343) 2018 (304,343) 2019 (304,343)
Actuarial Assumptions
The total pension liability was determined by an actuarial valuation as of June 30, 2014, using the entry age normal actuarial cost method. Inflation is assumed to be 2.9% for general and 3.4% for wage. The discount rate and long-term expected rate of return on pension plan investments used in the determination of the pension liability is 7.65%.
123
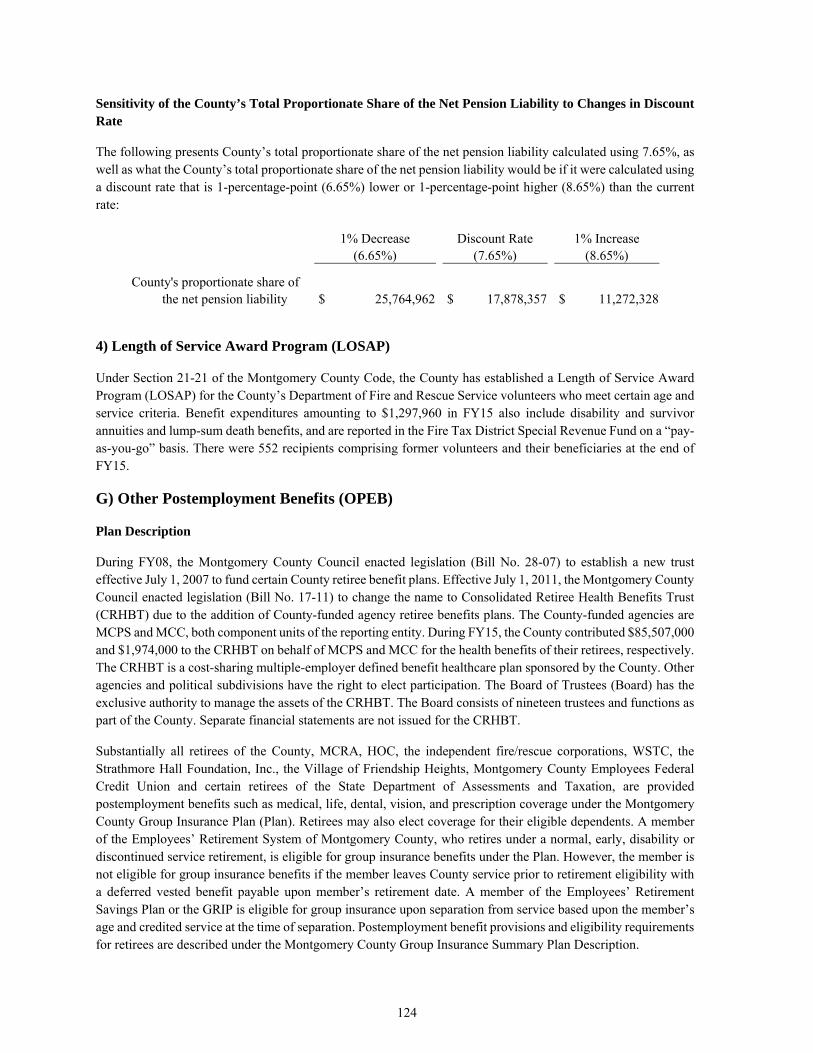
Sensitivity of the County’s Total Proportionate Share of the Net Pension Liability to Changes in Discount Rate
The following presents County’s total proportionate share of the net pension liability calculated using 7.65%, as well as what the County’s total proportionate share of the net pension liability would be if it were calculated using a discount rate that is 1-percentage-point (6.65%) lower or 1-percentage-point higher (8.65%) than the current rate:
1% Decrease Discount Rate 1% Increase (6.65%) (7.65%) (8.65%)
County's proportionate share of the net pension liability $ 25,764,962 $ 17,878,357 $ 11,272,328
4) Length of Service Award Program (LOSAP)
Under Section 21-21 of the Montgomery County Code, the County has established a Length of Service Award Program (LOSAP) for the County’s Department of Fire and Rescue Service volunteers who meet certain age and service criteria. Benefit expenditures amounting to $1,297,960 in FY15 also include disability and survivor annuities and lump-sum death benefits, and are reported in the Fire Tax District Special Revenue Fund on a “pay-as-you-go” basis. There were 552 recipients comprising former volunteers and their beneficiaries at the end of FY15.
G) Other Postemployment Benefits (OPEB)
Plan Description
During FY08, the Montgomery County Council enacted legislation (Bill No. 28-07) to establish a new trust effective July 1, 2007 to fund certain County retiree benefit plans. Effective July 1, 2011, the Montgomery County Council enacted legislation (Bill No. 17-11) to change the name to Consolidated Retiree Health Benefits Trust (CRHBT) due to the addition of County-funded agency retiree benefits plans. The County-funded agencies are MCPS and MCC, both component units of the reporting entity. During FY15, the County contributed $85,507,000 and $1,974,000 to the CRHBT on behalf of MCPS and MCC for the health benefits of their retirees, respectively. The CRHBT is a cost-sharing multiple-employer defined benefit healthcare plan sponsored by the County. Other agencies and political subdivisions have the right to elect participation. The Board of Trustees (Board) has the exclusive authority to manage the assets of the CRHBT. The Board consists of nineteen trustees and functions as part of the County. Separate financial statements are not issued for the CRHBT.
Substantially all retirees of the County, MCRA, HOC, the independent fire/rescue corporations, WSTC, the Strathmore Hall Foundation, Inc., the Village of Friendship Heights, Montgomery County Employees Federal Credit Union and certain retirees of the State Department of Assessments and Taxation, are provided postemployment benefits such as medical, life, dental, vision, and prescription coverage under the Montgomery County Group Insurance Plan (Plan). Retirees may also elect coverage for their eligible dependents. A member of the Employees’ Retirement System of Montgomery County, who retires under a normal, early, disability or discontinued service retirement, is eligible for group insurance benefits under the Plan. However, the member is not eligible for group insurance benefits if the member leaves County service prior to retirement eligibility with a deferred vested benefit payable upon member’s retirement date. A member of the Employees’ Retirement Savings Plan or the GRIP is eligible for group insurance upon separation from service based upon the member’s age and credited service at the time of separation. Postemployment benefit provisions and eligibility requirements for retirees are described under the Montgomery County Group Insurance Summary Plan Description.
124

Plan membership at June 30, 2014, the most recent actuarial valuation as of July 1, 2014, consisted of the following:
Retirees and beneficiaries receiving benefits 7,563 Active plan members 9,942
Total 17,505
Condensed FY15 financial statements for the Consolidated Retiree Health Benefits Trust are as follows:
Condensed Statement of Condensed Statement of Changes in Fiduciary Net Position Fiduciary Net Position
ASSETS ADDITIONS Cash and investments $ 620,134,216 Contributions $ 209,128,508 Other assets 6,800,849 Net investment income (loss) 2,158,711 Total Assets 626,935,065 Total Additions, net 211,287,219 LIABILITIES DEDUCTIONS Claims payable 4,253,303 Benefits 72,260,293 Other liabilities 28,960,325 Administrative 5,042,092 Total Liabilities 33,213,628 Total Deductions 77,302,385 Change in Net Position 133,984,834 NET POSITION: Beginning Net Position 459,736,603 Held in trust for other postemployment benefits $ 593,721,437 Ending Net Position $ 593,721,437
Contributions
The County Council has the authority to establish and amend contribution requirements of the plan members and the County. The Plan is a contributory plan in which the County and the retired members and beneficiaries contribute, based on an actuarial valuation, certain amounts toward the current cost of healthcare benefits. During FY15, plan members and beneficiaries receiving benefits contributed $21,916,187 (approximately 29 percent of current contributions). The County and other contributing entities contributed $97,651,089 including $53,017,089 (approximately 71 percent of current contributions) for current premiums, claims and administrative expenses, and $44,634,000 toward prefunding future benefits.
Funding Status and Funding Progress
As of June 30, 2014, the most recent actuarial valuation, the actuarial accrued liability (AAL) was $1,241,304,000 and there was $239,399,000 of actuarial plan assets; therefore, the unfunded AAL (UAAL) was $1,001,905,000. The annual covered payroll of active employees covered by the Plan was $649,659,000 and the ratio of the UAAL to covered payroll was 154.2 percent.
The actuarial valuation of the Plan involves estimates of the value of reported amounts and assumptions about the probability of events far into the future. The actuarially determined amounts regarding the funded status of the Plan and the annual required contributions (ARC) of the County and other participating agencies are subject to continual revision as actual results are compared to past expectations and new estimates are made about the future.
125
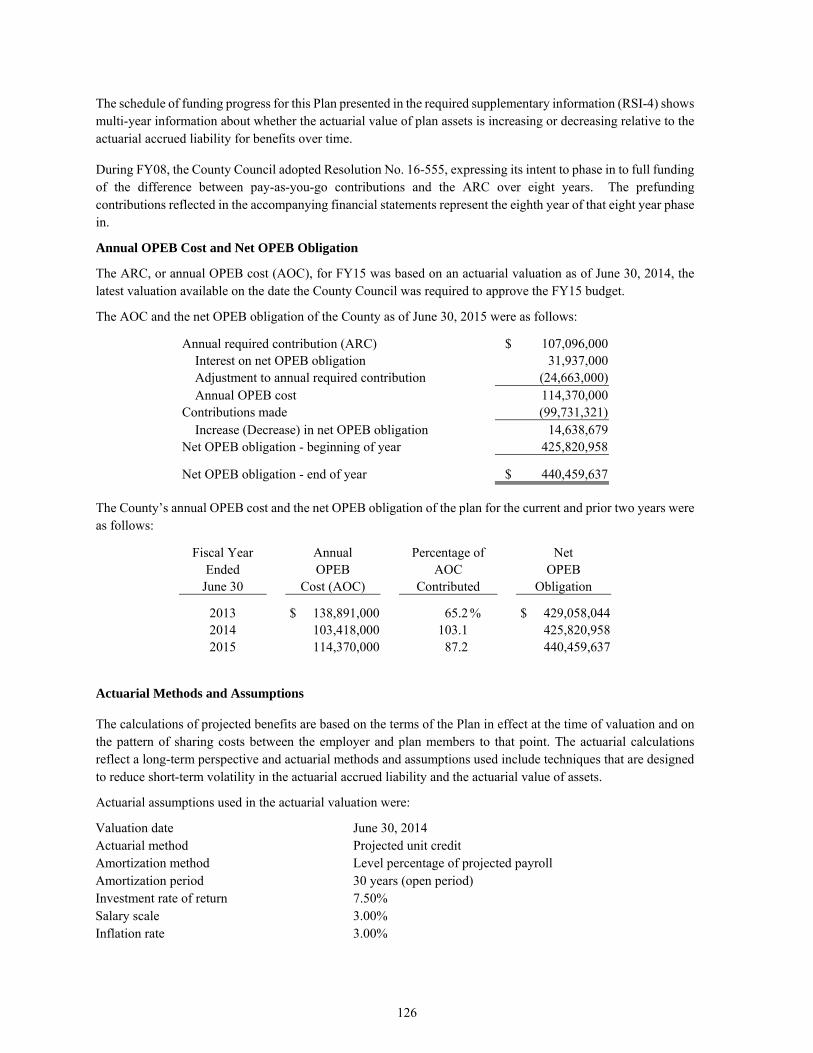
The schedule of funding progress for this Plan presented in the required supplementary information (RSI-4) shows multi-year information about whether the actuarial value of plan assets is increasing or decreasing relative to the actuarial accrued liability for benefits over time.
During FY08, the County Council adopted Resolution No. 16-555, expressing its intent to phase in to full funding of the difference between pay-as-you-go contributions and the ARC over eight years. The prefunding contributions reflected in the accompanying financial statements represent the eighth year of that eight year phase in.
Annual OPEB Cost and Net OPEB Obligation
The ARC, or annual OPEB cost (AOC), for FY15 was based on an actuarial valuation as of June 30, 2014, the latest valuation available on the date the County Council was required to approve the FY15 budget.
The AOC and the net OPEB obligation of the County as of June 30, 2015 were as follows:
Annual required contribution (ARC) $ 107,096,000 Interest on net OPEB obligation 31,937,000 Adjustment to annual required contribution (24,663,000) Annual OPEB cost 114,370,000 Contributions made (99,731,321) Increase (Decrease) in net OPEB obligation 14,638,679 Net OPEB obligation - beginning of year 425,820,958
Net OPEB obligation - end of year $ 440,459,637
The County’s annual OPEB cost and the net OPEB obligation of the plan for the current and prior two years were as follows:
Fiscal Year Annual Percentage of Net Ended OPEB AOC OPEB
June 30 Cost (AOC) Contributed Obligation
2013 $ 138,891,000 65.2 % $ 429,058,044 2014 103,418,000 103.1 425,820,958 2015 114,370,000 87.2 440,459,637
Actuarial Methods and Assumptions
The calculations of projected benefits are based on the terms of the Plan in effect at the time of valuation and on the pattern of sharing costs between the employer and plan members to that point. The actuarial calculations reflect a long-term perspective and actuarial methods and assumptions used include techniques that are designed to reduce short-term volatility in the actuarial accrued liability and the actuarial value of assets.
Actuarial assumptions used in the actuarial valuation were:
Valuation date June 30, 2014 Actuarial method Projected unit credit Amortization method Level percentage of projected payroll Amortization period 30 years (open period) Investment rate of return 7.50% Salary scale 3.00% Inflation rate 3.00%
126

Mortality RP 2000 projected 30 years, separate tables for males and females
Health care cost trend rates: (initial, ultimate) Medical (excluding Indemnity plan) pre-65 8.09%, 5.16% Medical (excluding Indemnity plan) post-65 (2.87)%, 5.00% Medical (Indemnity plan) 9.21%, 5.50% Medical (Indemnity plan) post-65 1.15%, 6.09% Dental 5.00%, 4.50%
(Rest of page intentionally left blank.)
127

128
REQUIRED SUPPLEMENTARY INFORMATION
129

130
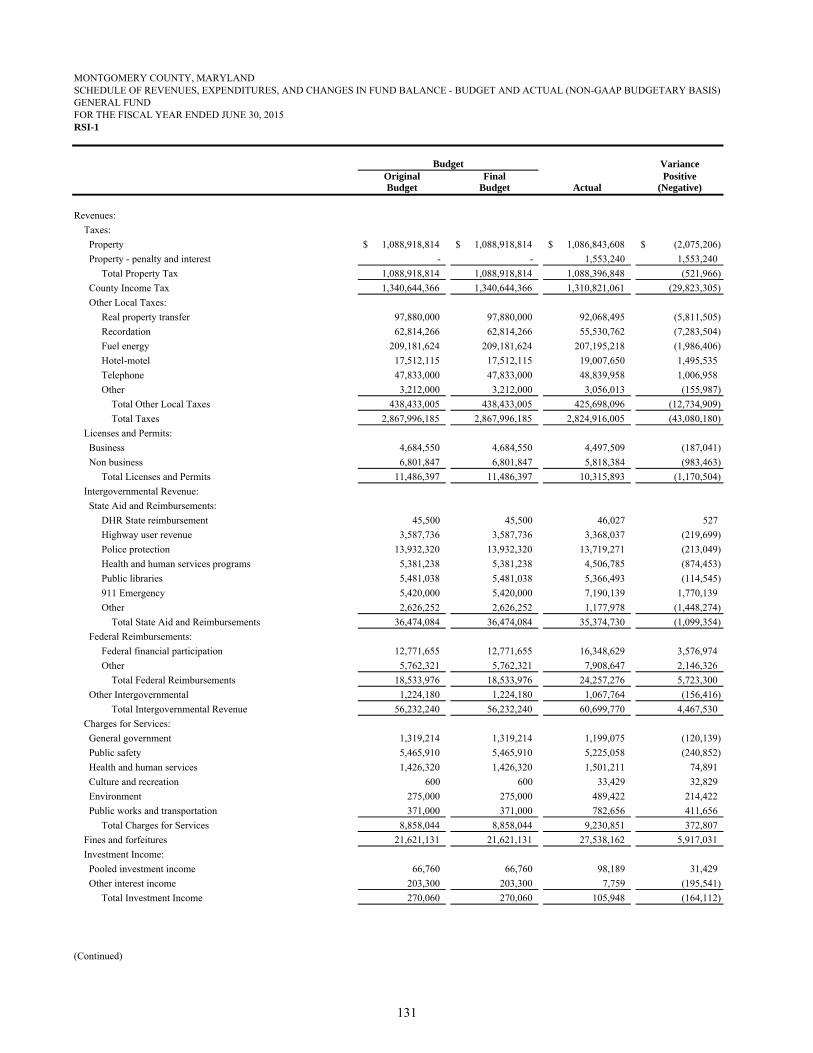
MONTGOMERY COUNTY, MARYLANDSCHEDULE OF REVENUES, EXPENDITURES, AND CHANGES IN FUND BALANCE - BUDGET AND ACTUAL (NON-GAAP BUDGETARY BASIS)GENERAL FUNDFOR THE FISCAL YEAR ENDED JUNE 30, 2015RSI-1
VarianceOriginal Final PositiveBudget Budget Actual (Negative)
Revenues:
Taxes:
Property 1,088,918,814$ 1,088,918,814$ 1,086,843,608$ (2,075,206)$
Property - penalty and interest - - 1,553,240 1,553,240
Total Property Tax 1,088,918,814 1,088,918,814 1,088,396,848 (521,966)
County Income Tax 1,340,644,366 1,340,644,366 1,310,821,061 (29,823,305)
Other Local Taxes:
Real property transfer 97,880,000 97,880,000 92,068,495 (5,811,505)
Recordation 62,814,266 62,814,266 55,530,762 (7,283,504)
Fuel energy 209,181,624 209,181,624 207,195,218 (1,986,406)
Hotel-motel 17,512,115 17,512,115 19,007,650 1,495,535
Telephone 47,833,000 47,833,000 48,839,958 1,006,958
Other 3,212,000 3,212,000 3,056,013 (155,987)
Total Other Local Taxes 438,433,005 438,433,005 425,698,096 (12,734,909)
Total Taxes 2,867,996,185 2,867,996,185 2,824,916,005 (43,080,180)
Licenses and Permits:
Business 4,684,550 4,684,550 4,497,509 (187,041)
Non business 6,801,847 6,801,847 5,818,384 (983,463)
Total Licenses and Permits 11,486,397 11,486,397 10,315,893 (1,170,504)
Intergovernmental Revenue:
State Aid and Reimbursements:
DHR State reimbursement 45,500 45,500 46,027 527
Highway user revenue 3,587,736 3,587,736 3,368,037 (219,699)
Police protection 13,932,320 13,932,320 13,719,271 (213,049)
Health and human services programs 5,381,238 5,381,238 4,506,785 (874,453)
Public libraries 5,481,038 5,481,038 5,366,493 (114,545)
911 Emergency 5,420,000 5,420,000 7,190,139 1,770,139
Other 2,626,252 2,626,252 1,177,978 (1,448,274)
Total State Aid and Reimbursements 36,474,084 36,474,084 35,374,730 (1,099,354)
Federal Reimbursements:
Federal financial participation 12,771,655 12,771,655 16,348,629 3,576,974
Other 5,762,321 5,762,321 7,908,647 2,146,326
Total Federal Reimbursements 18,533,976 18,533,976 24,257,276 5,723,300
Other Intergovernmental 1,224,180 1,224,180 1,067,764 (156,416)
Total Intergovernmental Revenue 56,232,240 56,232,240 60,699,770 4,467,530
Charges for Services:
General government 1,319,214 1,319,214 1,199,075 (120,139)
Public safety 5,465,910 5,465,910 5,225,058 (240,852)
Health and human services 1,426,320 1,426,320 1,501,211 74,891
Culture and recreation 600 600 33,429 32,829
Environment 275,000 275,000 489,422 214,422
Public works and transportation 371,000 371,000 782,656 411,656
Total Charges for Services 8,858,044 8,858,044 9,230,851 372,807
Fines and forfeitures 21,621,131 21,621,131 27,538,162 5,917,031
Investment Income:
Pooled investment income 66,760 66,760 98,189 31,429
Other interest income 203,300 203,300 7,759 (195,541)
Total Investment Income 270,060 270,060 105,948 (164,112)
(Continued)
Budget
131

MONTGOMERY COUNTY, MARYLANDSCHEDULE OF REVENUES, EXPENDITURES, AND CHANGES IN FUND BALANCE - BUDGET AND ACTUAL (NON-GAAP BUDGETARY BASIS)GENERAL FUNDFOR THE FISCAL YEAR ENDED JUNE 30, 2015RSI-1 (Continued)
VarianceOriginal Final PositiveBudget Budget Actual (Negative)
Miscellaneous Revenue:
Property rentals 5,114,970 5,114,970 3,875,465 (1,239,505)
Sundry 3,606,020 3,606,020 5,631,563 2,025,543
Total Miscellaneous Revenue 8,720,990 8,720,990 9,507,028 786,038
Total Revenues 2,975,185,047 2,975,185,047 2,942,313,657 (32,871,390)
Expenditures:
Departments or Offices:
County Council:
Personnel 9,534,805 9,900,095 9,900,094 1
Operating 847,195 872,780 872,775 5
Totals 10,382,000 10,772,875 10,772,869 6
Board of Appeals:
Personnel 509,489 541,951 541,947 4
Operating 57,107 51,407 39,026 12,381
Totals 566,596 593,358 580,973 12,385
Legislative Oversight:
Personnel 1,409,301 1,456,572 1,456,569 3
Operating 26,202 28,876 23,830 5,046
Totals 1,435,503 1,485,448 1,480,399 5,049
Merit System Protection Board:
Personnel 142,789 128,510 124,754 3,756
Operating 15,508 89,357 89,354 3
Totals 158,297 217,867 214,108 3,759
Zoning and Administrative Hearings:
Personnel 511,001 516,081 516,073 8
Operating 76,414 82,252 67,928 14,324
Totals 587,415 598,333 584,001 14,332
Inspector General:
Personnel 688,744 696,569 695,236 1,333
Operating 68,302 108,426 58,575 49,851
Totals 757,046 804,995 753,811 51,184
Circuit Court:
Personnel 8,901,234 8,851,234 8,649,047 202,187
Operating 2,681,823 3,013,049 2,994,721 18,328
Totals 11,583,057 11,864,283 11,643,768 220,515
State's Attorney:
Personnel 14,212,691 13,912,259 13,912,257 2
Operating 678,088 1,120,594 1,120,588 6
Totals 14,890,779 15,032,853 15,032,845 8
County Executive:
Personnel 4,320,728 4,536,997 4,536,987 10
Operating 607,126 842,217 610,646 231,571
Totals 4,927,854 5,379,214 5,147,633 231,581
Community Engagement Cluster:
Personnel 2,696,078 2,722,069 2,722,068 1
Operating 786,910 817,572 817,567 5
Totals 3,482,988 3,539,641 3,539,635 6
(Continued)
Budget
132

MONTGOMERY COUNTY, MARYLANDSCHEDULE OF REVENUES, EXPENDITURES, AND CHANGES IN FUND BALANCE - BUDGET AND ACTUAL (NON-GAAP BUDGETARY BASIS)GENERAL FUNDFOR THE FISCAL YEAR ENDED JUNE 30, 2015RSI-1 (Continued)
VarianceOriginal Final PositiveBudget Budget Actual (Negative)
Ethics Commission:
Personnel 329,084 337,825 337,822 3
Operating 26,557 64,057 63,525 532
Totals 355,641 401,882 401,347 535
Intergovernmental Relations:
Personnel 788,054 791,614 791,607 7
Operating 86,609 86,379 86,377 2
Totals 874,663 877,993 877,984 9
Public Information:
Personnel 3,868,420 3,945,400 3,945,394 6
Operating 947,709 1,219,708 1,219,707 1
Totals 4,816,129 5,165,108 5,165,101 7
Board of Elections:
Personnel 3,484,481 3,493,204 3,477,874 15,330
Operating 3,240,957 3,961,889 3,889,508 72,381
Totals 6,725,438 7,455,093 7,367,382 87,711
County Attorney:
Personnel 4,907,091 5,303,886 5,303,884 2
Operating 474,145 982,615 982,610 5
Totals 5,381,236 6,286,501 6,286,494 7
Management and Budget:
Personnel 3,790,334 3,813,578 3,719,433 94,145
Operating 126,679 134,631 113,874 20,757
Totals 3,917,013 3,948,209 3,833,307 114,902
Finance:
Personnel 10,970,775 10,506,125 10,433,162 72,963
Operating 2,441,662 3,735,469 3,532,269 203,200
Totals 13,412,437 14,241,594 13,965,431 276,163
Human Resources:
Personnel 5,023,029 5,569,363 5,569,354 9
Operating 2,755,610 3,100,056 3,100,048 8
Totals 7,778,639 8,669,419 8,669,402 17
Technology Services:
Personnel 15,807,789 15,389,919 15,364,232 25,687
Operating 14,464,279 18,545,813 18,093,329 452,484
Totals 30,272,068 33,935,732 33,457,561 478,171
General Services:
Personnel 15,165,868 16,932,934 16,932,930 4
Operating 14,302,157 25,496,737 25,496,732 5
Totals 29,468,025 42,429,671 42,429,662 9
Consumer Protection:
Personnel 2,114,324 2,117,128 2,064,750 52,378
Operating 141,912 142,192 71,091 71,101
Totals 2,256,236 2,259,320 2,135,841 123,479
Corrections and Rehabilitation:
Personnel 63,988,697 63,456,170 63,437,009 19,161
Operating 7,147,194 7,797,850 7,627,067 170,783
Totals 71,135,891 71,254,020 71,064,076 189,944
(Continued)
Budget
133
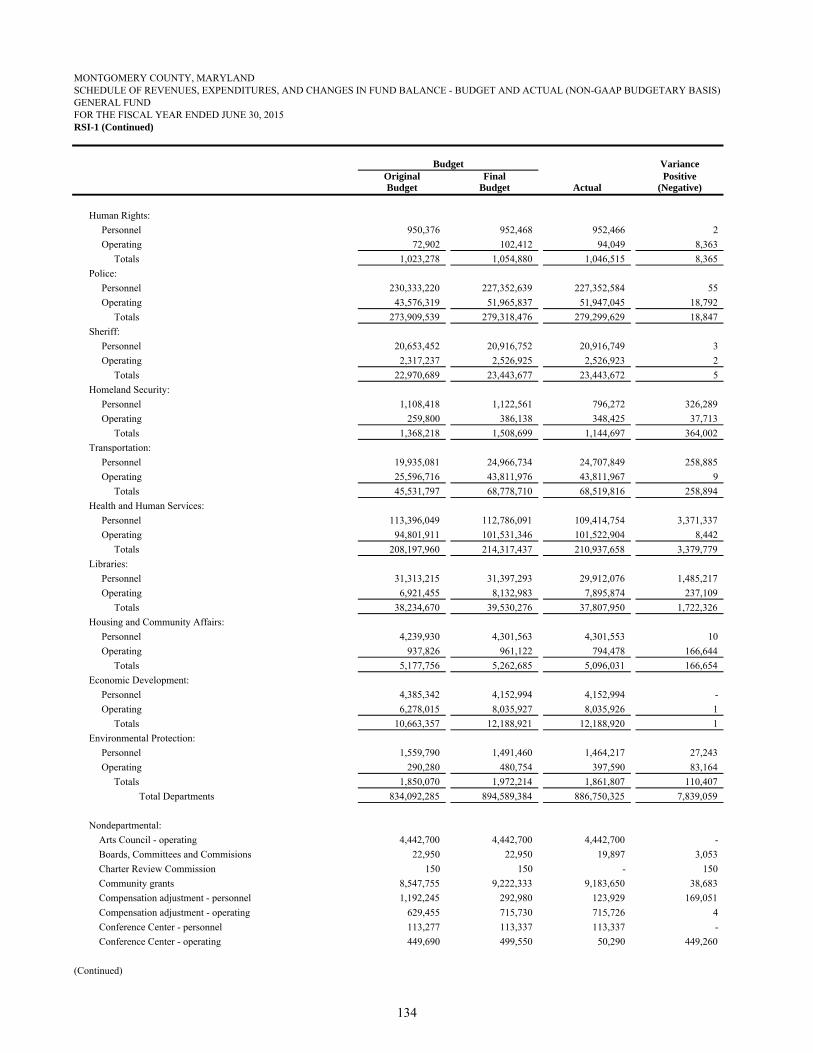
MONTGOMERY COUNTY, MARYLANDSCHEDULE OF REVENUES, EXPENDITURES, AND CHANGES IN FUND BALANCE - BUDGET AND ACTUAL (NON-GAAP BUDGETARY BASIS)GENERAL FUNDFOR THE FISCAL YEAR ENDED JUNE 30, 2015RSI-1 (Continued)
VarianceOriginal Final PositiveBudget Budget Actual (Negative)
Human Rights:
Personnel 950,376 952,468 952,466 2
Operating 72,902 102,412 94,049 8,363
Totals 1,023,278 1,054,880 1,046,515 8,365
Police:
Personnel 230,333,220 227,352,639 227,352,584 55
Operating 43,576,319 51,965,837 51,947,045 18,792
Totals 273,909,539 279,318,476 279,299,629 18,847
Sheriff:
Personnel 20,653,452 20,916,752 20,916,749 3
Operating 2,317,237 2,526,925 2,526,923 2
Totals 22,970,689 23,443,677 23,443,672 5
Homeland Security:
Personnel 1,108,418 1,122,561 796,272 326,289
Operating 259,800 386,138 348,425 37,713
Totals 1,368,218 1,508,699 1,144,697 364,002
Transportation:
Personnel 19,935,081 24,966,734 24,707,849 258,885
Operating 25,596,716 43,811,976 43,811,967 9
Totals 45,531,797 68,778,710 68,519,816 258,894
Health and Human Services:
Personnel 113,396,049 112,786,091 109,414,754 3,371,337
Operating 94,801,911 101,531,346 101,522,904 8,442
Totals 208,197,960 214,317,437 210,937,658 3,379,779
Libraries:
Personnel 31,313,215 31,397,293 29,912,076 1,485,217
Operating 6,921,455 8,132,983 7,895,874 237,109
Totals 38,234,670 39,530,276 37,807,950 1,722,326
Housing and Community Affairs:
Personnel 4,239,930 4,301,563 4,301,553 10
Operating 937,826 961,122 794,478 166,644
Totals 5,177,756 5,262,685 5,096,031 166,654
Economic Development:
Personnel 4,385,342 4,152,994 4,152,994 -
Operating 6,278,015 8,035,927 8,035,926 1
Totals 10,663,357 12,188,921 12,188,920 1
Environmental Protection:
Personnel 1,559,790 1,491,460 1,464,217 27,243
Operating 290,280 480,754 397,590 83,164
Totals 1,850,070 1,972,214 1,861,807 110,407
Total Departments 834,092,285 894,589,384 886,750,325 7,839,059
Nondepartmental:
Arts Council - operating 4,442,700 4,442,700 4,442,700 -
Boards, Committees and Commisions 22,950 22,950 19,897 3,053
Charter Review Commission 150 150 - 150
Community grants 8,547,755 9,222,333 9,183,650 38,683
Compensation adjustment - personnel 1,192,245 292,980 123,929 169,051
Compensation adjustment - operating 629,455 715,730 715,726 4
Conference Center - personnel 113,277 113,337 113,337 -
Conference Center - operating 449,690 499,550 50,290 449,260
(Continued)
Budget
134

MONTGOMERY COUNTY, MARYLANDSCHEDULE OF REVENUES, EXPENDITURES, AND CHANGES IN FUND BALANCE - BUDGET AND ACTUAL (NON-GAAP BUDGETARY BASIS)GENERAL FUNDFOR THE FISCAL YEAR ENDED JUNE 30, 2015RSI-1 (Continued)
VarianceOriginal Final PositiveBudget Budget Actual (Negative)
Conferences & Visitors Bureau 1,225,848 1,345,208 1,345,204 4
Consolidated Retiree Health Benefits Trust (MC) 1,974,000 1,974,000 1,974,000 -
Consolidated Retiree Health Benefits Trust (MCPS) 85,507,000 85,507,000 85,507,000 -
Contrib. To Self Ins Fund - Risk Mg 19,547,940 19,547,940 18,996,437 551,503
County Associations 74,728 74,728 74,728 -
County Leases - personnel 100,000 100,440 100,435 5
County Leases - operating 20,881,310 20,910,564 20,096,533 814,031
Desktop computer modernization - operating 5,661,200 7,225,771 7,034,481 191,290
Grants To Muni Lieu Of Shared Tax 28,020 28,020 28,012 8
Group Insurance Retirees 32,462,450 32,462,450 32,462,450 -
Historical Activities 77,250 102,590 102,589 1
Homeowners' Association Roads 53,110 53,110 53,110 -
Housing Opportunities Commission 6,376,480 - - -
Inauguration & Transition 5,000 5,000 3,884 1,116
Independent Audit 420,820 428,589 282,769 145,820
Interagency tech, policy and coord comm - operating 5,850 5,850 1,666 4,184
Legislative Branch Communications Outreach 488,000 598,833 579,554 19,279
Metro Washington Council Of Govts 816,409 816,409 815,579 830
Mont Coalition Adult English Literacy 1,257,058 1,257,058 1,257,058 -
Motor Pool Fund 823,698 - - -
Municipal Tax Duplication 8,048,578 8,106,648 8,106,641 7
Prisoner Medical Services 50,000 50,000 - 50,000
Public Technologies Inc 20,000 20,000 20,000 -
Rebate Takoma Park For Police 951,540 951,540 920,996 30,544
Retiree Health Benefits Trust 38,577,480 38,577,480 38,577,480 -
Rockville Parking District 376,600 376,600 366,137 10,463
Snow Removal 5,884,990 - - -
State Positions Supplement 60,756 60,756 26,659 34,097
State Property Tax Services 3,464,610 3,464,610 3,128,208 336,402
State Retirement Contribution 1,251,603 1,251,603 1,251,603 -
Takoma Park - Lib Transition 132,819 145,809 145,801 8
Utilities 25,234,133 25,319,257 24,619,207 700,050
Working Families Income Supplement 18,342,200 18,960,630 18,960,626 4
Total - Nondepartmental 295,579,702 285,038,223 281,488,376 3,549,847
Total Expenditures 1,129,671,987 1,179,627,607 1,168,238,701 11,388,906
Excess of Revenues over (under) Expenditures 1,845,513,060 1,795,557,440 1,774,074,956 (21,482,484)
Other Financing Sources (Uses):
Transfers In:
Special Revenue Funds:
Fire Tax District 120,750 120,750 120,750 -
Recreation 5,216,400 4,866,400 3,103,190 (1,763,210)
Mass Transit 10,873,510 10,548,510 10,548,510 -
Water Quality Protection 1,287,544 1,287,544 1,287,544 -
Urban Districts 569,210 569,210 569,210 -
Housing Activities 295,481 295,481 295,481 -
Grants 638,580 - - -
Cable TV 8,389,025 8,389,025 8,389,025 -
Total Special Revenue Funds 27,390,500 26,076,920 24,313,710 (1,763,210)
(Continued)
Budget
135

MONTGOMERY COUNTY, MARYLANDSCHEDULE OF REVENUES, EXPENDITURES, AND CHANGES IN FUND BALANCE - BUDGET AND ACTUAL (NON-GAAP BUDGETARY BASIS)GENERAL FUNDFOR THE FISCAL YEAR ENDED JUNE 30, 2015RSI-1 (Continued)
VarianceOriginal Final PositiveBudget Budget Actual (Negative)
Enterprise Funds:
Liquor 27,790,916 27,790,916 28,300,046 509,130
Parking Lot Districts 801,217 801,217 854,012 52,795
Solid Waste Activities 2,555,079 2,555,079 2,555,079 -
Community Use of Public Facilities 454,619 454,619 454,619 -
Permitting Services 4,090,186 4,090,186 4,090,186 -
Total Enterprise Funds 35,692,017 35,692,017 36,253,942 561,925
Internal Service Funds:
Self insurance employee health benefits 10,056,754 10,056,754 10,745,911 689,157
Total Internal Service Funds 10,056,754 10,056,754 10,745,911 689,157
Total Transfers In 73,139,271 71,825,691 71,313,563 (512,128)
Transfers In - Component Units:
Montgomery College 247,610 - - -
Total Transfers In - Component Units 247,610 - - -
Total Transfers In - MCG 73,386,881 71,825,691 71,313,563 (512,128)
Transfers (Out):
Special Revenue Funds:
Recreation (1,009,700) (1,009,700) (1,009,700) -
Fire Tax District (1,450,000) (250,000) (250,000) -
Urban Districts (1,284,430) (1,284,430) (1,284,430) -
Mass Transit (531,310) (531,310) (531,310) -
Revenue Stabilization (22,571,411) (22,482,050) (22,392,996) 89,054
Housing Activities (18,572,277) (18,572,277) (18,572,277) -
Economic Development (1,686,617) (1,199,627) (1,199,627) -
Total Special Revenue Funds (47,105,745) (45,329,394) (45,240,340) 89,054
Internal Service Funds:
Motor Pool - (823,698) (576,813) 246,885
Total Internal Service Funds - (823,698) (576,813) 246,885
Enterprise Funds: Community Use of Public Facilities (160,000) (160,000) (160,000) - Solid Waste Activities (1,548,890) (1,548,890) (1,548,890) -
Permitting Services (1,153,770) - - -
Total Enterprise Funds (2,862,660) (1,708,890) (1,708,890) -
Debt Service Fund (290,789,930) (290,805,592) (281,282,150) 9,523,442
Capital Projects Fund - (87,865,511) (54,521,679) 33,343,832
Total Transfers (Out) (340,758,335) (426,533,085) (383,329,872) 43,203,213
(Continued)
Budget
136

MONTGOMERY COUNTY, MARYLANDSCHEDULE OF REVENUES, EXPENDITURES, AND CHANGES IN FUND BALANCE - BUDGET AND ACTUAL (NON-GAAP BUDGETARY BASIS)GENERAL FUNDFOR THE FISCAL YEAR ENDED JUNE 30, 2015RSI-1 (Concluded)
VarianceOriginal Final PositiveBudget Budget Actual (Negative)
Transfers (Out) - Component Units:
Montgomery County Public Schools - operating (1,478,450,933) (1,478,450,933) (1,478,450,933) -
Montgomery County Public Schools - capital - (21,250,981) (8,953,638) 12,297,343
Total Montgomery County Public Schools (1,478,450,933) (1,499,701,914) (1,487,404,571) 12,297,343
Montgomery College - operating (118,813,727) (118,813,727) (118,813,727) -
Montgomery College - capital - (27,639,193) (9,086,748) 18,552,445
Total Montgomery College (118,813,727) (146,452,920) (127,900,475) 18,552,445
Housing Opportunity Commission - operating - (6,376,480) (7,360,143) (983,663)
Housing Opportunity Commission - capital - (6,392,659) - 6,392,659
Total Housing Opportunity Commission - (12,769,139) (7,360,143) 5,408,996
M-NCPPC - operating (866,800) (866,800) (866,800) -
Total Transfers (Out) - Component Units and JV (1,598,131,460) (1,659,790,773) (1,623,531,989) 36,258,784
Total Transfers (Out) - MCG (1,938,889,795) (2,086,323,858) (2,006,861,861) 79,461,997
Total Other Financing Sources (Uses) (1,865,502,914) (2,014,498,167) (1,935,548,298) 78,949,869
Excess of Revenues and Other Financing
Sources over (under) Expenditures and
Other Financing Uses (19,989,854) (218,940,727) (161,473,342) 57,467,385
Fund Balance - Beginning of Year 349,764,282 349,764,282 349,764,282 -
Fund Balance - End of Year 329,774,428$ 130,823,555$ 188,290,940$ 57,467,385$
Reconciliation of budgetary schedule to GAAP basis Combining Statement of Revenues, Expenditures, and Changes in Fund Balances:
Expenditures
and Financing Effect onGeneral Fund: Revenues Encumbrances Sources (Uses) Fund Balance
As reported - budgetary basis 2,942,313,657$ 1,168,238,701$ (1,935,548,298)$ (161,473,342)$
Non budgeted Item - Bad debt expense - 4,476,824 - (4,476,824)
Adjusted - budgetary basis 2,942,313,657 1,172,715,525 (1,935,548,298) (165,950,166)
Reconciling items:
Financing under notes and leases payable - - 231,235 231,235
Elimination of encumbrances outstanding - (26,575,194) - 26,575,194
Revenue Stabilization investment income 267,729 - - 267,729
Conference center activity 23,051,429 16,343,149 - 6,708,280
Transfer to Revenue Stabilization - - 22,392,996 22,392,996
Interfund activities budgeted as transfers:
Recreation facility maintenance costs 1,763,210 - - 1,763,210
Parking revenue 52,795 - (52,795) -
Solid Waste tipping fees - 1,548,890 1,548,890 -
Community Use of Public Facilities for elections - 135,000 135,000 -
Component Unit activities budgeted as transfers:
Component Units and Joint Venture - transfer out - 1,623,531,989 1,623,531,989 -
As reported - GAAP basis 2,967,448,820$ 2,787,699,359$ (287,760,983)$ (108,011,522)$
Budget
137

RSI-2
VarianceOriginal Final PositiveBudget Budget Actual (Negative)
Revenues:
Taxes - transfer 9,658,371$ 9,658,371$ 8,630,004$ (1,028,367)$
Investment Income:
Pooled investment income 1,000,000 1,000,000 21,645 (978,355)
Other interest income - - 2,018,175 2,018,175
Total Investment Income 1,000,000 1,000,000 2,039,820 1,039,820
Miscellaneous:
Property rentals, MPDU and other contributions 390,636 390,636 315,902 (74,734)
Total Miscellaneous 390,636 390,636 315,902 (74,734)
Total Revenues 11,049,007 11,049,007 10,985,726 (63,281)
Expenditures: Community development and housing
Personnel 1,770,182 1,770,182 1,747,166 23,016
Operating 26,120,543 32,035,334 28,815,254 3,220,080
Total Expenditures 27,890,725 33,805,516 30,562,420 3,243,096
Excess of Revenues over (under) Expenditures (16,841,718) (22,756,509) (19,576,694) 3,179,815
Other Financing Sources (Uses):
Transfers In (Out):
From General Fund 18,572,277 18,572,277 18,572,277 -
From Capital Projects Fund 10,392,257 10,392,257 10,392,257 -
To General Fund (262,272) (295,481) (295,481) -
To Debt Service Fund (7,229,219) (7,196,010) (7,395,785) (199,775)
To Capital Projects - - (5,104,445) (5,104,445)
Mortgage repayment 2,500,000 2,500,000 9,616,637 7,116,637
Sale of property 1,250,000 1,250,000 1,526,002 276,002
Total Other Financing Sources (Uses) 25,223,043 25,223,043 27,311,462 2,088,419
Excess of Revenues
and Other Financing Sources over (under)
Expenditures and Other Financing Uses 8,381,325 2,466,534 7,734,768 5,268,234
Fund Balance - Beginning of Year 48,778,373 48,778,373 48,778,373 -
Fund Balance - End of Year 57,159,698$ 51,244,907$ 56,513,141$ 5,268,234$
Reconciliation of budgetary schedule to GAAP basis Combining Statement of Revenues, Expenditures, and Changes in Fund Balances:
Budgetary - Excess of Revenues and Other Financing Sources over (under) Expenditures and Other Financing Uses: 7,734,768$
Reconciling items:
Elimination of encumbrances outstanding 528,068
Non budgeted Item - Bad debt expense (5,940,313)
GAAP - Net Change in Fund Balance 2,322,523$
MONTGOMERY COUNTY, MARYLAND
HOUSING INITIATIVE SPECIAL REVENUE FUNDFOR THE FISCAL YEAR ENDED JUNE 30, 2015
Budget
SCHEDULE OF REVENUES, EXPENDITURES, AND CHANGES IN FUND BALANCE - BUDGET AND ACTUAL (NON-GAAP BUDGETARY BASIS)
138

MONTGOMERY COUNTY, MARYLANDSCHEDULE OF REVENUES, EXPENDITURES, AND CHANGES IN FUND BALANCE - BUDGET AND ACTUAL (NON-GAAP BUDGETARY BASIS)GRANTS SPECIAL REVENUE FUNDFOR THE FISCAL YEAR ENDED JUNE 30, 2015RSI-3
VarianceOriginal Final PositiveBudget Budget Actual (Negative)
Revenues:
Intergovernmental:
Federal grants 28,182,678$ 49,501,478$ 47,101,036$ (2,400,442)$
State grants 88,236,501 159,374,047 67,608,089 (91,765,958)
Other non-state and non-federal reimbursements 130,000 2,105,088 470,537 (1,634,551)
Total Intergovernmental 116,549,179 210,980,613 115,179,662 (95,800,951)
Investment income:
Other principal and interest income 1,000,000 603,699 946,567 342,868
Total Investment Income 1,000,000 603,699 946,567 342,868
Miscellaneous 299,038 112,427 212,685 100,258
Total Revenues 117,848,217 211,696,739 116,338,914 (95,357,825)
Expenditures:
General Government:
Circuit Court:
Personnel costs 2,218,982 2,183,339 1,981,205 202,134
Operating 177,053 383,338 199,445 183,893
Totals 2,396,035 2,566,677 2,180,650 386,027
Office of State's Attorney:
Personnel costs 117,470 563,230 121,303 441,927
Operating - 1,764 1,764 -
Totals 117,470 564,994 123,067 441,927
Office of the County Executive:
Personnel costs 125,874 508,345 122,079 386,266
Operating 4,484 233,800 25,403 208,397
Totals 130,358 742,145 147,482 594,663
Intergovernmental Relations:
Operating 30,670 95,849 30,664 65,185
Totals 30,670 95,849 30,664 65,185
Community Engagement Cluster:
Personnel costs 71,042 143,048 66,287 76,761
Operating - 75,480 36,364 39,116
Totals 71,042 218,528 102,651 115,877
General Services:
Operating - 1,446,017 341,245 1,104,772
Totals - 1,446,017 341,245 1,104,772
Department of Technology Services:
Operating - 939,005 7,349 931,656
Totals - 939,005 7,349 931,656
Total General Government 2,745,575 6,573,215 2,933,108 3,640,107
Public Safety:
Department of Corrections and Rehabilitation:
Personnel costs - 15,955 - 15,955
Operating - 109,173 - 109,173
Totals - 125,128 - 125,128
(Continued)
Budget
139

MONTGOMERY COUNTY, MARYLANDSCHEDULE OF REVENUES, EXPENDITURES, AND CHANGES IN FUND BALANCE - BUDGET AND ACTUAL (NON-GAAP BUDGETARY BASIS)GRANTS SPECIAL REVENUE FUNDFOR THE FISCAL YEAR ENDED JUNE 30, 2015RSI-3 (Continued)
VarianceOriginal Final PositiveBudget Budget Actual (Negative)
Department of Fire and Rescue Services:
Personnel costs 917,155 1,645,395 1,505,834 139,561
Operating - 2,858,054 1,041,663 1,816,391
Totals 917,155 4,503,449 2,547,497 1,955,952
Department of Police:
Personnel costs 148,000 1,707,298 555,099 1,152,199
Operating 17,000 2,108,125 835,245 1,272,880
Totals 165,000 3,815,423 1,390,344 2,425,079
Office of the County Sheriff:
Personnel costs 603,931 1,513,625 692,000 821,625
Operating 188,069 780,132 204,415 575,717
Totals 792,000 2,293,757 896,415 1,397,342
Office of Emergency Management & Homeland Security:
Personnel costs 633,331 3,989,524 794,304 3,195,220
Operating - 10,934,857 6,189,338 4,745,519
Totals 633,331 14,924,381 6,983,642 7,940,739
Total Public Safety 2,507,486 25,662,138 11,817,898 13,844,240
Transportation:
Department of Transportation:
Personnel costs 1,763,781 8,568,970 1,428,345 7,140,625
Operating 2,948,765 5,430,869 3,833,969 1,596,900
Total Transportation 4,712,546 13,999,839 5,262,314 8,737,525
Economic Development:
Department of Economic Development:
Personnel costs - 1,558,573 - 1,558,573
Operating 2,842,854 5,138,924 3,788,009 1,350,915
Total Economic Development 2,842,854 6,697,497 3,788,009 2,909,488
Health and Human Services:
Department of Health and Human Services:
Personnel costs 43,251,605 57,544,648 44,472,463 13,072,185
Operating 33,750,328 60,538,460 40,981,062 19,557,398
Total Health and Human Services 77,001,933 118,083,108 85,453,525 32,629,583
Culture and Recreation:
Department of Libraries:
Personnel costs 40,290 40,290 40,290 -
Operating 12,000 49,707 12,625 37,082
Totals 52,290 89,997 52,915 37,082
Department of Recreation:
Personnel costs 69,157 82,713 19,857 62,856
Operating - 55,903 55,903 -
Totals 69,157 138,616 75,760 62,856
Total Culture and Recreation 121,447 228,613 128,675 99,938
Housing:
Department of Housing and Community Affairs:
Personnel costs 2,297,810 2,577,307 2,099,615 477,692
Operating 5,033,252 16,743,031 5,144,153 11,598,878
Total Housing 7,331,062 19,320,338 7,243,768 12,076,570
(Continued)
Budget
140

MONTGOMERY COUNTY, MARYLANDSCHEDULE OF REVENUES, EXPENDITURES, AND CHANGES IN FUND BALANCE - BUDGET AND ACTUAL (NON-GAAP BUDGETARY BASIS)GRANTS SPECIAL REVENUE FUNDFOR THE FISCAL YEAR ENDED JUNE 30, 2015RSI-3 (Concluded)
VarianceOriginal Final PositiveBudget Budget Actual (Negative)
Environment:
Department of Environmental Protection:
Personnel costs - 6,338 - 6,338
Operating - 119,650 24,181 95,469
Total Environmental Protection - 125,988 24,181 101,807
Department of Liquor Control:
Personnel costs - 21,525 13,586 7,939
Operating - 40,430 27,999 12,431
Total Liquor Control - 61,955 41,585 20,370
Nondepartmental:
NDA Historical Activities - Operating 585,314 - - -
NDA Future Grants - Operating 20,000,000 21,139,997 - 21,139,997
Total Nondepartmental 20,585,314 21,139,997 - 21,139,997
Total Expenditures 117,848,217 211,892,688 116,693,063 95,199,625
Excess of Revenues over (under)
Expenditures - (195,949) (354,149) (158,200)
Other Financing Sources (Uses):
Transfers In:
Restricted Donations Fund - - 216,033 216,033
Mass Transit Special Revenue Fund - 181,800 340,000 158,200
Fire Tax District Special Revenue Fund - 14,149 14,149 -
Total Transfers In - 195,949 570,182 374,233
Total Other Financing Sources (Uses) - 195,949 570,182 374,233
Excess of Revenues and Other Financing
Sources over (under) Expenditures
and Other Financing Uses - - 216,033 216,033
Fund Balance - Beginning of Year - - - -
Fund Balance - End of Year -$ -$ 216,033$ 216,033$
Reconciliation of Budgetary Schedule to GAAP basis Combining Statement of Revenues, Expenditures, and Changes in Fund Balances:
Expenditures & Other Financing Effect on
Revenues Encumbrances Sources (Uses) Fund Balance
As reported - budgetary basis 116,338,914$ 116,693,063$ 570,182$ 216,033$
Reconciling items:
Loan expenditures (2,992,462) (2,992,462) - -
Indirect costs (965,742) (965,742) - -
Pass-through expenditures (4,659,531) (4,659,531) - -
As reported - GAAP basis 107,721,179$ 108,075,328$ 570,182$ 216,033$
Grants Fund prior year carryover includes: a) re-appropriation of encumbered appropriations, and b) revenues under grants that require more than one fiscal year to complete the grant program.
Budget
141

RSI-4
REQUIRED SUPPLEMENTARY INFORMATION
CONSOLIDATED RETIREE HEALTH BENEFITS TRUST
The following required supplementary information is intended to help users assess the system’s funding status on a going-concern basis, assess progress made in accumulating assets to pay benefits when due, and make comparisons among employers.
SCHEDULE OF FUNDING PROGRESS
Actuarial UAAL as a Actuarial Accrued Unfunded percentage of
Actuarial Value of Liability AAL Funded Covered Covered Valuation Assets (AAL) (UAAL) Ratio Payroll Payroll
Date (a) (b) (b-a) (a/b) (c) ((b-a)/c)
6/30/2012 $ 92,610,000 $ 1,403,693,000 $ 1,311,083,000 6.6 % $ 618,227,000 212.1 %6/30/2013 153,327,000 1,093,214,000 939,887,000 14.0 636,774,000 147.6 6/30/2014 239,399,000 1,241,304,000 1,001,905,000 19.3 649,659,000 154.2
Analysis of the dollar amounts of plan net assets, actuarial accrued liability, and unfunded actuarial liability in isolation can be misleading. Expressing the assets as a percentage of the actuarial accrued liability provides one indication of the system’s funding status on a going-concern basis. Analysis of the percentage over time indicates whether the system is becoming financially stronger or weaker. Generally, the greater this percentage, the stronger the system. Trends in the unfunded actuarial accrued liability and annual covered payroll are both affected by inflation. Expressing the unfunded accrued liability as a percentage of annual covered payroll approximately adjusts for the effects of inflation and aids analysis of the system’s progress made in accumulating sufficient assets to pay benefits when due. Generally, the smaller this percentage, the stronger the system.
SCHEDULE OF EMPLOYER AND OTHER CONTRIBUTING ENTITIES CONTRIBUTIONS
Annual Percentage Contributed Fiscal Year Required Other Contributing Net OPEB
Ended June 30 Contributions Employers Entities Obligation
2010 $ 107,397,000 37.5 % 2.1 % $ 180,712,589 2011 147,582,000 28.7 1.1 287,497,491 2012 147,327,000 44.4 1.6 380,693,810 2013 123,152,000 71.8 1.7 429,058,044 2014 103,418,000 103.1 1.5 425,820,958 2015 107,096,000 85.4 1.8 440,459,637
142

RSI-5
REQUIRED SUPPLEMENTARY INFORMATION
EMPLOYEES’ RETIREMENT SYSTEM
SCHEDULE OF COUNTY’S PROPORTIONATE SHARE OF THE NET PENSION LIABILITY LAST 10 FISCAL YEARS
County's Proportion County's Plan Fiduciary Measurement Date % of Net Share of the Share of the Net Pension Covered- Net Position as a
Fiscal Year Pension Net Pension Liability as a % of its Employee % of Total Ending June 30 Liability Liability Covered-Employee Payroll Payroll Pension Liability
2014 97.79 % $ 298,751,284 75.83 % $ 393,995,026 92.28 %
SCHEDULE OF COUNTY CONTRIBUTIONS LAST 10 FISCAL YEARS
Contributions in County's Contribution Measurement Date Contractually Relation to Contribution Covered- as a % of
Fiscal Year Required Contractually Deficiency Employee Covered-EmployeeEnding June 30 Contribution Required Contribution (Excess) Payroll Payroll
2014 $ 141,511,591 $ 141,511,591 $ - $ 393,995,026 35.92 %
These two Schedules are intended to show information for 10 years. Additional years will be displayed as they become available.
143

RSI-6
REQUIRED SUPPLEMENTARY INFORMATION
MARYLAND STATE RETIREMENT AND PENSION SYSTEM
SCHEDULE OF COUNTY’S PROPORTIONATE SHARE OF THE NET PENSION LIABILITY LAST 10 FISCAL YEARS
County's Proportion Plan Fiduciary Share of the Net County's Net Position as
Measurement Date % of Net Share of the Pension Liability as Covered- a % of Total Fiscal Year Pension Net Pension a % of its Covered- Employee Pension
Ending June 30 Liability Liability Employee Payroll Payroll Liability
2014 0.1007416899595518197 % $ 17,878,357 276.62 % $ 6,463,239 71.87 %
SCHEDULE OF COUNTY CONTRIBUTIONS LAST 10 FISCAL YEARS
Contributions in County's Contribution Measurement Date Contractually Relation to Contribution Covered- as a % of
Fiscal Year Required Contractually Deficiency Employee Covered-EmployeeEnding June 30 Contribution Required Contribution (excess) Payroll Payroll
2014 $ 2,347,645 $ 2,347,645 $ - $ 6,463,239 36.32 %
These two Schedules are intended to show information for 10 years. Additional years will be displayed as they become available.
144
NOTES TO REQUIRED SUPPLEMENTARY INFORMATION
Budgetary Information
Overview
Annual appropriated operating budgets are adopted for the General Fund, Debt Service Fund, substantially all Special Revenue Funds (except for the Agricultural Transfer Tax Fund), Enterprise Funds, the Liability and Property Coverage Self-Insurance Internal Service Fund, and the Employee Health Benefits Self-Insurance Internal Service Fund. The Capital Projects Fund budget is appropriated at the project level on a biennial basis. All unencumbered appropriations lapse at year-end except for those related to Federal and State grants and the Capital Projects Fund.
Encumbrance accounting is employed for budgetary purposes in the governmental and proprietary funds. Encumbrances (purchase orders and contracts awarded for which goods and services have not been received at year-end), and other commitments for the expenditure of funds are recorded in order to preserve that portion of the appropriation. In the governmental funds for GAAP purposes, outstanding encumbrances are reported as restricted, committed, or assigned category of fund balance because they do not constitute expenditures or liabilities. In the proprietary funds, encumbrances are eliminated for GAAP financial statement presentation since neither goods nor services have been provided. For GAAP purposes, all encumbrances are charged to expenditures/expenses in the period in which goods or services are received.
Approval
Pursuant to the Montgomery County Charter, the Capital Improvements Program (CIP) is presented to the County Council by January 15 in even numbered years. An Amended CIP is presented to the County Council by January 15 in odd numbered years. The annual capital budget, with the CIP or Amended CIP, is presented to the County Council by January 15 of every year, and the operating budget is presented to the County Council by March 15 of every year. The County Council holds public hearings and, pursuant to the County Charter, an annual appropriation resolution must be passed by the County Council by June 1. This resolution becomes effective for the one-year period beginning the following July 1. For the operating budget, the annual resolution provides the spending authority at the department level in two major categories (personnel costs and operating expenses) with the unencumbered appropriation authority expiring the following June 30. Encumbered appropriations are reappropriated and carried forward to the subsequent fiscal year. Encumbrances are reported as a restricted or committed component of the current fiscal year's fund balance. The annual budget must be consistent with the six-year program for public services and fiscal policy. Multi-year planning provides a framework to make informed decisions about the levels of public services and project the impact of what may happen as a result of current decisions and policies. For the capital projects budget, the annual resolution provides spending authority at the project level. The unencumbered appropriation of the CIP budget is reappropriated in the following year's budget unless specifically closed out by County Council action.
The County Executive has authority to transfer appropriations within departments up to 10 percent of the original appropriation. Transfers between departments are also limited to 10 percent of original appropriation and require County Council action. During the operating year the County Council may adopt a supplemental appropriation if recommended by the County Executive and after holding a public hearing. Supplemental appropriations enacted during the first half of the fiscal year require: five Councilmember votes if they are to avail the County of, or put into effect the provision of Federal, State, or local legislation or regulation or six Councilmember votes for any other purpose. During the operating year the County Council may also adopt, with six Councilmember votes, special appropriations to meet an unforeseen disaster or other emergency or to act without delay in the public interest. Special appropriations require only public notice by news release. During FY15, the County Council
145
increased the operating budget for all funds through supplemental and special appropriations by $34.2 million. In addition, supplemental appropriations increased the CIP budget by $44.6 million.
Presentation
The basis used to prepare the legally adopted budget is different from GAAP in a number of ways, including the following:
Encumbrances outstanding are charged to budgetary appropriations and considered expenditures of the current period; any cancellations of such encumbrances in a subsequent year are classified with miscellaneous revenue for budgetary purposes.
Certain interfund revenues/expenditures are classified as transfers for budget purposes.
Fund budgets do not include depreciation and bad debts, however they do include debt service payments and capital outlay.
Mortgages and loans made and related repayments are generally accounted for as expenditures/other financial uses and revenues/other financing sources, respectively.
Proceeds under certain capital lease financing are not budgeted.
Certain activity is not budgeted by the County, since it is included in the budget of a component unit that is legally adopted by the County Council, such as certain pass-through expenditures, and bond proceeds and related transfers to MCPS and MCC.
(Rest of page intentionally left blank.)
146

SUPPLEMENTARY DATA
147

148

NONMAJOR GOVERNMENTAL FUNDS
Special Revenue Funds Special revenue funds are used to account for specific revenues that are legally restricted to expenditure for particular purposes.
Special Taxing Districts:
Recreation Accounts for the fiscal activity relating to providing recreational services throughout the County, except for certain cities and towns that provide their own recreational services.
Fire Tax District Accounts for the fiscal activities related to providing fire and rescue services throughout the County. To a great extent, tax revenues are distributed to independent fire and rescue corporations that provide these services.
Mass Transit Facilities Accounts for the fiscal activities of planning, developing, and financing transit facilities within the County-wide Mass Transit District.
Urban Districts Bethesda; Silver Spring; Wheaton: Accounts for the fiscal activity related to the maintenance and enhancement of the business districts of these communities.
Rehabilitation Loan Accounts for loans to homeowners of eligible income to finance rehabilitation required to make their homes conform to applicable Montgomery County Code requirements.
Economic Development Accounts for the economic development programs of the County, comprised of loans and grants, which are designed to assist private employers who are located or plan to locate or substantially expand operations in the County.
Cable TV Accounts for the franchise fee and gross receipts revenues and the administration of cable television activities in the County.
Other:
Agricultural Transfer Tax Accounts for agricultural transfer tax revenues to be used for an approved agricultural land preservation program.
Drug Enforcement Forfeitures Accounts for the fiscal activity of cash and other property forfeited to the County during drug enforcement operations. These resources are used for law enforcement and public education programs.
Water Quality Protection Accounts for the fiscal activity relating to maintenance of certain storm water management facilities.
Restricted Donations Accounts for donations and contributions received by the County that are restricted for use in specific County programs.
149

MAJOR GOVERNMENTAL FUNDS
This section also includes budget-to-actual schedules for the following major governmental funds:
DEBT SERVICE
CAPITAL PROJECTS
150

MONTGOMERY COUNTY, MARYLANDCOMBINING BALANCE SHEETNONMAJOR GOVERNMENTAL FUNDS JUNE 30, 2015Exhibit B-1
Total Special NonmajorTaxing Rehabilitation Economic Cable Governmental
Districts Loan Development TV Other Total
ASSETS
Equity in pooled cash and investments 38,204,579$ 1,819,144$ 2,259,914$ 5,709,248$ 23,549,883$ 71,542,768$
Cash 12,750 - - - 25,000 37,750
Receivables (net of allowances for uncollectibles):
Property taxes 4,261,998 - - - - 4,261,998
Accounts 3,398,361 - - 6,074,445 1,834,614 11,307,420
Notes - - 693,740 - - 693,740
Mortgages - 2,810,263 - - - 2,810,263
Parking violations 313,720 - - - - 313,720
Due from other funds 1,484,577 - - - - 1,484,577
Due from other governments 17,234,314 - - - - 17,234,314
Due from other component units 419,333 - - - - 419,333
Total Assets 65,329,632$ 4,629,407$ 2,953,654$ 11,783,693$ 25,409,497$ 110,105,883$
LIABILITIES, DEFERRED INFLOWS OF RESOURCES, AND FUND BALANCES
Liabilities:
Accounts payable 1,883,619$ -$ -$ 346,069$ 1,377,710$ 3,607,398$
Retainage payable - - - - 68,916 68,916
Accrued liabilities 10,824,876 - 5,015 1,347,595 876,436 13,053,922
Deposits - - - 164,125 - 164,125
Due to other funds 4,380,010 - 875 49,208 65,271 4,495,364
Due to component units 144,715 - - - - 144,715
Due to other governments 72,191 - - 37,970 141,011 251,172
Unearned revenue 1,476 - - - - 1,476
Total Liabilities 17,306,887 - 5,890 1,944,967 2,529,344 21,787,088
Deferred Inflows of Resources:
Unavailable property taxes 3,927,856 - - - 1,834,614 5,762,470
Unavailable revenue 965,333 - - - - 965,333
Total Deferred Inflows of Resources 4,893,189 - - - 1,834,614 6,727,803
Fund Balances:
Restricted 43,253,399 4,629,407 2,947,764 9,838,726 21,045,539 81,714,835
Unassigned (123,843) - - - - (123,843)
Total Fund Balances 43,129,556 4,629,407 2,947,764 9,838,726 21,045,539 81,590,992
Total Liabilities, Deferred Inflows of Resources, and Fund Balances 65,329,632$ 4,629,407$ 2,953,654$ 11,783,693$ 25,409,497$ 110,105,883$
151
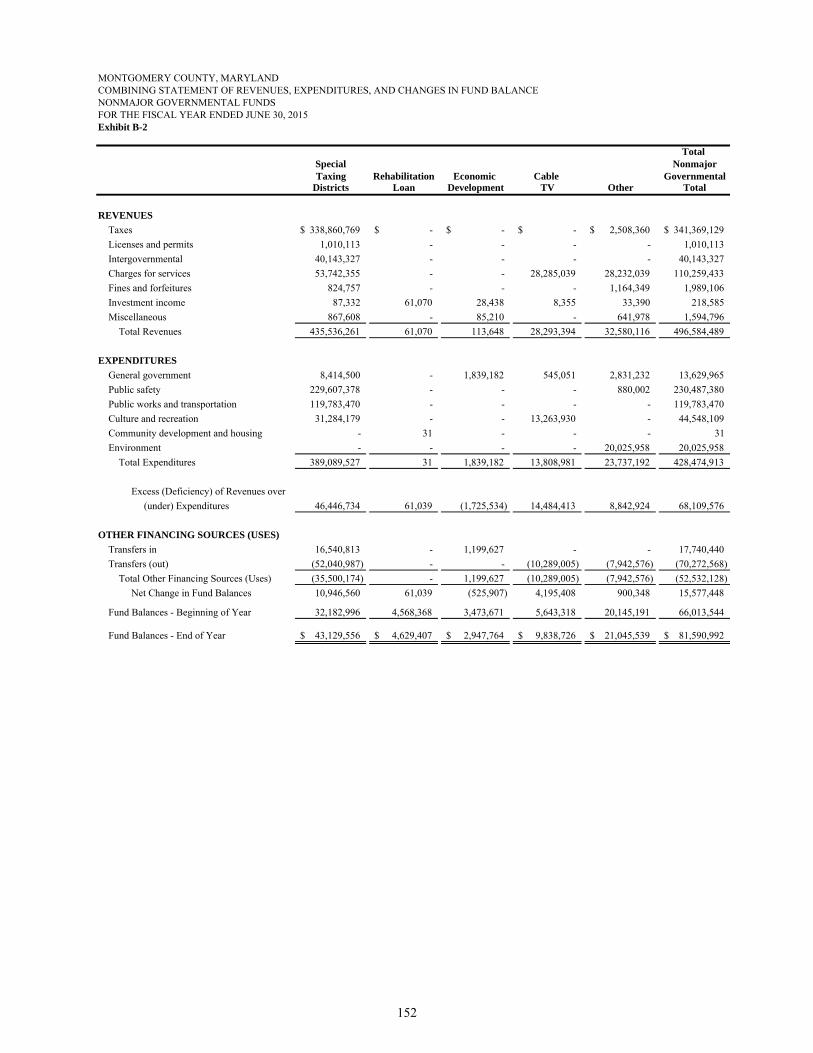
MONTGOMERY COUNTY, MARYLANDCOMBINING STATEMENT OF REVENUES, EXPENDITURES, AND CHANGES IN FUND BALANCENONMAJOR GOVERNMENTAL FUNDS FOR THE FISCAL YEAR ENDED JUNE 30, 2015Exhibit B-2
Total Special NonmajorTaxing Rehabilitation Economic Cable Governmental
Districts Loan Development TV Other Total
REVENUES
Taxes 338,860,769$ -$ -$ -$ 2,508,360$ 341,369,129$
Licenses and permits 1,010,113 - - - - 1,010,113
Intergovernmental 40,143,327 - - - - 40,143,327
Charges for services 53,742,355 - - 28,285,039 28,232,039 110,259,433
Fines and forfeitures 824,757 - - - 1,164,349 1,989,106
Investment income 87,332 61,070 28,438 8,355 33,390 218,585
Miscellaneous 867,608 - 85,210 - 641,978 1,594,796
Total Revenues 435,536,261 61,070 113,648 28,293,394 32,580,116 496,584,489
EXPENDITURES
General government 8,414,500 - 1,839,182 545,051 2,831,232 13,629,965
Public safety 229,607,378 - - - 880,002 230,487,380
Public works and transportation 119,783,470 - - - - 119,783,470
Culture and recreation 31,284,179 - - 13,263,930 - 44,548,109
Community development and housing - 31 - - - 31
Environment - - - - 20,025,958 20,025,958
Total Expenditures 389,089,527 31 1,839,182 13,808,981 23,737,192 428,474,913
Excess (Deficiency) of Revenues over
(under) Expenditures 46,446,734 61,039 (1,725,534) 14,484,413 8,842,924 68,109,576
OTHER FINANCING SOURCES (USES)
Transfers in 16,540,813 - 1,199,627 - - 17,740,440
Transfers (out) (52,040,987) - - (10,289,005) (7,942,576) (70,272,568)
Total Other Financing Sources (Uses) (35,500,174) - 1,199,627 (10,289,005) (7,942,576) (52,532,128)
Net Change in Fund Balances 10,946,560 61,039 (525,907) 4,195,408 900,348 15,577,448
Fund Balances - Beginning of Year 32,182,996 4,568,368 3,473,671 5,643,318 20,145,191 66,013,544
Fund Balances - End of Year 43,129,556$ 4,629,407$ 2,947,764$ 9,838,726$ 21,045,539$ 81,590,992$
152

MONTGOMERY COUNTY, MARYLANDCOMBINING BALANCE SHEETNONMAJOR GOVERNMENTAL FUNDS - SPECIAL TAXING DISTRICTSJUNE 30, 2015Exhibit B-3
Fire Tax Mass Transit Urban Recreation District Facilities Districts Total
ASSETS
Equity in pooled cash and investments 1,416,157$ 35,603,120$ 207,142$ 978,160$ 38,204,579$
Cash 5,750 5,000 2,000 - 12,750
Receivables (net of allowances for uncollectibles):
Property taxes 388,838 2,755,124 1,031,145 86,891 4,261,998
Accounts 58,337 2,296,339 984,437 59,248 3,398,361
Mortgages - - - - -
Parking violations - - 313,720 - 313,720
Due from other funds 310,000 - 1,174,577 - 1,484,577
Due from other governments - - 17,222,632 11,682 17,234,314
Due from component units - - 419,333 - 419,333
Total Assets 2,179,082$ 40,659,583$ 21,354,986$ 1,135,981$ 65,329,632$
LIABILITIES, DEFERRED INFLOWS OF RESOURCES, AND FUND BALANCES
Liabilities:
Accounts payable 355,331$ 608,013$ 856,597$ 63,678$ 1,883,619$
Accrued liabilities 1,334,820 6,556,765 2,817,251 116,040 10,824,876
Due to other funds 171,363 3,345,660 807,513 55,474 4,380,010
Due to component units 16,803 - 127,912 - 144,715
Due to other governments 71,017 1,174 - - 72,191
Unearned revenue - - 1,476 - 1,476
Total Liabilities 1,949,334 10,511,612 4,610,749 235,192 17,306,887
Deferred Inflows of Resources:
Unavailable property taxes 353,591 2,526,325 961,651 86,289 3,927,856
Unavailable service revenues - 965,333 - - 965,333
Total Deferred Inflows of Resources 353,591 3,491,658 961,651 86,289 4,893,189
Fund Balances:
Restricted - 26,656,313 15,782,586 814,500 43,253,399
Unassigned (123,843) - - - (123,843)
Total Fund Balances (123,843) 26,656,313 15,782,586 814,500 43,129,556
Total Liabilities, Deferred Inflows of Resources, and Fund Balances 2,179,082$ 40,659,583$ 21,354,986$ 1,135,981$ 65,329,632$
153

MONTGOMERY COUNTY, MARYLANDCOMBINING STATEMENT OF REVENUES, EXPENDITURES, AND CHANGES IN FUND BALANCENONMAJOR GOVERNMENTAL FUNDS - SPECIAL TAXING DISTRICTSFOR THE FISCAL YEAR ENDED JUNE 30, 2015Exhibit B-4
Fire Tax Mass Transit Urban Recreation District Facilities Districts Total
REVENUES
Taxes 34,586,397$ 233,983,584$ 68,879,641$ 1,411,147$ 338,860,769$
Licenses and permits - 454,350 555,763 - 1,010,113
Intergovernmental - 1,526,354 38,616,973 - 40,143,327
Charges for services 9,996,051 17,682,946 25,859,474 203,884 53,742,355
Fines and forfeitures - - 824,757 - 824,757
Investment income 11,567 75,192 - 573 87,332
Miscellaneous 190,182 409,936 267,490 - 867,608
Total Revenues 44,784,197 254,132,362 135,004,098 1,615,604 435,536,261
EXPENDITURES
General government - - - 8,414,500 8,414,500
Public safety - 229,607,378 - - 229,607,378
Public works and transportation - - 119,783,470 - 119,783,470
Culture and recreation 31,284,179 - - - 31,284,179
Total Expenditures 31,284,179 229,607,378 119,783,470 8,414,500 389,089,527
Excess (Deficiency) of Revenues over
(under) Expenditures 13,500,018 24,524,984 15,220,628 (6,798,896) 46,446,734
OTHER FINANCING SOURCES (USES)
Transfers in 1,118,518 250,000 8,331,010 6,841,285 16,540,813
Transfers (out) (14,012,824) (11,007,441) (26,347,757) (672,965) (52,040,987)
Total Other Financing Sources (Uses) (12,894,306) (10,757,441) (18,016,747) 6,168,320 (35,500,174)
Net Change in Fund Balances 605,712 13,767,543 (2,796,119) (630,576) 10,946,560
Fund Balances - Beginning of Year (729,555) 12,888,770 18,578,705 1,445,076 32,182,996
Fund Balances - End of Year (123,843)$ 26,656,313$ 15,782,586$ 814,500$ 43,129,556$
154
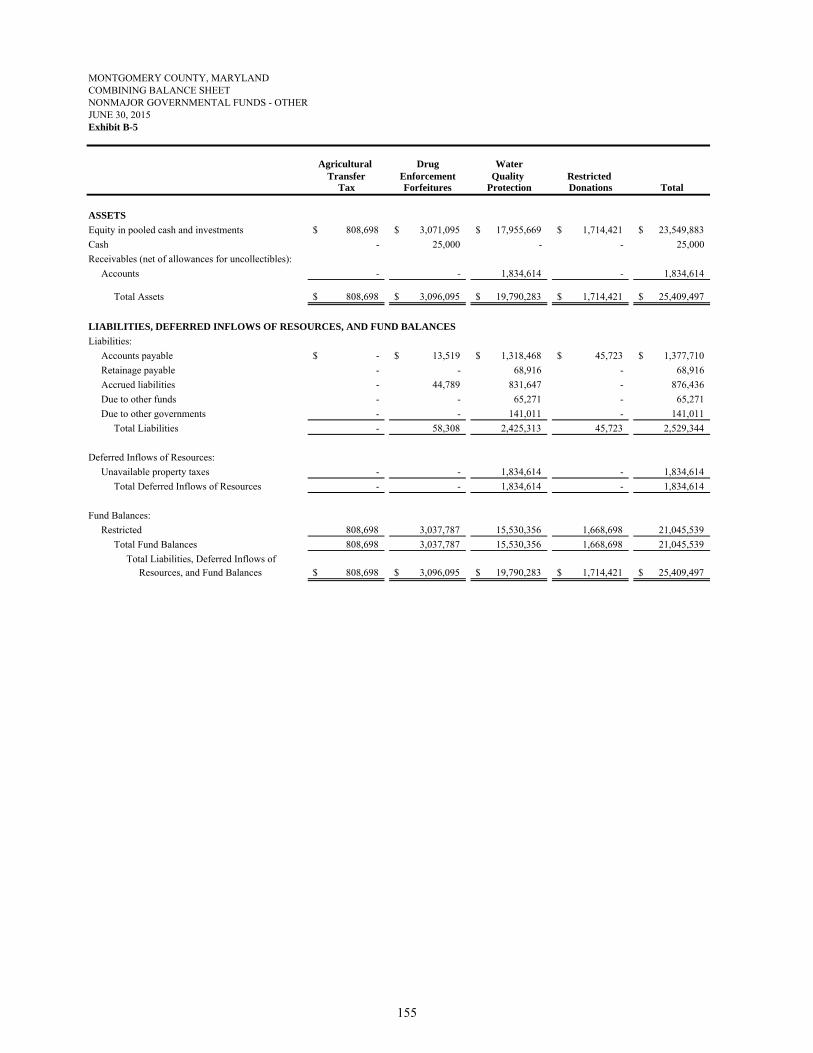
MONTGOMERY COUNTY, MARYLANDCOMBINING BALANCE SHEETNONMAJOR GOVERNMENTAL FUNDS - OTHERJUNE 30, 2015Exhibit B-5
Agricultural Drug WaterTransfer Enforcement Quality Restricted
Tax Forfeitures Protection Donations Total
ASSETS
Equity in pooled cash and investments 808,698$ 3,071,095$ 17,955,669$ 1,714,421$ 23,549,883$
Cash - 25,000 - - 25,000
Receivables (net of allowances for uncollectibles):
Accounts - - 1,834,614 - 1,834,614
Total Assets 808,698$ 3,096,095$ 19,790,283$ 1,714,421$ 25,409,497$
LIABILITIES, DEFERRED INFLOWS OF RESOURCES, AND FUND BALANCES
Liabilities:
Accounts payable -$ 13,519$ 1,318,468$ 45,723$ 1,377,710$
Retainage payable - - 68,916 - 68,916
Accrued liabilities - 44,789 831,647 - 876,436
Due to other funds - - 65,271 - 65,271
Due to other governments - - 141,011 - 141,011
Total Liabilities - 58,308 2,425,313 45,723 2,529,344
Deferred Inflows of Resources:
Unavailable property taxes - - 1,834,614 - 1,834,614
Total Deferred Inflows of Resources - - 1,834,614 - 1,834,614
Fund Balances:
Restricted 808,698 3,037,787 15,530,356 1,668,698 21,045,539
Total Fund Balances 808,698 3,037,787 15,530,356 1,668,698 21,045,539
Total Liabilities, Deferred Inflows of Resources, and Fund Balances 808,698$ 3,096,095$ 19,790,283$ 1,714,421$ 25,409,497$
155

MONTGOMERY COUNTY, MARYLANDCOMBINING STATEMENT OF REVENUES, EXPENDITURES, AND CHANGES IN FUND BALANCENONMAJOR GOVERNMENTAL FUNDS - OTHERFOR THE FISCAL YEAR ENDED JUNE 30, 2015Exhibit B-6
Agricultural Drug WaterTransfer Enforcement Quality Restricted
Tax Forfeitures Protection Donations Total
REVENUES
Taxes 22,819$ -$ 2,485,541$ -$ 2,508,360$
Charges for services - - 28,232,039 - 28,232,039
Fines and forfeitures - 1,164,349 - - 1,164,349
Investment income 1,338 3,839 28,213 - 33,390
Miscellaneous - - - 641,978 641,978
Total Revenues 24,157 1,168,188 30,745,793 641,978 32,580,116
EXPENDITURES
General government - - - 2,831,232 2,831,232
Public safety - 880,002 - - 880,002
Environment 9,128 - 20,016,830 - 20,025,958
Total Expenditures 9,128 880,002 20,016,830 2,831,232 23,737,192
Excess (Deficiency) of Revenues over
(under) Expenditures 15,029 288,186 10,728,963 (2,189,254) 8,842,924
OTHER FINANCING SOURCES (USES)
Transfers (out) (231,042) - (7,495,501) (216,033) (7,942,576)
Total Other Financing Sources (Uses) (231,042) - (7,495,501) (216,033) (7,942,576)
Net Change in Fund Balances (216,013) 288,186 3,233,462 (2,405,287) 900,348
Fund Balances - Beginning of Year 1,024,711 2,749,601 12,296,894 4,073,985 20,145,191
Fund Balances - End of Year 808,698$ 3,037,787$ 15,530,356$ 1,668,698$ 21,045,539$
156

MONTGOMERY COUNTY, MARYLANDSCHEDULE OF REVENUES, EXPENDITURES, AND CHANGES IN FUND BALANCE - BUDGET AND ACTUAL (NON-GAAP BUDGETARY BASIS)DEBT SERVICE FUNDFOR THE FISCAL YEAR ENDED JUNE 30, 2015Exhibit B-7
VarianceOriginal PositiveBudget Final Actual (Negative)
Revenues:
Intergovermental 5,928,730$ 5,928,730$ 8,780,438$ 2,851,708$
Investment Income:
Pooled investment income - - 8,957 8,957
Other investment income - - 4,741 4,741
Total Investment Income - - 13,698 13,698
Miscellaneous - - 108,017 108,017
Total Revenues 5,928,730 5,928,730 8,902,153 2,973,423
Expenditures:
Operating:
Principal and Interest for General Obligation Bonds:
General county 47,398,490 47,398,490 46,989,995 408,495
Roads and Storm Drainage 68,437,830 68,437,830 67,396,632 1,041,198
Parks and Recreation 9,906,220 9,906,220 9,714,221 191,999
Public Schools 133,221,530 133,221,530 133,188,736 32,794
Community College 17,841,820 17,841,820 18,046,881 (205,061)
Public Housing 65,640 65,640 65,625 15
Recreation 9,758,720 9,758,720 9,338,662 420,058
Fire and Rescue 8,438,020 8,438,020 8,207,008 231,012
Mass Transit 11,046,940 11,046,940 11,836,166 (789,226)
Issuing costs 4,000,000 4,534,753 3,465,196 1,069,557
Bond anticipation note interest 1,000,000 1,000,000 309,535 690,465
Principal and interest on long-term equipment notes - 847,610 847,610 -
Principal and interest on Revenue Bonds 3,019,200 8,866,907 8,866,011 896
Long-term leases:
General Fund 14,847,130 14,847,130 12,529,866 2,317,264
Recreation 1,834,300 1,834,300 1,522,159 312,141
Montgomery Housing Initiative 7,196,010 7,196,010 7,261,579 (65,569)
Mass Transit 6,675,950 6,675,950 6,625,835 50,115
Fire and Rescue 4,221,600 4,221,600 3,741,600 480,000
Total Expenditures 348,909,400 356,139,470 349,953,317 6,186,153
Excess of Revenues over (under) Expenditures (342,980,670) (350,210,740) (341,051,164) 9,159,576
Other Financing Sources (Uses):
Transfers In (Out):
From General Fund 290,789,930 290,805,592 281,282,150 (9,523,442)
From Capital Projects Fund - - - -
From Special Revenue Funds:
Recreation 11,593,020 11,593,020 10,587,571 (1,005,449)
Mass Transit 17,722,890 17,722,890 14,704,479 (3,018,411)
Fire Tax District 12,659,620 13,491,568 10,173,485 (3,318,083)
Montgomery Housing Initiative 7,196,010 7,196,010 7,395,785 199,775
Water Quality Protection 3,019,200 3,019,200 3,011,877 (7,323)
Liquor Control Fund - 5,847,707 5,847,707 -
Total Other Financing Sources (Uses) 342,980,670 349,675,987 333,003,054 (16,672,933)
Excess of Revenues and Other Financing Sources over (under) Expenditures and Other Financing Uses - (534,753) (8,048,110) (7,513,357)
Fund Balance - Beginning of Year (9,737,533) (9,737,533) (9,737,533) -
Fund Balance - End of Year (9,737,533)$ (10,272,286)$ (17,785,643)$ (7,513,357)$ (Continued)
Budget
157

MONTGOMERY COUNTY, MARYLANDSCHEDULE OF REVENUES, EXPENDITURES, AND CHANGES IN FUND BALANCE - BUDGET AND ACTUAL (NON-GAAP BUDGETARY BASIS)DEBT SERVICE FUNDFOR THE FISCAL YEAR ENDED JUNE 30, 2015Exhibit B-7 (Concluded)
Reconciliation of budgetary schedule to GAAP basis Combining Statement of Revenues, Expenditures, and Changes in Fund Balances:
Expenditures and Other Financing Effect on
Revenues Encumbrances Sources (Uses) Fund Balance
As reported - budgetary basis 8,902,153$ 349,953,317$ 333,003,054$ (8,048,110)$
Reconciling items:
Payment to refunding bond escrow agent - - (429,855,226) (429,855,226)
Elimination of encumbrances outstanding - (468,470) - 468,470
Bond anticipation note activity - - (500,000,000) (500,000,000)
Premium on general obligation - - 18,150,223 18,150,223
Premium on general obligation refunding bonds - - 74,595,486 74,595,486
Lease revenue bond activity not required to be budgeted 3,481,613 3,481,613 - -
Issuing costs for: -
General obligation bonds - 1,425,000 - (1,425,000)
General obligation refunding bonds - 1,247,653 - (1,247,653)
Proceeds of:
General obligation bonds - - 500,000,000 500,000,000
General obligation refunding bonds - - 356,510,000 356,510,000
As reported - GAAP basis 12,383,766$ 355,639,113$ 352,403,537$ 9,148,190$
158

SCHEDULE OF REVENUES, EXPENDITURES, AND CHANGES IN FUND BALANCE - BUDGET AND ACTUAL (NON-GAAP BUDGETARY BASIS)
Exhibit B-8
VarianceOriginal Final PositiveBudget Budget Actual (Negative)
Revenues:Taxes 18,056,000$ 27,561,000$ 87,509,458$ 59,948,458$
Intergovernmental 39,255,000 39,642,000 20,886,364 (18,755,636)
Charges for services - - 745,347 745,347
Investment income:Pooled (1,794,000) (1,794,000) 298,462 2,092,462
Miscellaneous 9,495,000 10,495,000 1,640,987 (8,854,013)
Total Revenues 65,012,000 75,904,000 111,080,618 35,176,618
Expenditures - Capital Projects 703,599,874 770,770,069 981,223,545 (210,453,476)
Excess of Revenues over (under) Expenditures (638,587,874) (694,866,069) (870,142,927) (175,276,858)
Other Financing Sources (Uses):Transfers In 37,435,000 48,069,000 66,817,294 18,748,294
Transfers Out - - (10,392,257) (10,392,257)
Sale of property - - 2,070,265 2,070,265
Proceeds from issuance of general obligation bonds 226,792,000 259,146,000 - (259,146,000)
Proceeds from issuance of taxable limited obligation certificates 69,293,000 69,293,000 - (69,293,000)
Proceeds from bond anticipation notes - - 500,000,000 500,000,000
Proceeds from issuance of revenue bonds 39,315,000 39,315,000 - (39,315,000)
Premium on original issue debt - - 63,703,027 63,703,027
Proceeds from lease financing 21,837,000 31,559,000 17,897,176 (13,661,824)
Total Other Financing Sources (Uses) 394,672,000 447,382,000 640,095,505 192,713,505
Excess of Revenues and
Other Financing Sources over (under)
Expenditures and Other Financing Uses (243,915,874) (247,484,069) (230,047,422) 17,436,647
Fund Balance - Beginning of Year (557,525,342) (557,525,342) (557,525,342) -
Fund Balance - End of Year (801,441,216)$ (805,009,411)$ (787,572,764)$ 17,436,647$
Reconciliation of budgetary schedule to GAAP basis Statement of Revenues, Expenditures, and Changes in Fund Balances:
Expenditures and Other Financing Effect onRevenues Encumbrances Sources (Uses) Fund Balance
As reported - Budgetary basis 111,080,618$ 981,223,545$ 640,095,505$ (230,047,422)$
Reconciling Items:
Elimination of encumbrances outstanding - (424,539,966) - 424,539,966
As reported - GAAP Basis 111,080,618$ 556,683,579$ 640,095,505$ 194,492,544$
MONTGOMERY COUNTY, MARYLAND
CAPITAL PROJECTS FUNDFOR THE FISCAL YEAR ENDED JUNE 30, 2015
Budget
159
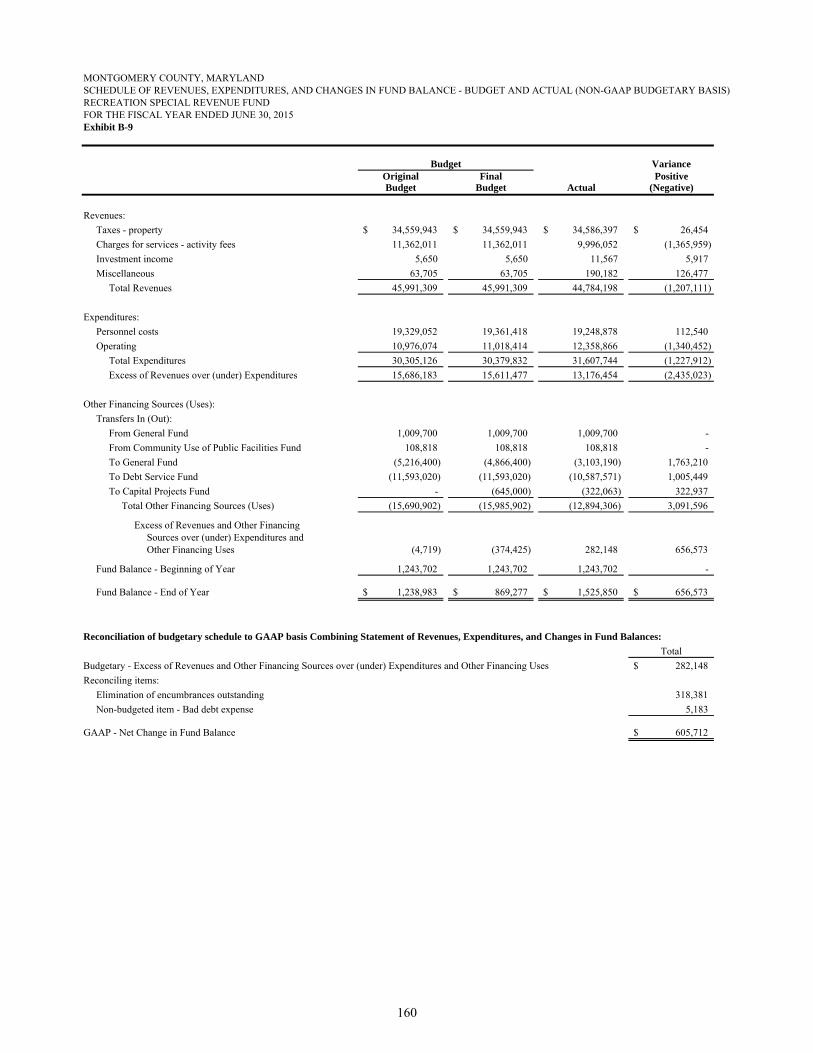
MONTGOMERY COUNTY, MARYLANDSCHEDULE OF REVENUES, EXPENDITURES, AND CHANGES IN FUND BALANCE - BUDGET AND ACTUAL (NON-GAAP BUDGETARY BASIS)RECREATION SPECIAL REVENUE FUNDFOR THE FISCAL YEAR ENDED JUNE 30, 2015Exhibit B-9
VarianceOriginal Final PositiveBudget Budget Actual (Negative)
Revenues:
Taxes - property 34,559,943$ 34,559,943$ 34,586,397$ 26,454$
Charges for services - activity fees 11,362,011 11,362,011 9,996,052 (1,365,959)
Investment income 5,650 5,650 11,567 5,917
Miscellaneous 63,705 63,705 190,182 126,477
Total Revenues 45,991,309 45,991,309 44,784,198 (1,207,111)
Expenditures:
Personnel costs 19,329,052 19,361,418 19,248,878 112,540
Operating 10,976,074 11,018,414 12,358,866 (1,340,452)
Total Expenditures 30,305,126 30,379,832 31,607,744 (1,227,912)
Excess of Revenues over (under) Expenditures 15,686,183 15,611,477 13,176,454 (2,435,023)
Other Financing Sources (Uses):
Transfers In (Out):
From General Fund 1,009,700 1,009,700 1,009,700 -
From Community Use of Public Facilities Fund 108,818 108,818 108,818 -
To General Fund (5,216,400) (4,866,400) (3,103,190) 1,763,210
To Debt Service Fund (11,593,020) (11,593,020) (10,587,571) 1,005,449
To Capital Projects Fund - (645,000) (322,063) 322,937
Total Other Financing Sources (Uses) (15,690,902) (15,985,902) (12,894,306) 3,091,596
Excess of Revenues and Other Financing Sources over (under) Expenditures and Other Financing Uses (4,719) (374,425) 282,148 656,573
Fund Balance - Beginning of Year 1,243,702 1,243,702 1,243,702 -
Fund Balance - End of Year 1,238,983$ 869,277$ 1,525,850$ 656,573$
Reconciliation of budgetary schedule to GAAP basis Combining Statement of Revenues, Expenditures, and Changes in Fund Balances:
Total
Budgetary - Excess of Revenues and Other Financing Sources over (under) Expenditures and Other Financing Uses 282,148$
Reconciling items:
Elimination of encumbrances outstanding 318,381
Non-budgeted item - Bad debt expense 5,183
GAAP - Net Change in Fund Balance 605,712$
Budget
160

MONTGOMERY COUNTY, MARYLANDSCHEDULE OF REVENUES, EXPENDITURES, AND CHANGES IN FUND BALANCE - BUDGET AND ACTUAL (NON-GAAP BUDGETARY BASIS)FIRE TAX DISTRICT SPECIAL REVENUE FUNDFOR THE FISCAL YEAR ENDED JUNE 30, 2015Exhibit B-10
VarianceOriginal Final PositiveBudget Budget Actual (Negative)
Revenues:
Taxes - property 234,329,822$ 234,329,822$ 233,983,584$ (346,238)$
Licenses and permits 600,000 600,000 454,350 (145,650)
Intergovernmental - 1,299,560 1,526,354 226,794
Charges for services 16,420,000 16,420,000 17,682,946 1,262,946
Investment income 27,440 27,440 75,192 47,752
Miscellaneous 10,000 10,000 409,936 399,936
Total Revenues 251,387,262 252,686,822 254,132,362 1,445,540
Expenditures:
Fire and Rescue Service
Personnel costs 184,354,732 186,439,613 186,439,611 2
Operating 39,947,649 51,520,343 51,520,335 8
Total Expenditures 224,302,381 237,959,956 237,959,946 10
Excess of Revenues over (under) Expenditures 27,084,881 14,726,866 16,172,416 1,445,550
Other Financing Sources (Uses):
Transfers In (Out):
From General Fund 1,450,000 250,000 250,000 -
To General Fund (120,750) (120,750) (120,750) -
To Debt Service Fund (12,659,620) (13,491,568) (10,173,485) 3,318,083
To Grants Fund - (14,149) (14,149) -
To Capital Projects Fund - (5,744,000) (699,057) 5,044,943
Total Other Financing Sources (Uses) (11,330,370) (19,120,467) (10,757,441) 8,363,026
Excess of Revenues and Other Financing Sources over (under) Expenditures and Other Financing Uses 15,754,511 (4,393,601) 5,414,975 9,808,576
Fund Balance - Beginning of Year 335,629 335,629 335,629 -
Fund Balance - End of Year 16,090,140$ (4,057,972)$ 5,750,604$ 9,808,576$
Reconciliation of budgetary schedule to GAAP basis Combining Statement of Revenues, Expenditures, and Changes in Fund Balances:
Total
Budgetary - Excess of Revenues and Other Financing Sources over (under) Expenditures and Other Financing Uses 5,414,975$
Reconciling items:
Non-budgeted item - Bad debt expense (947)
Elimination of encumbrances outstanding 8,353,515
GAAP - Net Change in Fund Balance 13,767,543$
Budget
161
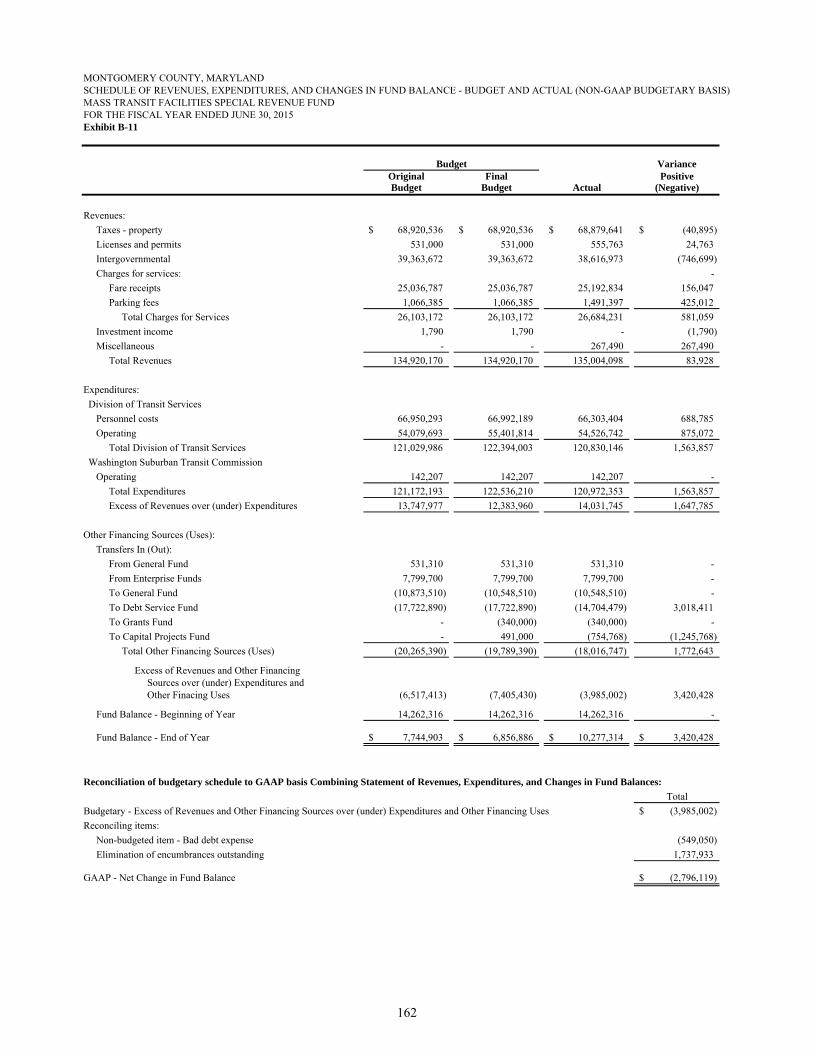
MONTGOMERY COUNTY, MARYLANDSCHEDULE OF REVENUES, EXPENDITURES, AND CHANGES IN FUND BALANCE - BUDGET AND ACTUAL (NON-GAAP BUDGETARY BASIS)MASS TRANSIT FACILITIES SPECIAL REVENUE FUNDFOR THE FISCAL YEAR ENDED JUNE 30, 2015Exhibit B-11
VarianceOriginal Final PositiveBudget Budget Actual (Negative)
Revenues:
Taxes - property 68,920,536$ 68,920,536$ 68,879,641$ (40,895)$
Licenses and permits 531,000 531,000 555,763 24,763
Intergovernmental 39,363,672 39,363,672 38,616,973 (746,699)
Charges for services: -
Fare receipts 25,036,787 25,036,787 25,192,834 156,047
Parking fees 1,066,385 1,066,385 1,491,397 425,012
Total Charges for Services 26,103,172 26,103,172 26,684,231 581,059
Investment income 1,790 1,790 - (1,790)
Miscellaneous - - 267,490 267,490
Total Revenues 134,920,170 134,920,170 135,004,098 83,928
Expenditures:
Division of Transit Services
Personnel costs 66,950,293 66,992,189 66,303,404 688,785
Operating 54,079,693 55,401,814 54,526,742 875,072
Total Division of Transit Services 121,029,986 122,394,003 120,830,146 1,563,857
Washington Suburban Transit Commission
Operating 142,207 142,207 142,207 -
Total Expenditures 121,172,193 122,536,210 120,972,353 1,563,857
Excess of Revenues over (under) Expenditures 13,747,977 12,383,960 14,031,745 1,647,785
Other Financing Sources (Uses):
Transfers In (Out):
From General Fund 531,310 531,310 531,310 -
From Enterprise Funds 7,799,700 7,799,700 7,799,700 -
To General Fund (10,873,510) (10,548,510) (10,548,510) -
To Debt Service Fund (17,722,890) (17,722,890) (14,704,479) 3,018,411
To Grants Fund - (340,000) (340,000) -
To Capital Projects Fund - 491,000 (754,768) (1,245,768)
Total Other Financing Sources (Uses) (20,265,390) (19,789,390) (18,016,747) 1,772,643
Excess of Revenues and Other Financing Sources over (under) Expenditures and Other Finacing Uses (6,517,413) (7,405,430) (3,985,002) 3,420,428
Fund Balance - Beginning of Year 14,262,316 14,262,316 14,262,316 -
Fund Balance - End of Year 7,744,903$ 6,856,886$ 10,277,314$ 3,420,428$
Reconciliation of budgetary schedule to GAAP basis Combining Statement of Revenues, Expenditures, and Changes in Fund Balances:
Total
Budgetary - Excess of Revenues and Other Financing Sources over (under) Expenditures and Other Financing Uses (3,985,002)$
Reconciling items:
Non-budgeted item - Bad debt expense (549,050)
Elimination of encumbrances outstanding 1,737,933
GAAP - Net Change in Fund Balance (2,796,119)$
Budget
162

MONTGOMERY COUNTY, MARYLANDSCHEDULE OF REVENUES, EXPENDITURES AND CHANGES IN FUND BALANCE - BUDGET AND ACTUAL (NON-GAAP BUDGETARY BASIS)URBAN DISTRICT SPECIAL REVENUE FUNDSFOR THE FISCAL YEAR ENDED JUNE 30, 2015Exhibit B-12
Variance Original Final Positive Budget Budget Actual (Negative)
BETHESDA URBAN DISTRICT
Revenues:
Taxes - property 480,406$ 480,406$ 524,070$ 43,664$
Charges for Services - maintenance fees 150,000 150,000 139,276 (10,724)
Total Revenues 630,406 630,406 663,346 32,940
Expenditures:
Personnel costs 131,760 131,760 125,972 5,788
Operating 3,586,621 3,588,735 3,551,363 37,372
Total Expenditures 3,718,381 3,720,495 3,677,335 43,160
Excess of Revenues over (under) Expenditures (3,087,975) (3,090,089) (3,013,989) 76,100
Other Financing Sources (Uses):
Transfers in (Out):
From Enterprise Funds 2,823,989 2,823,989 2,823,989 -
To General Fund (20,910) (20,910) (124,665) (103,755)
Total Other Financing Sources (Uses) 2,803,079 2,803,079 2,699,324 (103,755)
Excess of Revenues and Other Financing Sources over (under) Expenditures and
Other Financing Uses (284,896) (287,010) (314,665) (27,655)
Fund Balance - Beginning of Year 376,552 376,552 376,552 -
Fund Balance - End of Year 91,656$ 89,542$ 61,887$ (27,655)$
SILVER SPRING URBAN DISTRICT
Revenues:
Taxes - property 729,771$ 729,771$ 717,223$ (12,548)$
Charges for Services - maintenance fees 134,000 134,000 64,608 (69,392)
Total Revenues 863,771 863,771 781,831 (81,940)
Expenditures:
Personnel costs 2,217,059 2,217,059 2,151,315 65,744
Operating 991,920 1,269,400 1,182,824 86,576
Total Expenditures 3,208,979 3,486,459 3,334,139 152,320
Excess of Revenues over (under) Expenditures (2,345,208) (2,622,688) (2,552,308) 70,380
Other Financing Sources (Uses):
Transfers in (Out):
From Enterprise Funds 2,440,546 2,440,546 2,440,546 -
To General Fund (351,850) (351,850) (351,850) -
Total Other Financing Sources (Uses) 2,088,696 2,088,696 2,088,696 -
Excess of Revenues and Other Financing Sources over (under) Expenditures and
Other Financing Uses (256,512) (533,992) (463,612) 70,380
Fund Balance - Beginning of Year (984,043) (984,043) (984,043) -
Fund Balance - End of Year (1,240,555)$ (1,518,035)$ (1,447,655)$ 70,380$
(Continued)
Budget
163

MONTGOMERY COUNTY, MARYLANDSCHEDULE OF REVENUES, EXPENDITURES AND CHANGES IN FUND BALANCE - BUDGET AND ACTUAL (NON-GAAP BUDGETARY BASIS)URBAN DISTRICT SPECIAL REVENUE FUNDSFOR THE FISCAL YEAR ENDED JUNE 30, 2015Exhibit B-12 (Concluded)
Variance Original Final Positive Budget Budget Actual (Negative)
WHEATON URBAN DISTRICT
Revenues:
Taxes - property 164,449$ 164,449$ 169,854$ 5,405$
Investment income - - 573 573
Total Revenues 164,449 164,449 170,427 5,978
Expenditures:
Personnel costs 1,237,841 1,220,191 1,066,213 153,978
Operating 576,101 624,115 624,112 3
Total Expenditures 1,813,942 1,844,306 1,690,325 153,981
Excess of Revenues over (under) Expenditures (1,649,493) (1,679,857) (1,519,898) 159,959
Other Financing Sources (Uses):
Transfers in (Out):
From Enterprise Funds 1,576,750 1,576,750 1,576,750 -
To General Fund (196,450) (196,450) (196,450) -
Total Other Financing Sources (Uses) 1,380,300 1,380,300 1,380,300 -
Excess of Revenues and Other Financing Sources over (under) Expenditures and
Other Financing Uses (269,193) (299,557) (139,598) 159,959
Fund Balance - Beginning of Year 48,496 48,496 48,496 -
Fund Balance - End of Year (220,697)$ (251,061)$ (91,102)$ 159,959$
Reconciliation of budgetary schedule to GAAP basis Combining Statement of Revenues, Expenditures, and Changes in Fund Balances:
SilverBethesda Spring Wheaton Total
Budgetary - Excess of Revenues and Other Financing
Sources over (under) Expenditures and
Other Financing Uses (314,665)$ (463,612)$ (139,598)$ (917,875)$
Reconciling item:
Elimination of encumbrances outstanding 2,114 235,551 49,634 287,299
GAAP - Net Change in Fund Balance (312,551)$ (228,061)$ (89,964)$ (630,576)$
Budget
164

MONTGOMERY COUNTY, MARYLANDSCHEDULE OF REVENUES, EXPENDITURES, AND CHANGES IN FUND BALANCE - BUDGET AND ACTUAL (NON-GAAP BUDGETARY BASIS)REHABILITATION LOAN SPECIAL REVENUE FUNDFOR THE FISCAL YEAR ENDED JUNE 30, 2015Exhibit B-13
VarianceOriginal Final PositiveBudget Budget Actual (Negative)
Revenues:
Investment income
Pooled investment income -$ -$ 2,220$ 2,220$
Other investment income - - 58,850 58,850
Total Revenues - - 61,070 61,070
Expenditures:
Operating - - 31 (31)
Total Expenditures - - 31 (31)
Excess of Revenues over (under) Expenditures - - 61,039 61,039
Other Financing Sources (Uses):
Mortgage loans (1,207,753) (1,207,753) - 1,207,753
Total Other Financing Sources (Uses) (1,207,753) (1,207,753) - 1,207,753
Excess of Revenues and Other Financing Sources over (under) Expenditures and Other Financing Uses (1,207,753) (1,207,753) 61,039 1,268,792
Fund Balance - Beginning of Year 1,207,753 1,207,753 1,207,753 -
Fund Balance - End of Year -$ -$ 1,268,792$ 1,268,792$
Reconciliation of budgetary schedule to GAAP basis Combining Statement of Revenues, Expenditures, and Changes in Fund Balances:
Total
Budgetary - Excess of Revenues and Other Financing Sources over (under) Expenditures and Other Financing Uses 61,039$
GAAP - Net Change in Fund Balance 61,039$
Budget
165
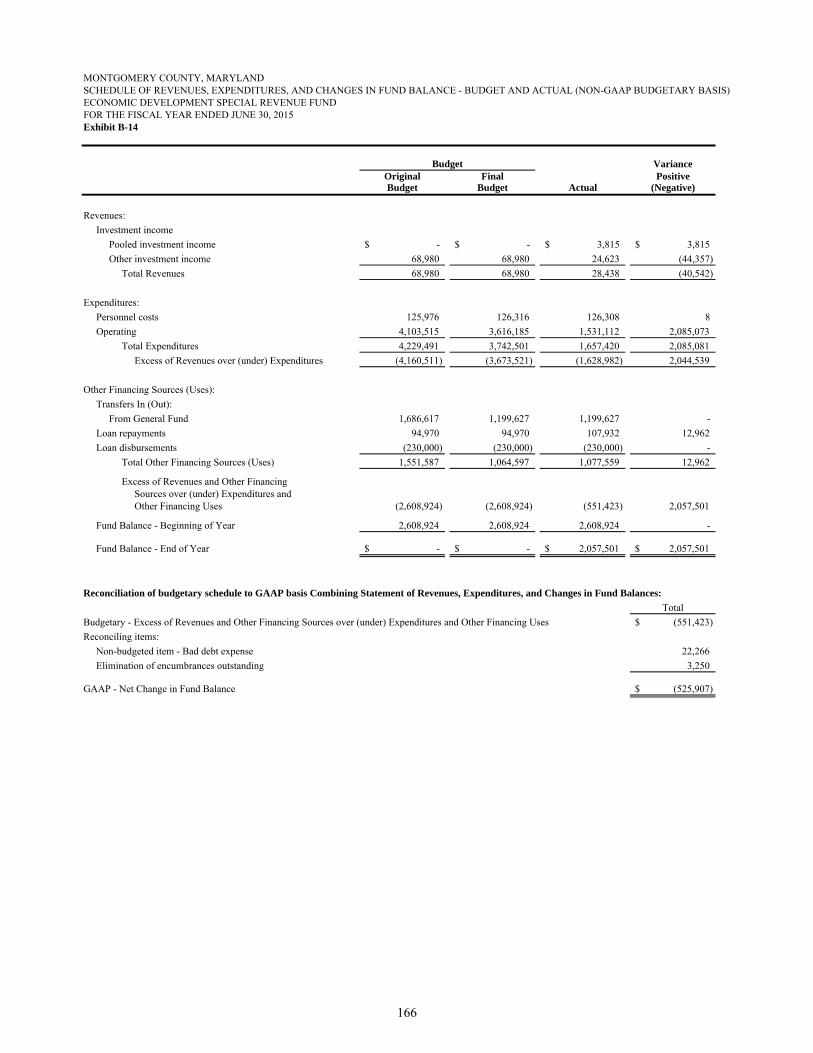
MONTGOMERY COUNTY, MARYLANDSCHEDULE OF REVENUES, EXPENDITURES, AND CHANGES IN FUND BALANCE - BUDGET AND ACTUAL (NON-GAAP BUDGETARY BASIS)ECONOMIC DEVELOPMENT SPECIAL REVENUE FUNDFOR THE FISCAL YEAR ENDED JUNE 30, 2015Exhibit B-14
VarianceOriginal Final PositiveBudget Budget Actual (Negative)
Revenues:
Investment income
Pooled investment income -$ -$ 3,815$ 3,815$
Other investment income 68,980 68,980 24,623 (44,357)
Total Revenues 68,980 68,980 28,438 (40,542)
Expenditures:
Personnel costs 125,976 126,316 126,308 8
Operating 4,103,515 3,616,185 1,531,112 2,085,073
Total Expenditures 4,229,491 3,742,501 1,657,420 2,085,081
Excess of Revenues over (under) Expenditures (4,160,511) (3,673,521) (1,628,982) 2,044,539
Other Financing Sources (Uses):
Transfers In (Out):
From General Fund 1,686,617 1,199,627 1,199,627 -
Loan repayments 94,970 94,970 107,932 12,962
Loan disbursements (230,000) (230,000) (230,000) -
Total Other Financing Sources (Uses) 1,551,587 1,064,597 1,077,559 12,962
Excess of Revenues and Other FinancingSources over (under) Expenditures andOther Financing Uses (2,608,924) (2,608,924) (551,423) 2,057,501
Fund Balance - Beginning of Year 2,608,924 2,608,924 2,608,924 -
Fund Balance - End of Year -$ -$ 2,057,501$ 2,057,501$
Reconciliation of budgetary schedule to GAAP basis Combining Statement of Revenues, Expenditures, and Changes in Fund Balances:
Total
Budgetary - Excess of Revenues and Other Financing Sources over (under) Expenditures and Other Financing Uses (551,423)$
Reconciling items:
Non-budgeted item - Bad debt expense 22,266
Elimination of encumbrances outstanding 3,250
GAAP - Net Change in Fund Balance (525,907)$
Budget
166

MONTGOMERY COUNTY, MARYLANDSCHEDULE OF REVENUES, EXPENDITURES, AND CHANGES IN FUND BALANCE - BUDGET AND ACTUAL (NON-GAAP BUDGETARY BASIS)CABLE TV SPECIAL REVENUE FUNDFOR THE FISCAL YEAR ENDED JUNE 30, 2015Exhibit B-15
VarianceOriginal Final PositiveBudget Budget Actual (Negative)
Revenues:
Fines and forfeitures 27,662,814$ 27,662,814$ 28,285,039$ 622,225$
Investment income - - 8,355 8,355
Total Revenues 27,662,814 27,662,814 28,293,394 630,580
Expenditures:
Personnel costs 3,651,390 3,561,766 3,428,006 133,760
Operating 11,054,595 12,160,159 12,130,595 29,564
Total Expenditures 14,705,985 15,721,925 15,558,601 163,324
Excess of Revenues over (under) Expenditures 12,956,829 11,940,889 12,734,793 793,904
Other Financing Sources (Uses):
Transfers In (Out):
To General Fund (8,389,025) (8,389,025) (8,389,025) -
To Capital Projects Fund - (3,748,000) (1,884,405) 1,863,595
To Motor Pool Fund - - (15,575) (15,575)
Total Other Financing Sources (Uses) (8,389,025) (12,137,025) (10,289,005) 1,848,020
Excess of Revenues and Other Financing Sources over (under) Expenditures and Other Financing Uses 4,567,804 (196,136) 2,445,788 2,641,924
Fund Balance - Beginning of Year 677,458 677,458 677,458 -
Fund Balance - End of Year 5,245,262$ 481,322$ 3,123,246$ 2,641,924$
Reconciliation of budgetary schedule to GAAP basis Combining Statement of Revenues, Expenditures, and Changes in Fund Balances:
Total
Budgetary - Excess of Revenues and Other Financing Sources over (under) Expenditures and Other Financing Uses 2,445,788$
Reconciling items:
Elimination of encumbrances outstanding 1,755,465
Non-budgeted item - Bad debt expense (5,845)
GAAP - Net Change in Fund Balance 4,195,408$
Budget
167

MONTGOMERY COUNTY, MARYLANDSCHEDULE OF REVENUES, EXPENDITURES, AND CHANGES IN FUND BALANCE - BUDGET AND ACTUAL (NON-GAAP BUDGETARY BASIS)DRUG ENFORCEMENT FORFEITURES SPECIAL REVENUE FUNDFOR THE FISCAL YEAR ENDED JUNE 30, 2015Exhibit B-16
VarianceOriginal Final PositiveBudget Budget Actual (Negative)
Revenues:
Fines and forfeitures -$ -$ 1,164,349$ 1,164,349$
Investment income - - 3,839 3,839
Total Revenues - - 1,168,188 1,168,188
Expenditures:
Operating - 2,749,601 1,217,390 1,532,211
Total Expenditures - 2,749,601 1,217,390 1,532,211
Excess of Revenues over (under) Expenditures - (2,749,601) (49,202) 2,700,399
Fund Balance - Beginning of Year 1,424,984 1,424,984 1,424,984 -
Fund Balance - End of Year 1,424,984$ (1,324,617)$ 1,375,782$ 2,700,399$
Reconciliation of budgetary schedule to GAAP basis Combining Statement of Revenues, Expenditures, and Changes in Fund Balances:
Total
Budgetary - Excess of Revenues and Other Financing Sources over (under) Expenditures and Other Financing Uses (49,202)$
Reconciling items:
Elimination of encumbrances outstanding 337,388
GAAP - Net Change in Fund Balance 288,186$
Budget
168

MONTGOMERY COUNTY, MARYLANDSCHEDULE OF REVENUES, EXPENDITURES, AND CHANGES IN FUND BALANCE - BUDGET AND ACTUAL (NON-GAAP BUDGETARY BASIS)WATER QUALITY PROTECTION SPECIAL REVENUE FUNDFOR THE FISCAL YEAR ENDED JUNE 30, 2015Exhibit B-17
VarianceOriginal Final PositiveBudget Budget Actual (Negative)
Revenues:
Taxes 2,150,000$ 2,150,000$ 2,485,541$ 335,541$
Charges for services 28,473,690 28,473,690 28,232,039 (241,651)
Investment income 8,540 8,540 28,213 19,673
Total Revenues 30,632,230 30,632,230 30,745,793 113,563
Expenditures:
Personnel costs 7,876,960 7,550,923 7,416,736 134,187
Operating 12,644,827 15,265,819 14,909,386 356,433
Total Expenditures 20,521,787 22,816,742 22,326,122 490,620
Excess of Revenues over (under) Expenditures 10,110,443 7,815,488 8,419,671 604,183
Other Financing Sources (Uses):
Transfers In (Out):
To General Fund (1,287,544) (1,287,544) (1,287,544) -
To Capital Projects Fund - (4,626,000) (3,196,080) 1,429,920
To Debt Service Fund (3,019,200) (3,019,200) (3,011,877) 7,323
Total Other Financing Sources (Uses) (4,306,744) (8,932,744) (7,495,501) 1,437,243
Excess of Revenues and Other Financing Sources over (under) Expenditures and Other Financing Uses 5,803,699 (1,117,256) 924,170 2,041,426
Fund Balance - Beginning of Year 3,518,581 3,518,581 3,518,581 -
Fund Balance - End of Year 9,322,280$ 2,401,325$ 4,442,751$ 2,041,426$
Reconciliation of budgetary schedule to GAAP basis Combining Statement of Revenues, Expenditures, and Changes in Fund Balances:
Total
Budgetary - Excess of Revenues and Other Financing Sources over (under) Expenditures and Other Financing Uses 924,170$
Reconciling items:
Elimination of encumbrances outstanding 2,309,292
GAAP - Net Change in Fund Balance 3,233,462$
Budget
169

MONTGOMERY COUNTY, MARYLANDSCHEDULE OF REVENUES, EXPENDITURES, AND CHANGES IN FUND BALANCE - BUDGET AND ACTUAL (NON-GAAP BUDGETARY BASIS)RESTRICTED DONATIONS SPECIAL REVENUE FUNDFOR THE FISCAL YEAR ENDED JUNE 30, 2015Exhibit B-18
VarianceOriginal Final PositiveBudget Budget Actual (Negative)
Revenues:
Miscellaneous - contributions -$ -$ 641,978$ 641,978$
Total Revenues - - 641,978 641,978
Expenditures:
Operating 3,880,787 3,880,787 2,862,820 1,017,967
Total Expenditures 3,880,787 3,880,787 2,862,820 1,017,967
Excess of Revenues over (under) Expenditures (3,880,787) (3,880,787) (2,220,842) 1,659,945
Other Financing Sources (Uses):
Transfers In (Out):
To Grants Fund - - (216,033) (216,033)
Total Other Financing Sources (Uses) - - (216,033) (216,033)
Excess of Revenues and Other Financing Sources over (under) Expenditures and Other Financing Uses (3,880,787) (3,880,787) (2,436,875) 1,443,912
Fund Balance - Beginning of Year 3,880,787 3,880,787 3,880,787 -
Fund Balance - End of Year -$ -$ 1,443,912$ 1,443,912$
Reconciliation of budgetary schedule to GAAP basis Combining Statement of Revenues, Expenditures, and Changes in Fund Balances:
Total
Budgetary - Excess of Revenues and Other Financing Sources over (under) Expenditures and Other Financing Uses (2,436,875)$
Reconciling items:
Elimination of encumbrances outstanding 61,588
Non-budgeted item - Bad debt expense (30,000)
GAAP - Net Change in Fund Balance (2,405,287)$
Budget
170

NONMAJOR ENTERPRISE FUNDS
Enterprise funds are used to account for operations where:
The activity is financed with debt that is secured solely by a pledge of the net revenues from fees and charges of the activity;
Laws or regulations require that the activity's costs of providing services, including capital costs, be recovered with fees and charges, rather than with taxes or similar revenues; or
The pricing policies of the activity establish fees and charges designed to recover its costs, including capital costs.
Permitting Services
Accounts for most of the fiscal activity of permitting programs within the County, such as building permits, construction code enforcement, flood plain management, land use compliance, plan review, sediment control, storm water management, well and septic regulatory services, fire code review, and public access construction.
Community Use of Public Facilities
Accounts for the fiscal activity related to renting public facilities to community organizations.
MAJOR ENTERPRISE FUNDS
This section also includes budget-to-actual schedules for the following major enterprise funds:
Liquor
Solid Waste Activities
Parking Lot Districts
171

172

MONTGOMERY COUNTY, MARYLANDCOMBINING STATEMENT OF NET POSITIONNONMAJOR ENTERPRISE FUNDSFOR THE FISCAL YEAR ENDED JUNE 30, 2015Exhibit C-1
Community TotalUse of Nonmajor
Permitting Public EnterpriseServices Facilities Funds
ASSETS
Current Assets:
Equity in pooled cash and investments 50,625,990$ 10,698,342$ 61,324,332$
Receivables (net of allowance for uncollectibles):
Accounts 167,029 41,998 209,027
Total Current Assets 50,793,019 10,740,340 61,533,359
Noncurrent Assets:
Capital Assets:
Furniture, fixtures, equipment, and machinery 2,302,654 49,423 2,352,077
Automobiles and trucks 342,136 - 342,136
Subtotal 2,644,790 49,423 2,694,213
Less: Accumulated depreciation 2,000,545 49,284 2,049,829
Total Capital Assets (net of accumulated depreciation) 644,245 139 644,384
Total Noncurrent Assets 644,245 139 644,384
Total Assets 51,437,264 10,740,479 62,177,743
DEFERRED OUTFLOWS OF RESOURCES
Pension deferrals 2,835,950 187,031 3,022,981
Total Deferred Outflows of Resources 2,835,950 187,031 3,022,981
LIABILITIES
Current Liabilities:
Accounts payable 99,386 14,331 113,717
Deposits 9,906,068 - 9,906,068
Accrued liabilities 2,313,111 274,043 2,587,154
Due to other funds 369,043 37,687 406,730
Due to component units - 784,870 784,870
Due to other governments - 206,308 206,308
Equipment notes payable 18,554 - 18,554
Unearned revenue 179,284 2,754,466 2,933,750
Total Current Liabilities 12,885,446 4,071,705 16,957,151
Noncurrent Liabilities:
Equipment note payable 37,756 - 37,756
Compensated absences 512,194 60,937 573,131
Net pension liability 5,636,425 407,553 6,043,978
Other postemployment benefits 1,260,848 159,078 1,419,926
Total Noncurrent Liabilities 7,447,223 627,568 8,074,791
Total Liabilities 20,332,669 4,699,273 25,031,942
DEFERRED INFLOWS OF RESOURCES
Pension deferrals 4,398,429 318,037 4,716,466
Total Deferred Inflows of Resources 4,398,429 318,037 4,716,466
NET POSITIONNet investment in capital assets 644,245 139 644,384 Unrestricted 28,897,871 5,910,061 34,807,932
Total Net Position 29,542,116$ 5,910,200$ 35,452,316$
173

MONTGOMERY COUNTY, MARYLANDCOMBINING STATEMENT OF REVENUES, EXPENSES, AND CHANGES IN NET POSITIONNONMAJOR ENTERPRISE FUNDSFOR THE FISCAL YEAR ENDED JUNE 30, 2015Exhibit C-2
Community TotalUse of Nonmajor
Permitting Public EnterpriseServices Facilities Funds
OPERATING REVENUES
Charges for services 1,911,017$ 11,133,118$ 13,044,135$
Licenses and permits 36,573,945 - 36,573,945
Fines and penalties 114,445 - 114,445
Total Operating Revenues 38,599,407 11,133,118 49,732,525
OPERATING EXPENSES
Personnel costs 21,565,786 2,485,837 24,051,623
Other post employment contributions 940,100 129,500 1,069,600
Postage 11,658 340 11,998
Insurance 306,250 - 306,250
Supplies and materials 363,454 232,562 596,016
Contractual services 1,971,712 4,214,502 6,186,214
Communications 278,604 65,443 344,047
Transportation 678,218 4,079 682,297
Public utility services - 1,916,754 1,916,754
Rentals 2,371,409 286,177 2,657,586
Maintenance 262,259 68,488 330,747
Depreciation 143,902 834 144,736
Other 60,466 34,532 94,998
Total Operating Expenses 28,953,818 9,439,048 38,392,866
Operating Income (Loss) 9,645,589 1,694,070 11,339,659
NONOPERATING REVENUES (EXPENSES)
Investment income 65,618 14,832 80,450
Interest expense (809) - (809)
Miscellaneous (3,356) - (3,356)
Other revenue (1,039) - (1,039)
Total Nonoperating Revenues (Expenses) 60,414 14,832 75,246
Income (Loss) Before Transfers 9,706,003 1,708,902 11,414,905
Transfers In (Out):
Transfers in - 25,000 25,000
Transfers out (4,090,186) (563,437) (4,653,623)
Total Transfers In (Out) (4,090,186) (538,437) (4,628,623)
Change in Net Position 5,615,817 1,170,465 6,786,282
Total Net Position - Beginning of Year, as restated 23,926,299 4,739,735 28,666,034
Total Net Position - End of Year 29,542,116$ 5,910,200$ 35,452,316$
174

MONTGOMERY COUNTY, MARYLANDCOMBINING STATEMENT OF CASH FLOWSNONMAJOR ENTERPRISE FUNDSFOR THE FISCAL YEAR ENDED JUNE 30, 2015Exhibit C-3
Community TotalUse of Nonmajor
Permitting Public EnterpriseServices Facilities Funds
CASH FLOWS FROM OPERATING ACTIVITIES
Receipts from customers 37,451,083$ 11,116,746$ 48,567,829$
Payments to suppliers (7,260,470) (7,235,156) (14,495,626)
Payments to employees (23,829,604) (2,569,577) (26,399,181)
Internal activity - operating payments from other funds 1,153,770 - 1,153,770
Other operating receipts 5,063,522 - 5,063,522
Other operating payments (4,665,998) - (4,665,998)
Miscellaneous (3,356) - (3,356)
Other revenue (1,039) - (1,039)
Net cash provided (Used) by Operating Activities 7,907,908 1,312,013 9,219,921
CASH FLOWS FROM NONCAPITAL FINANCING ACTIVITIES
Operating subsidies and transfers from other funds - 25,000 25,000
Operating subsidies and transfers to other funds (4,090,186) (563,437) (4,653,623)
Net cash provided (Used) by Noncapital Financing Activities (4,090,186) (538,437) (4,628,623)
CASH FLOWS FROM CAPITAL AND RELATED FINANCING ACTIVITIES
Interest paid on capital debt (809) - (809)
Net cash provided (Used) by Capital and Related Financing Activities (809) - (809)
CASH FLOWS FROM INVESTING ACTIVITIES
Investment income from pooled investments 65,618 14,832 80,450
Net cash provided (Used) by Investing Activities 65,618 14,832 80,450
Net Increase (Decrease) in Cash and Cash Equivalents 3,882,531 788,408 4,670,939
Balances - Beginning of Year 46,743,459 9,909,934 56,653,393
Balances - End of Year 50,625,990$ 10,698,342$ 61,324,332$
Reconciliation of operating income (loss) to net cash provided by operating activities:
Operating income (loss) 9,645,589$ 1,694,070$ 11,339,659$
Adjustments to reconcile operating income (loss) to net cash provided (used) by operating activities:
Depreciation and amortization 143,902 834 144,736
Other revenues (1,039) - (1,039)
Pension expense (2,213,024) (141,989) (2,355,013)
Miscellaneous (3,356) - (3,356)
Effect of changes in operating assets and liabilities:
Receivables, net (98,030) (16,372) (114,402)
Accounts payable and other liabilities 87,136 (237,473) (150,337)
Accrued expenses 346,730 12,943 359,673
Net Cash Provided (Used) by Operating Activities 7,907,908$ 1,312,013$ 9,219,921$
175

MONTGOMERY COUNTY, MARYLANDSCHEDULE OF EXPENSES - BUDGET AND ACTUAL (NON-GAAP BUDGETARY BASIS)ENTERPRISE FUNDSFOR THE FISCAL YEAR ENDED JUNE 30, 2015Exhibit C-4
VarianceOriginal Final PositiveBudget Budget Actual (Negative)
LIQUOR
Personnel costs 28,091,153$ 30,171,953$ 30,161,949$ 10,004$
Operating 28,177,588 21,413,399 19,174,833 2,238,566
Total 56,268,741$ 51,585,352$ 49,336,782 2,248,570$
Reconciliation to GAAP expenses:
Additions:
Depreciation 2,118,550
Cost of goods sold 199,491,617
Interest expense 1,884,215
Bad debt expense 171,693
Deductions:
Cash interest payments (2,090,538)
Pension expense (1,334,448)
Encumbrances outstanding at year-end (399,060)
GAAP Expenses 249,178,811$
PERMITTING SERVICES
Personnel costs 23,205,436$ 23,778,816$ 23,778,810$ 6$
Operating 8,802,400 9,116,692 8,213,726 902,966
Total 32,007,836$ 32,895,508$ 31,992,536 902,972$
Reconciliation to GAAP expenses:
Additions:
Depreciation 143,902
Deductions:
Equipment note principal reduction (18,342)
Pension expense (2,213,024)
Cash interest payments (809)
Capital outlay (131,697)
Encumbrances outstanding at year-end (818,748)
GAAP Expenses 28,953,818$
COMMUNITY USE OF PUBLIC FACILITIES
Personnel costs 2,651,686$ 2,670,949$ 2,627,826$ 43,123$
Operating 7,482,823 7,490,499 6,986,039 504,460
Total 10,134,509$ 10,161,448$ 9,613,865 547,583$
Reconciliation to GAAP expenses:
Additions:
Depreciation 834
Deductions:
Pension expense (141,989)
Encumbrances outstanding at year-end (33,662)
GAAP Expenses 9,439,048$
(Continued)
Budget
176

MONTGOMERY COUNTY, MARYLANDSCHEDULE OF EXPENSES - BUDGET AND ACTUAL (NON-GAAP BUDGETARY BASIS)ENTERPRISE FUNDSFOR THE FISCAL YEAR ENDED JUNE 30, 2015Exhibit C-4 (Continued)
VarianceOriginal Final PositiveBudget Budget Actual (Negative)
SOLID WASTE DISPOSAL
Personnel costs 9,572,010$ 9,607,123$ 9,607,114$ 9$
Operating 93,553,251 93,853,776 93,853,704 72
Total 103,125,261$ 103,460,899$ 103,460,818 81$
Reconciliation to GAAP expenses:
Additions:
Depreciation 1,488,370
Accrued landfill closing cost 1,585,751
Deductions:
Capital outlay expenditures (1,017,151)
Bad debt expense (1,146)
Encumbrances outstanding at year-end (6,816,420)
Pension expense (635,835)
Adjustment of landfill closure costs (1,226,973)
GAAP Expenses 96,837,414$
SOLID WASTE COLLECTION
Personnel costs 1,252,597$ 1,256,627$ 1,253,836$ 2,791$
Operating 5,162,238 5,162,238 4,881,772 280,466
Total 6,414,835$ 6,418,865$ 6,135,608 283,257$
Reconciliation to GAAP expenses:
Additions:
Depreciation 6,048
Pension expense 23,906
Deductions:
Deferred outflow of resources for contributions made
to pension plan during current fiscal year (102,281)
Encumbrances outstanding at year-end (163,901)
GAAP Expenses 5,899,380$
SOLID WASTE LEAFING
Personnel costs 2,982,273$ 2,684,053$ 2,658,245$ 25,808$
Operating 2,242,370 3,231,515 3,231,513 2
Total 5,224,643$ 5,915,568$ 5,889,758 25,810$
Reconciliation to GAAP expenses:
Additions:
Interfund activities budgeted as transfers - charges for services from disposal 1,132,744
Deductions:
Pension expense (136,858)
Encumbrances outstanding at year-end (250,739)
GAAP Expenses 6,634,905$
Reconciliation of GAAP expenses to Statement of Revenues, Expenses, and Changes in Fund Net Assets:
GAAP Expenses:
Solid Waste Disposal 96,837,414$
Solid Waste Collection 5,899,380
Solid Waste Leafing 6,634,905
Total Solid Waste Activities 109,371,699$ *
(Continued)
Budget
177

MONTGOMERY COUNTY, MARYLANDSCHEDULE OF EXPENSES - BUDGET AND ACTUAL (NON-GAAP BUDGETARY BASIS)ENTERPRISE FUNDSFOR THE FISCAL YEAR ENDED JUNE 30, 2015Exhibit C-4 (Continued)
VarianceOriginal Final PositiveBudget Budget Actual (Negative)
SILVER SPRING PARKING
Personnel costs 2,292,905$ 2,303,536$ 2,149,465$ 154,071$
Operating 9,733,435 9,847,095 8,675,615 1,171,480
Total 12,026,340$ 12,150,631$ 10,825,080 1,325,551$
Reconciliation to GAAP expenses:
Additions:
Depreciation 5,248,362
CIP - other operating costs 27,169
Bad debt expense 1,890,106
Deductions:
Pension expense (147,890)
Encumbrances outstanding at year-end (397,603)
GAAP Expenses 17,445,224$
BETHESDA PARKING
Personnel costs 2,136,725$ 2,147,075$ 2,118,113$ 28,962$
Operating 12,875,429 12,885,635 12,297,767 587,868
Total 15,012,154$ 15,032,710$ 14,415,880 616,830$
Reconciliation to GAAP expenses:
Additions:
Depreciation 5,359,678
Interest expense 1,375,988
CIP - other operating costs 44,200
Bad debt expense 2,004,761
Deductions:
Encumbrances outstanding at year-end (324,988)
Pension expense (146,771)
Principal paid on bonds (3,120,000)
Cash interest payments (1,839,789)
GAAP Expenses 17,768,959$
WHEATON PARKING
Personnel costs 361,267$ 362,750$ 362,614$ 136$
Operating 987,359 1,002,612 783,181 219,431
Total 1,348,626$ 1,365,362$ 1,145,795 219,567$
Reconciliation to GAAP expenses:
Additions:
Depreciation 342,478
CIP - other operating costs 600
Bad debt expense 343,820
Deductions:
Encumbrances outstanding at year-end (55,839)
Pension expense (28,796)
GAAP Expenses 1,748,058$
(Continued)
Budget
178
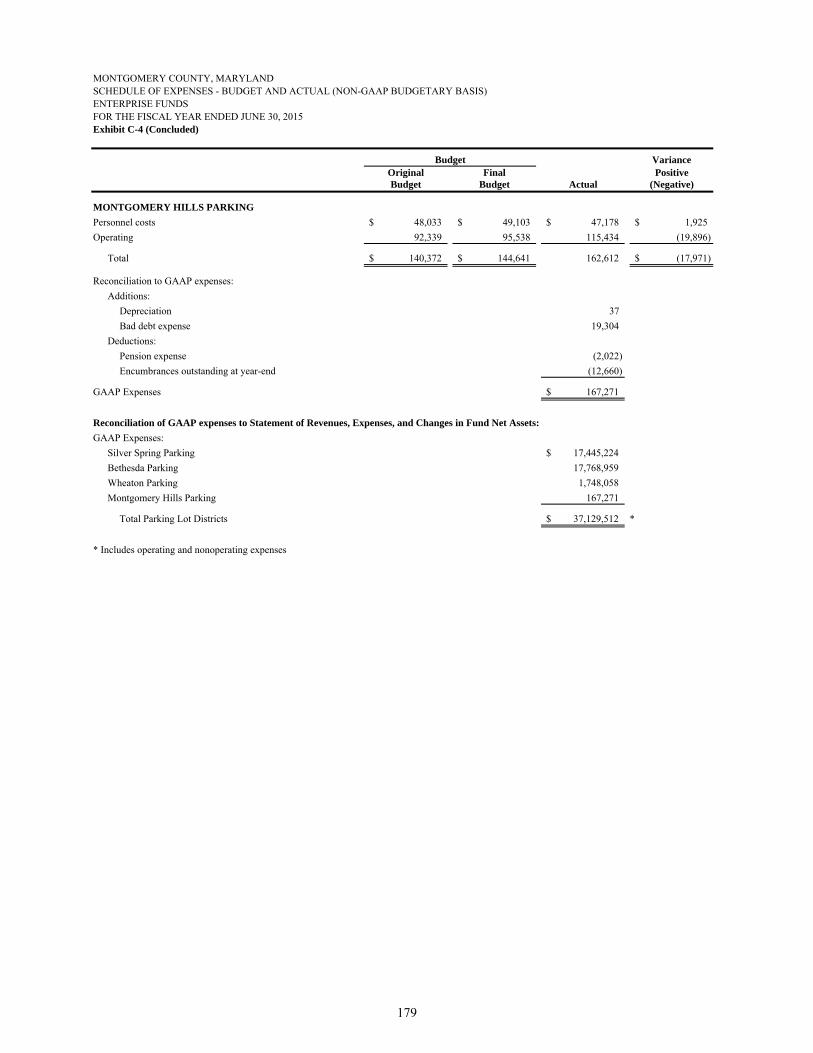
MONTGOMERY COUNTY, MARYLANDSCHEDULE OF EXPENSES - BUDGET AND ACTUAL (NON-GAAP BUDGETARY BASIS)ENTERPRISE FUNDSFOR THE FISCAL YEAR ENDED JUNE 30, 2015Exhibit C-4 (Concluded)
VarianceOriginal Final PositiveBudget Budget Actual (Negative)
MONTGOMERY HILLS PARKING
Personnel costs 48,033$ 49,103$ 47,178$ 1,925$
Operating 92,339 95,538 115,434 (19,896)
Total 140,372$ 144,641$ 162,612 (17,971)$
Reconciliation to GAAP expenses:
Additions:
Depreciation 37
Bad debt expense 19,304
Deductions:
Pension expense (2,022)
Encumbrances outstanding at year-end (12,660)
GAAP Expenses 167,271$
Reconciliation of GAAP expenses to Statement of Revenues, Expenses, and Changes in Fund Net Assets:
GAAP Expenses:
Silver Spring Parking 17,445,224$
Bethesda Parking 17,768,959
Wheaton Parking 1,748,058
Montgomery Hills Parking 167,271
Total Parking Lot Districts 37,129,512$ *
* Includes operating and nonoperating expenses
Budget
179

180

INTERNAL SERVICE FUNDS
Internal service funds are used to account for the financing of goods or services provided by one department or agency to other departments or agencies of the government and to other governmental units, on a cost reimbursement basis.
Motor Pool Accounts for the fiscal activity related to the automotive and other motorized equipment needs of the using departments of the County.
Liability and Property Coverage Self-Insurance Accounts for the fiscal activity related to liability, property, and workers' compensation insurance needs of the participating governmental agencies.
Employee Health Benefits Self-Insurance Accounts for the fiscal activity related to health, life, vision, dental, and long-term disability insurance needs of active employees of the participating governmental agencies.
Central Duplicating Accounts for the fiscal activity related to printing and postage services provided to the using agencies
181

182

MONTGOMERY COUNTY, MARYLANDCOMBINING STATEMENT OF NET POSITIONINTERNAL SERVICE FUNDSJUNE 30, 2015Exhibit D-1
Liability andProperty Employee TotalCoverage Health Benefits Internal
Self Self Central ServiceMotor Pool Insurance Insurance Duplicating Funds
ASSETSCurrent Assets:
Equity in pooled cash and investments 11,426,555$ 143,637,450$ 23,349,425$ 278,200$ 178,691,630$ Cash 300 - - - 300 Receivables (net of allowances for uncollectibles):
Accounts 1,200,465 155,533 323,912 - 1,679,910 Due from other funds - - 6,414,219 - 6,414,219 Due from component units 51,487 - 534,698 6,632 592,817 Due from other governments 3,063 - 66,216 25,350 94,629 Inventory of supplies 4,457,202 - - - 4,457,202 Prepaids 15,258 14,533 - 291,573 321,364
Total Current Assets 17,154,330 143,807,516 30,688,470 601,755 192,252,071
Noncurrent Assets:Capital Assets:
Land, improved and unimproved 22,506 - - - 22,506 Improvements other than buildings 268,565 - - - 268,565 Furniture, fixtures, equipment, and machinery 3,082,441 - - 776,073 3,858,514 Automobiles and trucks 83,584,278 - - - 83,584,278
Subtotal 86,957,790 - - 776,073 87,733,863 Less: Accumulated depreciation 55,491,530 - - 652,030 56,143,560
Total Capital Assets (net of accumulated depreciation) 31,466,260 - - 124,043 31,590,303 Total Assets 48,620,590 143,807,516 30,688,470 725,798 223,842,374
DEFERRED OUTFLOWS OF RESOURCESPension deferrals 737,953 351,811 75,331 234,304 1,399,399
Total Deferred Outflows of Resources 737,953 351,811 75,331 234,304 1,399,399
LIABILITIESCurrent Liabilities:
Accounts payable 2,941,569 573,260 4,339,243 55,475 7,909,547 Claims payable - 30,614,202 8,552,112 - 39,166,314 Accrued liabilities 2,452,431 867,906 616,848 324,078 4,261,263 Due to other funds 242,360 53,108 4,169,055 49,052 4,513,575 Due to other governments - 110,480 - - 110,480 Equipment notes payable 61,550 - - - 61,550 Unearned revenue - - 34,816 - 34,816
Total Current Liabilities 5,697,910 32,218,956 17,712,074 428,605 56,057,545
Noncurrent Liabilities:Claims payable - 97,528,298 4,750,000 - 102,278,298 Compensated absences 388,048 104,855 64,651 40,348 597,902 Net pension liability 1,444,961 765,507 117,426 464,623 2,792,517 Other postemployment benefits 983,943 43,753 - 113,518 1,141,214
Total Noncurrent Liabilities 2,816,952 98,442,413 4,932,077 618,489 106,809,931 Total Liabilities 8,514,862 130,661,369 22,644,151 1,047,094 162,867,476
DEFERRED INFLOWS OF RESOURCESPension deferrals 1,127,587 597,369 91,634 362,572 2,179,162
Total Deferred Inflows of Resources 1,127,587 597,369 91,634 362,572 2,179,162
NET POSITIONNet investment in capital assets 31,404,710 - - - 31,404,710 Unrestricted 8,311,384 12,900,589 8,028,016 (449,564) 28,790,425
Total Net Position (Deficit) 39,716,094$ 12,900,589$ 8,028,016$ (449,564)$ 60,195,135$
183

MONTGOMERY COUNTY, MARYLANDCOMBINING STATEMENT OF REVENUES, EXPENSES, AND CHANGES IN NET POSITIONINTERNAL SERVICE FUNDSFOR THE FISCAL YEAR ENDED JUNE 30, 2015Exhibit D-2
Liability andProperty Employee TotalCoverage Health Benefits Internal
Self Self Central ServiceMotor Pool Insurance Insurance Duplicating Funds
OPERATING REVENUES
Charges for services 76,225,315$ 68,628,558$ 131,478,299$ 8,461,412$ 284,793,584$
Claim recoveries 1,486,381 542,457 - - 2,028,838
Total Operating Revenues 77,711,696 69,171,015 131,478,299 8,461,412 286,822,422
OPERATING EXPENSES
Personnel costs 19,193,277 3,686,576 1,487,756 2,058,831 26,426,440
Other post employment contributions 964,080 47,960 - 143,890 1,155,930
Postage 2,809 58 32,455 1,145,718 1,181,040
Self-insurance incurred and estimated claims - 37,905,495 132,697,247 - 170,602,742
Insurance 2,280,685 4,262,919 - - 6,543,604
Supplies and materials 27,794,239 4,734 23,665 814,987 28,637,625
Contractual services 683,721 6,228,568 6,186,845 522,736 13,621,870
Communications 162,274 7,445 62,122 665,863 897,704
Transportation 282,567 19,282 2,650 38,281 342,780
Public utility services 628,198 - - - 628,198
Rentals 413 - - 2,017,826 2,018,239
Maintenance 13,553,774 4,894 72 113,070 13,671,810
Depreciation 6,824,490 - - 51,613 6,876,103
Other (522,474) 18,014 618,384 15,676 129,600
Total Operating Expenses 71,848,053 52,185,945 141,111,196 7,588,491 272,733,685
Operating Income (Loss) 5,863,643 16,985,070 (9,632,897) 872,921 14,088,737
NONOPERATING REVENUES (EXPENSES)
Gain (loss) on disposal of capital assets 825,876 - - - 825,876
Investment income 36,633 193,008 23,698 223 253,562
Interest expense (4,499) - - - (4,499)
Insurance recoveries - 503,547 - - 503,547
Total Nonoperating Revenues (Expenses) 858,010 696,555 23,698 223 1,578,486
Income (Loss) Before Transfers 6,721,653 17,681,625 (9,609,199) 873,144 15,667,223
Transfers In (Out):
Transfers in 592,388 - - - 592,388
Transfers out - - (10,745,911) - (10,745,911)
Total Transfers In (Out) 592,388 - (10,745,911) - (10,153,523)
Change in Net Position 7,314,041 17,681,625 (20,355,110) 873,144 5,513,700
Total Net Position - Beginning of Year, as restated 32,402,053 (4,781,036) 28,383,126 (1,322,708) 54,681,435
Total Net Position - End of Year 39,716,094$ 12,900,589$ 8,028,016$ (449,564)$ 60,195,135$
184

MONTGOMERY COUNTY, MARYLANDCOMBINING STATEMENT OF CASH FLOWSINTERNAL SERVICE FUNDSFOR THE FISCAL YEAR ENDED JUNE 30, 2015Exhibit D-3
Liability andProperty Employee TotalCoverage Health Benefits Internal
Self Self Central ServiceMotor Pool Insurance Insurance Duplicating Funds
CASH FLOWS FROM OPERATING ACTIVITIES
Receipts from customers 77,032,948$ 68,634,050$ 130,685,771$ 8,458,322$ 284,811,091$
Payments to suppliers (45,668,778) (10,790,029) (29,708,849) (5,724,085) (91,891,741)
Payments to employees (19,972,957) (3,701,878) (1,579,414) (2,456,488) (27,710,737)
Claims paid - (37,723,921) (109,365,774) - (147,089,695)
Other revenue - 542,457 - - 542,457
Net Cash Provided (Used) by Operating Activities 11,391,213 16,960,679 (9,968,266) 277,749 18,661,375
CASH FLOWS FROM NONCAPITAL FINANCING ACTIVITIES
Insurance reimbursement claims - 503,547 - - 503,547
Operating subsidies, transfers and payments to other funds - - (10,745,911) - (10,745,911)
Net Cash Provided (Used) by Noncapital Financing Activities - 503,547 (10,745,911) - (10,242,364)
CASH FLOWS FROM CAPITAL AND RELATED
FINANCING ACTIVITIES
Proceeds from sale of capital assets 922,258 - - - 922,258
Purchases of capital assets (7,038,275) - - - (7,038,275)
Principal paid on capital debt (120,422) - - - (120,422)
Interest paid on capital debt (4,499) - - - (4,499)
Internal activity-payment from other funds 592,388 - - - 592,388
Net Cash Provided (Used) by Capital and
Related Financing Activities (5,648,550) - - - (5,648,550)
CASH FLOWS FROM INVESTING ACTIVITIES
Investment income from pooled investments 36,633 193,008 23,698 223 253,562
Net Cash Provided (Used) by Investing Activities 36,633 193,008 23,698 223 253,562
Net Increase (Decrease) in Cash and Cash Equivalents 5,779,296 17,657,234 (20,690,479) 277,972 3,024,023
Balances - Beginning of Year 5,647,559 125,980,216 44,039,904 228 175,667,907
Balances - End of Year 11,426,855$ 143,637,450$ 23,349,425$ 278,200$ 178,691,930$
Reconciliation of operating income (loss) to net cash provided by operating activities:
Operating income (loss) 5,863,643$ 16,985,070$ (9,632,897)$ 872,921$ 14,088,737$
Adjustment to reconcile operating income (loss) to
net cash provided (used) by operating activities:
Depreciation 6,824,490 - - 51,613 6,876,103
Pension expense (578,259) (267,208) (62,353) (182,954) (1,090,774)
Effect of changes in operating assets and liabilities:
Receivables, net (678,748) 5,492 (792,528) (3,091) (1,468,875)
Inventories, prepaids and other assets 415,525 (13,768) - (94,021) 307,736
Accounts payable and other liabilities (220,342) (496,654) 221,257 (473,229) (968,968)
Claims payable - 181,574 - - 181,574
Accrued expenses (235,096) 566,173 298,255 106,510 735,842
Net Cash Provided (Used) by Operating Activities 11,391,213$ 16,960,679$ (9,968,266)$ 277,749$ 18,661,375$
185

MONTGOMERY COUNTY, MARYLANDSCHEDULE OF EXPENSES - BUDGET AND ACTUAL (NON-GAAP BUDGETARY BASIS)INTERNAL SERVICE FUNDSFOR THE FISCAL YEAR ENDED JUNE 30, 2015Exhibit D-4
VarianceOriginal Final PositiveBudget Budget Actual (Negative)
LIABILITY AND PROPERTY COVERAGE SELF-INSURANCE
Personnel costs 3,926,228$ 3,953,788$ 3,953,784$ 4$
Operating 54,943,339 50,094,641 48,761,249 1,333,392
Total 58,869,567$ 54,048,429$ 52,715,033 1,333,396$
Reconciliation to GAAP expenses:
Additions:
Portion of incurred but not reported claims not
required to be budgeted 181,574
Bad debt expense 1,678
Deductions:
Pension expense (267,208)
Encumbrances outstanding at year-end (445,132)
GAAP Expenses 52,185,945$
EMPLOYEE HEALTH BENEFITS SELF-INSURANCE
Personnel costs 2,150,801$ 2,262,141$ 1,550,109$ 712,032$
Operating 202,102,168 213,436,429 138,572,047 74,864,382
Total 204,252,969$ 215,698,570$ 140,122,156 75,576,414$
Reconciliation to GAAP expenses:
Additions:
Portion of incurred but not reported claims not
required to be budgeted 1,057,074
Deductions:
Pension expense (62,353)
Encumbrances outstanding at year-end (5,681)
GAAP Expenses 141,111,196$
Budget
186

FIDUCIARY FUNDS
Fiduciary funds are used to account for assets held in a trustee or agency capacity for others and therefore cannot be used to support the government's own programs.
Pension and Other Employee Benefit Trust Account for the accumulation of resources for, and payment of, retirement annuities and/or other benefits and administrative costs.
Employees' Retirement System Employees' Retirement Savings Plan Deferred Compensation Plan Retiree Health Benefits
Private Purpose Trust Account for trust arrangements under which principal and income benefit individuals, private organizations, or other governments.
Private Contributions Tricentennial
Agency Account for resources held by the County in a purely custodial capacity.
Recreation Activities Property Tax Miscellaneous
187

188

MONTGOMERY COUNTY, MARYLANDCOMBINING STATEMENT OF FIDUCIARY NET POSITIONPENSION AND OTHER EMPLOYEE BENEFIT TRUST FUNDSJUNE 30, 2015Exhibit E-1
Employees' Employees' Deferred RetireeRetirement Retirement Compensation Health
System Savings Plan Plan Benefits Total
ASSETS
Current Assets:
Equity in pooled cash and investments 981,456$ 671,139$ -$ 691,251$ 2,343,846$
Investments:
Government and agency obligations 395,527,073 - - - 395,527,073
Asset-backed securities 3,464,339 - - - 3,464,339
Municipal/Provincial bonds 12,358,783 - - - 12,358,783
Corporate bonds 656,471,268 - - - 656,471,268
Common and preferred stock 1,455,833,853 - - 123,730,476 1,579,564,329
Mutual and commingled funds 365,620,792 313,170,346 351,892,072 451,559,705 1,482,242,915
Short-term investments 119,853,979 - - 3,865,465 123,719,444
Cash collateral received under securities lending agreements 273,912,882 - - 28,185,429 302,098,311
Real assets 380,180,632 - - 4,095,880 384,276,512
Private equity 261,364,506 - - 8,006,010 269,370,516
Total Investments 3,924,588,107 313,170,346 351,892,072 619,442,965 5,209,093,490
Receivables (net of allowances for uncollectibles):
Receivables and accrued interest 6,640,354 - - 439,546 7,079,900
Accounts 111,164 171,890 9,207 34,400 326,661
Due from other funds 8,187,643 1,212,569 745,573 4,156,880 14,302,665
Due from component units 131,087 96,877 - 2,073,600 2,301,564
Due from other governments 10,990 1,995 - 96,423 109,408
Total Current Assets 3,940,650,801 315,324,816 352,646,852 626,935,065 5,235,557,534
Noncurrent Assets:
Capital assets:
Miscellaneous 900,043 - - - 900,043
Less: Accumulated depreciation 300,014 - - - 300,014
Total Capital Assets (net of accumulated depreciation) 600,029 - - - 600,029
Total Assets 3,941,250,830 315,324,816 352,646,852 626,935,065 5,236,157,563
LIABILITIES
Current Liabilities:
Accounts payable 274,630,287 571 - 28,208,628 302,839,486
Accrued liabilities 4,825,931 18,217 - 745,835 5,589,983
Claims payable - - - 4,253,303 4,253,303
Due to other funds 14,699 1,382 - 1,553 17,634
Unearned revenue 77,121 - - - 77,121
Total Current Liabilities 279,548,038 20,170 - 33,209,319 312,777,527
Noncurrent Liabilities:
Compensated absences 41,548 3,730 - 4,310 49,588
Total Liabilities 279,589,586 23,900 - 33,213,629 312,827,115
NET POSITION
Held in trust for pension and other postemployment benefits 3,661,661,244$ 315,300,916$ 352,646,852$ 593,721,436$ 4,923,330,448$
189

MONTGOMERY COUNTY, MARYLANDCOMBINING STATEMENT OF CHANGES IN FIDUCIARY NET POSITIONPENSION AND OTHER EMPLOYEE BENEFIT TRUST FUNDSFOR THE FISCAL YEAR ENDED JUNE 30, 2015Exhibit E-2
Employees' Employees' Deferred RetireeRetirement Retirement Compensation Health
System Savings Plan Plan Benefits Total
ADDITIONS
Contributions:
Employers 151,301,867$ 18,502,353$ -$ 185,132,089$ 354,936,309$
Members 26,627,493 9,728,222 19,228,978 21,916,187 77,500,880
Federal government - Medicare Part D - - - 2,080,232 2,080,232
Total Contributions 177,929,360 28,230,575 19,228,978 209,128,508 434,517,421
Investment income (loss) 89,644,845 7,050,419 15,258,958 4,595,808 116,550,030
Less: Investment expenses 22,574,412 5,438 - 2,437,097 25,016,947
Net Investment Income (Loss) 67,070,433 7,044,981 15,258,958 2,158,711 91,533,083
Other income - forfeitures - 447,749 - - 447,749
Total Additions, net 244,999,793 35,723,305 34,487,936 211,287,219 526,498,253
DEDUCTIONS
Benefits:
Annuities:
Retirees 171,784,946 - - - 171,784,946
Survivors 8,982,132 - - - 8,982,132
Disability 49,879,651 - - - 49,879,651
Claims - - - 72,260,293 72,260,293
Total Benefits 230,646,729 - - 72,260,293 302,907,022
Member refunds 2,874,357 12,693,995 26,122,796 - 41,691,148
Administrative expenses 2,384,546 235,299 - 5,042,093 7,661,938
Depreciation 300,014 - - - 300,014
Total Deductions 236,205,646 12,929,294 26,122,796 77,302,386 352,560,122
Net Increase (Decrease) 8,794,147 22,794,011 8,365,140 133,984,833 173,938,131
Net Position - Beginning of Year 3,652,867,097 292,506,905 344,281,712 459,736,603 4,749,392,317
Net Position - End of Year 3,661,661,244$ 315,300,916$ 352,646,852$ 593,721,436$ 4,923,330,448$
190

MONTGOMERY COUNTY, MARYLANDCOMBINING STATEMENT OF FIDUCIARY NET POSITIONPRIVATE PURPOSE TRUST FUNDSJUNE 30, 2015Exhibit E-3
Private Tri-Contributions Centennial Total
ASSETS
Current Assets:
Equity in pooled cash and investments 52,678$ 7,346$ 60,024$
Total Assets 52,678 7,346 60,024
LIABILITIES
Current Liabilities:
Accounts payable 44,585 - 44,585
Total Liabilities 44,585 - 44,585
NET POSITION
Held in trust 8,093$ 7,346$ 15,439$
191
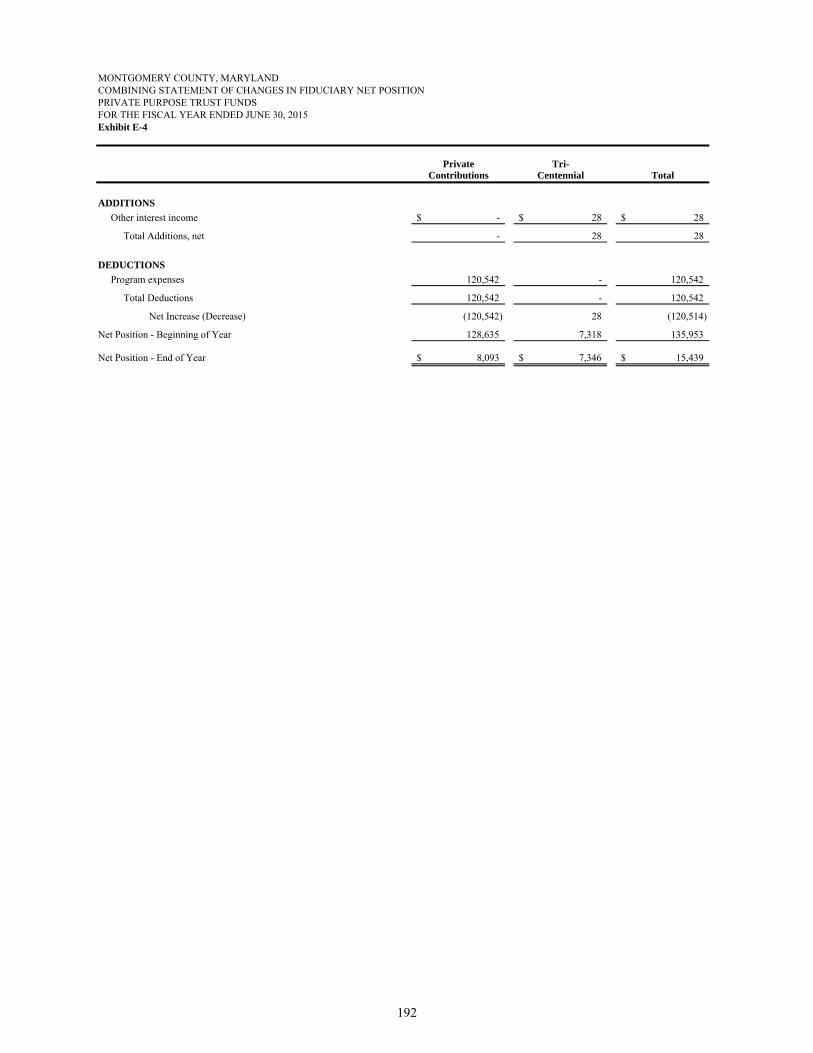
MONTGOMERY COUNTY, MARYLANDCOMBINING STATEMENT OF CHANGES IN FIDUCIARY NET POSITIONPRIVATE PURPOSE TRUST FUNDSFOR THE FISCAL YEAR ENDED JUNE 30, 2015Exhibit E-4
Private Tri-Contributions Centennial Total
ADDITIONS
Other interest income -$ 28$ 28$
Total Additions, net - 28 28
DEDUCTIONS
Program expenses 120,542 - 120,542
Total Deductions 120,542 - 120,542
Net Increase (Decrease) (120,542) 28 (120,514)
Net Position - Beginning of Year 128,635 7,318 135,953
Net Position - End of Year 8,093$ 7,346$ 15,439$
192

MONTGOMERY COUNTY, MARYLANDCOMBINING STATEMENT OF CHANGES IN ASSETS AND LIABILITIESALL AGENCY FUNDSFOR THE FISCAL YEAR ENDED JUNE 30, 2015Exhibit E-5
Balance BalanceJune 30, 2014 Additions Deductions June 30, 2015
RECREATION ACTIVITIES FUND
ASSETS
Equity in pooled cash and investments 3,055,466$ 29,170,073$ 28,863,281$ 3,362,258$
Accounts receivable 365,137 - - 365,137
Total Assets 3,420,603$ 29,170,073$ 28,863,281$ 3,727,395$
LIABILITIES
Accounts payable 60,057$ 3,829,549$ 3,759,020$ 130,586$
Due to other funds 310,000 - - 310,000
Other liabilities 3,360,546 3,257,298 3,331,035 3,286,809
Total Liabilities 3,730,603$ 7,086,847$ 7,090,055$ 3,727,395$
PROPERTY TAX FUND
ASSETS
Equity in pooled cash and investments 19,370,838$ 2,081,427,029$ 2,076,653,021$ 24,144,846$
Property taxes receivable 5,314,182 390,460,509 390,637,211 5,137,480
Accounts receivable - 34 34 -
Due from other governments - 400,268,369 399,973,037 295,332
Total Assets 24,685,020$ 2,872,155,941$ 2,867,263,303$ 29,577,658$
LIABILITIES
Deposits 463,011$ -$ 463,011$ -$
Uncollected property taxes due to governments 4,989,696 390,460,509 390,637,211 4,812,994
Due to other governments 309,151 - 309,151 -
Undistributed taxes and refunds 2,916,927 2,052,906,689 2,052,399,661 3,423,955
Tax sale surplus and redemptions payable 2,375,366 8,944,658 7,575,274 3,744,750
Other liabilities 13,630,869 425,281,374 421,316,284 17,595,959
Total Liabilities 24,685,020$ 2,877,593,230$ 2,872,700,592$ 29,577,658$
MISCELLANEOUS AGENCY FUND
ASSETS
Equity in pooled cash and investments 6,254,431$ 15,072,045$ 14,519,998$ 6,806,478$
Cash 288,261 62,152 217,542 132,871
Property taxes receivable 480 1,255,477 1,255,651 306
Accounts receivable 67,831 432,038 280,573 219,296
Total Assets 6,611,003$ 16,821,712$ 16,273,764$ 7,158,951$
LIABILITIES
Accrued liabilities 6,152$ -$ 6,152$ -$
Due to component units 6,324 7,935 7,935 6,324
Due to other governments 1,317,813 16,151,147 16,073,318 1,395,642
Other liabilities 1,941,290 8,066,756 8,178,432 1,829,614
Deposits 3,339,424 5,877,562 5,289,615 3,927,371
Total Liabilities 6,611,003$ 30,103,400$ 29,555,452$ 7,158,951$
(Continued)
193
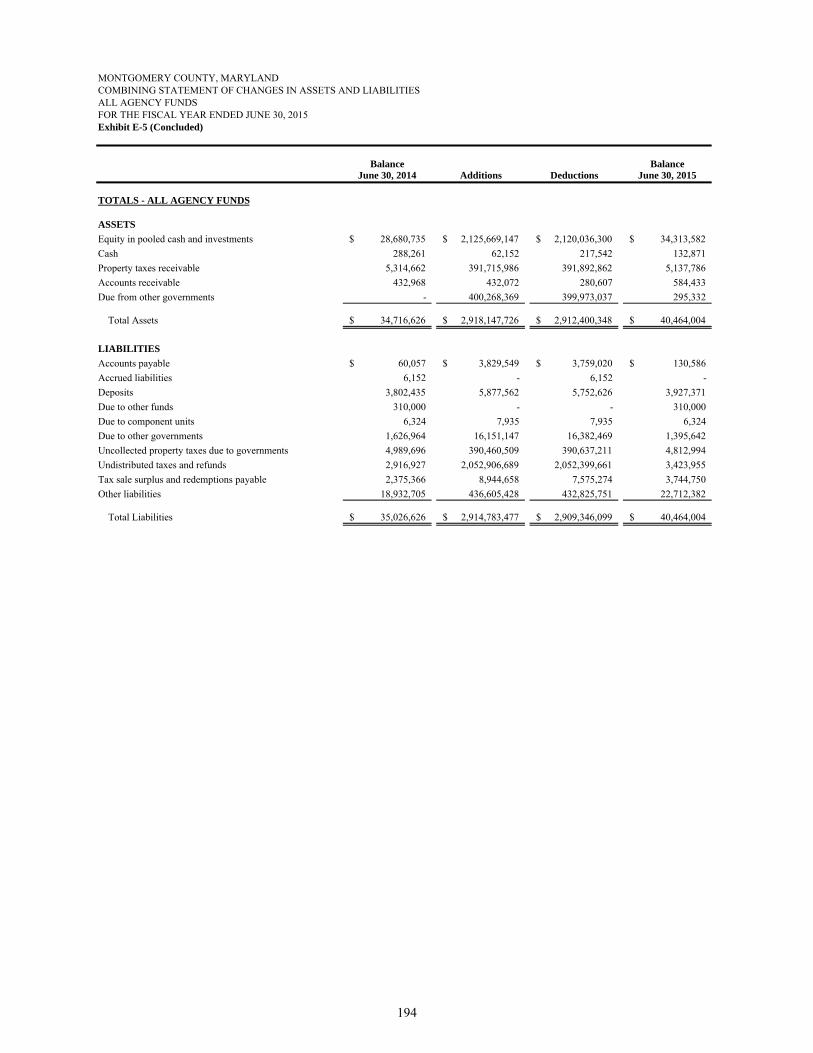
MONTGOMERY COUNTY, MARYLANDCOMBINING STATEMENT OF CHANGES IN ASSETS AND LIABILITIESALL AGENCY FUNDSFOR THE FISCAL YEAR ENDED JUNE 30, 2015Exhibit E-5 (Concluded)
Balance BalanceJune 30, 2014 Additions Deductions June 30, 2015
TOTALS - ALL AGENCY FUNDS
ASSETS
Equity in pooled cash and investments 28,680,735$ 2,125,669,147$ 2,120,036,300$ 34,313,582$
Cash 288,261 62,152 217,542 132,871
Property taxes receivable 5,314,662 391,715,986 391,892,862 5,137,786
Accounts receivable 432,968 432,072 280,607 584,433
Due from other governments - 400,268,369 399,973,037 295,332
Total Assets 34,716,626$ 2,918,147,726$ 2,912,400,348$ 40,464,004$
LIABILITIES
Accounts payable 60,057$ 3,829,549$ 3,759,020$ 130,586$
Accrued liabilities 6,152 - 6,152 -
Deposits 3,802,435 5,877,562 5,752,626 3,927,371
Due to other funds 310,000 - - 310,000
Due to component units 6,324 7,935 7,935 6,324
Due to other governments 1,626,964 16,151,147 16,382,469 1,395,642
Uncollected property taxes due to governments 4,989,696 390,460,509 390,637,211 4,812,994
Undistributed taxes and refunds 2,916,927 2,052,906,689 2,052,399,661 3,423,955
Tax sale surplus and redemptions payable 2,375,366 8,944,658 7,575,274 3,744,750
Other liabilities 18,932,705 436,605,428 432,825,751 22,712,382
Total Liabilities 35,026,626$ 2,914,783,477$ 2,909,346,099$ 40,464,004$
194
NONMAJOR COMPONENT UNITS
195

196

NONMAJOR COMPONENT UNITS
Exhibit F-1
BUPI MCRA MCC Total
ASSETSEquity in pooled cash and investments -$ -$ 28,722,385$ 28,722,385$ Cash with fiscal agents - - 19,849,706 19,849,706 Cash 993,317 5,754,788 110,594 6,858,699 Investments - cash equivalents - - 24,203,606 24,203,606 Investments - - 40,450,204 40,450,204 Receivables (net of allowance for uncollectibles):
Capital leases - 14,803,344 - 14,803,344 Accounts 568 398,310 10,689,396 11,088,274 Notes - 67,512,710 - 67,512,710 Other - - 1,199,293 1,199,293
Due from primary government 35,304 - 10,179,267 10,214,571 Due from other governments 12,191 53,486 2,625,227 2,690,904 Inventory of supplies - 438,438 1,396,753 1,835,191 Prepaids 16,951 23,198 1,829,676 1,869,825 Other assets 5,075 - 56,415,784 56,420,859 Restricted Asset:
Equity in pooled cash and investments - - 5,199,431 5,199,431 Cash - 450,808 - 450,808
Investment - 1,473,598 - 1,473,598 Net Pension asset - - 1,213,552 1,213,552 Capital Assets:
Nondepreciable assets - 30,880,117 55,703,950 86,584,067 Depreciable assets, net 410,280 13,871,438 464,352,295 478,634,013
Total Assets 1,473,686 135,660,235 724,141,119 861,275,040
DEFERRED OUTFLOWS OF RESOURCESDeferred loss on refunding of debt - 1,064,672 1,844,068 2,908,740 Pension deferrals - 257,469 - 257,469 Accumulated decrease in fair value of hedging derivatives - 306,849 50,000 356,849
Total Deferred Outflow of Resources - 1,628,990 1,894,068 3,523,058
LIABILITIESAccounts payable 286,601 410,257 24,389,881 25,086,739 Interest payable - 297,058 - 297,058 Accrued liabilities 237,261 586,412 - 823,673 Deposits - 338,166 - 338,166 Due to primary government 18,852 131,381 506,548 656,781 Due to other governments - - 640,043 640,043 Unearned revenue 51,786 673,416 5,159,370 5,884,572 Other liabilities 112,935 - - 112,935 Noncurrent Liabilities:
Due within one year - 5,999,481 4,625,938 10,625,419 Due in more than one year - 96,619,008 139,804,132 236,423,140
Total Liabilities 707,435 105,055,179 175,125,912 280,888,526
DEFERRED INFLOWS OF RESOURCESDeferred gain on refunding of debt - - 3,570,000 3,570,000 Pension deferrals - 396,489 1,305,603 1,702,092
Accumulated increase in fair value of hedging derivatives - 153,811 - 153,811
Total Deferred Intflow of Resources - 550,300 4,875,603 5,425,903
NET POSITION
Net investment in capital assets 410,280 25,267,519 463,287,946 488,965,745 Restricted for:
Capital projects - 123,771 - 123,771 Debt service - 1,473,598 - 1,473,598 Other purposes - 327,037 31,369,193 31,696,230
Unrestricted (deficit) 355,971 4,491,821 51,376,533 56,224,325
Total Net Position 766,251$ 31,683,746$ 546,033,672$ 578,483,669$
MONTGOMERY COUNTY, MARYLANDCOMBINING STATEMENT OF NET POSITION
JUNE 30, 2015
197

MONTGOMERY COUNTY, MARYLANDCOMBINING STATEMENT OF ACTIVITIESNONMAJOR COMPONENT UNITSFOR THE FISCAL YEAR ENDED JUNE 30, 2015Exhibit F-2
Operating CapitalCharges for Grants and Grants and
Functions Expenses Services Contributions Contributions BUPI MCRA MCC Total
Component Units:
General government 4,833,365$ 4,577,615$ 239,554$ -$ (16,196)$ -$ -$ (16,196)$
Culture and recreation 17,414,438 15,798,719 - 63,453 - (1,552,266) - (1,552,266)
Education 337,763,487 77,914,425 17,187,769 1,011,933 - - (241,649,360) (241,649,360)
Total component units 360,011,290$ 98,290,759$ 17,427,323$ 1,075,386$ (16,196) (1,552,266) (241,649,360) (243,217,822)
General revenues:
Grants and contributions not restricted to specific programs - - 261,634,908 261,634,908
Investment Income - 2,113,576 2,612,465 4,726,041
Gain on sale of capital assets 54,512 (7,386) - 47,126
Total general revenues 54,512 2,106,190 264,247,373 266,408,075
Change in net position 38,316 553,924 22,598,013 23,190,253
Total Net Position - beginning, as restated 727,935 31,129,822 523,435,659 555,293,416
Total Net Position - ending 766,251$ 31,683,746$ 546,033,672$ 578,483,669$
Program Revenues Net (Expense) Revenue and Changes in Net Position
198
sTATisTiCAL sECTiON

STATISTICAL SECTION
The Statistical Section presents detailed information for the primary government in the following areas, as a context for understanding what the information in the Financial Section says about the County's overall financial health:
Financial Trends Information to help the reader understand how the County's financial performance and well-being have changed over time.
Revenue Capacity Information to help the reader assess the County's most significant local revenue sources - the property tax and income tax.
Debt Capacity Information to help the reader assess the affordability of the County's current levels of outstanding debt and the County's ability to issue additional debt in the future.
Demographic and Economic Information Indicators to help the reader understand the environment within which the County's financial activities take place.
Operating Information Service and infrastructure data to help the reader understand how the information in the County's financial report relates to the services the County provides and the activities it performs.
Many of these tables cover more than two fiscal years and present data from outside the accounting records. Therefore, the Statistical Section is unaudited.
201

202

MONTGOMERY COUNTY, MARYLAND
FINANCIAL TRENDS
NET POSITION BY COMPONENT - GOVERNMENT-WIDE (GOVERNMENTAL AND BUSINESS-TYPE ACTIVITIES)
LAST TEN FISCAL YEARS
Table 1
2006 2007 2008 2009 2010 2011 2012 2013 2014 2015
Governmental Activities:
Net investment in capital assets 1,769,233,330$ 1,880,672,363$ 1,875,327,937$ 1,937,493,317$ 1,965,289,080$ 1,923,668,729$ 1,880,813,780$ 1,932,495,036$ 2,112,879,507$ 2,099,290,326$
Restricted 338,811,955 440,714,792 410,457,623 393,404,279 380,181,540 426,265,013 502,059,858 296,564,191 315,878,315 493,320,702
Unrestricted (deficit) (1) (425,270,974) (423,363,652) (652,576,967) (1,043,969,070) (1,372,709,340) (1,388,128,738) (1,365,476,872) (1,147,060,057) (1,247,964,983) (1,882,775,991)
Total Governmental Activities Net Position 1,682,774,311 1,898,023,503 1,633,208,593 1,286,928,526 972,761,280 961,805,004 1,017,396,766 1,081,999,170 1,180,792,839 709,835,037
Business-type Activities:
Net investment in capital assets 152,244,454 160,807,324 166,059,652 177,697,087 178,781,693 173,232,831 185,300,678 191,266,741 181,965,592 186,001,533
Restricted 80,486,538 72,370,254 76,590,751 66,606,205 54,684,729 52,817,393 93,254,622 94,329,133 64,810,807 48,386,118
Unrestricted 31,001,878 33,422,201 36,328,335 24,449,753 16,127,031 18,434,295 26,894,257 41,045,651 69,285,828 57,451,970
Total Business-type Activities Net Position 263,732,870 266,599,779 278,978,738 268,753,045 249,593,453 244,484,519 305,449,557 326,641,525 316,062,227 291,839,621
Primary Government:
Net investment in capital assets 1,874,877,273 1,996,886,602 1,999,920,988 2,003,119,670 2,109,006,202 2,065,797,289 2,066,114,458 2,123,761,777 2,294,845,099 2,285,291,859
Restricted 419,298,493 513,085,046 513,085,046 487,048,374 434,866,269 479,082,406 595,314,480 390,893,324 380,689,122 541,706,820
Unrestricted (deficit) (1) (347,668,585) (345,348,366) (348,382,752) (577,980,713) (1,321,517,738) (1,338,590,172) (1,338,582,615) (1,106,014,406) (1,178,679,155) (1,825,324,021)
Total Primary Government Net Position 1,946,507,181$ 2,164,623,282$ 2,164,623,282$ 1,912,187,331$ 1,222,354,733$ 1,206,289,523$ 1,322,846,323$ 1,408,640,695$ 1,496,855,066$ 1,001,674,658$
NOTES:***
*
*
(1)
Unrestricted (deficit) net position reported above (347,668,585)$ (345,348,366)$ (348,382,752)$ (577,980,713)$ (1,321,517,738)$ (1,338,590,172)$ (1,338,582,615)$ (1,106,014,406)$ (1,178,679,155)$ (1,825,324,021)$
Debt issued for capital on behalf of others 902,249,062 1,109,741,009 1,023,021,034 1,122,854,267 1,252,293,676 1,359,354,018 1,399,452,195 1,471,314,322 1,498,460,648 1,634,742,350
County net position absent effect of this relationship 554,580,477$ 764,392,643$ 674,638,282$ 544,873,554$ (69,224,062)$ 20,763,846$ 60,869,580$ 365,299,916$ 319,781,493$ (190,581,671)$
Accounting standards require that net position be reported in three components in the financial statements: net investment in capital assets; restricted; and unrestricted. Net position is considered restricted when (1) an external party, such as the state or federal government, places a restriction on how the resources may be used, or (2) enabling legislation is enacted by the County.
The County's governmental activities has an unrestricted deficit because the County issues debt to fund construction costs for MCPS and MCC, two of its component units, and for M-NCPPC, a joint venture. Absent the effect of this relationship, the County would have reported a smaller government-wide deficit for its governmental activities and for government-wide purposes. Government-wide unrestricted net position would have been:
Beginning in FY13, the County implemented GASB Statement No. 63, Financial Reporting of Deferred Outflows of Resources, Deferred Inflows of Resources, and Net Position, which requires amounts formerly reported as net assets be reported as net position. The effect of this implementation is reflected in the above table.
This table is a summary of net position information presented in the basic financial statement Exhibit A-1.Government-wide net position information is reported on the accrual basis of accounting.
Certain amounts have been restated or reclassified to conform with the following year's presentation.
203

MONTGOMERY COUNTY, MARYLAND
FINANCIAL TRENDS
CHANGES IN NET POSITION - GOVERNMENT-WIDE (GOVERNMENTAL AND BUSINESS-TYPE ACTIVITIES)
LAST TEN FISCAL YEARS
Table 2-a
2006 2007 2008 2009 2010 2011 2012 2013 2014 2015
Expenses
Governmental Activities:
General government 257,586,189$ 274,005,357$ 304,526,806$ 337,557,085$ 293,349,395$ 287,987,929$ 351,138,451$ 400,023,515$ 474,084,799$ 470,405,790$
Public safety 473,624,268 529,748,046 601,156,598 626,855,553 611,714,420 614,081,563 600,877,545 609,565,746 607,555,402 591,702,869
Public works and transportation 192,228,591 210,395,916 233,193,597 257,041,963 297,864,026 255,731,300 263,586,549 278,716,716 273,021,015 288,226,716
Health and human services 235,394,838 252,066,273 286,907,329 288,519,635 287,883,637 283,727,427 256,703,043 272,032,818 291,657,233 296,567,081
Culture and recreation 93,460,648 103,765,006 118,017,417 116,186,268 108,490,460 88,433,456 93,560,027 93,965,468 95,084,426 95,703,122
Community development and housing 19,280,438 18,213,040 19,134,520 21,365,597 40,627,603 73,432,068 46,198,670 37,821,686 38,160,065 32,001,034
Environment 9,157,156 12,962,711 14,967,339 13,618,312 16,446,934 19,189,065 28,584,840 28,913,062 31,590,141 30,905,863
Education 1,595,747,791 1,669,681,121 1,783,953,133 1,842,962,933 1,738,633,028 1,728,747,256 1,751,721,080 1,797,097,286 1,770,301,285 1,826,117,289
Interest on long-term debt 73,675,523 81,262,618 95,931,334 92,511,000 86,352,825 99,272,929 116,354,151 113,688,959 101,268,081 112,420,639
Total Governmental Activities Expenses 2,950,155,442 3,152,100,088 3,457,788,073 3,596,618,346 3,481,362,328 3,450,602,993 3,508,724,356 3,631,825,256 3,682,722,447 3,744,050,403
Business-type Activities:
Liquor control 168,325,049 180,243,618 190,742,139 197,044,956 204,677,766 215,359,402 220,242,176 225,650,484 239,218,758 248,982,109
Solid waste activities 99,911,970 103,455,706 98,166,937 96,857,869 100,709,914 100,890,192 99,723,180 106,039,038 129,531,260 109,351,706
Parking lot districts 26,568,228 26,622,097 27,854,499 29,003,485 30,698,606 30,755,951 29,724,042 30,321,385 30,140,788 37,103,525
Permitting services 21,962,821 23,463,486 26,977,767 27,878,868 27,306,059 25,490,571 25,039,256 27,534,056 29,486,839 29,002,673
Community use of public facilities 6,810,783 7,657,662 8,456,433 8,744,741 8,397,989 8,727,217 8,890,716 9,533,241 8,997,721 9,444,551
Total Business-type Activities Expenses 323,578,851 341,442,569 352,197,775 359,529,919 371,790,334 381,223,333 383,619,370 399,078,204 437,375,366 433,884,564
Total Primary Government Expenses 3,273,734,293 3,493,542,657 3,809,985,848 3,956,148,265 3,853,152,662 3,831,826,326 3,892,343,726 4,030,903,460 4,120,097,813 4,177,934,967
Program Revenues
Governmental Activities:
Charges for services:
General government 70,760,591 58,026,709 52,271,766 55,124,011 53,793,781 72,444,386 69,255,366 67,955,551 35,879,186 75,223,054
Public safety 21,261,849 21,633,121 33,618,772 44,359,719 33,115,674 38,595,219 35,960,217 44,887,666 52,773,389 52,554,641
Public works and transportation 17,417,455 18,262,635 17,750,337 18,997,028 22,214,073 26,974,805 28,375,493 31,024,303 28,606,534 32,070,795
Health and human services 3,733,918 (3) 3,894,842 6,504,109 5,604,372 1,497,239 4,721,205 5,785,003 4,976,188 5,448,684 4,968,870
Culture and recreation 24,180,695 26,155,477 27,740,357 29,964,898 31,559,913 32,590,653 36,029,762 37,693,903 38,555,482 39,462,050
Community development and housing 201,156 245,105 3,947,238 3,937,188 4,745,237 5,019,056 5,328,444 7,882,996 5,097,251 5,245,558
Environment 4,566,822 5,954,673 6,062,667 8,594,412 10,832,323 11,860,231 17,686,313 23,115,938 23,130,913 28,232,295
Operating Grants and Contributions:
General government 8,624,075 9,906,187 9,833,718 6,720,731 8,425,267 5,849,908 4,727,151 4,746,333 7,177,643 5,900,190
Public safety 33,672,335 32,672,761 29,421,302 30,138,410 30,382,733 37,520,540 34,066,226 37,548,290 32,105,352 34,566,646
Public works and transportation 65,846,601 65,774,815 65,513,498 71,494,515 30,127,888 29,181,943 17,616,341 34,642,383 48,675,916 40,840,283
Health and human services 100,845,243 (3) 113,457,584 102,694,709 109,573,451 95,136,860 104,007,562 87,045,926 105,230,050 111,498,816 112,388,538
Culture and recreation 4,284,853 4,852,256 5,084,296 4,729,985 5,270,729 5,366,409 5,391,330 12,344,981 5,089,403 5,362,215
Community development and housing 8,905,322 4,568,516 3,825,474 6,300,663 10,997,335 10,261,792 13,596,969 738,299 4,765,528 2,843,614
Environment 9,377 336,713 20,104 924 86,862 567,585 2,984,828 623,999 1,740,066 23,547
Capital Grants and Contributions:
General government 621,102 1,068 702,125 2,019,511 1,785,014 5,102,185 6,279,853 6,998,575 6,728,959 8,780,438
Public safety 4,151,203 6,444,925 1,867,152 5,112,282 1,830,899 212,915 805,520 1,866,778 2,144,407 986,711
Public works and transportation (3) 25,154,942 29,777,979 22,482,671 16,919,856 43,203,926 38,384,823 49,814,738 11,801,526 26,115,518 18,100,100
Culture and recreation 8,961,749 11,974,970 3,183,810 7,909,851 1,565,933 3,123,739 3,794,333 1,739,360 1,715,816 4,950,414
204

Community development and housing 1,703,776 3,252,035 3,071,146 2,567,389 1,760,429 79,902 556,768 1,008,236 3,306,075 1,509,342
Environment 3,678,066 - 1,999,900 - 5,024,146 493,943 12,063 - - 43,848
Total Governmental Activities Program Revenues 408,581,130 417,192,371 397,595,151 430,069,196 393,356,261 432,358,801 425,112,644 436,825,355 440,554,938 474,053,149
Business-type Activities:
Charges for Services:
Liquor control 191,351,999 201,744,558 213,711,131 220,795,524 229,317,194 242,802,606 252,285,232 259,327,227 268,677,859 278,768,662
Solid waste activities 102,432,416 99,990,932 102,107,187 100,139,024 103,373,586 106,304,522 108,410,918 108,780,916 109,251,865 111,621,329
Parking lot districts 22,978,890 25,306,635 26,486,431 27,303,666 28,252,122 30,647,758 29,208,719 31,980,146 31,093,981 34,717,204
Permitting services 23,949,256 25,523,639 28,320,497 22,998,323 27,840,904 30,537,026 41,196,475 45,231,452 44,393,317 38,595,012
Community use of public facilities 7,977,618 7,869,818 7,788,733 8,576,323 8,405,087 9,854,373 10,378,258 10,555,506 10,986,875 11,133,118
Operating Grants and Contributions:
Solid waste activities - 11,135 10,000 8,700 30,000 - - - - -
Total Business-type Activities Program Revenues 348,690,179 360,446,717 378,423,979 379,821,560 397,218,893 420,146,285 441,479,602 455,875,247 464,403,897 474,835,325
Total Primary Government Program Revenues 757,271,309 777,639,088 776,019,130 809,890,756 790,575,154 852,505,086 866,592,246 892,700,602 904,958,835 948,888,474
Net (Expense) Revenue (1)
Governmental activities (2,541,574,312) (2,734,907,717) (3,060,192,922) (3,166,549,150) (3,088,006,067) (3,018,244,192) (3,083,611,712) (3,194,999,901) (3,242,167,509) (3,269,997,254)
Business-type activities 25,111,328 19,004,148 26,226,204 20,291,641 25,428,559 38,922,952 57,860,232 56,797,043 27,028,531 40,950,761
Total Primary Government Net Expense (2,516,462,984) (2,715,903,569) (3,033,966,718) (3,146,257,509) (3,062,577,508) (2,979,321,240) (3,025,751,480) (3,138,202,858) (3,215,138,978) (3,229,046,493)
General Revenues and Other Changes in Net Position
Governmental Activities:
Taxes (2) 2,602,766,145 2,867,870,217 2,707,037,561 2,759,520,047 2,711,817,013 2,945,614,528 3,083,078,491 3,208,768,624 3,290,585,776 3,228,243,148
Grants, contributions, and other revenue not
restricted to specific programs - - - - - - - - 588,567 -
Investment income (3) 29,769,889 42,003,532 42,586,707 14,173,076 8,299,709 5,543,975 7,035,479 8,036,630 6,457,962 6,787,434
Gain/(loss) on sale of capital assets 5,187,736 6,209,594 13,309,573 1,604,285 (1,366,889) 2,669,858 1,103,216 4,965,531 (3,529,635) 3,882,648
Transfers 32,433,658 34,073,566 32,444,171 44,971,675 55,088,988 53,459,555 47,986,288 44,703,099 46,858,508 55,489,227
Total Governmental Activities 2,670,157,428 2,950,156,909 2,795,378,012 2,820,269,083 2,773,838,821 3,007,287,916 3,139,203,474 3,266,473,884 3,340,961,178 3,294,402,457
Business-type Activities:
Property taxes 9,199,581 9,562,592 11,266,747 11,854,882 9,931,045 9,273,198 8,503,222 10,063,874 10,391,101 10,903,699
Investment income 6,267,935 8,339,098 7,330,179 2,599,459 569,792 154,471 43,202 51,852 100,857 215,823
Gain/(loss) on sale of capital assets - 34,637 - - - - 42,544,670 - (1,241,279) 175,100
Transfers (32,433,658) (34,073,566) (32,444,171) (44,971,675) (55,088,988) (53,459,555) (47,986,288) (44,703,099) (46,858,508) (55,489,227)
Total Business-type Activities (16,966,142) (16,137,239) (13,847,245) (30,517,334) (44,588,151) (44,031,886) 3,104,806 (34,587,373) (37,607,829) (44,194,605)
Total Primary Government 2,653,191,286 2,934,019,670 2,781,530,767 2,789,751,749 2,729,250,670 2,963,256,030 3,142,308,280 3,231,886,511 3,303,353,349 3,250,207,852
Change in Net Position
Governmental activities 128,583,116 215,249,192 (264,814,910) (346,280,067) (314,167,246) (10,956,276) 55,591,762 71,473,983 98,793,669 24,405,203
Business-type activities 8,145,186 2,866,909 12,378,959 (10,225,693) (19,159,592) (5,108,934) 60,965,038 22,209,670 (10,579,298) (3,243,844)
Total Primary Government 136,728,302$ 218,116,101$ (252,435,951)$ (356,505,760)$ (333,326,838)$ (16,065,210)$ 116,556,800$ 93,683,653$ 88,214,371$ 21,161,359$
NOTES:
* This table presents information from the basic financial statement Exhibit A-2.
* Government-wide net position information is reported on the accrual basis of accounting.
(1)
(2) See Table 2-b for detail of General Tax Revenues(3)
Net (expense)/revenue is the difference between the expenses and program revenues of a function or program. It indicates the degree to which a function or program is supported with its own fees and program-specific grants versus its reliance upon funding from taxes and general revenues. Numbers in parentheses indicate that expenses were greater than program revenues and therefore general revenues were needed to finance that function or program. Numbers without parentheses mean that program revenues were more than sufficient to cover expenses.
Certain amounts have been restated or reclassified to conform with the following year's presentation.
205

MONTGOMERY COUNTY, MARYLANDFINANCIAL TRENDS
GENERAL TAX REVENUES - GOVERNMENTAL ACTIVITIESLAST TEN FISCAL YEARSTable 2-b
2006 2007 2008 2009 2010
Property taxes 1,064,737,107$ 1,126,632,925$ 1,146,965,583$ 1,296,974,051$ 1,371,964,491$
County income taxes 1,117,543,440 1,388,927,139 1,246,939,067 1,169,568,981 1,010,874,757
Real property transfer taxes 145,478,479 106,902,482 80,380,388 64,771,739 77,106,332
Recordation taxes 96,239,932 72,672,928 54,658,577 42,437,216 44,934,687
Fuel energy taxes 117,381,196 118,853,224 118,277,973 129,328,307 156,880,330
Hotel-motel taxes 15,869,779 17,476,723 17,783,194 16,829,254 17,064,493
Telephone taxes 29,176,263 29,375,812 30,472,124 30,906,025 29,741,879
Other taxes 16,339,949 7,028,984 11,560,655 8,704,474 3,250,044
Total Taxes - Governmental Activities 2,602,766,145$ 2,867,870,217$ 2,707,037,561$ 2,759,520,047$ 2,711,817,013$
2011 2012 2013 2014 2015
Property taxes 1,358,968,819$ 1,395,693,492$ 1,463,855,656$ 1,528,302,790$ 1,528,093,085$
County income taxes 1,151,260,721 1,265,289,159 1,311,161,472 1,329,827,192 1,276,415,595
Real property transfer taxes 71,809,475 76,089,437 84,391,394 90,496,157 92,068,495
Recordation taxes 57,725,334 51,207,341 57,635,661 53,962,477 55,530,762
Fuel energy taxes 233,408,845 226,148,664 223,948,716 210,678,660 207,195,218
Hotel-motel taxes 19,295,158 18,167,827 18,910,872 17,675,982 19,007,650
Telephone taxes 49,087,889 46,470,315 45,696,525 53,160,865 48,839,958
Other taxes 4,058,287 4,012,256 3,168,328 6,481,653 1,092,385
Total Taxes - Governmental Activities 2,945,614,528$ 3,083,078,491$ 3,208,768,624$ 3,290,585,776$ 3,228,243,148$
NOTES:
* Government-wide general tax revenue information is reported on the accrual basis of accounting.
206
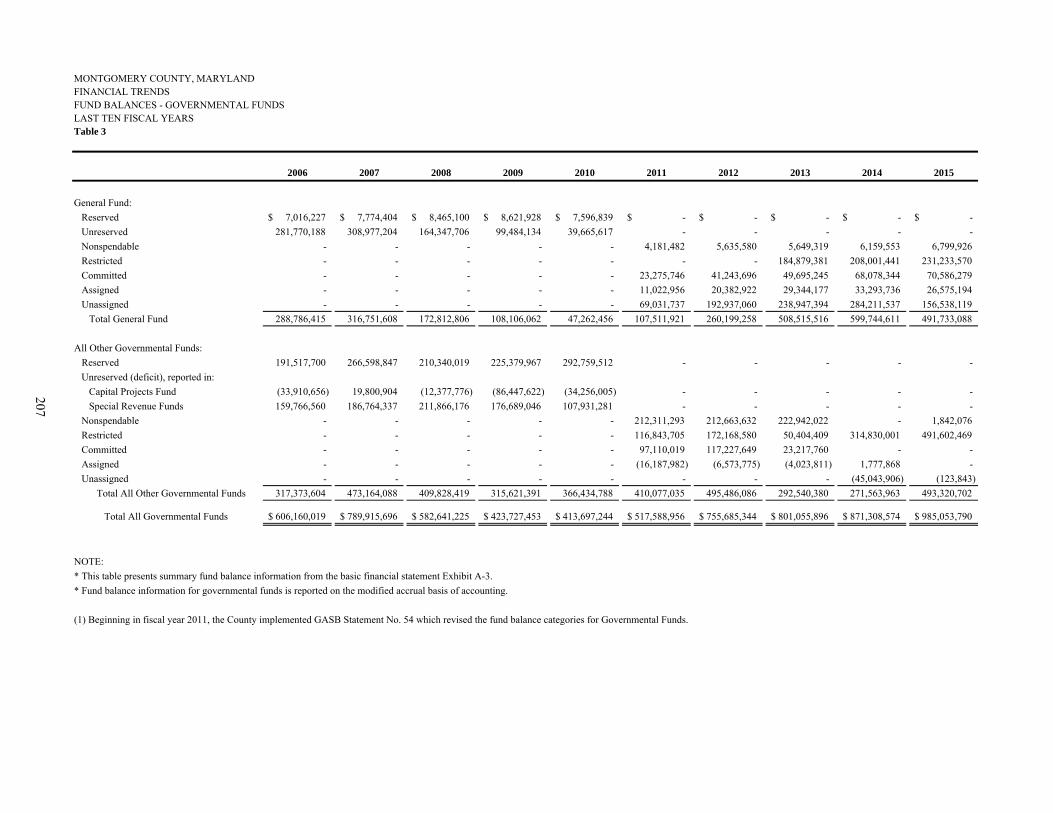
MONTGOMERY COUNTY, MARYLANDFINANCIAL TRENDSFUND BALANCES - GOVERNMENTAL FUNDSLAST TEN FISCAL YEARSTable 3
2006 2007 2008 2009 2010 2011 2012 2013 2014 2015
General Fund:
Reserved 7,016,227$ 7,774,404$ 8,465,100$ 8,621,928$ 7,596,839$ -$ -$ -$ -$ -$
Unreserved 281,770,188 308,977,204 164,347,706 99,484,134 39,665,617 - - - - -
Nonspendable - - - - - 4,181,482 5,635,580 5,649,319 6,159,553 6,799,926
Restricted - - - - - - - 184,879,381 208,001,441 231,233,570
Committed - - - - - 23,275,746 41,243,696 49,695,245 68,078,344 70,586,279
Assigned - - - - - 11,022,956 20,382,922 29,344,177 33,293,736 26,575,194
Unassigned - - - - - 69,031,737 192,937,060 238,947,394 284,211,537 156,538,119
Total General Fund 288,786,415 316,751,608 172,812,806 108,106,062 47,262,456 107,511,921 260,199,258 508,515,516 599,744,611 491,733,088
All Other Governmental Funds:
Reserved 191,517,700 266,598,847 210,340,019 225,379,967 292,759,512 - - - - -
Unreserved (deficit), reported in:
Capital Projects Fund (33,910,656) 19,800,904 (12,377,776) (86,447,622) (34,256,005) - - - - -
Special Revenue Funds 159,766,560 186,764,337 211,866,176 176,689,046 107,931,281 - - - - -
Nonspendable - - - - - 212,311,293 212,663,632 222,942,022 - 1,842,076
Restricted - - - - - 116,843,705 172,168,580 50,404,409 314,830,001 491,602,469
Committed - - - - - 97,110,019 117,227,649 23,217,760 - -
Assigned - - - - - (16,187,982) (6,573,775) (4,023,811) 1,777,868 -
Unassigned - - - - - - - - (45,043,906) (123,843)
Total All Other Governmental Funds 317,373,604 473,164,088 409,828,419 315,621,391 366,434,788 410,077,035 495,486,086 292,540,380 271,563,963 493,320,702
Total All Governmental Funds 606,160,019$ 789,915,696$ 582,641,225$ 423,727,453$ 413,697,244$ 517,588,956$ 755,685,344$ 801,055,896$ 871,308,574$ 985,053,790$
NOTE:
* This table presents summary fund balance information from the basic financial statement Exhibit A-3.
* Fund balance information for governmental funds is reported on the modified accrual basis of accounting.
(1) Beginning in fiscal year 2011, the County implemented GASB Statement No. 54 which revised the fund balance categories for Governmental Funds.
207
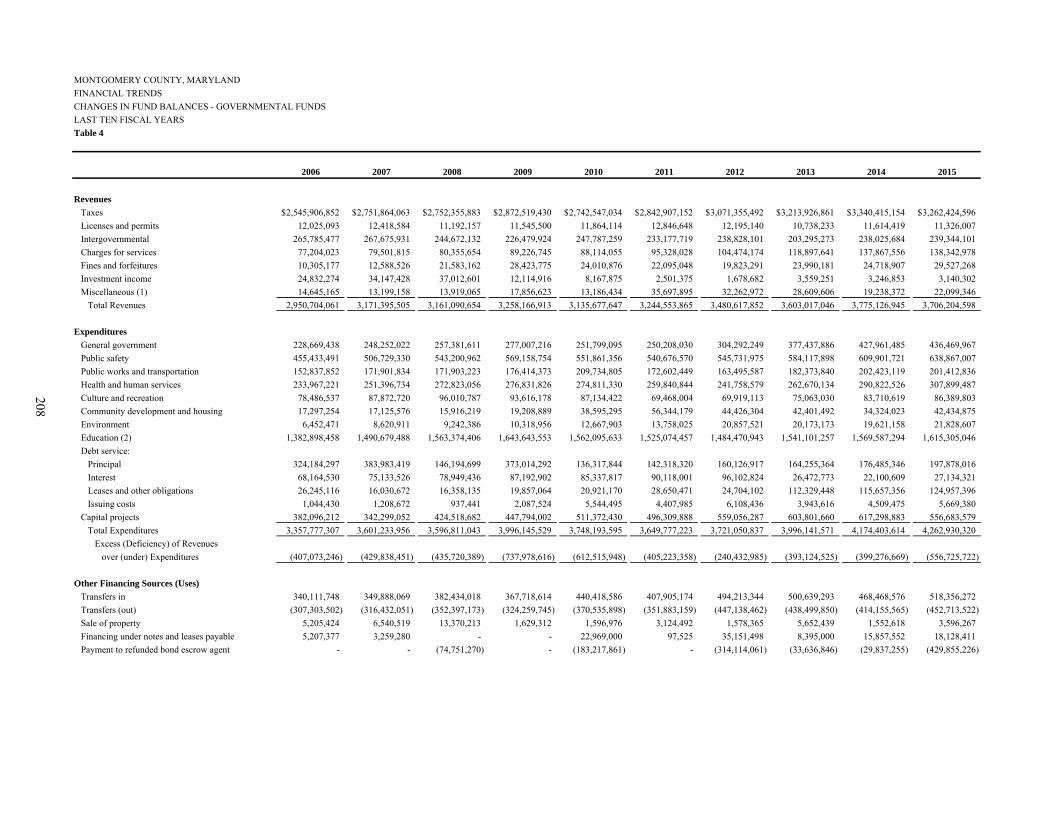
MONTGOMERY COUNTY, MARYLAND
FINANCIAL TRENDS
CHANGES IN FUND BALANCES - GOVERNMENTAL FUNDS
LAST TEN FISCAL YEARS
Table 4
2006 2007 2008 2009 2010 2011 2012 2013 2014 2015
Revenues
Taxes 2,545,906,852$ 2,751,864,063$ 2,752,355,883$ 2,872,519,430$ 2,742,547,034$ 2,842,907,152$ 3,071,355,492$ 3,213,926,861$ 3,340,415,154$ 3,262,424,596$
Licenses and permits 12,025,093 12,418,584 11,192,157 11,545,500 11,864,114 12,846,648 12,195,140 10,738,233 11,614,419 11,326,007
Intergovernmental 265,785,477 267,675,931 244,672,132 226,479,924 247,787,259 233,177,719 238,828,101 203,295,273 238,025,684 239,344,101
Charges for services 77,204,023 79,501,815 80,355,654 89,226,745 88,114,055 95,328,028 104,474,174 118,897,641 137,867,556 138,342,978
Fines and forfeitures 10,305,177 12,588,526 21,583,162 28,423,775 24,010,876 22,095,048 19,823,291 23,990,181 24,718,907 29,527,268
Investment income 24,832,274 34,147,428 37,012,601 12,114,916 8,167,875 2,501,375 1,678,682 3,559,251 3,246,853 3,140,302
Miscellaneous (1) 14,645,165 13,199,158 13,919,065 17,856,623 13,186,434 35,697,895 32,262,972 28,609,606 19,238,372 22,099,346
Total Revenues 2,950,704,061 3,171,395,505 3,161,090,654 3,258,166,913 3,135,677,647 3,244,553,865 3,480,617,852 3,603,017,046 3,775,126,945 3,706,204,598
Expenditures
General government 228,669,438 248,252,022 257,381,611 277,007,216 251,799,095 250,208,030 304,292,249 377,437,886 427,961,485 436,469,967
Public safety 455,433,491 506,729,330 543,200,962 569,158,754 551,861,356 540,676,570 545,731,975 584,117,898 609,901,721 638,867,007
Public works and transportation 152,837,852 171,901,834 171,903,223 176,414,373 209,734,805 172,602,449 163,495,587 182,373,840 202,423,119 201,412,836
Health and human services 233,967,221 251,396,734 272,823,056 276,831,826 274,811,330 259,840,844 241,758,579 262,670,134 290,822,526 307,899,487
Culture and recreation 78,486,537 87,872,720 96,010,787 93,616,178 87,134,422 69,468,004 69,919,113 75,063,030 83,710,619 86,389,803
Community development and housing 17,297,254 17,125,576 15,916,219 19,208,889 38,595,295 56,344,179 44,426,304 42,401,492 34,324,023 42,434,875
Environment 6,452,471 8,620,911 9,242,386 10,318,956 12,667,903 13,758,025 20,857,521 20,173,173 19,621,158 21,828,607
Education (2) 1,382,898,458 1,490,679,488 1,563,374,406 1,643,643,553 1,562,095,633 1,525,074,457 1,484,470,943 1,541,101,257 1,569,587,294 1,615,305,046
Debt service:
Principal 324,184,297 383,983,419 146,194,699 373,014,292 136,317,844 142,318,320 160,126,917 164,255,364 176,485,346 197,878,016
Interest 68,164,530 75,133,526 78,949,436 87,192,902 85,337,817 90,118,001 96,102,824 26,472,773 22,100,609 27,134,321
Leases and other obligations 26,245,116 16,030,672 16,358,135 19,857,064 20,921,170 28,650,471 24,704,102 112,329,448 115,657,356 124,957,396
Issuing costs 1,044,430 1,208,672 937,441 2,087,524 5,544,495 4,407,985 6,108,436 3,943,616 4,509,475 5,669,380
Capital projects 382,096,212 342,299,052 424,518,682 447,794,002 511,372,430 496,309,888 559,056,287 603,801,660 617,298,883 556,683,579
Total Expenditures 3,357,777,307 3,601,233,956 3,596,811,043 3,996,145,529 3,748,193,595 3,649,777,223 3,721,050,837 3,996,141,571 4,174,403,614 4,262,930,320
Excess (Deficiency) of Revenues
over (under) Expenditures (407,073,246) (429,838,451) (435,720,389) (737,978,616) (612,515,948) (405,223,358) (240,432,985) (393,124,525) (399,276,669) (556,725,722)
Other Financing Sources (Uses)
Transfers in 340,111,748 349,888,069 382,434,018 367,718,614 440,418,586 407,905,174 494,213,344 500,639,293 468,468,576 518,356,272
Transfers (out) (307,303,502) (316,432,051) (352,397,173) (324,259,745) (370,535,898) (351,883,159) (447,138,462) (438,499,850) (414,155,565) (452,713,522)
Sale of property 5,205,424 6,540,519 13,370,213 1,629,312 1,596,976 3,124,492 1,578,365 5,652,439 1,552,618 3,596,267
Financing under notes and leases payable 5,207,377 3,259,280 - - 22,969,000 97,525 35,151,498 8,395,000 15,857,552 18,128,411
Payment to refunded bond escrow agent - - (74,751,270) - (183,217,861) - (314,114,061) (33,636,846) (29,837,255) (429,855,226)
208

Debt Issued:
General obligation bonds 105,456,700 268,839,000 - 250,000,000 310,000,000 325,000,000 320,000,000 295,000,000 295,000,000 500,000,000
Premium on general obligation bonds - - - - 9,937,130 28,107,877 37,661,920 32,201,168 30,795,345 81,853,250
Bond anticipation notes 300,000,000 300,000,000 150,000,000 250,000,000 125,000,000 75,000,000 - - - -
Certificates of participation - - 34,583,195 - 24,483,684 - - - - -
Lease revenue bonds 1,747,573 835,614 399,231 15,059,652 14,700 29,360,000 28,840,000 - - -
Taxable LTD obligation certificate - - - - 30,400,000 - - - 38,015,000 -
Discount on Taxable LTD obligation certificate - - - - - - - - (4,763) -
Variable rate demand obligations 100,000,000 - - - - - - - - -
Notes payable - - - 10,000,000 - - - - - -
Premium on general obligation refunding bonds - - - - 22,055,598 - 43,863,734 2,013,430 5,023,826 74,595,486
Capital lease financing 8,379,687 663,698 12,407 - 11,985 - - - - -
General obligation refunding bonds - - 74,795,297 8,917,011 161,755,000 - 237,655,000 23,360,000 25,059,716 356,510,000
Lease revenue refunding bonds - - - - - - 35,465,000 - - -
Premium on lease revenue refunding bonds - - - - - - 5,353,035 57,288 - -
Revenue bonds - - - - - - - 37,835,000 32,383,753 -
Premium on revenue bonds - - - - - - - 5,478,155 1,370,544 -
Total Other Financing Sources (Uses) 558,805,007 613,594,129 228,445,918 579,064,844 594,888,900 516,711,909 478,529,373 438,495,077 469,529,347 670,470,938
Net Change in Fund Balances 151,731,761$ 183,755,678$ (207,274,471)$ (158,913,772)$ (17,627,048)$ 111,488,551$ 238,096,388$ 45,370,552$ 70,252,678$ 113,745,216$
Debt service as a percentage of
noncapital expenditures (1, 2) 12.26% 13.29% 6.56% 12.13% 6.44% 6.80% 7.47% 5.15% 5.25% 5.66%
NOTES:
* This table is a summary of the basic financial statement Exhibit A-5.
* Governmental fund information is reported on the modified accrual basis of accounting.
(1) Debt service represents debt service principal and interest expenditures presented above.
(2) Noncapital expenditures represents Total Expenditures above, less Capital Projects Fund and capital outlay expenditures that resulted in capital assets.
209

MONTGOMERY COUNTY, MARYLANDFINANCIAL TRENDSCOMBINED SCHEDULE OF CASH AND INVESTMENTS AND INVESTMENT AND INTEREST INCOME - ALL FUNDSAS OF JUNE 30, 2015 AND FOR THE FISCAL YEAR ENDED JUNE 30, 2015Table 5
Cash and Investments Investment and Interest Income (Loss)Pooled Non-pooled Total Pooled Non-pooled Total
Primary Government:
General Fund 370,105,907$ 5,829,436$ 375,935,343$ 365,480$ 8,197$ 373,677$
Debt Service Fund 10,337,434 6,931,557 17,268,991 8,957 4,741 13,698
Capital Projects Fund 250,486,616 37,590,270 288,076,886 267,984 30,478 298,462
Special Revenue Funds:Recreation 1,416,157 5,750 1,421,907 11,567 - 11,567 Fire Tax District 35,603,120 5,000 35,608,120 75,192 - 75,192 Mass Transit Facilities 207,142 2,000 209,142 - - - Urban Districts 978,160 - 978,160 573 - 573 Housing Initiative 18,040,557 212,450 18,253,007 21,642 2,018,178 2,039,820 Rehabilitation Loan 1,819,144 - 1,819,144 2,220 58,850 61,070 Economic Development 2,259,914 - 2,259,914 3,815 24,623 28,438 Cable TV (2) 5,709,248 - 5,709,248 8,507 - 8,507 Grants (1) 987,468 - 987,468 - 196,060 196,060 Agricultural Transfer Tax 808,698 - 808,698 1,338 - 1,338 Drug Enforcement Forfeitures 3,071,095 25,000 3,096,095 3,839 - 3,839 Water Quality Protection 17,955,669 - 17,955,669 28,213 - 28,213 Restricted Donations 1,714,421 - 1,714,421 - - -
Total Special Revenue Funds 90,570,793 250,200 90,820,993 156,906 2,297,711 2,454,617
Enterprise Funds:Liquor 4,256,413 5,004,089 9,260,502 441 23,294 23,735 Solid Waste Activities 66,222,891 3,000 66,225,891 63,194 - 63,194 Parking Lot Districts 34,212,994 4,447,595 38,660,589 45,582 2,862 48,444 Permitting Services 50,625,990 - 50,625,990 65,618 - 65,618 Community Use of Public Facilities 10,698,342 - 10,698,342 14,832 - 14,832
Total Enterprise Funds 166,016,630 9,454,684 175,471,314 189,667 26,156 215,823
Internal Service Funds:Motor Pool 11,426,555 300 11,426,855 36,633 - 36,633 Liability & Property Coverage Self-Insurance 143,637,450 - 143,637,450 192,939 69 193,008 Employee Health Benefits Self-Insurance 23,349,425 - 23,349,425 23,698 - 23,698 Central Duplicating 278,200 - 278,200 223 - 223
Total Internal Service Funds 178,691,630 300 178,691,930 253,493 69 253,562
Pension and Other Employee Benefit Trust Funds (1) 2,343,846 5,209,093,490 5,211,437,336 21,151 116,528,879 116,550,030 Investment Trust Fund 33,951,853 - 33,951,853 (10,158) - (10,158) Private Purpose Trust Funds 60,024 - 60,024 - 28 28 Agency Funds 34,313,582 132,871 34,446,453 1,707 - 1,707
Total Primary Government 1,136,878,315 5,269,282,808 6,406,161,123 1,255,187 118,896,259 120,151,446
Component Units (Participation in County Pool) 381,831 - 381,831 461 - 461
Total 1,137,260,146$ 5,269,282,808$ 6,406,542,954$ 1,255,648$ 118,896,259$ 120,151,907$
NOTES:* This table presents cash and investment related information, by fund, that is reported throughout the basic financial statements and supplementary data.(1)(2)
Non-pooled investment income of these funds includes adjustments to fair value of non-pooled investments.Pooled investment income of the Cable TV Special Revenue Fund includes $152 related to interest earned on deposits, which has been classified as a liability.
210

MONTGOMERY COUNTY, MARYLANDFINANCIAL TRENDSCOMBINED SCHEDULE OF CASH AND INVESTMENTS - BY FINANCIAL INSTITUTIONJUNE 30, 2015Table 6
Description Total
PNC Bank 392,086,102$
Bank of New York 1,000,000
Capital One Bank 17,542,812
Congressional Bank 4,770,875
Eagle Bank 42,257,559
Capital Bank 2,636,456
Total Financial Institutions 460,293,804
Petty Cash, Change Funds, Fiscal Agents, and Safe Deposit Escrow:
General Fund 5,829,436
Debt Service Fund 6,931,557
Capital Projects Fund 37,590,270
Special Revenue Funds 250,200
Enterprise Funds 5,136,393
Internal Service Funds 300
Fiduciary Funds 132,871
Total Petty Cash, Change Funds, Fiscal Agents, and Safe Deposit Escrow 55,871,027
Total Cash Deposits in Financial Institutions and on Hand 516,164,831
Investments, at carrying value 5,888,851,752
Accrued interest receivable 1,526,371
Total Cash and Investments (1) 6,406,542,954$
NOTES:
(1) Includes component units' participation in County external investment pool (see Table 5).
This table presents detailed cash and investment information that supports amounts reported in Table 5 and in Note III-A Cash and Investments.
211

MONTGOMERY COUNTY, MARYLANDFINANCIAL TRENDSCOMBINED SCHEDULE OF INVESTMENTSJUNE 30, 2015Table 7
TotalCarrying
Pooled Enterprise Fiduciary Value (2)
Investments, including accrued interest:
U.S. Government Securities 454,177,227$ -$ -$ 454,177,227$
Commercial paper 70,484,237 - - 70,484,237
Money Market Funds - 4,318,291 - 4,318,291
State Pool 150,778,507 - - 150,778,507
Pension and Other Employee Benefit Trusts - - 5,209,093,490 5,209,093,490
Total (1) 675,439,971$ 4,318,291$ 5,209,093,490$ 5,888,851,752$
NOTES: *
(1) Includes component units' participation in County external investment pool (see Table 5).
(2) Carrying value is the same as fair value.
Non-Pooled
This table presents detailed cash and investment information that supports amounts reported in Table 5 and in Note III-A Cash and Investments.
212

MONTGOMERY COUNTY, MARYLANDREVENUE CAPACITYASSESSED AND ESTIMATED ACTUAL VALUE OF TAXABLE PROPERTYLAST TEN FISCAL YEARSTable 8
TotalAssessed Estimated Assessed Estimated Assessed Estimated Direct
Value Market Value Value Market Value Value Market Value Tax Rate (3)
84,762,150,340$ 90,946,513,240$ 25,767,098,776$ 27,647,101,691$ 110,529,249,116$ 118,593,614,931$ 0.952
96,569,606,606 101,120,006,917 29,141,169,512 30,514,313,625 125,710,776,118 131,634,320,542 0.902
110,002,920,713 112,247,878,279 32,303,514,880 32,962,770,285 142,306,435,593 145,210,648,564 0.902
123,318,552,451 127,923,809,596 34,814,939,022 36,115,081,973 158,133,491,473 164,038,891,569 0.902
131,149,193,561 137,472,949,225 35,947,649,976 37,680,974,818 167,096,843,537 175,153,924,043 0.904
131,778,908,275 149,071,163,208 36,011,884,254 40,737,425,626 167,790,792,529 189,808,588,834 0.904
129,513,818,139 139,412,075,499 32,683,331,619 35,181,196,575 162,197,149,758 174,593,272,074 0.947
124,783,384,563 134,320,112,554 33,489,446,285 36,048,919,575 158,272,830,848 170,369,032,129 0.990
125,035,897,087 136,502,071,055 34,855,968,247 38,052,367,082 159,891,865,334 174,554,438,137 1.008
127,929,975,330 138,452,354,253 35,726,782,876 38,665,349,433 163,656,758,206 177,117,703,686 0.995
TotalOperating Domestic Direct Assessed Estimated
Individuals Corporations Property Shares Total Tax Rate (3) Value Actual Value
39,858,300$ 2,275,916,200$ 1,046,842,820$ 469,011,910$ 3,831,629,230$ 2.367 114,360,878,346$ 122,425,244,161$ 93.41
36,342,680 2,353,070,220 1,070,305,710 489,230,940 3,948,949,550 2.244 129,659,725,668 135,583,270,092 95.63
34,444,330 2,412,515,690 1,035,536,740 488,050,610 3,970,547,370 2.241 146,276,982,963 149,181,195,934 98.05
31,767,940 2,328,560,300 1,077,766,490 482,076,290 3,920,171,020 2.241 162,053,662,493 167,959,062,589 96.48
30,405,750 2,494,866,410 1,099,074,782 499,649,670 4,123,996,612 2.247 171,220,840,149 179,277,920,655 95.51
44,693,880 2,295,053,040 1,075,595,252 440,849,780 3,856,191,952 2.247 171,646,984,481 193,664,780,786 88.63
44,967,690 2,206,151,910 1,063,567,900 404,258,210 3,718,945,710 2.357 165,916,095,468 178,312,217,784 93.05
46,638,380 2,092,070,220 1,081,466,940 384,303,210 3,604,478,750 2.463 161,877,309,598 173,973,510,879 93.05
42,416,630 2,172,248,760 1,120,973,968 373,688,150 3,709,327,508 2.509 163,601,192,842 178,263,765,645 91.77
42,008,150 2,075,584,320 1,181,901,740 355,639,000 3,655,133,210 2.477 167,311,891,416 180,772,836,896 92.55
NOTES:*
*
*
*
(1)
(2) For personal property, the assessed value and estimated actual value are the same.
(3)
2006
Real PropertyResidential (1) Commercial/Other Total
FiscalYear
Ratio of Total Assessed to Total Estimated Actual
Value
Business Public Utility
2007
2008
2009
2010
2011
2012
2015
2010
2013
2014
Personal Property (2) Real and Personal Property Total
2006
2007
2008
2009
FiscalYear
2011
2012
2013
2014
Exempt and nontaxable property are not included in this table.
The following classes of property are not taxed: 1) personal property not used in a trade, business, or profession, and 2) business inventories.
Intangible personal property is exempt from taxation except in two instances: shares of stock in certain domestic utilities and oil pipeline corporations (shown above) and intangible personal property of corporations under a contract with the State, granted charter exemptions from property taxation.
Property owned by the Federal government, the State, or a subdivision or agency of either, is exempt. Also exempt are real and personal property used for religious, educational, or charitable purposes. Specific exemptions involve historical property, societies and museums, conservation property, cemeteries, certain fraternal and service organizations, continuing care facilities for the aged, nonprofit housing property, and dwelling houses of disabled veterans and blind persons.
Residential real property includes single-family homes, townhouses, and condominiums but excludes apartment dwellings which are included under the Commercial/Other category.
See Table 9-a for real and personal property direct tax rates. Source: State of Maryland, Department of Assessments and Taxation.
2015
213

MONTGOMERY COUNTY, MARYLANDREVENUE CAPACITYREAL AND PERSONAL PROPERTY TAX RATES - COUNTY DIRECT RATELAST TEN FISCAL YEARSTable 9-a
M-NCPPC (2)Fire Tax Transit Advance Land Storm Regional Metropolitan Prorata Total County
County District District Acquisition Subtotal Recreation Drainage District District Tax Rate Direct Rate (3)
Real Property:$ .6790 $ .1340 $ .0420 $ .0010 $ .8560 $ .0250 $ .0030 $ .0220 $ .0610 $ .0960 $ .9520
.6240 .1340 .0530 .0010 .8120 .0240 .0030 .0200 .0570 .0900 .9020 .6270 .1260 .0580 .0010 .8120 .0240 .0030 .0190 .0580 .0900 .9020 .6610 .1160 .0400 .0010 .8180 .0220 .0030 .0190 .0530 .0840 .9020 .6830 .1050 .0370 .0010 .8260 .0190 .0030 .0180 .0500 .0780 .9040 .6990 .0970 .0370 .0010 .8340 .0180 .0030 .0150 .0450 .0700 .9040 .7130 .1210 .0380 .0010 .8730 .0180 .0030 .0170 .0480 .0740 .9470 .7240 .1340 .0480 .0010 .9070 .0210 .0030 .0180 .0540 .0830 .9900 .7590 .1250 .0420 .0010 .9270 .0200 .0030 .0180 .0530 .0810 1.0080 .7320 .1360 .0400 .0010 .9090 .0230 .0030 .0170 .0560 .0857 .9947
Personal Property:$ 1.6980 $ .3350 $ .1050 $ .0030 $ 2.1410 $ .0630 $ .0080 $ .0550 $ .1530 $ .2260 $ 2.3670
1.5600 .3350 .1330 .0030 2.0310 .0600 .0080 .0500 .1430 .2130 2.24401.5670 .3150 .1450 .0030 2.0300 .0600 .0070 .0470 .1450 .2110 2.24101.6520 .2900 .1000 .0030 2.0450 .0550 .0070 .0470 .1320 .1960 2.24101.7070 .2620 .0920 .0030 2.0640 .0470 .0070 .0450 .1250 .1830 2.24701.7470 .2420 .0920 .0030 2.0840 .0450 .0070 .0380 .1120 .1630 2.24701.7830 .3030 .0950 .0030 2.1840 .0450 .0080 .0430 .1200 .1730 2.35701.8100 .3350 .1200 .0030 2.2680 .0530 .0080 .0450 .1350 .1950 2.46301.8980 .3130 .1050 .0030 2.3190 .0500 .0080 .0450 .1330 .1900 2.50901.8300 .3400 .1000 .0030 2.2730 .0580 .0080 .0430 .1400 .2003 2.4733
NOTES:* The Tax rates are per $100 of assessed value.*
* No discounts are allowed.* Taxes are levied as of July 1, are due by September 30, and become delinquent the following October 1 for non-owner occupied property.** Interest and penalty at 20 percent are assessed on delinquent tax bills.* Revised tax bills based upon certifications from the State received after September 1 may be paid within thirty days without interest.* Delinquent taxes on real property are collected by sale. Taxes on personal property are enforced by legal action. Corporations may lose charter for failure to pay taxes.* Costs of tax sale, which vary, are added to tax bills. The last sale cost $50 per parcel.* Tax sale date: second Monday in June.* Personal property tax rates are applied to 100 percent of the property assessment.
(1)(2)(3)
Unless homeowners elect to pay their real property taxes annually, taxes are paid on a semi-annual basis with payment due by September 30 and December 31 for owner occupied property.
Rates classified as substantially county-wide represent those tax rates that are levied against all of the County's assessable base, except those incorporated cities and municipalities that provide their own such service. M-NCPPC County property tax rates are included in the County's direct rate since the County Council has the power to set, modify, or approve these tax rates for this joint venture organization.County direct rate includes: County tax rates that are levied County-wide, and County tax rates levied by M-NCPPC. For County special taxing district tax rates that are levied substantially County-wide, the direct rate includes a prorata portion of the tax rate that corresponds to the portion of the County's assessable base against which the rate is levied. Therefore, the total County direct rate presented above is not a mathematical sum of all the individual rates presented.
The charter requires that revenues from real property taxes cannot exceed last year's revenues adjusted by the rate of inflation excluding revenues from new construction. The Council can adopt tax rates that exceed this limit by a supermajority of seven out of nine councilmembers.
2015201420132012201120102009200820072006
2015201420132012201120102009
20072008
County-wide Substantially County-wide (1)County County M-NCPPC (2)
2006
214

MONTGOMERY COUNTY, MARYLANDREVENUE CAPACITYREAL AND PERSONAL PROPERTY TAX RATES - COUNTY SPECIAL TAXING DISTRICTSLAST TEN FISCAL YEARSTable 9-b
Silver Montgomery Silver Cabin Kingsview West White Spring Bethesda Wheaton Hills Spring Bethesda Wheaton Bradley John Village Germantown Flint (2)
Real Property:$ .2800 $ .2800 $ .2400 $ .2400 $ .0240 $ .0160 $ .0300 $ .1450 $ .1850 $ .0890 $ .1870 $ .0000
.2800 .2800 .2400 .2400 .0240 .0160 .0300 .0500 .0010 .0650 .1610 .0000 .2800 .2800 .2400 .2400 .0240 .0160 .0300 .0800 .0800 .0710 .1560 .0000 .2800 .2800 .2400 .2400 .0240 .0120 .0300 .0800 .0800 .0630 .1440 .0000 .2800 .1800 .2400 .2400 .0240 .0120 .0300 .0800 .0800 .0860 .1370 .0000 .3170 .1040 .2400 .2400 .0240 .0120 .0300 .0800 .0800 .0790 .1630 .0000 .3170 .1040 .2400 .2400 .0240 .0120 .0300 .0770 .0800 .0990 .1650 .1070 .3170 .1240 .2400 .2400 .0240 .0120 .0300 .0000 .0100 .0990 .1730 .1120 .3170 .1240 .2400 .2400 .0240 .0120 .0300 .0000 .0000 .1050 .1830 .1130 .3170 .1240 .2400 .2400 .0240 .0120 .0300 .0000 .0000 .0810 .1820 .1120
Personal Property:$ .7000 $ .7000 $ .6000 $ .6000 $ .0600 $ .0400 $ .0750 $ .3630 $ .4630 $ .0000 $ .0000 $ .0000
.7000 .7000 .6000 .6000 .0600 .0400 .0750 .1250 .1250 .0000 .0000 .0000 .7000 .7000 .6000 .6000 .0600 .0400 .0750 .2000 .2000 .0000 .0000 .0000 .7000 .7000 .6000 .6000 .0600 .0300 .0750 .2000 .2000 .0000 .0000 .0000 .7000 .4500 .6000 .6000 .0600 .0300 .0750 .2000 .2000 .0000 .0000 .0000 .7920 .2600 .6000 .6000 .0600 .0300 .0750 .2000 .2000 .0000 .0000 .0000 .7930 .2600 .6000 .6000 .0600 .0300 .0750 .1930 .2000 .0000 .0000 .0000 .7930 .3100 .6000 .6000 .0600 .0300 .0750 .0000 .0250 .0000 .0000 .0000 .7930 .3100 .6000 .6000 .0600 .0300 .0750 .0000 .0000 .0000 .0000 .0000 .7930 .3100 .6000 .6000 .0600 .0300 .0750 .0000 .0000 .0000 .0000 .0000
NOTES:***
(1)(2)
White Flint Special Taxing District was established in November 2010 and levy year 2011 was the first year that the property tax on commercial properties went into effect.
2009201020112012201320142015
Tax rates are per $100 of assessed value.Personal property tax rates are applied to 100 percent of the property assessment.The County special taxing district rates above represent taxes that are levied against mutually exclusive specific geographic portions of the County's assessable base. Such rates are not included in the County direct rate on Table 9-a, as they are not reflective of what all County taxpayers would pay.
Parking Lot Districts also carry a tax rate of one-half the amount shown which applies to property zoned commercial but not used as such.
2008
200720082009201020112012201320142015
20062007
2006
FiscalYear
Noise Abatement Districts Development Districts Parking Lot Districts (1) Urban Districts
215

MONTGOMERY COUNTY, MARYLANDREVENUE CAPACITYREAL AND PERSONAL PROPERTY TAX RATES - OVERLAPPING GOVERNMENTS - CITIES AND TOWNSLAST TEN FISCAL YEARSTable 9-c
Takoma Chevy Garrett Glen WashingtonGaithersburg Rockville Park Barnesville Brookeville Chase Park Echo Kensington Laytonsville Poolesville Somerset Grove
Real Property:$ .2120 $ .3220 $ .6300 $ .0650 $ .1500 $ .0290 $ .2000 $ .1200 $ .1550 $ .1600 $ .2210 $ .0450 $ .2020
.2120 .3120 .6300 .0600 .1500 .0260 .1900 .1200 .1470 .1400 .2000 .0400 .2020 .2120 .3020 .6100 .0540 .1500 .0230 .1900 .1200 .1390 .1400 .1800 .0400 .2020 .2120 .2920 .6050 .0540 .1500 .0210 .1900 .1300 .1300 .1200 .1600 .0400 .1810 .2120 .2920 .5800 .0490 .1500 .0100 .1920 .1300 .1220 .1100 .1500 .0400 .1810 .2620 .2920 .5800 .0514 .1500 .0100 .1920 .1300 .1360 .1000 .1594 .0800 .2210 .2620 .2920 .5800 .0514 .1500 .0105 .2100 .1300 .1360 .1100 .1594 .0800 .2210 .2620 .2920 .5800 .0514 .1500 .0104 .2100 .1340 .1360 .1100 .1590 .0800 .3170 .2620 .2920 .5700 .0514 .1500 .0000 .2100 .1400 .1360 .1000 .1672 .0800 .3000 .2620 .2920 .5700 .0514 .1500 .0000 .2100 .1400 .1360 .0900 .1672 .0800 .3000
Personal Property:$ .5300 $ .8050 $ 1.5750 $ .2000 $ .4500 $ .1000 $ 1.0000 $ .8000 $ .5000 $ .3500 $ .6000 $ .2200 $ .6000
.5300 .8050 1.5750 .2000 .4500 .1000 1.0000 .8000 .5000 .3500 .6000 .2200 .6000 .5300 .8050 1.5250 .2000 .4500 .1000 1.0000 .8000 .5000 .3500 .6000 .2200 .6000 .5300 .8050 1.5130 .2000 .4500 .1000 1.0000 .8000 .5000 .3300 .6000 1.0000 .6000 .5300 .8050 1.4500 .2000 .4500 .1000 1.0000 .8000 .5000 .3100 .6000 1.0000 .6000 .5300 .8050 1.4500 .2000 .4500 .1000 1.0000 .8000 .5500 .3000 .6000 1.0000 .6000 .5300 .8050 1.4500 .2000 .4500 .1000 1.0000 .8000 .5500 .3000 .6000 1.0000 .6000 .5300 .8050 1.5500 .2000 .4500 .1000 1.0000 .8000 .5500 .3000 .6000 1.0000 .6000 .5300 .8050 1.5500 .2000 .4500 .0000 1.0000 .8000 .5700 .3000 .6000 1.0000 .7000 .5300 .8050 1.5500 .2000 .4500 .0000 1.0000 .8000 .6200 .3000 .6000 1.0000 .7000
NOTES:* Tax rates are per $100 of assessed value.* Personal property tax rates are applied to 100 percent of the property assessment.* Taxes collected by the County for other fiscal units, including overlapping governments, are remitted based on actual collections.
Cities TownsFiscalYear
2006200720082009201020112012201320142015
2006
2012201320142015
20072008200920102011
216
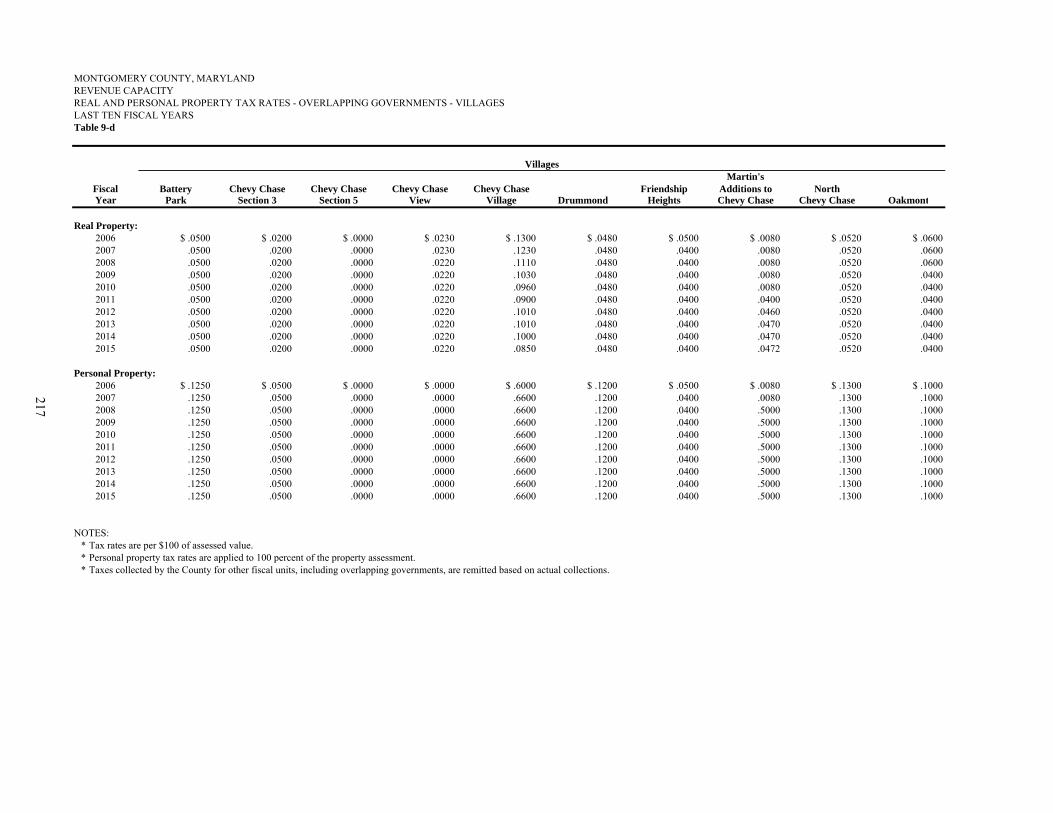
MONTGOMERY COUNTY, MARYLANDREVENUE CAPACITYREAL AND PERSONAL PROPERTY TAX RATES - OVERLAPPING GOVERNMENTS - VILLAGES LAST TEN FISCAL YEARSTable 9-d
Martin'sBattery Chevy Chase Chevy Chase Chevy Chase Chevy Chase Friendship Additions to North
Park Section 3 Section 5 View Village Drummond Heights Chevy Chase Chevy Chase Oakmont
Real Property:$ .0500 $ .0200 $ .0000 $ .0230 $ .1300 $ .0480 $ .0500 $ .0080 $ .0520 $ .0600
.0500 .0200 .0000 .0230 .1230 .0480 .0400 .0080 .0520 .0600 .0500 .0200 .0000 .0220 .1110 .0480 .0400 .0080 .0520 .0600 .0500 .0200 .0000 .0220 .1030 .0480 .0400 .0080 .0520 .0400 .0500 .0200 .0000 .0220 .0960 .0480 .0400 .0080 .0520 .0400 .0500 .0200 .0000 .0220 .0900 .0480 .0400 .0400 .0520 .0400 .0500 .0200 .0000 .0220 .1010 .0480 .0400 .0460 .0520 .0400 .0500 .0200 .0000 .0220 .1010 .0480 .0400 .0470 .0520 .0400 .0500 .0200 .0000 .0220 .1000 .0480 .0400 .0470 .0520 .0400 .0500 .0200 .0000 .0220 .0850 .0480 .0400 .0472 .0520 .0400
Personal Property:$ .1250 $ .0500 $ .0000 $ .0000 $ .6000 $ .1200 $ .0500 $ .0080 $ .1300 $ .1000
.1250 .0500 .0000 .0000 .6600 .1200 .0400 .0080 .1300 .1000 .1250 .0500 .0000 .0000 .6600 .1200 .0400 .5000 .1300 .1000 .1250 .0500 .0000 .0000 .6600 .1200 .0400 .5000 .1300 .1000 .1250 .0500 .0000 .0000 .6600 .1200 .0400 .5000 .1300 .1000 .1250 .0500 .0000 .0000 .6600 .1200 .0400 .5000 .1300 .1000 .1250 .0500 .0000 .0000 .6600 .1200 .0400 .5000 .1300 .1000 .1250 .0500 .0000 .0000 .6600 .1200 .0400 .5000 .1300 .1000 .1250 .0500 .0000 .0000 .6600 .1200 .0400 .5000 .1300 .1000 .1250 .0500 .0000 .0000 .6600 .1200 .0400 .5000 .1300 .1000
NOTES:* Tax rates are per $100 of assessed value.* Personal property tax rates are applied to 100 percent of the property assessment. * Taxes collected by the County for other fiscal units, including overlapping governments, are remitted based on actual collections.
201320142015
FiscalYear
200720082009201020112012
20112012201320142015
2006
Villages
20062007200820092010
217

MONTGOMERY COUNTY, MARYLANDTEN HIGHEST COMMERCIAL PROPERTY TAXPAYERSCURRENT FISCAL YEAR AND NINE YEARS AGOTable 10
Ratio:Assessable Base Taxpayer
Real Personal Base to TotalTotal Property Property Assessable Base
Potomac Electric Power Co. 840,291,615$ 25,931,735$ 814,359,880$ 0.50 %
Federal Realty Investment Trust 457,777,107 455,381,667 2,395,440 0.27
Verizon - Maryland 403,670,743 46,038,233 357,632,510 0.24
Montgomery Mall LLC 361,099,693 359,049,933 2,049,760 0.22
Washington Metropolitan Area Transit Authority 347,692,200 347,692,200 - 0.21
Street Retail Inc. 266,755,357 266,755,357 - 0.16
Washington Gas Light Co. 259,010,920 - 259,010,920 0.15
Chevy Chase Land Co 225,743,666 225,743,666 - 0.13
Wheaton Plaza Reg Shopping Center 222,998,837 221,801,267 1,197,570 0.13
WP Project Developer LLC 214,089,411 214,089,411 - 0.13
Total 3,599,129,549$ 2,162,483,469$ 1,436,646,080$ 2.14 %
Total Assessable Base 167,311,891,416$ 100.00 %
Ratio: Assessable Base Taxpayer
Real Personal Base to TotalTotal Property Property Assessable Base
Potomac Electric Power Co. 725,549,880$ 6,582,100$ 718,967,780$ 0.63 %
Verizon 638,664,976 31,447,466 607,217,510 0.56
Montgomery Mall 272,112,660 271,420,100 692,560 0.24
Washington Gas Light Co. 222,128,000 - 222,128,000 0.19
Mirant Mid-Atlantic LLC 199,484,536 72,347,066 127,137,470 0.17
7501 Wisconsin Ave LLC 182,805,833 182,805,833 - 0.16
Bryant F. Foulger, Trustee 167,030,698 167,030,698 - 0.15
Wheaton Plaza Reg Shopping Center 165,827,404 165,301,244 526,160 0.15
Camalier, Anne D et al, Trustee 145,656,253 145,656,253 - 0.13
Democracy Associates 139,800,000 139,800,000 - 0.12
Total 2,859,060,240$ 1,182,390,760$ 1,676,669,480$ 2.50 %
Total Assessable Base 114,360,878,346$ 100.00 %
Source: State of Maryland Department of Assessments and Taxation
For the Fiscal Year Ended June 30, 2015
For the Fiscal Year Ended June 30, 2006
218
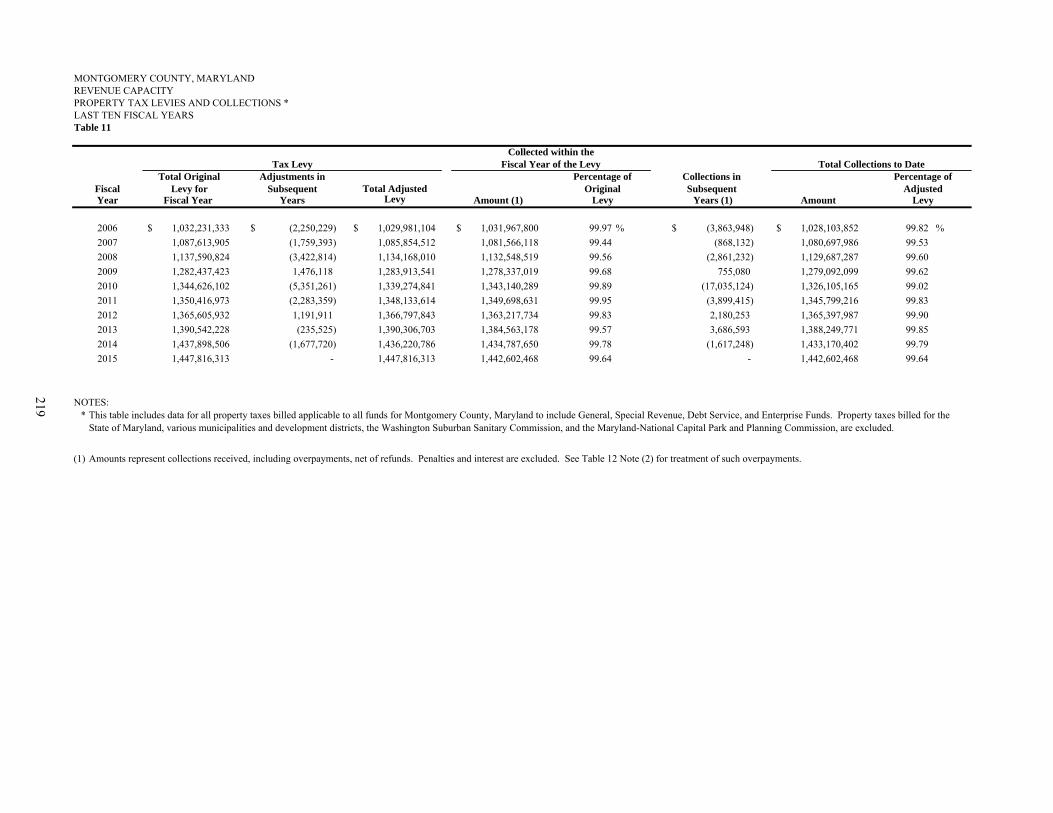
MONTGOMERY COUNTY, MARYLANDREVENUE CAPACITYPROPERTY TAX LEVIES AND COLLECTIONS *LAST TEN FISCAL YEARSTable 11
Total Original Adjustments in Collections inLevy for Subsequent Total Adjusted Subsequent
Fiscal Year Years Levy Amount (1) Years (1) Amount
1,032,231,333$ (2,250,229)$ 1,029,981,104$ 1,031,967,800$ 99.97 % (3,863,948)$ 1,028,103,852$ 99.82 %
1,087,613,905 (1,759,393) 1,085,854,512 1,081,566,118 99.44 (868,132) 1,080,697,986 99.53
1,137,590,824 (3,422,814) 1,134,168,010 1,132,548,519 99.56 (2,861,232) 1,129,687,287 99.60
1,282,437,423 1,476,118 1,283,913,541 1,278,337,019 99.68 755,080 1,279,092,099 99.62
1,344,626,102 (5,351,261) 1,339,274,841 1,343,140,289 99.89 (17,035,124) 1,326,105,165 99.02
1,350,416,973 (2,283,359) 1,348,133,614 1,349,698,631 99.95 (3,899,415) 1,345,799,216 99.83
1,365,605,932 1,191,911 1,366,797,843 1,363,217,734 99.83 2,180,253 1,365,397,987 99.90
1,390,542,228 (235,525) 1,390,306,703 1,384,563,178 99.57 3,686,593 1,388,249,771 99.85
1,437,898,506 (1,677,720) 1,436,220,786 1,434,787,650 99.78 (1,617,248) 1,433,170,402 99.79
1,447,816,313 - 1,447,816,313 1,442,602,468 99.64 - 1,442,602,468 99.64
NOTES:*
(1)
Fiscal Year of the LevyCollected within the
Total Collections to DatePercentage of Percentage of
Tax Levy
Fiscal AdjustedOriginal
2015
Year Levy
2006
2007
2008
2009
2010
2011
2012
2013
2014
Levy
This table includes data for all property taxes billed applicable to all funds for Montgomery County, Maryland to include General, Special Revenue, Debt Service, and Enterprise Funds. Property taxes billed for the State of Maryland, various municipalities and development districts, the Washington Suburban Sanitary Commission, and the Maryland-National Capital Park and Planning Commission, are excluded.
Amounts represent collections received, including overpayments, net of refunds. Penalties and interest are excluded. See Table 12 Note (2) for treatment of such overpayments.
219

MONTGOMERY COUNTY, MARYLANDREVENUE CAPACITYSCHEDULE OF FISCAL YEAR PROPERTY TAX LEVY, PROPERTY TAX REVENUES,AND ADDITIONAL ITEMS RELATED TO THE PROPERTY TAX BILLINGFOR THE FISCAL YEAR ENDED JUNE 30, 2015Table 12
Fiscal Year Collections of Collection ofProperty Tax Current Levy Year Prior Levy Year Adjustments Total
Levy Assessment (1) Assessment (1) and Accruals Revenues (2)
General Fund 1,133,030,658$ 1,129,368,728$ (306,509)$ (42,096,162)$ 1,086,966,057$
Special Revenue Funds :
Recreation 30,933,476 30,802,886 53,816 3,653,747 34,510,449
Bethesda Urban District 515,471 511,459 1,842 9,168 522,469
Silver Spring Urban District 729,533 704,845 6,616 3,627 715,088
Wheaton Urban District 175,909 176,528 (6,501) (1,017) 169,010
Mass Transit 61,702,899 61,400,338 43,822 7,271,433 68,715,593
Fire Tax District 209,640,204 208,761,993 151,363 24,555,050 233,468,406
Total Special Revenue Funds 303,697,492 302,358,049 250,958 35,492,008 338,101,015
Enterprise Funds:
Silver Spring Parking Lot District 7,687,792 7,492,160 (118,136) 238,517 7,612,541
Bethesda Parking Lot District 2,743,359 2,723,888 (359) 8,552 2,732,081
Wheaton Parking Lot District 566,584 569,791 (59,981) (89,133) 420,677
Montgomery Hills Parking Lot District 90,428 89,852 (324) (827) 88,701
Total Enterprise Funds 11,088,163 10,875,691 (178,800) 157,109 10,854,000
Total Property Tax - Montgomery County 1,447,816,313 1,442,602,468 (234,351) (6,447,045) 1,435,921,072
Tax Bill Items Other than Montgomery County
Property Taxes:
M-NCPPC Joint Venture Property Taxes:
M-NCPPC Administration 22,739,654 22,643,903 40,656 2,670,061 25,354,620 *
M-NCPPC Park 74,858,296 74,541,726 89,385 8,803,626 83,434,737 *
M-NCPPC Land Acquisition 1,562,045 1,553,275 2,356 178,185 1,733,816 *
Agency Relationship Property Taxes:
State of Maryland 183,907,978 183,706,406 (859,496) (4,110,378) 178,736,532 *
Municipalities 84,023,763 83,291,554 (534,721) 437,269 83,194,102 *
Development Districts 2,683,898 2,683,779 118,392 12,733 2,814,904 *
Charges for Services:
Refuse Disposal - Solid Waste Activities Fund 70,069,386 69,505,781 28,453 (202,972) 69,331,262 *
Refuse Collection - Solid Waste Activities Fund 6,034,017 6,027,214 3,707 2,898 6,033,819 *
Leaf Vacuuming 6,533,232 6,525,933 1,527 4,622 6,532,082 *
Water Quality Protection Charges 29,005,513 28,213,287 (42,042) (20,771) 28,150,474 *
Municipality Refuse Charges 1,035,280 1,033,330 2,936 (16) 1,036,250 *
Development District Special Assessments 216,470 216,470 - - 216,470 *
WSSC FFBC 15,645,909 15,635,876 (7,783) 23,624 15,651,717 *
Bay Restoration Fund 913,440 917,445 84 (21,106) 896,423 *
Total Other Items 499,228,881 496,495,979 (1,156,546) 7,777,775 503,117,208
Grand Total 1,947,045,194$ 1,939,098,447$ (1,390,897)$ 1,330,730$ 1,939,038,280$
NOTES:* Amounts represent collections, rather than revenues.
(1)(2)
Amounts represent collections received net of refunds.Total Revenues represent the sum of Collections, during the current year, of Current and Prior Year Levy Assessments, (i.e., cash basis) and related Adjustments and Accruals to convert such data to revenues on the modified or full accrual basis of accounting. Penalties and interest are excluded.
220

MONTGOMERY COUNTY, MARYLANDREVENUE CAPAPCITYSCHEDULE OF PROPERTY TAXES RECEIVABLE BY FUND TYPEJUNE 30, 2015Table 13
Special Other Year General Revenue Enterprise Fiduciary Total
2006 & prior 2,010,839$ 533,512$ 69,502$ 860,495$ 3,474,348$
2007 271,564 95,936 9,376 107,117 483,993
2008 364,918 130,627 17,189 117,362 630,096
2009 749,456 207,240 27,958 239,886 1,224,540
2010 943,760 209,680 13,759 310,392 1,477,591
2011 735,624 182,719 45,806 269,389 1,233,538
2012 702,212 204,688 44,887 359,861 1,311,648
2013 1,199,952 442,114 83,011 707,408 2,432,485
2014 2,322,238 586,831 269,502 560,639 3,739,210
2015 6,273,046 1,668,651 368,259 1,604,931 9,914,887
Total Property Taxes Receivable 15,573,609$ 4,261,998$ 949,249$ 5,137,480$ 25,922,336$
221
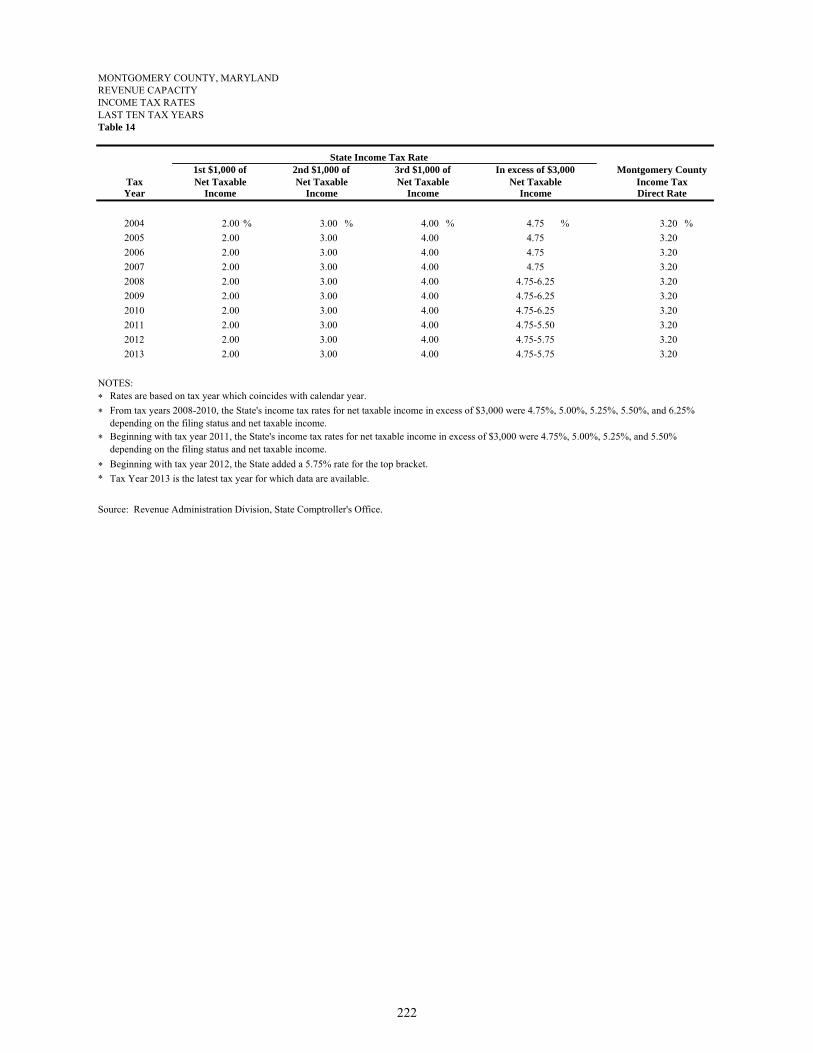
MONTGOMERY COUNTY, MARYLAND
LAST TEN TAX YEARSTable 14
1st $1,000 of 2nd $1,000 of 3rd $1,000 of In excess of $3,000 Montgomery CountyNet Taxable Net Taxable Net Taxable Net Taxable Income Tax
Income Income Income Income Direct Rate
2.00 % 3.00 % 4.00 % 4.75 % 3.20 %
2.00 3.00 4.00 4.75 3.20
2.00 3.00 4.00 4.75 3.20
2.00 3.00 4.00 4.75 3.20
2.00 3.00 4.00 4.75-6.25 3.20
2.00 3.00 4.00 4.75-6.25 3.20
2.00 3.00 4.00 4.75-6.25 3.20
2.00 3.00 4.00 4.75-5.50 3.20
2.00 3.00 4.00 4.75-5.75 3.20
2.00 3.00 4.00 4.75-5.75 3.20
NOTES:
*
*
*
** Tax Year 2013 is the latest tax year for which data are available.
Source: Revenue Administration Division, State Comptroller's Office.
Beginning with tax year 2012, the State added a 5.75% rate for the top bracket.
2010
2011
2012
Rates are based on tax year which coincides with calendar year.
Beginning with tax year 2011, the State's income tax rates for net taxable income in excess of $3,000 were 4.75%, 5.00%, 5.25%, and 5.50% depending on the filing status and net taxable income.
2013
From tax years 2008-2010, the State's income tax rates for net taxable income in excess of $3,000 were 4.75%, 5.00%, 5.25%, 5.50%, and 6.25% depending on the filing status and net taxable income.
2009
REVENUE CAPACITYINCOME TAX RATES
State Income Tax Rate
TaxYear
2004
2005
2006
2007
2008
222

MONTGOMERY COUNTY, MARYLAND
INCOME TAX FILERS SUMMARY INFORMATIONLAST TEN TAX YEARS Table 15
MontgomeryNumber of Maryland County
Tax Taxable Adjusted Net Net State Local Total Income TaxYear Returns Gross Income Taxable Income Income Tax Income Tax Tax Liability Direct Rate
2004 361,268 31,160,185,053$ 24,901,353,842$ 1,102,583,780$ 791,114,843$ 1,893,698,623$ 3.20 %
2005 380,241 39,581,589,250 32,241,963,585 1,384,669,182 1,025,536,849 2,410,206,031 3.20
2006 383,214 41,836,264,633 34,089,151,444 1,470,625,709 1,084,440,791 2,555,066,500 3.20
2007 387,875 45,044,465,276 36,947,166,594 1,610,260,135 1,175,936,199 2,786,196,334 3.20
2008 379,739 41,070,791,364 32,876,469,466 1,511,917,178 1,046,272,919 2,558,190,097 3.20
2009 376,323 39,060,773,506 31,075,877,228 1,410,063,716 987,098,452 2,397,162,168 3.20
2010 386,891 42,234,426,562 34,040,992,827 1,556,444,328 1,081,538,245 2,637,982,573 3.20
2011 393,640 43,986,140,274 35,879,078,661 1,622,232,304 1,139,960,820 2,762,193,124 3.20
2012 401,848 47,554,137,682 39,644,979,160 1,845,214,377 1,259,631,971 3,104,846,348 3.20
2013 407,363 45,607,413,448 38,036,993,408 1,789,843,796 1,207,855,837 2,997,699,633 3.20
NOTES:* See Table 16 for detailed breakout of adjusted gross income level.
* Rates are based on tax year which coincides with calendar year.
* Tax Year 2013 is the latest tax year for which data are available.
Source: Revenue Administration Division, State Comptroller's Office.
REVENUE CAPACITY
223
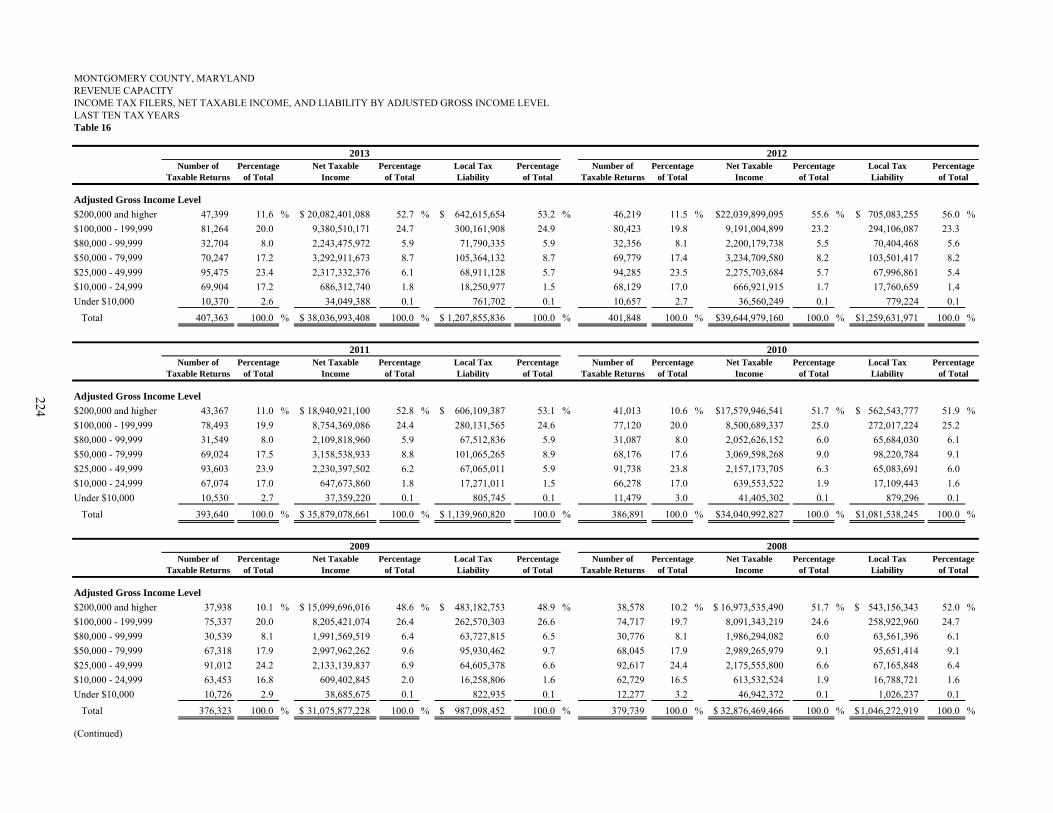
MONTGOMERY COUNTY, MARYLAND
INCOME TAX FILERS, NET TAXABLE INCOME, AND LIABILITY BY ADJUSTED GROSS INCOME LEVELLAST TEN TAX YEARS Table 16
Percentage Net Taxable Percentage Local Tax Percentage Number of Percentage Net Taxable Percentage Local Taxof Total Income of Total Liability of Total Taxable Returns of Total Income of Total Liability
Adjusted Gross Income Level
$200,000 and higher 47,399 11.6 % 20,082,401,088$ 52.7 % 642,615,654$ 53.2 % 46,219 11.5 % 22,039,899,095$ 55.6 % 705,083,255$ 56.0 %
$100,000 - 199,999 81,264 20.0 9,380,510,171 24.7 300,161,908 24.9 80,423 19.8 9,191,004,899 23.2 294,106,087 23.3
$80,000 - 99,999 32,704 8.0 2,243,475,972 5.9 71,790,335 5.9 32,356 8.1 2,200,179,738 5.5 70,404,468 5.6
$50,000 - 79,999 70,247 17.2 3,292,911,673 8.7 105,364,132 8.7 69,779 17.4 3,234,709,580 8.2 103,501,417 8.2
$25,000 - 49,999 95,475 23.4 2,317,332,376 6.1 68,911,128 5.7 94,285 23.5 2,275,703,684 5.7 67,996,861 5.4
$10,000 - 24,999 69,904 17.2 686,312,740 1.8 18,250,977 1.5 68,129 17.0 666,921,915 1.7 17,760,659 1.4
Under $10,000 10,370 2.6 34,049,388 0.1 761,702 0.1 10,657 2.7 36,560,249 0.1 779,224 0.1
Total 407,363 100.0 % 38,036,993,408$ 100.0 % 1,207,855,836$ 100.0 % 401,848 100.0 % 39,644,979,160$ 100.0 % 1,259,631,971$ 100.0 %
Percentage Net Taxable Percentage Local Tax Percentage Number of Percentage Net Taxable Percentage Local Taxof Total Income of Total Liability of Total Taxable Returns of Total Income of Total Liability
Adjusted Gross Income Level
$200,000 and higher 43,367 11.0 % 18,940,921,100$ 52.8 % 606,109,387$ 53.1 % 41,013 10.6 % 17,579,946,541$ 51.7 % 562,543,777$ 51.9 %
$100,000 - 199,999 78,493 19.9 8,754,369,086 24.4 280,131,565 24.6 77,120 20.0 8,500,689,337 25.0 272,017,224 25.2
$80,000 - 99,999 31,549 8.0 2,109,818,960 5.9 67,512,836 5.9 31,087 8.0 2,052,626,152 6.0 65,684,030 6.1
$50,000 - 79,999 69,024 17.5 3,158,538,933 8.8 101,065,265 8.9 68,176 17.6 3,069,598,268 9.0 98,220,784 9.1
$25,000 - 49,999 93,603 23.9 2,230,397,502 6.2 67,065,011 5.9 91,738 23.8 2,157,173,705 6.3 65,083,691 6.0
$10,000 - 24,999 67,074 17.0 647,673,860 1.8 17,271,011 1.5 66,278 17.0 639,553,522 1.9 17,109,443 1.6
Under $10,000 10,530 2.7 37,359,220 0.1 805,745 0.1 11,479 3.0 41,405,302 0.1 879,296 0.1
Total 393,640 100.0 % 35,879,078,661$ 100.0 % 1,139,960,820$ 100.0 % 386,891 100.0 % 34,040,992,827$ 100.0 % 1,081,538,245$ 100.0 %
Percentage Net Taxable Percentage Local Tax Percentage Number of Percentage Net Taxable Percentage Local Taxof Total Income of Total Liability of Total Taxable Returns of Total Income of Total Liability
Adjusted Gross Income Level
$200,000 and higher 37,938 10.1 % 15,099,696,016$ 48.6 % 483,182,753$ 48.9 % 38,578 10.2 % 16,973,535,490$ 51.7 % 543,156,343$ 52.0 %
$100,000 - 199,999 75,337 20.0 8,205,421,074 26.4 262,570,303 26.6 74,717 19.7 8,091,343,219 24.6 258,922,960 24.7
$80,000 - 99,999 30,539 8.1 1,991,569,519 6.4 63,727,815 6.5 30,776 8.1 1,986,294,082 6.0 63,561,396 6.1
$50,000 - 79,999 67,318 17.9 2,997,962,262 9.6 95,930,462 9.7 68,045 17.9 2,989,265,979 9.1 95,651,414 9.1
$25,000 - 49,999 91,012 24.2 2,133,139,837 6.9 64,605,378 6.6 92,617 24.4 2,175,555,800 6.6 67,165,848 6.4
$10,000 - 24,999 63,453 16.8 609,402,845 2.0 16,258,806 1.6 62,729 16.5 613,532,524 1.9 16,788,721 1.6
Under $10,000 10,726 2.9 38,685,675 0.1 822,935 0.1 12,277 3.2 46,942,372 0.1 1,026,237 0.1
Total 376,323 100.0 % 31,075,877,228$ 100.0 % 987,098,452$ 100.0 % 379,739 100.0 % 32,876,469,466$ 100.0 % 1,046,272,919$ 100.0 %
(Continued)
Percentageof TotalTaxable Returns
Number of
2011 2010Percentage
of Total
2009 2008
Taxable ReturnsNumber of
Taxable Returns of Total
REVENUE CAPACITY
2013 2012Number of Percentage
224

MONTGOMERY COUNTY, MARYLAND
INCOME TAX FILERS, NET TAXABLE INCOME, AND LIABILITY BY ADJUSTED GROSS INCOME LEVELLAST TEN TAX YEARS Table 16 (Concluded)
Percentage Net Taxable Percentage Local Tax Percentage Number of Percentage Net Taxable Percentage Local Taxof Total Income of Total Liability of Total Taxable Returns of Total Income of Total Liability
Adjusted Gross Income Level
$200,000 and higher 39,973 10.3 % 20,721,888,649$ 56.1 % 663,101,691$ 56.4 % 35,634 9.3 % 18,364,689,191$ 53.8 % 587,671,196$ 54.2 %
$100,000 - 199,999 73,690 19.0 8,058,872,420 21.8 257,889,666 21.9 70,202 18.3 7,643,868,101 22.4 244,608,348 22.6
$80,000 - 99,999 30,713 7.9 2,030,595,581 5.5 64,983,024 5.5 30,178 7.9 1,998,995,282 5.9 63,973,086 5.9
$50,000 - 79,999 67,534 17.4 3,057,948,389 8.3 97,861,191 8.3 66,285 17.3 2,995,838,794 8.8 95,875,398 8.8
$25,000 - 49,999 93,694 24.2 2,298,139,649 6.2 71,322,924 6.1 95,337 24.8 2,306,395,629 6.8 71,796,673 6.6
$10,000 - 24,999 67,786 17.5 719,513,016 1.9 19,469,703 1.7 70,328 18.4 715,858,507 2.1 19,067,166 1.8
Under $10,000 14,485 3.7 60,208,890 0.2 1,308,000 0.1 15,250 4.0 63,505,940 0.2 1,448,924 0.1
Total 387,875 100.0 % 36,947,166,594$ 100.0 % 1,175,936,199$ 100.0 % 383,214 100.0 % 34,089,151,444$ 100.0 % 1,084,440,791$ 100.0 %
Percentage Net Taxable Percentage Local Tax Percentage Number of Percentage Net Taxable Percentage Local Tax
of Total Income of Total Liability of Total Taxable Returns of Total Income of Total Liability
Adjusted Gross Income Level
$200,000 and higher 32,289 8.5 % 16,822,880,955$ 52.1 % 538,333,470$ 52.5 % 24,529 6.8 % 10,214,344,217$ 41.0 % 326,859,346$ 41.4 %
$100,000 - 199,999 67,171 17.7 7,344,360,047 22.8 235,024,270 22.9 61,333 17.0 6,729,437,859 27.0 215,346,908 27.2
$75,000 - 99,999 29,705 7.8 1,973,884,323 6.1 63,168,474 6.2 37,159 10.3 2,416,623,481 9.7 77,335,230 9.8
$50,000 - 74,999 65,722 17.3 2,990,204,062 9.3 95,694,416 9.3 55,487 15.4 2,455,348,478 9.9 78,581,106 9.9
$25,000 - 49,999 96,118 25.3 2,312,771,299 7.2 72,276,536 7.0 95,230 26.3 2,300,676,859 9.2 72,216,385 9.1
$10,000 - 24,999 72,054 18.9 727,599,564 2.3 19,364,575 1.9 70,752 19.6 715,905,106 2.9 19,080,205 2.4
Under $10,000 17,182 4.5 70,263,335 0.2 1,675,108 0.2 16,778 4.6 69,017,842 0.3 1,695,663 0.2
Total 380,241 100.0 % 32,241,963,585$ 100.0 % 1,025,536,849$ 100.0 % 361,268 100.0 % 24,901,353,842$ 100.0 % 791,114,843$ 100.0 %
NOTES:
* Information in this table presents data by adjusted gross income level to support summary level information in Table 15.
* Information relating to the ten highest tax payers is not available from the State of Maryland; therefore, as an alternative, data is presented above by adjusted gross income level.
* Rates are based on tax year which coincides with calendar year.
* See Tables 14 and 15 for direct tax rate information.
* Tax Year 2013 is the latest tax year for which data are available.
Source: Revenue Administration Division, State Comptroller's Office and Montgomery County Department of Finance.
Number ofTaxable Returns of Total
REVENUE CAPACITY
2007 2006Percentage
of Total
2004Percentage
2005
Number ofTaxable Returns
225

MONTGOMERY COUNTY, MARYLANDDEBT CAPACITYRATIOS OF OUTSTANDING DEBT BY TYPELAST TEN FISCAL YEARS (2)Table 17
General Variable Rate Taxable BABs Bond Lease Certificates Taxable Limited TotalFiscal Obligation Demand General Anticipation Notes Revenue of Capital Revenue Obligation GovernmentalYear Bonds Obligations Obligations Notes Payable Bonds Participation Leases Bonds Certificates Activities
2006 1,393,883,160$ 100,000,000$ -$ 100,000,000$ 13,980,419$ 39,790,000$ -$ 87,086,843$ -$ -$ 1,734,740,422$ 2007 1,512,675,607 100,000,000 - 150,000,000 13,975,293 38,255,000 - 81,316,156 - - 1,896,222,056 2008 1,366,758,054 100,000,000 - 300,000,000 9,920,647 36,670,000 33,580,000 74,472,783 - - 1,921,401,484 2009 1,496,561,371 100,000,000 - 300,000,000 15,764,265 35,025,000 30,475,000 67,929,435 14,463,000 - 2,060,218,071 2010 1,437,839,285 100,000,000 232,000,000 425,000,000 13,897,942 33,320,000 50,255,000 81,564,283 13,923,324 30,400,000 2,418,199,834 2011 1,517,280,000 100,000,000 338,320,000 500,000,000 15,023,170 31,550,000 43,935,000 71,156,741 42,803,956 29,470,000 2,689,538,867 2012 1,658,970,000 100,000,000 338,320,000 500,000,000 59,537,476 33,100,000 37,420,000 46,530,000 41,265,110 56,265,000 2,871,407,586 2013 1,930,155,391 100,000,000 339,827,520 500,000,000 49,800,724 33,802,447 30,675,000 20,130,000 83,556,016 54,661,870 3,142,608,968 2014 2,085,028,317 100,000,000 339,671,879 500,000,000 51,252,461 32,812,650 24,305,000 16,432,750 112,031,698 90,509,121 3,352,043,876 2015 2,465,636,613 100,000,000 339,516,247 500,000,000 51,776,731 30,251,464 17,685,000 13,817,910 106,941,278 86,711,269 3,712,336,512
General Total Total Debt to OutstandingFiscal Obligation Revenue Notes Capital Business-Type Primary Personal Debt perYear Bonds Bonds Payable Leases Activities Government Income (1) Capita (1)
2006 4,894$ 70,620,000$ -$ -$ 70,624,894$ 1,805,365,316$ 2.99 % 1,949$ 2007 2,447 61,800,000 926,268 10,033,172 72,761,887 1,968,983,943 3.14 2,113 2008 - 54,685,000 724,795 - 55,409,795 1,976,811,279 3.00 2,097 2009 - 79,567,000 467,876 - 80,034,876 2,140,252,947 3.38 2,232 2010 - 73,101,676 252,610 - 73,354,286 2,491,554,120 3.78 2,564 2011 - 71,566,044 81,782 - 71,647,826 2,761,186,693 3.98 2,816 2012 - 87,674,890 - - 87,674,890 2,959,082,476 4.08 2,990 2013 - 86,295,600 1,976,348 - 88,271,948 3,230,880,916 4.40 3,233 2014 - 97,163,694 1,701,104 - 98,864,798 3,450,908,674 4.40 3,389 2015 - 91,756,076 4,047,213 - 95,803,289 3,808,139,801 4.80 3,733
NOTES:(1) See Table 23 for personal income and population data, used in calculating these ratios.(2)
Business-type Activities Ratios
Governmental Activities
Beginning in fiscal year 2013, the County changed its presentation of outstanding debt in the statistical section to include unamortized premiums, discounts, and deferred differences on refundings. Amounts presented prior to fiscal year 2013 are shown at gross amounts.
226

MONTGOMERY COUNTY, MARYLANDDEBT CAPACITYRATIOS OF GENERAL BONDED DEBT OUTSTANDINGLAST TEN FISCAL YEARSTable 18
Percentage ofEstimated
Variable Rate Taxable BABs Actual TaxableGeneral Demand General Value Per
Obligation Bonds Obligations Obligations Total of Property (2) Capita (3)
1,393,888,054$ 100,000,000$ -$ 1,493,888,054$ 1.22 % 1,597$
1,512,675,607 100,000,000 - 1,612,675,607 1.19 1,713
1,366,758,054 100,000,000 - 1,466,758,054 0.98 1,538
1,496,561,371 100,000,000 - 1,596,561,371 0.95 1,643
1,437,839,285 100,000,000 232,000,000 1,769,839,285 0.99 1,821
1,517,280,000 100,000,000 338,320,000 1,955,600,000 1.01 1,996
1,658,970,000 100,000,000 338,320,000 2,097,290,000 1.18 2,119
1,930,155,391 100,000,000 339,827,520 2,369,982,911 1.36 2,372
2,085,028,317 100,000,000 339,671,879 2,524,700,196 1.42 2,479
2,465,636,613 100,000,000 339,516,247 2,905,152,860 1.61 2,848
NOTES:(1) (2) See Table 8 for estimated actual value of taxable property data.(3)
2013
2014
General Bonded Debt includes all general obligation debt, variable rate demand obligation, regardless of purpose or repayment source, and other bonded debt financed with general government resources. Governmental lease revenue bonds and business-type revenue bonds are excluded because they are repayable from specific resources other than general governmental resources. Other debt is excluded because it is not in the form of bonds.
See Table 23 for population data. However, when population data for prior years is revised, per capita amounts presented herein are reported as originally stated.
2015
2012
General Bonded Debt Outstanding (1)
FiscalYear
2006
2007
2008
2009
2010
2011
227

MONTGOMERY COUNTY, MARYLANDDEBT CAPACITYDIRECT AND OVERLAPPING GOVERNMENTAL ACTIVITIES DEBT (1)JUNE 30, 2015Table 19
EstimatedEstimated Share of
Debt Percentage OverlappingGovernmental Unit Outstanding Applicable Debt
Overlapping Debt:
Towns, Cities, and Villages: (2, 3)
Garrett Park - bonds 362,300$ 100.00 % 362,300$
Poolesville - bonds 2,297,978 100.00 2,297,978
Rockville:
Bonds 132,290,000 100.00 132,290,000
Certificates or notes 5,489,474 100.00 5,489,474
Somerset - bonds 1,540,000 100.00 1,540,000
Takoma Park:
Bonds 2,343,500 100.00 2,343,500
Certificates or notes 150,000 100.00 150,000
Component Units (2):
MCPS - capital leases 64,224,227 100.00 64,224,227
MCC - capital leases 63,968,224 100.00 63,968,224
Joint Venture - M-NCPPC (4):
Park acquisition and development bonds 97,666,298 41.09 40,130,000
Advance land acquisition bonds 1,200,000 100.00 1,200,000
Development Districts (2):
Kingsview Village Center - bonds 1,296,958 100.00 1,296,958
West Germantown - bonds 12,025,000 100.00 12,025,000
Total Overlapping Debt 327,317,661
Montgomery County direct debt (5) 3,712,336,512
Total Direct and Overlapping Debt 4,039,654,173$
NOTES:
Entities are wholly within Montgomery County.
Unaudited information provided by entities.
Overlapping debt percentage is based on the debt relating to the County.
Source: total of governmental activities debt on Table 17.
(4)
(5)
Direct debt relating to the governmental activities of the County includes general obligation bonds, variable rate demand obligations, bond anticipation notes, notes payable, lease revenue bonds, and capital leases. Overlapping debt is the debt of other governmental entities in the County that is payable in whole or in part by taxpayers of the County. It includes general obligation bonds, revenue bonds, mortgages payable, notes payable, commercial paper, bond anticipation notes, certificates of participation, capital leases, and bank loans.
(1)
(2)
(3)
228

MONTGOMERY COUNTY, MARYLANDDEBT CAPACITYCOMPUTATION OF LEGAL DEBT MARGINLAST TEN FISCAL YEARSTable 20
2006 2007 2008 2009 2010
Assessed Value
Real property (1, 3) 110,529,249,116$ 125,710,776,118$ 142,306,435,593$ 158,133,491,472$ 167,096,843,537$
Personal property (2) 3,831,629,230 3,948,949,550 3,970,547,370 3,920,171,020 4,123,996,612 Total Assessed Value 114,360,878,346$ 129,659,725,668$ 146,276,982,963$ 162,053,662,492$ 171,220,840,149$
Legal Debt Margin
Debt Limit - Percentage of Assessable Base:
For real property at 6% (2) 6,631,754,947$ 7,542,646,567$ 8,538,386,136$ 9,488,009,488$ 10,025,810,612$
For personal property at 15% 574,744,385 592,342,433 595,582,106 588,025,653 618,599,492
Legal Limitation for the Borrowing of Funds
and the Issuance of Bonds 7,206,499,332 8,134,989,000 9,133,968,242 10,076,035,141 10,644,410,104
Debt Applicable to Limit:
General obligation bonds 1,393,888,054 1,512,675,607 1,366,758,054 1,496,561,371 1,437,839,285
Variable Rate Demand Obligation 100,000,000 100,000,000 100,000,000 100,000,000 100,000,000
Taxable BABs General Obligation - - - - 232,000,000
Bond anticipation notes 100,000,000 150,000,000 300,000,000 300,000,000 425,000,000
Total Debt Applicable to Limit 1,593,888,054 1,762,675,607 1,766,758,054 1,896,561,371 2,194,839,285
Legal Debt Margin 5,612,611,278$ 6,372,313,393$ 7,367,210,188$ 8,179,473,770$ 8,449,570,819$
Legal Debt Margin as a Percentage of Debt Limit 78% 78% 81% 81% 79%
2011 2012 2013 2014 2015
Assessed Value
Real property (1, 3) 167,790,792,529$ 162,197,149,758$ 158,272,830,848$ 159,891,865,334$ 163,656,758,206$
Personal property (2) 3,856,191,952 3,718,945,710 3,604,478,750 3,709,327,508 3,655,133,210 Total Assessed Value 171,646,984,481$ 165,916,095,468$ 161,877,309,598$ 163,601,192,842$ 167,311,891,416$
Legal Debt Margin
Debt Limit - Percentage of Assessable Base:
For real property at 6% (2) 10,067,447,552$ 9,731,828,985$ 9,496,369,851$ 9,593,511,920$ 9,819,405,492$
For personal property at 15% 578,428,793 557,841,857 540,671,813 556,399,126 548,269,982
Legal Limitation for the Borrowing of Funds
and the Issuance of Bonds 10,645,876,345 10,289,670,842 10,037,041,664 10,149,911,046 10,367,675,474
Debt Applicable to Limit:
General obligation bonds 1,517,280,000 1,658,970,000 1,930,155,391 2,085,028,317 2,465,636,613
Variable Rate Demand Obligation 100,000,000 100,000,000 100,000,000 100,000,000 100,000,000
Taxable BABs General Obligation 338,320,000 338,320,000 339,827,520 339,671,879 339,516,247
Bond anticipation notes 500,000,000 500,000,000 500,000,000 500,000,000 500,000,000
Total Debt Applicable to Limit 2,455,600,000 2,597,290,000 2,869,982,911 3,024,700,196 3,405,152,860
Legal Debt Margin 8,190,276,345$ 7,692,380,842$ 7,167,058,753$ 7,125,210,850$ 6,962,522,614$
Legal Debt Margin as a Percentage of Debt Limit 77% 75% 71% 70% 67%
NOTES:
(1) See (1) on Table 8.
(2) See (3) on Table 8.
(3) As a Charter County, the legal debt limit is provided by Article 25A, Section 5(P(i)), of the Annotated Code of Maryland. Effective June 1, 2001, real property in the State of Maryland began being assessed at 100 percent of full assessed value instead of the previous 40 percent assessment method. Also effective June 1, 2001, the section of the Code referred to above was amended in conjunction with the real property assessment change. Under the amendment, the legal debt margin is a total of 6 percent of the assessable base (presented at 100 percent) of real property of the County and 15 percent of the County's assessable base of personal property and operating real property.
229

DEBT CAPACITY
Less: Net AvailableFiscal Gross Operating Revenue for CoverageYear Revenues (2) Expenses (3) Debt Service Principal Interest Total %
Bethesda Parking Lot District:
2006 18,167,711$ 5,959,821$ 12,207,890$ 3,430,000$ 1,567,391$ 4,997,391$ 244.29 %
2007 20,055,735 6,587,481 13,468,254 3,550,000 1,848,185 5,398,185 249.50
2008 20,991,790 6,935,238 14,056,552 3,175,000 1,709,435 4,884,435 287.78
2009 21,538,148 7,409,414 14,128,734 3,340,000 1,566,585 4,906,585 287.95
2010 20,046,662 8,188,688 11,857,974 1,840,000 1,429,335 3,269,335 362.70
2011 19,217,766 (a) 7,829,314 11,388,452 1,915,000 1,355,235 3,270,235 348.25
2012 18,137,767 (a) 8,038,372 10,099,395 1,995,000 1,278,135 3,273,135 308.55
2013 20,201,622 (a) 8,006,351 12,195,271 2,020,000 2,030,369 4,050,369 301.09
2014 19,001,427 (a) 8,129,681 10,871,746 2,100,000 1,910,939 4,010,939 271.05
2015 21,153,076 (a) 9,015,362 12,137,714 3,120,000 1,839,789 4,959,789 244.72
Liquor Control:
2010 229,335,472$ 201,443,397$ 27,892,075$ 1,745,000$ 2,024,478$ 3,769,478$ 739.95 %
2011 242,614,756 212,550,427 30,064,329 1,550,000 2,108,248 3,658,248 821.82
2012 252,364,670 217,254,363 35,110,307 2,825,000 3,530,455 6,355,455 552.44
2013 258,903,266 222,759,553 36,143,713 2,790,000 3,561,750 6,351,750 569.04
2014 268,683,615 235,187,621 33,495,994 4,725,000 5,038,843 9,763,843 343.06
2015 278,792,397 245,176,046 33,616,351 4,640,000 5,188,539 9,828,539 342.03
Metrorail Garage Project:
2006 3,292,758$ -$ 3,292,758$ 1,485,000$ 1,807,758$ 3,292,758$ 100.00 %
2007 3,294,214 - 3,294,214 1,535,000 1,759,214 3,294,214 100.00
2008 3,292,339 - 3,292,339 1,585,000 1,707,339 3,292,339 100.00
2009 3,295,276 - 3,295,276 1,645,000 1,650,276 3,295,276 100.00
2010 3,294,214 - 3,294,214 1,705,000 1,589,214 3,294,214 100.00
2011 3,292,009 - 3,292,009 1,770,000 1,522,009 3,292,009 100.00
2012 3,416,120 - 3,416,120 2,365,000 1,051,120 3,416,120 100.00
2013 3,472,363 - 3,472,363 1,860,000 1,612,363 3,472,363 100.00
2014 3,474,363 - 3,474,363 1,955,000 1,519,363 3,474,363 100.00
2015 3,481,613 - 3,481,613 2,060,000 1,421,613 3,481,613 100.00
Water Quality Protection:
2013 25,302,118$ 16,937,522$ 8,364,596$ 915,000$ 1,207,601$ 2,122,601$ 394.07 %
2014 26,047,644 17,248,871 8,798,773 1,310,000 1,706,150 3,016,150 291.72
2015 30,745,793 20,016,830 10,728,963 1,340,000 1,678,850 3,018,850 355.40
NOTES:(1)
(2)
(3)
(4)
(a)
MONTGOMERY COUNTY, MARYLAND
PLEDGED-REVENUE COVERAGE (1)LAST TEN FISCAL YEARSTable 21
Debt Service (4)
Table includes debt that is secured by a pledge of a specific revenue stream, and is designed to reflect whether the County had to use general (unpledged) revenues to repay debt that was intended to be self-supporting.
Operating expenses do not include interest, depreciation, or amortization expenses.
Debt service consists of amounts relating to revenue or lease revenue bonds; amounts relating to general obligation bonds are excluded.
Parking Lot District gross revenue excludes non-cash gains on disposal of capital assets; not available to pay for debt service.
Gross revenues include non-operating investment income. Gross revenues for the parking lot district bonds include all revenues of the district and consist primarily of parking fee charges for services, parking fines, and dedicated property taxes. Gross revenues for the metrorail garage project lease revenue bonds include lease payments from WMATA. Gross revenues for the liquor control bonds come primarily from the sale of beverage alcohol products. Gross revenues for the water quality protection bonds include the water quality protection charge that is part of property tax bills and based on the potential for a property to contribute to stormwater runoff.
230
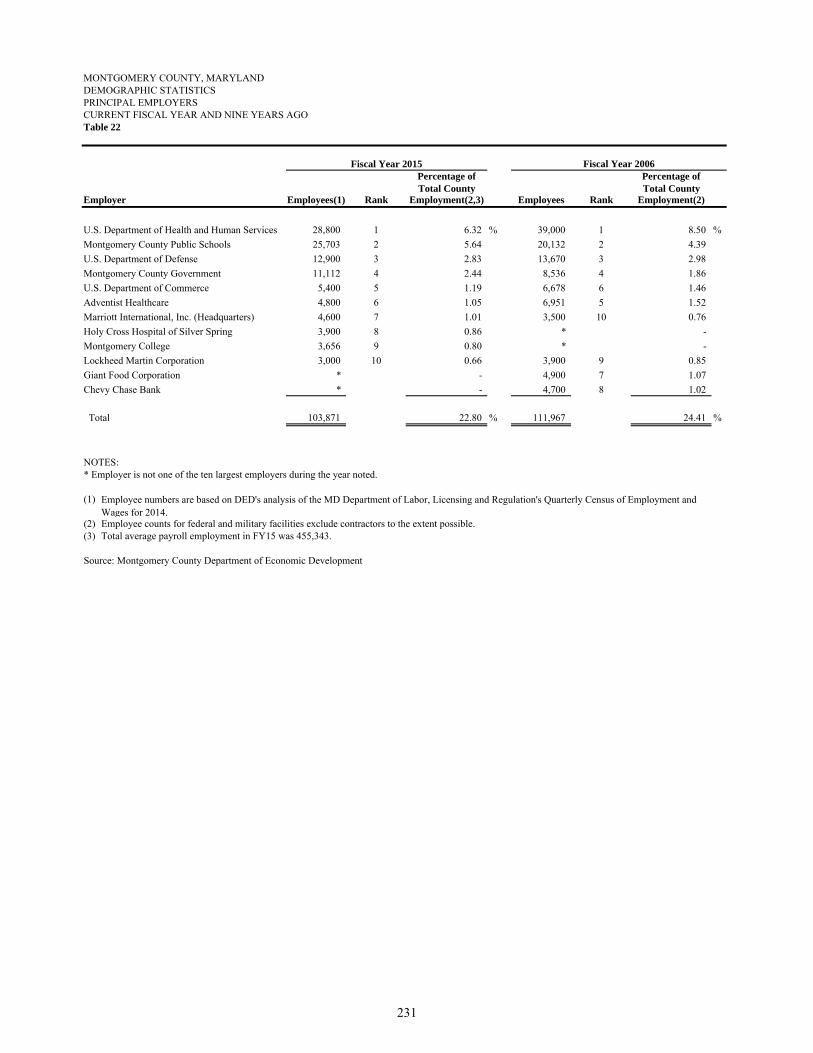
MONTGOMERY COUNTY, MARYLANDDEMOGRAPHIC STATISTICSPRINCIPAL EMPLOYERSCURRENT FISCAL YEAR AND NINE YEARS AGOTable 22
Fiscal Year 2015Percentage of Percentage ofTotal County Total County
Employer Employees(1) Rank Employment(2,3) Employees Rank Employment(2)
U.S. Department of Health and Human Services 28,800 1 6.32 % 39,000 1 8.50 %
Montgomery County Public Schools 25,703 2 5.64 20,132 2 4.39
U.S. Department of Defense 12,900 3 2.83 13,670 3 2.98
Montgomery County Government 11,112 4 2.44 8,536 4 1.86
U.S. Department of Commerce 5,400 5 1.19 6,678 6 1.46
Adventist Healthcare 4,800 6 1.05 6,951 5 1.52
Marriott International, Inc. (Headquarters) 4,600 7 1.01 3,500 10 0.76
Holy Cross Hospital of Silver Spring 3,900 8 0.86 * -
Montgomery College 3,656 9 0.80 * -
Lockheed Martin Corporation 3,000 10 0.66 3,900 9 0.85
Giant Food Corporation * - 4,900 7 1.07
Chevy Chase Bank * - 4,700 8 1.02
Total 103,871 22.80 % 111,967 24.41 %
NOTES:* Employer is not one of the ten largest employers during the year noted.
(1)
(2) Employee counts for federal and military facilities exclude contractors to the extent possible.(3) Total average payroll employment in FY15 was 455,343.
Source: Montgomery County Department of Economic Development
Fiscal Year 2006
Employee numbers are based on DED's analysis of the MD Department of Labor, Licensing and Regulation's Quarterly Census of Employment and Wages for 2014.
231
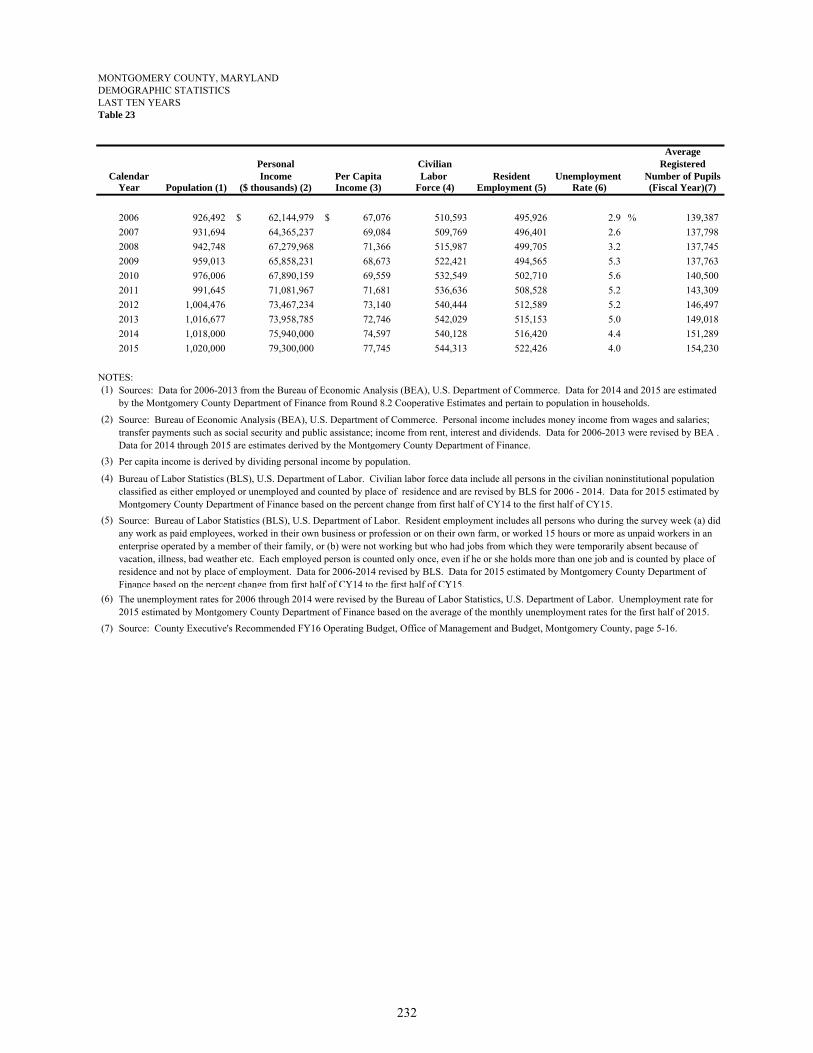
MONTGOMERY COUNTY, MARYLANDDEMOGRAPHIC STATISTICSLAST TEN YEARSTable 23
AveragePersonal Civilian RegisteredIncome Per Capita Labor Resident Unemployment Number of Pupils
Population (1) ($ thousands) (2) Income (3) Force (4) Employment (5) Rate (6) (Fiscal Year)(7)
926,492 62,144,979$ 67,076$ 510,593 495,926 2.9 % 139,387
931,694 64,365,237 69,084 509,769 496,401 2.6 137,798
942,748 67,279,968 71,366 515,987 499,705 3.2 137,745
959,013 65,858,231 68,673 522,421 494,565 5.3 137,763
976,006 67,890,159 69,559 532,549 502,710 5.6 140,500
991,645 71,081,967 71,681 536,636 508,528 5.2 143,309
1,004,476 73,467,234 73,140 540,444 512,589 5.2 146,497
1,016,677 73,958,785 72,746 542,029 515,153 5.0 149,018
1,018,000 75,940,000 74,597 540,128 516,420 4.4 151,289
1,020,000 79,300,000 77,745 544,313 522,426 4.0 154,230
NOTES:(1)
(2)
(3)
(4)
(5)
(6)
(7) Source: County Executive's Recommended FY16 Operating Budget, Office of Management and Budget, Montgomery County, page 5-16.
2008
CalendarYear
2006
2007
The unemployment rates for 2006 through 2014 were revised by the Bureau of Labor Statistics, U.S. Department of Labor. Unemployment rate for 2015 estimated by Montgomery County Department of Finance based on the average of the monthly unemployment rates for the first half of 2015.
2009
2010
2011
2012
2013
2014
Sources: Data for 2006-2013 from the Bureau of Economic Analysis (BEA), U.S. Department of Commerce. Data for 2014 and 2015 are estimated by the Montgomery County Department of Finance from Round 8.2 Cooperative Estimates and pertain to population in households.
Source: Bureau of Economic Analysis (BEA), U.S. Department of Commerce. Personal income includes money income from wages and salaries; transfer payments such as social security and public assistance; income from rent, interest and dividends. Data for 2006-2013 were revised by BEA . Data for 2014 through 2015 are estimates derived by the Montgomery County Department of Finance.
Per capita income is derived by dividing personal income by population.
Bureau of Labor Statistics (BLS), U.S. Department of Labor. Civilian labor force data include all persons in the civilian noninstitutional population classified as either employed or unemployed and counted by place of residence and are revised by BLS for 2006 - 2014. Data for 2015 estimated by Montgomery County Department of Finance based on the percent change from first half of CY14 to the first half of CY15.
Source: Bureau of Labor Statistics (BLS), U.S. Department of Labor. Resident employment includes all persons who during the survey week (a) did any work as paid employees, worked in their own business or profession or on their own farm, or worked 15 hours or more as unpaid workers in an enterprise operated by a member of their family, or (b) were not working but who had jobs from which they were temporarily absent because of vacation, illness, bad weather etc. Each employed person is counted only once, even if he or she holds more than one job and is counted by place of residence and not by place of employment. Data for 2006-2014 revised by BLS. Data for 2015 estimated by Montgomery County Department of Finance based on the percent change from first half of CY14 to the first half of CY15.
2015
232

MONTGOMERY COUNTY, MARYLANDOPERATING INFORMATIONEMPLOYEE FTEs BY FUNCTION (1)LAST TEN FISCAL YEARSTable 24
2006 4 2007 4 2008 4 2009 4 2010 4 2011 4 2012 4 2013 2014 2015
Governmental Activities:General Government:
Legislative Branch:Board of Appeals 5 5 5 5 5 4 4 4 4 4 County Council 69 70 73 77 75 70 73 75 77 79 Inspector General 5 5 6 6 5 3 4 5 5 5 Legislative Oversight 10 11 11 11 11 9 9 10 11 11 Merit System Protection Board 1 1 1 1 1 1 1 1 1 1 People's Counsel 2 2 2 2 2 2 - - - - Zoning and Administrative Hearings 4 4 4 4 4 4 4 4 4 4
Judicial Branch: Circuit Court 106 111 108 109 110 107 106 117 118 114 State's Attorney 112 115 118 121 122 119 122 129 132 136
Executive Branch: Board of Elections 28 47 47 47 46 44 40 31 31 51 Board of Liquor License Commissioners 12 12 - - - - - - - - Commission for Women 10 11 11 11 10 6 - - - - Community Engagement (2) - - - - - - 24 22 22 22 County Attorney 44 44 44 43 39 37 34 42 43 43 County Executive 38 37 41 50 47 32 26 28 31 32 Ethics Commission 2 3 3 3 2 - 2 3 3 3 Finance 116 117 121 116 108 103 107 114 125 126 General Services - - - 194 199 179 178 184 183 191 Human Resources 57 58 61 59 58 44 49 60 67 66 Human Rights 23 22 22 22 19 15 8 8 8 9 Intergovernmental Relations 5 5 5 5 5 5 5 5 5 5 Management and Budget 31 31 31 30 29 25 25 28 28 29 Procurement 29 30 30 - - - - - - - Public Information 9 9 9 9 8 42 42 43 42 43 Regional Services Centers 29 30 31 34 29 17 - - - - Technology Services 147 156 150 146 138 107 102 104 110 110 Urban Districts 57 57 57 58 58 50 52 55 55 58 Non-Departmental Accounts 3 3 3 3 3 3 2 2 4 4
Public Safety: Consumer Protection - 23 22 21 19 15 15 16 17 17 Correction and Rehabilitation 585 626 635 622 599 555 557 512 518 526 Emergency Management and Homeland Security 70 72 72 10 9 10 11 11 12 14 Fire and Rescue 1,155 1,236 1,335 1,351 1,349 1,267 1,240 1,254 1,282 1,287 Police 1,651 1,733 1,777 1,819 1,789 1,720 1,724 1,744 1,767 1,843 Sheriff 169 177 183 183 176 169 166 178 185 183
Transportation: Fleet Management 164 170 191 205 202 194 206 205 205 204 Transit Services 652 680 762 871 831 789 831 814 816 836 Other (3) 472 477 480 315 346 305 258 258 273 275
Health and Human Services 1,476 1,506 1,605 1,613 1,577 1,462 1,484 1,559 1,569 1,589 Culture and Recreation:
Cable TV 13 14 15 17 19 26 27 30 31 31 Public Libraries 403 420 428 426 388 299 273 314 350 385 Recreation 416 442 450 451 422 365 343 375 398 414
Community Development and Housing:Economic Development 40 45 52 46 41 32 26 29 31 34 Housing and Community Affairs 91 74 77 73 67 59 58 66 73 77
Environmental Protection 45 49 51 51 52 51 84 91 93 97
Business-Type Activities:Community Use of Public Facilities 26 26 26 27 25 22 26 27 27 27 Liquor Control 321 330 341 344 337 313 323 324 339 337 Parking Lot Districts 43 45 47 50 51 46 48 49 49 50 Permitting Services 191 215 214 218 197 173 178 198 201 207 Solid Waste Activities 152 156 155 159 105 99 103 103 102 103
Total FTEs 9,089 9,512 9,912 10,038 9,734 8,999 9,000 9,231 9,447 9,682
NOTES: Amounts represent budgeted workyears or FTEs rounded to nearest whole workyear.
Community Engagement Cluster created in FY12 by consolidating the staffing of the Regional Services Centers, the Gilchrist Center and the Commission for Women.Excludes programs presented under business-type activities.Effective FY13, FTE is used as a measure rather than workyear. Years FY06 to FY12 still reflect original workyear measurements.
Source: County Executive's Annual Recommended Operating and Public Services Program, Schedule D-2, various years.
(3)(4)
Represents County government FTEs only, and excludes component units. Therefore, no FTEs are listed for Education function, which relates to component units MCPS and MCC.*
(1)
(2)
233
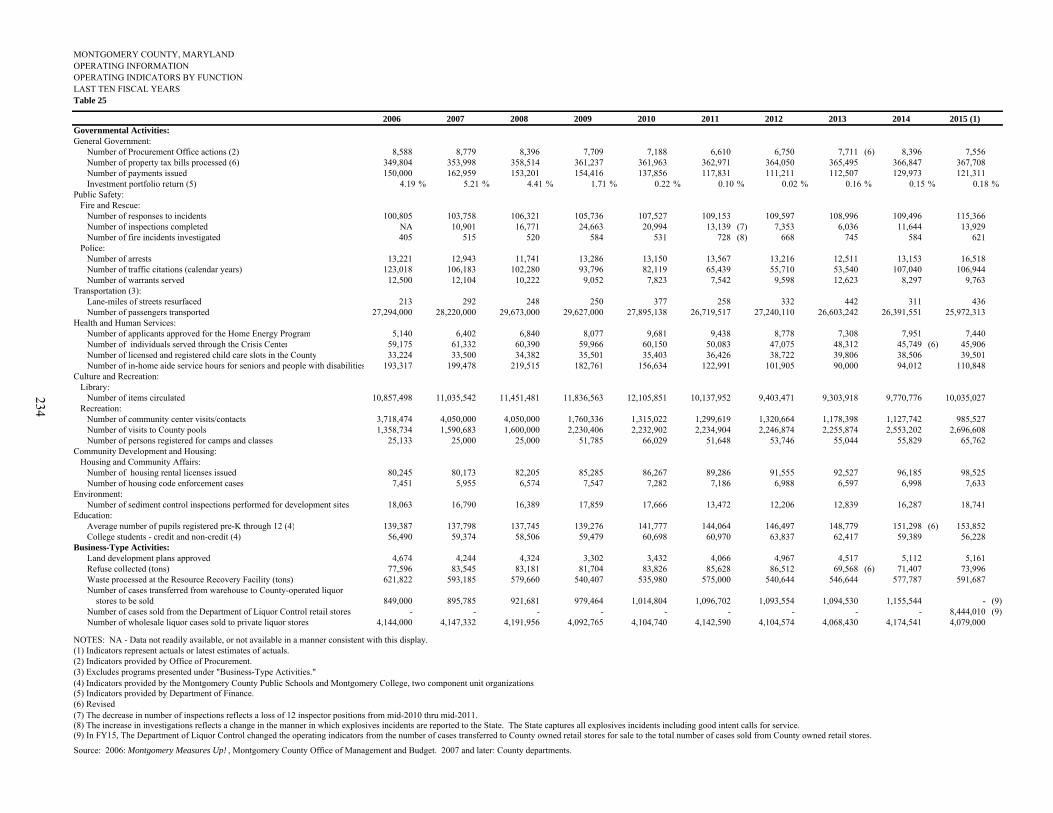
MONTGOMERY COUNTY, MARYLANDOPERATING INFORMATIONOPERATING INDICATORS BY FUNCTIONLAST TEN FISCAL YEARSTable 25
2006 2007 2008 2009 2010 2011 2012 2013 2014 2015 (1)Governmental Activities:General Government: Number of Procurement Office actions (2) 8,588 8,779 8,396 7,709 7,188 6,610 6,750 7,711 (6) 8,396 7,556 Number of property tax bills processed (6) 349,804 353,998 358,514 361,237 361,963 362,971 364,050 365,495 366,847 367,708 Number of payments issued 150,000 162,959 153,201 154,416 137,856 117,831 111,211 112,507 129,973 121,311 Investment portfolio return (5) 4.19 % 5.21 % 4.41 % 1.71 % 0.22 % 0.10 % 0.02 % 0.16 % 0.15 % 0.18 %Public Safety: Fire and Rescue: Number of responses to incidents 100,805 103,758 106,321 105,736 107,527 109,153 109,597 108,996 109,496 115,366 Number of inspections completed NA 10,901 16,771 24,663 20,994 13,139 (7) 7,353 6,036 11,644 13,929 Number of fire incidents investigated 405 515 520 584 531 728 (8) 668 745 584 621 Police: Number of arrests 13,221 12,943 11,741 13,286 13,150 13,567 13,216 12,511 13,153 16,518 Number of traffic citations (calendar years) 123,018 106,183 102,280 93,796 82,119 65,439 55,710 53,540 107,040 106,944 Number of warrants served 12,500 12,104 10,222 9,052 7,823 7,542 9,598 12,623 8,297 9,763 Transportation (3): Lane-miles of streets resurfaced 213 292 248 250 377 258 332 442 311 436 Number of passengers transported 27,294,000 28,220,000 29,673,000 29,627,000 27,895,138 26,719,517 27,240,110 26,603,242 26,391,551 25,972,313Health and Human Services: Number of applicants approved for the Home Energy Program 5,140 6,402 6,840 8,077 9,681 9,438 8,778 7,308 7,951 7,440 Number of individuals served through the Crisis Center 59,175 61,332 60,390 59,966 60,150 50,083 47,075 48,312 45,749 (6) 45,906 Number of licensed and registered child care slots in the County 33,224 33,500 34,382 35,501 35,403 36,426 38,722 39,806 38,506 39,501 Number of in-home aide service hours for seniors and people with disabilities 193,317 199,478 219,515 182,761 156,634 122,991 101,905 90,000 94,012 110,848 Culture and Recreation: Library: Number of items circulated 10,857,498 11,035,542 11,451,481 11,836,563 12,105,851 10,137,952 9,403,471 9,303,918 9,770,776 10,035,027 Recreation: Number of community center visits/contacts 3,718,474 4,050,000 4,050,000 1,760,336 1,315,022 1,299,619 1,320,664 1,178,398 1,127,742 985,527 Number of visits to County pools 1,358,734 1,590,683 1,600,000 2,230,406 2,232,902 2,234,904 2,246,874 2,255,874 2,553,202 2,696,608 Number of persons registered for camps and classes 25,133 25,000 25,000 51,785 66,029 51,648 53,746 55,044 55,829 65,762 Community Development and Housing: Housing and Community Affairs: Number of housing rental licenses issued 80,245 80,173 82,205 85,285 86,267 89,286 91,555 92,527 96,185 98,525 Number of housing code enforcement cases 7,451 5,955 6,574 7,547 7,282 7,186 6,988 6,597 6,998 7,633 Environment: Number of sediment control inspections performed for development sites 18,063 16,790 16,389 17,859 17,666 13,472 12,206 12,839 16,287 18,741 Education: Average number of pupils registered pre-K through 12 (4) 139,387 137,798 137,745 139,276 141,777 144,064 146,497 148,779 151,298 (6) 153,852 College students - credit and non-credit (4) 56,490 59,374 58,506 59,479 60,698 60,970 63,837 62,417 59,389 56,228 Business-Type Activities: Land development plans approved 4,674 4,244 4,324 3,302 3,432 4,066 4,967 4,517 5,112 5,161 Refuse collected (tons) 77,596 83,545 83,181 81,704 83,826 85,628 86,512 69,568 (6) 71,407 73,996 Waste processed at the Resource Recovery Facility (tons) 621,822 593,185 579,660 540,407 535,980 575,000 540,644 546,644 577,787 591,687 Number of cases transferred from warehouse to County-operated liquor stores to be sold 849,000 895,785 921,681 979,464 1,014,804 1,096,702 1,093,554 1,094,530 1,155,544 - (9) Number of cases sold from the Department of Liquor Control retail stores - - - - - - - - - 8,444,010 (9) Number of wholesale liquor cases sold to private liquor stores 4,144,000 4,147,332 4,191,956 4,092,765 4,104,740 4,142,590 4,104,574 4,068,430 4,174,541 4,079,000
NOTES: NA - Data not readily available, or not available in a manner consistent with this display.(1) Indicators represent actuals or latest estimates of actuals.(2) Indicators provided by Office of Procurement.(3) Excludes programs presented under "Business-Type Activities."
(5) Indicators provided by Department of Finance.(6) Revised
Source: 2006: Montgomery Measures Up! , Montgomery County Office of Management and Budget. 2007 and later: County departments.
(8) The increase in investigations reflects a change in the manner in which explosives incidents are reported to the State. The State captures all explosives incidents including good intent calls for service.
(4) Indicators provided by the Montgomery County Public Schools and Montgomery College, two component unit organizations.
(7) The decrease in number of inspections reflects a loss of 12 inspector positions from mid-2010 thru mid-2011.
(9) In FY15, The Department of Liquor Control changed the operating indicators from the number of cases transferred to County owned retail stores for sale to the total number of cases sold from County owned retail stores.
234

MONTGOMERY COUNTY, MARYLANDOPERATING INFORMATIONCAPITAL ASSET STATISTICS BY FUNCTIONLAST TEN FISCAL YEARSTable 26
2006 2007 2008 2009 2010 2011 2012 2013 2014 2015
Governmental Activities:
General Government:
Number of conference centers 1 1 1 1 1 1 1 1 1 1
Landfills 3 3 3 3 3 3 3 3 3 3
Public Safety:
Police stations 6 6 6 6 6 6 6 6 6 6
Police satellites 6 7 8 8 8 8 4 4 3 3
Police vehicles 1,252 1,255 1,340 1,410 1,369 1,327 1,363 1,341 1,345 1,467
Fire stations (2) 34 34 34 35 35 36 36 37 37 37
Fire apparatus 464 463 471 498 518 452 464 451 461 447
Transportation:
Streets (miles) 2,588 2,602 2,609 2,611 2,621 2,621 2,623 2,627 2,631 2,634
Ride On buses (1) 398 459 469 480 462 390 410 412 422 379
Administrative vehicles 762 778 757 806 785 757 734 738 761 764
Fire vehicles 96 110 130 134 122 121 120 115 116 113
Heavy equipment 645 596 540 482 456 454 460 463 482 420
Streetlights 63,489 65,225 66,528 66,752 66,903 66,962 67,211 67,781 67,931 67,969
Traffic signals 747 756 772 779 791 800 814 823 829 836
Culture and Recreation:
Libraries 21 22 22 22 22 22 22 22 22 22
Volumes in library collection 2,977,017 3,203,802 3,131,150 3,168,551 2,809,010 2,660,221 2,564,280 2,500,705 2,834,652 2,556,864
Swimming pools 13 14 14 14 13 13 13 13 13 13
Community Development and Housing:
Number of low income housing units (1) 102 102 102 102 101 101 101 101 101 101
Environment:
Storm drains (miles) 854 860 864 864 874 874 875 877 881 883
Education:
Elementary, Middle and High School buildings 194 199 200 199 200 200 200 202 202 203
College buildings 42 43 43 44 46 48 48 49 49 49
Business-Type Activities:
Parking spaces in parking lot districts 21,479 21,282 21,160 21,169 21,185 21,173 20,470 19,989 19,984 20,970
Parking garages/lots 41 40 41 41 41 41 40 40 42 42
NOTES:* Data relates to primary government only, except for education data which relates to MCPS and MCC.
(1) FY06 to FY07 restated(2) FY10 to FY13 restated
Sources: Various County departments, MCPS, and MCC.
235

236

INDEX
237

Balance Sheet / Net Position
MONTGOMERY COUNTY, MARYLAND - PRIMARY GOVERNMENT:
Agricultural Transfer Tax Special Revenue 155 156 - -
Cable TV Special Revenue 151 152 - 167Capital Projects 32 34 - 159Central Duplicating Internal Service 183 184 185 -Community Use of Public Facilities Enterprise 173 174 175 176
Debt Service 32 34 - 157Deferred Compensation POEB * Trust 189 190 - -Drug Enforcement Forfeitures Special Revenue 155 156 - 168
Economic Development Special Revenue 151 152 - 166Employee Health Benefits Self-Insurance Internal Service 183 184 185 186Employees' Retirement Savings Plan POEB * Trust 189 190 - -Employees' Retirement System POEB * Trust 189 190 - -
Fire Tax District Special Revenue 153 154 - 161
General 32 34 - 131Grants Special Revenue 32 34 - 139
Housing Initiative Special Revenue 32 34 - 138
Investment Trust 40 41 - -
Liability and Property Coverage Self-Insurance Internal Service 183 184 185 186Liquor Enterprise 36 38 39 176
Mass Transit Facilities Special Revenue 153 154 - 162Miscellaneous Agency 193 - - -Motor Pool Internal Service 183 184 185 -
Parking Lot Districts Enterprise 36 38 39 178Permitting Services Enterprise 173 174 175 176Private Contributions Private Purpose Trust 191 192 - -Property Tax Agency 193 - - -
Recreation Activities Agency 193 - - -Recreation Special Revenue 153 154 - 160Rehabilitation Loan Special Revenue 151 152 - 165Restricted Donations Special Revenue 155 156 - 170Retiree Health Benefits POEB* Trust 189 190 - -
Solid Waste Activities Enterprise 36 38 39 177
Tri-centennial Private Purpose Trust 191 192 - -
Urban Districts Special Revenue 153 154 - 163
Water Quality Protection Special Revenue 155 156 - 169
(Continued)
INDEX
Fund TitlesChanges in Net Position
CashFlows Budgetary
Statements / SchedulesPages
238
INDEX, Concluded
PagesStatements / Schedules
Fund TitlesBalance Sheet /
Net PositionChanges in Net
PositionCashFlows Budgetary
COMPONENT UNITS:
Bethesda Urban Partnership, Inc. (BUPI) 197 198 - -
Housing Opportunities Commission of Montgomery County (HOC) 42 43 - -
Montgomery College (MCC) 197 198 - -Montgomery County Public Schools (MCPS) 42 43 - -Montgomery County Revenue Authority (MCRA) 197 198 - -
* POEB = Pension and Other Employee Benefits
239


Prepared by the:Department of finance
Division of the Controller101 Monroe street
Rockville, Maryland 20850240-777-8860