monte carlo simulations for research as well as clinical ...monte carlo simulations for research as...
TRANSCRIPT

Monte Carlo simulations for
research as well as clinical
support in proton therapy
Harald Paganetti PhD Professor of Radiation Oncology, Harvard Medical School
Director of Physics Research, Massachusetts General Hospital, Department of Radiation Oncology

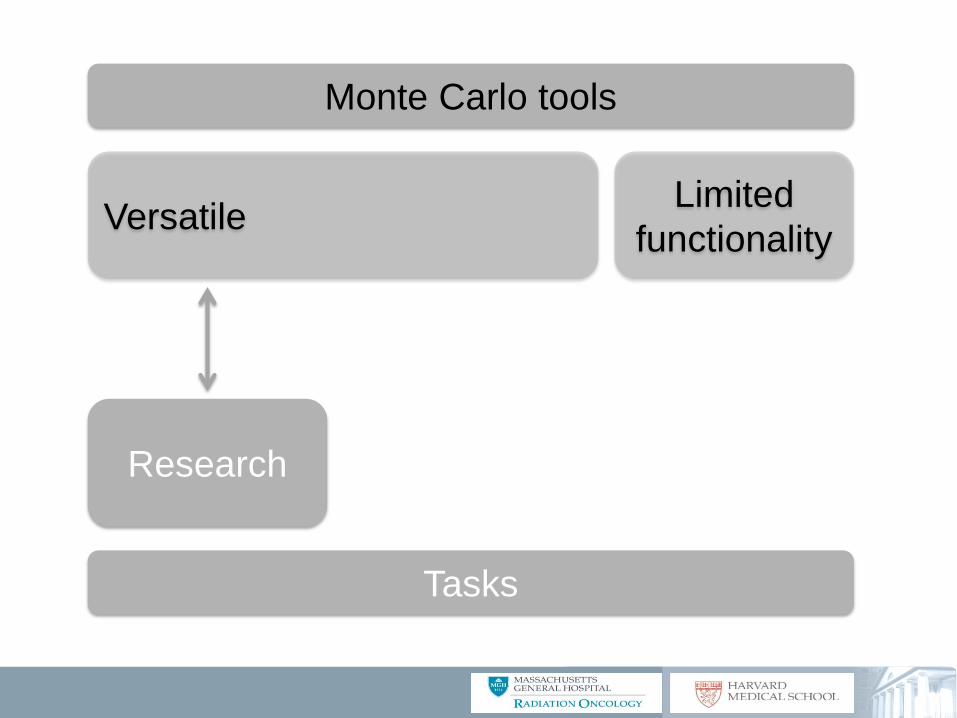
Versatile Limited functionality
Monte Carlo tools
Tasks

Monte Carlo tools
Multi-purpose codes
MCNPX
FLUKA
GEANT4
…
Tool for Particle Simulation
Perl J; Shin J; Schuemann S; Faddegon BA and Paganetti H: TOPAS - An innovative proton Monte Carlo
platform for research and clinical applications. Medical Physics 2012 39: 6818-6837
~150 users at ~50 institutions
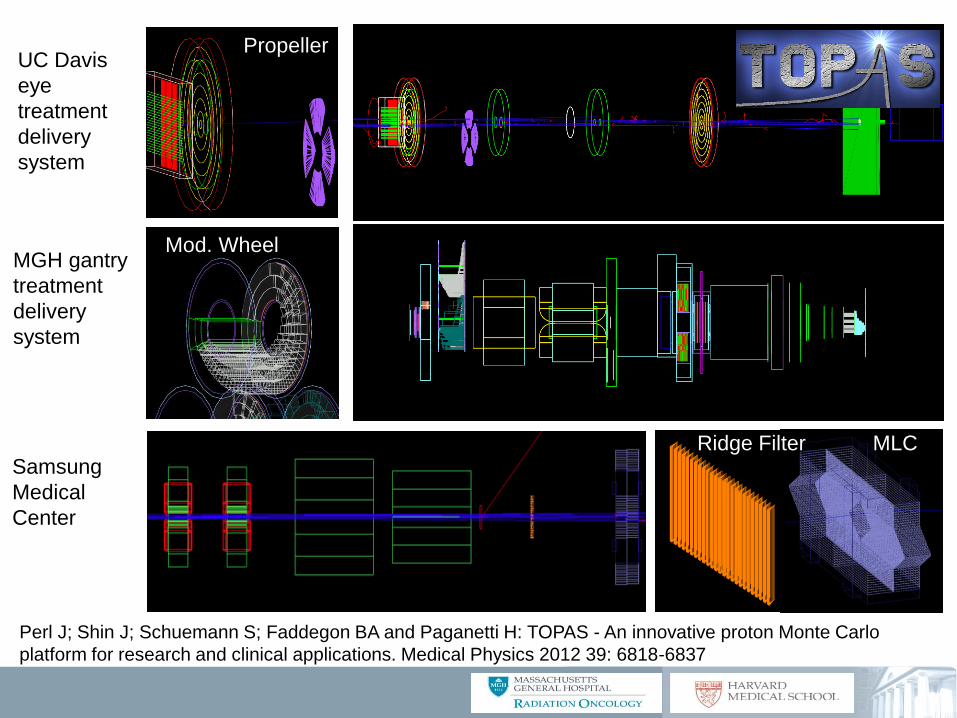
MGH gantry
treatment
delivery
system
UC Davis
eye
treatment
delivery
system
Samsung
Medical
Center
Ridge Filter MLC
Mod. Wheel
Propeller
Perl J; Shin J; Schuemann S; Faddegon BA and Paganetti H: TOPAS - An innovative proton Monte Carlo
platform for research and clinical applications. Medical Physics 2012 39: 6818-6837

Time feature of steering magnet fields
Points of every 0.5 ms
Shin J; Perl J; Schuemann S; Paganetti H and Faddegon BA: A modular method to handle multiple time-
dependent quantities in Monte Carlo simulations. Physics in Medicine and Biology 2012 57: 3295-3308

Validation
Testa M; Schümann J; Lu H-M; Shin J; Faddegon B; Perl J and Paganetti H: Experimental validation of the
TOPAS Monte Carlo system for proton therapy simulations. Medical Physics 2013 40: 121719

Versatile Limited functionality
Monte Carlo tools

Proton transport physics
Physics models
Kawrakow, Med Phys, 27, 485(2000), Fippel et. al., Med Phys, 31, 2263
(2004), Penelope manual (2009), Geant4 physics manual (2011)
Multiple scattering and energy straggling
Nuclear interaction is handled by an empirical strategy
Fippel et. al., Med Phys, 31, 2263(2004)
gPMC
Jia X; Schuemann J; Paganetti H and Jiang SB: GPU-based fast Monte Carlo dose calculation for proton
therapy. Physics in Medicine and Biology 2012 57: 7783-7798
Source
Energy (MeV)
<σ/D>
(%)
Pγ
(1mm/1%)(%)
Pγ
(2mm/2%)(%)
T
(sec)
Inhomogeneous
phantom 100 0.9 99.9 99.9 9.44
Patient 100 1.0 95.1 99.9 10.08
Versatile Limited
functionality
Research
Monte Carlo tools
Tasks

Example:
New concepts using prompt gamma range verification
Monte Carlo for Research

Correlation of Prompt Gamma Rate Functions with position along an SOBP Dose Rate Functions: IC Measurements Prompt Gamma Rate Functions: TOPAS
0 20 40 60 80 1000
0.2
0.4
0.6
0.8
1
Time [ms]
Do
se R
ate
[a
.u.]
16 cm
0 20 40 60 80 1000
0.2
0.4
0.6
0.8
1
Time [ms]
Do
se R
ate
[a
.u.]
14 cm
0 20 40 60 80 1000
0.2
0.4
0.6
0.8
1
Time [ms]
Do
se R
ate
[a
.u.]
12 cm
0 20 40 60 80 1000
0.2
0.4
0.6
0.8
1
Time [ms]
Do
se R
ate
[a
.u.]
10 cm
0 20 40 60 80 1000
0.2
0.4
0.6
0.8
1
Time [ms]
Do
se R
ate
[a
.u.]
8 cm
0 20 40 60 80 1000
0.2
0.4
0.6
0.8
1
Time [ms]
Do
se R
ate
[a
.u.]
6 cm
0 20 40 60 80 1000
50
100
150
200
250
Time [ms]
Pro
mp
t g
Co
un
ts /
ms
16 cm
0 20 40 60 80 1000
0.2
0.4
0.6
0.8
1
Time [ms]
Do
se R
ate
[a
.u.]
16 cm
14 cm
12 cm
10 cm
8 cm
6 cm
0 20 40 60 80 1000
50
100
150
200
250
Time [ms]
Pro
mp
t g
Co
un
ts /
ms
14 cm
0 20 40 60 80 1000
50
100
150
200
250
Time [ms]
Pro
mp
t g
Co
un
ts /
ms
12 cm
0 20 40 60 80 1000
50
100
150
200
250
Time [ms]
Pro
mp
t g
Co
un
ts /
ms
10 cm
0 20 40 60 80 1000
50
100
150
200
250
Time [ms]
Pro
mp
t g
Co
un
ts /
ms
8 cm
0 20 40 60 80 1000
50
100
150
200
250
Time [ms]
Pro
mp
t g
Co
un
ts /
ms
6 cm
0 20 40 60 80 1000
50
100
150
200
250
Time [ms]
Pro
mp
t g
Cou
nts
/ m
s
16 cm
14 cm
12 cm
10 cm
8 cm
6 cm
Testa; Min; Verburg; Schümann; Lu; Paganetti: Range verification in proton therapy based on the characteristic prompt-gamma time-
patterns of passively modulated beams. Submitted

Application to a Prostate Patient
Range: 25.7 cm
Mod. Width: 8.5 cm
Dose: ~ 2.5 cGy
SOBP
0 2 4 6 80
500
1000
1500
Time [ns]
Co
unts
/ 0
.1 n
s
TOF Converted E>2MeV & E<7MeV
All Particles
Gamma
Neutrons
Testa; Min; Verburg; Schümann; Lu; Paganetti: Range verification in proton therapy based on the characteristic prompt-gamma time-
patterns of passively modulated beams. Submitted

• Prompt Gamma Ray Functions can be determined by
MC-simulations.
• 2mm range verification is achievable in a water
phantom for a dose of 2.5cGy.
• For a typical prostate tumor treatment a 4mm
resolution in range is achievable for a dose of 15cGy.
• Energy and TOF-selection simplifies the detection
design and is effective in discriminating the prompt-
gamma signal from the background.
Example:
New concepts using prompt gamma range verification
Testa; Min; Verburg; Schümann; Lu; Paganetti: Range verification in proton therapy based on the characteristic prompt-gamma time-
patterns of passively modulated beams. Submitted

Versatile Limited
functionality
Research Clinical
Research
Monte Carlo tools
Tasks

Example 1: Understanding the interplay effect when
treating lung cancer with pencil beam scanning
Monte Carlo for Clinical Research
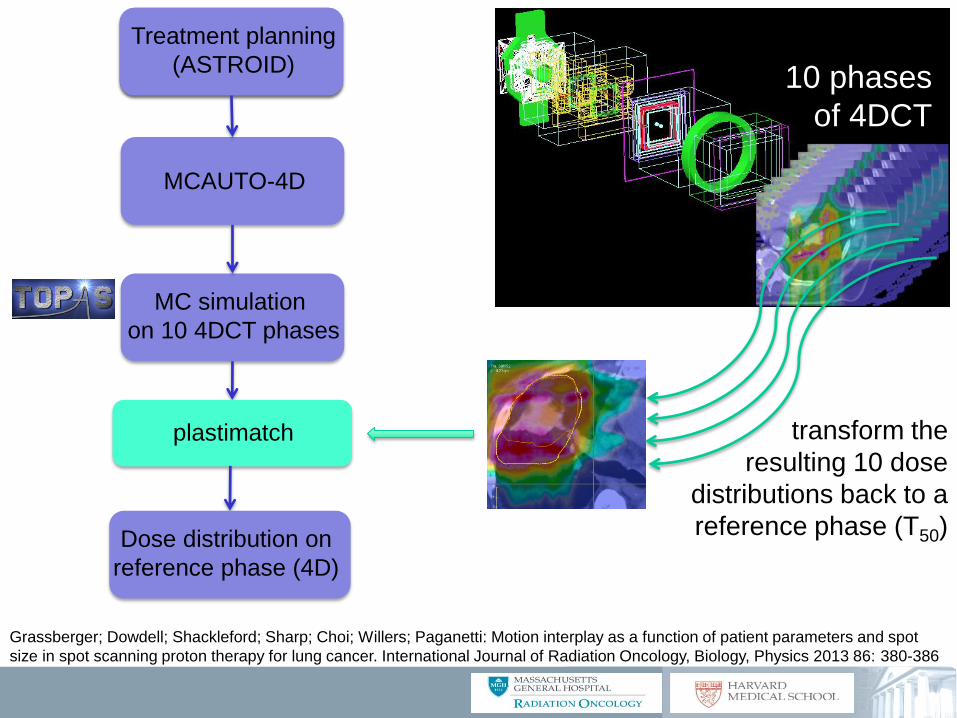
MCAUTO-4D
• Takes spot list
magnet strength,
energy switching
time, etc …
• sorts pencil beams to 10
phases depending on the
time structure
Treatment planning
(ASTROID)
Treatment planning
(ASTROID)
MCAUTO-4D
MC simulation
on 10 4DCT phases
Grassberger; Dowdell; Shackleford; Sharp; Choi; Willers; Paganetti: Motion interplay as a function of patient parameters and spot
size in spot scanning proton therapy for lung cancer. International Journal of Radiation Oncology, Biology, Physics 2013 86: 380-386
transform the
resulting 10 dose
distributions back to a
reference phase (T50)
plastimatch
10 phases
of 4DCT
Dose distribution on
reference phase (4D)
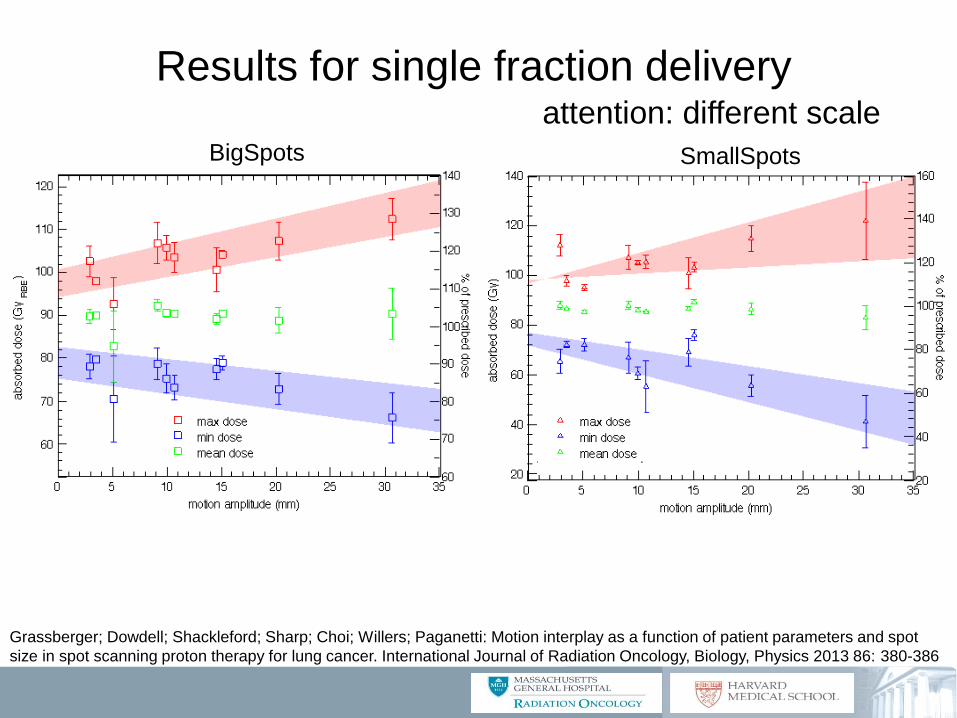
Results for single fraction delivery
SmallSpots
attention: different scale BigSpots
Grassberger; Dowdell; Shackleford; Sharp; Choi; Willers; Paganetti: Motion interplay as a function of patient parameters and spot
size in spot scanning proton therapy for lung cancer. International Journal of Radiation Oncology, Biology, Physics 2013 86: 380-386

BigSpots SmallSpots
attention: different scale
Results for 35 fraction delivery
Grassberger; Dowdell; Shackleford; Sharp; Choi; Willers; Paganetti: Motion interplay as a function of patient parameters and spot
size in spot scanning proton therapy for lung cancer. International Journal of Radiation Oncology, Biology, Physics 2013 86: 380-386
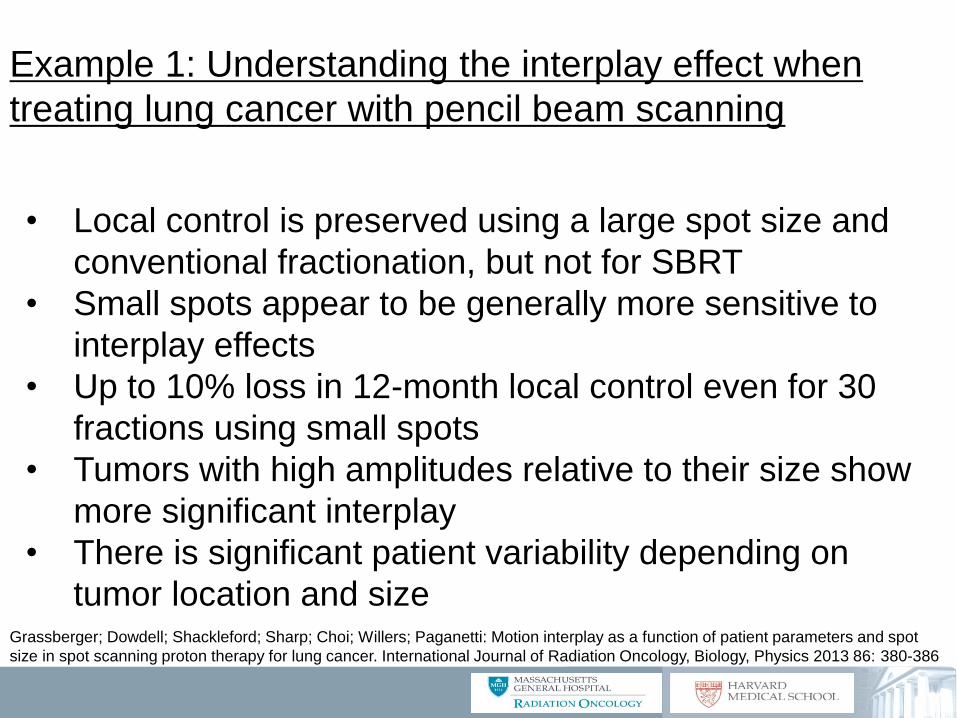
• Local control is preserved using a large spot size and
conventional fractionation, but not for SBRT
• Small spots appear to be generally more sensitive to
interplay effects
• Up to 10% loss in 12-month local control even for 30
fractions using small spots
• Tumors with high amplitudes relative to their size show
more significant interplay
• There is significant patient variability depending on
tumor location and size
Example 1: Understanding the interplay effect when
treating lung cancer with pencil beam scanning
Grassberger; Dowdell; Shackleford; Sharp; Choi; Willers; Paganetti: Motion interplay as a function of patient parameters and spot
size in spot scanning proton therapy for lung cancer. International Journal of Radiation Oncology, Biology, Physics 2013 86: 380-386

Monte Carlo for Clinical Research
Example 2: The use of LET information in proton therapy
treatment planning

Sethi; Giantsoudi; Raiford; Rappalino; Caruso; Yock; Tarbell; Paganetti; MacDonald: Patterns of failure following proton therapy in
medulloblastoma; LET distributions and RBE associations for relapses. International Journal of Radiation Oncology, Biology, Physics
2014 88: 655-663
DOSE LET

Sethi; Giantsoudi; Raiford; Rappalino; Caruso; Yock; Tarbell; Paganetti; MacDonald: Patterns of failure following proton therapy in
medulloblastoma; LET distributions and RBE associations for relapses. International Journal of Radiation Oncology, Biology, Physics
2014 88: 655-663

PLAN 1
PLAN 2
Dose LETd
Intensity-modulated proton therapy (IMPT)
Grassberger C; Trofimov A; Lomax A and Paganetti H: Variations in linear energy transfer within clinical proton therapy fields and the
potential for biological treatment planning. International Journal of Radiation Oncology, Biology, Physics 2011 80: 1559-1566

LET-guided multi-criteria optimization (MCO)
Biological dose optimization based on LET
Giantsoudi; Grassberger; Craft; Niemierko; Trofimov; Paganetti: Linear energy transfer (LET)-Guided Optimization in intensity
modulated proton therapy (IMPT): feasibility study and clinical potential. Int J Radiat Oncol Biol Phys 2013 87: 216-222

LET-guided MCO
Giantsoudi; Grassberger; Craft; Niemierko; Trofimov; Paganetti: Linear energy transfer (LET)-Guided Optimization in intensity
modulated proton therapy (IMPT): feasibility study and clinical potential. Int J Radiat Oncol Biol Phys 2013 87: 216-222

• For doses and LET values relevant in proton therapy, one
can assume a close to linear relationship between LET
and RBE for a given α/β. LET information can potentially
be used to understand unexpected side effects
• LET information can be used as additional parameter in
treatment optimization
Example 2: The use of LET information in proton therapy
treatment planning
Giantsoudi; Grassberger; Craft; Niemierko; Trofimov; Paganetti: Linear energy transfer (LET)-Guided Optimization in intensity
modulated proton therapy (IMPT): feasibility study and clinical potential. Int J Radiat Oncol Biol Phys 2013 87: 216-222

Versatile Limited functionality
Research Clinical
Research Clinical
Monte Carlo tools
Tasks

H. Paganetti: Range uncertainties in proton beam therapy and the impact of Monte Carlo simulations. Phys. Med.
Biol. 57: R99-R117 (2012)
Uncertainties in predicting the beam range in patients
Source of range uncertainty in the patient
Range
uncertainty
Independent of dose calculation:
Measurement uncertainty in water for commissioning ± 0.3 mm
Compensator design ± 0.2 mm
Beam reproducibility ± 0.2 mm
Patient setup ± 0.7 mm
Dose calculation:
Biology (always positive) + 0.8 %
CT imaging and calibration ± 0.5 %
CT conversion to tissue (excluding I-values) ± 0.5 %
CT grid size ± 0.3 %
Mean excitation energies (I-values) in tissue ± 1.5 %
Range degradation; complex inhomogeneities - 0.7 %
Range degradation; local lateral inhomogeneities * ± 2.5 %
Total (excluding *) 2.7% + 1.2 mm
Total 4.6% + 1.2 mm
Typical
Worst case

± 0.1 %
± 0.1 %
± 0.2 %
2.4 % + 1.2 mm
Source of range uncertainty in the patient
Range
uncertainty
Independent of dose calculation:
Measurement uncertainty in water for commissioning ± 0.3 mm
Compensator design ± 0.2 mm
Beam reproducibility ± 0.2 mm
Patient setup ± 0.7 mm
Dose calculation:
Biology (always positive) + 0.8 %
CT imaging and calibration ± 0.5 %
CT conversion to tissue (excluding I-values) ± 0.5 %
CT grid size ± 0.3 %
Mean excitation energies (I-values) in tissue ± 1.5 %
Range degradation; complex inhomogeneities - 0.7 %
Range degradation; local lateral inhomogeneities * ± 2.5 %
Total (excluding *) 2.7% + 1.2 mm
Total 4.6% + 1.2 mm
H. Paganetti: Range uncertainties in proton beam therapy and the impact of Monte Carlo simulations. Phys. Med.
Biol. 57: R99-R117 (2012)
Uncertainties in predicting the beam range in patients
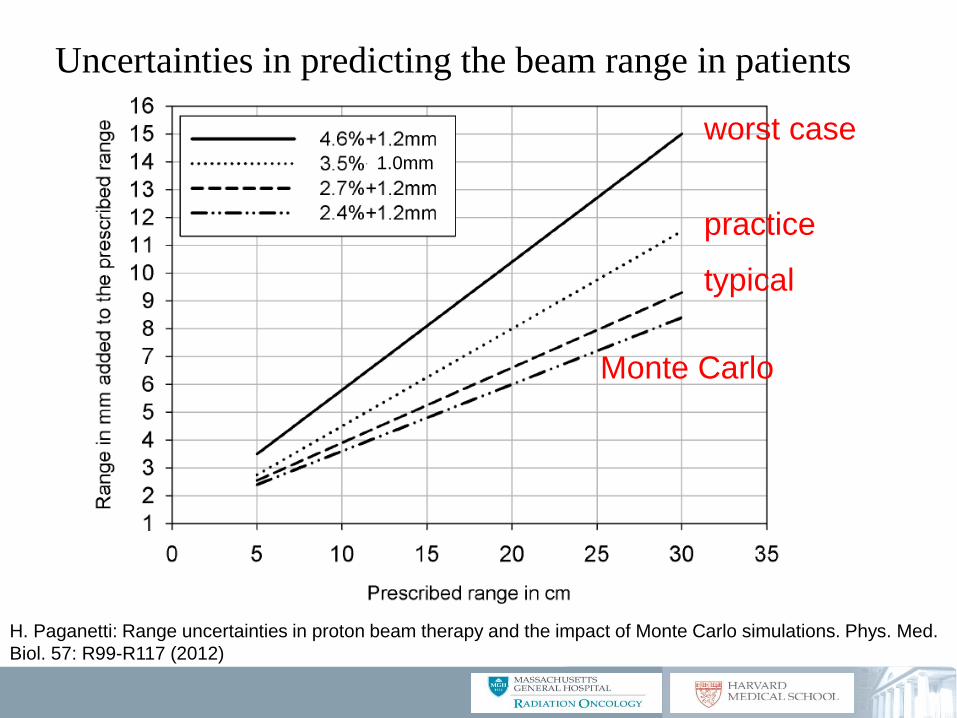
practice
worst case
typical
Monte Carlo
1.0mm
Uncertainties in predicting the beam range in patients
H. Paganetti: Range uncertainties in proton beam therapy and the impact of Monte Carlo simulations. Phys. Med.
Biol. 57: R99-R117 (2012)

Schuemann, Dowdell, Min, Paganetti: Site-specific range uncertainties caused by dose calculation algorithms for
proton therapy: Phys. Med. Biol. submitted
Field with an average
range difference of
<0.1mm but a root-mean-
square deviation of 4.7mm
Range differences between analytical and Monte Carlo based dose calculation
analyzed by comparing distal dose surfaces in patients

Estimation of range uncertainties by performing
MC dose calculation on 508 fields
includes uncertainties from sources other than dose calculation
Schuemann, Dowdell, Min, Paganetti: Site-specific range uncertainties caused by dose calculation algorithms for
proton therapy: Phys. Med. Biol. submitted

Monte Carlo for Clinical Use
• Monte Carlo in routine dose calculation has the
potential to reduce treatment margins
• Monte Carlo can be used to revise current margins
and better understand uncertainties due to dose
calculation
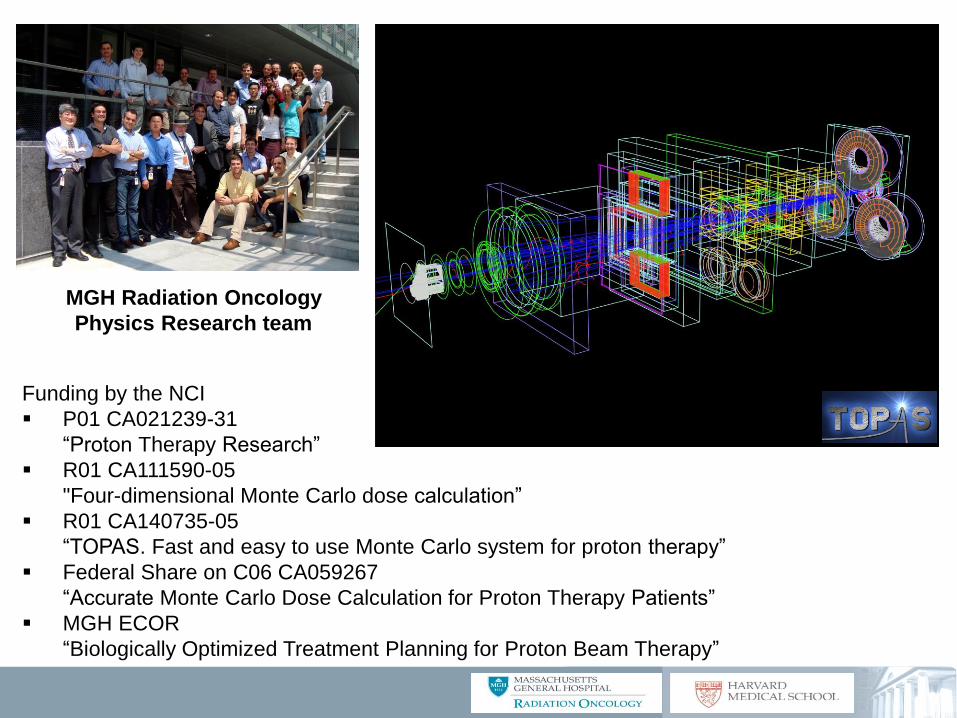
Funding by the NCI
P01 CA021239-31
“Proton Therapy Research”
R01 CA111590-05
"Four-dimensional Monte Carlo dose calculation”
R01 CA140735-05
“TOPAS. Fast and easy to use Monte Carlo system for proton therapy”
Federal Share on C06 CA059267
“Accurate Monte Carlo Dose Calculation for Proton Therapy Patients”
MGH ECOR
“Biologically Optimized Treatment Planning for Proton Beam Therapy”
MGH Radiation Oncology
Physics Research team