monte carlo simulation of cutaneous reflectance and fluorescence measurements – the effect of...
TRANSCRIPT
www.elsevier.com/locate/jphotobiol
Journal of Photochemistry and Photobiology B: Biology 86 (2007) 219–226
Monte Carlo simulation of cutaneous reflectance and fluorescencemeasurements – The effect of melanin contents and localization
Rong Chen a,b, Zhiwei Huang a, Harvey Lui a, Iltefat Hamzavi a, David I. McLean a,Shusen Xie b, Haishan Zeng a,*
a Laboratory for Advanced Medical Photonics (LAMP), Cancer Imaging Department, British Columbia Cancer Research Centre and Department
of Dermatology and Skin Science, University of British Columbia and Vancouver Coastal Health Research Institute, Vancouver, BC, Canadab Key Laboratory of Optoelectronic Science and Technology for Medicine (Fujian Normal University), Ministry of Education, Fuzhou, Fujian, PR China
Received 30 March 2006; received in revised form 1 November 2006; accepted 1 November 2006Available online 8 December 2006
Abstract
Melanin content and distribution in skin were studied by examining a patient with white, brown and blue skin tones expressed on skinaffected by vitiligo. Both diffuse reflectance and autofluorescence spectra of the three distinction skin sites were measured and compared.Monte Carlo simulations were then performed to help explain the measured spectral differences. The modeling is based on a six-layer skinoptical model established from published skin optical parameters and by adding melanin content into different locations in the modelskin. Both the reflectance and fluorescence spectra calculated by Monte Carlo (MC) simulation were approximately in agreement withexperimental results. The study suggests that: (1) trichrome vitiligo skin may be an ideal in vivo model for studying the effect of skinmelanin content and distribution on skin spectroscopy properties. (2) Based on the skin optical model and MC simulation, the contentand distribution of melanin in skin, or other component of skin could be simulated and predicted. (3) Both reflectance and fluorescencespectra provided information about superficial skin structures but fluorescence spectra are capable of providing information from deepercutaneous structures. (4) The research method, including the spectral ratio method, the method of adding and modifying the melanincontent in skin optical models, and MC simulation could be applied in other non-invasive optical studies of the skin.� 2006 Elsevier B.V. All rights reserved.
Keywords: Trichrome vitiligo skin; Blue vitiligo; Melanin distribution; Tissue reflectance spectra; Tissue fluorescence spectra; Monte Carlo simulation
1. Introduction
Melanin is one of the most ubiquitous and biologicallyimportant natural pigments [1], and is largely responsiblefor the color of skin, hair, and eyes. Melanin has significanteffects on the optical properties of normal and diseasedskin. The determination of melanin content and distribu-tion in skin is important for skin optics study and for opti-cal diagnoses of skin diseases. Kollias and Baqer devised anoptical model for in vivo human skin melanin by using
1011-1344/$ - see front matter � 2006 Elsevier B.V. All rights reserved.
doi:10.1016/j.jphotobiol.2006.11.001
* Corresponding author. Address: Cancer Imaging Department, BritishColumbia Cancer Research Centre, 675 West 10th Avenue, Vancouver,BC, Canada V5Z 1L3. Tel.: +1 604 675 8083; fax: +1 604 675 8099.
E-mail address: [email protected] (H. Zeng).
reflectance spectroscopy to analyze pigmented and depig-mented skin areas on patients with vitiligo [2]. Our grouphas recently measured and studied the reflectance and fluo-rescence spectra of trichrome vitiligo skin (normal skin,blue vitiligo, and vitiligo) [3]. In normal skin, melanin con-taining melanocytes are present in the epidermal layer. Vit-iligo is a common condition defined by the development ofdepigmented white macules and patches that histopatho-logically demonstrate an absence of melanocytes in the epi-dermis [4]. In blue vitiligo, the affected skin appears bluegray [5], and corresponds histologically with an absenceof epidermal melanocytes, but the appearance of numerousdermal melanophages. Our recent experimental resultsdemonstrated that both reflectance and fluorescence spec-tra are different for the three skin tones (conditions), and
220 R. Chen et al. / Journal of Photochemistry and Photobiology B: Biology 86 (2007) 219–226
these differences can be qualitatively explained by the dif-ferences on their melanin contents and localizations [3].In this paper, we attempt to construct an optical modelof the trichrome vitiligo skin based on published skin tissueoptical properties and by adding different melanin contentsinto different locations of the model skin. Monte Carlosimulation will then be used to calculate and reconstructthe reflectance and fluorescence spectra of the model skin.The calculated spectra will be compared with the experi-mentally measured spectra to verify if the different melanincontents and distributions in the model skin can quantita-tively lead to the experimentally observed spectral differ-ences among these three skin conditions. We hope thatthis work will be useful for the eventual development of amodeling method for determining the content and distribu-tion of melanin in human skin from non-invasive in vivo
reflectance and fluorescence spectral measurements.
2. Materials and methods
2.1. Melanin distribution in trichrome vitiligo skin
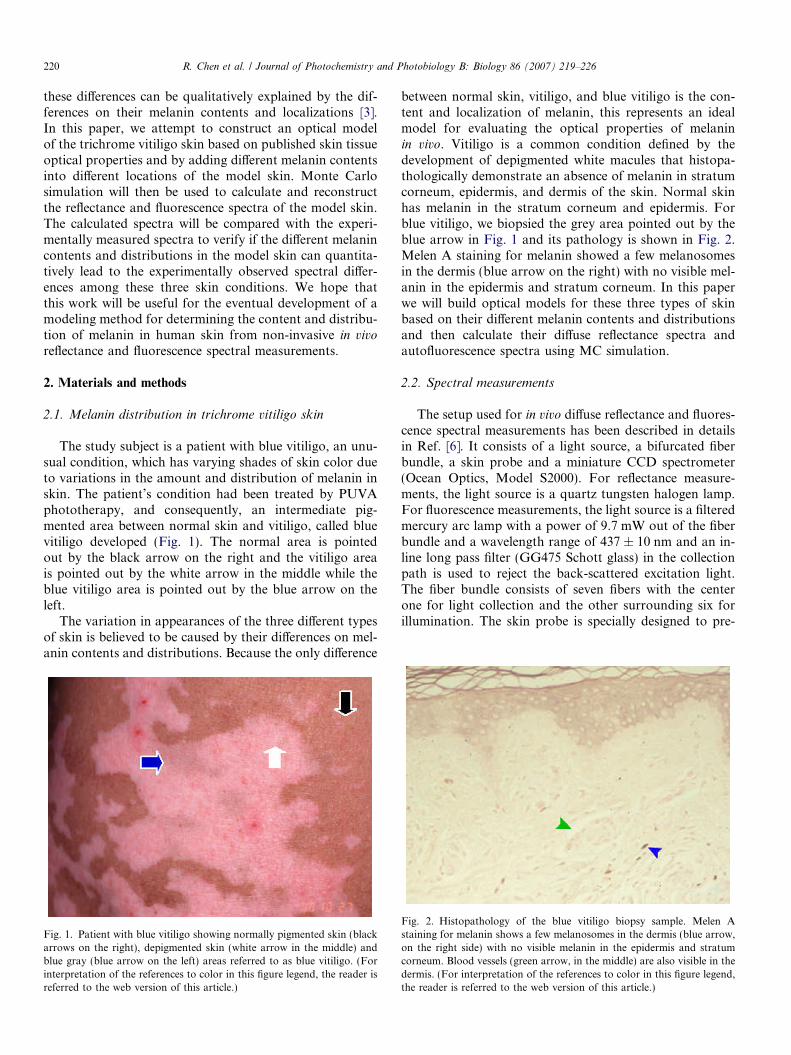
The study subject is a patient with blue vitiligo, an unu-sual condition, which has varying shades of skin color dueto variations in the amount and distribution of melanin inskin. The patient’s condition had been treated by PUVAphototherapy, and consequently, an intermediate pig-mented area between normal skin and vitiligo, called bluevitiligo developed (Fig. 1). The normal area is pointedout by the black arrow on the right and the vitiligo areais pointed out by the white arrow in the middle while theblue vitiligo area is pointed out by the blue arrow on theleft.
The variation in appearances of the three different typesof skin is believed to be caused by their differences on mel-anin contents and distributions. Because the only difference
Fig. 1. Patient with blue vitiligo showing normally pigmented skin (blackarrows on the right), depigmented skin (white arrow in the middle) andblue gray (blue arrow on the left) areas referred to as blue vitiligo. (Forinterpretation of the references to color in this figure legend, the reader isreferred to the web version of this article.)
between normal skin, vitiligo, and blue vitiligo is the con-tent and localization of melanin, this represents an idealmodel for evaluating the optical properties of melaninin vivo. Vitiligo is a common condition defined by thedevelopment of depigmented white macules that histopa-thologically demonstrate an absence of melanin in stratumcorneum, epidermis, and dermis of the skin. Normal skinhas melanin in the stratum corneum and epidermis. Forblue vitiligo, we biopsied the grey area pointed out by theblue arrow in Fig. 1 and its pathology is shown in Fig. 2.Melen A staining for melanin showed a few melanosomesin the dermis (blue arrow on the right) with no visible mel-anin in the epidermis and stratum corneum. In this paperwe will build optical models for these three types of skinbased on their different melanin contents and distributionsand then calculate their diffuse reflectance spectra andautofluorescence spectra using MC simulation.
2.2. Spectral measurements
The setup used for in vivo diffuse reflectance and fluores-cence spectral measurements has been described in detailsin Ref. [6]. It consists of a light source, a bifurcated fiberbundle, a skin probe and a miniature CCD spectrometer(Ocean Optics, Model S2000). For reflectance measure-ments, the light source is a quartz tungsten halogen lamp.For fluorescence measurements, the light source is a filteredmercury arc lamp with a power of 9.7 mW out of the fiberbundle and a wavelength range of 437 ± 10 nm and an in-line long pass filter (GG475 Schott glass) in the collectionpath is used to reject the back-scattered excitation light.The fiber bundle consists of seven fibers with the centerone for light collection and the other surrounding six forillumination. The skin probe is specially designed to pre-
Fig. 2. Histopathology of the blue vitiligo biopsy sample. Melen Astaining for melanin shows a few melanosomes in the dermis (blue arrow,on the right side) with no visible melanin in the epidermis and stratumcorneum. Blood vessels (green arrow, in the middle) are also visible in thedermis. (For interpretation of the references to color in this figure legend,the reader is referred to the web version of this article.)

R. Chen et al. / Journal of Photochemistry and Photobiology B: Biology 86 (2007) 219–226 221
vent the specular reflection and the pressure effect. Themeasurement geometry is equivalent to the broad beamillumination and small spot detection geometry used inour previous Monte Carlo modeling of in vivo skin fluores-cence measurements [7,8].
The spectral measurement results of the normal skin,vitiligo skin, and blue vitiligo skin have been presented inour previous report [3], but will be recited in Section 4when comparing with our MC modeling results.
3. Theoretical modeling and calculations
3.1. Six-layer optical model for normal skin
We have previously published a systematic study on themodeling of light propagation in and fluorescence measure-ments of normal skin [7,8]. Skin has a very complex struc-ture and thus for theoretical modeling, we have constructeda simplified seven-layer skin optical model for normal skinand have devised a method [7,8] of determining the opticalparameters of different skin layers in the model using pub-lished skin optical parameters by van Gemert et al. [9]. Inthis work, we further simplified the skin optical model intoa six-layer model (Table 1). Compared to the seven-layerskin optical model, the six-layer skin model has combinedthe third layer (papillary dermis, 100 lm thickness) and thefourth layer (upper blood plexus, 80 lm thickness) of theprevious seven-layer skin model into a single layer (papil-lary dermis, 180 lm thickness). Table 1 outlined thissix-layer model by providing data for the thickness (d),refractive index (n), and the optical transport parameters(la – absorption coefficient, ls – scattering coefficient, andg – scattering anisotropy) at 400 nm for each skin layer.As an example, tissue optical parameters at 400 nm ofthe combined layer were calculated to be n = 1.398, la =35.21 cm�1, ls = 794 cm�1, g = 0.74 as determined by thefollowing matrix formula [7]:
la
ls
gn
2664
3775 ¼
l1a l2
a
l1s l2
s
g1 g2
n1 n2
2664
3775 � f1
f2
� �
Table 1The six-layer skin optical model for normal skin
Layer d (lm) n la (cm�1) ls (cm�1) g
Air – 1.0 – – –Stratum corneum 10 1.45 220 2200 0.9Epidermis 80 1.4 71 580 0.736Papillary dermis 180 1.398 35.21 794 0.741Reticular dermis 1500 1.4 9 800 0.736Deep blood plexus 70 1.34 1188 530 0.956Dermis 160 1.4 9 800 0.736Subcutaneous fat – 1.46 – – –
The transport parameters (la, ls, g) are for 400 nm as an example only.The optical parameters for other wavelengths are different from this tableand were derived in a similar fashion using published skin optical prop-erties by van Gemert et al. [9].
where f1 and f2 are the percentages of individual compo-nents, superscripts 1 and 2 in the first matrix on the rightside of the equation denote the optical properties of com-ponents 1 and 2, respectively. For example, the papillarydermis in Table 1 is combined papillary dermis (took up98% volume fraction, f1 = 0.98) and upper blood plexus(took up 2% volume fraction, f2 = 0.02) of the previousseven-layer model, so the refractive index of thecombined layer was estimated as n = n1 Æ f1 + n2 Æ f2 =1.4 · 0.98 + 1.33 · 0.02 = 1.398. Tissue optical parametersat other wavelengths were derived in a similar fashion.This simplified six-layer model made it more conve-nient for us to modify the melanin and blood contentand distributions in the skin models latter on (seeTable 6).
3.2. Optical model for trichrome vitiligo skin
The melanin distribution of blue vitiligo has been dis-cussed earlier. The variation of skin optical parameterswas caused by the change of melanin content and distri-butions. The effect of UVA irradiation on vitiligo/bluevitiligo skin is negligible according to Lehmann et al.’sstudy on UV irradiation of the skin [10], which demon-strated that although UVB significantly increased thehorny cell layers, UVA did not alter the thickness ofthe stratum corneum. The optical parameters in Table1, for example, the absorption coefficient, could beincreased or decreased by different percentage of melanincontent in different skin layers. We changed the absorp-tion coefficient according to different melanin contentand distributions in trichrome vitiligo skin (Table 2).In this table letter m represents the absorption coefficientof melanosome (m = 1.70 · 1012k�3.48, where k is thewavelength of light in unit of nm, while m is in unitof cm�1. http://omlc.ogi.edu/spectra/melanin/mua.html).Because the optical parameters in Ref. [9] are basedon measurements of Caucasian skin, to account forthe darker skin of the study patient we added one per-cent more melanosome to the epidermis absorption coef-ficient of the normal skin model [11]. As an example for400 nm light, this melanosome addition corresponds toan increase of 14.97 cm�1 for the normal skin epidermalabsorption coefficient. Therefore, la for epidermis inTable 3 is increased to 85.97 cm�1 from the epidermalla value of 71 cm�1 in Table 1. However, because ofdepigmentation in vitiligo skin and blue vitiligo skin, a3% melanosome absorption was subtracted from thestratum corneum and epidermis layers [12,13]. As shownin Fig. 2, melanin was found in dermis of blue vitiligo,so 1.5% melanosome absorption was added into thereticular dermis of the blue vitiligo skin model. Withthese considerations, the six-layer optical model for tri-chrome vitiligo skin and their optical parameters wereobtained. Tables 3–5 list the corresponding opticalparameters for normal skin, vitiligo skin, and blue viti-ligo skin, respectively.

Table 2Melanin content and distributions of trichrome vitiligo skin
Skin type Skin layer
Stratumcorneum
Epidermis Papillarydermis
Reticulardermis
Normal la la + 0.01m – –Vitiligo la � 0.03m la � 0.03m – –Blue
vitiligola � 0.03m la � 0.03m – la + 0.015m
Here, m denotes the absorption coefficient of melanosome, lmelanosome. Weused data from Dr. Steven L. Jacques’ website (http://omlc.ogi.edu/spectra/melanin/mua.html) and Ref. [11–13].
Table 3The modified six-layer optical model for normal skin according to Table 2
Layer d (lm) n la (cm�1) ls (cm�1) g
Air – 1.0 – – –Stratum corneum 10 1.45 220 2200 0.9Epidermis 80 1.4 85.97 580 0.736Papillary dermis 180 1.398 35.21 794 0.741Reticular dermis 1500 1.4 9 800 0.736Deep blood plexus 70 1.34 1188 530 0.956Dermis 160 1.4 9 800 0.736Subcutaneous fat – 1.46 – – –
The transport parameters (la, ls, g) are for 400 nm only. The opticalparameters for other wavelengths are different from this table and werederived in a similar fashion using published skin optical properties by vanGemert et al. [9] and the absorption coefficient of melanosome, from Dr.Steven L. Jacques’ website (http://omlc.ogi.edu/spectra/melanin/mua.html) and Ref. [11–13].
Table 4The six-layer skin optical model for vitiligo skin according to Table 2
Layer d (lm) n la (cm�1) ls (cm�1) g
Air – 1.0 – – –Stratum corneum 10 1.45 175.08 2200 0.9Epidermis 80 1.4 26.08 580 0.736Papillary dermis 180 1.398 35.21 794 0.741Reticular dermis 1500 1.4 31.46 800 0.736Deep blood plexus 70 1.34 1188 530 0.956Dermis 160 1.4 9 800 0.736Subcutaneous fat – 1.46 – – –
The transport parameters (la, ls, g) are for 400 nm only. The opticalparameters for other wavelengths are different from this table and werederived in a similar fashion using published skin optical properties by vanGemert et al. [9] and the absorption coefficient of melanosome, from Dr.Steven L. Jacques’ website (http://omlc.ogi.edu/spectra/melanin/mua.html) and Ref. [11–13].
Table 5The six-layer skin optical model for blue vitiligo skin according to Table 2
Layer d (lm) n la (cm�1) ls (cm�1) g
Air – 1.0 – – –Stratum corneum 10 1.45 175.08 2200 0.9Epidermis 80 1.4 26.08 580 0.736Papillary dermis 180 1.398 35.21 794 0.741Reticular dermis 1500 1.4 9 800 0.736Deep blood plexus 70 1.34 1188.59 530 0.956Dermis 160 1.4 9 800 0.736Subcutaneous fat – 1.46 – – –
The transport parameters (la, ls, g) are for 400 nm only. The opticalparameters for other wavelengths are different from this table and werederived in a similar fashion using published skin optical properties by vanGemert et al. [9] and the absorption coefficient of melanosome, from Dr.Steven L. Jacques’ website (http://omlc.ogi.edu/spectra/melanin/mua.html) and Ref. [11–13].
222 R. Chen et al. / Journal of Photochemistry and Photobiology B: Biology 86 (2007) 219–226
3.3. Monte Carlo simulation
The Monte Carlo code from Wang and Jacques [14,15]were used directly, without any modifications to calculatethe diffuse reflectance at different wavelengths to recon-struct the diffuse reflectance spectra of various skin models(normal, vitiligo, and blue vitiligo). For fluorescence spec-tral modeling and reconstruction, the methodology in ourprevious paper [7] was used. It consists of four steps:
(1) Calculate the excitation light distribution inside the
model skin. This is performed directly with the MonteCarlo code from Wang and Jacques [14,15].
(2) Obtain the intrinsic fluorescence coefficient. Weassume that this coefficient is the same for normalskin, vitiligo skin, and blue vitiligo skin. The samedata for normal skin from our previous paper [7]are used in the current study.
(3) Calculation of fluorescence escape function. TheMonte Carlo code was modified to simulate theescape process of a fluorescence point source insidea given tissue depth. For each fluorescence emissionwavelength, 40 different source depths were simu-lated. We studied 24 different emission wavelengthsfrom 470 nm to 700 nm at an interval of 10 nm.Therefore, for each fluorescence spectrum, 960 simu-lations had to be performed, requiring a large amountof calculations.
(4) Calculation of the observed fluorescence. The observedflux rate of escaping fluorescence at the tissue surfacewas computed by convolution of the excitation lightdistribution, the intrinsic fluorescence coefficient,and the fluorescence escape function. Details can befound in our previous paper [7].
4. Results and discussion
4.1. Reflectance spectra of trichrome vitiligo skin
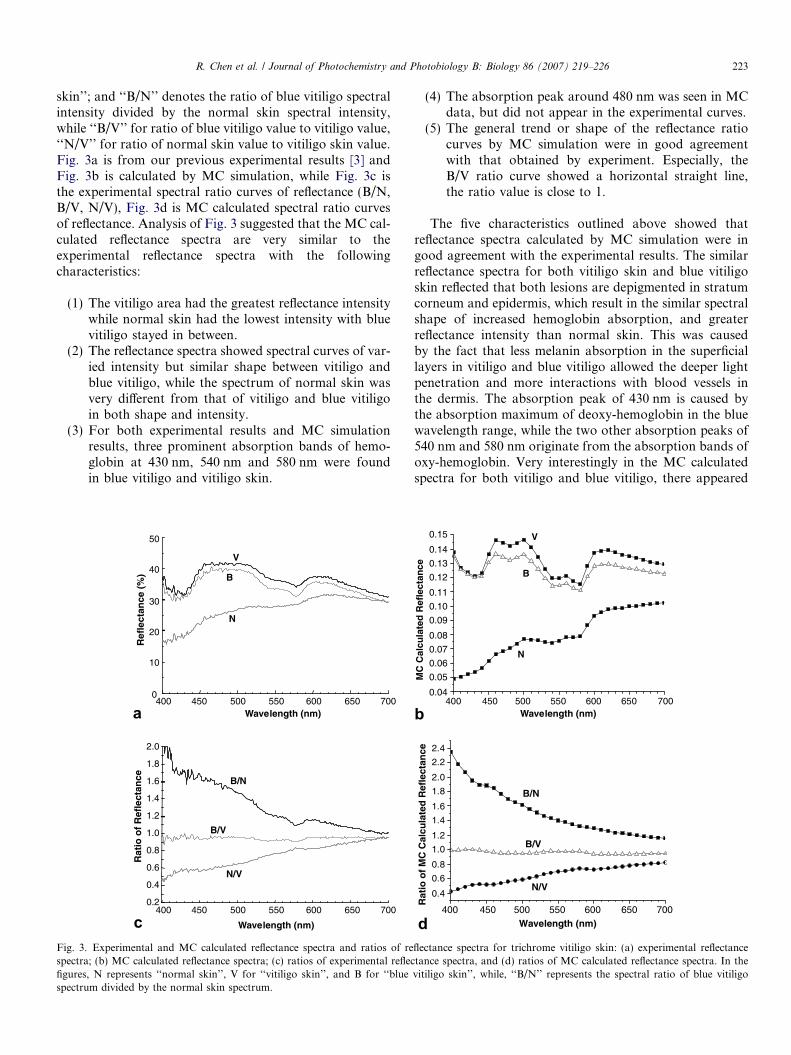
The reflectance spectra of trichrome vitiligo skin werecalculated according to the skin optical model given inTables 3–5 using MC simulation [14,15]. In the calculation,1,000,000 photons were launched for each wavelengthpoint. The reflectance spectra ranging from 400 nm to700 nm were calculated using a 10 nm interval, and hencea total of 31 data points were generated to form each reflec-tance spectrum curve. Fig. 3 shows the reflectance spectraof trichrome vitiligo skin. In the figure, ‘‘V’’ denotes ‘‘viti-ligo skin’’, ‘‘B’’ for ‘‘blue vitiligo skin’’, N for ‘‘normal
R. Chen et al. / Journal of Photochemistry and Photobiology B: Biology 86 (2007) 219–226 223
skin’’; and ‘‘B/N’’ denotes the ratio of blue vitiligo spectralintensity divided by the normal skin spectral intensity,while ‘‘B/V’’ for ratio of blue vitiligo value to vitiligo value,‘‘N/V’’ for ratio of normal skin value to vitiligo skin value.Fig. 3a is from our previous experimental results [3] andFig. 3b is calculated by MC simulation, while Fig. 3c isthe experimental spectral ratio curves of reflectance (B/N,B/V, N/V), Fig. 3d is MC calculated spectral ratio curvesof reflectance. Analysis of Fig. 3 suggested that the MC cal-culated reflectance spectra are very similar to theexperimental reflectance spectra with the followingcharacteristics:
(1) The vitiligo area had the greatest reflectance intensitywhile normal skin had the lowest intensity with bluevitiligo stayed in between.
(2) The reflectance spectra showed spectral curves of var-ied intensity but similar shape between vitiligo andblue vitiligo, while the spectrum of normal skin wasvery different from that of vitiligo and blue vitiligoin both shape and intensity.
(3) For both experimental results and MC simulationresults, three prominent absorption bands of hemo-globin at 430 nm, 540 nm and 580 nm were foundin blue vitiligo and vitiligo skin.
400 450 500 550 600 650 700
400 450 500 550 600 650 700
0
10
20
30
40
50
Ref
lect
ance
(%
)
N
V
B
0.2
0.4
0.6
0.8
1.0
1.2
1.4
1.6
1.8
2.0
Rat
io o
f R
efle
ctan
ce B/N
B/V
N/V
Wavelength (nm)
Wavelength (nm)
Fig. 3. Experimental and MC calculated reflectance spectra and ratios of respectra; (b) MC calculated reflectance spectra; (c) ratios of experimental reflecfigures, N represents ‘‘normal skin’’, V for ‘‘vitiligo skin’’, and B for ‘‘bluespectrum divided by the normal skin spectrum.
(4) The absorption peak around 480 nm was seen in MCdata, but did not appear in the experimental curves.
(5) The general trend or shape of the reflectance ratiocurves by MC simulation were in good agreementwith that obtained by experiment. Especially, theB/V ratio curve showed a horizontal straight line,the ratio value is close to 1.
The five characteristics outlined above showed thatreflectance spectra calculated by MC simulation were ingood agreement with the experimental results. The similarreflectance spectra for both vitiligo skin and blue vitiligoskin reflected that both lesions are depigmented in stratumcorneum and epidermis, which result in the similar spectralshape of increased hemoglobin absorption, and greaterreflectance intensity than normal skin. This was causedby the fact that less melanin absorption in the superficiallayers in vitiligo and blue vitiligo allowed the deeper lightpenetration and more interactions with blood vessels inthe dermis. The absorption peak of 430 nm is caused bythe absorption maximum of deoxy-hemoglobin in the bluewavelength range, while the two other absorption peaks of540 nm and 580 nm originate from the absorption bands ofoxy-hemoglobin. Very interestingly in the MC calculatedspectra for both vitiligo and blue vitiligo, there appeared
400 450 500 550 600 650 7000.04
0.05
0.06
0.07
0.08
0.09
0.10
0.11
0.12
0.13
0.14
0.15
MC
Cal
cula
ted
Ref
lect
ance
Wavelength (nm)
N
V
B
400 450 500 550 600 650 700
0.4
0.6
0.8
1.0
1.2
1.4
1.6
1.8
2.0
2.2
2.4
Rat
io o
f M
C C
alcu
late
d R
efle
ctan
ce
Wavelength (nm)
B/N
B/V
N/V
flectance spectra for trichrome vitiligo skin: (a) experimental reflectancetance spectra, and (d) ratios of MC calculated reflectance spectra. In thevitiligo skin’’, while, ‘‘B/N’’ represents the spectral ratio of blue vitiligo

224 R. Chen et al. / Journal of Photochemistry and Photobiology B: Biology 86 (2007) 219–226
to be a new absorption valley around 480 nm, which wasnot observable in the experimental spectral curves. We ten-tatively attributed this absorption to originate from biliru-bin [16]. It may be due to the fact that the skin tissuesamples used to generate the optical parameters in the lit-erature [9] contained bilirubin.
4.2. Fluorescence spectra of trichrome vitiligo skin
According to the skin optical model in Tables 3–5, andthe method to calculate skin fluorescence outlined in Sec-tion 3.3 and detailed in our previous work [7,8], we calcu-lated the fluorescence spectra of trichrome vitiligo skin byMC simulation. The results are shown in Fig. 4 in compar-ison with our previous experimental results [3]. Fig. 4a isthe experimentally measured fluorescence spectra, Fig. 4bthe fluorescence spectra calculated by MC simulation,Fig. 4c the ratios of experimental fluorescence spectra,and Fig. 4d the ratios of the MC calculated fluorescencespectra. Comparing the experimental results with the MCsimulation results we observed that:
(1) From the fluorescence spectra, the results for experi-mental and MC calculated fluorescence showed simi-larities in that vitiligo and blue vitiligo have greaterintensities, while normal skin has lower intensity.The fluorescence peak of vitiligo, blue vitiligo andnormal skin are all between 500 nm and 520 nm.
1000
2000
3000
4000
Flu
ore
scen
ce (
a.u
.)
N
V
B
480 500 520 540 560 580 600 620 640 660 680 700
480 500 520 540 560 580 600 620 640 660 680 700
0.75
0.85
0.95
1.05
1.15
1.25
Rat
io o
f F
luo
resc
ence
B/N
B/V
N/V
Wavelength (nm)
Wavelength (nm)
Fig. 4. Experimental and MC calculated fluorescence spectra and ratios of fluspectra; (b) MC calculated fluorescence spectra; (c) ratios of experimental fluo
(2) The ratios of fluorescence spectra, however, showedobvious differences between Fig. 4c and Fig. 4d.The experimental B/N fluorescence spectral ratiocurve showed a flat horizontal line with ratio intensi-ties around 1.15, while the MC calculated fluores-cence spectral ratio for the B/N curve decreasedwith wavelength from 3.17 to 2.22. For ratio curvesB/V and N/V in MC data, there were no peaksaround 540 nm and 580 nm as were seen in the exper-imental data.
Zeng et al. [7,8,17,18] showed that the skin fluorophoredensity varies for different layers of skin tissue, and thefluorophore density in epidermis is close to zero. Dermalfluorescence is 7.5 times brighter than stratum corneum.As stated earlier blue vitiligo skin has melanin in dermis,while normal skin has melanin in the epidermis, the fluores-cence emitted from the dermis of blue vitiligo (B) and nor-mal (N) skin may both be absorbed by melanin, so theexperimental fluorescence spectral ratio, B/N is approxi-mately constant (Fig. 4c). However, vitiligo skin is depig-mented in both epidermis and dermis, its fluorescencespectral shape is different from blue vitiligo and normalskin, therefore, experimental fluorescence spectral ratiocurves B/V and N/V are not straight horizontal lines butwith obvious hemoglobin absorption peaks around540 nm and 580 nm. On the contrary, the MC calculatedfluorescence spectral ratios in Fig. 4d did not confirm the
480 500 520 540 560 580 600 620 640 660 680 7000
100
200
300
400
500
600
700
800
MC
Cal
cula
ted
Flu
ore
scen
ce
Wavelength (nm)
V
B
N
480 500 520 540 560 580 600 620 640 660 680 7000.20.40.60.81.01.21.41.61.82.02.22.42.62.83.03.2
Rat
io o
f M
C C
alcu
late
d F
luo
resc
ence
Wavelength(nm)
B/N
B/V
N/V
orescence spectra for trichrome vitiligo skin: (a) experimental fluorescencerescence spectra; and (d) ratios of MC calculated fluorescence spectra.
R. Chen et al. / Journal of Photochemistry and Photobiology B: Biology 86 (2007) 219–226 225
trends seen in the experimental curves, suggesting that ourskin model may have not accurately reflected the melaninand hemoglobin distributions in the real skin tissue.
4.3. Modified skin optical models and their Monte Carlo
simulation
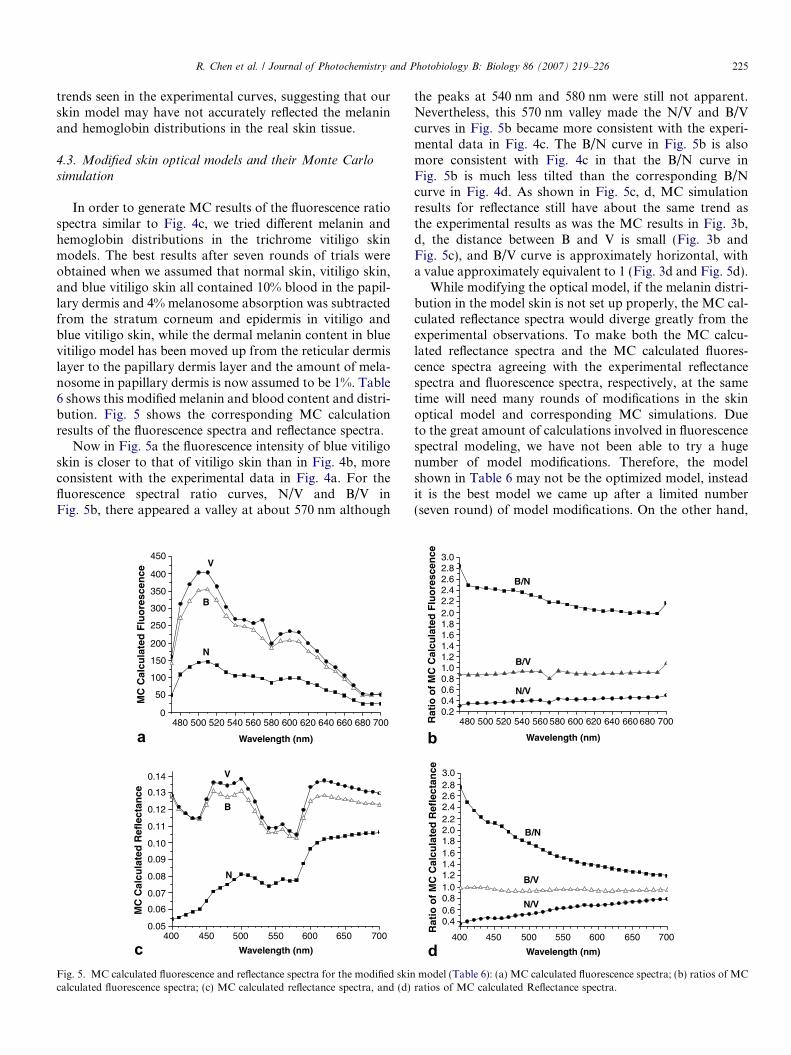
In order to generate MC results of the fluorescence ratiospectra similar to Fig. 4c, we tried different melanin andhemoglobin distributions in the trichrome vitiligo skinmodels. The best results after seven rounds of trials wereobtained when we assumed that normal skin, vitiligo skin,and blue vitiligo skin all contained 10% blood in the papil-lary dermis and 4% melanosome absorption was subtractedfrom the stratum corneum and epidermis in vitiligo andblue vitiligo skin, while the dermal melanin content in bluevitiligo model has been moved up from the reticular dermislayer to the papillary dermis layer and the amount of mela-nosome in papillary dermis is now assumed to be 1%. Table6 shows this modified melanin and blood content and distri-bution. Fig. 5 shows the corresponding MC calculationresults of the fluorescence spectra and reflectance spectra.
Now in Fig. 5a the fluorescence intensity of blue vitiligoskin is closer to that of vitiligo skin than in Fig. 4b, moreconsistent with the experimental data in Fig. 4a. For thefluorescence spectral ratio curves, N/V and B/V inFig. 5b, there appeared a valley at about 570 nm although
480 500 520 540 560 580 600 620 640 660 680 7000
50
100
150
200
250
300
350
400
450
MC
Cal
cula
ted
Flu
ore
scen
ce
V
B
N
400 450 500 550 600 650 7000.05
0.06
0.07
0.08
0.09
0.10
0.11
0.12
0.13
0.14
MC
Cal
cula
ted
Ref
lect
ance
V
B
N
Wavelength (nm)
Wavelength (nm)
Fig. 5. MC calculated fluorescence and reflectance spectra for the modified skincalculated fluorescence spectra; (c) MC calculated reflectance spectra, and (d)
the peaks at 540 nm and 580 nm were still not apparent.Nevertheless, this 570 nm valley made the N/V and B/Vcurves in Fig. 5b became more consistent with the experi-mental data in Fig. 4c. The B/N curve in Fig. 5b is alsomore consistent with Fig. 4c in that the B/N curve inFig. 5b is much less tilted than the corresponding B/Ncurve in Fig. 4d. As shown in Fig. 5c, d, MC simulationresults for reflectance still have about the same trend asthe experimental results as was the MC results in Fig. 3b,d, the distance between B and V is small (Fig. 3b andFig. 5c), and B/V curve is approximately horizontal, witha value approximately equivalent to 1 (Fig. 3d and Fig. 5d).
While modifying the optical model, if the melanin distri-bution in the model skin is not set up properly, the MC cal-culated reflectance spectra would diverge greatly from theexperimental observations. To make both the MC calcu-lated reflectance spectra and the MC calculated fluores-cence spectra agreeing with the experimental reflectancespectra and fluorescence spectra, respectively, at the sametime will need many rounds of modifications in the skinoptical model and corresponding MC simulations. Dueto the great amount of calculations involved in fluorescencespectral modeling, we have not been able to try a hugenumber of model modifications. Therefore, the modelshown in Table 6 may not be the optimized model, insteadit is the best model we came up after a limited number(seven round) of model modifications. On the other hand,
480 500 520 540 560 580 600 620 640 660 680 7000.20.40.60.81.01.21.41.61.82.02.22.42.62.83.0
Rat
io o
f M
C C
alcu
late
d F
luo
resc
ence
B/N
B/V
N/V
400 450 500 550 600 650 700
0.40.60.81.01.21.41.61.82.02.22.42.62.83.0
Rat
io o
f M
C C
alcu
late
d R
efle
ctan
ce
Wavelength (nm)
Wavelength (nm)
B/N
B/V
N/V
model (Table 6): (a) MC calculated fluorescence spectra; (b) ratios of MCratios of MC calculated Reflectance spectra.
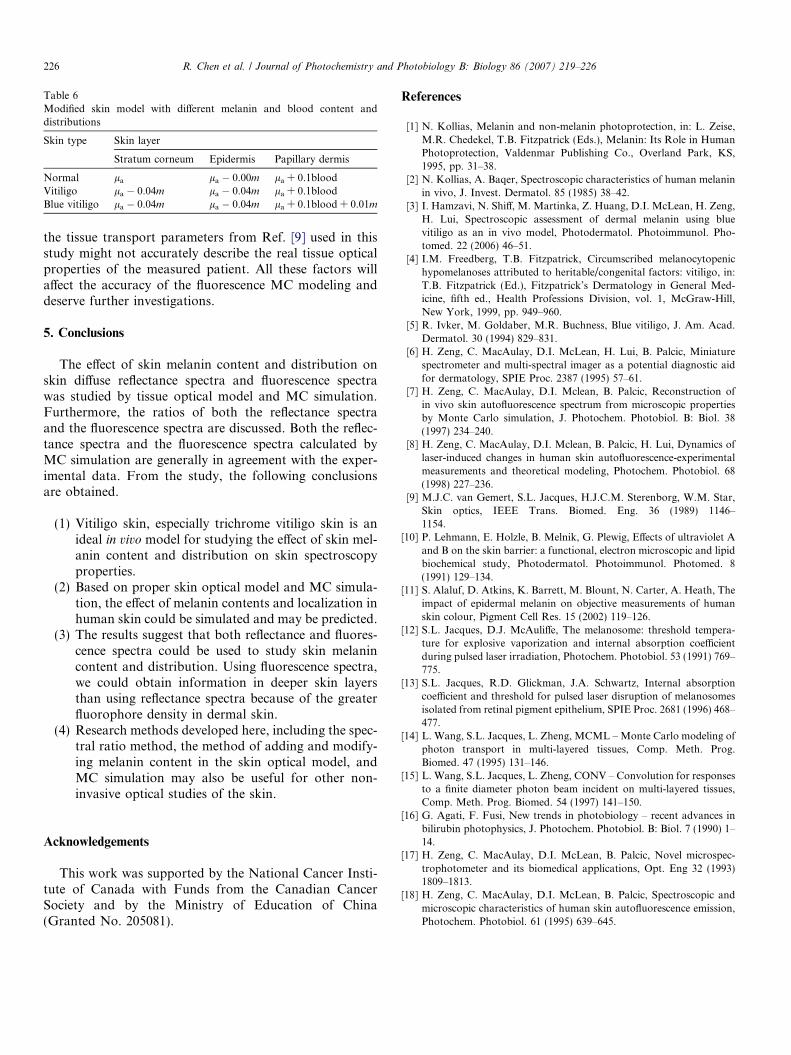
Table 6Modified skin model with different melanin and blood content anddistributions
Skin type Skin layer
Stratum corneum Epidermis Papillary dermis
Normal la la � 0.00m la + 0.1bloodVitiligo la � 0.04m la � 0.04m la + 0.1bloodBlue vitiligo la � 0.04m la � 0.04m la + 0.1blood + 0.01m
226 R. Chen et al. / Journal of Photochemistry and Photobiology B: Biology 86 (2007) 219–226
the tissue transport parameters from Ref. [9] used in thisstudy might not accurately describe the real tissue opticalproperties of the measured patient. All these factors willaffect the accuracy of the fluorescence MC modeling anddeserve further investigations.
5. Conclusions
The effect of skin melanin content and distribution onskin diffuse reflectance spectra and fluorescence spectrawas studied by tissue optical model and MC simulation.Furthermore, the ratios of both the reflectance spectraand the fluorescence spectra are discussed. Both the reflec-tance spectra and the fluorescence spectra calculated byMC simulation are generally in agreement with the exper-imental data. From the study, the following conclusionsare obtained.
(1) Vitiligo skin, especially trichrome vitiligo skin is anideal in vivo model for studying the effect of skin mel-anin content and distribution on skin spectroscopyproperties.
(2) Based on proper skin optical model and MC simula-tion, the effect of melanin contents and localization inhuman skin could be simulated and may be predicted.
(3) The results suggest that both reflectance and fluores-cence spectra could be used to study skin melanincontent and distribution. Using fluorescence spectra,we could obtain information in deeper skin layersthan using reflectance spectra because of the greaterfluorophore density in dermal skin.
(4) Research methods developed here, including the spec-tral ratio method, the method of adding and modify-ing melanin content in the skin optical model, andMC simulation may also be useful for other non-invasive optical studies of the skin.
Acknowledgements
This work was supported by the National Cancer Insti-tute of Canada with Funds from the Canadian CancerSociety and by the Ministry of Education of China(Granted No. 205081).
References
[1] N. Kollias, Melanin and non-melanin photoprotection, in: L. Zeise,M.R. Chedekel, T.B. Fitzpatrick (Eds.), Melanin: Its Role in HumanPhotoprotection, Valdenmar Publishing Co., Overland Park, KS,1995, pp. 31–38.
[2] N. Kollias, A. Baqer, Spectroscopic characteristics of human melaninin vivo, J. Invest. Dermatol. 85 (1985) 38–42.
[3] I. Hamzavi, N. Shiff, M. Martinka, Z. Huang, D.I. McLean, H. Zeng,H. Lui, Spectroscopic assessment of dermal melanin using bluevitiligo as an in vivo model, Photodermatol. Photoimmunol. Pho-tomed. 22 (2006) 46–51.
[4] I.M. Freedberg, T.B. Fitzpatrick, Circumscribed melanocytopenichypomelanoses attributed to heritable/congenital factors: vitiligo, in:T.B. Fitzpatrick (Ed.), Fitzpatrick’s Dermatology in General Med-icine, fifth ed., Health Professions Division, vol. 1, McGraw-Hill,New York, 1999, pp. 949–960.
[5] R. Ivker, M. Goldaber, M.R. Buchness, Blue vitiligo, J. Am. Acad.Dermatol. 30 (1994) 829–831.
[6] H. Zeng, C. MacAulay, D.I. McLean, H. Lui, B. Palcic, Miniaturespectrometer and multi-spectral imager as a potential diagnostic aidfor dermatology, SPIE Proc. 2387 (1995) 57–61.
[7] H. Zeng, C. MacAulay, D.I. Mclean, B. Palcic, Reconstruction ofin vivo skin autofluorescence spectrum from microscopic propertiesby Monte Carlo simulation, J. Photochem. Photobiol. B: Biol. 38(1997) 234–240.
[8] H. Zeng, C. MacAulay, D.I. Mclean, B. Palcic, H. Lui, Dynamics oflaser-induced changes in human skin autofluorescence-experimentalmeasurements and theoretical modeling, Photochem. Photobiol. 68(1998) 227–236.
[9] M.J.C. van Gemert, S.L. Jacques, H.J.C.M. Sterenborg, W.M. Star,Skin optics, IEEE Trans. Biomed. Eng. 36 (1989) 1146–1154.
[10] P. Lehmann, E. Holzle, B. Melnik, G. Plewig, Effects of ultraviolet Aand B on the skin barrier: a functional, electron microscopic and lipidbiochemical study, Photodermatol. Photoimmunol. Photomed. 8(1991) 129–134.
[11] S. Alaluf, D. Atkins, K. Barrett, M. Blount, N. Carter, A. Heath, Theimpact of epidermal melanin on objective measurements of humanskin colour, Pigment Cell Res. 15 (2002) 119–126.
[12] S.L. Jacques, D.J. McAuliffe, The melanosome: threshold tempera-ture for explosive vaporization and internal absorption coefficientduring pulsed laser irradiation, Photochem. Photobiol. 53 (1991) 769–775.
[13] S.L. Jacques, R.D. Glickman, J.A. Schwartz, Internal absorptioncoefficient and threshold for pulsed laser disruption of melanosomesisolated from retinal pigment epithelium, SPIE Proc. 2681 (1996) 468–477.
[14] L. Wang, S.L. Jacques, L. Zheng, MCML – Monte Carlo modeling ofphoton transport in multi-layered tissues, Comp. Meth. Prog.Biomed. 47 (1995) 131–146.
[15] L. Wang, S.L. Jacques, L. Zheng, CONV – Convolution for responsesto a finite diameter photon beam incident on multi-layered tissues,Comp. Meth. Prog. Biomed. 54 (1997) 141–150.
[16] G. Agati, F. Fusi, New trends in photobiology – recent advances inbilirubin photophysics, J. Photochem. Photobiol. B: Biol. 7 (1990) 1–14.
[17] H. Zeng, C. MacAulay, D.I. McLean, B. Palcic, Novel microspec-trophotometer and its biomedical applications, Opt. Eng 32 (1993)1809–1813.
[18] H. Zeng, C. MacAulay, D.I. McLean, B. Palcic, Spectroscopic andmicroscopic characteristics of human skin autofluorescence emission,Photochem. Photobiol. 61 (1995) 639–645.