monte carlo modeling based patient dose …
TRANSCRIPT
Clemson UniversityTigerPrints
All Dissertations Dissertations
5-2014
MONTE CARLO MODELING BASEDPATIENT DOSE OPTIMIZATION INDIAGNOSTIC RADIOLOGYWenjun HeClemson University, [email protected]
Follow this and additional works at: https://tigerprints.clemson.edu/all_dissertations
This Dissertation is brought to you for free and open access by the Dissertations at TigerPrints. It has been accepted for inclusion in All Dissertations byan authorized administrator of TigerPrints. For more information, please contact [email protected].
Recommended CitationHe, Wenjun, "MONTE CARLO MODELING BASED PATIENT DOSE OPTIMIZATION IN DIAGNOSTIC RADIOLOGY"(2014). All Dissertations. 1276.https://tigerprints.clemson.edu/all_dissertations/1276

MONTE CARLO MODELING BASED PATIENT
DOSE OPTIMIZATION IN DIAGNOSTIC RADIOLOGY
A Dissertation
Presented to
the Graduate School of
Clemson University
In Partial Fulfillment
of the Requirements for the Degree
Doctor of Philosophy
Bioengineering
by
Wenjun He
May 2014
Accepted by:
Hai Yao, PhD, Committee Chair
Walter Huda, PhD
Richard Swaja, PhD
Tong Ye, PhD
II
ABSTRACT
Radiation doses are caused by the energy deposited in unit mass of matter from
ionizing radiation. In the US, radiation doses from medical imaging increased six-fold in
the past generation. Among medical exposures to patients, computed tomography (CT)
composes about half of the collective doses, and interventional fluoroscopy composes
14%. Radiation exposure to patients undergoing diagnostic radiological procedures
causes increased lifetime carcinogenic risks, especially for pediatric patients who are
more radiosensitive than adults. The correlation between procedural x-ray techniques and
the radiation doses to patients, as well as the resultant image quality, is not well
understood, and therefore the focus of the performed studies.
High radiation dose levels can occur as an outcome of complex procedures
requiring additional imaging, or when a patient undergoes multiple radiological
procedures. Accumulated occupational doses, caused by the scattered radiation from the
patient to the staff during the procedures, are also of concern. There are many factors that
affect the patient radiation doses, such as different combinations of technical parameter
settings and patient characteristics. Due to the complexities and time-consuming nature of
clinical dose/exposure measurements, the Monte Carlo technique is the only realistic tool
to investigate patient doses and occupational exposure.
Therefore, the objective of this dissertation is to investigate the possible
optimization methods of the irradiation technical factors in order to lower radiation doses
to patients undergoing diagnostic radiological examinations using Monte Carlo
algorithm-based software. Our general hypothesis is that incident x-ray photon energy
III
used in a diagnostic radiological procedure can be optimized to reduce patient doses
without sacrificing image quality, and therefore can lower radiation-induced lifetime
carcinogenic risks for patients. Our results will be valuable for medical physicists to
analyze dose distributions, and for the cardiology clinicians to maximize image guidance
capabilities while minimizing potential carcinogenic and deterministic risks to pediatric
patients.
Firstly, the impact of irradiation parameters on patient doses during CT scans was
investigated and possible optimization methods were discussed. Our results about cone
beam CT scans showed that there were major differences in organ and effective dose as
the x-ray tube rotates around the patient. This suggested that the use of x-ray tube current
modulation could produce substantial reductions in organ and effective dose for body
imaging with cone beam CT. For chest CT, our results showed that the existing x-ray
tube current modulation schemes are expected to reduce patient effective doses in chest
CT examinations by about 10%, with longitudinal modulation accounting for two thirds
and angular modulation for the remaining one third. It was also shown that the choice of
the scanned region affects organ doses in CT.
Secondly, the radiation-induced cancer risks from body CT examinations for adult
patients were estimated. For patients who differ from a standard sized adult, correction
factors based on the patient weight and antero-posterior dimension are provided to adjust
organ doses and the corresponding risks. Our results showed that at constant incident
radiation intensity, for CT examinations that include the chest, risks in females are
markedly higher than those for males, whereas for examinations that include the pelvis,

IV
risks in males were slightly higher than those in females. In abdominal CT scans, risks
for males and female patients are very similar. A conclusion was reached that cancer
risks in body CT can be estimated from the examination Dose Length Product by
accounting for sex, age, as well as patient physical characteristics.
Thirdly, a set of innovative Monte Carlo models were developed to investigate the
role of x-ray photon energy in determining skin dose, energy imparted, and image quality
in pediatric interventional radiology using the MCNP5 platform. Contrast, relative noise,
and contrast-to-noise ratio (CNR) were obtained for diagnostic imaging with and without
the utilization of grids. Our results indicated that using Monte Carlo methods, the
optimized x-ray tube voltage for a relatively low patient dose under the desired image
quality could be obtained for any specific patient undergoing a certain type of diagnostic
examination.
Lastly, we investigated the changes in the pattern of energy deposition in patient
phantoms following the use of iodinated contrast media using Monte Carlo models built
on MCNP5 platform. Relative energy imparted to the volume of interest with iodine
contrast agent, as well as to the whole patient phantom, was calculated. Changes in
patterns of energy deposition around the contrast-filled volume were also investigated.
Our results suggested that adding iodine can result in values of localized absorbed dose
increasing by more than an order of magnitude, but the total energy deposition is
generally very modest. Furthermore, our results also showed that adding iodine primarily
changes the pattern of energy deposition in the irradiated region, rather than increasing
the corresponding patient doses.
V
The goal of this project was to establish a better understanding of the roles of
different technique factors in the patient doses from diagnostic radiological procedures.
Based on these studies, the limitations of the current Monte Carlo software were analyzed
and our own Monte Carlo model was proposed for simulations of patient doses during
pediatric interventional radiology procedures. The ultimate goal of this study is to
develop a comprehensive dosimetry database using Monte Carlo technique, with the
output of patient doses, operator doses, and the corresponding radiation-induced
carcinogenesis risks for pediatric interventional radiology procedures.
VI
ACKNOWLEGEMENTS
―Life is like a box of chocolates.‖ It is a gift from nature and ‗you never know
what you are going to get‘ (movie Forrest Gump). At this moment of completing my PhD
dissertation, my journey as a student is about to end and new chapters of life are going to
be opened. It seems like yesterday when I received the offer letter from Clemson
University six years ago, and my heart filled with joy. Looking back on the naive initial
days, the splendid times, as well as every memorable event during my student career,
every one of my progresses and growth was benefited from your care, enthusiasm,
encouragement and help. I would like to sincerely thank all of you.
Many thanks to my advisor Dr. Hai Yao. Six years ago, your conversation
initiated my life of studying in the United States. You led me into the bioengineering
world, encouraged me to overcome every difficulty and hardness along the road. You
have not only given me the opportunity for an amazing journey to study with the
Clemson Bioengineering Program, but also have been a great friend for guiding me
through different research stages and given me the directions to be creative, positive, and
productive. Every one of my advancements is because of your selfless help. Your open
mind and virtuous charm of personality will continue to inspire me along my whole
research career.
Thank you to Dr. Walter Huda for serving as my co-advisor and providing
extensive help during my PhD study. You helped me focus my working area, and led me
into the world of radiation dosimetry. You have taught me not only the skills required for

VII
related research, but also how to be an intelligent and productive researcher. Every time I
met difficulty, you were always willing to help and inspire me with stories full of wisdom.
Thanks to Dr. Richard Swaja and Dr. Tong Ye for serving on my committee. You
were always ready to give support and suggestions whenever I felt at a loss. You both
helped me immensely with my career development. Our many discussions benefited me
and meant a lot during the time.
Thanks to Sarah Cisewski, Greg Wright, Emily Ongstad, Yongren Wu and the
rest of the members with the Clemson-MUSC Bioengineering Program. You have always
been my family in the US when my other family is thousands of miles away, cleared the
dark clouds in my life away, and kept my heart warm. Also thanks to Eugene Mah, Dr.
Sameer Tipnis, and Dr. Edward Krug, who have given me tremendous help with building
the fundamentals for scientific research and have offered me great guidance for a
successful application to the American Heart Association pre-doctoral fellowship.
Thanks to my husband Pengfei Li. I often wonder what a miracle it is that god
brought us together. Only people with similar experiences and interests can understand
each other. Thank you for your understanding, encouragement, and care for me.
Everything in my life is better because of you. My only wish is to hold your hand, from
now to forever. Also, thanks to our dear child who is coming into this world soon. It is
the most amazing and loving gift to us granted by god.
Ultimately, I would like to dedicate this dissertation to my parents, Guoyun He
and E Wang. You have always been standing behind me and supporting me with love and
solicitude, without asking for anything in return. For twelve years have I studied far away

VIII
from home, during which time I had no chance to have meals with you, accompany you,
or take care of you. Every time I went home for a short time and discovered more white
hair on your sideburns, I felt really guilty for not being there enough for you. Dad, I know
that although you are in heaven now, you are still my strongest support all the time.
Because of you, I have the courage to overcome the loneliness and difficulty in life, and
focus on achieving my goals. You are forever my warmest harbor. No matter how heavy
the storm is, you are always there, looking after me, and waiting for me.
Again, thanks to all of you who love and support me.
IX
TABLE OF CONTENTS
ABSTRACT ........................................................................................................................ II
ACKNOWLEGEMENTS ................................................................................................. VI
LIST OF TABLES ......................................................................................................... XIV
LIST OF FIGURES ...................................................................................................... XVII
CHAPTER 1 GENERAL INTRODUCTION .................................................................... 1
1.1 Introduction ............................................................................................................. 1
1.2 Objective and Specific Aims ................................................................................... 4
1.3 Organization of Dissertation ................................................................................... 8
CHAPTER 2 BACKGROUND ...................................................................................... 11
2.1 Radiation Dosimetry ............................................................................................. 11
2.1.1 X-ray Interactions ........................................................................................... 11
2.1.2 Radiation Dosimetry and Measurement ...................................................... 14
2.2 Radiobiology ......................................................................................................... 20
2.2.1 Radiation Exposure Effects on Molecular Level ............................................ 20
2.2.2 Radiation Exposure Effects on Cellular Level ............................................... 23
2.2.3 High-dose Effects and Low-dose Effects ....................................................... 24
2.2.4 Radiation-induced Risks ................................................................................. 25
2.3 RADIATION DOSES IN INTERVENTIONAL RADIOLOGY ......................... 26
2.3.1 Interventional Radiology Suite ....................................................................... 26
2.3.2 Patient Doses .................................................................................................. 29
2.3.3 Operator Doses ............................................................................................... 34
2.4 Monte Carlo Applications In Diagnostic Radiology ............................................. 40

X
Table of Contents (Continued) Page
2.4.1 Monte Carlo Method ...................................................................................... 40
2.4.2 Application of Monte Carlo in Medical Physics ............................................ 42
2.4.3 Current Research on IR using MC Method ................................................ 43
CHAPTER 3 PATIENT DOSES AND PROJECTION ANGLE IN CONE BEAM CT 49
3.1 Introduction ........................................................................................................... 49
3.2 Method .................................................................................................................. 51
3.2.1 Cone Beam CT ............................................................................................... 51
3.2.2 PCXMC .......................................................................................................... 54
3.2.3 Dose calculations ............................................................................................ 58
3.3 Results ................................................................................................................... 60
3.3.1 Average Organ Doses ..................................................................................... 60
3.3.2 Effective Doses ............................................................................................... 68
3.3.3 X-ray Beam Quality........................................................................................ 70
3.4 Discussion ............................................................................................................. 74
3.5 Conclusion ............................................................................................................. 77
CHAPTER 4 X-RAY TUBE CURRENT MODULATION AND PATIENT DOSES IN
CHEST CT ........................................................................................................................ 78
4.1 Introduction ........................................................................................................... 78
4.2 Methods ................................................................................................................. 79
4.2.1 CT Simulations ............................................................................................... 79
4.2.2 Effective Doses ............................................................................................... 81
4.2.3 Tube Current Modulation ............................................................................... 81
4.3 Results ................................................................................................................... 85

XI
Table of Contents (Continued) Page
4.3.1 Relative Effective Doses ................................................................................ 85
4.3.2 Dose Reductions from Modulation................................................................. 88
4.4 Discussion ............................................................................................................. 91
4.5 Conclusion ............................................................................................................. 94
CHAPTER 5 SCAN REGION AND ORGAN DOSES IN CT ...................................... 95
5.1 Introduction ........................................................................................................... 95
5.2 Method .................................................................................................................. 96
5.2.1 ImPACT.......................................................................................................... 96
5.2.2 Scan Length .................................................................................................... 99
5.2.3 Doses ............................................................................................................ 103
5.3 Results ................................................................................................................. 104
5.3.1 Relative Dose (Dr) ........................................................................................ 104
5.3.2 Scan Mode .................................................................................................... 109
5.3.3 Dmax/CTDIvol ................................................................................................. 111
5.4 Discussion and Conclusion ................................................................................. 111
CHAPTER 6 ESTIMATING CANCER RISKS TO ADULTS UNDERGOING BODY
CT ................................................................................................................................... 116
6.1 Introduction ......................................................................................................... 116
6.2 Method ................................................................................................................ 117
6.2.1 CT Dosimetry ............................................................................................... 117
6.2.2 Radiation Risks ............................................................................................. 120
6.2.3 Patient Size Correction Factors .................................................................... 121
6.3 Results ................................................................................................................. 123
XII
Table of Contents (Continued) Page
6.3.1 ―Sensitive Organ‖ Carcinogenic Risk .......................................................... 123
6.3.2 Relative Organ Sensitivity ............................................................................ 126
6.3.3 Other Organ Risks ........................................................................................ 130
6.3.4 Patient Size ................................................................................................... 131
6.4 Discussion ........................................................................................................... 133
6.5 Conclusion ........................................................................................................... 137
CHAPTER 7 PHOTON ENERGY, RADIATION DOSE AND IMAGE QUALITY IN
INTERVENTIONAL RADIOLOGY ............................................................................. 138
7.1 Introduction ......................................................................................................... 138
7.2 Method ................................................................................................................ 138
7.2.1 Simulation Geometry .................................................................................... 138
7.2.2 Image Quality ............................................................................................... 140
7.2.3 Sampling Points for Calculations ................................................................. 142
7.2.4 Monte Carlo Validation ................................................................................ 143
7.3 Results and Discussion ........................................................................................ 145
7.3.1 Energy Imparted and Skin Dose under Fixed CNR ..................................... 145
7.3.2 Energy Imparted and Skin Dose under Fixed Output Photon Energy Fluence
................................................................................................................................. 148
7.3.3 Output Photon Energy Spectra ..................................................................... 150
7.3.4 Scattered to Primary Ratios from MCNP Results ........................................ 152
7.3.4 Impact of Grids ............................................................................................. 153
7.4 Conclusion ........................................................................................................... 156
XIII
Table of Contents (Continued) Page
CHAPTER 8 IODINATED CONTRAST AGENT CAUSED PATIENT DOSE
INCREASE IN RADIOGRAPHY .................................................................................. 157
8.1 Introduction ......................................................................................................... 157
8.2 Method ................................................................................................................ 158
8.2.1 Simulation Phantoms .................................................................................... 158
8.2.2 Relative Energy Imparted ............................................................................. 161
8.2.3 Monte Carlo Model ...................................................................................... 162
8.2.4 Monte Carlo Model Validation ..................................................................... 163
8.3 Results ................................................................................................................. 164
8.3.1 Monte Carlo Model Validation ..................................................................... 164
8.3.2 Energy Imparted and Relative Dose ............................................................. 166
8.3.3 Relative Energy Imparted and Photon Energy ............................................. 168
8.4 Discussion ........................................................................................................... 172
8.5 Conclusion ........................................................................................................... 176
CHAPTER 9 OVERALL CONCLUSIONS AND FUTURE DIRECTIONS .............. 178
9.1 Conclusions ......................................................................................................... 178
9.2 Challenges ........................................................................................................... 183
9.2.1 Clinical Application ...................................................................................... 183
9.2.2 Software Limitations .................................................................................... 183
9.2.3 Computational Time ..................................................................................... 183
9.2.4 Data Processing ............................................................................................ 184
9.3 Future Goals ....................................................................................................... 184
REFERENCES ............................................................................................................... 188

XIV
LIST OF TABLES
Table 2.1 ICRP 103 tissue weighting factors……………………………………….17
Table 2.2 KAP (Gy-cm2) values for different procedures…………………………30
Table 2.3 Tissue reactions from single-delivered radiation dose to skin and hair….32
Table 2.4 Degrees of protection offered by different techniques/devices………….35
Table 2.5 Distributions of data for operator dose/DAP…………………………….38
Table 2.6 Threshold doses for different radiation damages of eye lens……...…….39
Table 2.7 Effective dose per DAP (mSv/(Gy-cm2)) for the patient…………...……47
Table 2.8 Effective dose per DAP (µSv/(Gy-cm2)) for the physician………..…….48
Table 3.1 Technical details of Gantry CT and C-Arm CT………………………….54
Table 3.2 X-ray tube air kerma per unit of tube current-exposure time product
(μGy/mAs) at 1m distance with different tube voltage and filtration settings……..…....59
Table 3.3 Normalized organ dose maxima and minima for CT scans performed at
120 kV…………………………………………………………………………...……….66
Table 3.4 Organ doses as a function of projection angle. Organ doses are expressed
as a percentage, with the average dose over all 24 projections being 100%…………….66
Table 3.5 Normalized effective dose maxima and minima for Gantry CT and C-Arm
CT generated at 120 kV……………………………………………………………….....69
Table 3.6 Normalized effective doses (µSv/mAs) averaged over angle at different z
location for Gantry CT and C-Arm CT (computed at 120 kV) …………………...…….69
Table 4.1 Angular modulation factors with different modulation amplitudes (R) at
each projection angle…………………………………………………………………….83
Table 4.2 Longitudinal modulation factors with different amplitudes (R) at each
patient long axis positions (z) …………………………………………………………...84
Table 4.3 Normalized effective doses with different projection angles (θ) and patient
long axis locations (z) …………………………………………………………………...86

XV
List of Tables (Continued) Page
Table 4.4 Key characteristics of how effective doses vary with z and taken from
Table 3…………………………………………………………………………...………88
Table 4.5 Reductions in effective doses from a modulation scheme where the tube
current is switched off for the most sensitive projections and doubled for the opposite
projections ……………………………………………………………………………….90
Table 4.6 Modulation amplitudes (R) obtained from published figures with clinical
mA modulation in chest CT examination………………………………………………..91
Table 5.1 Scanner models investigated from the original ImPACT data set………97
Table 5.2 The shape and key dimensions of the eight organs investigated in the
phantom………………………………………………………………………………….98
Table 5.3 Relative doses (Dr (Lr = 1)) for the eight investigated organs at the 13
selected scanners………………………………………………………………………..107
Table 5.4 Relative dose (Dr) at different values of Lr under different tube voltages at
Philips LX scanner…………………………………………………………………….109
Table 5.5 Dmax / CTDIvol for the eight organs investigated at different tube
voltages with Philips LX scanner………………………………………………………114
Table 6.1 The eight CT scanners investigated in this study……………………….118
Table 6.2 Average (± standard deviation) Effective Dose per unit Dose-Length
Product factors (k-factors) and average (± standard deviation) relative importance of the
eight organs investigated to the total carcinogenic detriment in body CT using ICRP 103
weighting factors for the eight CT scanners listed in Table 6.1..………………………119
Table 6.3 List of radiosensitive organs in BEIR VII with their corresponding ICRP
103 weighting factors for males and females..…………………………………………120
Table 6.4 Average contribution (%) of sex organs (prostate for males; uterus and
ovaries for females) to the total sensitive organ cancer risk from selected body CT
examinations……………………………………………………………………………129
Table 6.5 Relative importance of the ―other organ‖ category provided in BEIR

XVI
List of Tables (Continued) Page
VII………………………………………………………………………………………130
Table 7.1 Output Scattered Photon Spectra assumed in Analytical Calculations…151
Table 8.1 Hounsfield Unit of the iodine and water mixture solution inside the Iodine
Sphere with different iodine concentrations……………………………………………160
Table 8.2 Values of Erel(Iodine) and Erel(Phantom) for varying values of Iodine
Sphere diameter and iodine concentration values under incident photon energy of 60
keV……………………………………………………………………………...………166
Table 8.3 Values of Erel(Front), Erel(Side), and Erel(Rear) for varying values of
Iodine Sphere diameter and iodine concentration values under incident photon energy of
60 keV…………………………………………………………………………………167
Table 8.4 Mean HU value difference between after and before the injection of
iodinated contrast agent in different tissues during multislice CT at 120 kV from
literatures………………………………………………………………..………………174
XVII
LIST OF FIGURES
Figure 2.1 (A) coherent scatter; (B) photoelectric scatter; (C) Compton scatter……12
Figure 2.2 X-ray tube air kerma per unit tube current as a function of tube
voltage………………………………………………………………..…………………..15
Figure 2.3 Schematic depicting the principle of ionization chamber………………20
Figure 2.4 (A) DNA single-strand break; (B) DNA double-strand break…………22
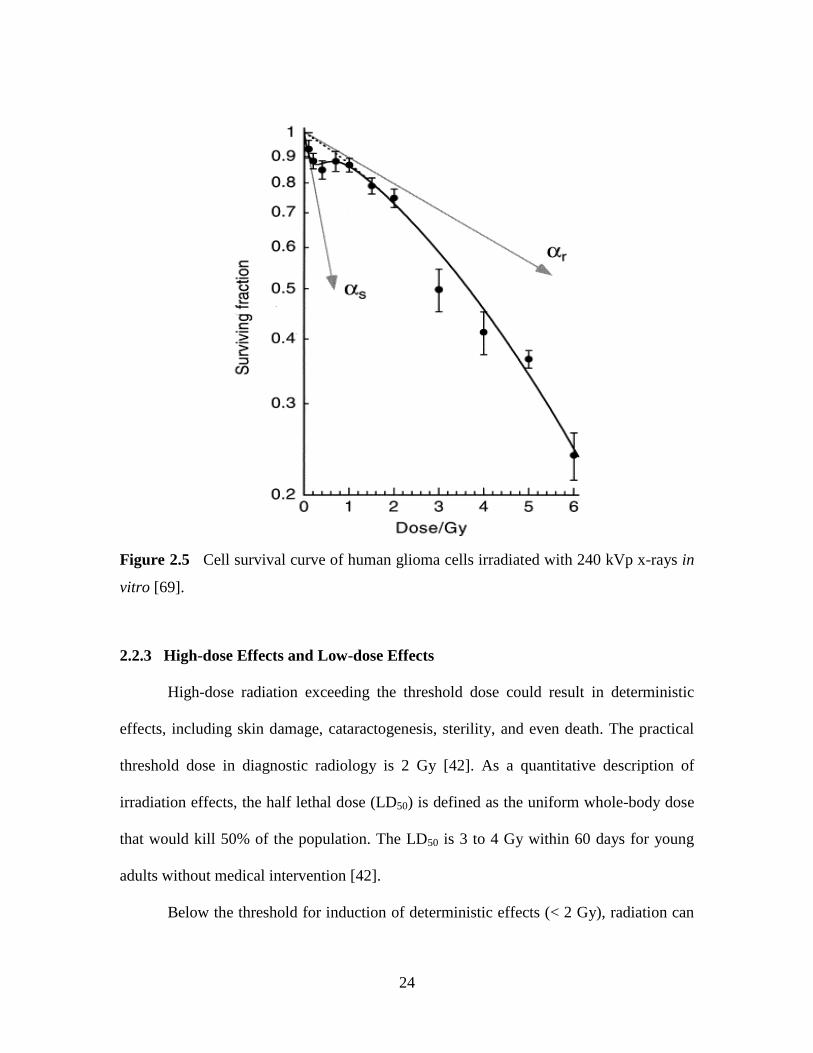
Figure 2.5 Cell survival curve of human glioma cells irradiated with 240 kVp x-rays
in vitro………………………………………………………………..………………….24
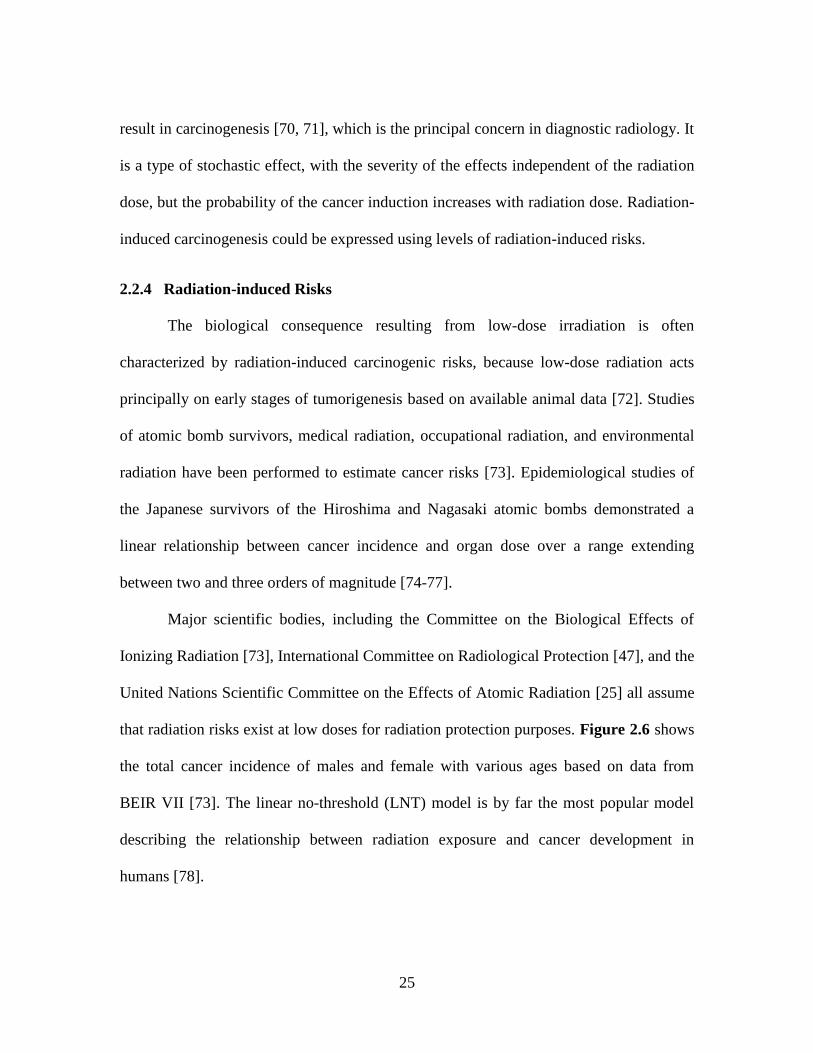
Figure 2.6 Total cancer incidence risks from BEIR VII Report………………….…26
Figure 2.7 Interventional radiology suite: (A) a biplane interventional suite [(1) floor
mounted C-arm (plane A), (2) ceiling mounted C-arm (plane B), (3) table, (4) monitors,
(5) foot pedals, (6) control console]; (B) the suite in use……………………..…………28
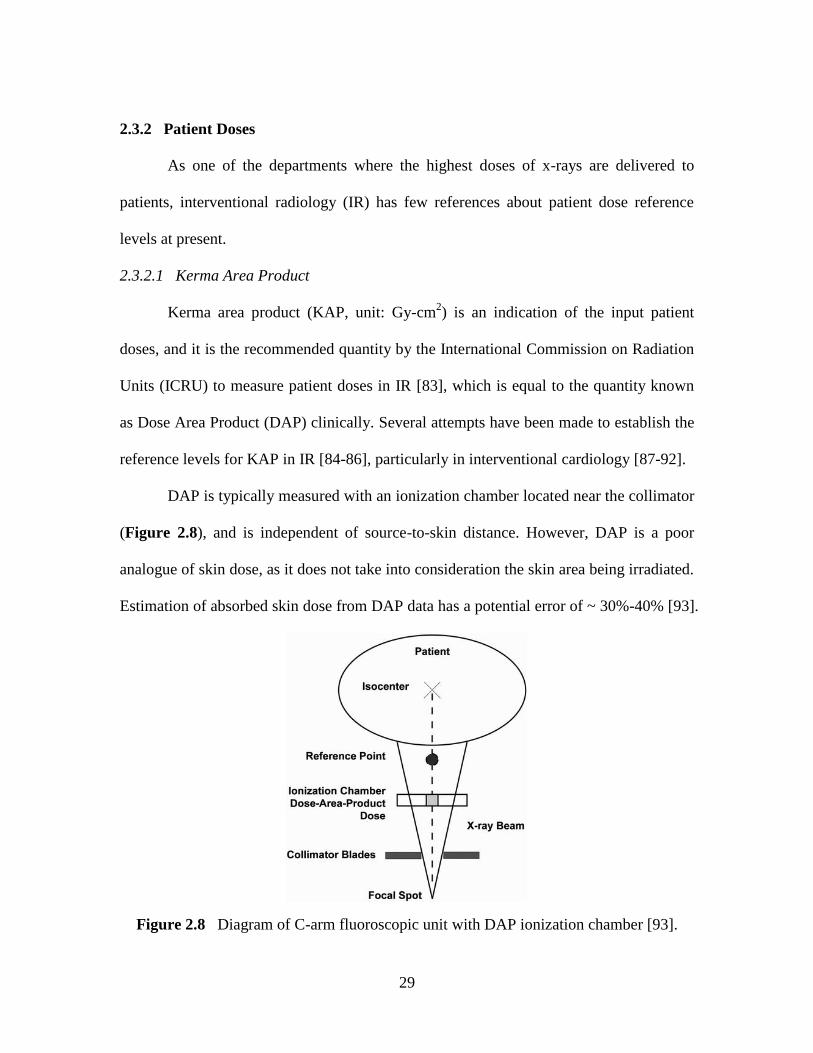
Figure 2.8 Diagram of C-arm fluoroscopic unit with DAP ionization chamber……29
Figure 2.9 Radiation injury in a 60-year-old woman after a neurointerventional
procedure………………………………………………………………..………………31
Figure 2.10 E/ε vs patient age…………………………….....……………………..…34
Figure 2.11 Position of the operator‘s hands manipulating catheters during (A)
interventional cardiology through radial and femoral access; (B) internal jugular vein
(IJV) procedures through percutaneous and femoral access……………..………………36
Figure 2.12 Number of IR procedures as a function of the mean hand dose…………38
Figure 2.13 (A) Function g(x); (B) schematic of Monte Carlo solution...……………41
Figure 2.14 Monte Carlo geometry with arrows indicating TLD positions in the
study…………………………………………………….………………..………………45
Figure 2.15 Contour plot of dose distribution (mGy) for cardiac catheterization. The
circumference is measured counter-clockwise starting from middle of the chest. The
horizontal line indicates position of the center of the heart………………….………..…45
Figure 2.16 Schematic depicting the simulated radiologist and patient: (A) top view
(the grey square indicating the irradiation area); (B) right-side view……………………46
XVIII
List of Figures (Continued) Page
Figure 3.1 Geometry of the CT modalities A: Gantry CT, B: C-Arm CT………..…53
Figure 3.2 (A) Axial view of the phantom showing how the beam rotates around the
phantom at 15° increments. (B) Coronal view of the phantom taken from PCXMC
software, showing z values (in centimeters) of the beam center we used in PCXMC (12
cm to 62 cm). The patient phantom is shown in the prone position……………..………57
Figure 3.3 Normalized breast dose (µGy/mAs) as a function of projection angle for A:
Gantry CT and B: C-arm CT at 120 kV tube voltage……………………………………61
Figure 3.4 Normalized colon dose (µGy/mAs) as a function of projection angle for A:
Gantry CT and B: C-arm CT at 120 kV tube voltage……………………………………62
Figure 3.5 Normalized lung dose (µGy/mAs) as a function of projection angle for A:
Gantry CT and B: C-arm CT at 120 kV tube voltage……………………………………63
Figure 3.6 Normalized red bone marrow dose (µGy/mAs) as a function of projection
angle for A: Gantry CT and B: C-arm CT at 120 kV tube voltage………………………64
Figure 3.7 Normalized stomach dose (µGy/mAs) as a function of projection angle for
A: Gantry CT and B: C-arm CT at 120 kV tube voltage……………………………...…65
Figure 3.8 Normalized absorbed doses to radiosensitive organs (µGy/mAs) at each
patient long axis location (z) for Gantry CT and C-Arm CT computed at 120 kV tube
voltage, averaged over all projection angles……………………………………67
Figure 3.9 Normalized effective dose (µSv/mAs) as a function of projection angle for
Gantry and C-arm CT of the chest and pelvis/abdomen regions at 120 kV tube voltage..68
Figure 3.10 Effective dose as a function of projection angle for different voltages in
the chest region at Gantry CT under 120 kV tube voltage (A: normalized values; B:
relative values) ………………………………………………………………………..…71
Figure 3.11 Effective dose as a function of projection angle for different filtrations in
the chest region at Gantry CT under 120 kV tube voltage (A: normalized values; B:
relative values) ………………………………………………………………………..…73
Figure 4.1 Scheme of the projection area investigated (from z = 36 to z = 72)……80
Figure 4.2 Relative effective dose averaged by (A) projection angles and (B) patient
XIX
List of Figures (Continued) Page
long axis locations………………………………………………………………………87
Figure 4.3 Dose saving rate resulted from angular modulation, longitudinal
modulation and combined modulation with different modulation amplitudes (R)….…89
Figure 5.1 Scheme of the scan region on the phantom in ImPACT software package
used to generate (A) Dr(Lr = 1) and (B) Dmax for liver…………………………………100
Figure 5.2 Scheme of the three different scan modes on (A) Liver and (B) Stomach
(craniocadual cross section view), where the dots show the starting point of the scan.
Organ dimensions and location are provided in Table 5.2………..……………………102
Figure 5.3 Relative dose (Dr) as a function of relative length (Lr) for the five longest
organs investigated (on the GE 9800 scanner under 120 kV, dataset No. 8) ………….105
Figure 5.4 Relative dose (Dr) as a function of relative length (Lr) for the three shortest
organs investigated (on the GE 9800 scanner under 120 kV, dataset No. 8)………..…106
Figure 5.5 Relative dose (Dr) at Lr = 1 as a function of organ length (Lmax) with
standard errors among 14 investigated scanners……………………………………..…108
Figure 5.6 Relative dose (D(L)/Dmax) for (A) liver and (B) stomach as a function of
relative length (L/Lmax) under three different scan modes (on the GE 9800 scanner under
120 kV, dataset No. 8) ………………………………………………………..……..…110
Figure 6.1 Normalized sensitive organ risks in chest, abdomen and pelvis CT
examinations per 100,000 patients. Figures in the left column have been normalized by
the DLP (mGy-cm) and Figures in the right column normalized by the corresponding
patient effective dose (mSv) ……………………………………………….………..…124
Figure 6.2 Normalized sensitive organ risks in Chest/Abdomen/Pelvis and
Abdomen/Pelvis CT examinations per 100,000 patients. Figures in the left column have
been normalized by the DLP (mGy-cm) and Figures in the right column normalized by
the corresponding patient effective dose (mSv). ………………………………….....…125
Figure 6.3 Relative contributions of eight male organs to the total sensitive organ
cancer risk for the five types of body CT examinations investigated………………..…127
Figure 6.4 Relative contributions of ten female organs to the total sensitive organ
cancer risk for the five types of body CT examinations investigated…………………128
XX
List of Figures (Continued) Page
Figure 6.5 Relative doses as a function of patient weight W (upper) and as a function
of patient Anterior-Posterior dimension AP (lower) …………………………………..132
Figure 7.1 Schematic of the simulation geometry used in this study………........…139
Figure 7.2 Illustration of sampling points on the imaging plane.………………..…143
Figure 7.3 Schematic of simulation geometry used for Monte Carlo validation…144
Figure 7.4 REI and RSD results from MCNP simulations under fixed CNR.…..…146
Figure 7.5 REI and RSD results from theoretical calculations (s/p = 1) under fixed
CNR………………………………………………………………………………..…146
Figure 7.6 REI and RSD results from MCNP simulations under fixed output energy
fluence………………………………………………………………………………..…149
Figure 7.7 REI and RSD results from theoretical calculations (s/p = 1) under fixed
output energy fluence………………………………………………….……………..…149
Figure 7.8 Output scattered photon spectra from MCNP simulation results .…..…151
Figure 7.9 MCNP results of output scatter to primary photon ratio at different
incident photon energies……………………………………………………………..…153
Figure 7.10 MCNP results of REI and RSD under fixed CNR with or without
grids……………………………………………………………………………………154
Figure 7.11 MCNP results of REI and RSD under fixed output energy fluence with or
without grids.…………………………………………………………………………155
Figure 8.1 (A) Phantom with an Iodine Sphere (yellow) located at the phantom center
containing iodinated contrast material; (B) The same phantom as shown in A, but with no
iodinated contrast material within the ―Iodine Sphere‖ region…..…………………..…159
Figure 8.2 Simulation geometry utilized for Monte Carlo validation...................…164
Figure 8.3 Dose to photon fluence ratios from MCNP validation simulations as well
as analytical calculations as functions of the diameter of the simulated water sphere under
different incident photon energies...............................................................................…165
Figure 8.4 Values of Erel(Iodine) for different sized Iodine Sphere (d = 0.5, 4, 16 cm)
XXI
List of Figures (Continued) Page
as functions of the incident photon energy under the iodine concentration of 100
mg/ml...........................................................................................................................…169
Figure 8.5 Values of (A) Erel(Rear) and (B) Erel(Side) for different sized Iodine
Sphere (d = 0.5, 4, 16 cm) as functions of the incident photon energy with iodine
concentration of 100 mg/ml.........................................................................................…170
Figure 8.6 Values of Erel(Phantom) for different sized Iodine Sphere (d = 0.5, 4, 16
cm) as functions of the incident photon energy with iodine concentration of 100
mg/ml...........................................................................................................................…171
1
CHAPTER 1 GENERAL INTRODUCTION
1.1 Introduction
In the US, medical imaging resulted in a per capita dose of ~3 mSv in 2006,
which corresponds to an increase of ~600% in a single generation [1]. Among medical
exposures to patients, computed tomography (CT) composes 49% of the collective doses,
and interventional fluoroscopy composes 14%. Radiation exposure to patients undergoing
diagnostic radiological procedures causes increased lifetime carcinogenic risks,
especially for pediatric patients who are more radiosensitive than adults. The correlation
between procedural x-ray techniques and the radiation doses to patients, as well as the
resultant image quality, is not well understood, and therefore the focus of this proposed
study.
As a routine procedure in medical imaging, the number of computed tomography
(CT) examinations performed in the US increased from 3 million per year in 1980 to 72
million in 2006 [2]. The effective dose for a specific CT scan depends on the technique
and body region, and can range from ~2 mSv for a head CT to more than 30 mSv for a
multiphase abdominal-pelvic CT [3]. In 2006, medical imaging was responsible for ~48%
of the total radiation exposure to the US population, approximately half of which was
from CT scans. Although there are reports implying that up to 30% of the ordered CT
examinations may be unnecessary, it is generally recognized that in most circumstances
CT has a favorable risk-to-benefit ratio when used diagnostically for symptomatic
patients [4]. Due to the rapid increase of radiation doses caused by CT scans, the
2
radiology community is continually undertaking efforts to standardize and minimize
radiation dose in CT (such as the Dose Index Registry), consistent with the As Low As
Reasonable Achievable (ALARA) principle [5, 6]. Given the clinical advantage of better
image quality, there will always exist the need to balance the benefits of lower radiation
dose with resulting reduction in image quality [7]. However, there are few studies
investigating dose reduction that take quantified image quality into consideration, which
is likely due to the complexity of various parameter settings, patient characteristics, etc.
Interventional Cardiology (IC) represents a series of procedures, such as coronary
angiography, percutaneous transluminal coronary angioplasty, and electrophysiology
procedures, which have become routine practice in the majority of hospitals and clinics [8,
9]. In recent years, interventional cardiology has developed rapidly in terms of both
equipment and techniques for accessing the most remote parts of the body [10, 11]. The
increasing number of radiological procedures performed each year results in increasing
medical radiation exposure [12, 13]. IC procedures are associated with high patient
radiation entrance doses. These doses depend on the degree of difficulty in accessing the
cardiac region of interest (fluoroscopy time), the patient-specific characteristics (age, size,
and gender), the efficiency in the use of radiological equipment, and the cardiologist‘s
experience, among other factors. There have been numerous reports of cases where
patients suffered from radiation skin lesions and even necrosis after an IC procedure with
radiation doses exceeding the threshold of deterministic effects (2-6 Gy for erythema, 3
Gy for hair loss, 18 Gy for necrosis) [14, 15]. In addition to increased patient doses, the
advent of IC procedures has resulted in a dramatic increase in occupational x-ray

3
exposure to interventional cardiologists and nurses, leading to an elevated risk of
radiation injury and occupational health hazards [16-19].
Radiation-induced carcinogenesis is a cause of increasing concern in recent years
[20], particularly in radiosensitive populations such as pediatric patients and pregnant
female patients [21-23]. This concern for infants and children is of particular interest
because compared to adults, a larger fraction of the patient body is irradiated by the x-ray
beam during IC procedures [24]. Furthermore, there is a pressing need to justify the risks
of a radiation dose administrated to a patient undergoing an IC procedure with the
procedural benefits [25]. The risk of carcinogenic and deterministic (e.g. skin lesions,
cataracts) effects to both the patients and medical staff performing the procedures must
be considered. Clinical follow-up and statistical analyses have shown that there is an
increased risk of cataracts in IC staff, especially when radiation protection tools are not
used properly [26-28].
In order to study these clinical situations, the Monte Carlo method is commonly
used. The Monte Carlo method is a well-established technique in the medical physics
field when physical measurements and pure mathematical calculations are either too
cumbersome or impossible [29]. It employs a class of computational algorithms that rely
on repeated random sampling to compute results, which are often used in simulating
physical and mathematical systems [30, 31]. Monte Carlo algorithms are used to simulate
the absorbed dose in any material at any specific point in a geometric setting with high
accuracy and small relative errors. However, few researchers have applied Monte Carlo
simulations to IC because of the difficulty in the variability of the parameters

4
encountered from the nature of these complex procedures [32]. Investigating the x-ray
technique parameters involved in IC procedures and their effects on radiation doses,
without sacrificing diagnostic image quality, is currently the most challenging task in the
field.
1.2 Objective and Specific Aims
Interventional Radiology (IR) contributes to 14% of the collective radiation dose
from medical exposures and 7% of all radiation exposure types to the US population [8,
33, 34]. High radiation dose level can occur as an outcome of complex procedures
requiring additional imaging, or when a patient undergoes multiple interventional
procedures [35]. Accumulated occupational doses, caused by the scattered radiation from
the patient to the staff during the procedures, are also of concern. The staff of an IR
department is among those most highly-exposed to medical radiation, receiving annual
effective doses in the range of 5 to 10 mSv. Efforts have been made to investigate the
radiation doses to patients undergoing interventional cardiology procedures as well as the
staff, with most of them using dosimeter measurements and medical records [36].
However, there are many factors that affect the patient radiation doses, such as different
combinations of technical parameter settings and patient characteristics. Due to the
complexities and time-consuming nature of clinical dose/exposure measurements, the
Monte Carlo technique is the only realistic tool to investigate patient doses and
occupational exposure. Our results will be valuable for medical physicists to analyze dose
distributions, and for the cardiology clinicians to maximize image guidance capabilities
while minimizing potential carcinogenic and deterministic risks to pediatric patients.
5
The objective of this proposal is to investigate the effects of different x-ray
techniques on patient doses during CT procedures using existing Monte Carlo software,
and to build a Monte Carlo model to investigate the effects of incident x-ray photon
energy on the skin dose and total energy imparted to the patient under a constant image
quality. This will promote a better understanding and characterization of the importance
of output photon energy on patient doses and the development of a novel strategy for
optimizing radiation doses while maintaining image quality.
Our general hypothesis is that incident x-ray photon energy used in a diagnostic
radiological procedure can be optimized to reduce patient doses without sacrificing image
quality, and therefore can lower radiation-induced lifetime carcinogenic risks for patients.
To test this hypothesis, it is necessary to understand the effect of incident x-ray photon
energy on the total energy imparted to a patient and to quantify the dose levels under a
constant image quality. The specific aims of this proposal are as follows:
Specific Aim 1: Investigate the impact of technical parameters on patient doses
during CT examinations using available Monte Carlo software. Absorbed doses to
patients undergoing radiographic examinations are related to the selection of x-ray
technical parameters, such as tube voltage, tube current, scan region, and projection angle.
Studies will be performed using PCXMC software [37], and the effect of various
technical parameter settings will be studied under different types of CT scans for standard
size adult patients. Aim 1 is addressed in Chapters 3 - 5, with each of the chapters mainly
focusing on addressing the impact of one of the irradiation technical factors on patient
doses: Chapter 3 on projection angle, Chapter 4 on tube current, and Chapter 5 on scan
6
length. The impact of x-ray tube voltage on the patient doses was also studied and
discussed in Chapters 3 and 5.
Specific Aim 2: Analyze the effect of patient characteristics on patient doses and
risks, and explore the limitations of the existing software. Patient characteristics, such as
gender and age, are also crucial factors that determine the effective dose and carcinogenic
risks to patient undergoing the examination. In this aim, the ImPACT Dosimetry
Calculator [38] will be used to study patient-specific doses and carcinogenic risks among
different types of CT scans. Currently, existing software only generates limited
information and doesn‘t permit the investigation of image quality, which is paramount for
justifying the necessity of any diagnostic radiographic examination. We mainly
concentrated on this aim in Chapter 6 by exploring the relationship between
characteristics of adult patients (gender, age, and size) and the corresponding radiation
doses as well as the resultant radiation-induced cancer risks for different types of body
CT scans.
Specific Aim 3: Develop a Monte Carlo model to investigate the relationship
between incident photon energy, patient dose, and image quality for pediatric patients
undergoing interventional cardiology procedures. In this specific aim, a Monte Carlo
model with a water phantom will be built to generate all the physical quantities employed
in this study using the MCNP5/MCNPX platform [39]. The radiation doses investigated
will include skin dose at the x-ray beam entrance point, which is closely related to
potential deterministic effects, as well as total energy imparted on the patient, which is
directly correlated with absorbed dose by the patient. Image quality will be represented
7
by the contrast-to-noise-ratio (CNR), which is also a function of x-ray photon energy.
The model developed will be utilized to study the variation of the patient dose as a
function of incident photon energy under constant CNR. As a result, the optimized
photon energy with the lowest dose will be determined without sacrificing diagnostic
information. A simplified Monte Carlo model, which took into consideration the image
quality and the absorbed doses, was developed in the project described in Chapter 7 to
realize Aim 3. In addition, we built an in-house Monte Carlo model to study the radiation
dose and energy imparted increase caused by utilization of the iodinated contrast agent
during diagnostic radiology imaging, which was not applicable using the commercially
available dosimetry software. These results were shown and discussed in Chapter 8.
Specific Aim 4: Investigate the impact of patient size and grids on dose
optimization based on the model developed in Aim 3. The absorbed dose to the patient
varies with patient size. Under the same x-ray tube output, a larger patient will receive a
lower dose. Grids are often utilized in examinations to improve image quality by
reducing scattering, at the cost of increasing patient dose. In this specific aim, the Monte
Carlo model developed in Aim 3 will be advanced to include different patient sizes and
application of grids. The relationship between image quality, patient dose and photon
energy (tube voltage) for each parameter combination will be analyzed. The impact of
grids on the patient dose – image quality relationship was analyzed using the developed
Monte Carlo models in Chapter 7. The additional studies to investigate the patient size
using the derivative models from this project were proposed in the future work section (in
Chapter 9).
8
Successful completion of the proposed aims will provide characterization of the
correlation between patient radiation doses and x-ray energy at a desired image quality.
This proposed study represents the first step toward my long-term research objective to
understand the mechanism of radiation dose optimization in diagnostic radiology.
1.3 Organization of Dissertation
The objective of this dissertation is to investigate the possible optimization
methods of the irradiation technical factors in order to lower radiation doses to patients
undergoing diagnostic radiological examinations using Monte Carlo algorithm-based
software. The manuscript is organized in chapters of related studies that combine to
achieve the overall aims of this project. In Chapter 2 we presented a comprehensive
overview of the radiation dosimetry, radiation-induced carcinogenic risks, and the
application of Monte Carlo Algorithm in dose calculations. The current proposed dose
optimization techniques in CT are also introduced. In Chapter 3, we investigated how x-
ray tube projection angle affects organ and effective doses to patients undergoing a CT
examination on a cone beam scanner. The effect of changing x-ray tube voltage and beam
filtration on patient doses were also investigated and discussed. The results from this
study showed that there were major differences in organ and effective dose as the x-ray
tube rotates around the patient. These results also suggested that the use of x-ray tube
current modulation could produce substantial reductions in organ and effective dose for
body imaging with cone beam CT. In Chapter 4, we further investigated how patient
effective doses vary as a function of x-ray tube projection angle, as well as patient long
axis, and quantify how x-ray tube current modulation affects patient doses in chest CT

9
examinations. Our results showed that the current x-ray tube current modulation schemes
are expected to reduce patient effective doses in chest CT examinations by about 10%,
with longitudinal modulation accounting for two thirds and angular modulation for the
remaining one third. In Chapter 5, the choice of the scanned region and its impact on the
organ doses during CT scans were studied. We discovered that CT scans limited to direct
irradiation of an organ result in absorbed doses that range from ~ 0.70 of that from a
uniform whole body irradiation for small organs such as the bladder to ~ 0.85 of that
from a uniform whole body irradiation for large organs such as the lungs. As a result of
receiving radiation doses from CT examinations, the radiation-induced lifetime
carcinogenic risks to a patient also increase. In Chapter 6, we calculated the cancer risks
from the amount of radiation used to perform body CT examination. It is shown that
cancer risks in body CT can be estimated from the examination Dose Length Product
(DLP) by accounting for gender, age, and patient physical characteristics. These studies
showed that for CT examinations that include the chest, risks in females are markedly
higher than those for males, whereas for examinations that include the pelvis, risks in
males were slightly higher than those in females; for abdominal CT scans, risks for males
and female patients are very similar. In Chapter 7, we built a simulation model based on a
Monte Carlo algorithm platform MCNP5, which enables investigation of the relationship
among the incident photon energy, radiation dose and image quality in interventional
radiology. Our results showed that under the same image quality during a procedure,
patient doses were significantly dependent on the incident photon energy. We also looked
into the impact of grids on the radiation doses and image quality. In Chapter 8, we
10
investigated the changes in the pattern of energy deposition in tissue-equivalent phantoms
following the introduction of iodinated contrast media using MCNP simulations. The
results from these studies indicated that adding iodine can result in values of localized
absorbed dose increasing by more than an order of magnitude, but the total energy
deposition is generally very modest. Our data also showed that adding iodine primarily
changes the pattern of energy deposition in the irradiated region, rather than increasing
patient doses. The most important findings and the overall conclusions are discussed and
summarized in Chapter 9. Recommendations for future research are also given where
appropriate.
11
CHAPTER 2 BACKGROUND
2.1 Radiation Dosimetry
Radiation doses are caused by locally deposited energy from the interactions
between x-ray photons and atoms in the medium. In this chapter, the typical types of x-
ray interactions in diagnostic radiology are introduced, as well as radiation dosimetry
quantities and radiation measurement apparatus.
2.1.1 X-ray Interactions
X-ray is a form of electromagnetic radiation composed by energetic photons. The
energy of an x-ray is determined by
hE , (2.1)
where sJ.h 3410636 (known as the Plank‘s constant), and is the frequency of
the electromagnetic wave.
During the interaction between x-ray and matter, the energy of x-ray photons is
transferred to electrons. Because these energetic electrons lose energy by interacting with
other electrons in adjacent atoms and produce ionizations, x-ray is categorized as indirect
ionizing radiation. X-ray interaction with matter results in local energy deposition. There
are mainly three types of interactions at the energy level of diagnostic x-rays [40-42]:
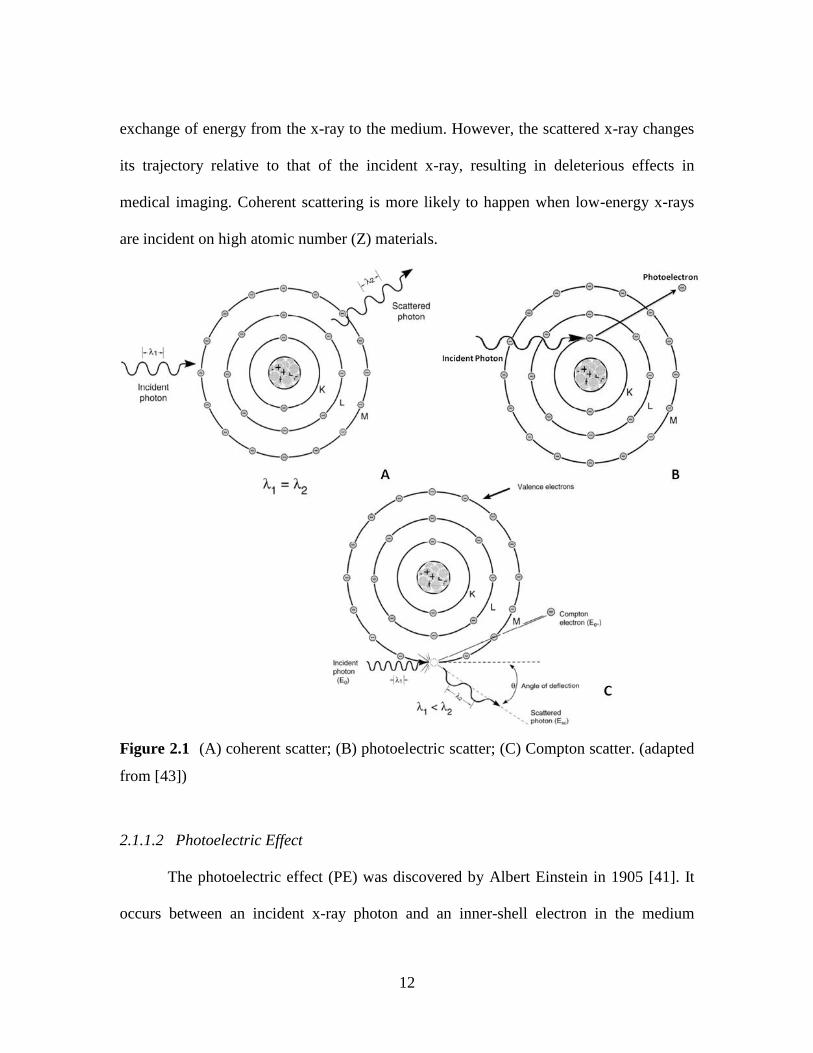
coherent scatter, Compton scatter, and photoelectric effect, as depicted in Figure 2.1.
2.1.1.1 Coherent Scatter
Coherent scatter (Figure 2.1A), also known as Rayleigh scatter, occurs when a
low-energy x-ray photon is scattered from an atom without any energy loss. There is no
12
exchange of energy from the x-ray to the medium. However, the scattered x-ray changes
its trajectory relative to that of the incident x-ray, resulting in deleterious effects in
medical imaging. Coherent scattering is more likely to happen when low-energy x-rays
are incident on high atomic number (Z) materials.
Figure 2.1 (A) coherent scatter; (B) photoelectric scatter; (C) Compton scatter. (adapted
from [43])
2.1.1.2 Photoelectric Effect
The photoelectric effect (PE) was discovered by Albert Einstein in 1905 [41]. It
occurs between an incident x-ray photon and an inner-shell electron in the medium
13
(Figure 2.1B). The incident photon is completely absorbed with all of its energy
transferred to the electron which is ejected from the atom. Assuming the incident x-ray
energy is E0 and the inner-shell electron binding energy is EB, the kinetic energy Ek of the
ejected photoelectron is: Bk EEE 0 . Then the vacancies left by the inner-shell
electrons are filled by outer-shell electrons, with the excess energy emitted as
characteristic x-rays or Auger electrons. In diagnostic imaging, PE effect is only
important when the atomic number (Z) of the medium is high and the incident photon
energy is just above the K edge (binding energy of the K-shell electron).
2.1.1.3 Compton Scatter
Compton scatter occurs between outer-shell electrons and incident x-ray
photons (Figure 2.1C). It typically occurs when the incident x-ray photon energy
(E0) is much higher than the binding energy of the outer-shell electron. A Compton
interaction results in a scattered photon which travels in a different direction with
energy (E‘) less than the incident photon, as well as a positive atomic ion with an
outer shell electron lost. The relationship between scattering angle θ and the energies
is described by the Klein-Nishina equation:
cos
'
11
1
0E
E, (2.2)
where
keV
E
cm
E
5110
2
0
0 . (2.3)
Equations (2.2) and (2.3) show that the energy of the scattered x-ray photon
14
decreases when its scattering angle increases. Compton scatter accounts for most of
the scattered radiation in diagnostic radiology.
2.1.2 Radiation Dosimetry and Measurement
2.1.2.1 Incident Radiation
Exposure
Exposure is a quantity used to describe the output of an x-ray generator [41]. It is
defined by the charge liberated by ionizing radiation per unit mass of air, with the SI unit
of C/kg:
MQExposure / . (2.4)
For many years, exposure was expressed in roentgens (1 roentgen = 2.58 x 10⁻⁴
C/kg).
Exposure can be measured in medical radiation dosimetry by placing an
ionization chamber directly in an x-ray beam. Because the use of exposure with the SI
system is cumbersome, it is gradually being replaced by air kerma [44] in measuring x-
ray beam intensities.
Air Kerma
Air kerma (Unit: Gy, 1 Gy = 1 J/kg) is defined as the kinetic energy transferred
from the x-ray photons to electrons per unit of mass of air. It is recommended as the
calibration quantity in medical x-ray imaging by the International Commission on
Radiation Units and Measurements (ICRU) [45] and the International Atomic Energy
Agency (IAEA) [46].
In diagnostic radiology examinations, an exposure of 1 R corresponds to an air
15
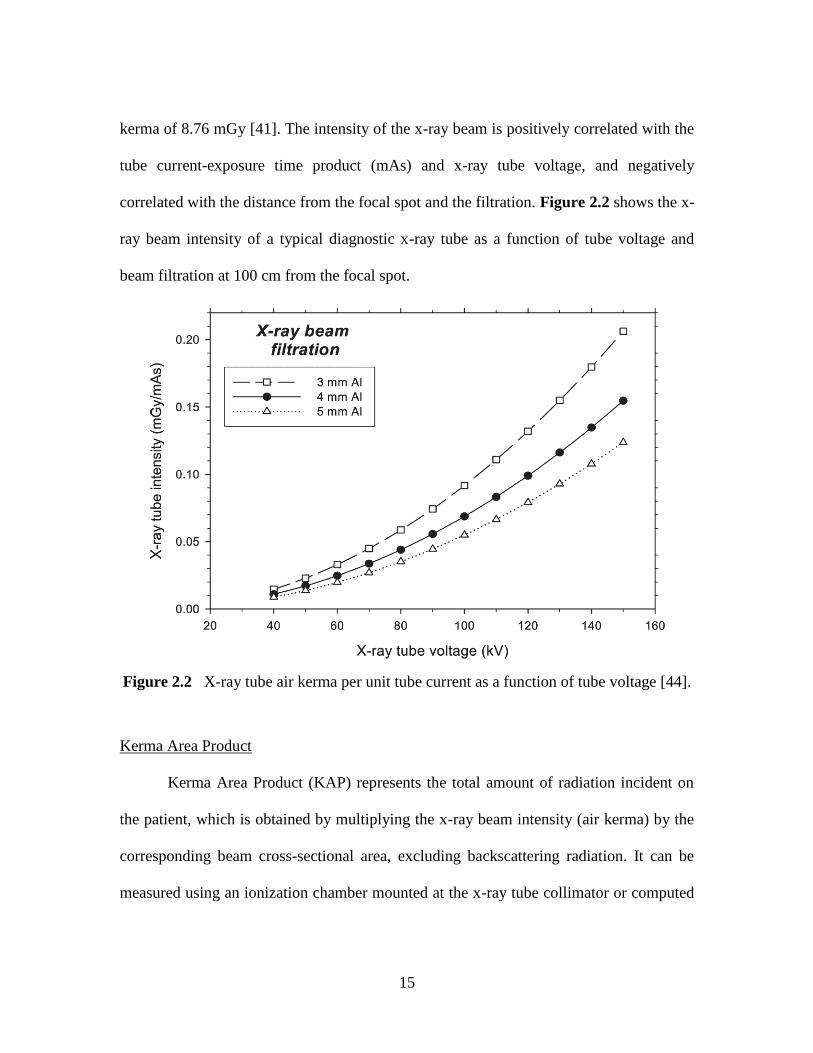
kerma of 8.76 mGy [41]. The intensity of the x-ray beam is positively correlated with the
tube current-exposure time product (mAs) and x-ray tube voltage, and negatively
correlated with the distance from the focal spot and the filtration. Figure 2.2 shows the x-
ray beam intensity of a typical diagnostic x-ray tube as a function of tube voltage and
beam filtration at 100 cm from the focal spot.
Figure 2.2 X-ray tube air kerma per unit tube current as a function of tube voltage [44].
Kerma Area Product
Kerma Area Product (KAP) represents the total amount of radiation incident on
the patient, which is obtained by multiplying the x-ray beam intensity (air kerma) by the
corresponding beam cross-sectional area, excluding backscattering radiation. It can be
measured using an ionization chamber mounted at the x-ray tube collimator or computed
16
from the manufactory properties of the x-ray tube and generator. With the same amount
of radiation incident on the patient (KAP), the resultant energy absorption pattern
depends on the physical characteristics of the patient.
2.1.2.2 Absorbed Radiation
Absorbed Dose
The absorbed dose (unit: Gy or J/kg) to a certain material depends on the material
physical characteristics for a given x-ray beam intensity. Materials with high atomic
numbers (Z) absorb more radiation energy than the ones with low atomic numbers. If a
medium with mass M absorbs an energy of En, the absorbed dose to the medium (Dmedium)
is defined as
MED nmedium / (2.5)
For example, for a typical diagnostic x-ray beam with average photon energy of 50 keV,
an air kerma of 1 mGy will result in an absorbed dose to muscle of ~1.1 mGy and an
absorbed dose to bone of ~4 mGy [42].
The most useful absorbed dose quantities in medical radiology are skin doses and
organ doses. The skin dose in a diagnostic radiologic examination is ~50% higher than
the value of incident air kerma [44]. Organ doses are lower than the corresponding skin
dose and depend on the x-ray beam quality and irradiation area.
Equivalent Dose
Different types of radiation (ie. α, β, γ, and x-ray) can result in different relative
biological effectiveness (RBE), which represents the biological harm caused by radiation
17
[41]. For example, a dose of 1 mGy deposited by α-particles has greater RBE than 1 mGy
by x-ray photons. To account for the RBE, the equivalent dose H (unit: Sv) is defined as
rwDH , (2.6)
where rw is the radiation weighting factor ( 1rw for x-rays used in diagnostic radiology)
and D is the absorbed dose in the irradiated tissue.
Effective Dose
Effective dose is designed to normalize the dose delivered to the irradiated body
region to that of a whole-body exposure [41], and thus make risk estimation possible. The
effective dose (E) is defined as
ii i HwE , (2.7)
where iH is the equivalent dose to organ i , and iw is the tissue weighting factor which
represents the relative radiosensitivity of the individual organ (Table 2.1).
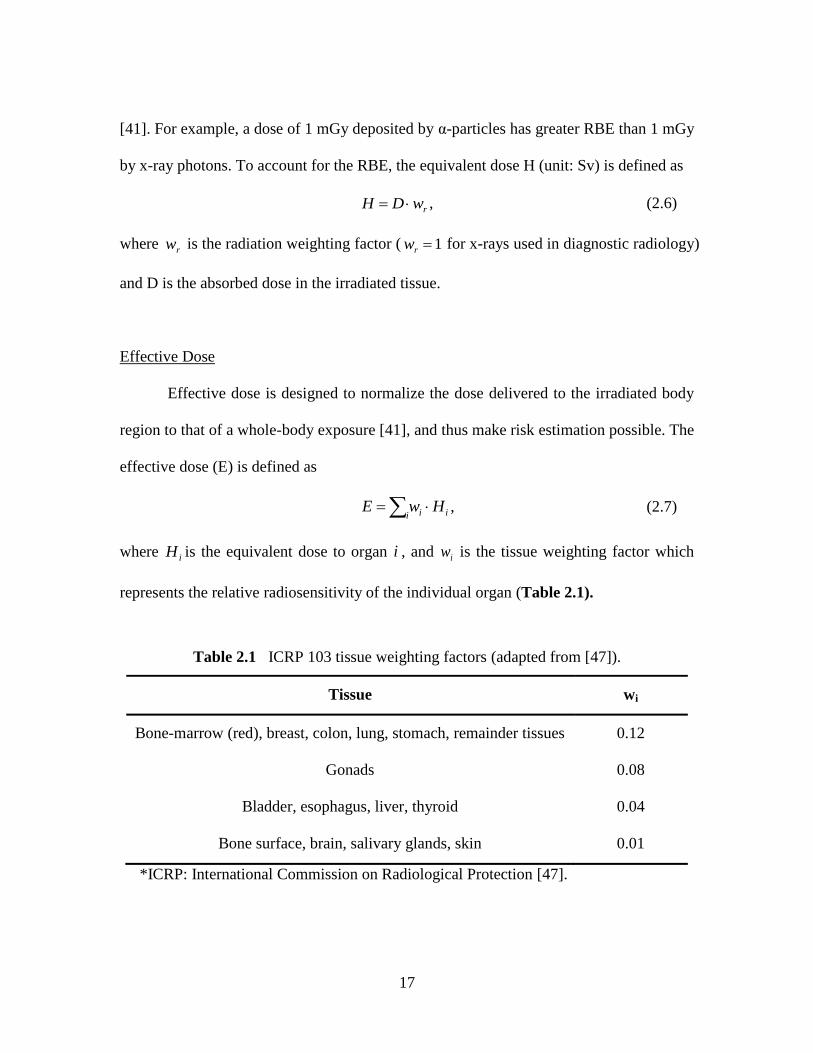
Table 2.1 ICRP 103 tissue weighting factors (adapted from [47]).
Tissue wi
Bone-marrow (red), breast, colon, lung, stomach, remainder tissues 0.12
Gonads 0.08
Bladder, esophagus, liver, thyroid 0.04
Bone surface, brain, salivary glands, skin 0.01
*ICRP: International Commission on Radiological Protection [47].
18
The summation in Equation (2.7) is over all the organs and tissues irradiated for a
specific examination. Effective dose is by far the best indicator of the patient radiation
risk when doses to individual organs are below the threshold for the induction of
deterministic effects [3, 48].
2.1.2.3 Radiation Dosimeters
A dosimeter is a device that is capable of providing measurement of the absorbed
dose deposited in its sensitive volume by ionizing radiation [49]. Most common
dosimeters include film badge dosimeters, thermoluminescent dosimeters (TLDs), and
optically stimulated luminescence (OSL) dosimeters. Other commonly used ionizing
radiation measuring devices include ionization chambers and Geiger counters.
Dosimeters
Film is sensitive to radiation and when developed the exposed area increases its
optical density in response to incident radiation. Film badge dosimeters can be worn
under protective clothing and used to measure radiation doses received by radiation
workers [50]. However, film sensitivity depends on x-ray photon energy and the film
dosimeter absorbs 30 keV photons best, causing limited accuracy.
Thermoluminescent dosimeters (TLDs) have been replacing film badges. They
can store energy absorbed during x-ray exposure in electron traps, and the trapped
electrons are released through a heating process as visible light [51]. Lithium fluoride
(LiF) is the typical TLD used in diagnostic radiology because it simulates the absorption
19
of x-ray by soft tissue. The detection limit of the TLD used to monitor workers in
radiology is ~0.2 mGy [52].
An optically stimulated luminescence dosimeters (OSLDs) have a similar
operating principle to TLDs, except that the readout is performed by stimulation by light
instead of by heating [53]. The materials used for OSLDs are quartz, feldspars, and
aluminum oxide. The application of OSLs in medicine, including radiotherapy, is just
beginning but slowly increasing [54-56].
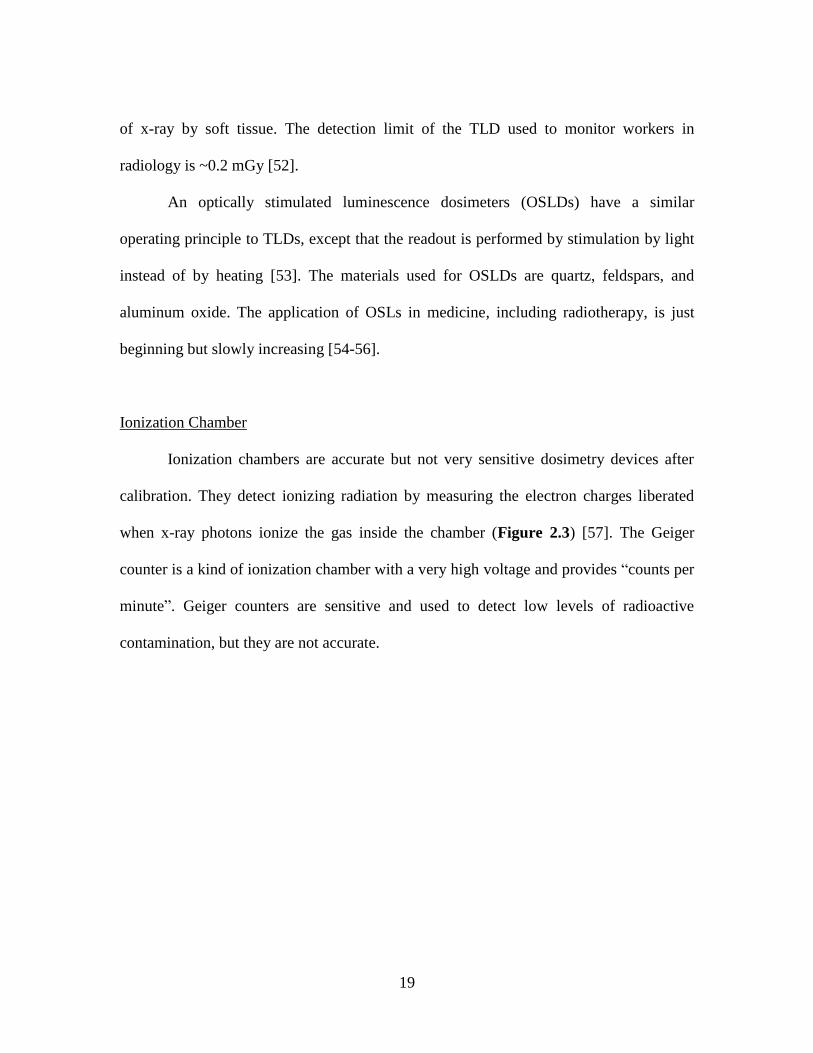
Ionization Chamber
Ionization chambers are accurate but not very sensitive dosimetry devices after
calibration. They detect ionizing radiation by measuring the electron charges liberated
when x-ray photons ionize the gas inside the chamber (Figure 2.3) [57]. The Geiger
counter is a kind of ionization chamber with a very high voltage and provides ―counts per
minute‖. Geiger counters are sensitive and used to detect low levels of radioactive
contamination, but they are not accurate.
20
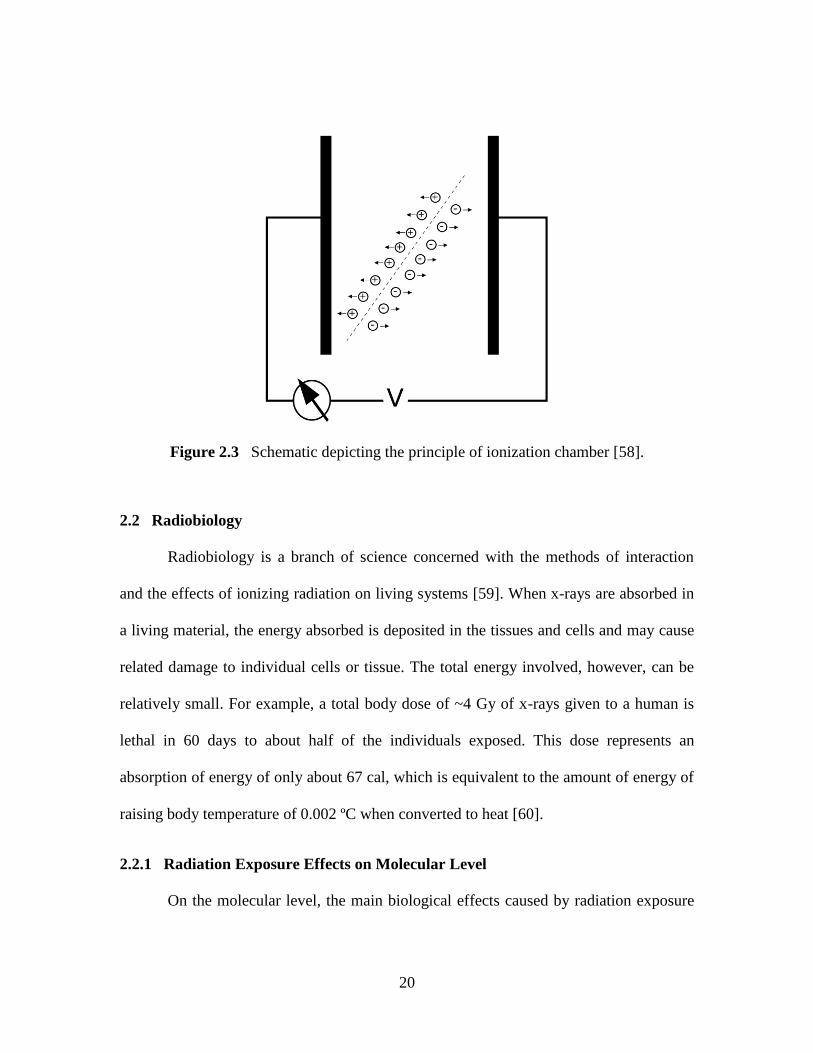
Figure 2.3 Schematic depicting the principle of ionization chamber [58].
2.2 Radiobiology
Radiobiology is a branch of science concerned with the methods of interaction
and the effects of ionizing radiation on living systems [59]. When x-rays are absorbed in
a living material, the energy absorbed is deposited in the tissues and cells and may cause
related damage to individual cells or tissue. The total energy involved, however, can be
relatively small. For example, a total body dose of ~4 Gy of x-rays given to a human is
lethal in 60 days to about half of the individuals exposed. This dose represents an
absorption of energy of only about 67 cal, which is equivalent to the amount of energy of
raising body temperature of 0.002 ºC when converted to heat [60].
2.2.1 Radiation Exposure Effects on Molecular Level
On the molecular level, the main biological effects caused by radiation exposure
21
are DNA strand breaks and chromosomal aberrations. It is reported that DNA is the
principal target for the biologic effects of radiation, including cell killing, mutations, and
carcinogenesis [61]. Chromosomal aberrations are caused by double-strand DNA breaks
when cells are irradiated with x-rays.
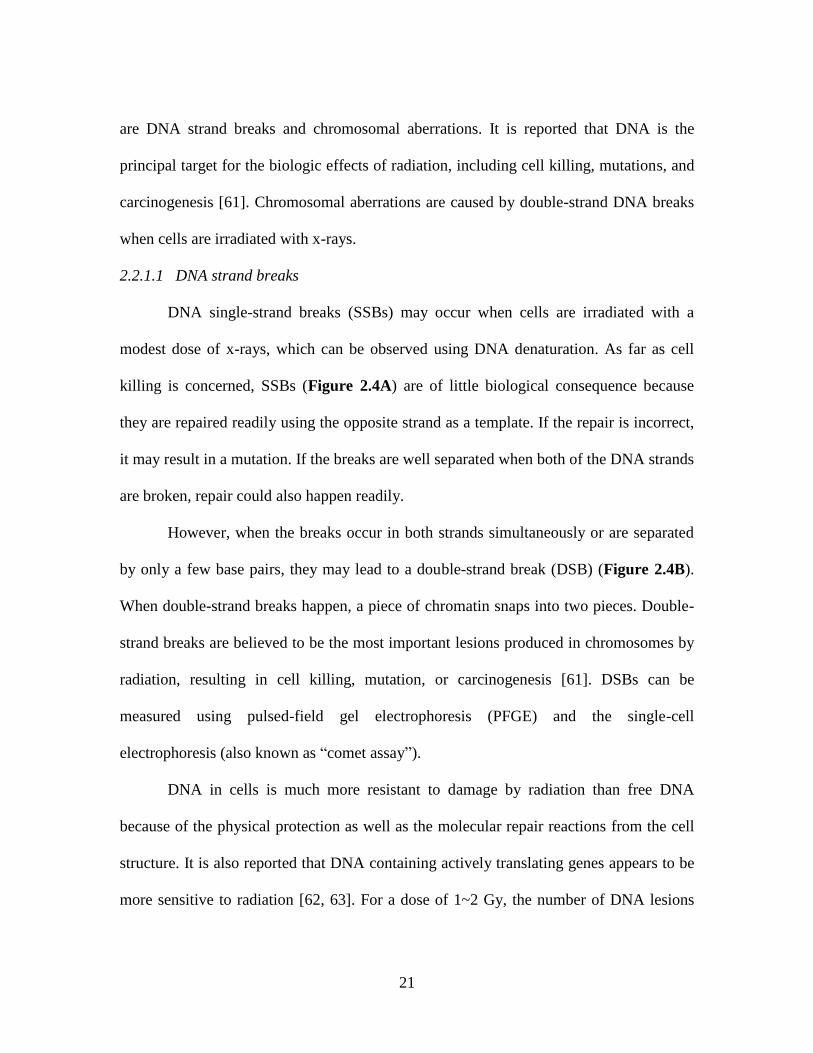
2.2.1.1 DNA strand breaks
DNA single-strand breaks (SSBs) may occur when cells are irradiated with a
modest dose of x-rays, which can be observed using DNA denaturation. As far as cell
killing is concerned, SSBs (Figure 2.4A) are of little biological consequence because
they are repaired readily using the opposite strand as a template. If the repair is incorrect,
it may result in a mutation. If the breaks are well separated when both of the DNA strands
are broken, repair could also happen readily.
However, when the breaks occur in both strands simultaneously or are separated
by only a few base pairs, they may lead to a double-strand break (DSB) (Figure 2.4B).
When double-strand breaks happen, a piece of chromatin snaps into two pieces. Double-
strand breaks are believed to be the most important lesions produced in chromosomes by
radiation, resulting in cell killing, mutation, or carcinogenesis [61]. DSBs can be
measured using pulsed-field gel electrophoresis (PFGE) and the single-cell
electrophoresis (also known as ―comet assay‖).
DNA in cells is much more resistant to damage by radiation than free DNA
because of the physical protection as well as the molecular repair reactions from the cell
structure. It is also reported that DNA containing actively translating genes appears to be
more sensitive to radiation [62, 63]. For a dose of 1~2 Gy, the number of DNA lesions

22
per cell immediately after the exposure is approximately: base damage > 1000, single-
strand breaks ~ 1000, and double-strand breaks ~40 [60].
Figure 2.4 (A) DNA single-strand break; (B) DNA double-strand break [64].
2.2.1.2 Chromosomal aberrations
When double-strand breaks are produced in the chromosomes as a consequence of
incident x-rays, the resultant broken unpaired ends are sticky and can rejoin with other
sticky ends (unpaired ends), causing chromosome aberrations and chromatid aberrations
[65]. Chromosomal aberrations in peripheral lymphocytes have been widely used as
biomarkers of radiation exposure with the lowest detectable single dose of 0.25 Gy [60].
The radiation dose can be estimated by comparison with in vitro cultures exposed to
known doses and used to determine whether the suspected exposure to a person is a real
23
exposure.
2.2.2 Radiation Exposure Effects on Cellular Level
The radiation-induced damage on DNA in the cell nucleus is responsible for most
of the radiation-induced cell death. Different types of cells have various levels of
sensitivity to radiation [66]. In 1906, radiologist Jean Bergonie and histologist Louis
Tribondeau put forward the Law of Bergonie and Tribondeau [67, 68] stating:
1). Stem or immature cells are more radiosensitive than mature cells;
2). Younger tissues and organs are more radiosensitive than older tissues and organs;
3). The higher the metabolic cell activity, the more radiosensitive it is;
4). The greater the proliferation and growth rate for tissues, the greater the
radiosensitivity.
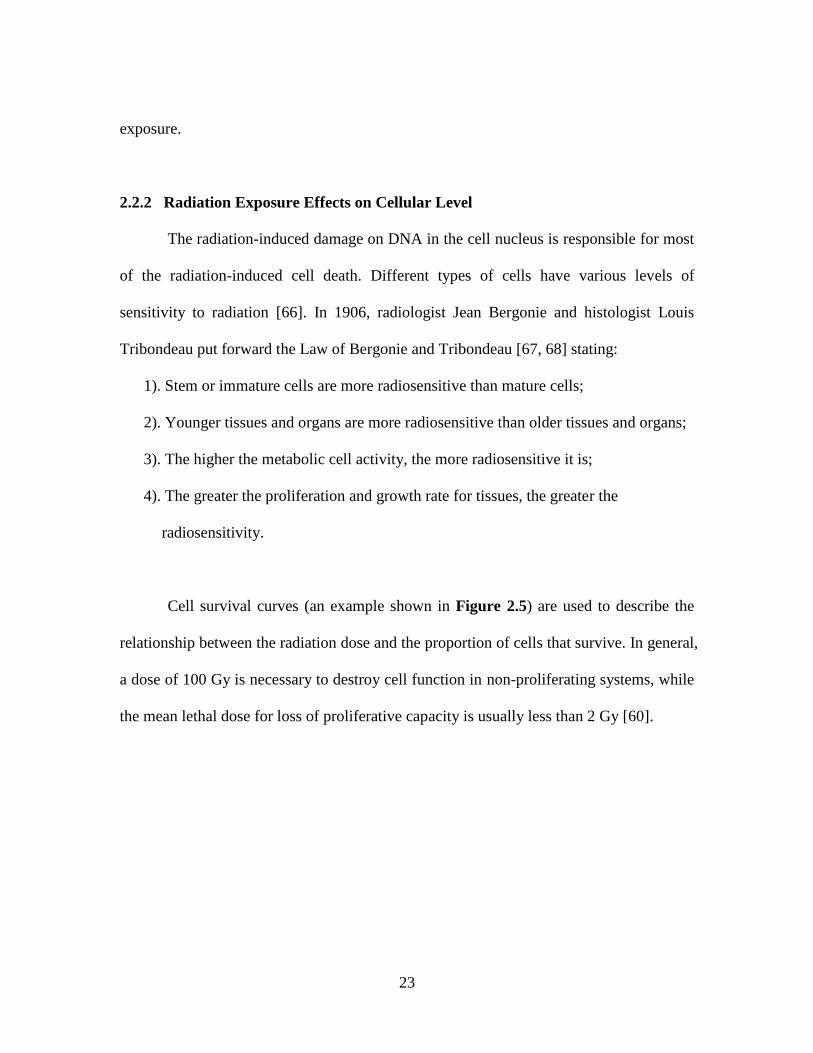
Cell survival curves (an example shown in Figure 2.5) are used to describe the
relationship between the radiation dose and the proportion of cells that survive. In general,
a dose of 100 Gy is necessary to destroy cell function in non-proliferating systems, while
the mean lethal dose for loss of proliferative capacity is usually less than 2 Gy [60].
24
Figure 2.5 Cell survival curve of human glioma cells irradiated with 240 kVp x-rays in
vitro [69].
2.2.3 High-dose Effects and Low-dose Effects
High-dose radiation exceeding the threshold dose could result in deterministic
effects, including skin damage, cataractogenesis, sterility, and even death. The practical
threshold dose in diagnostic radiology is 2 Gy [42]. As a quantitative description of
irradiation effects, the half lethal dose (LD50) is defined as the uniform whole-body dose
that would kill 50% of the population. The LD50 is 3 to 4 Gy within 60 days for young
adults without medical intervention [42].
Below the threshold for induction of deterministic effects (< 2 Gy), radiation can
25
result in carcinogenesis [70, 71], which is the principal concern in diagnostic radiology. It
is a type of stochastic effect, with the severity of the effects independent of the radiation
dose, but the probability of the cancer induction increases with radiation dose. Radiation-
induced carcinogenesis could be expressed using levels of radiation-induced risks.
2.2.4 Radiation-induced Risks
The biological consequence resulting from low-dose irradiation is often
characterized by radiation-induced carcinogenic risks, because low-dose radiation acts
principally on early stages of tumorigenesis based on available animal data [72]. Studies
of atomic bomb survivors, medical radiation, occupational radiation, and environmental
radiation have been performed to estimate cancer risks [73]. Epidemiological studies of
the Japanese survivors of the Hiroshima and Nagasaki atomic bombs demonstrated a
linear relationship between cancer incidence and organ dose over a range extending
between two and three orders of magnitude [74-77].
Major scientific bodies, including the Committee on the Biological Effects of
Ionizing Radiation [73], International Committee on Radiological Protection [47], and the
United Nations Scientific Committee on the Effects of Atomic Radiation [25] all assume
that radiation risks exist at low doses for radiation protection purposes. Figure 2.6 shows
the total cancer incidence of males and female with various ages based on data from
BEIR VII [73]. The linear no-threshold (LNT) model is by far the most popular model
describing the relationship between radiation exposure and cancer development in
humans [78].
26
Figure 2.6 Total cancer incidence risks from BEIR VII Report.
2.3 RADIATION DOSES IN INTERVENTIONAL RADIOLOGY
2.3.1 Interventional Radiology Suite
A typical interventional radiology suite is usually composed of one or two C-arms,
a patient support table, a group of monitors, a set of foot pedals for operating the x-ray
tubes, and a control console for controlling the movement of the C-arms and the patient
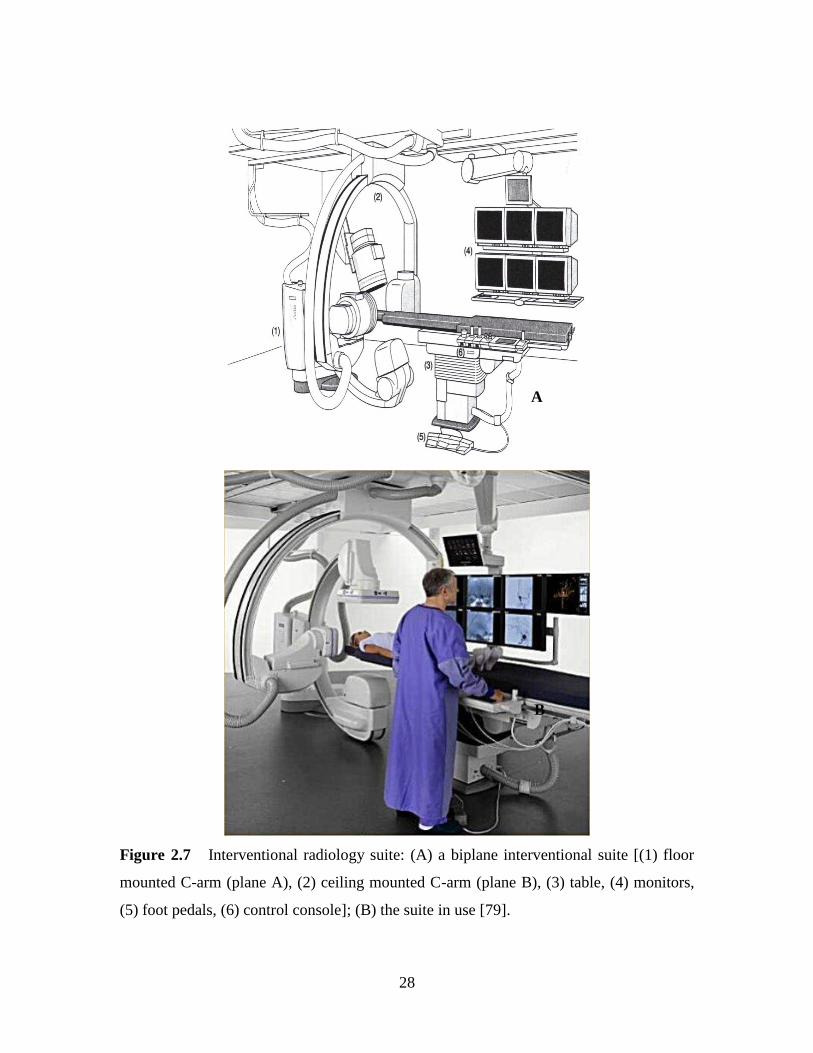
table. Figure 2.7 shows a typical interventional radiology suite [79].
Interventional radiology demands an increased awareness of the fundamental
radiation protection principles of time, distance, and shielding. Unlike other areas in
medicine in which ionizing radiation is used to diagnose or treat disease (e.g., therapeutic
27
radiology, nuclear medicine), x-ray use is not completely regulated at the federal level. A
variety of recommendations have been put forward by different organizations, including
the Occupational Safety and Health Administration (OSHA) [80], International
Commission on Radiological Protection (ICRP) [81], and the International Commission
on Radiation Units and Measurements (ICRU) [45]. In general, doses should always be
kept ―as low as reasonably achievable‖ (ALARA) [82].
28
Figure 2.7 Interventional radiology suite: (A) a biplane interventional suite [(1) floor
mounted C-arm (plane A), (2) ceiling mounted C-arm (plane B), (3) table, (4) monitors,
(5) foot pedals, (6) control console]; (B) the suite in use [79].
A
B
29
2.3.2 Patient Doses
As one of the departments where the highest doses of x-rays are delivered to
patients, interventional radiology (IR) has few references about patient dose reference
levels at present.
2.3.2.1 Kerma Area Product
Kerma area product (KAP, unit: Gy-cm2) is an indication of the input patient
doses, and it is the recommended quantity by the International Commission on Radiation
Units (ICRU) to measure patient doses in IR [83], which is equal to the quantity known
as Dose Area Product (DAP) clinically. Several attempts have been made to establish the
reference levels for KAP in IR [84-86], particularly in interventional cardiology [87-92].
DAP is typically measured with an ionization chamber located near the collimator
(Figure 2.8), and is independent of source-to-skin distance. However, DAP is a poor
analogue of skin dose, as it does not take into consideration the skin area being irradiated.
Estimation of absorbed skin dose from DAP data has a potential error of ~ 30%-40% [93].
Figure 2.8 Diagram of C-arm fluoroscopic unit with DAP ionization chamber [93].
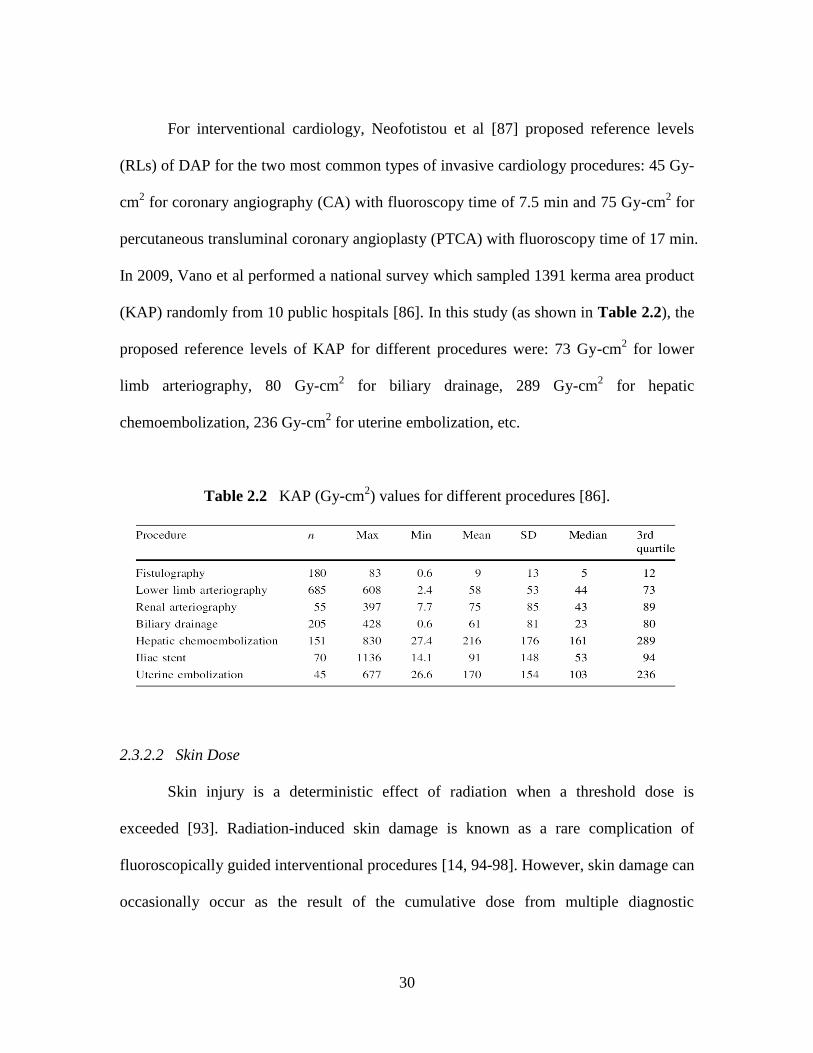
30
For interventional cardiology, Neofotistou et al [87] proposed reference levels
(RLs) of DAP for the two most common types of invasive cardiology procedures: 45 Gy-
cm2 for coronary angiography (CA) with fluoroscopy time of 7.5 min and 75 Gy-cm
2 for
percutaneous transluminal coronary angioplasty (PTCA) with fluoroscopy time of 17 min.
In 2009, Vano et al performed a national survey which sampled 1391 kerma area product
(KAP) randomly from 10 public hospitals [86]. In this study (as shown in Table 2.2), the
proposed reference levels of KAP for different procedures were: 73 Gy-cm2 for lower
limb arteriography, 80 Gy-cm2 for biliary drainage, 289 Gy-cm
2 for hepatic
chemoembolization, 236 Gy-cm2 for uterine embolization, etc.
Table 2.2 KAP (Gy-cm2) values for different procedures [86].
2.3.2.2 Skin Dose
Skin injury is a deterministic effect of radiation when a threshold dose is
exceeded [93]. Radiation-induced skin damage is known as a rare complication of
fluoroscopically guided interventional procedures [14, 94-98]. However, skin damage can
occasionally occur as the result of the cumulative dose from multiple diagnostic

31
procedures. Tissues at risk include the skin, hair, subcutaneous fat, and muscle [99, 100].
Generally speaking, the threshold dose for transient skin injuries is ~ 2Gy for
erythema and ~ 3 Gy for hair loss [93]. Figure 2.9 illustrates hair loss, epilation on scalp,
as well as skin injury on the neck of a 60-year-old woman after a 70 minutes long
neurointerventional procedure for the treatment of an acute stroke. No dose estimates
were available for the case. Table 2.3 lists the effects on skin and hair (of the neck, torso,
pelvis, buttocks, or arms) as a function of input radiation dose and duration of time.
Prompt reactions occur less than 2 weeks after irradiation [101, 102]; early reactions
occur 2-8 weeks after [103]; midterm reactions occur 6-52 weeks after [104]; primary
long-term reactions occur more than 40 weeks after [105].
Figure 2.9 Radiation injury in a 60-year-old woman after a neurointerventional
procedure [106].

32
Table 2.3 Tissue reactions from single-delivered radiation dose to skin and hair [106].
A review published in 2010 [106] concluded that skin irradiated to a dose higher
than 3-5 Gy often looks normal but reacts abnormally when irradiation is repeated. When
the same area of skin is exposed to levels higher than a few grays, the effects of previous
irradiation should be included when estimating the expected tissue reaction from the
additional procedure [106].
2.3.2.3 Effective Dose
The effective dose is a descriptor that can be used to characterize radiation
exposure to patients in interventional radiology [107]. Computation of effective dose
requires knowledge of absorbed dose to all irradiated organs and tissues, which may be
obtained by means of Monte Carlo computational techniques [108] or direct
measurement in anthropomorphic phantoms [3]. Effective doses can be obtained from
different measurement quantities, such as dose area product, or air kerma measurement
33
[109].
In a study performed by Brambilla M et al [110], low mean effective dose
estimates were shown to lie in extravascular procedures (4.8 - 28.2 mSv), intermediate
effective dose values for neurointerventional procedures (12.6 - 32.9 mSv), and higher
effective doses for vascular procedures involving the abdomen (36.5 - 86.8 mSv).
Calculations aiming at obtaining the DAP to effective dose conversion factor in
abdominal and vascular interventional radiology [111] showed a result of ~ 0.15 mSv/
Gy-cm2.
2.3.2.4 Energy imparted
Energy imparted in a patient during an IR procedure could also be used to
calculate the effective dose, as advanced by Huda et al [112]. Under the condition of a
uniform whole-body irradiation, the smaller mass results in a higher conversion factor to
convert energy imparted to effective dose; under non-uniform exposure, the radio-
sensitivity of an irradiated region also needs to be taken into account when energy
imparted is converted to effective dose [113, 114]. Thus, an estimate of energy imparted
on a patient undergoing any given radiology imaging procedure can be used to compute
the effective dose [115, 116] and then converted to patient specific radiation-induced
carcinogenesis risks [117]. A set of effective dose to energy imparted conversion factors
(E/ε, mSv/J) was obtained for different projection angles and patient ages (as shown in
Figure 2.10) [112].
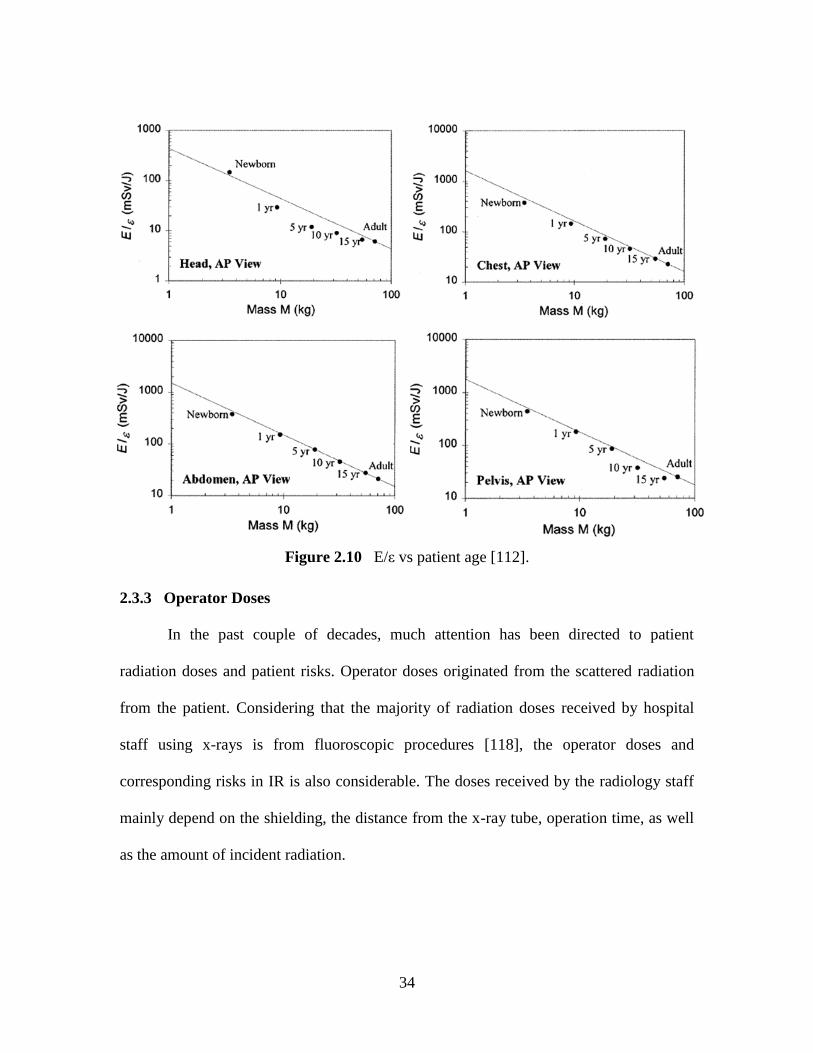
34
Figure 2.10 E/ε vs patient age [112].
2.3.3 Operator Doses
In the past couple of decades, much attention has been directed to patient
radiation doses and patient risks. Operator doses originated from the scattered radiation
from the patient. Considering that the majority of radiation doses received by hospital
staff using x-rays is from fluoroscopic procedures [118], the operator doses and
corresponding risks in IR is also considerable. The doses received by the radiology staff
mainly depend on the shielding, the distance from the x-ray tube, operation time, as well
as the amount of incident radiation.
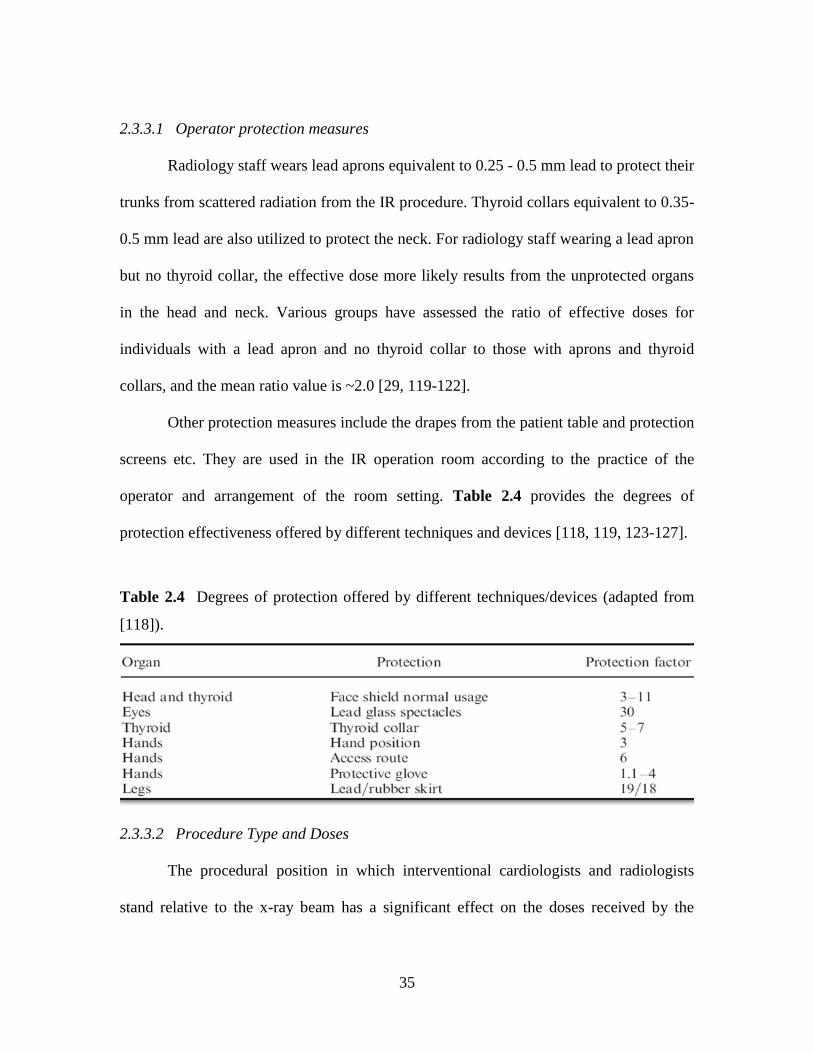
35
2.3.3.1 Operator protection measures
Radiology staff wears lead aprons equivalent to 0.25 - 0.5 mm lead to protect their
trunks from scattered radiation from the IR procedure. Thyroid collars equivalent to 0.35-
0.5 mm lead are also utilized to protect the neck. For radiology staff wearing a lead apron
but no thyroid collar, the effective dose more likely results from the unprotected organs
in the head and neck. Various groups have assessed the ratio of effective doses for
individuals with a lead apron and no thyroid collar to those with aprons and thyroid
collars, and the mean ratio value is ~2.0 [29, 119-122].
Other protection measures include the drapes from the patient table and protection
screens etc. They are used in the IR operation room according to the practice of the
operator and arrangement of the room setting. Table 2.4 provides the degrees of
protection effectiveness offered by different techniques and devices [118, 119, 123-127].
Table 2.4 Degrees of protection offered by different techniques/devices (adapted from
[118]).
2.3.3.2 Procedure Type and Doses
The procedural position in which interventional cardiologists and radiologists
stand relative to the x-ray beam has a significant effect on the doses received by the
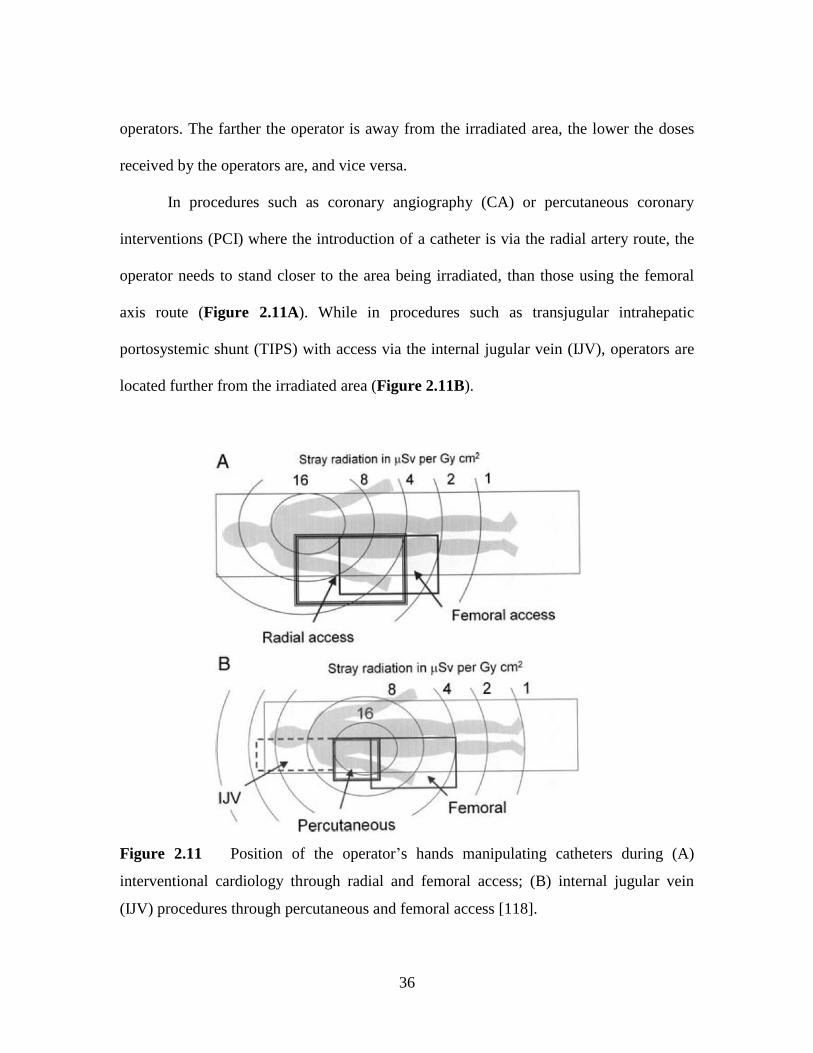
36
operators. The farther the operator is away from the irradiated area, the lower the doses
received by the operators are, and vice versa.
In procedures such as coronary angiography (CA) or percutaneous coronary
interventions (PCI) where the introduction of a catheter is via the radial artery route, the
operator needs to stand closer to the area being irradiated, than those using the femoral
axis route (Figure 2.11A). While in procedures such as transjugular intrahepatic
portosystemic shunt (TIPS) with access via the internal jugular vein (IJV), operators are
located further from the irradiated area (Figure 2.11B).
Figure 2.11 Position of the operator‘s hands manipulating catheters during (A)
interventional cardiology through radial and femoral access; (B) internal jugular vein
(IJV) procedures through percutaneous and femoral access [118].
37
The type of IR procedure and its corresponding access method should be taken
into account for calculating the amount of radiation received by radiology staff, and
should also be considered as a factor to decide the position of the protective screen.
2.3.3.3 Effective Dose
The mean effective dose calculated from monitoring data indicate that the
effective dose per interventional cardiology procedure are between ~ 0.2 µSv and ~4.0
µSv [128-132] with some exceptions [133]. This will result in an annual effective dose
between ~0.1 mSv and ~2 mSv, assuming that an individual performs 500 procedures per
year. However, these effective dose calculations assume that good protection measures
are in place consistently. Even under similar protection measurement conditions,
variations in calculations still exist because of the erratic use of dosimeters by some
clinicians. For example, according to Monte Carlo simulation results [29], a dosimeter
worn on the front or right side of the chest will record doses that are 1.5–2.5 times less
than those on the left side facing the x-ray source. Thus, it is almost impossible to achieve
a high degree of accuracy.
2.3.3.4 Organ Dose and Extremity Dose
The most important organ doses and extremity doses to interventional radiology
staff are the absorbed doses to hands, eyes and thyroid. The median and quartile for the
data of operator dose per DAP (unit: µGy Gy-1
cm-2
) values, including doses to the
operator‘s eyes, thyroid, hand, leg, and effective dose, are listed in Table 2.5.
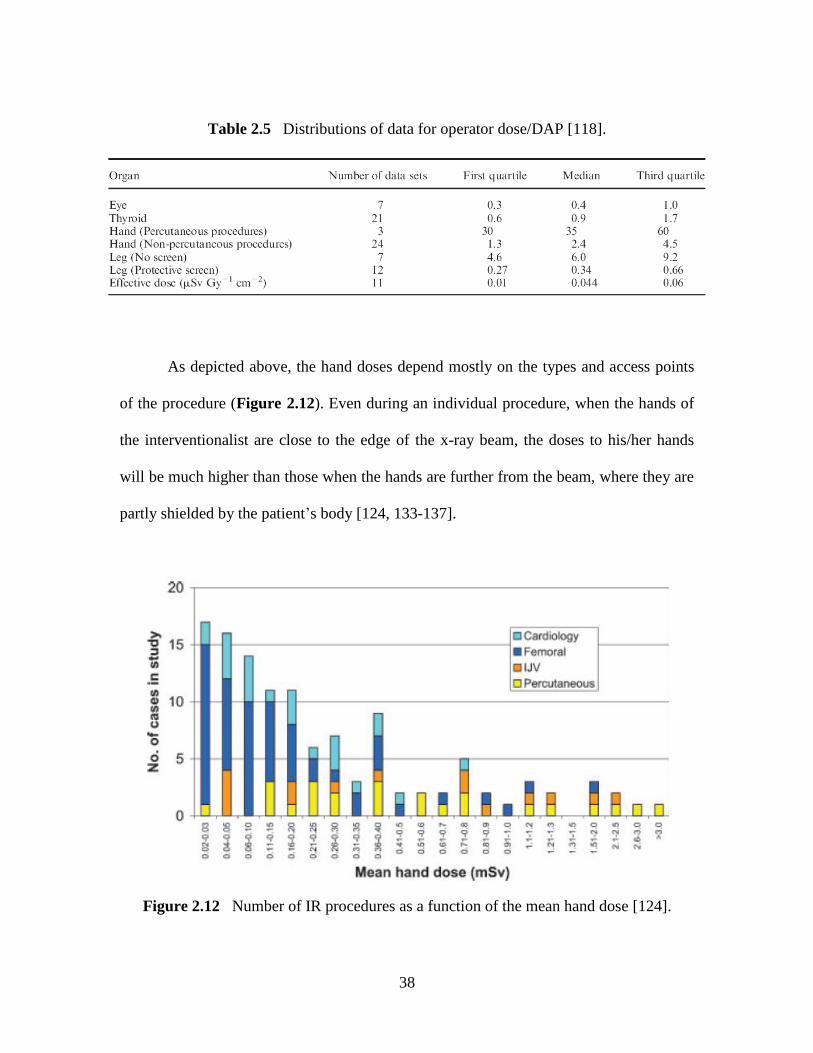
38
Table 2.5 Distributions of data for operator dose/DAP [118].
As depicted above, the hand doses depend mostly on the types and access points
of the procedure (Figure 2.12). Even during an individual procedure, when the hands of
the interventionalist are close to the edge of the x-ray beam, the doses to his/her hands
will be much higher than those when the hands are further from the beam, where they are
partly shielded by the patient‘s body [124, 133-137].
Figure 2.12 Number of IR procedures as a function of the mean hand dose [124].
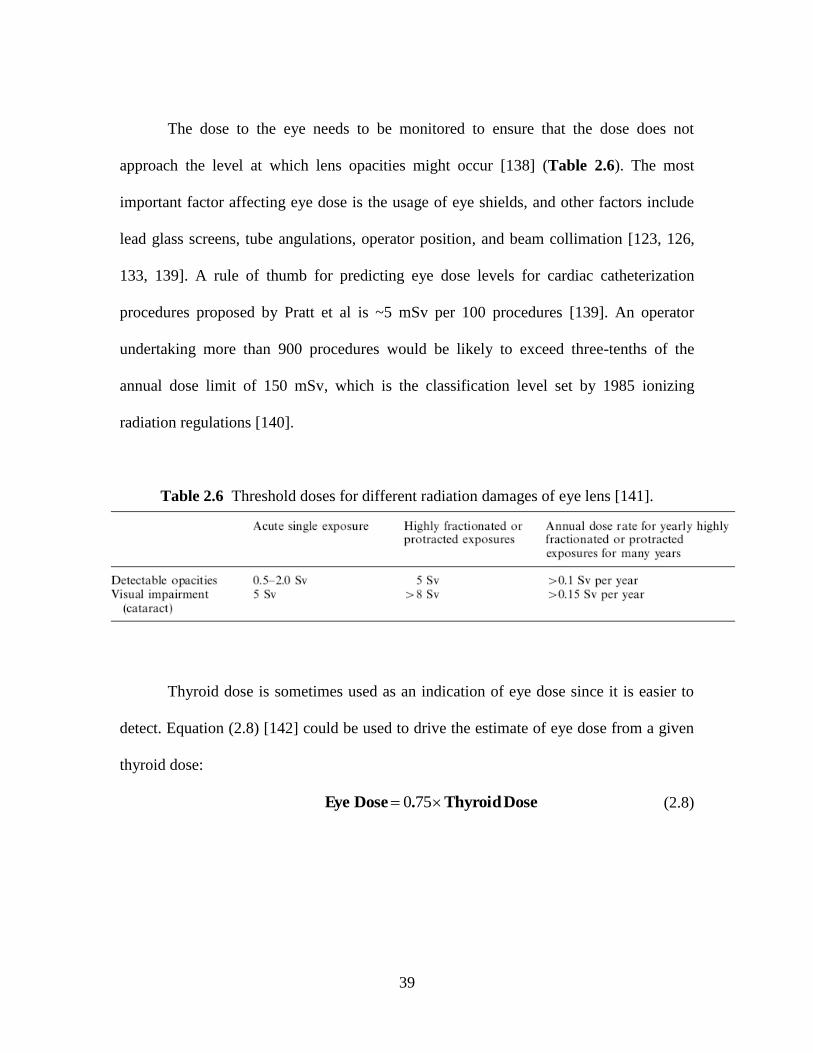
39
The dose to the eye needs to be monitored to ensure that the dose does not
approach the level at which lens opacities might occur [138] (Table 2.6). The most
important factor affecting eye dose is the usage of eye shields, and other factors include
lead glass screens, tube angulations, operator position, and beam collimation [123, 126,
133, 139]. A rule of thumb for predicting eye dose levels for cardiac catheterization
procedures proposed by Pratt et al is ~5 mSv per 100 procedures [139]. An operator
undertaking more than 900 procedures would be likely to exceed three-tenths of the
annual dose limit of 150 mSv, which is the classification level set by 1985 ionizing
radiation regulations [140].
Table 2.6 Threshold doses for different radiation damages of eye lens [141].
Thyroid dose is sometimes used as an indication of eye dose since it is easier to
detect. Equation (2.8) [142] could be used to drive the estimate of eye dose from a given
thyroid dose:
Dose Thyroid.Dose Eye 750 (2.8)

40
2.4 Monte Carlo Applications in Diagnostic Radiology
2.4.1 Monte Carlo Method
The Monte Carlo (MC) method is an application of laws of probability and
statistics to the natural sciences. The essence of the method is to use various distributions
of random numbers, each distribution reflecting a particular process in a sequence of
processes such as the diffusion of neutrons in various materials, to calculate samples that
approximate the real diffusion history [143, 144]. The development of computer
techniques made the laborious Monte Carlo approach possible and extremely useful for
many physics problems. Over the last 50 years, Monte Carlo techniques have become
ubiquitous in medical physics with a doubling of papers on the subject every 5 years
between the first PMB paper in 1967 and 2000 [30].
Monte Carlo approaches tend to follow a particular pattern [145]:
1). Define a domain of possible inputs;
2). Generate inputs randomly from the domain using a certain specified probability
distribution;
3). Perform a deterministic computation using the inputs;
4). Aggregate the results of the individual computations into the final result.
Use a simple integration problem [146] as an example to demonstrate the
principle of Monte Carlo method:
Evaluate 2
1
0
1 xxgdxxgG )( with,)( .
The distribution of the function g(x) is shown in Figure 2.13.

41
Figure 2.13 (A) Function g(x); (B) schematic of Monte Carlo solution. (adopted from
[146])
If mathematical approach is used to solve this problem, the solution would be:
) ,( in randomly ˆ choose ,, For 101 kxNk
N
k
k
N
k
k xN
xgN
G1
2
1
111
01 )ˆ(]g(x) of valueaverage[)( .
However, if the Monte Carlo method is employed to solve this problem, the
process will be similar to a game of darts (as shown in Figure 5.1B):
) ,( in randomly ˆ ,ˆ choose ,, For 101 kk yxNk ,
hit"" a tally 1,ˆˆ if kk yx ,
NG
Hits of Number)(]curve under area[ 11 .
When the number of cases (N) is big enough, the result from Monte Carlo method
should be the same as the mathematical method.
As shown above, MC methods are more intuitive than the mathematical methods,
but they use considerably more computation power to generate the results. The core
42
algorithm of MC methods includes random number generation [147, 148], random
sampling [149], variance reduction, etc.
2.4.2 Application of Monte Carlo in Medical Physics
2.4.2.1 Monte Carlo Software for Medical Physics
Monte Carlo N-Particle (MCNP) is a general-purpose Monte Carlo code package
that can be used for neutron, photon, electron, or coupled neutron/photon/electron
transport. The MCNP system is maintained by a large group at Los Alamos National
Laboratory [150] and has many applications outside medical physics since it was
originally a neutron–photon transport code used for reactor calculations [151]. This code
has a very powerful geometry package and has incorporated the electron transport part
from the ETRAN code system. The great flexibility of this code makes it run
considerably slower than EGSnrc[30].
Electron Gamma Shower (EGS) code was developed by Ralph Nelson et al in
1974 [152]. On the basis of this platform, the current EGSnrc system is developed as a
package for Monte Carlo simulation of coupled electron-photon transport within the
energy range of 1keV to 10 GeV. EGSnrc improved its former version of EGS4 which
was developed at Stanford Linear Accelerator Center (SLAC) and incorporated
improvements in the implementation of the condensed history technique for the
simulation of charged particle transport and better low energy cross sections [153].
BEAMnrc, based on the EGSnrc code system, is a general purpose MC simulation
system for modeling radiotherapy sources [154].
43
The PENELOPE code package has a detailed treatment of cross sections for low-
energy transport and a flexible geometry package which allows simulation of an
accelerator [155, 156]. The GEANT4 code [157] is a general purpose code developed for
particle physics applications, which can simulate the transport of many particle types
(neutrons, protons, etc). GEANT4 has been used for various application in radiotherapy
physics [158, 159]. It still demonstrates some problems when electron transport is
involved and runs slower than EGSnrc in such applications [160, 161], but overall the
system is very powerful.
2.4.2.2 Applications of MC software in Medical Physics
The Monte Carlo method could be used to perform calculations for radiation
protection and dosimetry, radiation shielding, radiography, nuclear criticality safety,
detector design and analysis, accelerator target design, and fission and fusion reactor
design. In the medical physics area, the applications of Monte Carlo codes have been
employed to conduct calculations on detection systems, imaging correction, absorbed
doses, and radiation protection in nuclear medicine, diagnostic radiology and
radiotherapy [31]. They are also applied in treatment planning and brachytherapy in
radiotherapy physics.
2.4.3 Current Research on IR using MC Method
The literature on patient and occupational dose levels has been reviewed in
Chapter 4, so in this section, the focus is on the MC simulation and methodology used in
available representative literature.
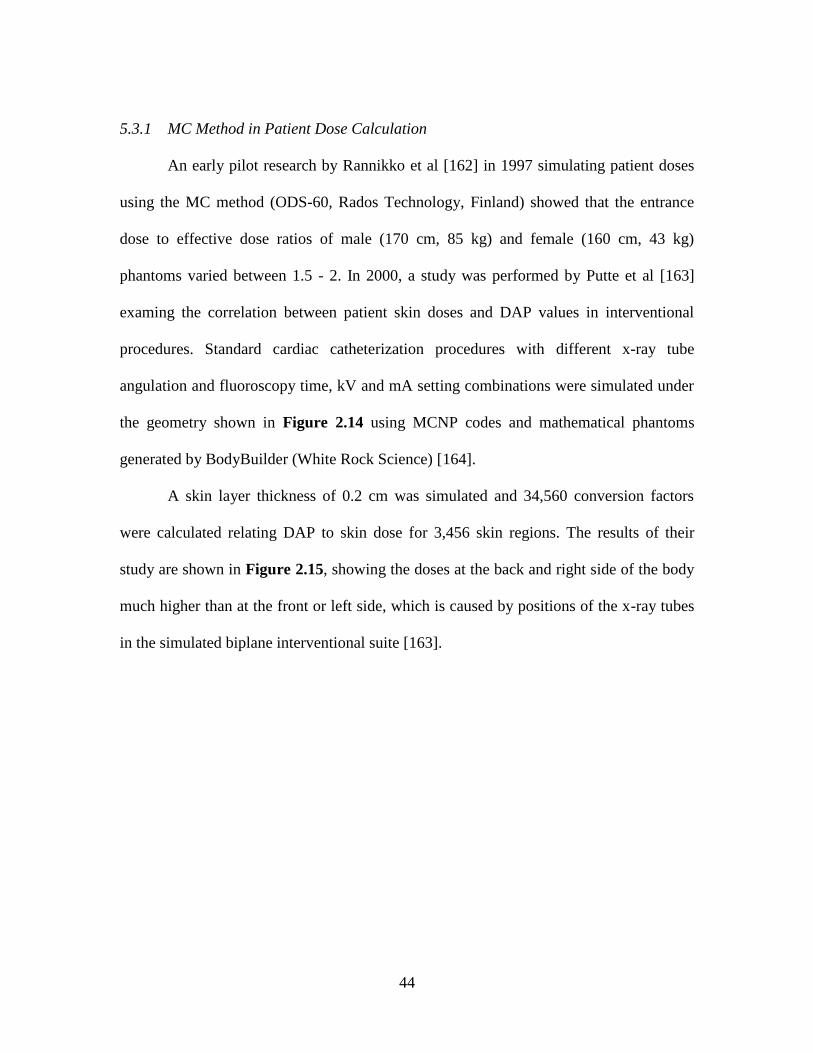
44
5.3.1 MC Method in Patient Dose Calculation
An early pilot research by Rannikko et al [162] in 1997 simulating patient doses
using the MC method (ODS-60, Rados Technology, Finland) showed that the entrance
dose to effective dose ratios of male (170 cm, 85 kg) and female (160 cm, 43 kg)
phantoms varied between 1.5 - 2. In 2000, a study was performed by Putte et al [163]
examing the correlation between patient skin doses and DAP values in interventional
procedures. Standard cardiac catheterization procedures with different x-ray tube
angulation and fluoroscopy time, kV and mA setting combinations were simulated under
the geometry shown in Figure 2.14 using MCNP codes and mathematical phantoms
generated by BodyBuilder (White Rock Science) [164].
A skin layer thickness of 0.2 cm was simulated and 34,560 conversion factors
were calculated relating DAP to skin dose for 3,456 skin regions. The results of their
study are shown in Figure 2.15, showing the doses at the back and right side of the body
much higher than at the front or left side, which is caused by positions of the x-ray tubes
in the simulated biplane interventional suite [163].
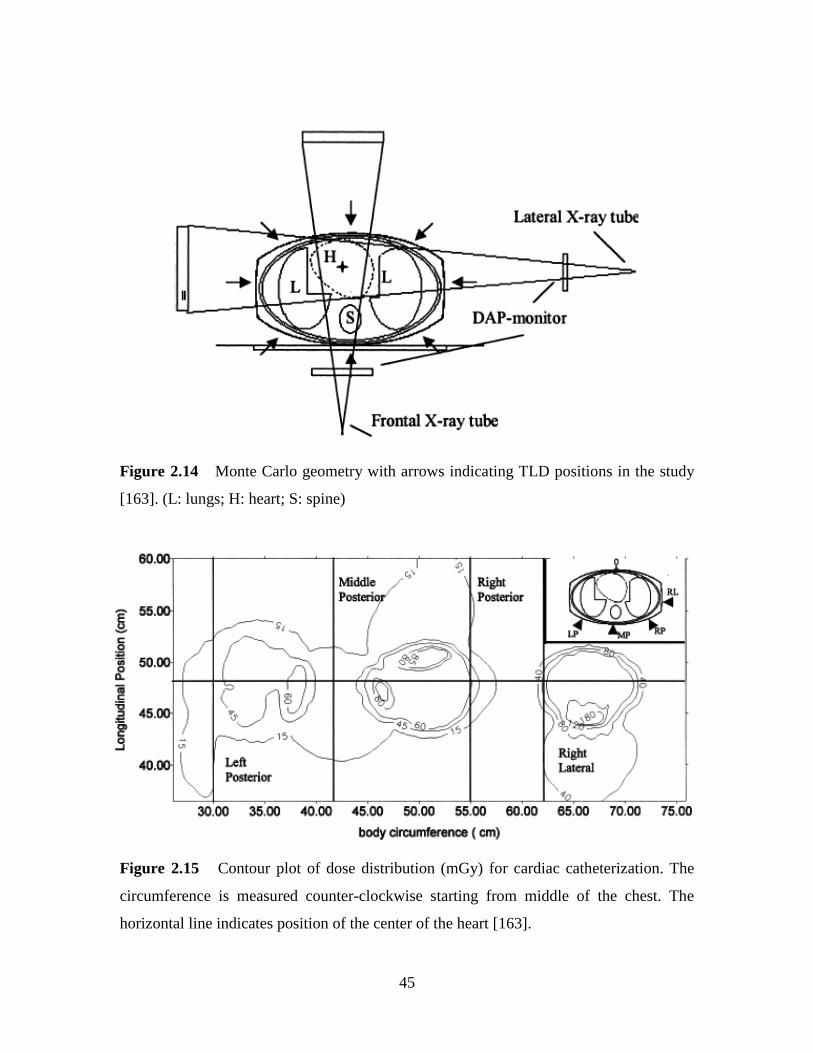
45
Figure 2.14 Monte Carlo geometry with arrows indicating TLD positions in the study
[163]. (L: lungs; H: heart; S: spine)
Figure 2.15 Contour plot of dose distribution (mGy) for cardiac catheterization. The
circumference is measured counter-clockwise starting from middle of the chest. The
horizontal line indicates position of the center of the heart [163].
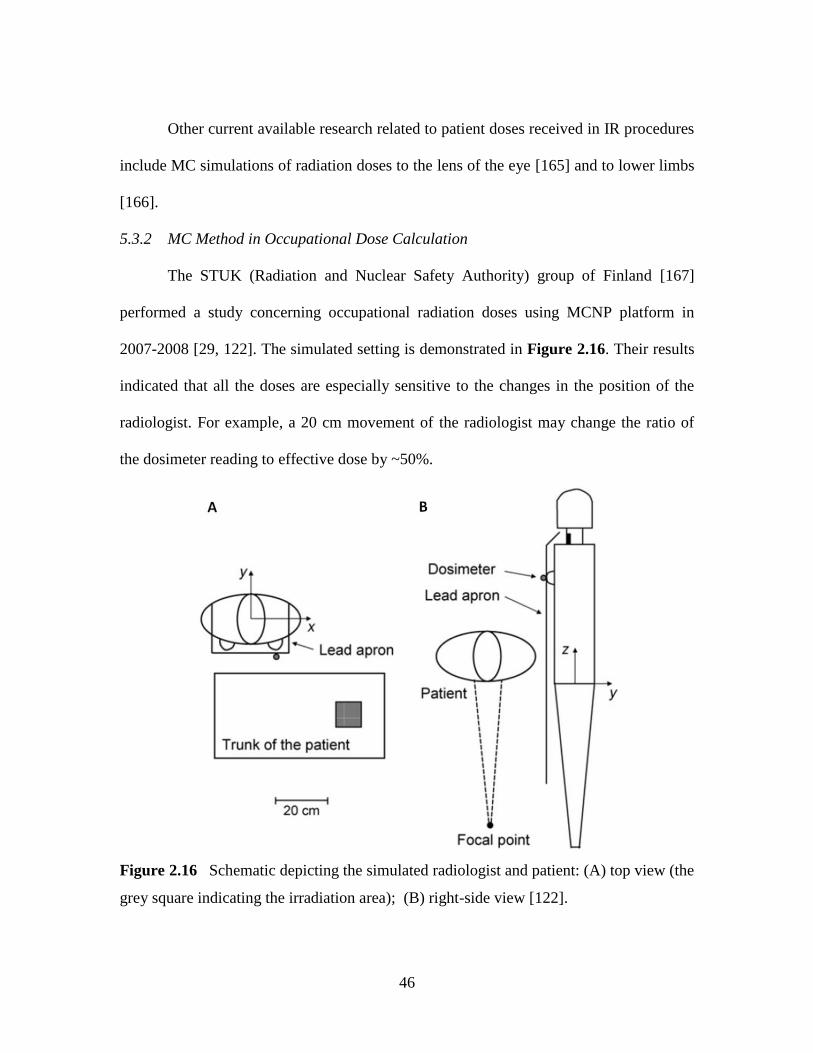
46
Other current available research related to patient doses received in IR procedures
include MC simulations of radiation doses to the lens of the eye [165] and to lower limbs
[166].
5.3.2 MC Method in Occupational Dose Calculation
The STUK (Radiation and Nuclear Safety Authority) group of Finland [167]
performed a study concerning occupational radiation doses using MCNP platform in
2007-2008 [29, 122]. The simulated setting is demonstrated in Figure 2.16. Their results
indicated that all the doses are especially sensitive to the changes in the position of the
radiologist. For example, a 20 cm movement of the radiologist may change the ratio of
the dosimeter reading to effective dose by ~50%.
Figure 2.16 Schematic depicting the simulated radiologist and patient: (A) top view (the
grey square indicating the irradiation area); (B) right-side view [122].

47
In 2007, Bozkurt et al [32] used an image-based voxel phantom (VIP-man) [168]
based on MCNP codes with a height of 1.76 m and a weight of 73 kg, with one patient
and one physician standing 15 cm away from about the waist level of the patient. The
physician was simulated wearing a lead apron and a thyroid collar. A 10 x 10 x 1 cm3 air
cell was placed between the patient and operation table to record the entrance dose and
used to calculate dose area product (DAP). Five most frequently used x-ray tube
angulations [169] were simulated at seven different tube voltages (from 60 kV to 120 kV)
with 108 photon histories. Doses to radiosensitive organs per DAP and effective doses per
DAP for the patient and physician were calculated (shown in Table 2.7 and Table 2.8). A
conclusion was reached that indicated the dosimeter-based method may overestimate the
effective dose per DAP for physicians.
Table 2.7 Effective dose per DAP (mSv/(Gy-cm2)) for the patient [32]
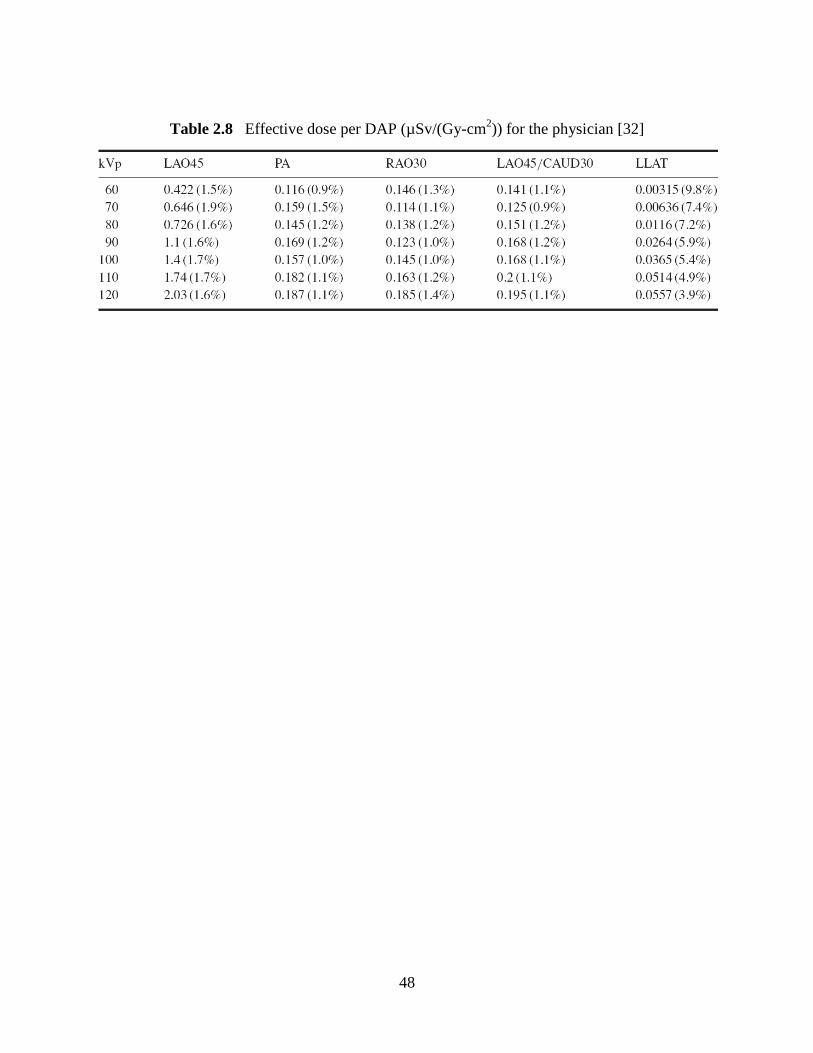
48
Table 2.8 Effective dose per DAP (µSv/(Gy-cm2)) for the physician [32]
49
CHAPTER 3 PATIENT DOSES AND PROJECTION ANGLE IN CONE BEAM
CT
3.1 Introduction
There is frequently a pressing clinical need to provide CT capability during
procedures performed in interventional radiology and in the operating room setting.
Diagnostic information obtained from a CT examination is often more valuable than that
obtained in traditional projection imaging [170, 171], and offers important medical
information to the clinician in a timely manner [172]. CT imaging in the interventional
suite with image intensifier based systems was attempted, but found to be unsatisfactory
because of difficulties associated with a reduced dynamic range and image distortion.
[173, 174] Flat panel detector CT systems are now increasingly being utilized instead of
image intensifiers in CT interventional procedures [175]. Advantages of flat panel
detectors over image intensifiers include excellent contrast resolution performance as
well as distortion-free images. Interventional CT imaging is most commonly achieved by
the use of flat panel detectors that are mounted on a C-arm. In addition, flat panel
detectors have been mounted onto conventional CT gantries with the hope of attaining
improved spatial resolution, as well as a superior level of mechanical stability [176].
It is recognized that CT imaging delivers relatively high doses to patients who
undergo this type of radiological examination [3]. CT currently accounts for about 12%
of all diagnostic examinations in the United States, whereas it is responsible for about
half the medical radiation doses [177]. The high dose associated with CT is increasingly a
source of concern in the medical imaging community [178, 179]. As a result, there is

50
considerable interest in investigating ways whereby patient doses can be reduced without
adversely affecting diagnostic information [178, 179]. One method of reducing patient
dose in CT is the utilization of x-ray tube modulation as the x-ray tube rotates around the
patient [180, 181]. With angular tube modulation, the x-ray beam intensity (mA) is
increased for thicker projections, and reduced for thinner projections, to equalize the x-
ray beam intensity at the CT detector at all x-ray tube projection angles. Use of mA
angular x-ray beam modulation is expected to reduce patient doses with no corresponding
increase in image mottle because the noise in the reconstructed image is generally
dominated by the projections with the lowest signal intensities [180].
At x-ray beam qualities used in CT imaging, x-ray beam transmission through an
average adult abdomen is only in the order of ~ 0.3 % [182]. As a result, absorbed doses
to organs close to the entrance will be much higher than absorbed doses to those organs
that are close to the patient exit. For image reconstruction purposes, however, the x-ray
attenuation in an Anterior-Posterior (AP) projection would be similar to the attenuation
from the corresponding Posterior-Anterior (PA) projection [183, 184]. It is therefore
possible to reduce the x-ray beam intensity for projections that increase patient radiation
risks, and vice versa [185]. A commercial scanner that offers this capability is currently
being introduced into clinical practice [186]. Minimizing (or switching off) the tube
current for AP projections when performing CT scans in young females could help
minimize the risk of breast cancer and offer a technologically superior alternative to the
use of breast shields [187, 188].
To quantify any dose saving that could be achieved by the use of mA modulation

51
in CT requires an explicit understanding of how patient doses vary during x-ray tube
rotation. In this study, we investigated how doses to radiosensitive organs and the
corresponding effective dose are influenced by x-ray tube projection angles for two cone
beam CT geometries. Our study focused on chest and abdominal imaging, where tube
current modulation schemes are most likely to result in significant patient dose savings.
3.2 Method
3.2.1 Cone Beam CT
Cone beam CT systems use a large area flat panel detector, with dimensions that
are about 40 cm on each side [173, 189]. One rotation of a cone beam CT system
provides coverage over a large body region such as the whole head, the chest, or
abdomen. The pixel size of a typical flat panel detector is approximately 200 m. One
rotation of an x-ray tube with a 40 cm wide flat panel detector could thus generate up to
2,000 tomographic images. By contrast, a conventional 64 slice multi-detector CT
scanner has 64 detectors each with a width of ~ 0.6 mm. One rotation of the x-ray tube in
a conventional CT scanner generates 64 tomographic images, each with a thickness of 0.6
mm. To achieve the same anatomical coverage as a cone beam CT scanner with a 40 x 40
cm2 flat panel detector, the MDCT would need to perform approximately 10 axial
rotations.
Two types of cone beam CT that utilize flat panel detectors to capture the x-ray
beam transmitted through a patient were modeled. One has the flat-panel detector and x-
ray tube mounted in a conventional CT gantry (Gantry CT), and the other has the x-ray
tube and flat panel detector CT scanner mounted on a C-arm mounting (C-Arm CT), as
52
depicted in Figure 3.1. The Gantry CT is described in detail by Gupta et al [176] and the
C-arm CT is described in detail by Kyriakou et al [190]. Table 3.1 provides a summary
of the key technical details for both cone beam CT systems, including Focus to Isocenter
Distance (FID), Focus to Detector Distance (FDD), detector size and matrix size, long
patient axis (i.e., z-axis) coverage and axial field of view.
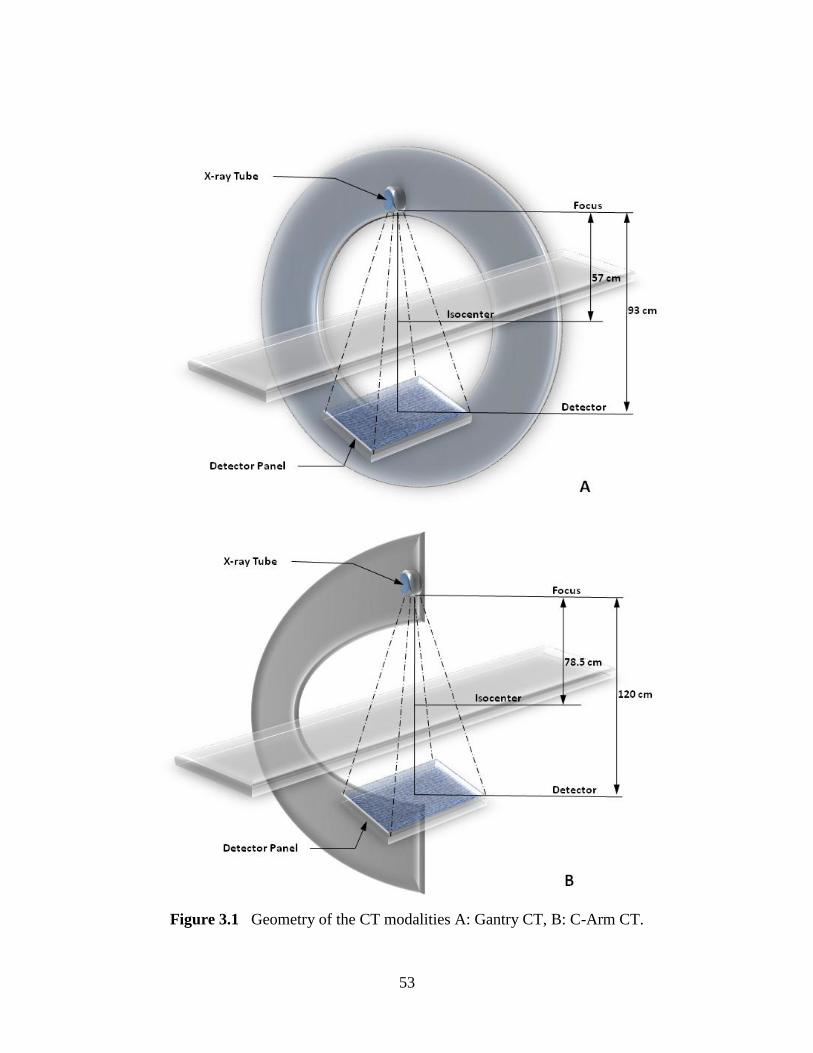
53
Figure 3.1 Geometry of the CT modalities A: Gantry CT, B: C-Arm CT.
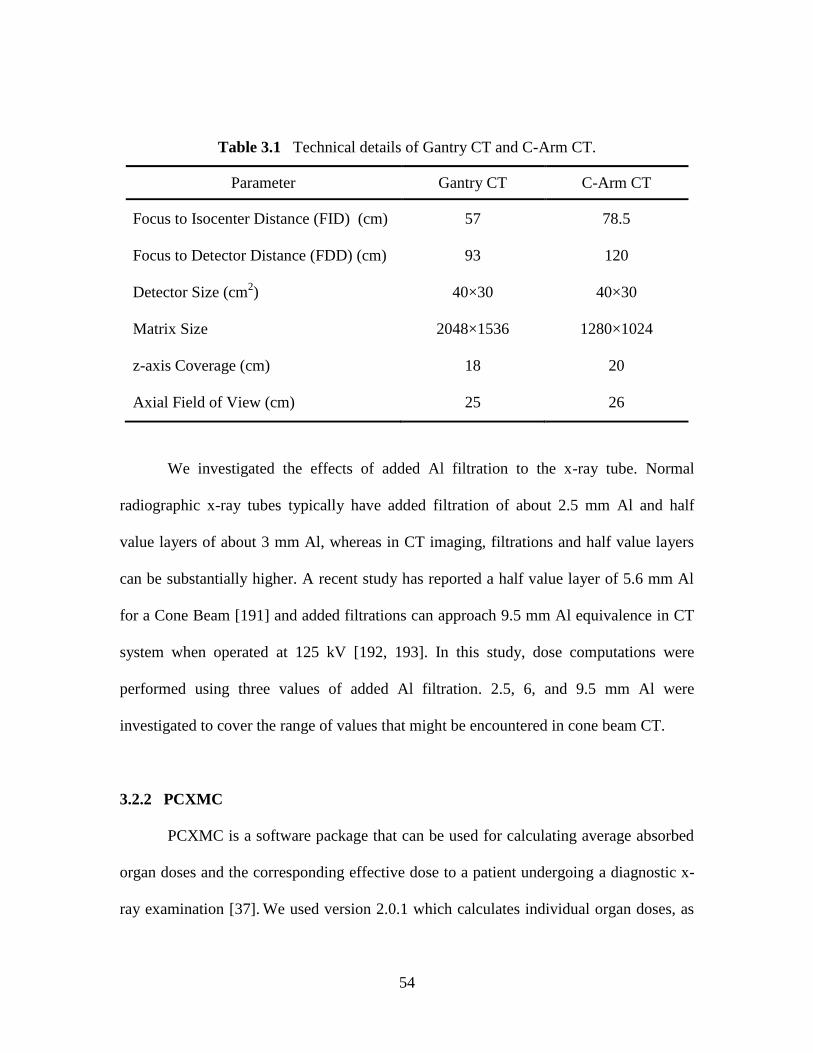
54
Table 3.1 Technical details of Gantry CT and C-Arm CT.
Parameter Gantry CT C-Arm CT
Focus to Isocenter Distance (FID) (cm) 57 78.5
Focus to Detector Distance (FDD) (cm) 93 120
Detector Size (cm2) 40×30 40×30
Matrix Size 2048×1536 1280×1024
z-axis Coverage (cm) 18 20
Axial Field of View (cm) 25 26
We investigated the effects of added Al filtration to the x-ray tube. Normal
radiographic x-ray tubes typically have added filtration of about 2.5 mm Al and half
value layers of about 3 mm Al, whereas in CT imaging, filtrations and half value layers
can be substantially higher. A recent study has reported a half value layer of 5.6 mm Al
for a Cone Beam [191] and added filtrations can approach 9.5 mm Al equivalence in CT
system when operated at 125 kV [192, 193]. In this study, dose computations were
performed using three values of added Al filtration. 2.5, 6, and 9.5 mm Al were
investigated to cover the range of values that might be encountered in cone beam CT.
3.2.2 PCXMC
PCXMC is a software package that can be used for calculating average absorbed
organ doses and the corresponding effective dose to a patient undergoing a diagnostic x-
ray examination [37]. We used version 2.0.1 which calculates individual organ doses, as
55
well as the corresponding effective dose using the tissue weighting factors recommend by
the International Commission on Radiological Protection (ICRP) in Publication 103 [194].
The anatomical data are based on the slightly modified models originating from the
mathematical hermaphroditic phantom models of Cristy and Eckerman [195] with a
nominal age of 30. In this study, we used a standard size adult phantom which weighed
73.2 kg, with a height of 178.6 cm that corresponds to a Body Mass Index of 22.9 kg/m2.
For all our simulations, the arms were kept within the phantom and their attenuation was
therefore included in the calculated organ doses.
PCXMC allows the user to define the patient irradiation geometry, where the
isocenter is always located in the geometrical center of the ellipse that defines the patient
cross-section. The user can define the image area both in vertical and horizontal
directions, FDD, as well as the patient-exit to detector distance. Definition of these
parameters permits the simulation of the irradiation geometries for both C-arm and
gantry-CT. The most important parameter that we investigated for a given gantry was the
projection angle (). Figure 2A shows the projection angles. A 90 angle corresponds to
a posteroanterior (PA) projection, and a 270 corresponds to an anteroposterior (AP)
projection. A projection angle of 0, which is also equivalent to 360, corresponds to a
left lateral projection, and a projection angle of 180 is a right lateral. Figure 2B shows a
coronal view of the phantom where the vertical axis from the mid-thigh region to the
head is defined by a z value. The six specific z values used in this study are shown in
Figure 2B, which range from the pelvic region (z = 12) to the upper chest region (z = 62).
To compute doses all factors that influence the x-ray beam quality have to be

56
defined. All of our computations used a tungsten target with a 15 anode angle. The x-ray
tube voltage in human CT imaging is typically 120 kV. Lower voltages of 80 kV may be
used when imaging pediatric patients or when iodinated contrast media has been
administered to the patient [196, 197], and higher x-ray tube voltages (140 kV) may be
used to increase penetration through larger patients or to reduce the incidence of beam
hardening image artifacts [198]. To cover this range of values that is likely to be
encountered in clinical practice, we investigated three x-ray tube voltages (i.e., 80, 120,
and 140 kV). All the calculations performed in this study were performed at a constant x-
ray tube output and the x-ray tube voltage was kept constant as the x-ray tube rotates
around the patient.

57
Figure 3.2 (A) Axial view of the phantom showing how the beam rotates around the
phantom at 15° increments. (B) Coronal view of the phantom taken from PCXMC
software, showing z values (in centimeters) of the beam center we used in PCXMC (12
cm to 62 cm). The patient phantom is shown in the prone position.
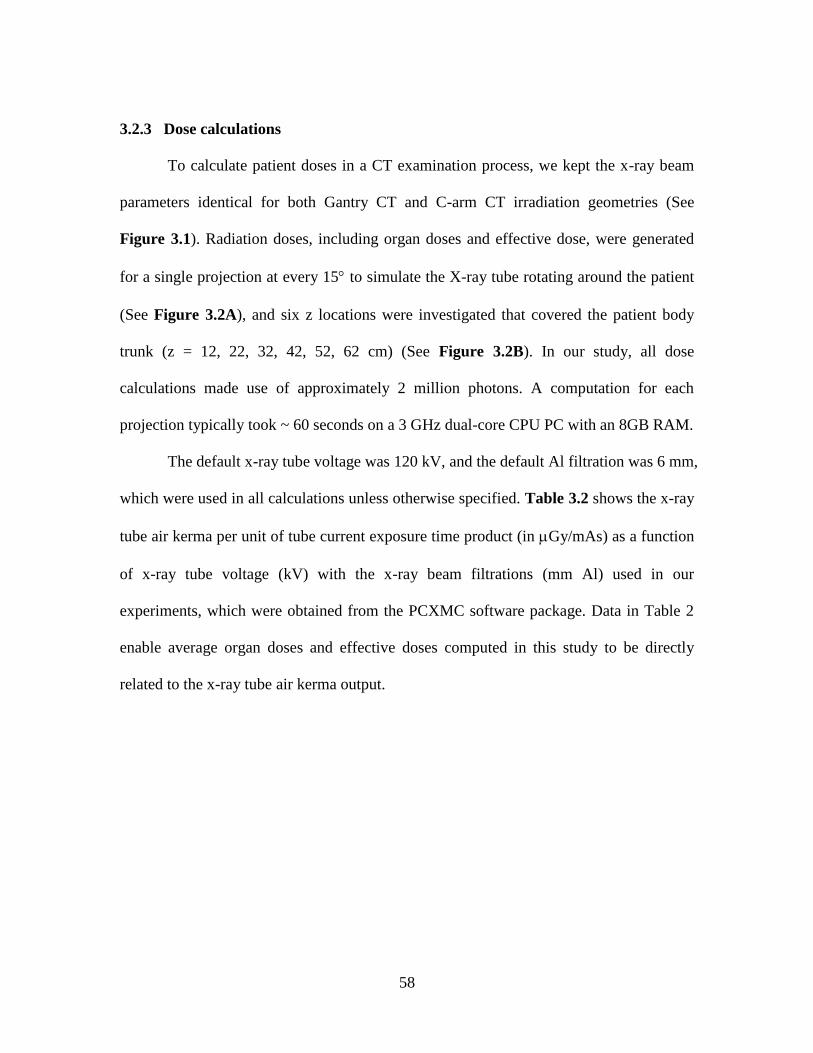
58
3.2.3 Dose calculations
To calculate patient doses in a CT examination process, we kept the x-ray beam
parameters identical for both Gantry CT and C-arm CT irradiation geometries (See
Figure 3.1). Radiation doses, including organ doses and effective dose, were generated
for a single projection at every 15 to simulate the X-ray tube rotating around the patient
(See Figure 3.2A), and six z locations were investigated that covered the patient body
trunk (z = 12, 22, 32, 42, 52, 62 cm) (See Figure 3.2B). In our study, all dose
calculations made use of approximately 2 million photons. A computation for each
projection typically took ~ 60 seconds on a 3 GHz dual-core CPU PC with an 8GB RAM.
The default x-ray tube voltage was 120 kV, and the default Al filtration was 6 mm,
which were used in all calculations unless otherwise specified. Table 3.2 shows the x-ray
tube air kerma per unit of tube current exposure time product (in Gy/mAs) as a function
of x-ray tube voltage (kV) with the x-ray beam filtrations (mm Al) used in our
experiments, which were obtained from the PCXMC software package. Data in Table 2
enable average organ doses and effective doses computed in this study to be directly
related to the x-ray tube air kerma output.
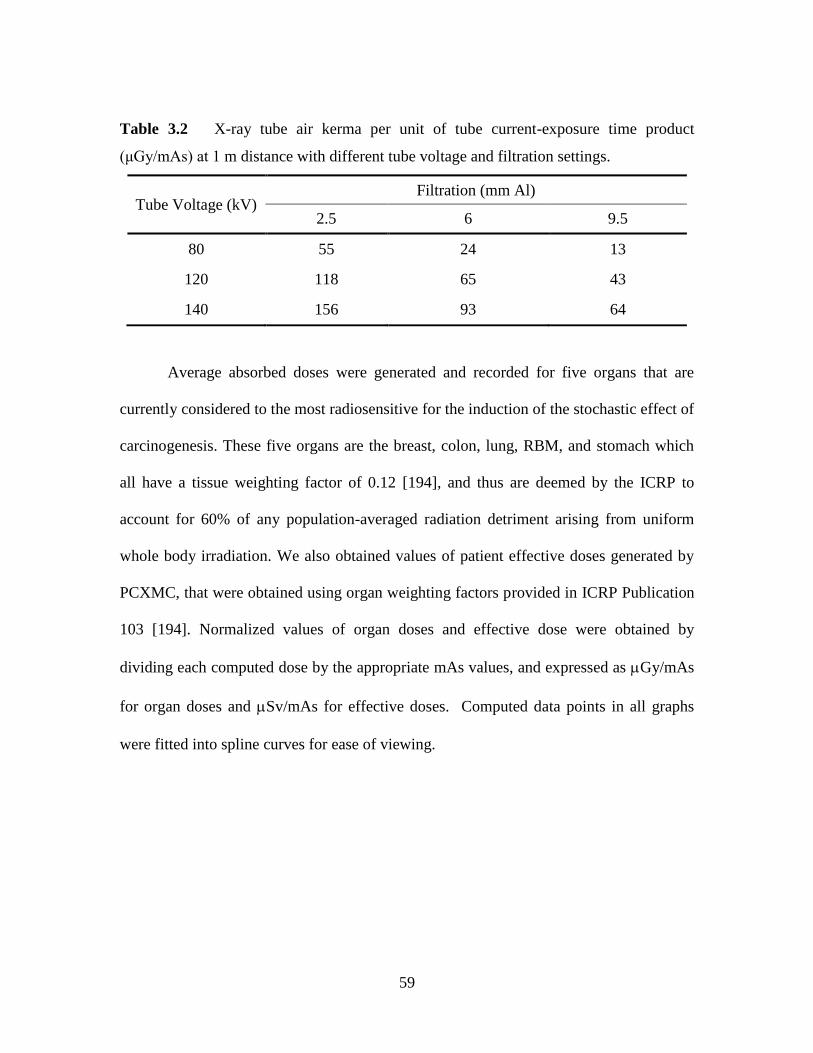
59
Table 3.2 X-ray tube air kerma per unit of tube current-exposure time product
(μGy/mAs) at 1 m distance with different tube voltage and filtration settings.
Tube Voltage (kV) Filtration (mm Al)
2.5 6 9.5
80 55 24 13
120 118 65 43
140 156 93 64
Average absorbed doses were generated and recorded for five organs that are
currently considered to the most radiosensitive for the induction of the stochastic effect of
carcinogenesis. These five organs are the breast, colon, lung, RBM, and stomach which
all have a tissue weighting factor of 0.12 [194], and thus are deemed by the ICRP to
account for 60% of any population-averaged radiation detriment arising from uniform
whole body irradiation. We also obtained values of patient effective doses generated by
PCXMC, that were obtained using organ weighting factors provided in ICRP Publication
103 [194]. Normalized values of organ doses and effective dose were obtained by
dividing each computed dose by the appropriate mAs values, and expressed as Gy/mAs
for organ doses and Sv/mAs for effective doses. Computed data points in all graphs
were fitted into spline curves for ease of viewing.
60
3.3 Results
3.3.1 Average Organ Doses
Figure 3.3 through Figure 3.7 show the absorbed doses to individual organs as a
function of X-ray projection angle, where the normalized organ doses are plotted using a
logarithmic scale. Table 3.3 provides a summary of the maximum and minimum
normalized doses and the maximum to minimum dose ratios to all five organs for the
Gantry CT and C-Arm CT geometries, respectively. Data in Table 3.3 show that
maximum to minimum ratios of organ dose as a function of x-ray tube angle () were ~
2.2 for the lungs, ~ 3.7 for the colon, ~ 5.9 for the red bone marrow, ~ 19.8 for the breast,
and ~ 36 for the stomach.
Table 3.4 shows how radiation doses to all five organs vary with the principal
projections in CT imaging (i.e., AP; PA; Lateral). Organ doses presented in Table 3.4
were normalized by the organ doses averaged over all 24 projections that we investigated.
For example, an AP projection normalized dose of 2 µGy/mAs, when the average
normalized dose per projection is 1 µGy/mAs, would be expressed as 200%. As varies,
data in Table 3.4 and Figures 3.3 through 3.7 illustrate that dose distributions for the
lung and colon are the most symmetrical, and that dose distribution for the stomach is
highly asymmetrical.
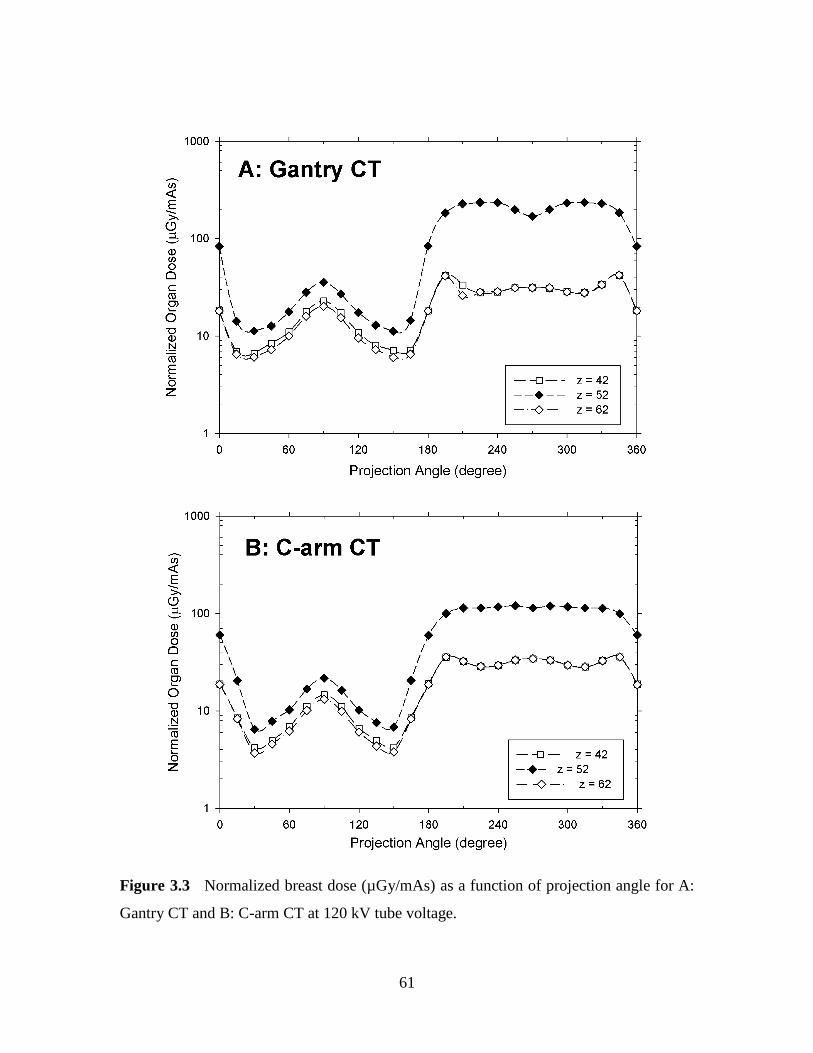
61
Figure 3.3 Normalized breast dose (µGy/mAs) as a function of projection angle for A:
Gantry CT and B: C-arm CT at 120 kV tube voltage.
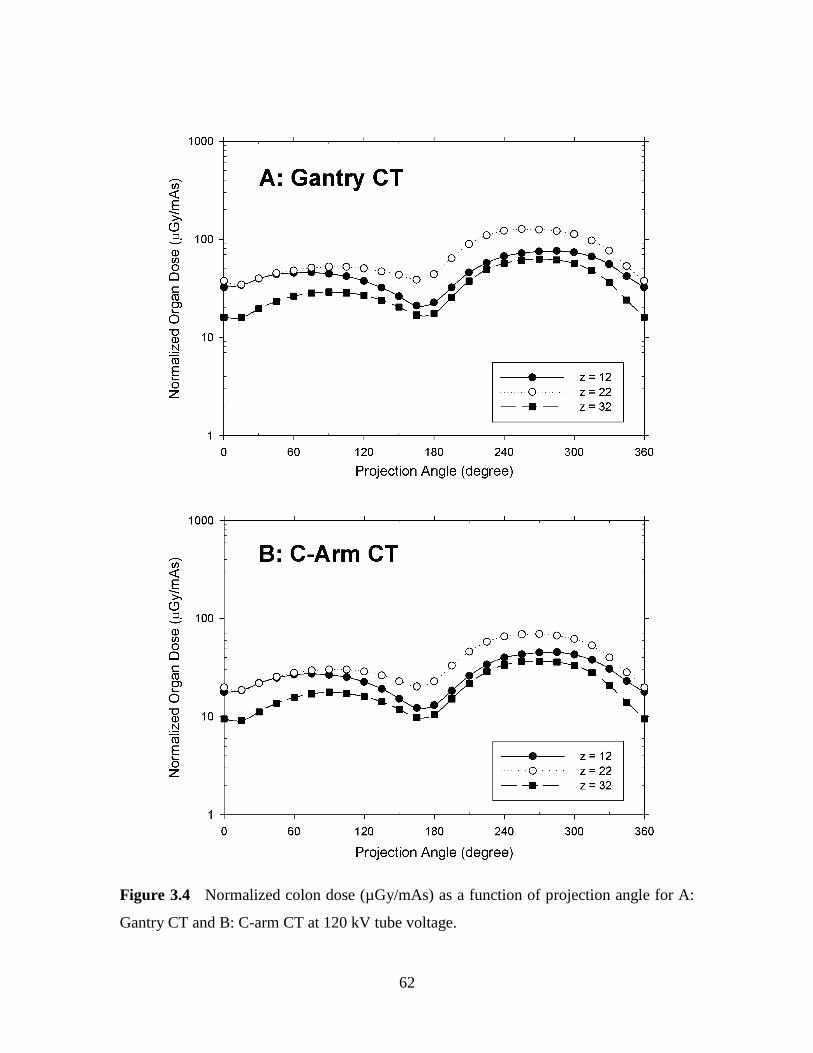
62
Figure 3.4 Normalized colon dose (µGy/mAs) as a function of projection angle for A:
Gantry CT and B: C-arm CT at 120 kV tube voltage.
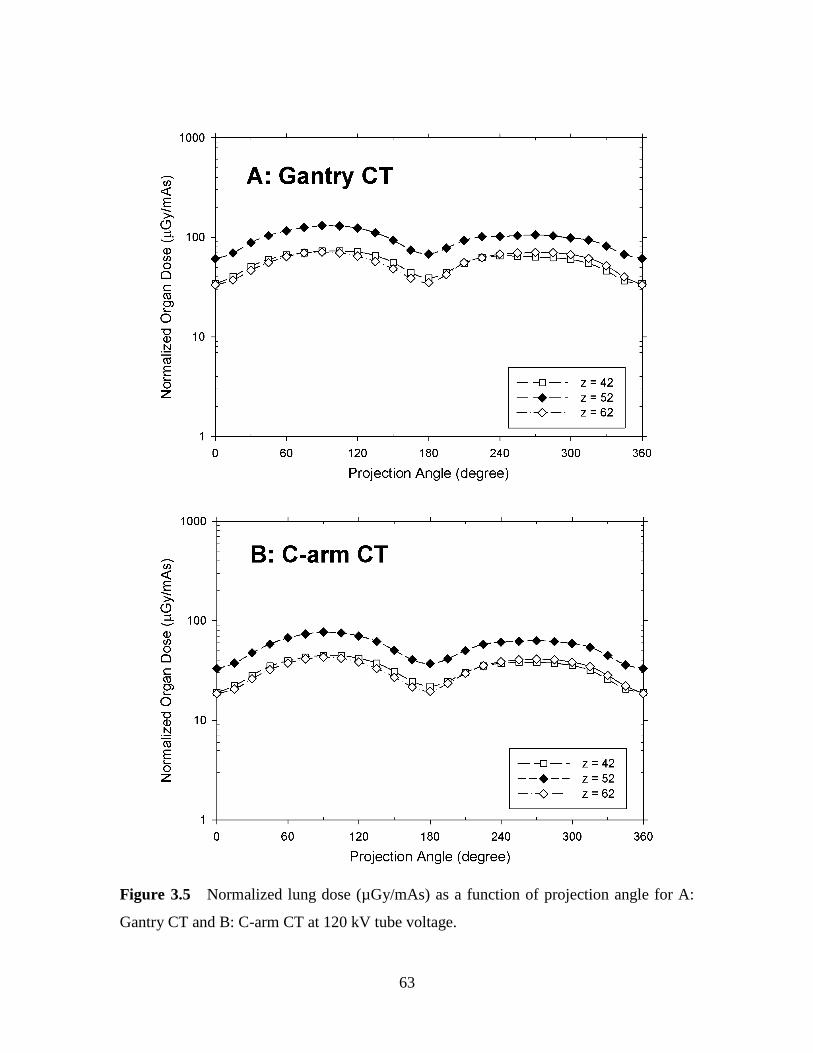
63
Figure 3.5 Normalized lung dose (µGy/mAs) as a function of projection angle for A:
Gantry CT and B: C-arm CT at 120 kV tube voltage.
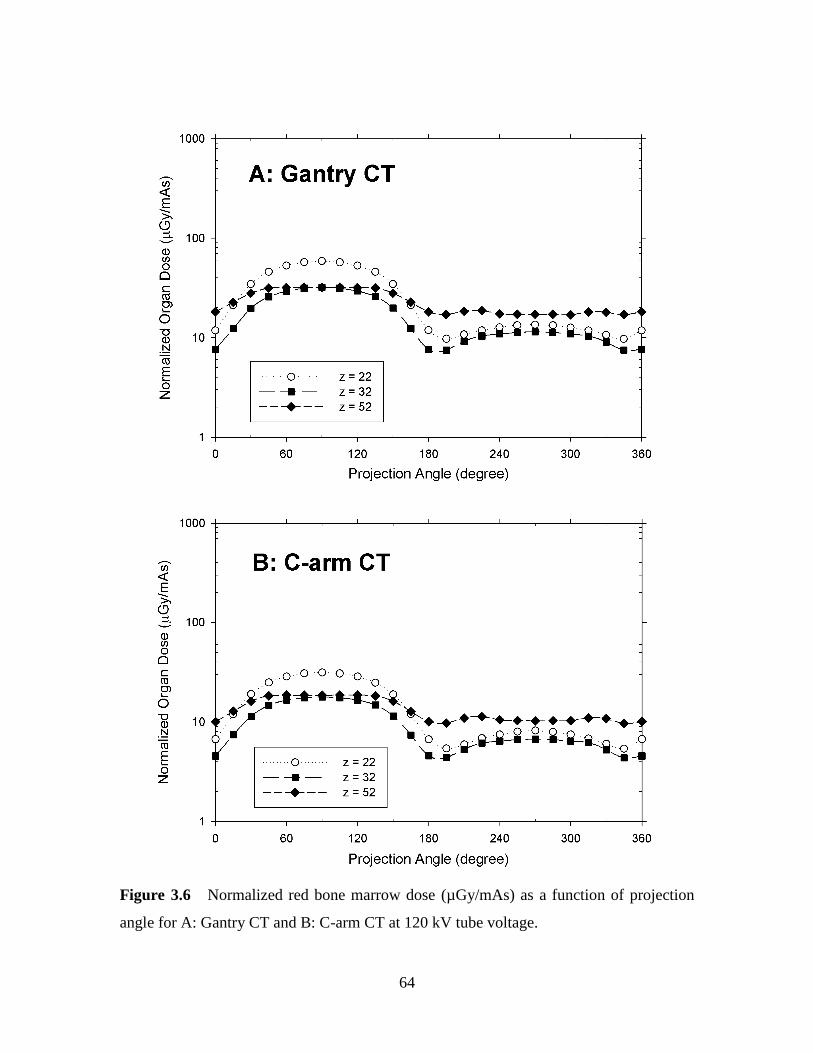
64
Figure 3.6 Normalized red bone marrow dose (µGy/mAs) as a function of projection
angle for A: Gantry CT and B: C-arm CT at 120 kV tube voltage.
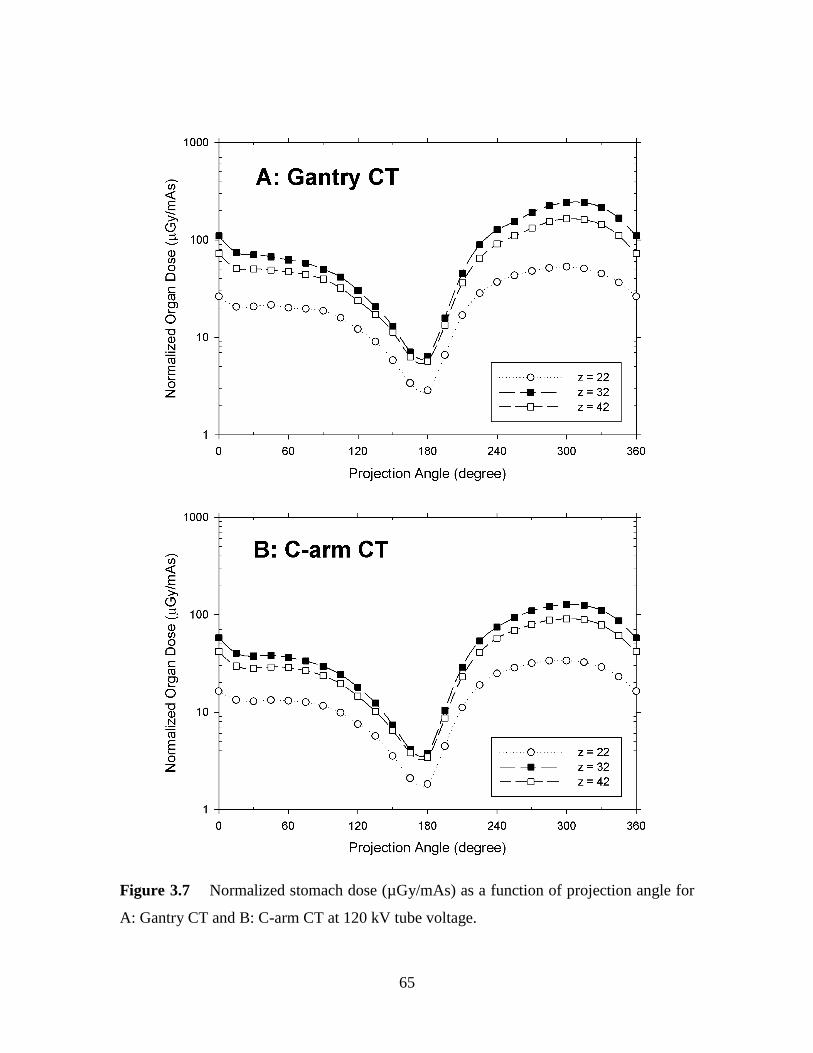
65
Figure 3.7 Normalized stomach dose (µGy/mAs) as a function of projection angle for
A: Gantry CT and B: C-arm CT at 120 kV tube voltage.

66
Table 3.3 Normalized organ dose maxima and minima for CT scans performed at 120
kV.
Organ
Gantry CT C-Arm CT
Dose
Maximum
(µGy/mAs)
Dose
Minimum
(µGy/mAs)
Ratio
Dose
Maximum
(µGy/mAs)
Dose
Minimum
(µGy/mAs)
Ratio
Breast
z = 52 235.1 11.2 21.0 120.0 6.5 18.5
Colon
z = 22 126.7 34.5 3.7 69.7 18.6 3.7
Lung
z = 52 130.9 61.2 2.1 76.7 33.1 2.3
RBM
z = 22 58.7 9.7 6.0 31.5 5.4 5.8
Stomach
z = 32 243.4 6.4 38.2 127.9 3.8 33.7
Table 3.4 Organ doses as a function of projection angle. Organ doses are expressed as a
percentage, with the average dose over all 24 projections being 100%.
Organ LLAT (0) PA (90) RLAT (180) AP (270)
Breast
z = 52 82.0% 32.7% 81.9% 161.8%
Colon
z = 22 52.9% 76.2% 61.8% 180.2%
Lung
z = 52 61.9% 136.4% 69.0% 111.4%
RBM
z = 22 45.1% 219.1% 45.2% 52.7%
Stomach
z = 32 111.6% 52.8% 6.7% 199.8%
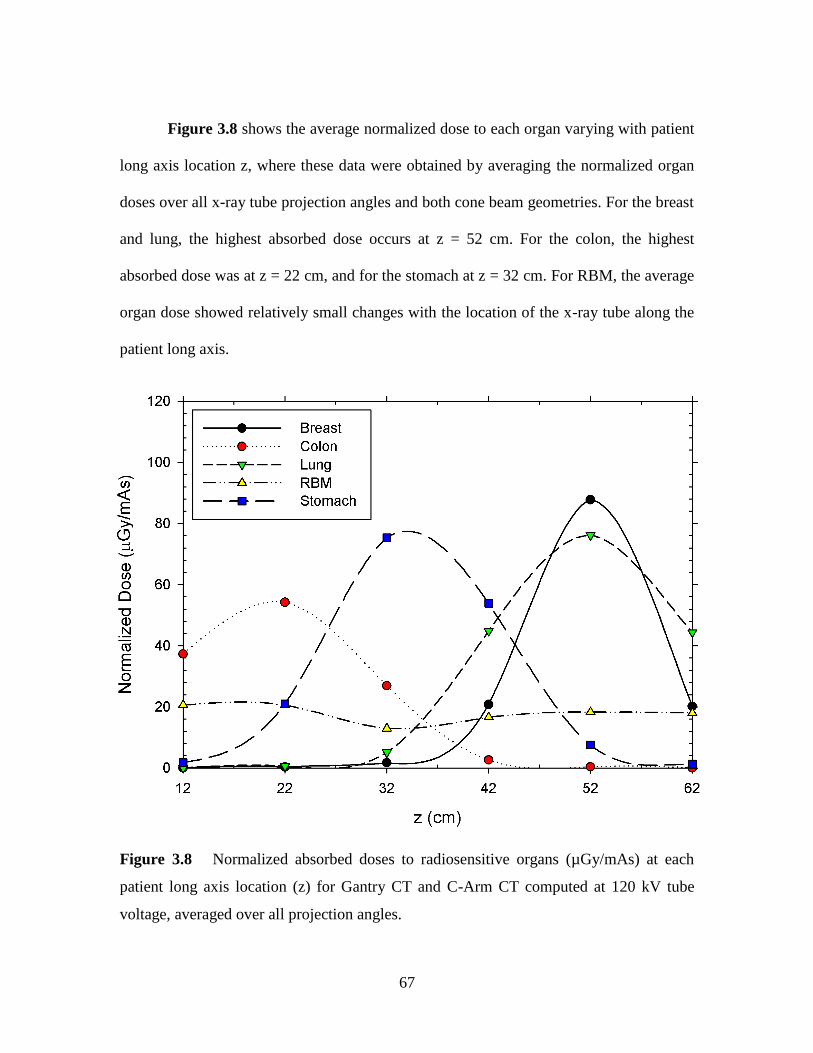
67
Figure 3.8 shows the average normalized dose to each organ varying with patient
long axis location z, where these data were obtained by averaging the normalized organ
doses over all x-ray tube projection angles and both cone beam geometries. For the breast
and lung, the highest absorbed dose occurs at z = 52 cm. For the colon, the highest
absorbed dose was at z = 22 cm, and for the stomach at z = 32 cm. For RBM, the average
organ dose showed relatively small changes with the location of the x-ray tube along the
patient long axis.
Figure 3.8 Normalized absorbed doses to radiosensitive organs (µGy/mAs) at each
patient long axis location (z) for Gantry CT and C-Arm CT computed at 120 kV tube
voltage, averaged over all projection angles.
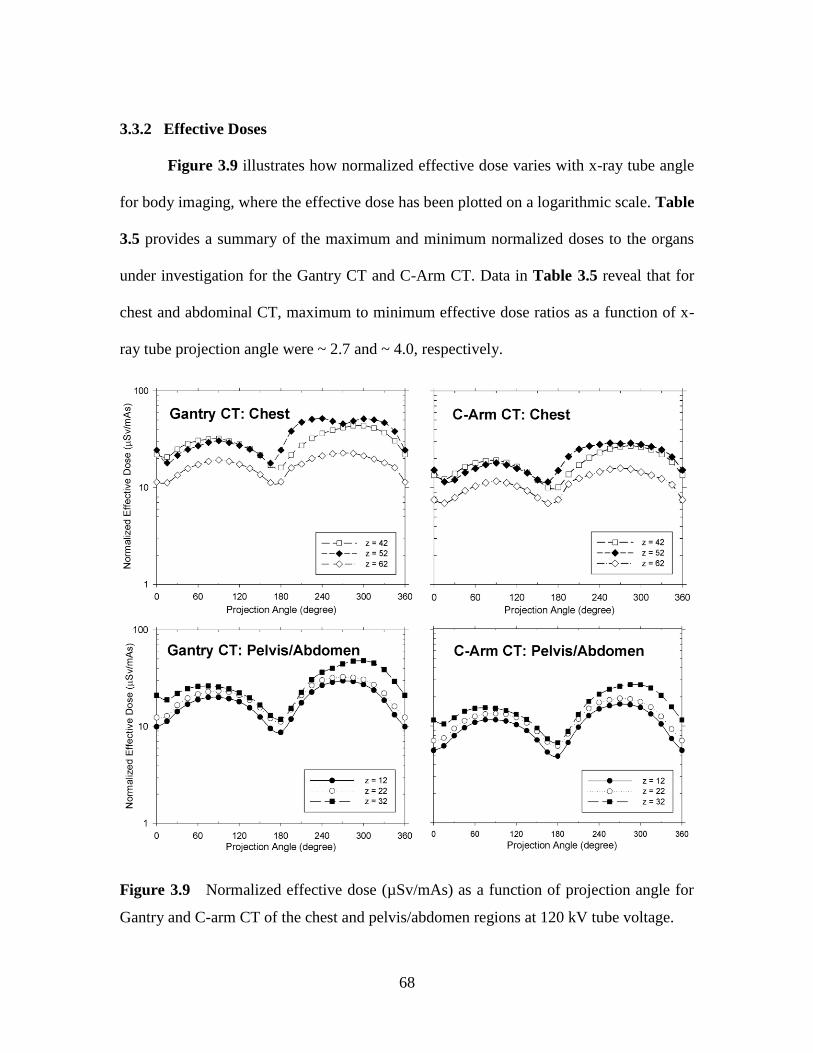
68
3.3.2 Effective Doses
Figure 3.9 illustrates how normalized effective dose varies with x-ray tube angle
for body imaging, where the effective dose has been plotted on a logarithmic scale. Table
3.5 provides a summary of the maximum and minimum normalized doses to the organs
under investigation for the Gantry CT and C-Arm CT. Data in Table 3.5 reveal that for
chest and abdominal CT, maximum to minimum effective dose ratios as a function of x-
ray tube projection angle were ~ 2.7 and ~ 4.0, respectively.
Figure 3.9 Normalized effective dose (µSv/mAs) as a function of projection angle for
Gantry and C-arm CT of the chest and pelvis/abdomen regions at 120 kV tube voltage.

69
Table 3.5 Normalized effective dose maxima and minima for Gantry CT and C-Arm CT
generated at 120 kV.
Body
Region
Gantry CT C-Arm CT
Dose
Maximum
(µSv/mAs)
Dose
Minimum
(µSv/mAs)
Ratio
Dose
Maximum
(µSv/mAs)
Dose
Minimum
(µSv/mAs)
Ratio
Chest
z = 52 51.8 17.9 2.9 29.0 11.5 2.5
Abdomen
z = 32 48.0 11.9 4.0 26.7 6.7 4.0
Table 3.6 demonstrates how normalized effective dose varies with patient long
axis dimension z. The lowest effective doses occur at z ~ 12 cm in the pelvic region, and
the highest effective doses are at z ~ 52 cm, which is the region of the breast. Overall,
body effective doses vary by no more than a factor of two when the location of the x-ray
tube is varied along the long patient axis.
Table 3.6 Normalized effective doses (µSv/mAs) averaged over angle at different z
location for Gantry CT and C-Arm CT (computed at 120 kV).
z (cm) Gantry CT C-Arm CT
12 18.6 10.5
22 21.5 12.4
32 28.0 15.9
42 30.1 18.3
52 34.9 19.9
62 17.2 11.1

70
3.3.3 X-ray Beam Quality
Figure 3.10 shows how the normalized and relative effective doses at z equal to
52 cm (corresponds to chest scan) vary with x-ray tube projection angle for the range of
x-ray tube voltage normally encountered in CT (i.e., 80 to 140 kV). Relative effective
doses were obtained by dividing normalized effective doses by the average value
obtained over all projection values, so that the average of the relative effective doses is
1.0. Increasing the x-ray tube voltage from 80 kV to 140 kV results in an approximately
five fold increase in patient doses, but relative patient doses as a function of projection
angle were approximately independent of the choice of x-ray tube voltage.
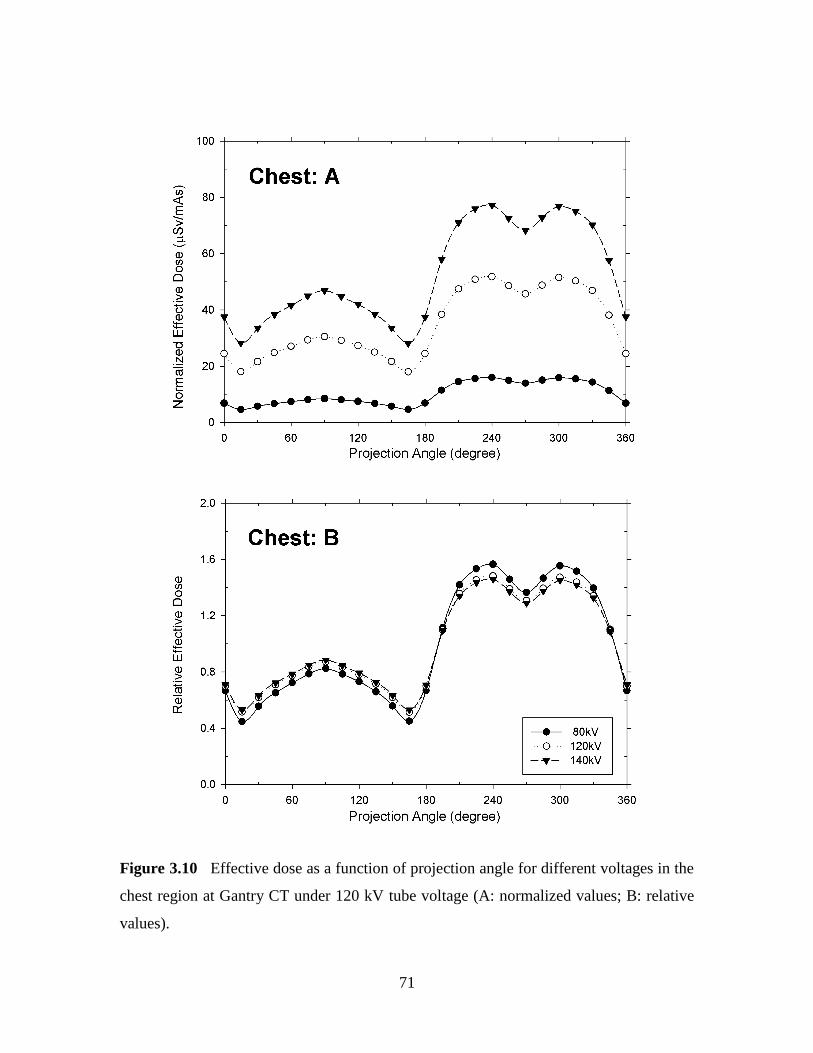
71
Figure 3.10 Effective dose as a function of projection angle for different voltages in the
chest region at Gantry CT under 120 kV tube voltage (A: normalized values; B: relative
values).
72
Figure 3.11 displays how the normalized and relative effective doses at z equal to
52 cm (corresponds to chest scan) vary with x-ray tube projection angle for x-ray tube
filtrations ranging from 2.5 mm Al to 9.5 mm Al. Increasing the x-ray tube filtration from
2.5 mm Al to 9.5 mm Al reduced patient doses by approximately a factor of two, but
relative patient doses as a function of projection angle were approximately independent
of the x-ray tube filtration.

73
Figure 3.11 Effective dose as a function of projection angle for different filtrations in
the chest region at Gantry CT under 120 kV tube voltage (A: normalized values; B:
relative values).
74
3.4 Discussion
Maximum doses for the breast, lung and stomach shown in Figure 3.8 are
approximately equal. By contrast, the maximum red bone marrow dose is about four
times lower. Cone beam CT only irradiates a fraction of RBM, whereas all of small
organs such as the stomach, or most of the larger organs such as the lung would be
irradiated. Since the computed doses are obtained by averaging the deposited energy over
the whole organ, those organs whose anatomy is larger than the x-ray beam will always
result in lower organ doses. The maximum dose to the colon is intermediate between the
higher doses to the breast, lung, and stomach, and the lower doses to the red bone marrow.
The colon is relatively large with a long axis extent of ~ 27 cm, is not compact and is
adjacent to a significant amount of bone in the pelvis. All of these three factors would
likely to reduce organ doses in cone beam CT relative to organs such as the breast,
stomach, and lung.
There were only very minor differences between the two gantries for the angles at
which any given organ dose was highest and lowest. The average of the dose maxima for
the two cone beam CT geometries (i.e., Gantry CT/C-Arm CT) for the five organs
investigated (Table 3.2) was 1.85 ± 0.10. The ratio of the focus to isocenter distances for
the two geometries is 1.38 (i.e., 78.5/57), which would be expected to result in X-ray tube
output differences of a factor of 1.89. In our simulations, organ doses were predominantly
affected by choice of focus to isocenter distance. Partial irradiation of organs and tissues
in our study did not result in any marked differences in the doses to the five most
radiosensitive organs. However, when smaller organs such as the gonads are irradiated,
75
potential difference in organ doses caused by geometric factors could be possible.
Our data covered only the five most sensitive organs in the body, including
superficial organs such as the breast, extended organs such as the red bone marrow, and
organs that have moderate size such as the stomach. Organs and tissues that are of lesser
importance for patient carcinogenic risk estimation purposes include the thyroid, liver,
bladder, and esophagus. These latter organs, which would account for about 22% of the
total cancer radiation risk from uniform irradiation, were not explicitly investigated.
Knowledge of the anatomical location and physical characteristics of any organ [199]
could be combined with our data to offer guidance regarding the expected variation of
dose to such organs as a function of projection angle. For example, the ratio of bladder
dose as a function of x-ray tube angle would most likely be similar to our data on the
stomach, given the general similarity of the sizes and radial locations of these two organs.
Quantitative radiation risk estimates require organ doses, and must take into
account both the age and sex of any exposed individual. The radiation risk for breast
cancer, for example, varies by two orders of magnitude between the ages of 20 and 80,
and is much lower in males than in females [73]. Organ dose data presented in Figures
3.3 through 3.8 can be used to evaluate how tube current modulation schemes might
impact on patient radiation risk. Switching off the x-ray tube for a total of 60 for AP
projections (i.e., 240 to 300) and compensating for this by doubling the tube current for
PA projections (i.e., 60 to 120) is technically possible in cone beam CT [185]. Use of
this modulation would reduce breast doses, and the corresponding breast cancer radiation
risks, by about 30%.
76
Variations in effective dose with x-ray tube projection angle are generally much
smaller than those for organs and tissues such as the breast and stomach. This is to be
expected, given that the effective dose takes into account all irradiated organs and tissues.
Switching off the x-ray tube for 60 for AP projections (i.e., 240 to 300) and doubling
the tube current for the PA projections to 60 degree (i.e., 60 to 120) would reduce body
effective doses by ~ 15%. It is important to note that although computed effective doses
are not radiation risk quantities, they provide a general estimate of the amount of
radiation received by a patient in a given examination [48]. Effective doses can be used to
compare doses from disparate types of radiological examinations such as a chest
radiograph, chest CT scan, and a nuclear medicine ventilation/perfusion scan [44, 200].
Effective doses may also be compared with other benchmark doses such as natural
background and regulatory dose limits. In the US, for example, natural background
exposure is ~ 3 mSv/year [177], and annual regulatory dose limits are 50 mSv/year for
radiation workers and 1 mSv/year for members of the public [192].
Data in Figures 3.10 and 3.11 exhibit the expected changes in absolute values of
effective dose with x-ray beam quality. Relative effective doses in chest CT as a function
of x-ray tube angle are approximately independent of x-ray beam quality. We also
investigated the behavior of absolute and relative dose with x-ray beam quality in
abdominal CT. The results obtained in abdominal CT were qualitatively and
quantitatively similar to the ones depicted in Figures 3.10 and 3.11. Since effective doses
are computed on the basis of individual organ doses, it is also likely that relative organ
doses as a function of x-ray tube angle are approximately independent of x-ray beam
77
quality. In cone beam CT, organ or effective dose savings achievable from the use of
angular beam modulation are likely independent of x-ray beam quality.
3.5 Conclusion
There are major differences in organ and effective dose as the x-ray tube rotates
around the patient. Our results suggest that the use of x-ray tube current modulation could
produce substantial reductions in organ and effective dose for body imaging with cone
beam CT.
Our data permit researchers and CT designers to quantify how specific x-ray tube
current modulation schemes will impact on patient dose. Data presented in Figures 3.3
through 3.8, together with the ratios presented in Table 3.3, permit a quantification of
how mA modulation schemes in cone beam CT will affect patient risks, taking into
account patient demographics. Data presented in Figure 3.9 and Table 3.4 permit
quantification of how mA modulation schemes will impact on patient effective doses.
Understanding how organ and effective doses are impacted by x-ray tube current
modulation is important for management of patient doses in cone beam CT. Optimizing
the design and operation of cone beam CT scanners will help minimize patient doses
without adversely impacting diagnostic performance [201].
78
CHAPTER 4 X-RAY TUBE CURRENT MODULATION AND PATIENT DOSES
IN CHEST CT
4.1 Introduction
Clinical use of CT imaging has grown substantially over the past 30 years and it is
now estimated that nearly 70 million examinations are performed in the United States
every year [177]. For indicated examinations there is a duty by the medical imaging
community to minimize the amount of radiation used to perform examinations that use
ionizing radiations without sacrificing valuable diagnostic information required for
optimal patient care [202]. Optimization of indicated radiological examinations is known
as keeping patient exposures ALARA (As Low As Reasonable Achievable) by
elimination of all unnecessary radiation [179, 203].
Tube current modulation (mA modulation) has recently been introduced into
clinical practice since it can reduce patient dose without sacrificing image quality or
diagnostic performance [204, 205]. Tube current modulation reduces tube current (i.e., x-
ray) intensity for less attenuating path lengths through the patient, and increase tube
currents for path lengths that have greater attenuation [180, 206]. Chest CT is an area
where x-ray tube current modulation is likely to have high dose savings [207]. The chest
and adjacent region contains a number of radiosensitive organs and tissues, including the
female breast, lungs, red bone marrow, the stomach, and the thyroid gland [194]. There
are marked differences in x-ray beam attenuation in the chest region as a function of x-
ray tube angle as well as along the patient axis [206, 208]. Knowledge of how patient
effective doses vary with x-ray tube projection angle as well as longitudinal x-ray tube
79
location are important prerequisites for quantifying potential patient dose savings that
may be achieved by any tube current modulation scheme [209].
In this paper we investigate how patient effective doses vary as a function of x-ray
projection angle as well as long patient axis for the irradiation geometry of a conventional
CT scanner used to perform chest CT examinations. Relative effective dose data are
combined with longitudinal and angular modulation schemes to shed light on the
quantitative dose savings that tube current modulation schemes could offer to adult
patients undergoing chest CT examinations.
4.2 Methods
4.2.1 CT Simulations
We used software package PCXMC 2.0.1 developed by STUK (Radiation and
Nuclear Safety Authority, Helsinki, Finland), to calculate patient doses in any type of
simulated x-ray examinations. PCXMC calculates absorbed doses to organs that of
interest in radiological protection, as well as the corresponding effective dose obtained
using ICRP 103 tissue weighting factors [194]. In this study, we used an adult phantom
with the height of 178.6 cm and mass of 73.2 kg, and whose arms were in place at the
phantom sides [195, 210]. Figure 4.1 shows the mathematical anthropomorphic phantom
which ranges from the base of the lung (z = 36) to the shoulder region (z = 72). The lungs
extend from z = 43.5 to z = 67.5; the heart extends from z = 44 to z = 56.
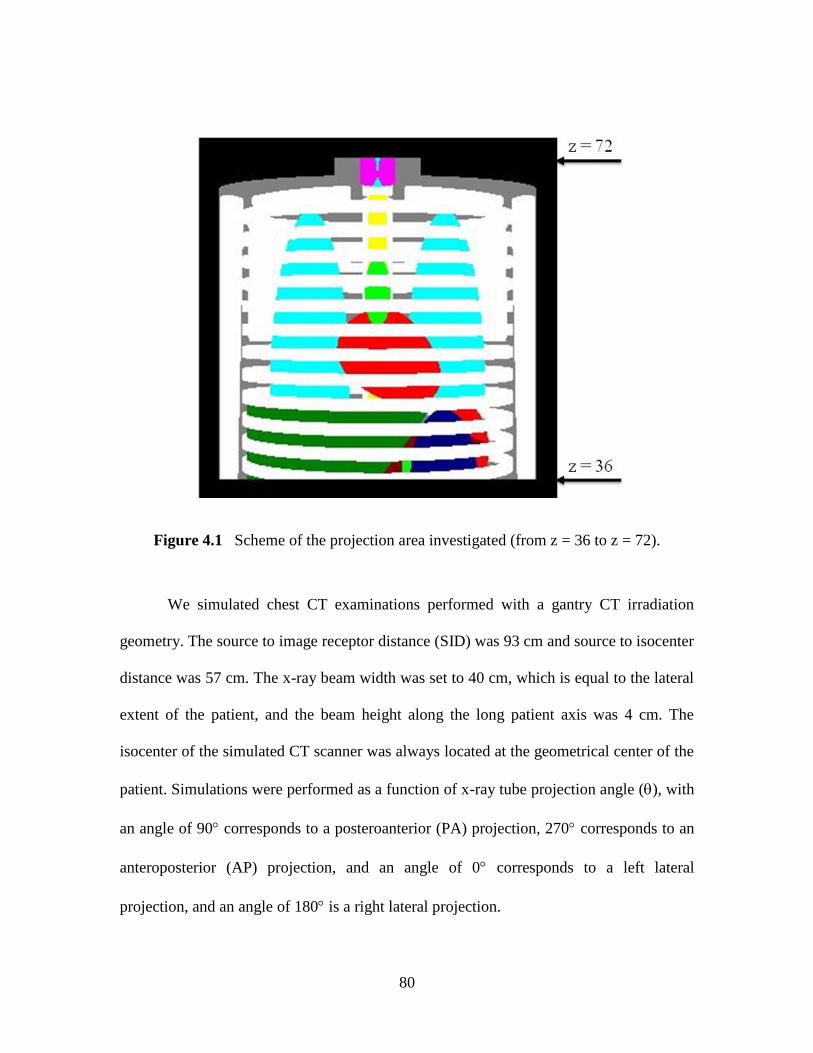
80
Figure 4.1 Scheme of the projection area investigated (from z = 36 to z = 72).
We simulated chest CT examinations performed with a gantry CT irradiation
geometry. The source to image receptor distance (SID) was 93 cm and source to isocenter
distance was 57 cm. The x-ray beam width was set to 40 cm, which is equal to the lateral
extent of the patient, and the beam height along the long patient axis was 4 cm. The
isocenter of the simulated CT scanner was always located at the geometrical center of the
patient. Simulations were performed as a function of x-ray tube projection angle (), with
an angle of 90 corresponds to a posteroanterior (PA) projection, 270 corresponds to an
anteroposterior (AP) projection, and an angle of 0 corresponds to a left lateral
projection, and an angle of 180 is a right lateral projection.
81
4.2.2 Effective Doses
All patient dose calculations were performed using an x-ray tube voltage of 120
kV which is the value most commonly employed in clinical chest CT scanning [207]. The
x-ray tube employed a tungsten target with a 15 anode angle, with a total of 8 mm
aluminium filtration. No beam shaping filter was used in our dose computations. A
constant x-ray tube current-time product was used for each projection. Each individual
dose calculations made use of approximately 2 million photons, and required a
processing time of ~ 60 seconds on a 3 GHz dual-core CPU PC with an 8GB RAM.
At each long patient axis location, effective doses were determined at 15
intervals of the angle which ranged from 0 to 345, and resulted in 24 values of
effective dose at a constant x-ray tube output. We also computed effective doses at nine
locations of the patient long axis location from z = 38 to z = 70, where a value of z = 32
represents an x-ray beam that extends from z = 30 to z = 34. The long patient axis range
(z = 36 to z = 72) corresponds to a scan length of 36 cm.
4.2.3 Tube Current Modulation
Table 4.1 shows the angular modulation schemes investigated. Each column in
Table 4.1 shows the angular modulation scheme which specifies the weighting to be
allocated to each of the 24 angles. The lowest weightings are allocated to the AP and PA
projections, and the highest weightings are allocated to the lateral projections. Table 4.2
shows the longitudinal modulation schemes that were investigated. Data in each column
in Table 4.2 specify the relative weightings allocated to each of the nine long patient axis
82
locations. The lowest weightings are allocated to the regions where x-ray transmission is
increased (z = 54 to 58 in Figure 4.1), and the highest weightings are allocated to
shoulder (z ~ 70) and abdominal (z ~ 38) regions. For each column in Tables 4.1 and 4.2,
the average weighting is equal to unity, and the ratio of the maximum to minimum
weighting value (modulation amplitude) is R, where the latter ranges from 1.5 to 5.
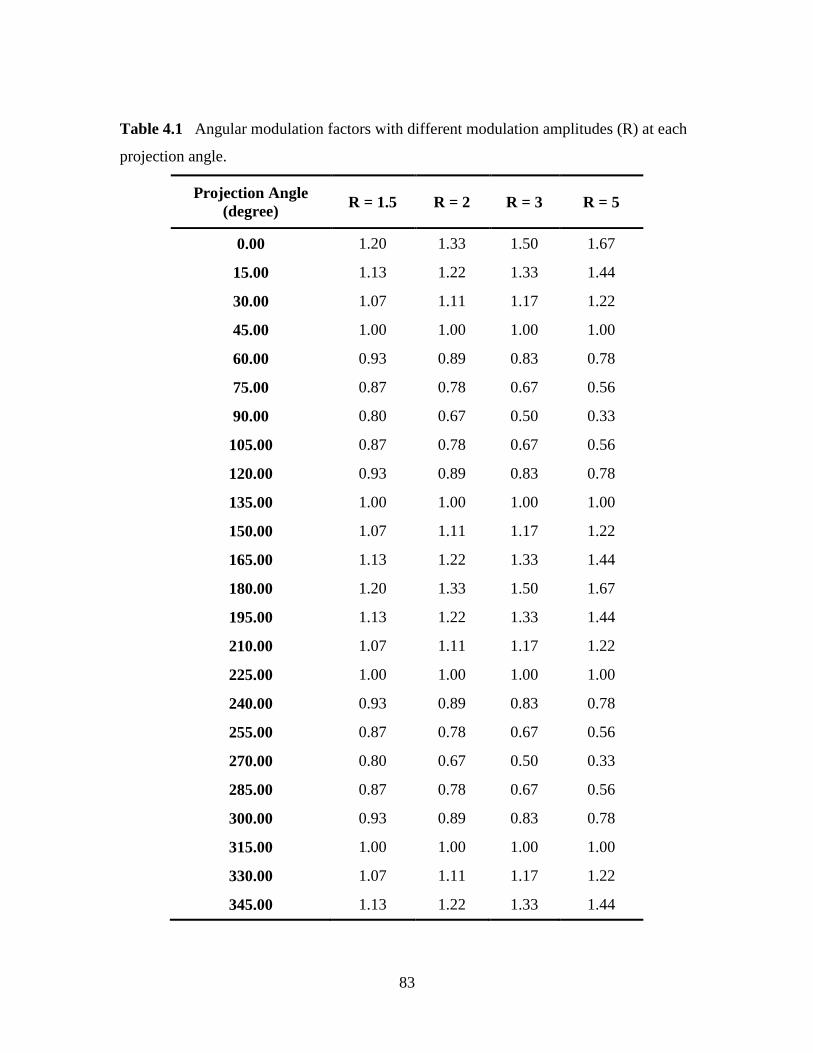
83
Table 4.1 Angular modulation factors with different modulation amplitudes (R) at each
projection angle.
Projection Angle
(degree) R = 1.5 R = 2 R = 3 R = 5
0.00 1.20 1.33 1.50 1.67
15.00 1.13 1.22 1.33 1.44
30.00 1.07 1.11 1.17 1.22
45.00 1.00 1.00 1.00 1.00
60.00 0.93 0.89 0.83 0.78
75.00 0.87 0.78 0.67 0.56
90.00 0.80 0.67 0.50 0.33
105.00 0.87 0.78 0.67 0.56
120.00 0.93 0.89 0.83 0.78
135.00 1.00 1.00 1.00 1.00
150.00 1.07 1.11 1.17 1.22
165.00 1.13 1.22 1.33 1.44
180.00 1.20 1.33 1.50 1.67
195.00 1.13 1.22 1.33 1.44
210.00 1.07 1.11 1.17 1.22
225.00 1.00 1.00 1.00 1.00
240.00 0.93 0.89 0.83 0.78
255.00 0.87 0.78 0.67 0.56
270.00 0.80 0.67 0.50 0.33
285.00 0.87 0.78 0.67 0.56
300.00 0.93 0.89 0.83 0.78
315.00 1.00 1.00 1.00 1.00
330.00 1.07 1.11 1.17 1.22
345.00 1.13 1.22 1.33 1.44

84
Table 4.2 Longitudinal modulation factors with different amplitudes (R) at each patient
long axis positions (z).
z (cm) R = 1.5 R = 2 R = 3 R = 5
38 1.18 1.30 1.46 1.64
42 1.18 1.30 1.46 1.64
46 0.96 0.92 0.84 0.73
50 0.96 0.92 0.84 0.73
54 0.79 0.65 0.49 0.33
58 0.79 0.65 0.49 0.33
62 0.92 0.87 0.81 0.76
66 1.05 1.08 1.14 1.20
70 1.18 1.30 1.46 1.64
We investigated the importance of angular modulation alone, longitudinal
modulation alone, as well as the combination of both angular and longitudinal
modulation. Calculations were performed for a range of modulation intensities as defined
by the parameter R. A value of R equal to 1 corresponds to no tube current modulation.
We also investigated the use of modulation schemes designed to minimize patient doses
by switching off the x-ray beam at the projection angles that have the highest doses, and
compensating for this by doubling the x-ray beam intensity for the opposite projections.
A review was performed of published modulation schemes in the scientific
literature that pertain to chest CT examinations in normal sized adult patients to obtain
values of R that are used in current longitudinal and angular modulation schemes in chest
CT examinations [187, 206, 209, 211]. Values of R for longitudinal modulation were
obtained by comparing the maximum to minimum tube currents along the patient axis
85
within the chest region. In clinical practice, angular modulation varies with long patient
axis location (z). For angular modulation, we therefore obtained a range of R values that
span the range of the largest and smallest amounts of angular modulation within the chest
region.
4.3 Results
4.3.1 Relative Effective Doses
Values of relative effective dose as a function of x-ray tube angle, and long
patient axis, are summarized in Table 4.3. As expected, effective dose maxima occur for
AP projections at the location of the breasts (i.e., z ~ 52; projection angle ~ 210° and ~
330°). The lowest effective doses are at 30° and 150° (oblique angles) which are the
projections that would minimize the absorbed doses to the radiosensitive breasts.
Figure 4.2A shows effective dose as a function of projection angle when
averaged over all 9 long patient axis values. Figure 4.2B shows how the effective dose
varies with long patient axis location when averaged over all 24 x-ray tube projection
angles. The lines shown in Figure 4.2 are fitted spline curves added for ease of viewing.
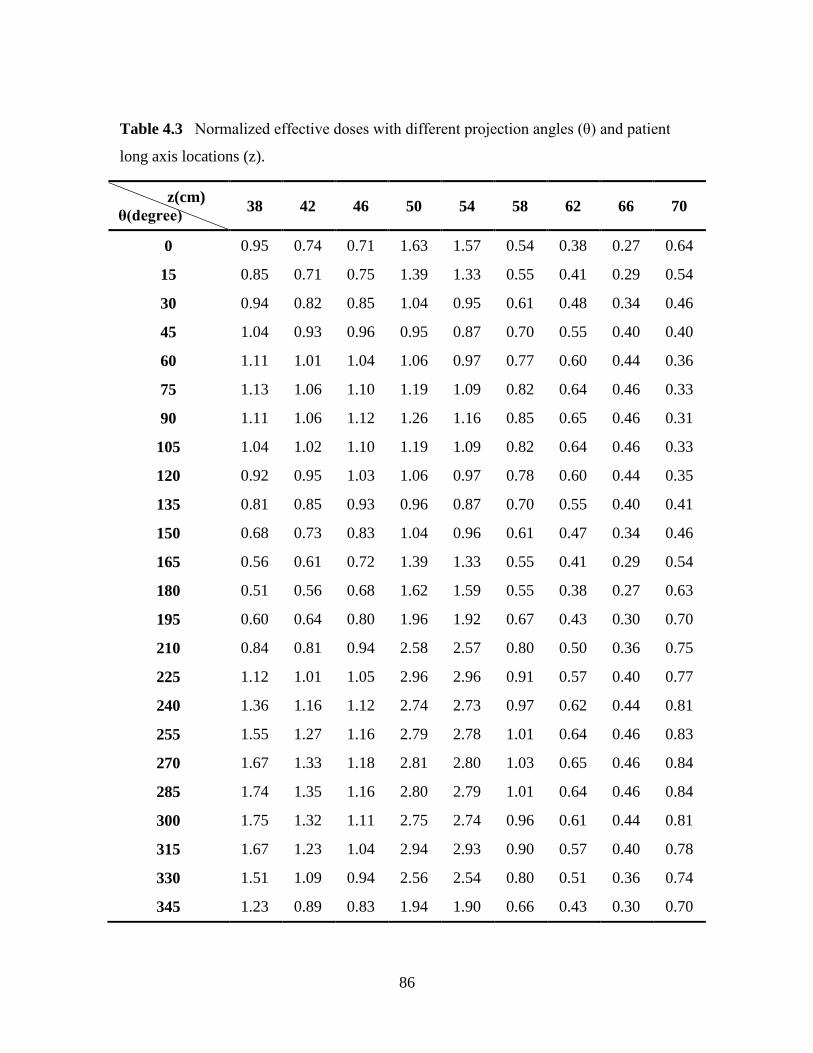
86
Table 4.3 Normalized effective doses with different projection angles (θ) and patient
long axis locations (z).
z(cm)
θ(degree) 38 42 46 50 54 58 62 66 70
0 0.95 0.74 0.71 1.63 1.57 0.54 0.38 0.27 0.64
15 0.85 0.71 0.75 1.39 1.33 0.55 0.41 0.29 0.54
30 0.94 0.82 0.85 1.04 0.95 0.61 0.48 0.34 0.46
45 1.04 0.93 0.96 0.95 0.87 0.70 0.55 0.40 0.40
60 1.11 1.01 1.04 1.06 0.97 0.77 0.60 0.44 0.36
75 1.13 1.06 1.10 1.19 1.09 0.82 0.64 0.46 0.33
90 1.11 1.06 1.12 1.26 1.16 0.85 0.65 0.46 0.31
105 1.04 1.02 1.10 1.19 1.09 0.82 0.64 0.46 0.33
120 0.92 0.95 1.03 1.06 0.97 0.78 0.60 0.44 0.35
135 0.81 0.85 0.93 0.96 0.87 0.70 0.55 0.40 0.41
150 0.68 0.73 0.83 1.04 0.96 0.61 0.47 0.34 0.46
165 0.56 0.61 0.72 1.39 1.33 0.55 0.41 0.29 0.54
180 0.51 0.56 0.68 1.62 1.59 0.55 0.38 0.27 0.63
195 0.60 0.64 0.80 1.96 1.92 0.67 0.43 0.30 0.70
210 0.84 0.81 0.94 2.58 2.57 0.80 0.50 0.36 0.75
225 1.12 1.01 1.05 2.96 2.96 0.91 0.57 0.40 0.77
240 1.36 1.16 1.12 2.74 2.73 0.97 0.62 0.44 0.81
255 1.55 1.27 1.16 2.79 2.78 1.01 0.64 0.46 0.83
270 1.67 1.33 1.18 2.81 2.80 1.03 0.65 0.46 0.84
285 1.74 1.35 1.16 2.80 2.79 1.01 0.64 0.46 0.84
300 1.75 1.32 1.11 2.75 2.74 0.96 0.61 0.44 0.81
315 1.67 1.23 1.04 2.94 2.93 0.90 0.57 0.40 0.78
330 1.51 1.09 0.94 2.56 2.54 0.80 0.51 0.36 0.74
345 1.23 0.89 0.83 1.94 1.90 0.66 0.43 0.30 0.70
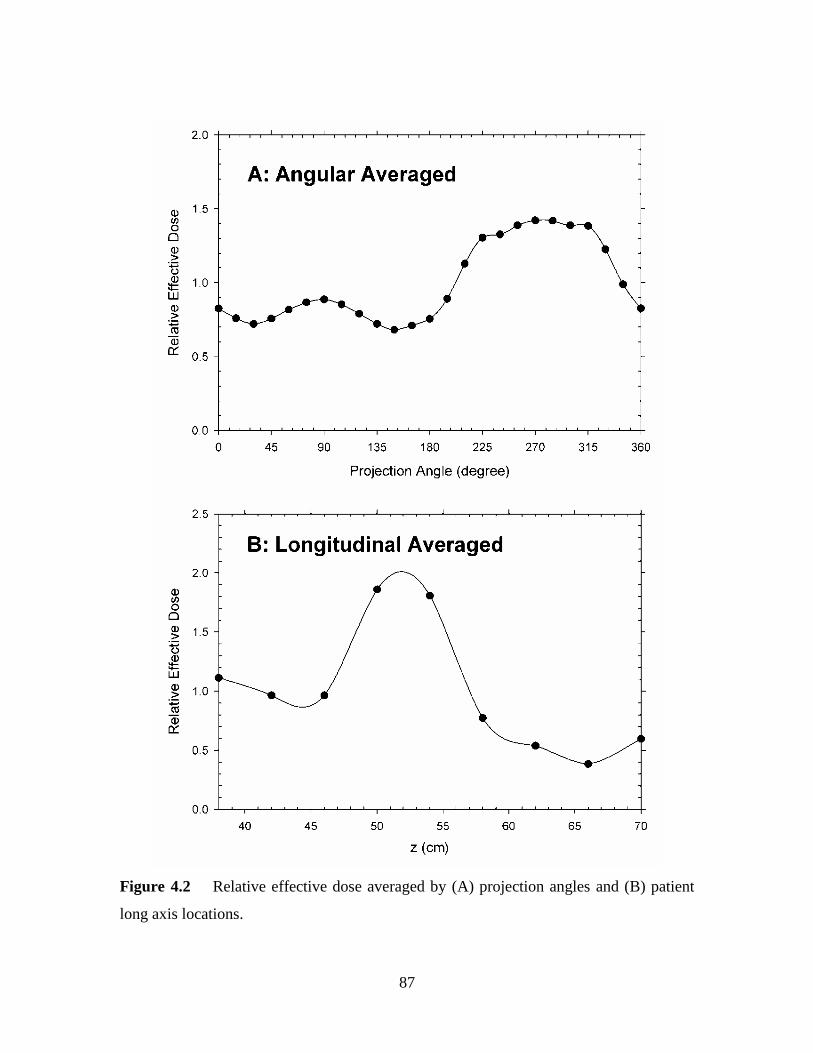
87
Figure 4.2 Relative effective dose averaged by (A) projection angles and (B) patient
long axis locations.
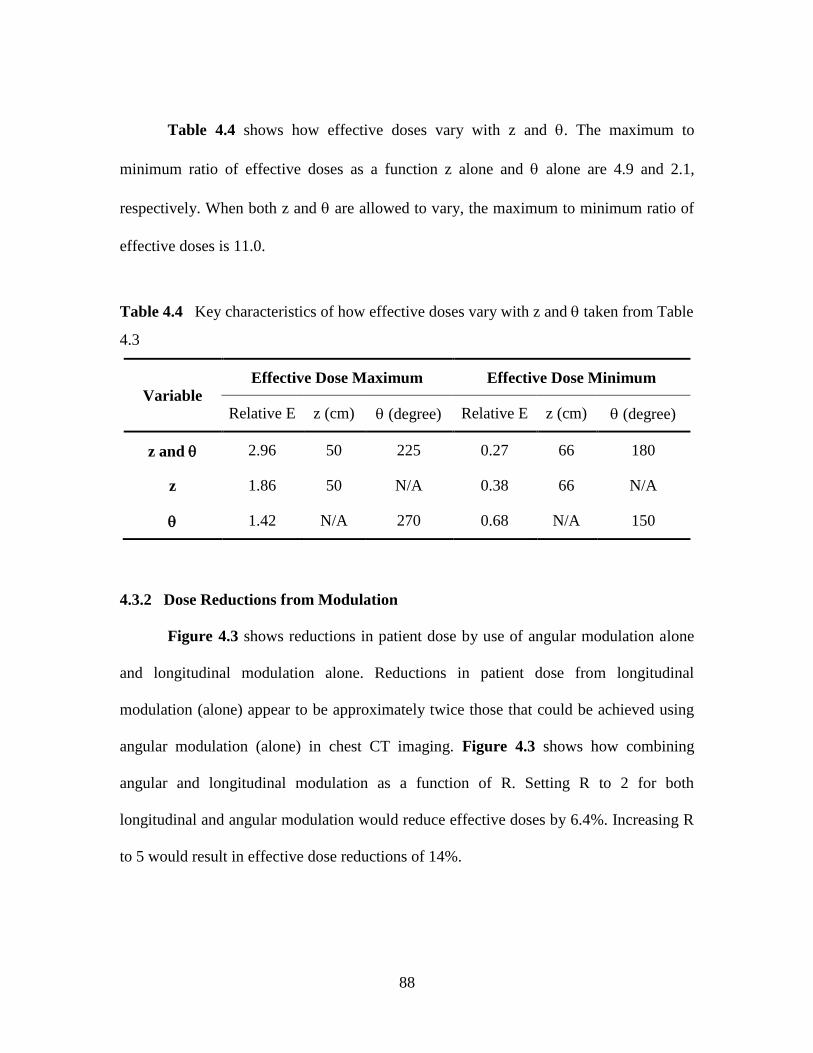
88
Table 4.4 shows how effective doses vary with z and . The maximum to
minimum ratio of effective doses as a function z alone and alone are 4.9 and 2.1,
respectively. When both z and are allowed to vary, the maximum to minimum ratio of
effective doses is 11.0.
Table 4.4 Key characteristics of how effective doses vary with z and taken from Table
4.3
Variable
Effective Dose Maximum Effective Dose Minimum
Relative E z (cm) (degree) Relative E z (cm) (degree)
z and 2.96 50 225 0.27 66 180
z 1.86 50 N/A 0.38 66 N/A
1.42 N/A 270 0.68 N/A 150
4.3.2 Dose Reductions from Modulation
Figure 4.3 shows reductions in patient dose by use of angular modulation alone
and longitudinal modulation alone. Reductions in patient dose from longitudinal
modulation (alone) appear to be approximately twice those that could be achieved using
angular modulation (alone) in chest CT imaging. Figure 4.3 shows how combining
angular and longitudinal modulation as a function of R. Setting R to 2 for both
longitudinal and angular modulation would reduce effective doses by 6.4%. Increasing R
to 5 would result in effective dose reductions of 14%.

89
Figure 4.3 Dose saving rate resulted from angular modulation, longitudinal modulation
and combined modulation with different modulation amplitudes (R).
Table 4.5 shows how patient effective doses could be reduced by switching off
the x-ray tube current for the most sensitive projections (AP), and doubling the x-ray
beam current for the opposite projections. As the angular range over which the x-ray
beam is switched off increases from 30 to 90, patient doses reduction rate increases
from 6.8% to 16.4%.

90
Table 4.5 Reductions in effective doses from a modulation scheme where the tube
current is switched off for the most sensitive projections and doubled for the opposite
projections.
Scheme 1 Scheme 2 Scheme 3
Switched off projection angles 255 to 285 240 to 340 225 to 315
Current doubled projection angles 75 to 105 60 to 120 45 to 135
Angular range (AP) of modulation 30 60 90
Effective dose reduction rate (%) 6.8 11.4 16.4
Table 4.6 summarizes R values estimated from graphical variations of x-ray tube
currents in chest CT examinations taken from the scientific literature [187, 206, 209, 211].
Average value of R for longitudinal modulation is 2.2, and average values of R for
angular modulation schemes range from a minimum of 1.5 to a maximum of 3.4. Data
shown in Figure 4.3 permit a modulation R value to be converted into a corresponding
patient effect dose reduction value. Current longitudinal x-ray tube current modulation
schemes (Table 4.6) reduce patient effective doses by ~ 7%, and current angular x-ray
tube current modulation schemes reduce patient effective doses by between 1.5% and 4%.

91
Table 4.6 Modulation amplitudes (R) obtained from published figures
with clinical mA modulation in chest CT examination.
Reference
Modulation Parameter R
Angular
(Max)
Angular
(Min) Longitudinal
Angel et al
(2009) 1.7 1.2 2.9
Hundt et al
(2005) 4.2 1.6 1.3
McCollough et al
(2006) 4.2 1.3 2.4
Straten et al
(2009) 3.4 1.8 2.0
Average 3.4 1.5 2.2
4.4 Discussion
Data presented in Table 4.3 shows how patient effective doses, obtained using the
most recent ICRP 103 tissue weighting factors [194], vary with x-ray tube angle and x-
ray tube location along the patient axis. The absolute maximum to minimum ratio of
effective doses was 11, showing that modulation of the x-ray tube current could offer
substantial dose savings. It is also evident that variations of the maximum to minimum
ratio of effective doses along the long patient axis z are more than double as large as
those around the patient. These data therefore suggest that, in principle, longitudinal
modulation has the potential for larger dose savings when compared with angular
modulation alone.
Our tube current modulations were designed to highlight both qualitative and
quantitative features likely to be obtained from the use of x-ray tube current modulation
in chest CT. Data presented in Figure 4.3 show how reductions in patient effective dose
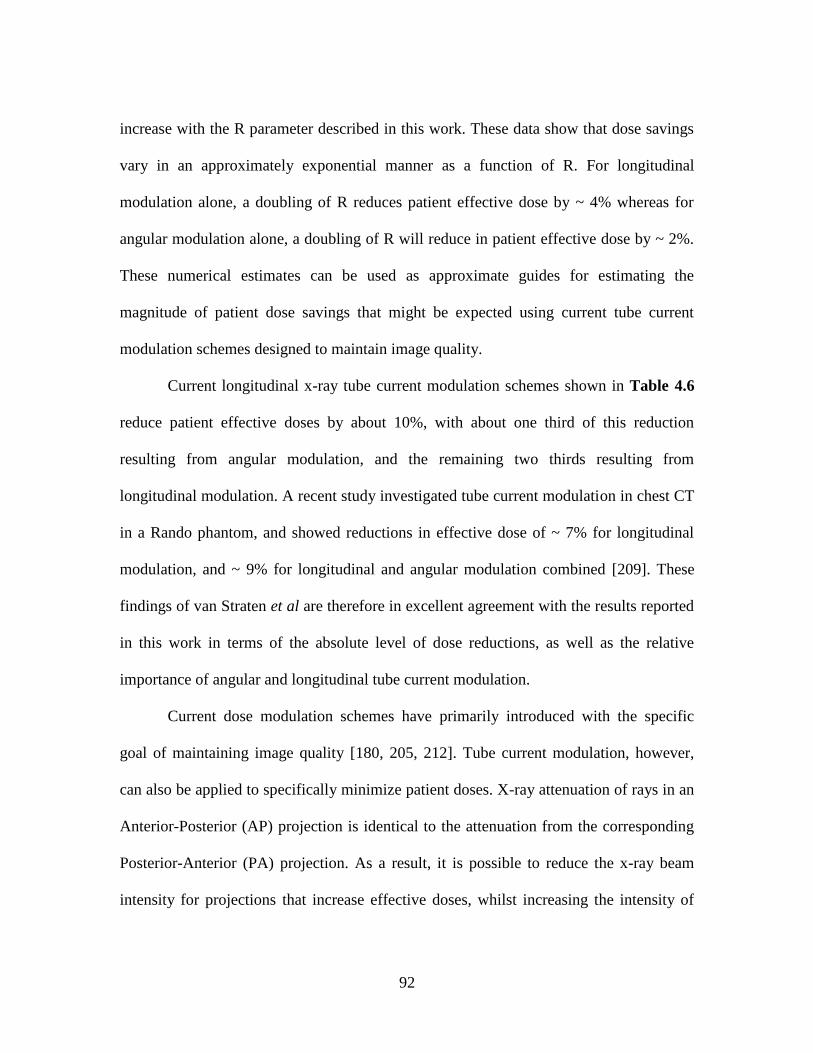
92
increase with the R parameter described in this work. These data show that dose savings
vary in an approximately exponential manner as a function of R. For longitudinal
modulation alone, a doubling of R reduces patient effective dose by ~ 4% whereas for
angular modulation alone, a doubling of R will reduce in patient effective dose by ~ 2%.
These numerical estimates can be used as approximate guides for estimating the
magnitude of patient dose savings that might be expected using current tube current
modulation schemes designed to maintain image quality.
Current longitudinal x-ray tube current modulation schemes shown in Table 4.6
reduce patient effective doses by about 10%, with about one third of this reduction
resulting from angular modulation, and the remaining two thirds resulting from
longitudinal modulation. A recent study investigated tube current modulation in chest CT
in a Rando phantom, and showed reductions in effective dose of ~ 7% for longitudinal
modulation, and ~ 9% for longitudinal and angular modulation combined [209]. These
findings of van Straten et al are therefore in excellent agreement with the results reported
in this work in terms of the absolute level of dose reductions, as well as the relative
importance of angular and longitudinal tube current modulation.
Current dose modulation schemes have primarily introduced with the specific
goal of maintaining image quality [180, 205, 212]. Tube current modulation, however,
can also be applied to specifically minimize patient doses. X-ray attenuation of rays in an
Anterior-Posterior (AP) projection is identical to the attenuation from the corresponding
Posterior-Anterior (PA) projection. As a result, it is possible to reduce the x-ray beam
intensity for projections that increase effective doses, whilst increasing the intensity of
93
the x-ray beam that results in lower effective doses. A commercial scanner that offers this
capability has recently been introduced into clinical practice [186]. Data presented in this
paper show that switching off the tube current for AP projections when performing CT
scans has the potential to substantially reduce patient doses. Design of a tube current
modulation scheme that both maintains image quality as well as minimizing patient doses
and risks should be possible, and could offer even larger patient dose reductions.
In chest CT, gonad doses are generally negligible, and effective doses therefore
provide an estimate of the risk of cancer induction. It is important to note these effective
doses are not radiation risk quantities per se [194]. Quantitative radiation risk estimates
require organ doses, and must take into account both the age and sex of any exposed
individual [213]. Nonetheless, effective doses are directly related to the patient cancer
risk, and quantify the amount of radiation a patient receives in a given examination [48].
Relative changes in effective dose are likely to correlate well with relative changes in the
patient cancer risk, and it is reasonable to expect a 10% reduction in effective dose to
result in a similar reduction in the (average) patient risk.
The principal limitations of our study is the fact that the x-ray dose simulations
only employed a conventional x-ray beam filter, but did not include the beam shaping
filter that is currently used in most commercial CT scanners. The use of a beam shaping
filter clearly reduces absolute values of organ doses, and therefore the corresponding
patient effective doses. The effect of the beam shaping filter on relative doses, however,
is uncertain. To shed light on this topic, we compared effective dose (E) to dose length
product (DLP) data for CT scanners, for CT systems from one commercial vendor that
94
are available in the ImPACT CT Dosimetry Calculator [38]. The average E/DLP for chest
CT examinations in two scanners with no beam shaping filter (i.e., Siemens DR3;
Siemens DRG1) was 18 Sv/mGy-cm, whereas the corresponding value for 16 scanners
which do employ beam shaping filters was 19 Sv/mGy-cm. These data suggest that the
introduction of a beam shaping filter would be unlikely to have change our relative doses
in a major manner.
4.5 Conclusion
Knowledge of how effective doses are will be affected by any extant or future x-
ray tube current modulation important for optimal management patients undergoing chest
CT examinations. The primary radiation protection objective in medical imaging
equipment is to minimize patient doses (i.e., risks) without adversely impacting on
diagnostic performance [201, 214]. Data presented in this study will be helpful to
researchers investigating methods for optimizing the design of modulation schemes that
will maintain image quality and/or minimize patient risks. In addition, our results will
assist users of MDCT scanners to quantify the likely dose savings that are achievable
from the application any specific tube current modulation scheme [179, 203].

95
CHAPTER 5 SCAN REGION AND ORGAN DOSES IN CT
5.1 Introduction
In the United States, medical imaging resulted in a per capita dose of about 3
mSv in 2006, which corresponds to an increase of about 600% in a single generation
[177]. Although CT scanning only accounts for ~ 17% of all medical imaging
examinations, this modality alone accounts for approximately one half of the total
medical collective effective dose [177]. The magnitude of the collective doses per se is of
no concern because the individuals who are being exposed to ionizing radiation also
benefit from the diagnostic information generated in imaging examinations [215].
Accordingly, current radiation protection philosophy requires imaging examinations to be
justified (i.e., indicated) where the patient benefit exceeds any corresponding risks,
including those from radiation [179, 203]. In addition, all indicated radiological
examinations should adopt the As Low As Reasonably Achievable (ALARA) principle
by ensuring that no more radiation is used than that required to obtained the required
diagnostic information [216, 217].
Indicated examinations can only be identified when imaging practitioners are able
to quantify the magnitude of patient risks [215]. Quantifying and minimizing risks
therefore rests on an understanding of the magnitude of doses to radiosensitive organs
and tissues. Organ doses permit the operator to estimate the likelihood of producing
deterministic or stochastic effects [8, 194]. In CT, although deterministic effects are
relatively rare, they have occurred during CT perfusion examinations [218]. In general,
the largest concern in CT is the stochastic risk of carcinogenesis. Cancer risks are taken
96
to be directly proportional to the organ dose, and for radiological protection purposes are
assumed to have no dose threshold below which risk would be zero [194, 219, 220]. The
most sensitive organs and tissues of concern in patient dosimetry are taken to be the
female breast, lungs, colon, stomach, and red bone marrow [194].
For a given individual and fixed x-ray beam intensity, the scan location and the
corresponding scan length are key determinants of the amount of radiation absorbed by
any organ or tissue [221]. In this study, we investigated how the choice of the scanned
region relative to a specific organ affects absorbed organ doses in adults undergoing
clinical CT examinations.
5.2 Method
5.2.1 ImPACT
ImPACT Dosimetry Calculator is a software package that can be used for
calculating absorbed organ doses to an anthropomorphic phantom undergoing a
diagnostic CT scanner examination [38]. We used ImPACT (version 1.0) to calculate
individual organ doses in whole body CT examinations, which uses NRPB Monte Carlo
dose data sets produced in report SR250 for 23 CT scanners [222]. Table 5.1 lists the 13
data sets that were used in this study, which includes the CT scanner and data set
combinations currently available in the software package. Table 5.1 also provides key
design characteristics for each scanner including x-ray tube voltage, as well as details of
the combination of flat and beam shaping filters.

97
Table 5.1 Scanner models investigated from the original ImPACT data set.
No. Maker Model Tube Voltage
(kV)
Flat Filters
(mm)
Shaped Filters
(material)
1 Siemens DR3 125 2.2 Al + 0.25 Cu None
3 Siemens DRH 125 2.2 Al + 0.2 Cu None
5 Picker 1200 SX 130 0.7 Al Body (Lexan)
7 GE 8800 120 2.7 Al Body (PMMA)
8 GE 9800 120 2.7 Al (PTFE)
9 GE 9800 140 2.7 Al (PTFE)
10 GE MAX 120 2.6 Al (PTFE)
11 GE PACE 120 2.7 Al (PTFE)
15 Philips 350 (GE3) 120 3.5 Al (Al)
17 Philips TX 120 1.4 Al + 0.1 Cu (Al)
18 Philips CX 120 1.4 Al + 0.1 Cu (Al)
19 Philips LX 120 1.4 Al + 0.1 Cu (Al)
22 Philips LX 100 1.4 Al + 0.1 Cu (Al)
23 Philips LX 130 1.4 Al + 0.1 Cu (Al)
The mathematical phantom used by the ImPACT software corresponds to an adult
size phantom with the weight of 71.1 kg [223] as depicted in Figure 5.1 and shows the
long patient axis parameter z that ranges from -10 cm to + 94 cm. Table 5.2 summarizes
the geometric shapes and main dimensions of the 8 organs investigated from the phantom,
which are represented by partial or whole ellipsoids. The arms are included in the body
trunk, and their attenuation is included in calculations. Also shown in Table 5.2 are the
masses of each of these eight organs that range from 20 g for the thyroid to 1.8 kg for the
liver. These eight organs were selected because they are of primary importance in

98
radiation protection dosimetry owing to their high radiosensitivity.
Table 5.2 The shape and key dimensions of the eight organs investigated in the
phantom (Cristy 1980).
Organ
[mass in kg] Shape
Inferior
Boundary
(z = cm)
Superior
Boundary
(z = cm)
Length
Lmax (cm)
Bladder
[0.245] Ellipsoid 4.5 11.5 6.9
Breast
[ 0.357] Partial ellipsoid 47.9 56.1 8.1
Liver
[1.810] Partial elliptical cylinder 27.0 43.0 16.0
Lungs
[0.999] Half an ellipsoid 43.5 67.5 24.0
Lower Large
Intestine
[0.294]
Space between two
coaxial elliptical cylinders 0.0 24.0 24.0
Upper Large
Intestine
[0.429]
Space between two
coaxial elliptical cylinders 14.5 27.0 12.6
Stomach
[0.397] Ellipsoid 27.0 43.0 16.0
Thyroid
[0.020]
Two concentric cylinders
cut by a surface 70.0 75.0 5.0
99
5.2.2 Scan Length
Consider a scan of length L that is centered on a selected organ, where the latter
has a length Lmax along the craniocaudal axis (z-axis). The relative scan length Lr was
defined as the ratio of the scan length to Lmax using
Lr = L/Lmax (5.1)
Figure 5.1A shows an example of a scan from patient long axis location (z) 27
cm to 43 cm (i.e., corresponding to Lmax of liver) so that for this organ, the scan length of
16 cm would correspond to Lr = 1. Figure 5.1B shows a whole body scan of length 104
cm that corresponds to scan length Lr = 6.5 for the liver. For a given organ, Lr values less
than unity imply a symmetrical scan from the organ center, whereas for Lr greater than
unity, the scan length increases until the maximum z value possible are reached (i.e., z = -
10 and z = + 94).
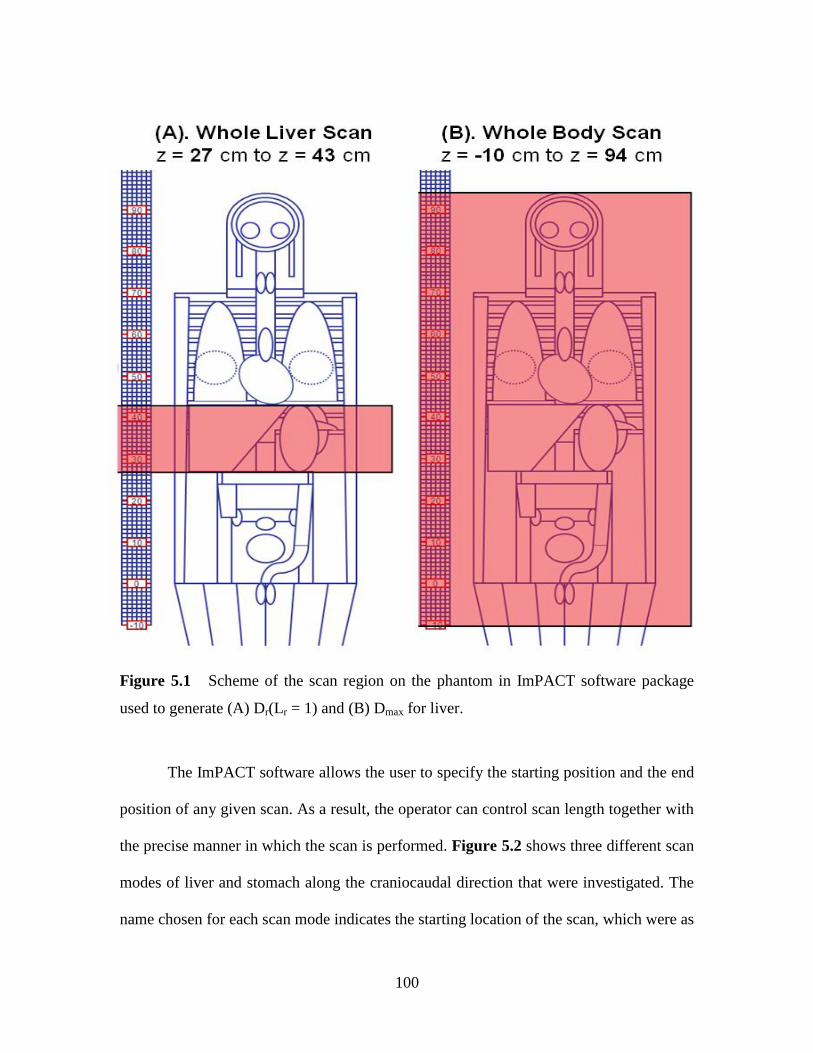
100
Figure 5.1 Scheme of the scan region on the phantom in ImPACT software package
used to generate (A) Dr(Lr = 1) and (B) Dmax for liver.
The ImPACT software allows the user to specify the starting position and the end
position of any given scan. As a result, the operator can control scan length together with
the precise manner in which the scan is performed. Figure 5.2 shows three different scan
modes of liver and stomach along the craniocaudal direction that were investigated. The
name chosen for each scan mode indicates the starting location of the scan, which were as

101
follows:
Center: The origin is the center along the craniocaudal axis of the organ in the
phantom, and the scan region is expanded symmetrically inferiorly and superiorly,
by moving both the starting position and end position. It is the default scan mode
in this study.
Caudal: The origin is at the caudal limit of the organ and increases incrementally
by increasing end position toward the cranial end of the organ.
Cranial: The origin is at the cranial limit of the organ and increases incrementally
by increasing the end position toward the caudal end of the organ.
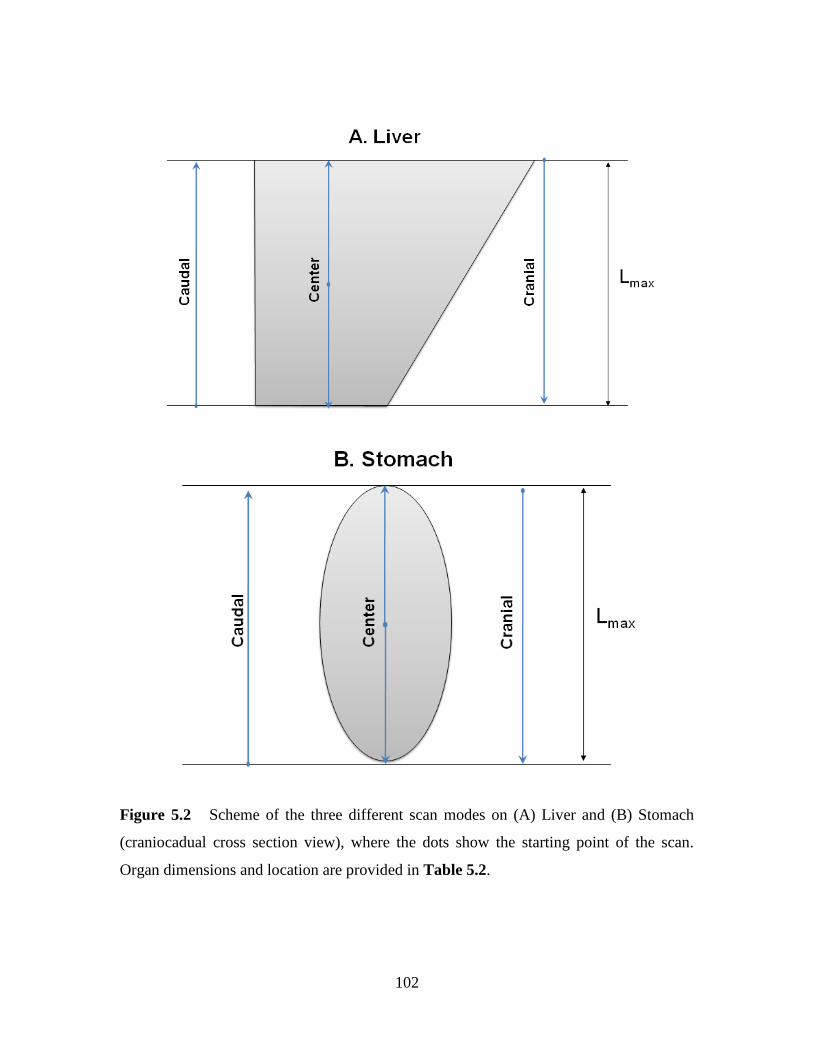
102
Figure 5.2 Scheme of the three different scan modes on (A) Liver and (B) Stomach
(craniocadual cross section view), where the dots show the starting point of the scan.
Organ dimensions and location are provided in Table 5.2.
103
5.2.3 Doses
For a selected organ undergoing a CT scan with fixed techniques (i.e., kV; mAs;
pitch), we obtained the maximum organ dose (i.e., Dmax) for a whole body scan from the
thigh region (z = -10 cm) to the head (z = 94 cm). Under the same operating conditions, a
scan of length L centered at the organ of interest has an organ dose of D(L), which
permits the relative dose Dr to be determined using
Dr = D(L)/Dmax (5.2)
Values of Dr as a function of Lr were obtained for eight organs listed in Table 5.2.
The selected organs have longitudinal lengths (i.e., z-axis lengths) from 5 cm (thyroid) to
24 cm (lungs and lower large intestines). In addition, these organs have anatomical
locations that range from the cervical region (thyroid) to the lower pelvic region (i.e.,
bladder). Figure 5.1A shows a scan of the whole liver (Lmax), and as well as a whole
body scan where the liver dose is Dmax. Division of the liver dose for Lmax by the
corresponding value of Dmax results in the value Dr (Lr = 1).
The default CT scanner used in this study was the GE 9800 scanner operated at
120 kV with a 2.7 mm Al flat filter and a PTFE beam shaping filter (Dataset No.8 in
Table 5.1). The Philips LX scanner was chosen to investigate the effect of x-ray tube
voltage on the organ doses, because dose data are available at three x-ray tube voltages
(i.e., 100 kV, 120 kV, and 130 kV) with all other parameters kept constant. Computations
were performed for a nominal x-ray tube current of 100 mA, a rotation time of 1 s, and a
CT pitch of 1. All scans were obtained using the body scan mode.
For each simulation, we recorded the value of the volume Computed Tomography
104
Dose Index (CTDIvol), which is directly proportional to the organ dose [224]. All scans
were performed in the body mode, so that our CTDI data relate to measurements obtained
in a CT dosimetry phantom with a diameter of 32 cm. CTDIvol data were combined with
organ doses to obtain values of Dmax/CTDIvol for the Philips LX CT scanner operated at
three x-ray tube voltages between 100 and 130 kV.
5.3 Results
5.3.1 Relative Dose (Dr)
Figure 5.3 shows plots of Dr as a function of Lr for the five longest organs that
were investigated, namely the lungs (24 cm), lower large intestines (24 cm), liver (16 cm),
stomach (16 cm), and the upper large intestine (12.6 cm). Figure 5.4 shows plots of Dr as
a function of Lr for the three shortest organs that were investigated, namely the breast
(8.1 cm), bladder (6.9 cm) and thyroid (5.0 cm). As expected, for each organ, Dr
increases monotonically with increasing Lr, and asymptotically approaches a value of
unity.
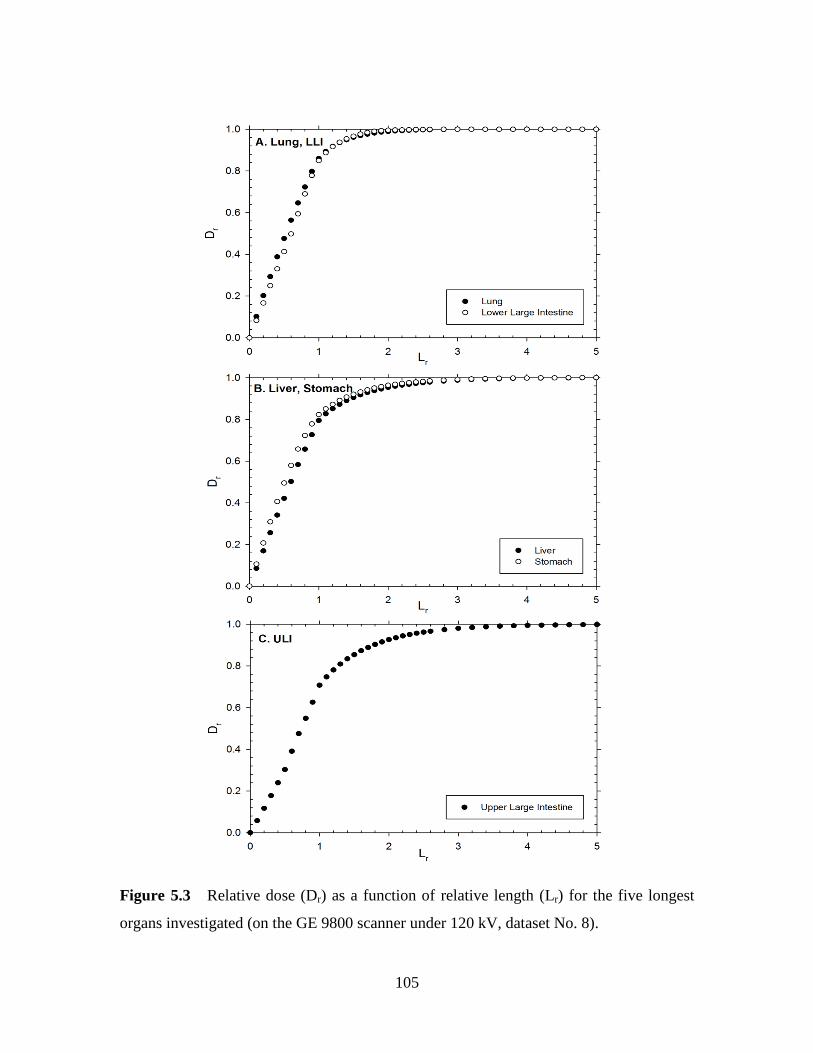
105
Figure 5.3 Relative dose (Dr) as a function of relative length (Lr) for the five longest
organs investigated (on the GE 9800 scanner under 120 kV, dataset No. 8).
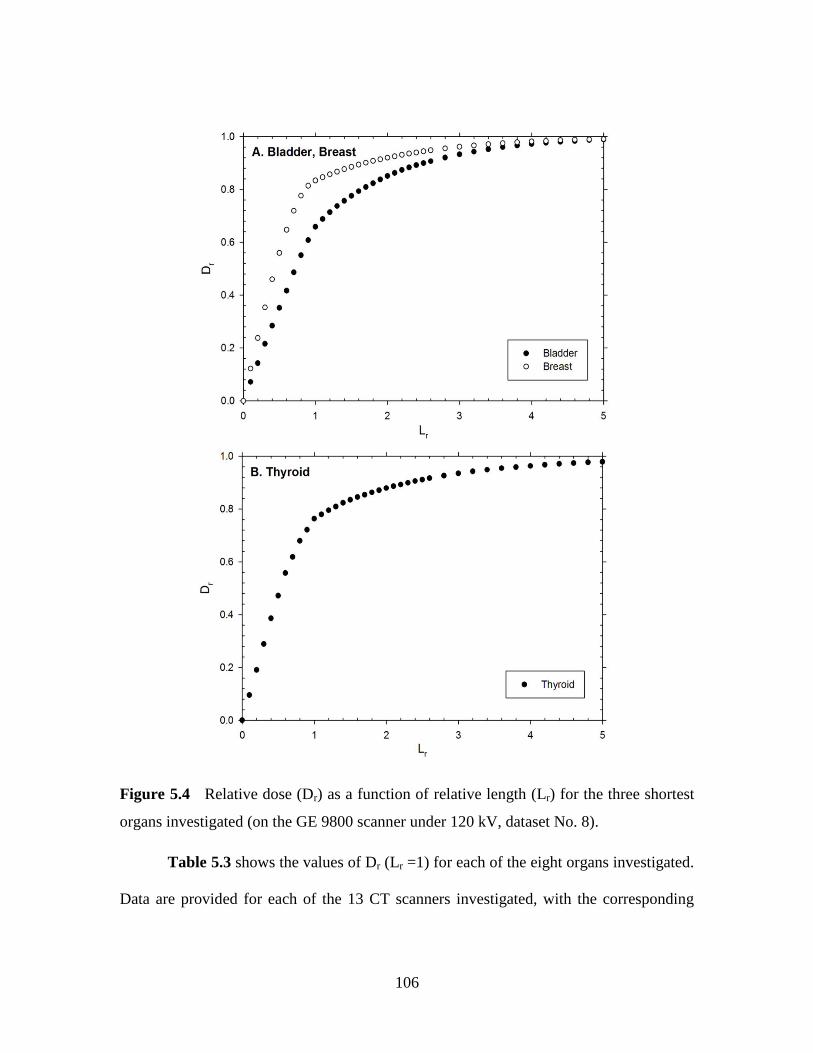
106
Figure 5.4 Relative dose (Dr) as a function of relative length (Lr) for the three shortest
organs investigated (on the GE 9800 scanner under 120 kV, dataset No. 8).
Table 5.3 shows the values of Dr (Lr =1) for each of the eight organs investigated.
Data are provided for each of the 13 CT scanners investigated, with the corresponding
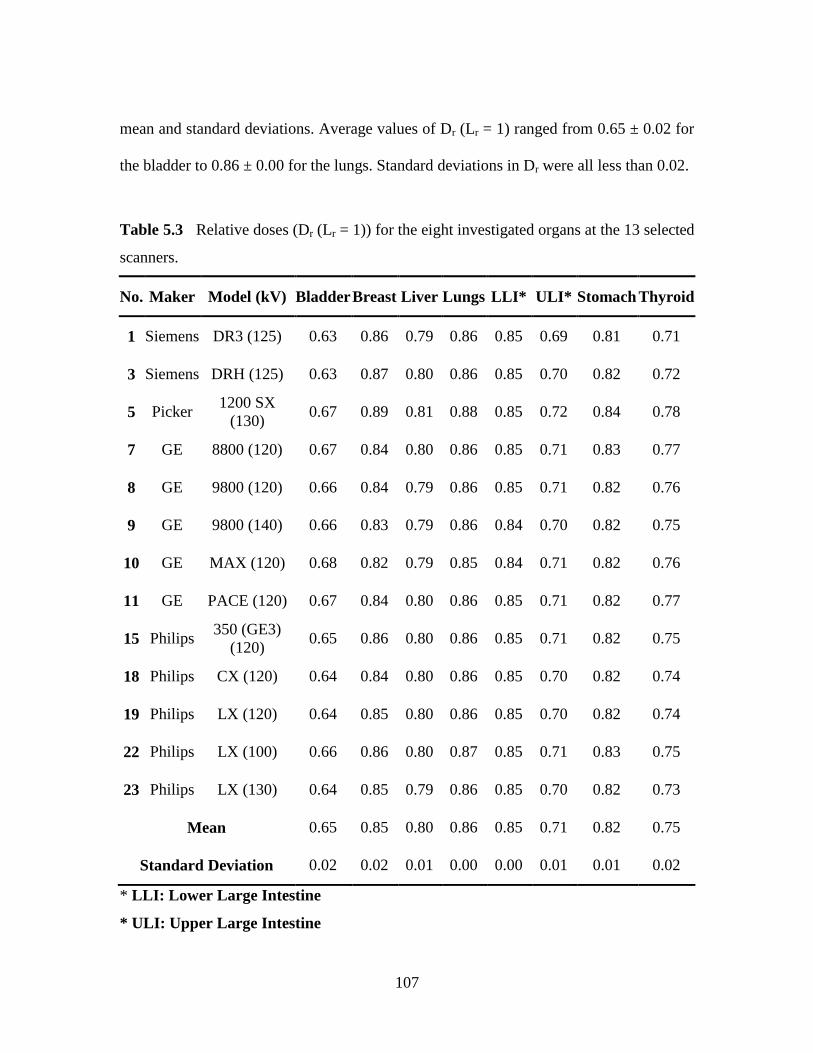
107
mean and standard deviations. Average values of Dr (Lr = 1) ranged from 0.65 ± 0.02 for
the bladder to 0.86 ± 0.00 for the lungs. Standard deviations in Dr were all less than 0.02.
Table 5.3 Relative doses (Dr (Lr = 1)) for the eight investigated organs at the 13 selected
scanners.
No. Maker Model (kV) Bladder Breast Liver Lungs LLI* ULI* Stomach Thyroid
1 Siemens DR3 (125) 0.63 0.86 0.79 0.86 0.85 0.69 0.81 0.71
3 Siemens DRH (125) 0.63 0.87 0.80 0.86 0.85 0.70 0.82 0.72
5 Picker 1200 SX
(130) 0.67 0.89 0.81 0.88 0.85 0.72 0.84 0.78
7 GE 8800 (120) 0.67 0.84 0.80 0.86 0.85 0.71 0.83 0.77
8 GE 9800 (120) 0.66 0.84 0.79 0.86 0.85 0.71 0.82 0.76
9 GE 9800 (140) 0.66 0.83 0.79 0.86 0.84 0.70 0.82 0.75
10 GE MAX (120) 0.68 0.82 0.79 0.85 0.84 0.71 0.82 0.76
11 GE PACE (120) 0.67 0.84 0.80 0.86 0.85 0.71 0.82 0.77
15 Philips 350 (GE3)
(120) 0.65 0.86 0.80 0.86 0.85 0.71 0.82 0.75
18 Philips CX (120) 0.64 0.84 0.80 0.86 0.85 0.70 0.82 0.74
19 Philips LX (120) 0.64 0.85 0.80 0.86 0.85 0.70 0.82 0.74
22 Philips LX (100) 0.66 0.86 0.80 0.87 0.85 0.71 0.83 0.75
23 Philips LX (130) 0.64 0.85 0.79 0.86 0.85 0.70 0.82 0.73
Mean 0.65 0.85 0.80 0.86 0.85 0.71 0.82 0.75
Standard Deviation 0.02 0.02 0.01 0.00 0.00 0.01 0.01 0.02
* LLI: Lower Large Intestine
* ULI: Upper Large Intestine
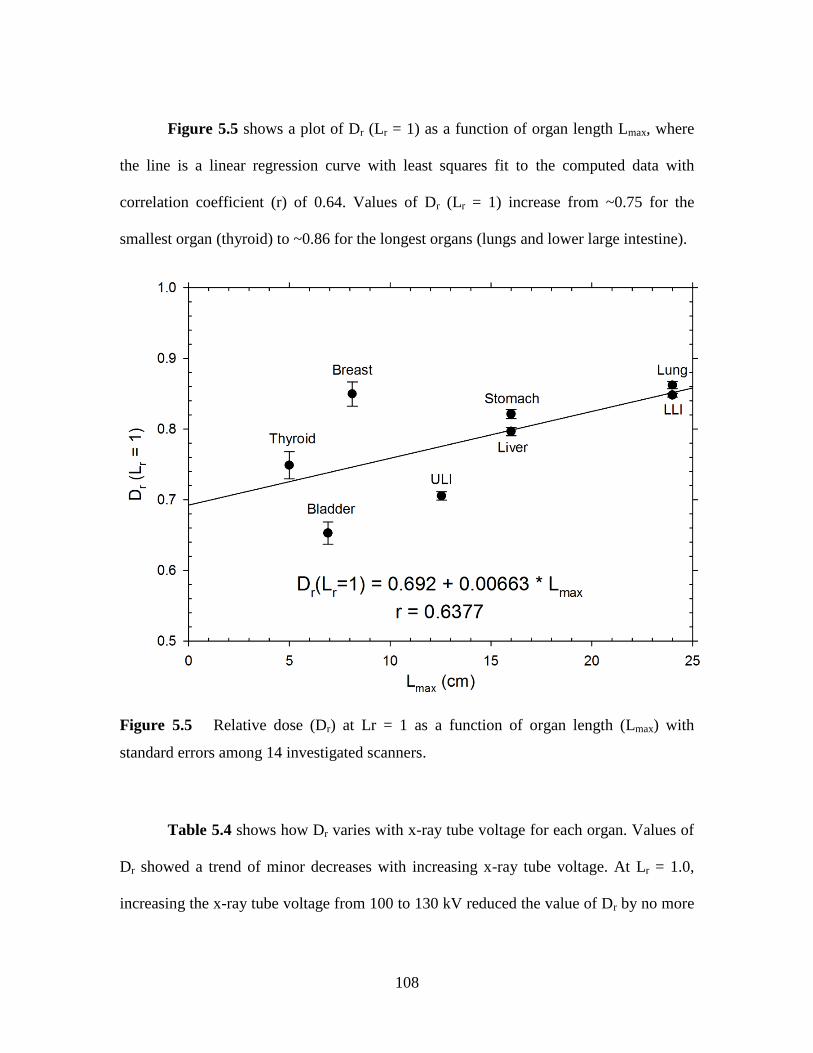
108
Figure 5.5 shows a plot of Dr (Lr = 1) as a function of organ length Lmax, where
the line is a linear regression curve with least squares fit to the computed data with
correlation coefficient (r) of 0.64. Values of Dr (Lr = 1) increase from ~0.75 for the
smallest organ (thyroid) to ~0.86 for the longest organs (lungs and lower large intestine).
Figure 5.5 Relative dose (Dr) at Lr = 1 as a function of organ length (Lmax) with
standard errors among 14 investigated scanners.
Table 5.4 shows how Dr varies with x-ray tube voltage for each organ. Values of
Dr showed a trend of minor decreases with increasing x-ray tube voltage. At Lr = 1.0,
increasing the x-ray tube voltage from 100 to 130 kV reduced the value of Dr by no more
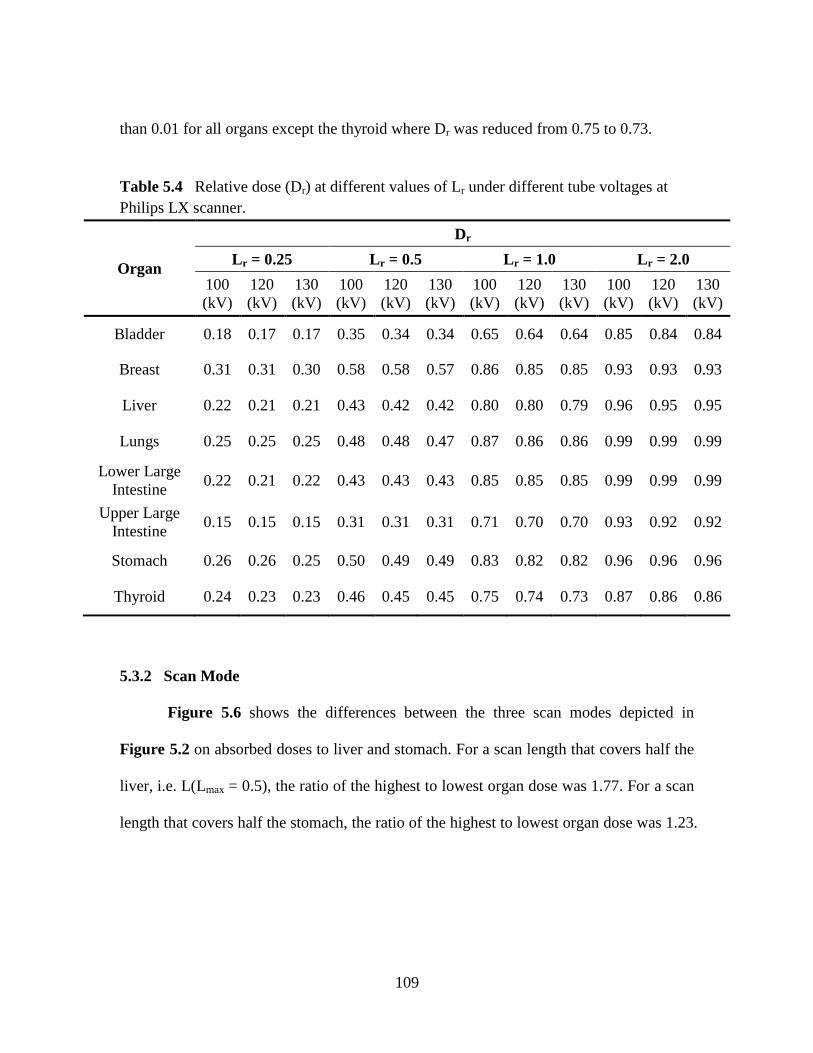
109
than 0.01 for all organs except the thyroid where Dr was reduced from 0.75 to 0.73.
Table 5.4 Relative dose (Dr) at different values of Lr under different tube voltages at
Philips LX scanner.
Organ
Dr
Lr = 0.25 Lr = 0.5 Lr = 1.0 Lr = 2.0
100
(kV)
120
(kV)
130
(kV)
100
(kV)
120
(kV)
130
(kV)
100
(kV)
120
(kV)
130
(kV)
100
(kV)
120
(kV)
130
(kV)
Bladder 0.18 0.17 0.17 0.35 0.34 0.34 0.65 0.64 0.64 0.85 0.84 0.84
Breast 0.31 0.31 0.30 0.58 0.58 0.57 0.86 0.85 0.85 0.93 0.93 0.93
Liver 0.22 0.21 0.21 0.43 0.42 0.42 0.80 0.80 0.79 0.96 0.95 0.95
Lungs 0.25 0.25 0.25 0.48 0.48 0.47 0.87 0.86 0.86 0.99 0.99 0.99
Lower Large
Intestine 0.22 0.21 0.22 0.43 0.43 0.43 0.85 0.85 0.85 0.99 0.99 0.99
Upper Large
Intestine 0.15 0.15 0.15 0.31 0.31 0.31 0.71 0.70 0.70 0.93 0.92 0.92
Stomach 0.26 0.26 0.25 0.50 0.49 0.49 0.83 0.82 0.82 0.96 0.96 0.96
Thyroid 0.24 0.23 0.23 0.46 0.45 0.45 0.75 0.74 0.73 0.87 0.86 0.86
5.3.2 Scan Mode
Figure 5.6 shows the differences between the three scan modes depicted in
Figure 5.2 on absorbed doses to liver and stomach. For a scan length that covers half the
liver, i.e. L(Lmax = 0.5), the ratio of the highest to lowest organ dose was 1.77. For a scan
length that covers half the stomach, the ratio of the highest to lowest organ dose was 1.23.
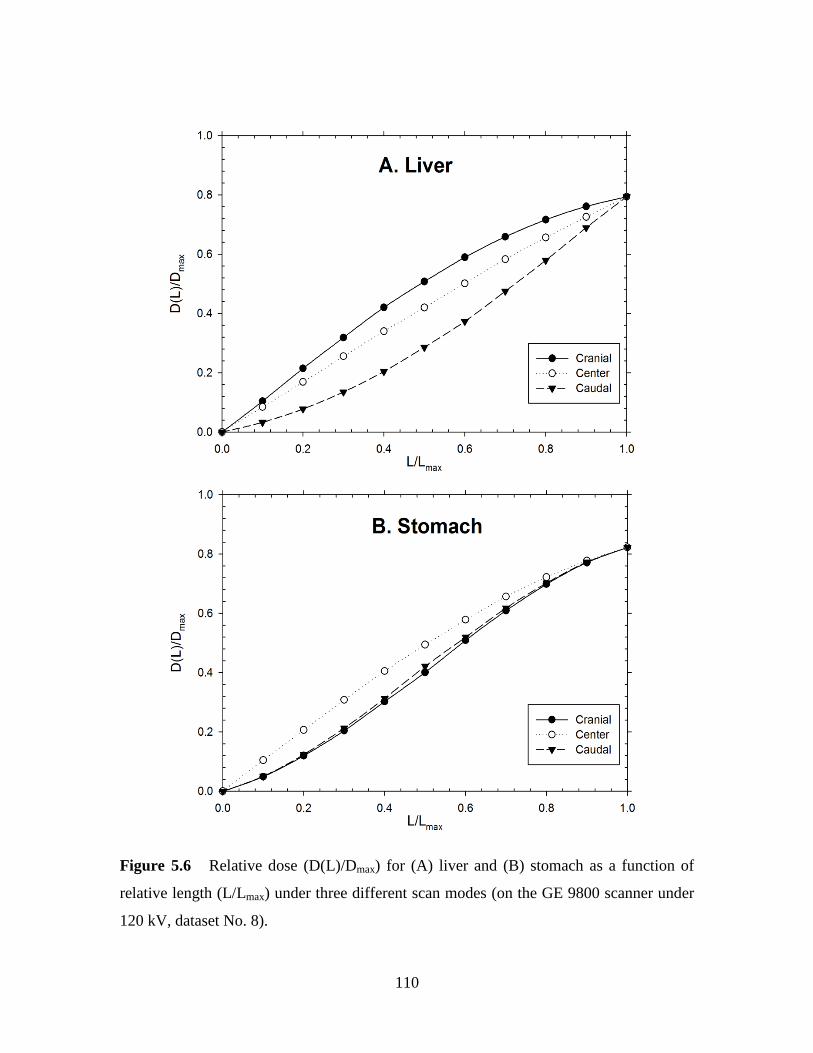
110
Figure 5.6 Relative dose (D(L)/Dmax) for (A) liver and (B) stomach as a function of
relative length (L/Lmax) under three different scan modes (on the GE 9800 scanner under
120 kV, dataset No. 8).
111
5.3.3 Dmax/CTDIvol
Table 5.5 lists ratios of [Dmax/CTDIvol] for each organ investigated, as well as the
relative values normalized to unity at 120 kV for each organ. At 120 kV, the lowest value
of Dmax/CTDIvol was 1.23 for the breast, and the highest was 2.22 for the thyroid.
Reducing the x-ray tube voltage on this scanner from 120 to 100 kV reduced the value of
[Dmax/CTDIvol] by an average of 4%. Increasing the x-ray tube voltage from 120 to 130
kV showed an average difference in [Dmax/CTDIvol] of less than 1%.
5.4 Discussion and Conclusion
For values of Lr less than unity, Figures 5.3 and 5.4 showed that Dr is
approximately linear with Lr. The slopes of these linear regions, however, vary with
organ length and are generally steepest for the largest organs, and vice versa. The values
of Dr (Lr = 1) listed in Table 5.3 may be taken as a quantitative indicator of the steepness
of the Dr versus Lr curves depicted in Figures 5.3 and 5.4. This finding can be explained
by consideration of the manner in which organs receive their absorbed energy, which is
generally half from direct irradiation, and the remaining half from scattered radiation
[225]. As the organ length increases, an increasing fraction of scatter radiation will be
deposited in organ which thereby increases the values of Dr (Lr = 1). The mean free path
for x-ray photons is an important parameter that influences the value of Dr (Lr = 1). X-ray
tube voltages in CT are typically 120 kV and use heavy filtration, so the average photon
energy is about 60 keV [226]. The linear attenuation (µ) coefficient of 60 keV photons in
water (tissue) is ~ 0.2 cm-1
, and with a corresponding mean free path (i.e., 1/µ) of ~ 5 cm
112
[193].
Choice of CT scanner had essentially no effect on the value of Dr (Lr =1) given
the very small standard deviation data provided in Table 5.3. Accordingly, the data
presented in this study may be taken to be valid not only for CT scanners that were being
used clinically in the early 1990s, but for any CT scanner that use fan beams and
detection widths that are treated as essentially planar. Cone beam CT geometries,
however, might result in Dr values different from the data depicted in Table 5.3.
The curve fit in Figure 5.5 shows an approximately linear relationship between
Dr (Lr = 1) and the length of the organ (Lmax). Five of the investigated organs (thyroid,
liver, stomach, lung, and lower large intestines) fall very close to the line, and all lie
within two standard deviations of the mean. The breast value is substantially higher,
which is most likely a result of the superficial nature of this organ. The value of Dr (Lr =
1) for the bladder is markedly lower than the least squares fit line, which is likely a result
of the asymmetric nature of the irradiation of this organ. Data in Figure 5.5 show that for
small organs with length of ~0 cm, scanning of the organ alone produces doses that are of
~ 0.69 Dmax. For large organs with length of ~25cm, however, scanning the organ alone
results in an organ dose that is ~ 0.86 Dmax.
The data in Figure 5.6 show that the manner in which an organ is scanned can
markedly impact on the organ dose. Absorbed dose in any organ is the simply the
quotient of the energy deposited divided by the corresponding mass. For a fixed scan
length that is less that the liver length, Figure 5.2 shows that fraction of liver that would
be irradiated by a scan starting at the lower level of the liver would be less than a
113
corresponding scan that commences at the top of the liver.
Table 5.4 shows that the choice of x-ray tube voltage has very little effect on Dr
values in a normal sized adult patient. For most practical patient dosimetry applications,
the choice of x-ray tube voltage may be neglected when considering the value of Dr.
Although tube voltage has no significant effect on Dr, there were minor variations in the
ratio Dmax/CTDIvol which was reduced by approximately 4% when the x-ray tube voltage
was reduced from 120 kV to 100 kV. This finding was observed for most organs, with the
exception of the thyroid where the Dmax/CTDIvol value was essentially independent of x-
ray tube voltage. It is important to note that recent data have shown that although dose
conversion factors in adult CT dosimetry are essentially independent of x-ray tube
voltage, it is necessary to take x-ray tube voltage into account when dealing with infants
and pediatric patients [227].
Values of Dmax/CTDIvol permit operators to estimate organ doses in normal sized
patients from CTDIvol data provided at CT console at the end of each examination. A
normal sized patient who undergoes a whole body scan using a CTDIvol of 20 mGy will
receive a bladder dose of ~30 mGy, a breast dose of ~25 mGy, and a thyroid dose of ~45
mGy. These organ doses can be obtained by multiplying the CTDIvol used to perform the
patient examination by the appropriate Dmax/CTDIvol factor depicted in Table 5.5. For
shorter scan lengths, the reduction in organ dose can be estimated using data presented in
this study (Figures 5.3 and 5.4), or similar factors recently published in the scientific
literature [228].

114
Table 5.5 Dmax / CTDIvol for the eight organs investigated at different tube voltages with
Philips LX scanner.
Organ
Dmax / CTDIvol
(Relative Dose)
100 kV 120 kV 130 kV
Bladder 1.45
(0.98)
1.49
(1.00)
1.51
(1.01)
Breast 1.19
(0.97)
1.23
(1.00)
1.24
(1.01)
Liver 1.33
(0.95)
1.39
(1.00)
1.41
(1.01)
Lungs 1.50
(0.96)
1.56
(1.00)
1.57
(1.00)
Lower Large Intestine 1.17
(0.93)
1.25
(1.00)
1.27
(1.02)
Upper Large Intestine 1.28
(0.95)
1.35
(1.00)
1.37
(1.01)
Stomach 1.38
(0.96)
1.43
(1.00)
1.45
(1.01)
Thyroid 2.19
(0.99)
2.22
(1.00)
2.17
(0.98)
For patients whose size differs from that of the anthropomorphic phantom
depicted in Figure 5.1, doses increase with reducing patient size, and vice versa.
Appropriate scaling factors that take into account body size have recently been published
for both chest and body [227, 229]. Accordingly, it is possible to estimate patient specific
organ doses for most CT scans. Obtaining a reliable estimate of organ dose is required to
quantifying radiation risks. As in all radiation exposures, the onus on medical imaging
practitioners is to justify all exposures, and ensure that they are minimized without
115
detracting from the valuable diagnostic information that CT imaging can provide patients
and their physicians.
116
CHAPTER 6 ESTIMATING CANCER RISKS TO ADULTS UNDERGOING
BODY CT
6.1 Introduction
One of the most important radiological protection principles in medical imaging is
the need to ensure that any patient exposure is justified by a net benefit [220]. For each
radiological examination, there is an implicit requirement to ensure that the patient
benefit exceeds any corresponding radiation risk. For this reason, it is essential that
practitioners understand the magnitude of radiation risks associated with radiological
examinations, and how these risks vary with age and sex of the patient [230, 231].
Understanding patient risks is of particular importance for CT imaging where radiation
doses are generally much higher than those in conventional radiography or fluoroscopy
[232]. In 2006, CT accounted for ~ 17% of the total number of diagnostic examinations
but was responsible for nearly half of the collective population dose from medical
imaging [233].
In CT examinations, operators are provided with the volume Computed
Tomography Dose Index (CTDIvol) and the Dose Length Product (DLP) [234, 235].
CTDIvol is a measure of the intensity of radiation that is used to perform the CT
examination, which is independent of the scan length. Multiplication of CTDIvol by the
corresponding scan length yields the DLP, which can be taken as a measure of the total
amount of radiation used to perform a given CT examination. The radiation absorbed by
the patient, however, depends on the individual physical characteristics and type of CT
examination [231, 236, 237]. For a fixed amount of radiation that is incident upon the
117
patient (i.e., DLP), reducing the patient size will increase the corresponding organ doses
and vice versa [238].
The amount of radiation that is used to perform a CT examination (DLP) is
known to the operator, together with knowledge of the anatomical region being
irradiated, as well as patient age, sex, and physical size. For normal sized adults, the
patient effective dose can also be obtained by multiplying the DLP by an appropriate
body region specific k factor (E/DLP) [227, 239], and adjustments can be made to correct
for differences in patient size [224]. The effective dose is a useful indicator of the amount
of radiation received by the patient, and is directly related to the DLP [240]. Effective
dose, however, is not an indicator of patient risks because it does not take into account
patient age, sex, or which specific organs were exposed [47, 241, 242]. In this study, a
method is described that permits the amount of radiation used to perform body CT
examination (DLP), as well as the corresponding amount of radiation received by the
patient (E), to be converted into the corresponding risk of carcinogenesis accounting for
patient demographics (i.e., sex and age) and physical characteristics (i.e., size).
6.2 Method
6.2.1 CT Dosimetry
The ImPACT CT Patient Dosimetry Calculator (version 1.0) was used to compute
values of adult organ doses for specified scans [38]. The ImPACT package makes use of
the Monte Carlo dose results from the National Radiological Protection Board‘s (now
integrated into Health Protection Agency) report for normalized organ doses in a MIRD
type phantom modeling a 70 kg adult [222]. The mathematical phantom is hermaphrodite
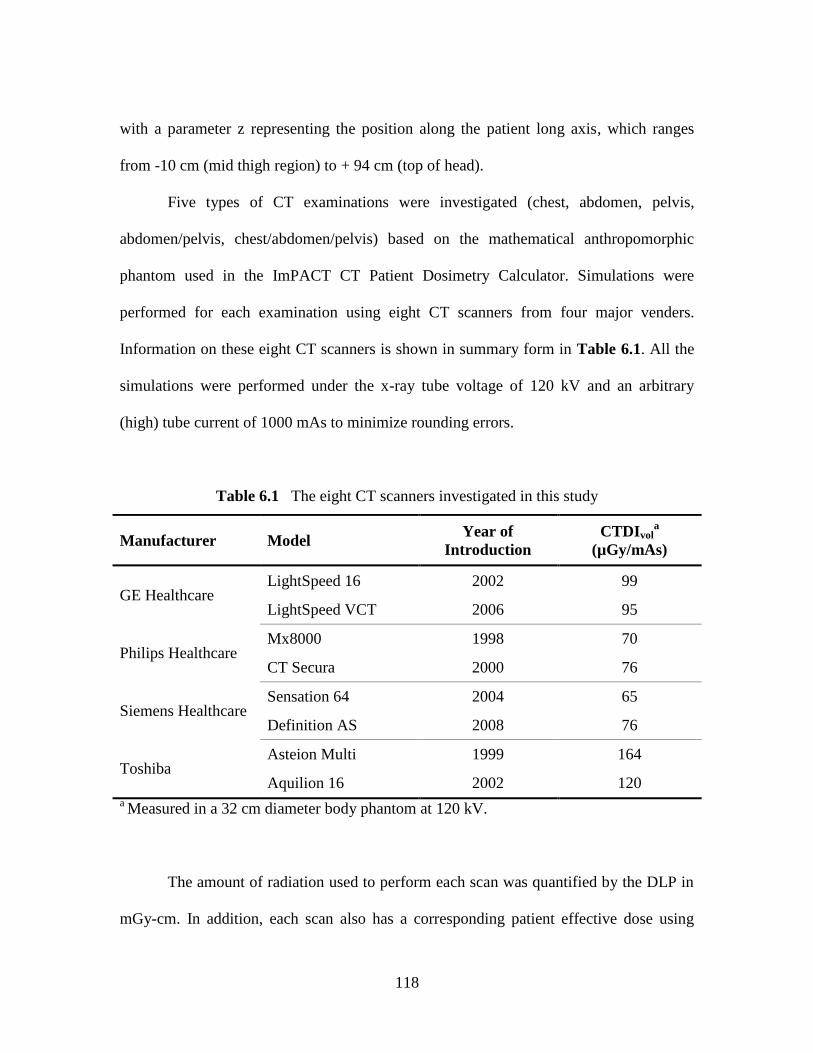
118
with a parameter z representing the position along the patient long axis, which ranges
from -10 cm (mid thigh region) to + 94 cm (top of head).
Five types of CT examinations were investigated (chest, abdomen, pelvis,
abdomen/pelvis, chest/abdomen/pelvis) based on the mathematical anthropomorphic
phantom used in the ImPACT CT Patient Dosimetry Calculator. Simulations were
performed for each examination using eight CT scanners from four major venders.
Information on these eight CT scanners is shown in summary form in Table 6.1. All the
simulations were performed under the x-ray tube voltage of 120 kV and an arbitrary
(high) tube current of 1000 mAs to minimize rounding errors.
Table 6.1 The eight CT scanners investigated in this study
Manufacturer Model Year of
Introduction
CTDIvola
(µGy/mAs)
GE Healthcare LightSpeed 16 2002 99
LightSpeed VCT 2006 95
Philips Healthcare Mx8000 1998 70
CT Secura 2000 76
Siemens Healthcare Sensation 64 2004 65
Definition AS 2008 76
Toshiba Asteion Multi 1999 164
Aquilion 16 2002 120
a Measured in a 32 cm diameter body phantom at 120 kV.
The amount of radiation used to perform each scan was quantified by the DLP in
mGy-cm. In addition, each scan also has a corresponding patient effective dose using

119
ICRP 103 tissue weighting factors. Table 6.2 provides a summary of the scan lengths for
each scan, as well as the ratios of the effective dose to the corresponding DLP. It is
important to note that the resultant organ doses are only applicable for patients with
physical size characteristics that are similar to the 70 kg phantom used in the ImPACT
Patient CT Dosimetry Calculator. For a normal sized patient, the amount of radiation
used to perform a CT examination (DLP) is directly proportional to the amount of
radiation received by the patient (E) as defined in Table 6.2, so that both quantities can
be used as the input term for estimating the resultant patient risk.
Table 6.2 Average (± standard deviation) Effective Dose per unit Dose-Length Product
factors (k-factors) and average (± standard deviation) relative importance of the eight
organs investigated to the total carcinogenic detriment in body CT using ICRP 103
weighting factors for the eight CT scanners listed in Table 6.1.
Scan Type
Start – End
locationa
(cm)
Scan
Length
(cm)
Effective
Dose/DLP
(µSv/mGy-cm)
Percentage (%) of the total
carcinogenic detriment due to
irradiation of the 8 organsb
Chest 35 – 70 35 19.8 ± 0.6 77.5 ± 1.4
Abdomen 20 – 44 24 18.6 ± 1.0 80.6 ± 1.0
Pelvis 0 – 20 20 12.7 ± 0.7 86.4 ± 1.4
Chest/Abd/Pelvis 0 – 70 70 17.3 ± 0.6 79.8 ± 0.9
Abd/Pelvis 0 – 44 44 15.9 ± 1.0 82.8 ± 1.6 a ImPACT anthropomorphic phantom z location
b Red bone marrow, colon, lung, stomach, breast, liver, thyroid, and bladder
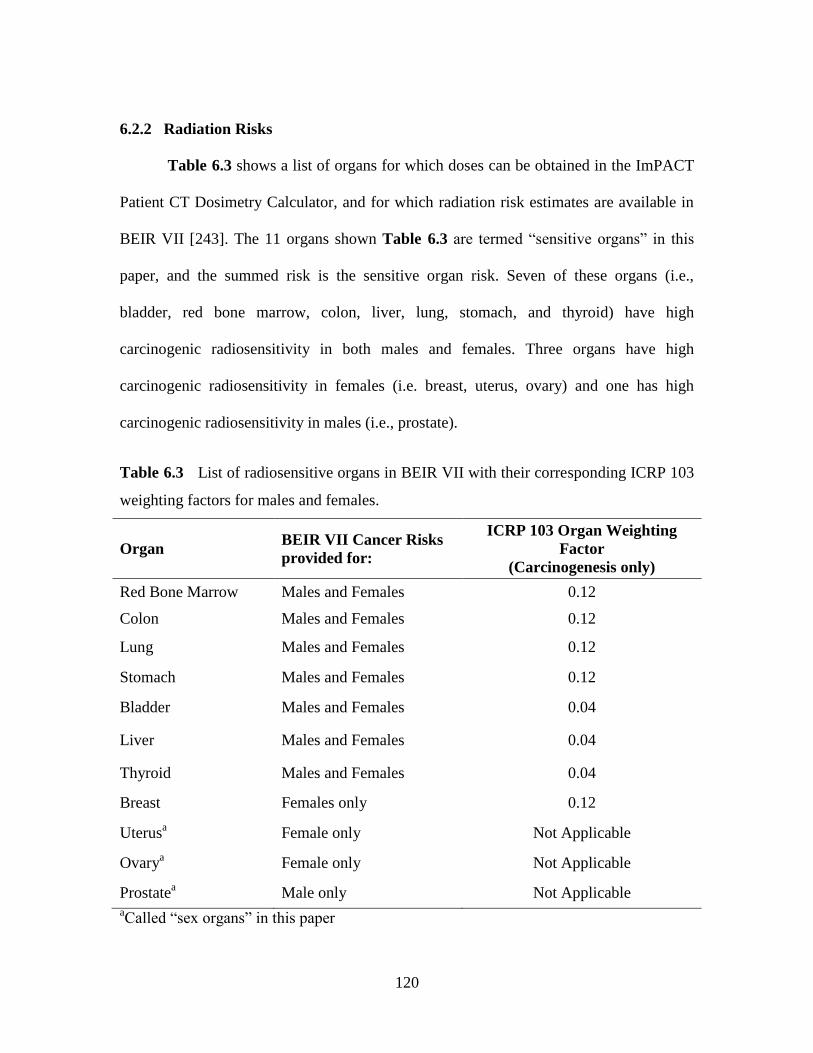
120
6.2.2 Radiation Risks
Table 6.3 shows a list of organs for which doses can be obtained in the ImPACT
Patient CT Dosimetry Calculator, and for which radiation risk estimates are available in
BEIR VII [243]. The 11 organs shown Table 6.3 are termed ―sensitive organs‖ in this
paper, and the summed risk is the sensitive organ risk. Seven of these organs (i.e.,
bladder, red bone marrow, colon, liver, lung, stomach, and thyroid) have high
carcinogenic radiosensitivity in both males and females. Three organs have high
carcinogenic radiosensitivity in females (i.e. breast, uterus, ovary) and one has high
carcinogenic radiosensitivity in males (i.e., prostate).
Table 6.3 List of radiosensitive organs in BEIR VII with their corresponding ICRP 103
weighting factors for males and females.
Organ BEIR VII Cancer Risks
provided for:
ICRP 103 Organ Weighting
Factor
(Carcinogenesis only)
Red Bone Marrow Males and Females 0.12
Colon Males and Females 0.12
Lung Males and Females 0.12
Stomach Males and Females 0.12
Bladder Males and Females 0.04
Liver Males and Females 0.04
Thyroid Males and Females 0.04
Breast Females only 0.12
Uterusa Female only Not Applicable
Ovarya Female only Not Applicable
Prostatea Male only Not Applicable
aCalled ―sex organs‖ in this paper
121
Organ doses were converted to radiation risks using the age and gender-specific
patient risk values provided in BEIR VII. Male risk values thus include eight ―sensitive
organs‖, and female risk values include ten ―sensitive organs‖. The risk conversion factor
for specified patient undergoing a given body CT examination was obtained by dividing
the total cancer risk from ―sensitive organs‖ by the computed DLP for each CT
examination, as well as the corresponding effective dose.
In addition to the eleven organs listed in Table 6.3, BEIR VII also provides a
category known as ―other‖ that refers to all other radiation induced cancers that are not
otherwise explicitly listed. Eight of the organs listed in Table 6.3 have explicit ICRP
organ weighting factors [47] relating to carcinogenesis, and the remaining three do not.
Organs with no explicit ICRP carcinogenesis weighting factor are called ―sex organs‖
and relate to the prostate in males, and the sum of the ovaries and uterus in females.
6.2.3 Patient Size Correction Factors
At a constant radiation intensity used to perform a given CT examination, organ
doses are always reduced with increasing patient size, and vice versa. As the patient size
increases, there is an increased attenuation of the x-ray beam, and radiation doses are
always reduced [238]. For a given x-ray output, the key determinant of organ doses is
therefore the physical size (i.e., mass) of the patient being irradiated. Patient mass in a CT
slice may be readily obtained from CT images that provide both the cross sectional area
and the corresponding average Hounsfield Unit (HU) [244]. At high photon energies
encountered in CT, most interactions are Compton scatter which is directly proportional
122
to electron density, which in turn is proportional to patient physical density [193].
Once the patient mass is available from a CT image, this patient can be modeled
as an equivalent cylinder of water. This approach permits the use relative doses as a
function of water cylinder diameter to be used to estimate how effective doses vary with
patient size [113]. The relative dose (Rsize) is defined as the ratio of the dose in a water
cylinder that has a mass equivalent to a patient of a specified size divided by the
corresponding dose in a water cylinder that has a mass equivalent to the ImPACT
anthropomorphic phantom (i.e., normal sized adult). The size metrics used in this study
relate to patient weight W (i.e., RW) and the body Antero-Posterior (AP) thickness (i.e.,
RAP). Relative doses in cylindrical water phantoms of varying sizes for representative CT
spectra ranging from 80 to 140 kV are available in the scientific literature [224].
The ImPACT phantom has a nominal weight (W) of 70 kg, and an antero-
posterior (AP) dimension in the chest of 23.4 cm, and in the abdomen of 22 cm [244,
245]. We used data in the scientific literature to generate both weight based adult patient
size correction factors RW as well as AP adult size correction factors RAP that can be
applied for adult chest [245] and abdomen/pelvis [244, 246] CT examinations. Since
radiation risk is directly proportional to organ doses, RW and RAP factors can be used to
adjust the radiation risk obtained for a 70 kg patient to be scaled to other adult sizes.
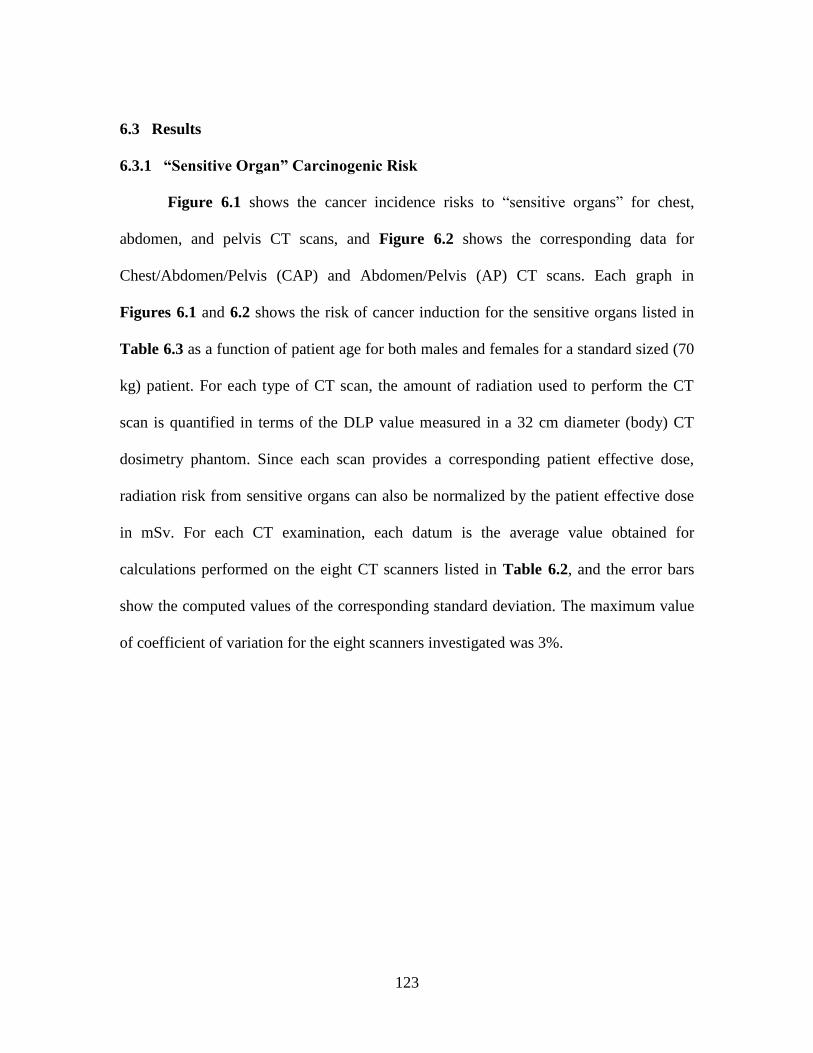
123
6.3 Results
6.3.1 “Sensitive Organ” Carcinogenic Risk
Figure 6.1 shows the cancer incidence risks to ―sensitive organs‖ for chest,
abdomen, and pelvis CT scans, and Figure 6.2 shows the corresponding data for
Chest/Abdomen/Pelvis (CAP) and Abdomen/Pelvis (AP) CT scans. Each graph in
Figures 6.1 and 6.2 shows the risk of cancer induction for the sensitive organs listed in
Table 6.3 as a function of patient age for both males and females for a standard sized (70
kg) patient. For each type of CT scan, the amount of radiation used to perform the CT
scan is quantified in terms of the DLP value measured in a 32 cm diameter (body) CT
dosimetry phantom. Since each scan provides a corresponding patient effective dose,
radiation risk from sensitive organs can also be normalized by the patient effective dose
in mSv. For each CT examination, each datum is the average value obtained for
calculations performed on the eight CT scanners listed in Table 6.2, and the error bars
show the computed values of the corresponding standard deviation. The maximum value
of coefficient of variation for the eight scanners investigated was 3%.
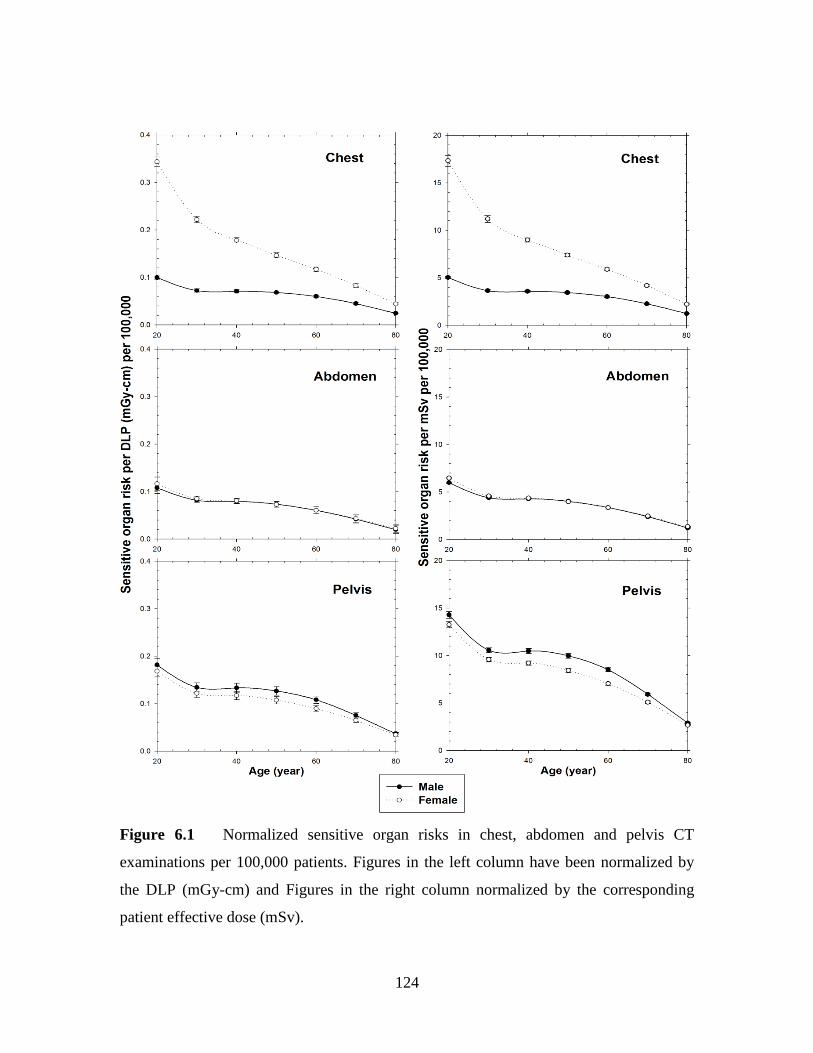
124
Figure 6.1 Normalized sensitive organ risks in chest, abdomen and pelvis CT
examinations per 100,000 patients. Figures in the left column have been normalized by
the DLP (mGy-cm) and Figures in the right column normalized by the corresponding
patient effective dose (mSv).
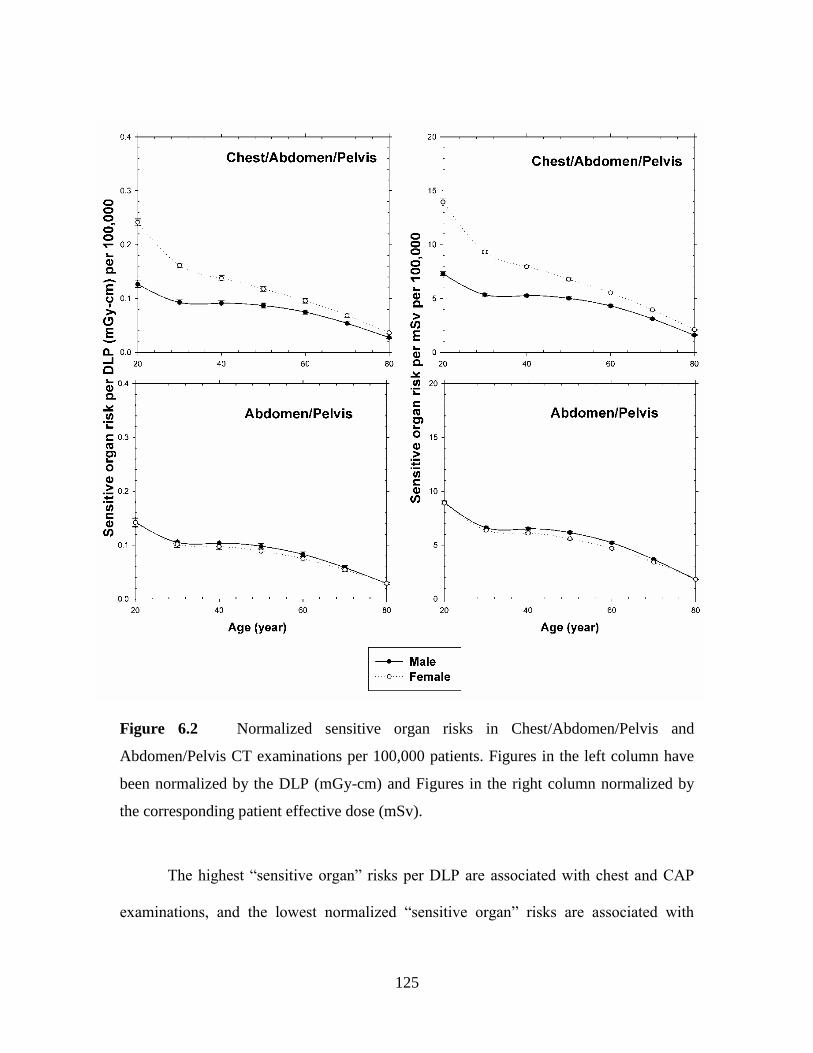
125
Figure 6.2 Normalized sensitive organ risks in Chest/Abdomen/Pelvis and
Abdomen/Pelvis CT examinations per 100,000 patients. Figures in the left column have
been normalized by the DLP (mGy-cm) and Figures in the right column normalized by
the corresponding patient effective dose (mSv).
The highest ―sensitive organ‖ risks per DLP are associated with chest and CAP
examinations, and the lowest normalized ―sensitive organ‖ risks are associated with
126
abdominal examinations. For CT examinations that include the chest, female ―sensitive
organ‖ risks are markedly higher than those for males, whereas for examinations that
include the pelvis, ―sensitive organ‖ risks in males are slightly higher than those in
females. In abdominal CT scans, ―sensitive organ‖ risks in males and female patients are
essentially identical. As expected, the there is a marked reduction in ―sensitive organ‖
radiation risks with increase in patient age. For abdominal CT scans, for example,
increasing the patient age from 20 to 80 resulted in a reduction in patient ―sensitive
organ‖ risks of nearly a factor of five.
6.3.2 Relative Organ Sensitivity
Figure 6.3 shows the contributions of each of the eight male ―sensitive organs‖ to
the total cancer risk for males and Figure 6.4 shows the corresponding contribution of
each of ten female ―sensitive organs‖ to the total cancer risk for females. Data shown in
Figure 6.2 and 6.3 have been averaged over eight scanners (Table 6.2), and error bars
show the corresponding standard deviations.
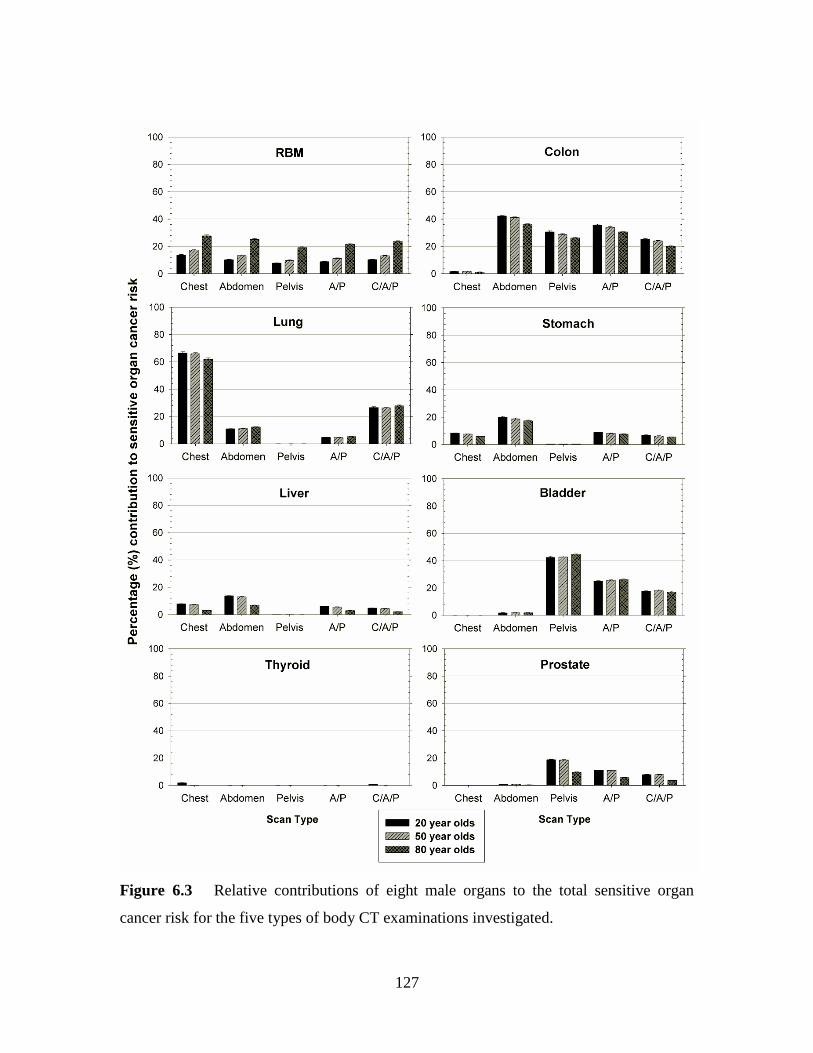
127
Figure 6.3 Relative contributions of eight male organs to the total sensitive organ
cancer risk for the five types of body CT examinations investigated.
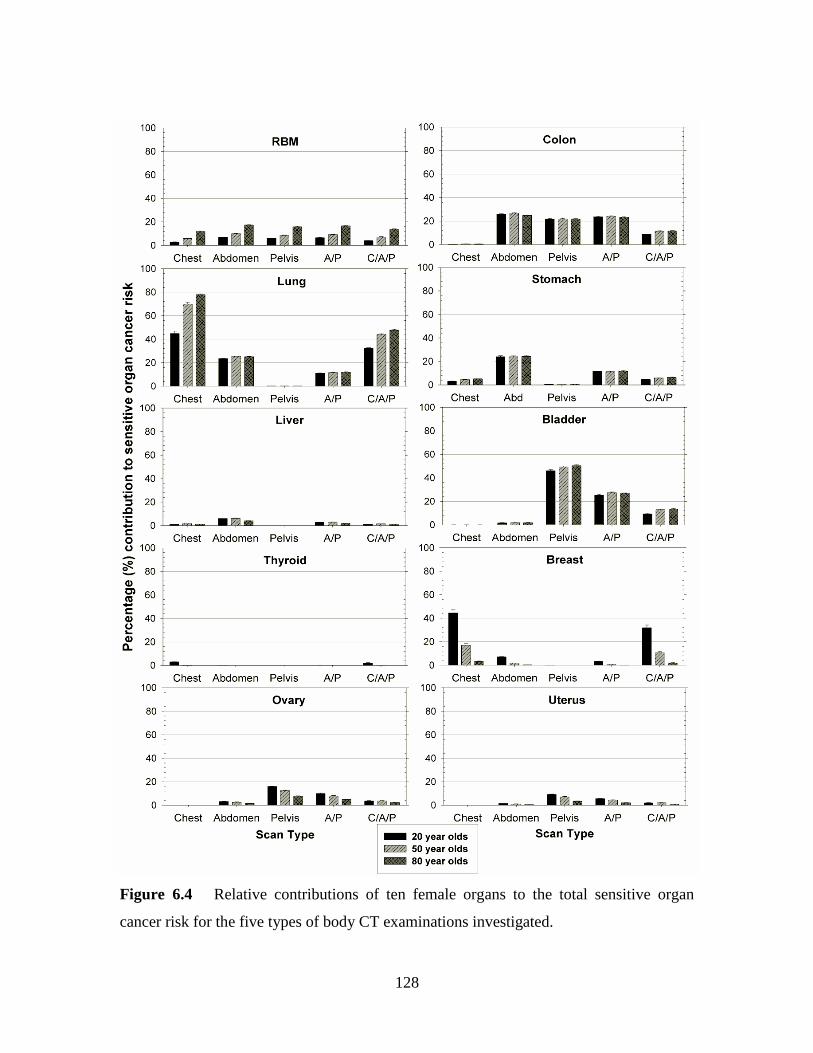
128
Figure 6.4 Relative contributions of ten female organs to the total sensitive organ
cancer risk for the five types of body CT examinations investigated.
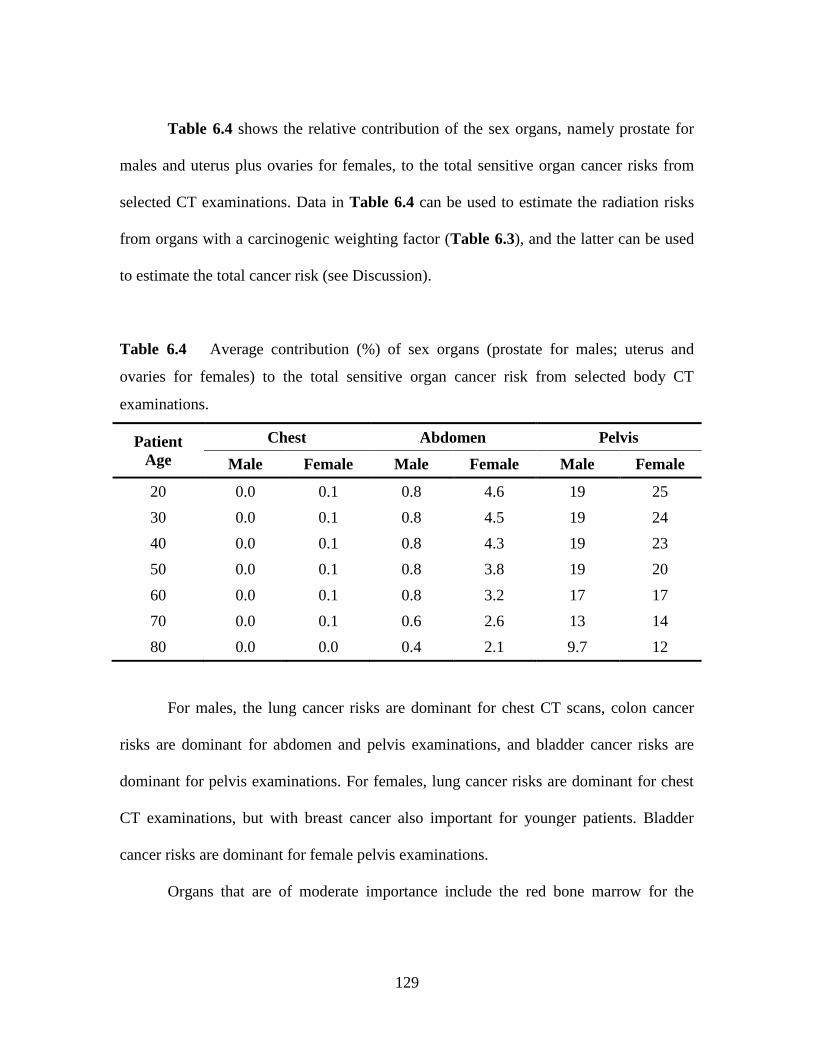
129
Table 6.4 shows the relative contribution of the sex organs, namely prostate for
males and uterus plus ovaries for females, to the total sensitive organ cancer risks from
selected CT examinations. Data in Table 6.4 can be used to estimate the radiation risks
from organs with a carcinogenic weighting factor (Table 6.3), and the latter can be used
to estimate the total cancer risk (see Discussion).
Table 6.4 Average contribution (%) of sex organs (prostate for males; uterus and
ovaries for females) to the total sensitive organ cancer risk from selected body CT
examinations.
Patient
Age
Chest Abdomen Pelvis
Male Female Male Female Male Female
20 0.0 0.1 0.8 4.6 19 25
30 0.0 0.1 0.8 4.5 19 24
40 0.0 0.1 0.8 4.3 19 23
50 0.0 0.1 0.8 3.8 19 20
60 0.0 0.1 0.8 3.2 17 17
70 0.0 0.1 0.6 2.6 13 14
80 0.0 0.0 0.4 2.1 9.7 12
For males, the lung cancer risks are dominant for chest CT scans, colon cancer
risks are dominant for abdomen and pelvis examinations, and bladder cancer risks are
dominant for pelvis examinations. For females, lung cancer risks are dominant for chest
CT examinations, but with breast cancer also important for younger patients. Bladder
cancer risks are dominant for female pelvis examinations.
Organs that are of moderate importance include the red bone marrow for the
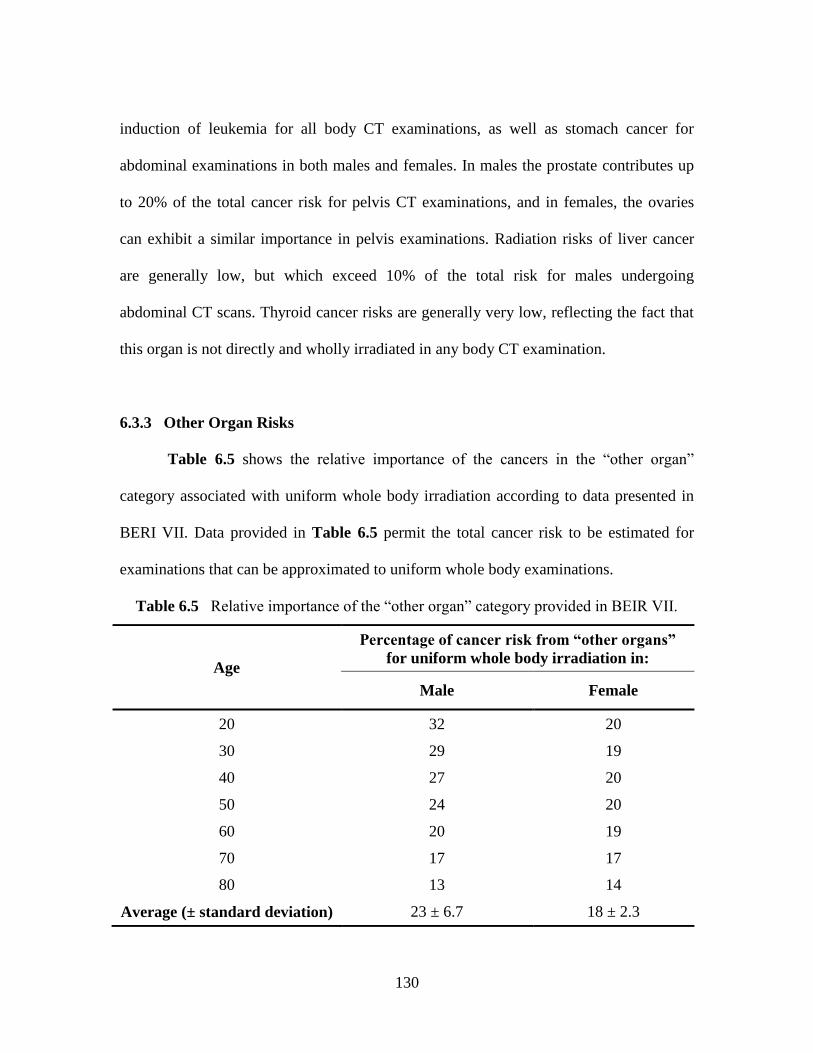
130
induction of leukemia for all body CT examinations, as well as stomach cancer for
abdominal examinations in both males and females. In males the prostate contributes up
to 20% of the total cancer risk for pelvis CT examinations, and in females, the ovaries
can exhibit a similar importance in pelvis examinations. Radiation risks of liver cancer
are generally low, but which exceed 10% of the total risk for males undergoing
abdominal CT scans. Thyroid cancer risks are generally very low, reflecting the fact that
this organ is not directly and wholly irradiated in any body CT examination.
6.3.3 Other Organ Risks
Table 6.5 shows the relative importance of the cancers in the ―other organ‖
category associated with uniform whole body irradiation according to data presented in
BERI VII. Data provided in Table 6.5 permit the total cancer risk to be estimated for
examinations that can be approximated to uniform whole body examinations.
Table 6.5 Relative importance of the ―other organ‖ category provided in BEIR VII.
Age
Percentage of cancer risk from “other organs”
for uniform whole body irradiation in:
Male Female
20 32 20
30 29 19
40 27 20
50 24 20
60 20 19
70 17 17
80 13 14
Average (± standard deviation) 23 ± 6.7 18 ± 2.3
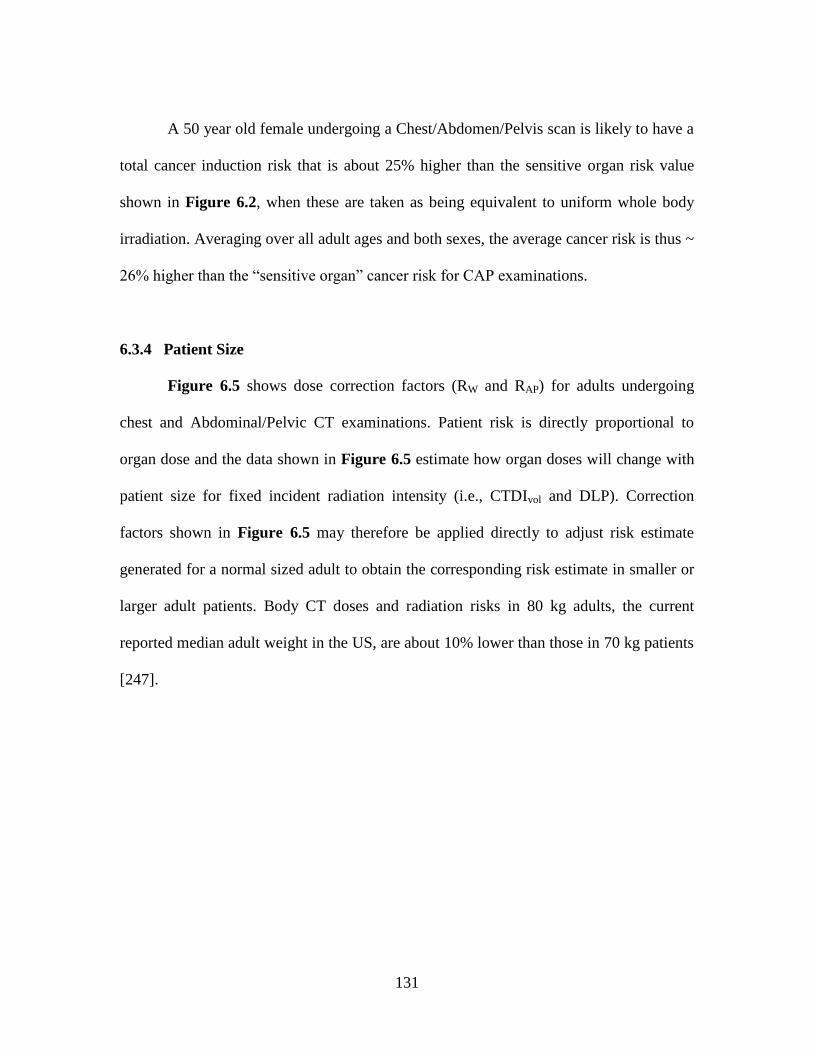
131
A 50 year old female undergoing a Chest/Abdomen/Pelvis scan is likely to have a
total cancer induction risk that is about 25% higher than the sensitive organ risk value
shown in Figure 6.2, when these are taken as being equivalent to uniform whole body
irradiation. Averaging over all adult ages and both sexes, the average cancer risk is thus ~
26% higher than the ―sensitive organ‖ cancer risk for CAP examinations.
6.3.4 Patient Size
Figure 6.5 shows dose correction factors (RW and RAP) for adults undergoing
chest and Abdominal/Pelvic CT examinations. Patient risk is directly proportional to
organ dose and the data shown in Figure 6.5 estimate how organ doses will change with
patient size for fixed incident radiation intensity (i.e., CTDIvol and DLP). Correction
factors shown in Figure 6.5 may therefore be applied directly to adjust risk estimate
generated for a normal sized adult to obtain the corresponding risk estimate in smaller or
larger adult patients. Body CT doses and radiation risks in 80 kg adults, the current
reported median adult weight in the US, are about 10% lower than those in 70 kg patients
[247].
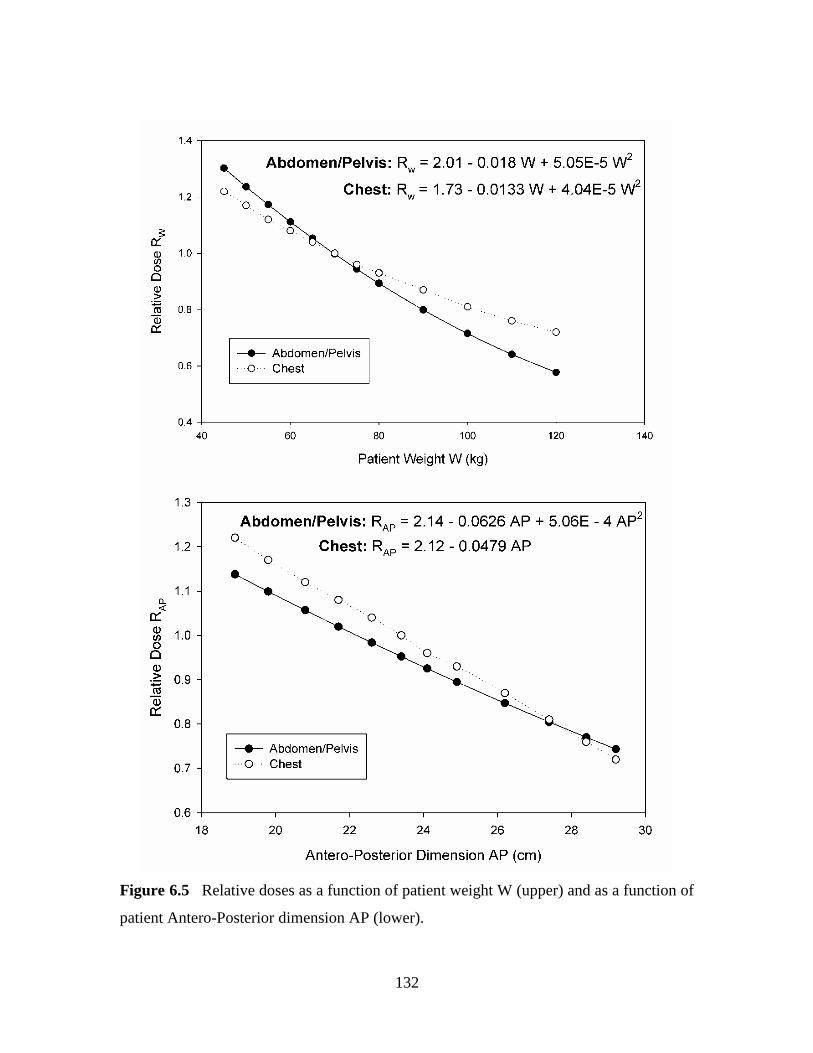
132
Figure 6.5 Relative doses as a function of patient weight W (upper) and as a function of
patient Antero-Posterior dimension AP (lower).

133
6.4 Discussion
Subtracting the risk attributed to the ―sex organs‖ (Table 6.4) from the sensitive
organ cancer risks shown in Figures 6.1 and 6.2 yields the risk from the eight organs
listed in Table 6.1 that have individual ICRP tissue weighting factors [47]. Knowledge of
the risk from these eight organs permits an estimate to be obtained of the total cancer risk
by analyzing the relative importance of these organs when computing total effective
doses after any genetic component has been excluded. The last column of Table 6.2
shows the relative importance of these eight organs to the total carcinogenic detriment
which were generated from effective doses computed in the ImPACT spreadsheet for the
eight CT scanners listed in Table 6.1. Data in Table 6.2, together with data in Table 6.4,
permit a crude estimate of the total cancer risk to be obtained that takes into account both
―sensitive organs‖ and the ―other category‖.
Consider a 70 kg 50 year old female who has a chest CT scan with a DLP of 450
mGy-cm (CTDIvol of 15 mGy and scan length of 30 cm). Using data shown in Figure
6.1, the ―sensitive organ‖ cancer induction risk for this patient would be 68 per 100,000
examinations. Data in Table 6.4 show that for females the ―sex organ‖ contribution to
this risk is negligible (0.1%), and data in Table 6.2 show that the eight listed organs
account for 78% of the total cancer detriment. In this example, the patient cancer
―sensitive organ‖ cancer risk of 68 per 100,000 should be increased to 87 per 100,000
(i.e., 0.089%) to account for contributions from the ―other organ‖ category. It is
important to use data shown in Table 6.2 as a guide, and not an exact algorithm, because
the ICRP tissue weighting factors used for computing effective doses are averaged over
134
age and weight, and account for detrminent attributed to both cancer and genetic effects
[241, 242].
Patient risks in CT imaging clearly may be obtained directly from DLP data
without computing the corresponding effective dose. However, there are benefits to
retaining the effective dose metric which provides a practical quantitative indicator as the
amount of radiation a patient received by patient [48, 240]. The effective dose in a CT
examination can be compared with effective dose from other examinations, and provides
a valuable context when compared with benchmark effective doses such as natural
background [234, 236]. When effective doses are converted into risk values as depicted
in Figures 6.1 and 6.2, the specific value of the weighting factor for any organ does not
affect the result patient risk. This can be illustrated by considering a radiological
examination that exposes one single organ with an arbitrary tissue weighting factor w,
and assume this organ receives dose D resulting in a cancer risk R. The patient effective
dose would be (D x w), and the risk per effective dose would be R/(D x w) so that the
risk from effective dose (D x w) is R, and is always independent of tissue weighing
factor.
It is important to note that the methodology developed in this paper is based on
adult patients [38, 222]. Children cannot be assumed to be simply small adults, because
the relative proportions of different organs and tissues change with age [248]. For
example, the size of a newborn head relative to the body changes dramatically with
increasing age. In addition, the relative importance of scatter radiation will be much
higher in infants than in adult because of reduced distances as well as reduction of

135
attenuation of intervening tissues [249]. Specifically, patient size correction factors given
in Figure 6.5 should not be used to estimate either effective doses or radiation risks to
any pediatric patient undergoing CT examinations. Risks to pediatric patients undergoing
CT examinations would need to explicitly taken into account the fact at constant CT
radiation intensity (DLP), effective doses increase sharply with decreasing age [227], and
that at constant effective dose, radiation risks also increase sharply with decreasing age
[243].
At high radiation doses, there is little disagreement about the carcinogenic effects
of ionizing radiation. As dose levels are progressively reduced, however, the amount of
empirical data on the harmful effects of x-ray exposures progressively diminishes. With
less empirical data, that is also subject to a range of possible interpretation, controversies
regarding harmful effects of radiation increase [250]. BEIR VII, for example, provides
risk estimates for organ doses of 100 mGy that implicitly serve to alert users that
extrapolating risks to 10 or 1 mGy is associated with large uncertainties [243]. Major
scientific bodies, including the Committee on the Biological Effects of Ionizing Radiation
[243], International Committee on Radiological Protection [47], and the United Nations
Scientific Committee on the Effects of Atomic Radiation [251] all assume that for
radiation protection purposes, radiation risks exist at low doses. Accordingly, it is
reasonable to assume that the quantitative risk estimates derived in this study are the most
accurate approximations currently available, albeit associated with large uncertainties
[243, 250].
To fully appreciate the significance of any medical radiation exposure, nominal
136
cancer risk of the type reported in this study would need to be converted into a measure
of detriment [252, 253]. Patient detriment should take into account the relative
importance of cancer incidence and cancer mortality, as well as issues that relate to
quality of life [47]. Of paramount importance, however, is the well known fact that there
is a relatively long latent period associated with radiation induced cancer [254]. For
leukemia, latent periods are generally considered to be of the order of a few years,
whereas for many solid tumors, latent periods are measured in decades. A 50 year old
male having a chest CT examination with an effective dose of 10 mSv has a nominal
cancer risk of about 0.04%. However, if this individual‘s life expectancy were only one
to two years, because of some underlying medical condition, it is likely that his/her true
radiation induced detriment would be taken as being zero.
Risk conversion factors can be used to estimate the potential risk for cancer
induction for any individual patient at body CT, and thereby provide a rational basis for
weighing expected benefits against potential risks [220, 255]. A recent study has shown
that in cardiac CT, individualized median cancer induction risks in sensitive organs for
males and females of 0.065% and 0.176%, respectively [215]. Awareness of radiation
risks also encourages practitioners to take appropriate steps to keep all patient exposures
as low as reasonably achievable (ALARA), particular in MDCT imaging [203].
Furthermore, the fact that radiation risks in CT imaging are finite promotes the
development of protocols and technology that could reduce patient exposures without
adversely impacting on diagnostic performance [217, 256, 257].
137
6.5 Conclusion
The medical imaging community requires an estimate of individual patient
radiation-induced carcinogenic risks in order to identify that patient benefits exceed (any)
risk during indicated examinations. The amount of radiation used to perform body CT
examinations (DLP) is always available to medical staff. This paper describes a method
for estimating organ doses and the corresponding organ risks for normal sized patients
based on the DLP values used to perform the CT examination. Correction factors based
on patient weight or AP dimension are also provided which permit a nominal patient risk
to be obtained for different-sized adults undergoing any type of body CT examination.
Computation of the corresponding radiation risks thus explicitly take into account the
amount of radiation used to perform the CT examination, the body region exposed, as
well as patient physical characteristics. These individualized radiation risks are the best
currently achievable estimates, and can be used to educate the medical imaging
community about adult risks associated with body CT examinations. This knowledge is
essential for justifying body CT examinations so that exposed patients receive a net
benefit.

138
CHAPTER 7 PHOTON ENERGY, RADIATION DOSE AND IMAGE QUALITY IN
INTERVENTIONAL RADIOLOGY
7.1 Introduction
One of the most challenging dilemmas in diagnostic radiology is to obtain a
desired image quality while keeping the radiation doses to a patient as low as reasonably
achievable (ALARA) [258, 259]. It is well known that increasing the x-ray tube voltage
can reduce the skin entrance dose and decrease the image contrast at the same time.
Imaging with lower tube voltage improves image contrast, but may also increase the
entrance skin dose and patient dose [260, 261]. However, there have been few thorough
studies investigating the relationship between the radiation dose and x-ray tube voltage
under fixed image quality.
The purpose of the presented study is to investigate the skin dose and energy
imparted under different incident photon energy levels with constant image quality.
Based on a simple geometry setting, we simulated cases by running Monte Carlo
simulations on the Clemson Palmetto Cluster [262] with small relative errors. The impact
of incident photon energy on the skin dose as well as total energy imparted was analyzed
under different imaging scenarios, according to whether grids are utilized.
7.2 Method
7.2.1 Simulation Geometry
Figure 7.1 shows a schematic of the geometry for simulation cases used in this
study. The irradiation geometry consisted of a monoenergetic x-ray source, a water
cylinder with 15 cm depth along the x-ray beam, and an imaging plane 5 cm away from
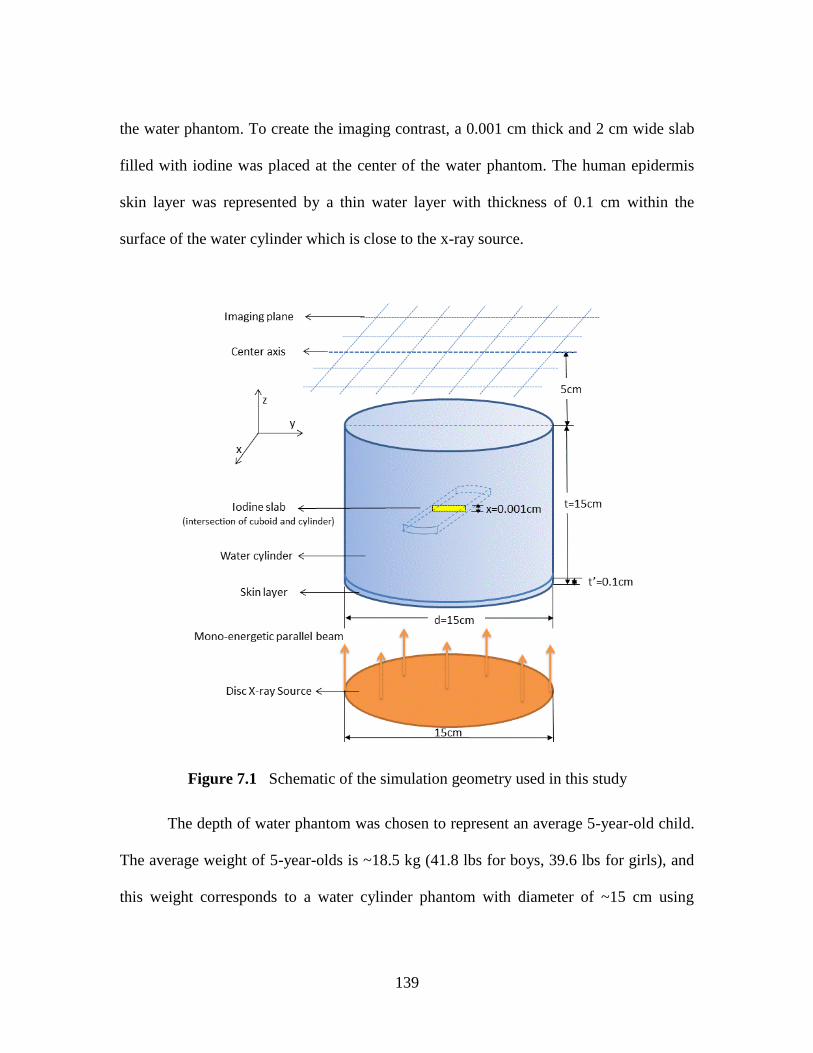
139
the water phantom. To create the imaging contrast, a 0.001 cm thick and 2 cm wide slab
filled with iodine was placed at the center of the water phantom. The human epidermis
skin layer was represented by a thin water layer with thickness of 0.1 cm within the
surface of the water cylinder which is close to the x-ray source.
Figure 7.1 Schematic of the simulation geometry used in this study
The depth of water phantom was chosen to represent an average 5-year-old child.
The average weight of 5-year-olds is ~18.5 kg (41.8 lbs for boys, 39.6 lbs for girls), and
this weight corresponds to a water cylinder phantom with diameter of ~15 cm using
140
methods in previously published research [263]. The 5-year-old patient phantom in
PCXMC software also has the AP dimension of 15 cm.
The x-ray source was modeled as a surface source which projects parallel x-ray
beams perpendicular to the surface of the water phantom. X-rays were confined to just
cover the geometry. Simulations were performed using monoenergetic x-rays with
energies ranging from 35 keV to 80 keV.
Monte Carlo simulations were performed using MCNP5 codes (Los Alamos
National Laboratory) [264]. The track length cell energy deposition tallies (F6 tallies) in
MCNP were used to obtain the radiation dose to the skin layer, the iodine block and the
water cube separately. The point flux detector tallies (F5 tallies) were used to obtain the
photon fluences on the image plane. The flux image radiography tallies FIR5 were used
on the imaging plane with 0.2 cm x 0.2 cm sized grids. One million photons were used
for each of the simulations, which were performed on the Clemson Palmetto Cluster
distributed computing system (1,978 nodes and 20,728 cores) [262].
7.2.2 Image Quality
The image quality quantities investigated in this study include contrast, noise, and
contrast-to-noise ratio (CNR).
Contrast (C) was defined as the difference between the photon fluence value
within the unit area and background fluence normalized by the total photon fluence
(including scatter) in the background.
211
21
SP
PPContrast
,
(7.1)

141
where ΦP1 and ΦP2 are the primary photon fluences (number of photons per unit area) in
the background and region of interest correspondingly, and ΦS1 is the scattered photon
fluence in the background.
Noise was defined as energy weighted quantum noise. Increasing the number of
incident photons will cause the decrease of relative noise; when scatter exists, the relative
noise will increase.
(7.2)
where (E)S is the probability density function of S with energy as the variable, and EP1
and ES1 are the energy levels of the primary and scattered photons in the background.
Contrast-to-noise ratio (CNR) was calculated as the ratio of the contrast and
noise.
(7.3)
For the different imaging scenarios investigated, the proportions of primary
photons and scattered photons were modulated. For scenario 1) without grids, all of the
scattered photons and primary photons were taken account into the calculation for the
image quality. For scenario 2) with 8:1 grids, all the image quality calculations were
1
0
1111
1
0
2
11
2
11
(E)
(E)
Re
S
E
SSPP
S
E
SSPP
dEEE
dEEE
elativeNois
1S
E
0
2
1S1S
2
1P1P
1S
E
0
1S1S1P1P
S1P
2P1P
dEE(E)E
dEE(E)E2
elativeNoisRe
ContrastCNR
142
performed assuming that 10% of the scattered photons and 70% of the primary photons
which penetrated the geometry reached the imaging plane.
7.2.3 Sampling Points for Calculations
As shown in Figure 7.2, in order to calculate Contrast, Noise, and CNR with the
simulation results, the average reading from y = -2 and y = 2 (cm) along the center axis of
the imaging plane was used as background (ΦP1, ΦS1); reading from y=0 (cm) was used
as the signal (ΦP2). The background sampling points were chosen because they are 1 cm
from the signal area and not likely to be in the line spread function region (which is
affected by the scattering from the signal area). Notice here that the photon flux at a point
is in fact the average flux to a 0.2 cm x 0.2 cm grid with the point at its center on the
imaging plane. The choice of the size of the sampling grids may have slight influence on
the accuracy of the flux result.

143
Figure 7.2 Illustration of sampling points on the imaging plane
The energy fluence for the primary photons (p) was obtained by the calculating
the product of the primary photon fluence and the incident photon energy. The energy
fluence for the scattered photons (s) was calculated as product of scattered photon fluence
and the energy levels of scattered Compton photons.
7.2.4 Monte Carlo Validation
To validate the Monte Carlo simulation results, the analytically calculated surface
dose results were compared with MCNP simulation results generated using a simplified
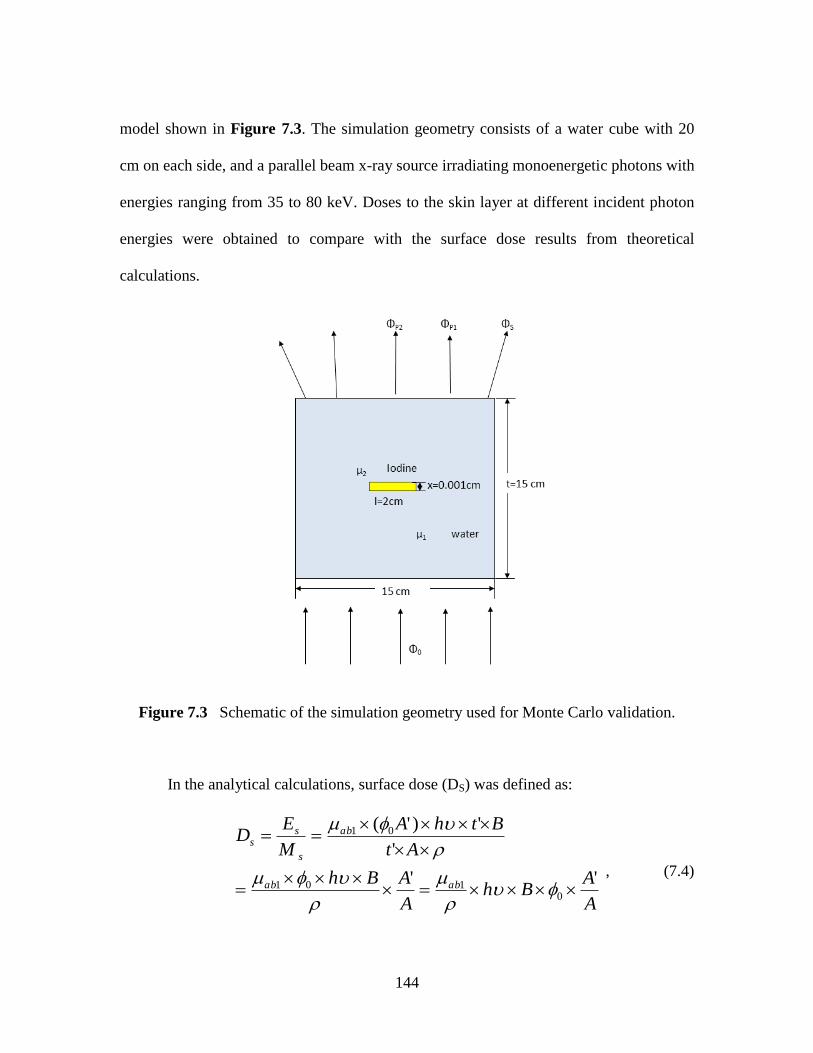
144
model shown in Figure 7.3. The simulation geometry consists of a water cube with 20
cm on each side, and a parallel beam x-ray source irradiating monoenergetic photons with
energies ranging from 35 to 80 keV. Doses to the skin layer at different incident photon
energies were obtained to compare with the surface dose results from theoretical
calculations.
Figure 7.3 Schematic of the simulation geometry used for Monte Carlo validation.
In the analytical calculations, surface dose (DS) was defined as:
A
ABh
A
ABh
At
BthA
M
ED
abab
ab
s
ss
''
'
')'(
0101
01
, (7.4)
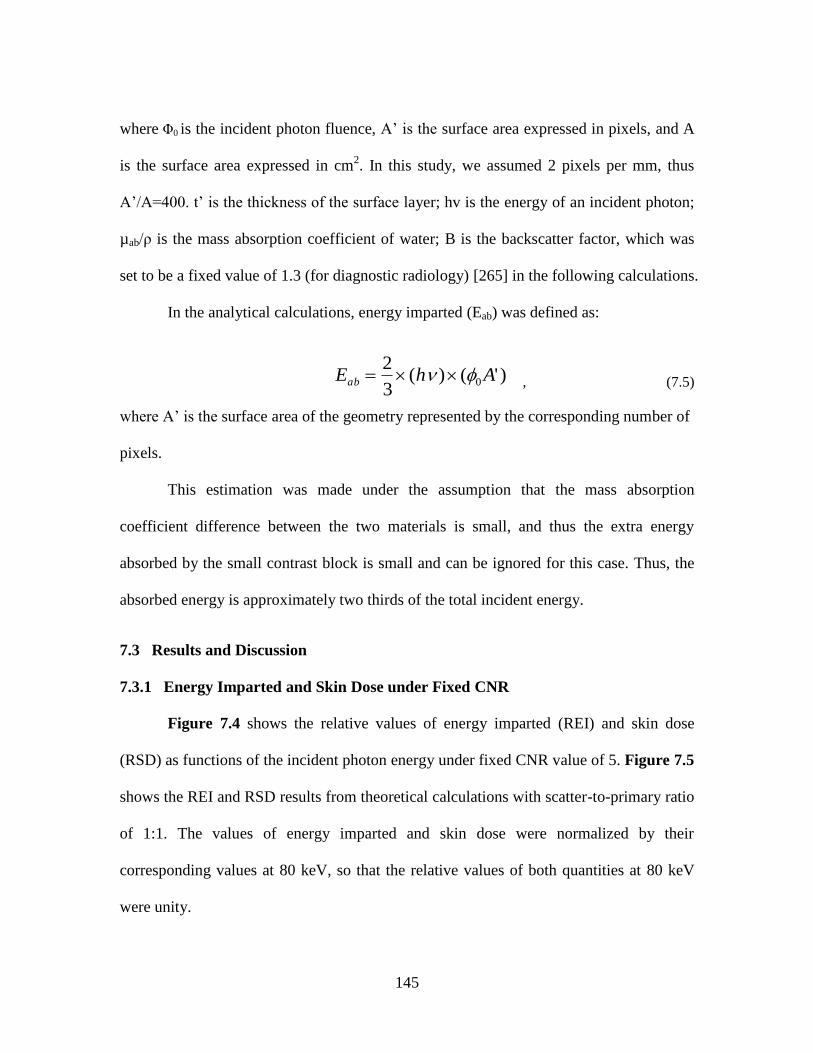
145
where Φ0 is the incident photon fluence, A‘ is the surface area expressed in pixels, and A
is the surface area expressed in cm2. In this study, we assumed 2 pixels per mm, thus
A‘/A=400. t‘ is the thickness of the surface layer; hv is the energy of an incident photon;
µab/ρ is the mass absorption coefficient of water; B is the backscatter factor, which was
set to be a fixed value of 1.3 (for diagnostic radiology) [265] in the following calculations.
In the analytical calculations, energy imparted (Eab) was defined as:
, (7.5)
where A‘ is the surface area of the geometry represented by the corresponding number of
pixels.
This estimation was made under the assumption that the mass absorption
coefficient difference between the two materials is small, and thus the extra energy
absorbed by the small contrast block is small and can be ignored for this case. Thus, the
absorbed energy is approximately two thirds of the total incident energy.
7.3 Results and Discussion
7.3.1 Energy Imparted and Skin Dose under Fixed CNR
Figure 7.4 shows the relative values of energy imparted (REI) and skin dose
(RSD) as functions of the incident photon energy under fixed CNR value of 5. Figure 7.5
shows the REI and RSD results from theoretical calculations with scatter-to-primary ratio
of 1:1. The values of energy imparted and skin dose were normalized by their
corresponding values at 80 keV, so that the relative values of both quantities at 80 keV
were unity.
)'()(3
20 AhEab
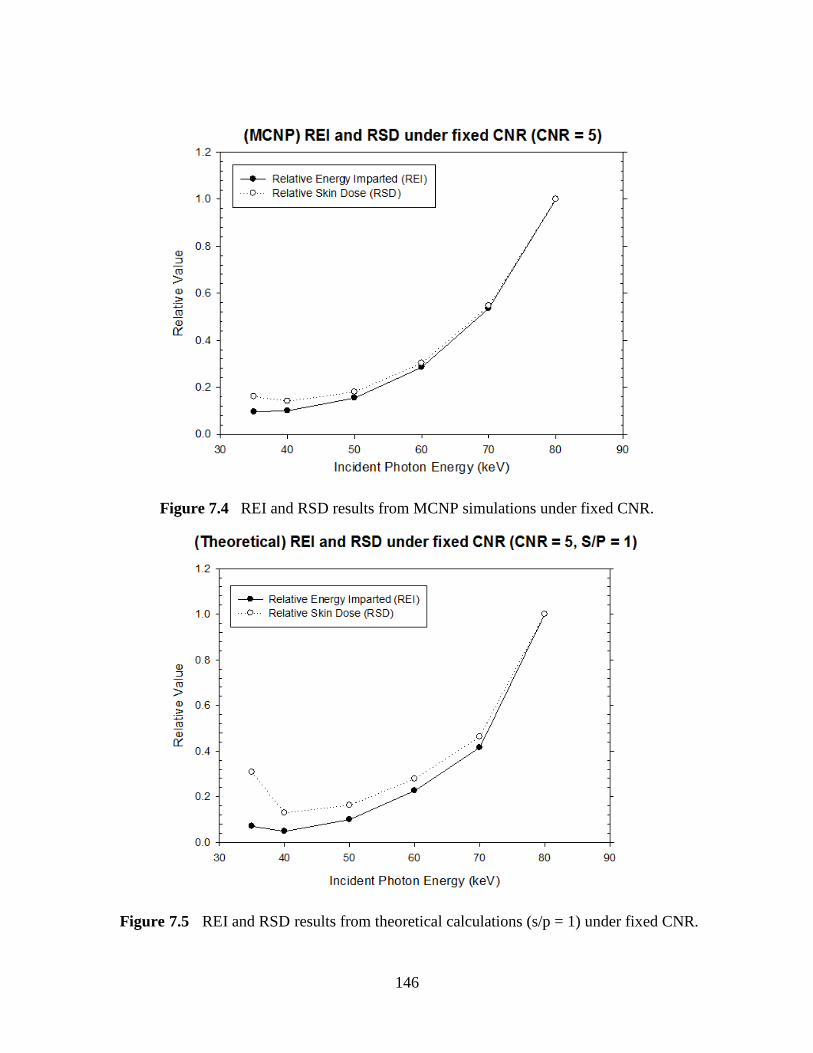
146
Figure 7.4 REI and RSD results from MCNP simulations under fixed CNR.
Figure 7.5 REI and RSD results from theoretical calculations (s/p = 1) under fixed CNR.
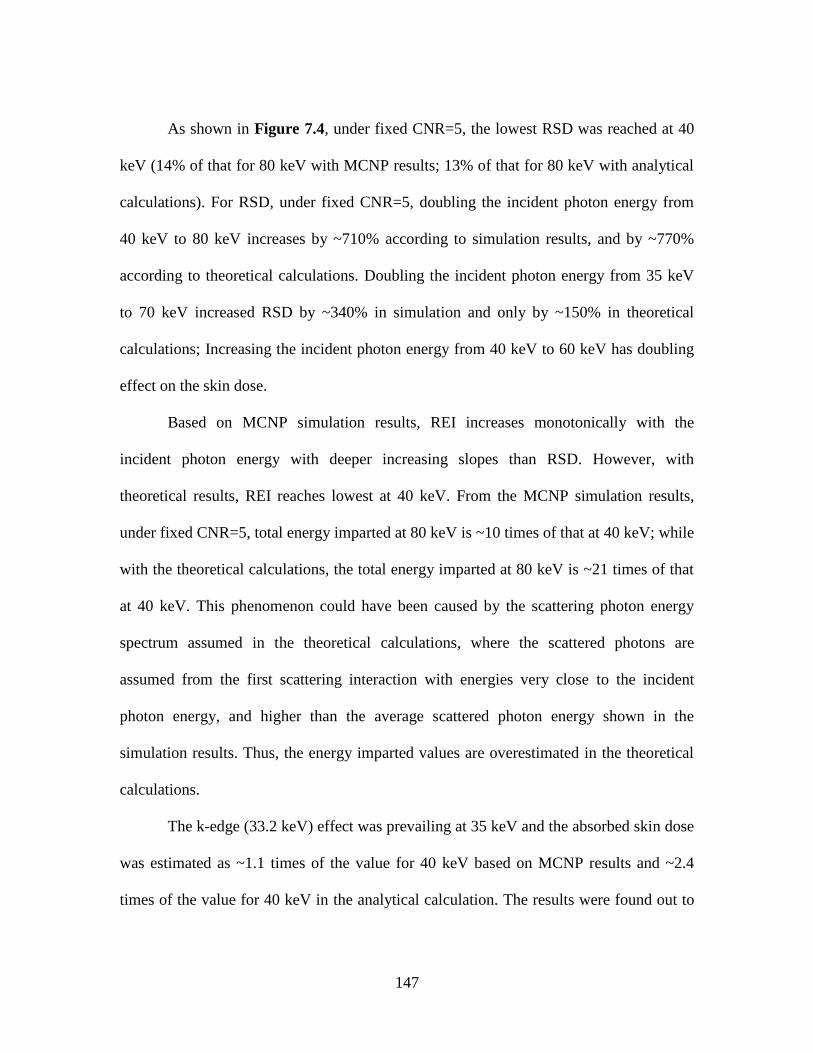
147
As shown in Figure 7.4, under fixed CNR=5, the lowest RSD was reached at 40
keV (14% of that for 80 keV with MCNP results; 13% of that for 80 keV with analytical
calculations). For RSD, under fixed CNR=5, doubling the incident photon energy from
40 keV to 80 keV increases by ~710% according to simulation results, and by ~770%
according to theoretical calculations. Doubling the incident photon energy from 35 keV
to 70 keV increased RSD by ~340% in simulation and only by ~150% in theoretical
calculations; Increasing the incident photon energy from 40 keV to 60 keV has doubling
effect on the skin dose.
Based on MCNP simulation results, REI increases monotonically with the
incident photon energy with deeper increasing slopes than RSD. However, with
theoretical results, REI reaches lowest at 40 keV. From the MCNP simulation results,
under fixed CNR=5, total energy imparted at 80 keV is ~10 times of that at 40 keV; while
with the theoretical calculations, the total energy imparted at 80 keV is ~21 times of that
at 40 keV. This phenomenon could have been caused by the scattering photon energy
spectrum assumed in the theoretical calculations, where the scattered photons are
assumed from the first scattering interaction with energies very close to the incident
photon energy, and higher than the average scattered photon energy shown in the
simulation results. Thus, the energy imparted values are overestimated in the theoretical
calculations.
The k-edge (33.2 keV) effect was prevailing at 35 keV and the absorbed skin dose
was estimated as ~1.1 times of the value for 40 keV based on MCNP results and ~2.4
times of the value for 40 keV in the analytical calculation. The results were found out to
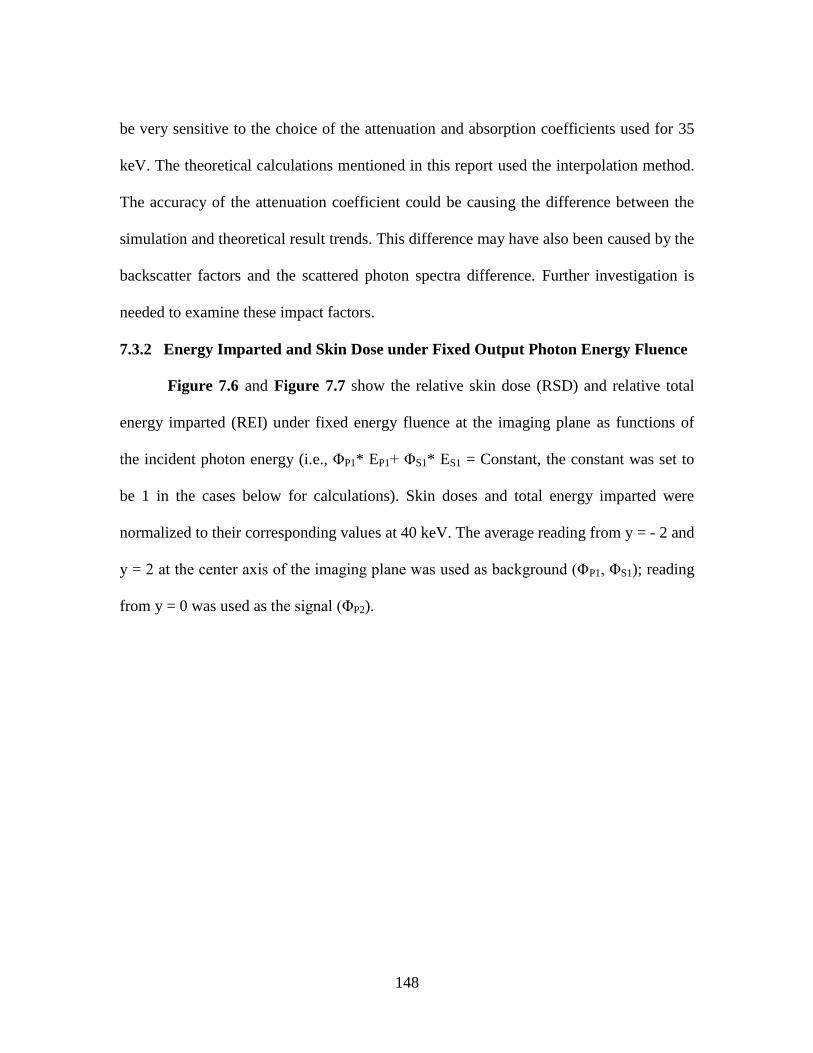
148
be very sensitive to the choice of the attenuation and absorption coefficients used for 35
keV. The theoretical calculations mentioned in this report used the interpolation method.
The accuracy of the attenuation coefficient could be causing the difference between the
simulation and theoretical result trends. This difference may have also been caused by the
backscatter factors and the scattered photon spectra difference. Further investigation is
needed to examine these impact factors.
7.3.2 Energy Imparted and Skin Dose under Fixed Output Photon Energy Fluence
Figure 7.6 and Figure 7.7 show the relative skin dose (RSD) and relative total
energy imparted (REI) under fixed energy fluence at the imaging plane as functions of
the incident photon energy (i.e., ΦP1* EP1+ ΦS1* ES1 = Constant, the constant was set to
be 1 in the cases below for calculations). Skin doses and total energy imparted were
normalized to their corresponding values at 40 keV. The average reading from y = - 2 and
y = 2 at the center axis of the imaging plane was used as background (ΦP1, ΦS1); reading
from y = 0 was used as the signal (ΦP2).
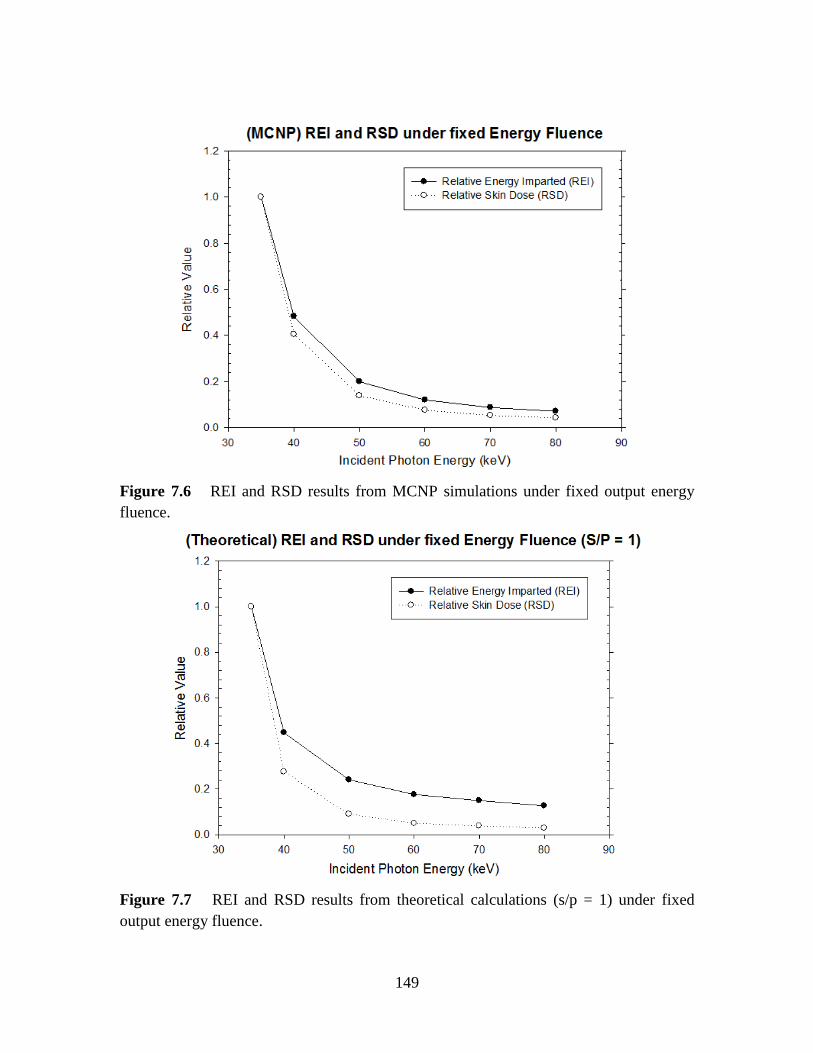
149
Figure 7.6 REI and RSD results from MCNP simulations under fixed output energy
fluence.
Figure 7.7 REI and RSD results from theoretical calculations (s/p = 1) under fixed
output energy fluence.
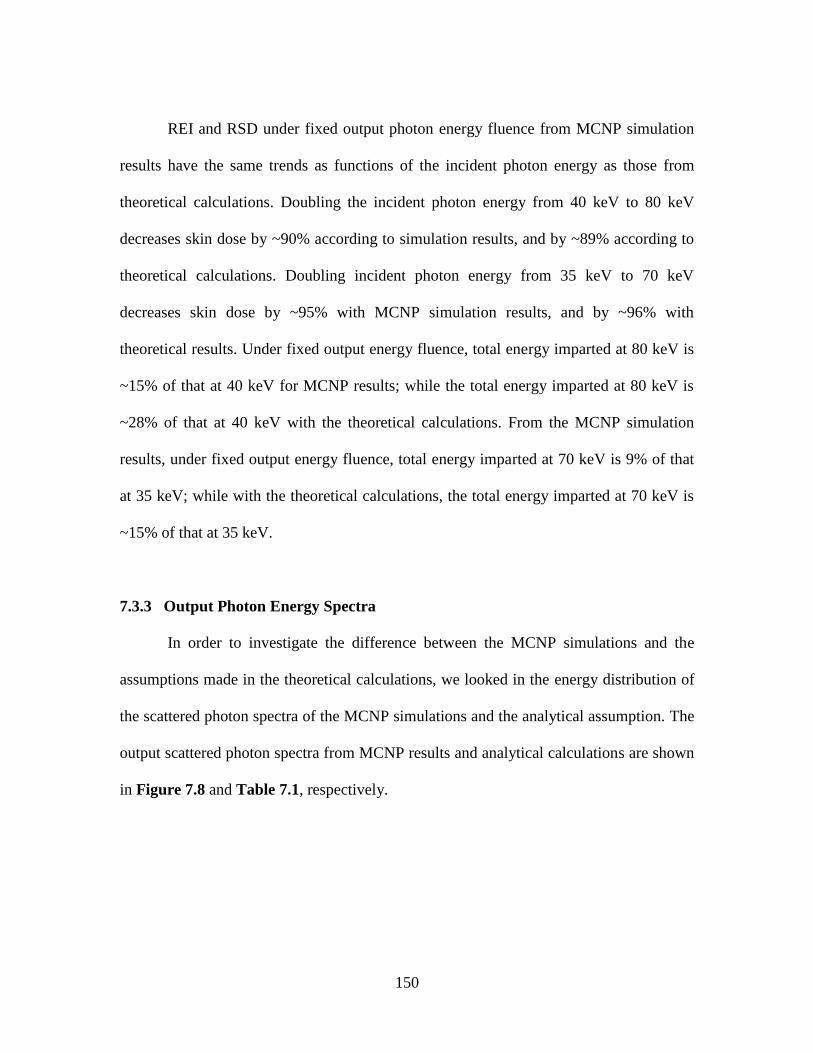
150
REI and RSD under fixed output photon energy fluence from MCNP simulation
results have the same trends as functions of the incident photon energy as those from
theoretical calculations. Doubling the incident photon energy from 40 keV to 80 keV
decreases skin dose by ~90% according to simulation results, and by ~89% according to
theoretical calculations. Doubling incident photon energy from 35 keV to 70 keV
decreases skin dose by ~95% with MCNP simulation results, and by ~96% with
theoretical results. Under fixed output energy fluence, total energy imparted at 80 keV is
~15% of that at 40 keV for MCNP results; while the total energy imparted at 80 keV is
~28% of that at 40 keV with the theoretical calculations. From the MCNP simulation
results, under fixed output energy fluence, total energy imparted at 70 keV is 9% of that
at 35 keV; while with the theoretical calculations, the total energy imparted at 70 keV is
~15% of that at 35 keV.
7.3.3 Output Photon Energy Spectra
In order to investigate the difference between the MCNP simulations and the
assumptions made in the theoretical calculations, we looked in the energy distribution of
the scattered photon spectra of the MCNP simulations and the analytical assumption. The
output scattered photon spectra from MCNP results and analytical calculations are shown
in Figure 7.8 and Table 7.1, respectively.
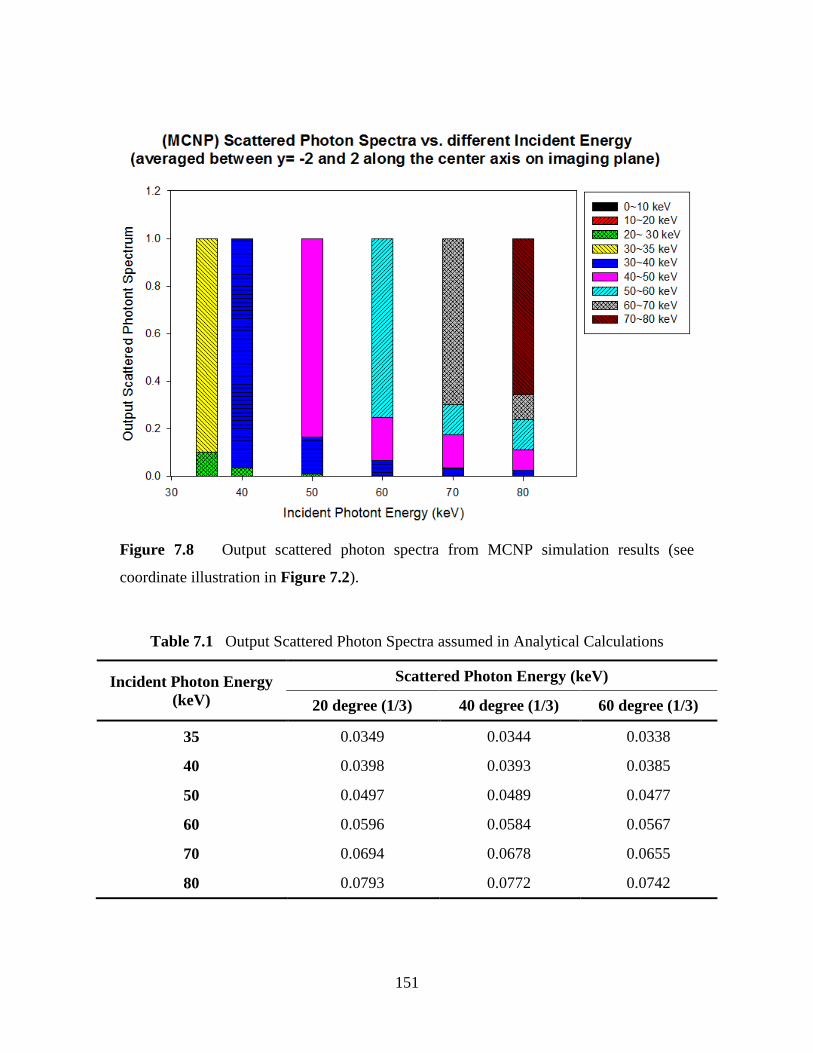
151
Figure 7.8 Output scattered photon spectra from MCNP simulation results (see
coordinate illustration in Figure 7.2).
Table 7.1 Output Scattered Photon Spectra assumed in Analytical Calculations
Incident Photon Energy
(keV)
Scattered Photon Energy (keV)
20 degree (1/3) 40 degree (1/3) 60 degree (1/3)
35 0.0349 0.0344 0.0338
40 0.0398 0.0393 0.0385
50 0.0497 0.0489 0.0477
60 0.0596 0.0584 0.0567
70 0.0694 0.0678 0.0655
80 0.0793 0.0772 0.0742
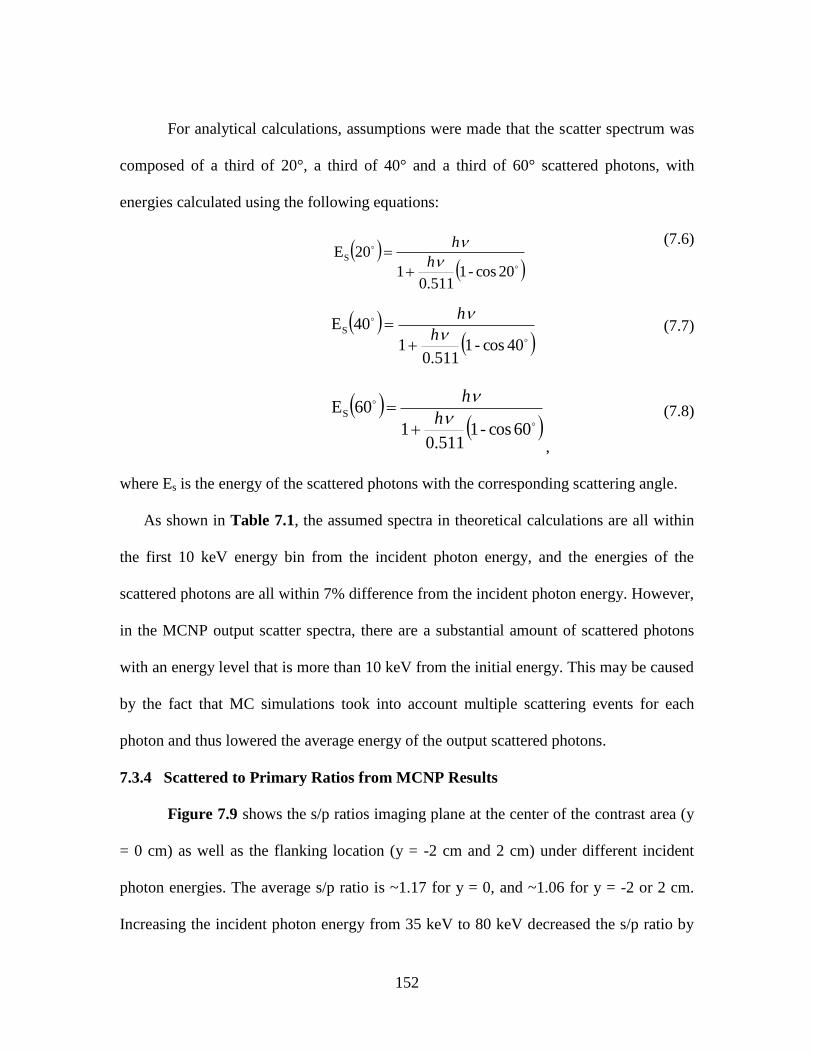
152
For analytical calculations, assumptions were made that the scatter spectrum was
composed of a third of 20°, a third of 40° and a third of 60° scattered photons, with
energies calculated using the following equations:
(7.6)
40cos-1511.0
1
40ES
h
h
(7.7)
60cos-1511.0
1
60ES
h
h
,
(7.8)
where Es is the energy of the scattered photons with the corresponding scattering angle.
As shown in Table 7.1, the assumed spectra in theoretical calculations are all within
the first 10 keV energy bin from the incident photon energy, and the energies of the
scattered photons are all within 7% difference from the incident photon energy. However,
in the MCNP output scatter spectra, there are a substantial amount of scattered photons
with an energy level that is more than 10 keV from the initial energy. This may be caused
by the fact that MC simulations took into account multiple scattering events for each
photon and thus lowered the average energy of the output scattered photons.
7.3.4 Scattered to Primary Ratios from MCNP Results
Figure 7.9 shows the s/p ratios imaging plane at the center of the contrast area (y
= 0 cm) as well as the flanking location (y = -2 cm and 2 cm) under different incident
photon energies. The average s/p ratio is ~1.17 for y = 0, and ~1.06 for y = -2 or 2 cm.
Increasing the incident photon energy from 35 keV to 80 keV decreased the s/p ratio by
20cos-1511.0
1
20ES
h
h
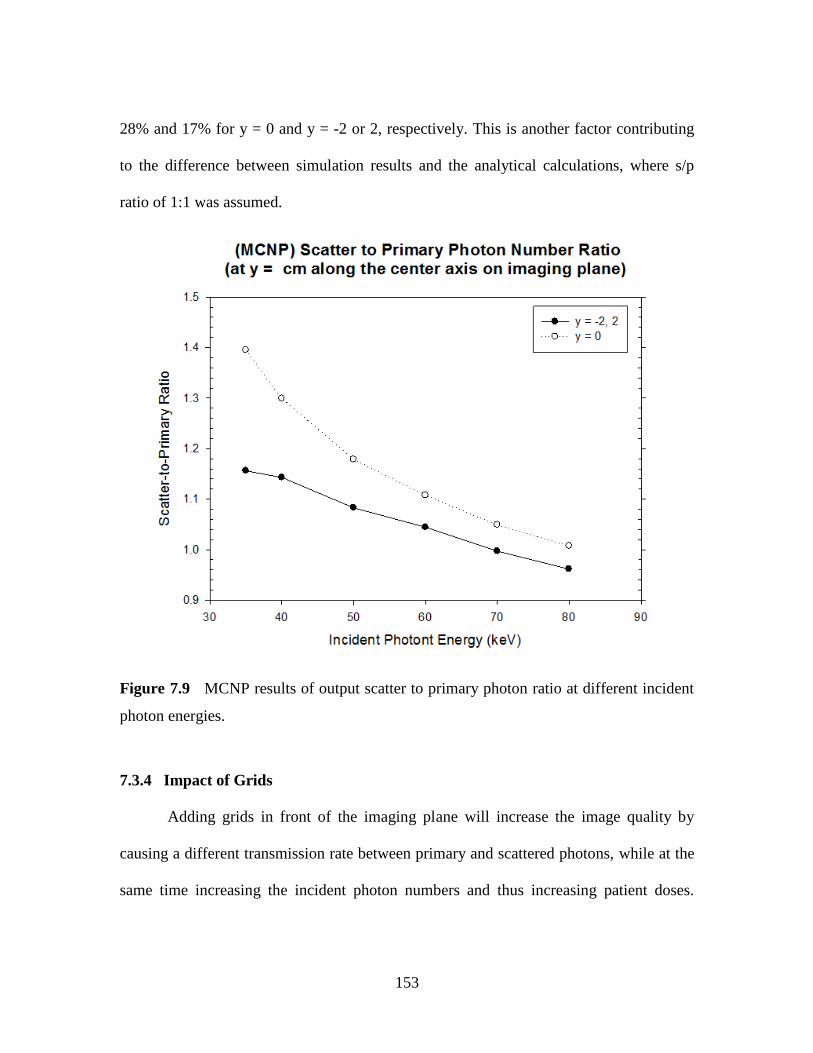
153
28% and 17% for y = 0 and y = -2 or 2, respectively. This is another factor contributing
to the difference between simulation results and the analytical calculations, where s/p
ratio of 1:1 was assumed.
Figure 7.9 MCNP results of output scatter to primary photon ratio at different incident
photon energies.
7.3.4 Impact of Grids
Adding grids in front of the imaging plane will increase the image quality by
causing a different transmission rate between primary and scattered photons, while at the
same time increasing the incident photon numbers and thus increasing patient doses.
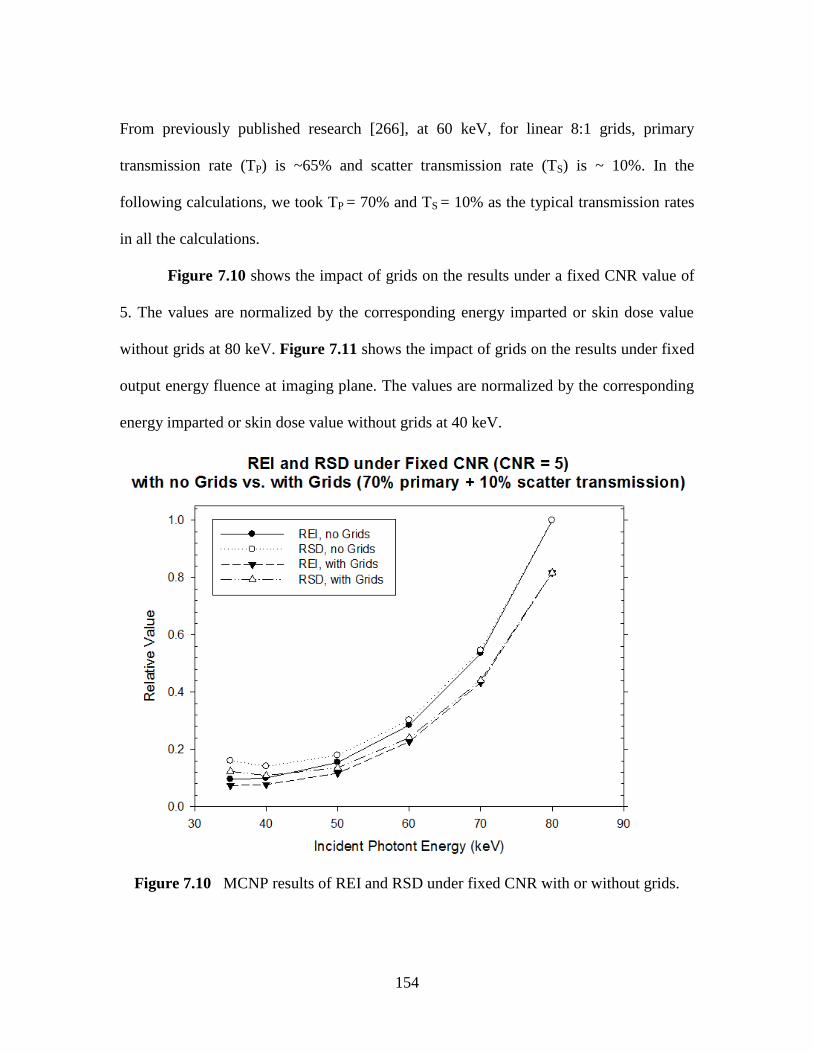
154
From previously published research [266], at 60 keV, for linear 8:1 grids, primary
transmission rate (TP) is ~65% and scatter transmission rate (TS) is ~ 10%. In the
following calculations, we took TP = 70% and TS = 10% as the typical transmission rates
in all the calculations.
Figure 7.10 shows the impact of grids on the results under a fixed CNR value of
5. The values are normalized by the corresponding energy imparted or skin dose value
without grids at 80 keV. Figure 7.11 shows the impact of grids on the results under fixed
output energy fluence at imaging plane. The values are normalized by the corresponding
energy imparted or skin dose value without grids at 40 keV.
Figure 7.10 MCNP results of REI and RSD under fixed CNR with or without grids.
155
Figure 7.11 MCNP results of REI and RSD under fixed output energy fluence with or
without grids.
The imaginary grids were assumed to permit 70% of the primary photons and 10%
of the scattered photons to transmit. As shown in Figure 7.10 and Figure 7.11, adding
these grids didn‘t affect the shape of the curves, which means it didn‘t change the
variation of the skin dose or the total energy imparted values as functions of the incident
photon energy. Under fixed CNR, adding the grids decreased skin dose and total energy
imparted by ~21% on average. Under fixed energy fluence at the receptor, adding the
grids increased skin dose and total energy imparted by ~64% on average.

156
7.4 Conclusion
In summary, the choice of x-ray tube voltage in interventional radiology
examinations affects both image quality and patient doses. Skin dose and energy
imparted are different radiation quantities that need to be taken into consideration,
depending on specific procedures. In order to keep radiation doses to patients as low as
reasonably achievable (ALARA), the amount of x-ray input used should be no more than
what is required to achieve a satisfactory image quality for effective diagnosis.
Our results showed that under a fixed image quality represented by CNR, energy
imparted increased with photon energy, while skin dose was not a monotonic function of
photon energy and reached its minimum at ~ 40 keV. Under fixed output energy fluence,
both skin dose and energy imparted decrease monotonically with the incident photon
energy, and the skin dose is more sensitive to changes in photon energy than total energy
imparted. These results demonstrated the benefit of using Monte Carlo methods to
optimize the x-ray tube voltage for a relatively low dose under the desired image quality
for a specific patient undergoing a certain type of diagnostic imaging.
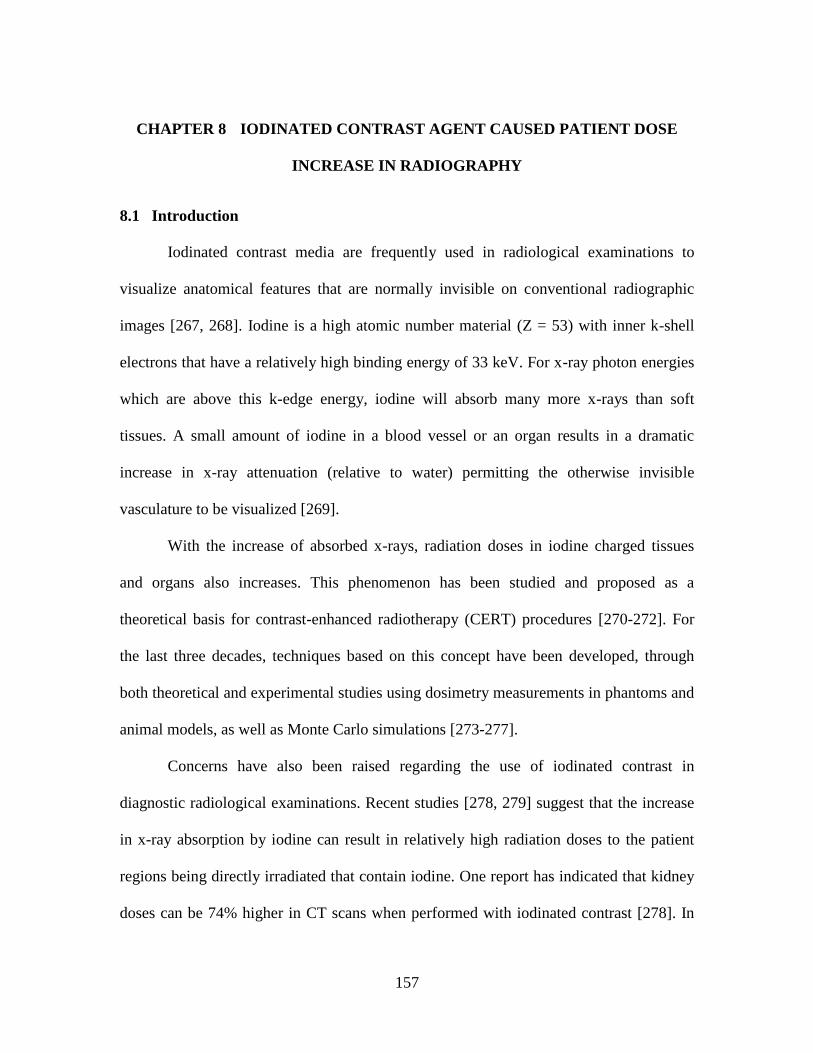
157
CHAPTER 8 IODINATED CONTRAST AGENT CAUSED PATIENT DOSE
INCREASE IN RADIOGRAPHY
8.1 Introduction
Iodinated contrast media are frequently used in radiological examinations to
visualize anatomical features that are normally invisible on conventional radiographic
images [267, 268]. Iodine is a high atomic number material (Z = 53) with inner k-shell
electrons that have a relatively high binding energy of 33 keV. For x-ray photon energies
which are above this k-edge energy, iodine will absorb many more x-rays than soft
tissues. A small amount of iodine in a blood vessel or an organ results in a dramatic
increase in x-ray attenuation (relative to water) permitting the otherwise invisible
vasculature to be visualized [269].
With the increase of absorbed x-rays, radiation doses in iodine charged tissues
and organs also increases. This phenomenon has been studied and proposed as a
theoretical basis for contrast-enhanced radiotherapy (CERT) procedures [270-272]. For
the last three decades, techniques based on this concept have been developed, through
both theoretical and experimental studies using dosimetry measurements in phantoms and
animal models, as well as Monte Carlo simulations [273-277].
Concerns have also been raised regarding the use of iodinated contrast in
diagnostic radiological examinations. Recent studies [278, 279] suggest that the increase
in x-ray absorption by iodine can result in relatively high radiation doses to the patient
regions being directly irradiated that contain iodine. One report has indicated that kidney
doses can be 74% higher in CT scans when performed with iodinated contrast [278]. In

158
these reports, however, the total energy that is deposited in the patient was not taken into
account, and it is also not clear how radiation doses change for organs and tissues that are
adjacent or behind the organs taking up iodine.
While measuring radiation doses with dosimeters in vivo and in vitro is usually
cumbersome and, under some circumstances, unrealistic, Monte Carlo methods have
been used widely in medical physics to simulate radiation doses [30, 280]. There are
several Monte Carlo software packages developed for simulating radiation transport
through different media, among which MCNP5/MCNPX [264], EGS4/EGSnrc [281],
GEANT4 [282] are considered as reference codes.
In this study, we used models based on the MCNP5/MCNPX platform to address
the issues of not only what the level of increased radiation dose to an organ containing
iodine is, but also how the pattern of energy deposition changes, as well as the changes of
the total amount of energy absorption by the phantom (or patient) being irradiated. In
order to validate our Monte Carlo models, we also compared results from a designed
simple Monte Carlo simulation case with its corresponding analytical solutions.
8.2 Method
8.2.1 Simulation Phantoms
Figure 8.1A shows a schematic of the phantom used in this study, which consists
of a 28 cm diameter water sphere containing a smaller sphere at the phantom isocenter
that holds iodine and water mixture solution (contrast sphere). The 28 cm diameter was
chosen to represent a typical adult abdomen region with an equivalent depth of water
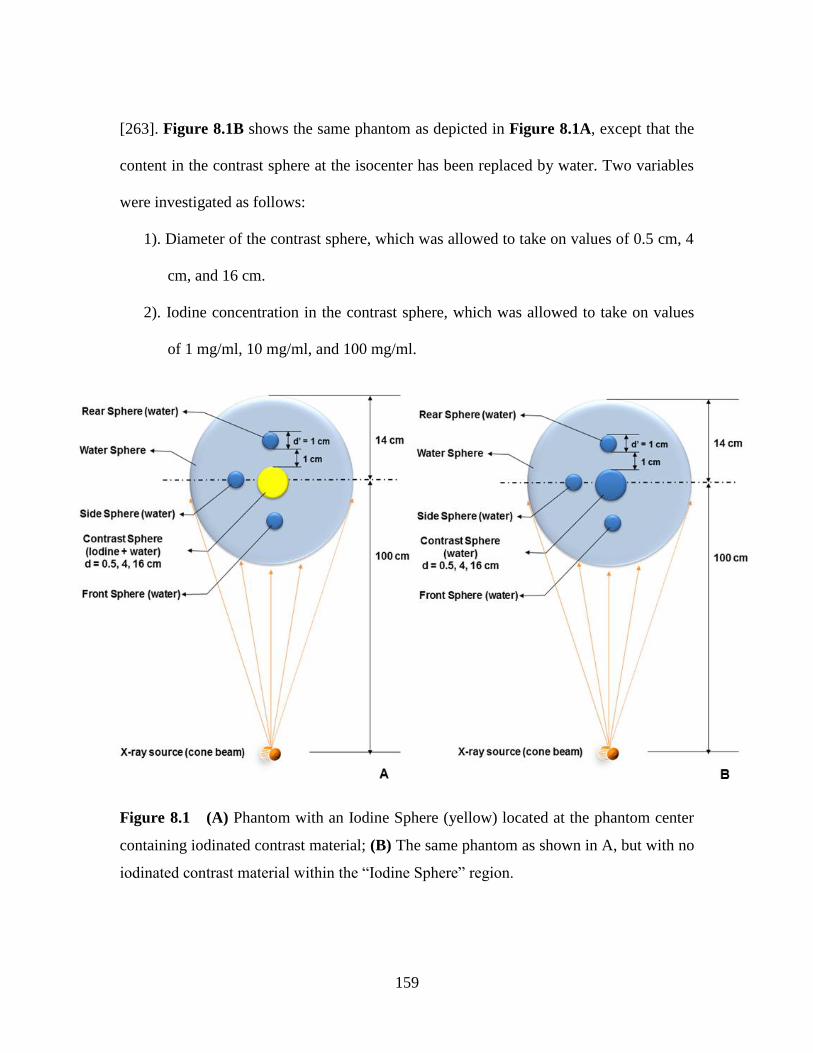
159
[263]. Figure 8.1B shows the same phantom as depicted in Figure 8.1A, except that the
content in the contrast sphere at the isocenter has been replaced by water. Two variables
were investigated as follows:
1). Diameter of the contrast sphere, which was allowed to take on values of 0.5 cm, 4
cm, and 16 cm.
2). Iodine concentration in the contrast sphere, which was allowed to take on values
of 1 mg/ml, 10 mg/ml, and 100 mg/ml.
Figure 8.1 (A) Phantom with an Iodine Sphere (yellow) located at the phantom center
containing iodinated contrast material; (B) The same phantom as shown in A, but with no
iodinated contrast material within the ―Iodine Sphere‖ region.
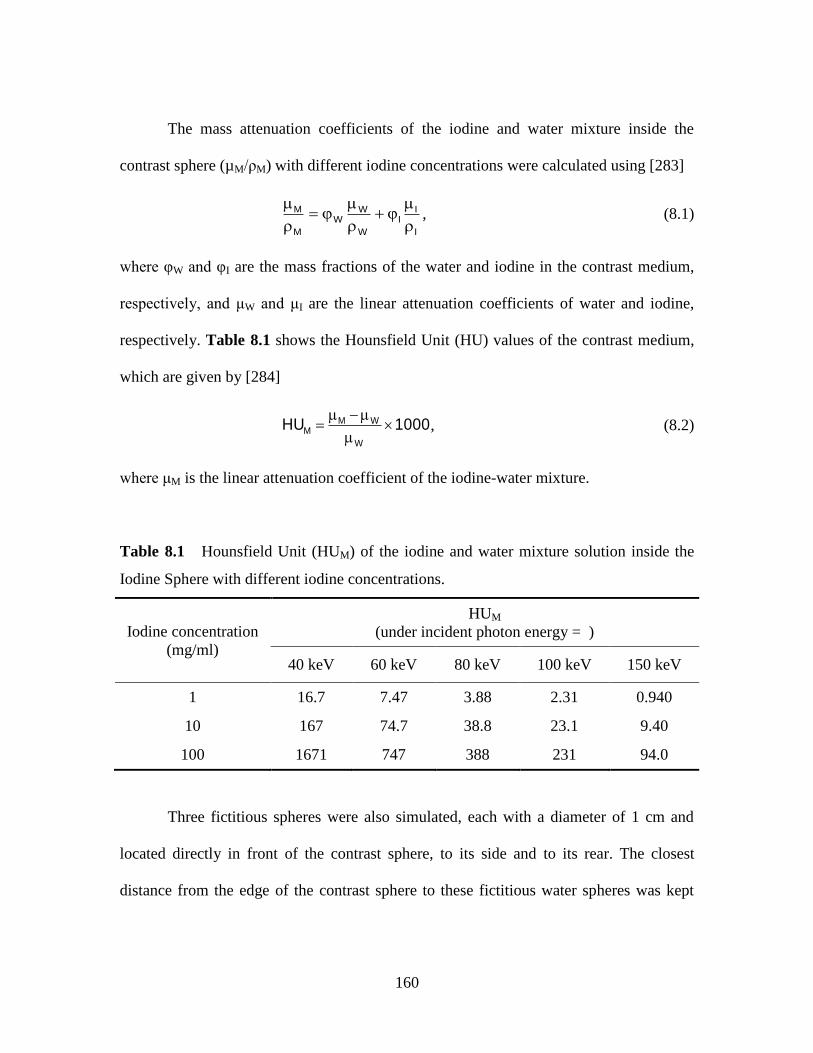
160
The mass attenuation coefficients of the iodine and water mixture inside the
contrast sphere (µM/ρM) with different iodine concentrations were calculated using [283]
I
II
W
WW
M
M
, (8.1)
where φW and φI are the mass fractions of the water and iodine in the contrast medium,
respectively, and μW and μI are the linear attenuation coefficients of water and iodine,
respectively. Table 8.1 shows the Hounsfield Unit (HU) values of the contrast medium,
which are given by [284]
1000HUW
WMM
, (8.2)
where μM is the linear attenuation coefficient of the iodine-water mixture.
Table 8.1 Hounsfield Unit (HUM) of the iodine and water mixture solution inside the
Iodine Sphere with different iodine concentrations.
Iodine concentration
(mg/ml)
HUM
(under incident photon energy = )
40 keV 60 keV 80 keV 100 keV 150 keV
1 16.7 7.47 3.88 2.31 0.940
10 167 74.7 38.8 23.1 9.40
100 1671 747 388 231 94.0
Three fictitious spheres were also simulated, each with a diameter of 1 cm and
located directly in front of the contrast sphere, to its side and to its rear. The closest
distance from the edge of the contrast sphere to these fictitious water spheres was kept
161
constant at 1 cm, and independent of contrast sphere diameter. The phantom isocenter
was located at a distance of 100 cm from an x-ray source. The x-ray source consisted of
mono-energetic photons.
8.2.2 Relative Energy Imparted
We obtained values of relative energy imparted, Erel, as the ratio of the energy
imparted in a defined region in the phantom shown in Figure 8.1A with the
corresponding value of energy imparted to the same region using the phantom depicted in
Figure 8.1B. The following volumes were considered as specific regions of interest:
1). The sphere containing the iodine at the phantom isocenter, which was termed as
Erel(Iodine).
2). Three fictitious water spheres located in front of the contrast sphere, Erel(Front), to
the side of the contrast sphere, Erel(Side), and at the rear of the contrast sphere
Erel(Rear).
3). The whole phantom shown in Figures 8.1A and 8.1B, and termed Erel(Phantom).
We performed a detailed analysis with mono-energetic incident photons of 60
keV for simulations at three contrast sphere diameter values and four investigated
solutions (three mixtures with different Iodine concentrations and one solution with water
only). These computations involved a total of 12 simulations, with five values of relative
energy imparted obtained in each simulation with iodine at the isocenter of the phantom
compared with the corresponding simulation with water at the isocenter. Computations
were also obtained at five levels of incident photon energy (35 keV, 45 keV, 75 keV, 100
keV, and 150 keV) for the selected diameters of contrast sphere at an Iodine
162
concentration of 100 mg/ml. Computed data points in all graphs were fitted to spline
curves for ease of viewing.
8.2.3 Monte Carlo Model
Monte Carlo techniques have become widely used in medical physics dosimetry
applications because they can provide accurate predictions of the absorbed dose
distributions in diagnostic and therapeutic radiological procedures. In this project, the
MCNP5 (Monte Carlo N Particle) [264] software package was used to perform Monte
Carlo simulations. MCNP is a general purpose Monte Carlo code designed to simulate
the transport of photons, neutrons, and electrons.
In our simulation cases, MCNP track length cell energy deposition tallies (F6
tallies) were placed on the volumes of interest to detect the radiation doses and to obtain
the corresponding energy deposited. The x-ray source was coded as a point source
irradiating cone beam shaped x-rays uniformly onto the field and covering the whole
simulation geometry, with the half beam angle of 8.05° and the edge beams tangent to the
surface of the water sphere. One billion photons were used for each case, and the relative
errors of the results were all smaller than 1%.
All the simulations were performed on the Clemson Palmetto Cluster high-
performance computing system with over 1,800 nodes and 17,000 cores (as of November
2013) [262]. The CPU time of each simulation was approximately 4 hours on a single
node, with the total computation time of approximately 200 hours for executing one set
of the simulation cases.
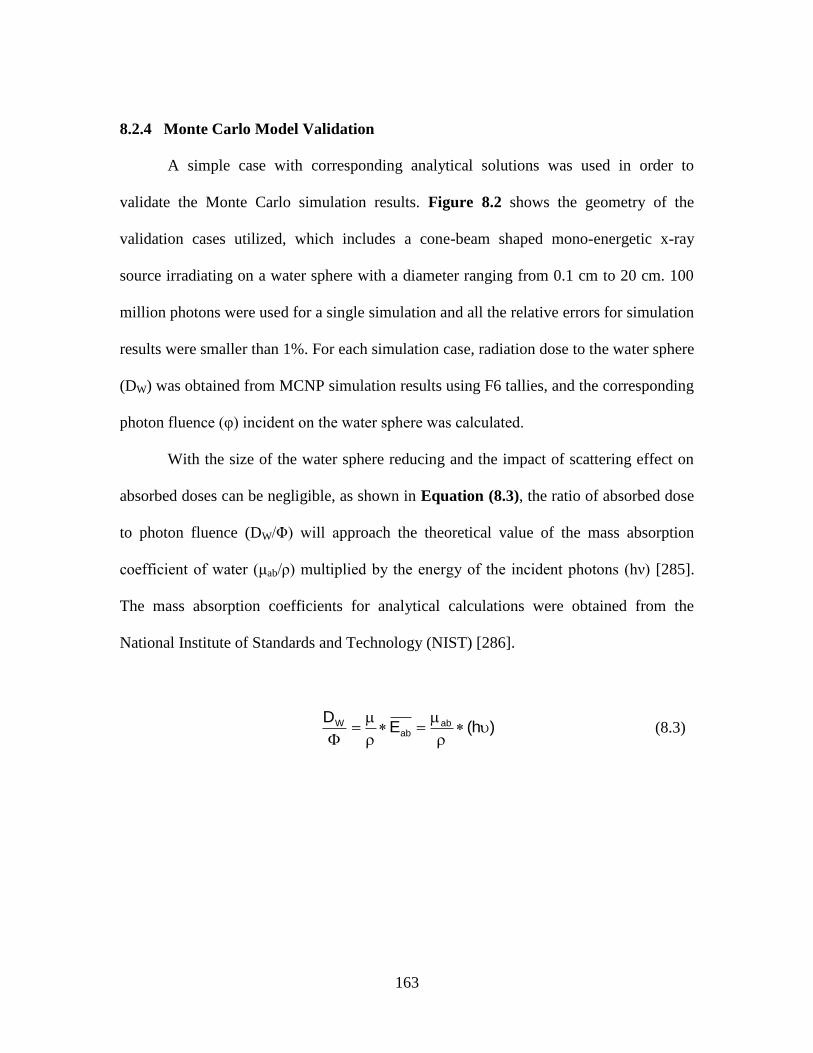
163
8.2.4 Monte Carlo Model Validation
A simple case with corresponding analytical solutions was used in order to
validate the Monte Carlo simulation results. Figure 8.2 shows the geometry of the
validation cases utilized, which includes a cone-beam shaped mono-energetic x-ray
source irradiating on a water sphere with a diameter ranging from 0.1 cm to 20 cm. 100
million photons were used for a single simulation and all the relative errors for simulation
results were smaller than 1%. For each simulation case, radiation dose to the water sphere
(DW) was obtained from MCNP simulation results using F6 tallies, and the corresponding
photon fluence (φ) incident on the water sphere was calculated.
With the size of the water sphere reducing and the impact of scattering effect on
absorbed doses can be negligible, as shown in Equation (8.3), the ratio of absorbed dose
to photon fluence (DW/Φ) will approach the theoretical value of the mass absorption
coefficient of water (μab/ρ) multiplied by the energy of the incident photons (hν) [285].
The mass absorption coefficients for analytical calculations were obtained from the
National Institute of Standards and Technology (NIST) [286].
)h(ED ab
abW
(8.3)

164
Figure 8.2 Simulation geometry utilized for Monte Carlo validation.
8.3 Results
8.3.1 Monte Carlo Model Validation
Figure 8.3 shows the validation results for the Monte Carlo validation simulations
using the simulation geometry shown in Figure 8.2, as well as the analytical calculation
results for different incident photon energies calculated using Equation (8.3). As shown
in Figure 8.3, the value of DW/Φ at a specific photon energy level approaches the
theoretical value as the size of the water sphere decreases. When the simulated water
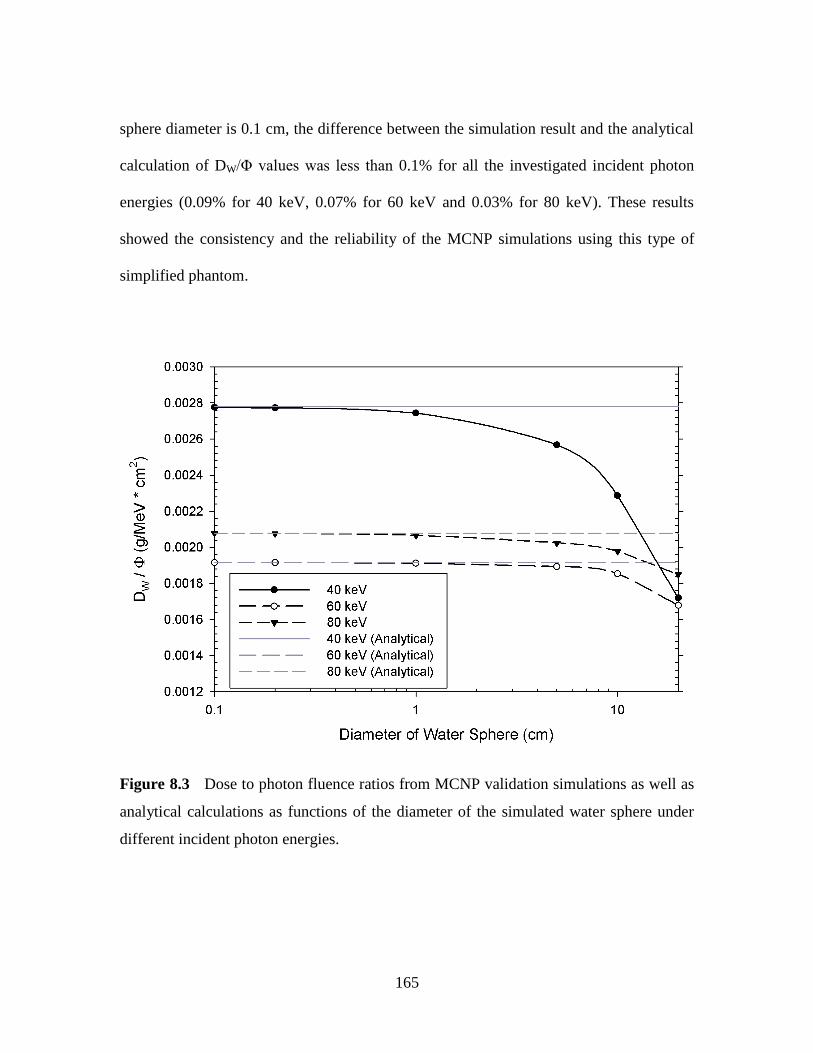
165
sphere diameter is 0.1 cm, the difference between the simulation result and the analytical
calculation of DW/Φ values was less than 0.1% for all the investigated incident photon
energies (0.09% for 40 keV, 0.07% for 60 keV and 0.03% for 80 keV). These results
showed the consistency and the reliability of the MCNP simulations using this type of
simplified phantom.
Figure 8.3 Dose to photon fluence ratios from MCNP validation simulations as well as
analytical calculations as functions of the diameter of the simulated water sphere under
different incident photon energies.

166
8.3.2 Energy Imparted and Relative Dose
Table 8.2 shows values of relative energy imparted to iodine contrast containing
spheres located at the center of the water phantom at 60 keV. The average dose to the
contrast-containing sphere increases as the sphere radius decreases and as the iodine
concentration increases. At the smallest sphere radius investigated (0.25 cm) and the
highest iodine concentration (100 mg/ml), the absorbed radiation dose to this sphere was
13 times higher than that with only water. These results may be contrasted with the
values of relative energy imparted in the whole phantom which was not significantly
affected (i.e., < 1%) at this smallest radius sphere and highest Iodine concentration. At
the highest concentration (100 mg/ml) and contrast containing sphere (8 cm), the total
energy imparted to the whole phantom merely increased by 11%.
Table 8.2 Values of Erel(Iodine) and Erel(Phantom) for varying values of Iodine Sphere
diameter and iodine concentration values under incident photon energy of 60 keV.
Relative Energy
Imparted
I Concentration
(mg/ml)
Contrast Sphere Diameter (cm)
0.5 4 16
Erel(Iodine)
1 1.14 1.14 1.11
10 2.38 2.21 1.63
100 13.0 5.80 2.18
Erel(Phantom)
1 1.00 1.00 1.01
10 1.00 1.00 1.06
100 1.00 1.00 1.11
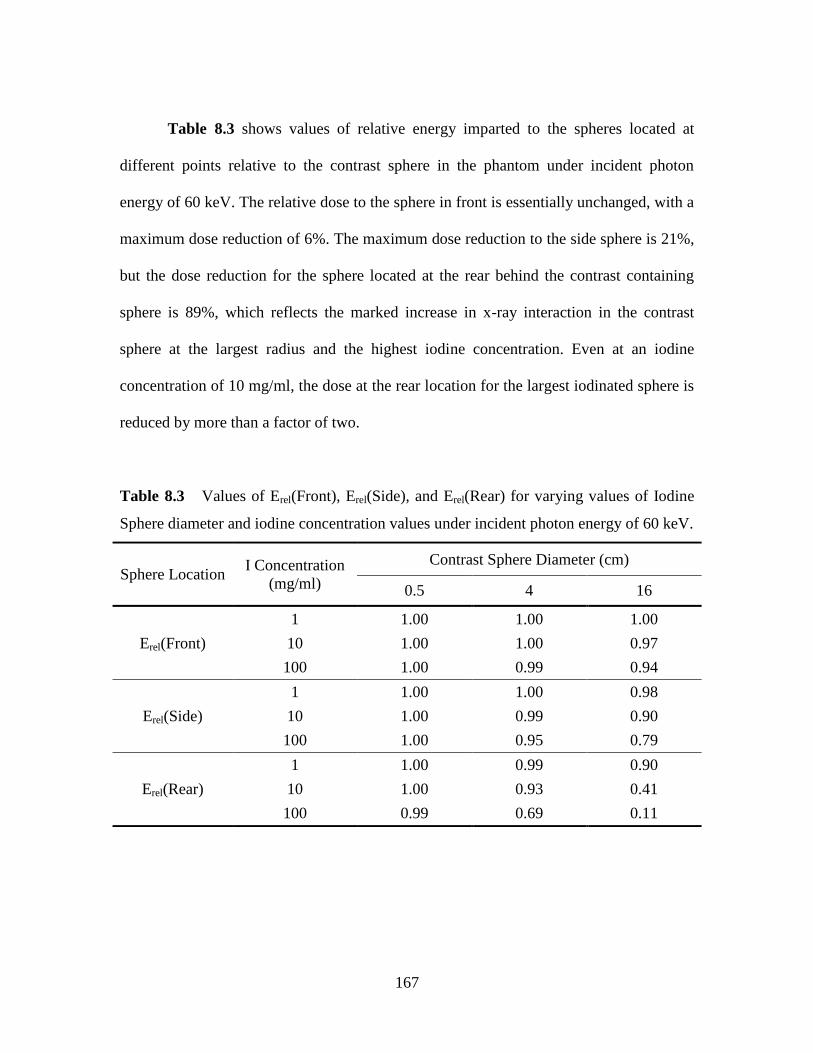
167
Table 8.3 shows values of relative energy imparted to the spheres located at
different points relative to the contrast sphere in the phantom under incident photon
energy of 60 keV. The relative dose to the sphere in front is essentially unchanged, with a
maximum dose reduction of 6%. The maximum dose reduction to the side sphere is 21%,
but the dose reduction for the sphere located at the rear behind the contrast containing
sphere is 89%, which reflects the marked increase in x-ray interaction in the contrast
sphere at the largest radius and the highest iodine concentration. Even at an iodine
concentration of 10 mg/ml, the dose at the rear location for the largest iodinated sphere is
reduced by more than a factor of two.
Table 8.3 Values of Erel(Front), Erel(Side), and Erel(Rear) for varying values of Iodine
Sphere diameter and iodine concentration values under incident photon energy of 60 keV.
Sphere Location I Concentration
(mg/ml)
Contrast Sphere Diameter (cm)
0.5 4 16
Erel(Front)
1 1.00 1.00 1.00
10 1.00 1.00 0.97
100 1.00 0.99 0.94
Erel(Side)
1 1.00 1.00 0.98
10 1.00 0.99 0.90
100 1.00 0.95 0.79
Erel(Rear)
1 1.00 0.99 0.90
10 1.00 0.93 0.41
100 0.99 0.69 0.11

168
8.3.3 Relative Energy Imparted and Photon Energy
Figure 8.4 shows values of Erel(Iodine) as a function of photon energy at the
iodine concentration of 100 mg/ml. The three curves in Figure 8.4 show that the smallest
contrast sphere diameter of 0.5 cm has the highest value of Erel(Iodine) of approximately
13 at an incident photon energy of ~60 keV. The lowest values of Erel(Iodine) were
generally at the lowest incident photon energy investigated of 35 keV. For the largest
contrast sphere diameter of 16 cm, at 35 keV the value of Erel(Iodine) was 1.2.
Figure 8.5 shows values of Erel(Side) and Erel(Rear) as a function of photon
energy at the iodine concentration of 100 mg/ml. For the smallest contrast sphere
diameter (0.5 cm), values of Erel(Side) and Erel(Rear) and approximately independent of
photon energy and close to the value of unity. Erel(Side) has a minimum of 0.78 at
approximately 75 keV for the largest contrast sphere diameter (16 cm). Values of
Erel(Rear) are sharply influenced by the size of the contrast sphere diameter. At a contrast
sphere diameter of 16 cm, however, values of Erel(Rear) monotonically increase from a
low of 0.09 at 35 keV to ~0.36 at 150 keV.
169
Figure 8.4 Values of Erel(Iodine) for different sized Iodine Sphere (d = 0.5, 4, 16 cm) as
functions of the incident photon energy under the iodine concentration of 100 mg/ml.

170
Figure 8.5 Values of (A) Erel(Rear) and (B) Erel(Side) for different sized Iodine Sphere
(d = 0.5, 4, 16 cm) as functions of the incident photon energy with iodine concentration
of 100 mg/ml.

171
Figure 8.6 shows how Erel(Phantom) varies with incident photon energies. For the
two smallest contrast sphere diameter values (0.5 cm and 4 cm), this parameter is
relatively close to unity, and independent of the incident photon energy. At the contrast
sphere diameter value of 16 cm, however, the value of Erel(phantom) shows a strong
photon energy dependence and shows a maximum value of 1.2 at incident photon energy
of 100 keV. It is also notable that highest values of Erel(phantom) in Figure 8.6 are
generally an order of magnitude lower than the corresponding highest values of
Erel(Iodine) shown in Figure 8.4. In addition, the maximum values of Erel(phantom) in
Figure 8.6 are for the largest contrast sphere diameter (16 cm) whereas the maximum
values of Erel(Iodine) in Figure 8.4 are for the smallest contrast sphere diameter (0.5 cm).
Figure 8.6 Values of Erel(Phantom) for different sized Iodine Sphere (d = 0.5, 4, 16 cm)
as functions of the incident photon energy with iodine concentration of 100 mg/ml.
172
8.4 Discussion
In this study we investigated the grounds for the rising concerns of the radiation
dose increase caused by the administration of iodinated contrast agents during diagnostic
radiological imaging. As a general conclusion, the data presented in Tables 8.1 and 8.2
clearly showed that, although the utilization of iodine can increase the localized absorbed
radiation dose, it is primarily a result of the redistribution of the energy deposited in the
phantom. Our results also demonstrated that the increase in the total amount of energy
deposited is relative modest, and for most practical purposes is likely to be of only
marginal importance.
The Monte Carlo algorithm is by far the best and most practical tool for radiation
dosimetry studies without cumbersome radiation dose measurements. The computational
time cost of the Monte Carlo simulations has been decreasing with the development of
computer technology, such as multi-core CPU and computational clusters. Nonetheless,
the accuracy of Monte Carlo simulations not only depends on the number of particle
transport events simulated, but also relies on the design of the irradiation geometry as
well as the normalization method used for processing the results. MCNP is a validated
Monte Carlo-based platform which suits our purpose of investigating the energy
distribution on the basis of relative values, but in order to use the corresponding absolute
values, further normalization and validation will be required.
The results of Erel(Iodine) show that there could be substantial radiation dose
increase within small volumes of interest under a high iodine concentration, i.e., local
dose increased 13 times to 100 mg/ml iodinated solution when compared with that to the
173
same volume of water (r = 0.5 cm). This significant dose increase is caused by the less
diluted solution and the short attenuation depth along the x-ray. In clinical practice,
however, the 100 mg/ml iodine concentration is unlikely reached at the targeted tissue
during x-ray imaging. The contrast agent with an original 300 to 400 mg/ml Iodine
concentration injected into the patient would be diluted by blood and extracellular liquids
and reach various iodine concentrations at different tissues depending on the phase when
the contrast enhanced imaging is taken and the iodine uptake of a specific tissue.
Increase in HU values caused by the application of iodinated contrast to patients
during multislice CT scans can be used as an indication of the concentration of the local
iodinated contrast agent. Table 8.4 lists the mean HU enhancement according to recent
literature [278, 287]. For an arterial phase scan, the increase in HU values ranged from
~10 for the liver to 177 for the kidney and 375 for the aorta. For a venous phase scan, the
increase in HU values ranged from ~41 for the pancreas to ~165 for the kidney. These
increased values are affected by the type and amount of contrast agent administered, the
concentration of iodine in the contrast agent, the irradiation parameters, as well as the
phase of which the image is taken. Compared with the HU values of different iodine
concentrations investigated in this paper, shown in Table 8.1, the iodine concentration in
most organs/tissues during imaging is in between 1 to 10 mg/ml under the assumption
that a patient can be simplified as a water phantom.
The change of the relative total energy imparted onto the patient during an
examination, represented by Erel(Phantom), was small even under the extreme iodine
concentration of 100 mg/ml. The largest increase in the relative total energy imparted was

174
21% for a contrast sphere with diameter of 16 cm at 100 keV, which means for the largest
solid organ in human body, i.e. the liver, the utilization of iodinated contrast agent during
contrast-enhanced imaging process will cause a less than 21% increase in the total energy
absorbed under any technical parameter setting. For the other two sizes of VOI (4 cm and
0.5 cm) investigated, the Erel(Phantom) value increase was within 1% under the three
iodine concentrations and six incident photon energy levels.
Table 8.4 Mean HU value difference between after and before the injection of iodinated
contrast agent in different tissues during multislice CT at 120 kV from literatures.
Organs/
Tissues
(2010) E Amato et al. (2004) S Fenchel et al.
Iodine concentration
= 300 mg/ml
Iodine concentration
= 300 mg/ml
Iodine concentration
= 400 mg/ml
Venous Phase Arterial
Phase
Venous
Phase
Arterial
Phase
Venous
Phase
Aorta N/A 260 108 375 112
Liver 58.9 10 52 12 59
Kidney 146 128 149 177 165
Pancreas 41.1 40 57 59 79
Spleen 76.0 41 70 68 69
Thyroid 102 N/A N/A N/A N/A
We also investigated the change of the energy distribution pattern caused by the
application of iodinated contrast agents. With little increase of the total energy imparted
on the phantom and the remarkable increase of local deposited energy caused by the
iodine solution, the energy absorption in the adjacent volumes surrounding the volume of
interest (VOI) decreases. Under the extreme iodine concentration of 100 mg/ml, the
175
change in energy deposited in front of the VOI, Erel(Front), was trivial and less than 9%.
The larger the VOI is, the smaller the value of Erel(Front) is, which is caused by the less
penetrated photons and thus fewer large-angle backscatter. With all the parameter settings
considered, the decrease in energy absorption was up to 91% for the investigated volume
behind the VOI along the x-ray beam and within 10% for the investigated volume to the
side of the VOI.
As the main factor determining the total output energy from the x-ray source,
incident photon energy affects the increase of the local absorbed dose as well as the total
energy imparted caused by iodinated contrast agents. According to our results, under
iodine concentration of 100 mg/ml, the value of Erel(Iodine) reached peak at ~60 keV for
contrast sphere diameter of 0.5 cm, ~75 keV for contrast sphere size of 4 cm, and ~100
keV for contrast sphere size of 16 cm, as a result of the balance between the penetration
and the absorption of the x-rays. As is similar for the trends of Erel(Iodine) values, the
value of Erel(Phantom) reached a plateau at ~100 keV for a 16 cm diameter contrast
sphere under 100 mg/ml iodine concentration. Our results suggested that for a typical
radiographic imaging with mean beam energy of 35-40 keV, the maximum local dose
increase caused by contrast agent would be ~10 times, and the maximum total energy
imparted increase would be less than 3%. In comparison, for a typical chest CT
examination with mean beam energy of ~ 60 keV, the local dose increase caused by
contrast agent for a small object could reach ~13 times, while the maximum total energy
imparted increase caused by the contrast agent is ~11%.
It should be pointed out explicitly that in order to further predict the increased
176
effective dose and carcinogenic risks caused by the injection of iodinated contrast agent
based on the results of this study, radiobiological and micro-dosimetry studies must be
performed. For a patient body undergoing the contrast-enhanced imaging, the energy
distributed may not be where the radio-sensitive tissues are. We studied the energy
absorption patterns assuming the tissue was context-free and the iodine solution was
evenly distributed within the volume of interest. In practical clinical and radiobiological
considerations, the convection and diffusion of the contrast agent in the human body is
much more complicated, considering factors such as the structural differences of each
organ/tissue, the balance between the blood and extracellular matrix fluids, and the
observation time frame, etc.
8.5 Conclusion
In conclusion, it was shown based on this study that by administrating the
iodinated contrast, the localized radiation dose could increase by up to 1300%, whereas
the total energy imparted increase by merely 11%. The additional total energy absorbed
due to the presence of iodinated contrast agent was relatively small compared with the
corresponding local dose absorption increase. Our results suggested that concerns
regarding the increased patient doses in diagnostic radiological examinations due to
higher x-ray absorption by iodinated contrast medium may be unjustified depending on
the volume of interest and irradiation parameters. Utilization of iodine contrast agent
primarily changes the pattern of energy deposition in the irradiated region, rather than
increasing the patient doses. As for the potential additional radiation-induced

177
carcinogenic risks caused by the iodinated contrast agent, further investigation needs to
be performed with radiobiology expertise.
178
CHAPTER 9 OVERALL CONCLUSIONS AND FUTURE DIRECTIONS
9.1 Conclusions
In the US, radiation doses from medical imaging resulted in an increase of ~600%
in a single generation [1]. Among medical exposures to patients, computed tomography
(CT) composes 49% of the collective doses, and interventional fluoroscopy composes
14%. Radiation exposure to patients undergoing diagnostic radiological procedures
causes increased lifetime carcinogenic risks, especially for pediatric patients who are
more radiosensitive than adults. The correlation between procedural x-ray techniques and
the radiation doses to patients, as well as the resultant image quality, is not well
understood, and therefore the focus of the performed studies.
The major focus of this work is the investigation of the effect of irradiation
technical parameters on radiation doses to patients, and its major impact is the potential
in optimizing radiation doses to patients undergoing diagnostic radiological examinations,
such as CT scans and interventional radiology procedures. This information will be
useful in better understanding the causes of the unnecessary medical radiation doses and
will help reach the goal of the as low as reasonable achievable (ALARA) rule for medical
radiation dosimetry. Our studies underlined the impact of projection angles, x-ray tube
current modulation and scan regions on the resultant patient doses (Aim 1), and also
analyzed the cancer risks to adults undergoing CT scans with the most important
radiosensitive organs causing the carcinogenic risk increase (Aim 2). Furthermore, the
Monte Carlo model built for our studies for the patient doses during the pediatric
interventional radiology examinations combined image quality into the input photon
179
energy – radiation dose relationship, and thus achieved the goal of maintaining image
quality while reducing patient doses in the quantitative perspective (Aims 3 and 4). These
studies will also build the baseline for image quality related dose optimization for
different types of diagnostic radiological procedures and different patient populations.
The Monte Carlo model developed will not only facilitate the current understanding of
patient dose optimization in diagnostic radiology, but will also offer the clinical field a
realistic method for estimating radiation doses to radiology staff during diagnostic and
interventional radiology examinations.
Chapter 3 (addressing Aim 1): In this study, absorbed doses to patients
undergoing cone beam CT scans as functions of the x-ray tube projection angle were
calculated using a Monte Carlo software package (PCXMC). Average absorbed doses
were generated and recorded for five radiosensitive organs (i.e., breast, colon, lung, red
bone marrow, and stomach), as well as the corresponding effective dose. Doses for both
CT gantries were obtained every 15 of the x-ray tube projection angle, at each of six
locations in 10 cm increments along the patient long axis. Our results showed that there
were major differences in organ and effective dose as the x-ray tube rotates around the
patient, which further suggested that the use of x-ray tube current modulation could
produce substantial reductions in organ and effective dose for body imaging with cone
beam CT.
180
Chapter 4 (addressing Aim 1): In this study, we investigated how patient
effective doses vary as a function of x-ray tube projection angle, as well as patient long
axis, and quantified how x-ray tube current modulation affects patient doses in chest CT
examinations. Our results showed that the effective dose maxima occur for AP
projections at the location of the (radiosensitive) breasts. It was concluded that the
existing x-ray tube current modulation schemes are expected to reduce patient effective
doses in chest CT examinations by about 10%, with longitudinal modulation accounting
for two thirds and angular modulation for the remaining one third.
Chapter 5 (addressing Aim 1): The choice of the scanned region could also
affect organ doses in CT. In this study, we used Monte Carlo algorithm based ImPACT
CT Patient Dosimetry Calculator (version 1.0) to compute absorbed doses to eight
radiosensitive organs of interest in medical radiation dosimetry. The ratios of the dose to
an organ at a specified scan length to the maximum organ dose resulted from a uniform
whole body irradiation were calculated as functions of increasing scan length.
Furthermore, the impact of different scan directions on dose to the same organ was
investigated. Our results showed that for each organ, the ratio of organ dose at a set scan
length to the maximum organ dose was independent of type of scanner, and increased
monotonically to unity with increasing scan length. CT scans limited to direct irradiation
of an organ result in absorbed doses that range from 70% of that from the uniform whole
body irradiation for small organs to 85% of that from the uniform whole body irradiation
for large organs.
181
Chapter 6 (addressing Aim 2): In this study, the resultant cancer risks from the
amount of radiation used to perform body CT examination were estimated. The ImPACT
CT Patient Dosimetry Calculator was used to compute values of organ doses for adult
body CT examinations. Results are presented for cancer risks per unit DLP and unit
effective dose for 11 sensitive organs, as well as estimates of the contribution from ―other
organs.‖ For patients who differ from a standard-sized adult, correction factors based on
the patient weight and antero-posterior dimension are provided to adjust organ doses and
the corresponding risks. Our results showed that at constant incident radiation intensity,
for CT examinations that include the chest, risks in females are markedly higher than
those for males, whereas for examinations that include the pelvis, risks in males were
slightly higher than those in females. In abdominal CT scans, risks for males and female
patients are very similar. For abdominal CT scans, increasing the patient age from 20 to
80 resulted in a reduction in patient risks of nearly a factor of five. It was concluded that
cancer risks in body CT can be estimated from the examination Dose Length Product by
accounting for sex, age, as well as patient physical characteristics.
Chapter 7 (addressing Aims 3 and 4): The purpose of this study was to
investigate the role of x-ray photon energy in determining skin dose, energy imparted and
image quality in pediatric interventional radiology using a Monte Carlo model built on
MCNP5 platform. Contrast, relative noise, and contrast-to-noise ratio (CNR) were
obtained for imaging under two scenarios: 1) without grids at different incident photon
energies; and 2) with 8:1 grids (10% scatter, 70% primary beam transmission). Our
182
results showed that under a fixed image quality represented by CNR, energy imparted
increased with photon energy, while skin dose was not a monotonic function of photon
energy and reached its minimum at ~ 40 keV. While under fixed output energy fluence,
both skin dose and energy imparted decrease monotonically with the incident photon
energy, and the skin dose is more sensitive to changes in photon energy than total energy
imparted. These results demonstrated that using Monte Carlo methods, the optimized x-
ray tube voltage for a relatively low dose under the desired image quality could be
obtained for a specific patient undergoing a certain type of diagnostic examination.
Chapter 8 (side project of Aims 3 and 4): In this study, we investigated the
changes in the pattern of energy deposition in tissue-equivalent phantoms following the
introduction of iodinated contrast media using a Monte Carlo model built using MCNP5
codes. Relative values of energy imparted to the iodine contrast, as well as to the whole
phantom, were calculated. Changes in patterns of energy deposition around the iodine
contrast-filled volume were also investigated. Our results indicated that adding iodine can
result in values of localized absorbed dose increasing by more than an order of magnitude,
but the total energy deposition is generally very modest (i.e., <10%). Furthermore, our
results showed that adding iodine primarily changes the pattern of energy deposition in
the irradiated region, rather than increasing the corresponding patient doses.

183
9.2 Challenges
9.2.1 Clinical Application
The results obtained from Chapter 3 to Chapter 6 are clinically practical, but there
are limitations that should be noted. For example, it is important to note that the
methodology developed in this study for CT scans was based on adult patients and cannot
be extrapolated to children [38, 222]. Children cannot simply be assumed to be small
adults, because the relative proportions of different organs and tissues change with age.
[248] In order to obtain the conversion factors for children, the model has to be altered to
fit pediatric patients, and also the risk factors need to be recalculated.
9.2.2 Software Limitations
Based on patient dose optimization studies in Chapters 3-6 (Aim 1 and Aim 2),
the limitations of the current dosimetry software were exposed. For example, the existing
software packages do not permit image quality to be quantified, because neither the
distribution of scattered photons nor the scatter-to-primary ratio on the imaging plane is
available in their output. In order to take image quality into consideration when
optimizing patient doses, our own in-house model needs to be built (Aim 3 and Aim 4).
9.2.3 Computational Time
For computations done with commercially available software in Chapters 3 to 6,
the computations were performed on a single PC because of the software requirements
(by PCXMC and ImPACT CT). It was not possible to shorten the computational time
184
used for these calculations. Meanwhile, the computational time for each simulation case
was relatively short because the software used pre-stored Monte Carlo calculation results.
However, for simulations performed using our in-house models on MCNP5
platform, the Monte Carlo simulations were highly CPU-time consuming because of its
property of real-time particle transport calculations. It could take weeks to complete all
the simulations needed for each batch of the experiment. In order to shorten the
simulation time, we utilized the multi-threaded capabilities of the MCNP software under
Linux system environment on the Clemson Palmetto Cluster.
9.2.4 Data Processing
The data file from each simulation generated in Chapter 8 and Chapter 9 may be
close to a hundred of megabytes, with massive results for each mesh location on the
imaging plane. This magnitude of data may be too large to be viewed using Microsoft
notepad, or processed by the common data management software such as Microsoft
Excel. To solve this problem, the data were viewed and extracted using large text data
processing software such as Ultraedit, and will be stored and accessed using a relational
database and then connected with Microsoft Access with a user inquiry interface.
9.3 Future Goals
The goal of this project was to gain a better understanding of the roles of different
radiological imaging technique factors on the patient doses in diagnostic radiological
procedures. By investigating the impact of different parameters in CT scans on doses and
185
cancer risks to adult patients using commercially available Monte Carlo software, we
looked into the possible optimization of technical parameters for CT examinations to
achieve lower patient doses. Based on these studies, the limitations of the current Monte
Carlo software were analyzed and our own Monte Carlo model was proposed for
simulations of patient doses during pediatric interventional radiology procedures. The
ultimate goal of this study is to develop a comprehensive dosimetry database using
Monte Carlo technique, with the output of patient doses, operator doses, and the
corresponding radiation-induced carcinogenesis risks for pediatric interventional
radiology procedures.
Chapter 3, 4 & 5: We hope to further study the impact of the irradiation technical
factors (projection angle, scan length, etc.) on organ doses and effective dose to pediatric
patients during different types of CT scans. Future work can be done to investigate the
specific pediatric procedures and compare among pediatric patients with different ages.
Chapter 6: We hope to further study the radiation-induced carcinogenic risks to
adult patients based on risk databases for different populations, such as American, Asian,
and European populations. Current existing cancer risk databases from ICRP 103, Health
Physics Association (HPA) and BEIR VII are all targeted on different population
compositions. Radiation risks calculated using different radiation risk databases can be
used upon more specific targeted populations and have more specific clinical indications.
186
Chapter 7: 1) Further studies could be done to improve the simulation phantoms.
The average thickness of the human skin is 0.2~0.3 cm. For the next step, we hope to
research references about skin dose simulation, and also examine which skin layer should
be accounted for (thin skin or thick skin). Finally, the size of the water phantom can be
varied to represent different patient age groups.
2) Additional studies may be carried out with the goal of decreasing the
computational cost and increasing the simulation result accuracy. The results from
simulations using one million photons are suitable for our pilot studies, but not
sufficiently rigorous for future publishing. In the next step, we need to use a larger
number for simulation histories (simulated source particles), and at the same time
improve the mesh tally design to decrease the computation time for each run. We also
hope to use parallel programming instead of multi-thread programming to shorten the
computational time.
3) Also of interest are the studies in which we vary the transmission rates of
primary and scattered photons of the grids with the incident photon energy. The
feasibility of simulating different transmission rates should be investigated. Also,
studying the influence of different types of grids could also be of interest.
Chapter 8: We hope to further investigate the potential additional radiation-
induced carcinogenic risks caused by the iodinated contrast agent based on radiobiology
expertise. The deposition of the iodinated contrast agent varies because of the different
uptake rates of organs and tissues. We have investigated the increased radiation dose and
187
energy imparted caused by the contrast agent based on the assumption that the iodine
concentration is uniform and not affected by the type of tissue/organ. In order to further
estimate the cancer risks caused by the contrast agent during irradiation, the deposition of
iodine and the radio-sensitivity of the contrast-absorbed organs needs to be considered.
188
REFERENCES
1. Measurements, N.C.o.R.P.a., Ionizing Radiation Exposure of the Population of the
United States, in NCRP Report No. 1602009.
2. Brenner, D.J. and E.J. Hall, Computed tomography--an increasing source of
radiation exposure. N Engl J Med, 2007. 357(22): p. 2277-84.
3. Mettler, F.A., Jr., et al., Effective doses in radiology and diagnostic nuclear
medicine: a catalog. Radiology, 2008. 248(1): p. 254-63.
4. Smith-Bindman, R., et al., Radiation dose associated with common computed
tomography examinations and the associated lifetime attributable risk of cancer.
Arch Intern Med, 2009. 169(22): p. 2078-86.
5. Goske, M.J., et al., The Image Gently campaign: working together to change
practice. AJR Am J Roentgenol, 2008. 190(2): p. 273-4.
6. McCollough, C.H., M.R. Bruesewitz, and J.M. Kofler, Jr., CT dose reduction and
dose management tools: overview of available options. Radiographics, 2006. 26(2):
p. 503-12.
7. Martin, C.J., D.G. Sutton, and P.F. Sharp, Balancing patient dose and image quality.
Appl Radiat Isot, 1999. 50(1): p. 1-19.
8. Padovani, R. and E. Quai, Patient dosimetry approaches in interventional cardiology
and literature dose data review. Radiat Prot Dosimetry, 2005. 117(1-3): p. 217-21.
9. Foti, C., et al., Staff dosimetry in interventional cardiology: survey on methods and
level of exposure. Radiat Prot Dosimetry, 2008. 129(1-3): p. 100-3.
10. Alidoosti, M., et al., Clinical outcomes of drug-eluting stents compared with bare
metal stents in our routine clinical practice. Hellenic J Cardiol, 2008. 49(3): p. 132-
8.
189
11. Toutouzas, K., et al., A preliminary experience report: Drug-eluting stents versus
coronary artery bypass surgery in patients with a single lesion in the proximal left
anterior descending artery suffering from diabetes mellitus and chronic stable
angina. Hellenic J Cardiol, 2008. 49(2): p. 65-71.
12. Regulla, D.F. and H. Eder, Patient exposure in medical X-ray imaging in Europe.
Radiat Prot Dosimetry, 2005. 114(1-3): p. 11-25.
13. Einstein, A.J., et al., Radiation dose to patients from cardiac diagnostic imaging.
Circulation, 2007. 116(11): p. 1290-305.
14. Valentin, J., Avoidance of radiation injuries from medical interventional procedures.
Ann ICRP, 2000. 30(2): p. 7-67.
15. IAEA, Appying radiation safety standards in radiotherapy, in Safety Reports Series
No. 382006: Vienna.
16. Klein, L.W., et al., Occupational health hazards in the interventional laboratory:
time for a safer environment. Radiology, 2009. 250(2): p. 538-44.
17. Balter, S., Radiation safety in the cardiac catheterization laboratory: operational
radiation safety. Catheter Cardiovasc Interv, 1999. 47(3): p. 347-53.
18. Balter, S., Radiation safety in the cardiac catheterization laboratory: basic
principles. Catheter Cardiovasc Interv, 1999. 47(2): p. 229-36.
19. Goldstein, J.A., et al., Occupational hazards of interventional cardiologists:
prevalence of orthopedic health problems in contemporary practice. Catheter
Cardiovasc Interv, 2004. 63(4): p. 407-11.
20. BEIR Report VII. Health Effects of Exposure to Low Levels of Ionizing Radiations:
Time for Reassessment?, 2005, National Academy of Sciences Committee on the
Biological Effects of Ionizing Radiation.
190
21. Strauss, K.J., Pediatric interventional radiography equipment: safety considerations.
Pediatr Radiol, 2006. 36 Suppl 2: p. 126-35.
22. Marx, M.V., Interventional radiology: management of the pregnant patient. Tech
Vasc Interv Radiol, 2010. 13(3): p. 154-7.
23. Bacher, K., et al., Patient-specific dose and radiation risk estimation in pediatric
cardiac catheterization. Circulation, 2005. 111(1): p. 83-9.
24. Schueler, B.A., et al., Radiation exposure and efficacy of exposure-reduction
techniques during cardiac catheterization in children. AJR Am J Roentgenol, 1994.
162(1): p. 173-7.
25. Valentin, J., Low-dose extrapolation of radiation-related cancer risk. Ann ICRP,
2005. 35(4): p. 1-140.
26. Ciraj-Bjelac, O., et al., Risk for radiation-induced cataract for staff in interventional
cardiology: is there reason for concern? Catheter Cardiovasc Interv, 2010. 76(6): p.
826-34.
27. Jacob, S., et al., Occupational cataracts and lens opacities in interventional
cardiology (O'CLOC study): are X-Rays involved? Radiation-induced cataracts and
lens opacities. BMC Public Health, 2010. 10: p. 537.
28. Vano, E., et al., Occupational radiation doses in interventional cardiology: a 15-year
follow-up. Br J Radiol, 2006. 79(941): p. 383-8.
29. Siiskonen, T., et al., Monte Carlo simulations of occupational radiation doses in
interventional radiology. Br J Radiol, 2007. 80(954): p. 460-8.
30. Rogers, D.W., Fifty years of Monte Carlo simulations for medical physics. Phys
Med Biol, 2006. 51(13): p. R287-301.
191
31. Andreo, P., Monte Carlo techniques in medical radiation physics. Phys Med Biol,
1991. 36(7): p. 861-920.
32. Bozkurt, A. and D. Bor, Simultaneous determination of equivalent dose to organs
and tissues of the patient and of the physician in interventional radiology using the
Monte Carlo method. Phys Med Biol, 2007. 52(2): p. 317-30.
33. Schauer, D.A. and O.W. Linton, NCRP Report No. 160, Ionizing Radiation
Exposure of the Population of the United States, medical exposure--are we doing
less with more, and is there a role for health physicists? Health Phys, 2009. 97(1): p.
1-5.
34. Mahesh, M., NCRP Report Number 160: its significance to medical imaging. J Am
Coll Radiol, 2009. 6(12): p. 890-2.
35. Bedetti, G., et al., Cumulative patient effective dose in cardiology. Br J Radiol,
2008. 81(969): p. 699-705.
36. Vano, E. and K. Faulkner, ICRP special radiation protection issues in interventional
radiology, digital and cardiac imaging. Radiat Prot Dosimetry, 2005. 117(1-3): p.
13-7.
37. Measurements, I.C.o.R.U.a., "Patient dosimetry for x-rays used in medical
imaging", ICRU Report No. 74, 2005.
38. ImPACT. http://www.impactscan.org/ctdosimetry.htm. Available from:
http://www.impactscan.org/ctdosimetry.htm.
39. MCNP - A General N-Particle Transport Code, Version 5 2003.
40. Johns, H.E. and J.R. Cunningham, The physcis of radiology. 4th ed. 1983,
Springfield, Illinois: Charles C Thomas Publisher.
192
41. Beutel, J., H.L. Kundel, and R.L. Van Metter, Handbook of medical imaging. Vol.
1. Physics and Psychopysics. 2000, Bellingham, Washington: Society of Photo-
Optical Instrumentation Engineers.
42. Huda, W., Review of Radiologic Physics. 3rd ed. 2010, Baltimore MD: Lippincott
Williams & Wilkins. 255.
43. Huda, W., Medical Physics lecture for MUSC residents. 2010.
44. Huda, W., Medical Radiation Dosimetry. RSNA Categorical Course in Diagnostic
Radiology: From Invisible to Visible - The Science and Practice of X-ray Imaging
and Radiation Dose Optimization., 2006: p. 29-40.
45. ICRU. http://www.icru.org/. 2010; Available from: http://www.icru.org/.
46. IAEA. http://www.iaea.org/. 2010; Available from: http://www.iaea.org/.
47. The 2007 Recommendations of the International Commission on Radiological
Protection. ICRP publication 103. Ann ICRP, 2007. 37(2-4): p. 1-332.
48. Brenner, D. and W. Huda, Effective dose: a useful concept in diagnostic radiology.
Radiat Prot Dosimetry, 2008. 128(4): p. 503-8.
49. Attix, H.F., Introduction to Radiological Physics and Radiation Dosimetry. 1986,
New York: John Wiley & Sons, Inc.
50. Van Dam, J., et al., Characteristics of dosemeter types for skin dose measurements
in practice. Radiat Prot Dosimetry, 2005. 117(1-3): p. 185-9.
51. Kron, T., Thermoluminescence dosimetry and its applications in medicine--Part 1:
Physics, materials and equipment. Australas Phys Eng Sci Med, 1994. 17(4): p. 175-
99.

193
52. Kron, T., Thermoluminescence dosimetry and its applications in medicine--Part 2:
History and applications. Australas Phys Eng Sci Med, 1995. 18(1): p. 1-25.
53. Yukihara, E.G. and S.W. McKeever, Optically stimulated luminescence (OSL)
dosimetry in medicine. Phys Med Biol, 2008. 53(20): p. R351-79.
54. Jursinic, P.A., Characterization of optically stimulated luminescent dosimeters,
OSLDs, for clinical dosimetric measurements. Med Phys, 2007. 34(12): p. 4594-
604.
55. Schembri, V. and B.J. Heijmen, Optically stimulated luminescence (OSL) of
carbon-doped aluminum oxide (Al2O3:C) for film dosimetry in radiotherapy. Med
Phys, 2007. 34(6): p. 2113-8.
56. Yukihara, E.G. and S.W. McKeever, Ionisation density dependence of the optically
and thermally stimulated luminescence from Al2O3:C. Radiat Prot Dosimetry,
2006. 119(1-4): p. 206-17.
57. DeWerd, L.A. and L.K. Wagner, Characteristics of radiation detectors for diagnostic
radiology. Appl Radiat Isot, 1999. 50(1): p. 125-36.
58. http://en.wikipedia.org/wiki/Ionization_chamber. 2010; Available from:
http://en.wikipedia.org/wiki/Ionization_chamber.
59. Froshier, S., Essentials of radiotion biology and protection. 2nd ed. 2009, NY:
Delmar.
60. Hall, E.J. and A.J. Giaccia, Radiobiology for the radiobiologist. 6th ed. 2006,
Philadelphia, PA: Lippincott Williams & Wilkins.
61. Martin, C.J., et al., The radiobiology/radiation protection interface in healthcare. J
Radiol Prot, 2009. 29(2A): p. A1-A20.
194
62. Barcellos-Hoff, M.H. and D.H. Nguyen, Radiation carcinogenesis in context: how
do irradiated tissues become tumors? Health Phys, 2009. 97(5): p. 446-57.
63. Barcellos-Hoff, M.H., Integrative radiation carcinogenesis: interactions between cell
and tissue responses to DNA damage. Semin Cancer Biol, 2005. 15(2): p. 138-48.
64. http://en.wikipedia.org/wiki/Double-strand_breaks#Double-strand_breaks. 2010.
65. Hunter, N. and C.R. Muirhead, Review of relative biological effectiveness
dependence on linear energy transfer for low-LET radiations. J Radiol Prot, 2009.
29(1): p. 5-21.
66. Deschavanne, P.J. and B. Fertil, A review of human cell radiosensitivity in vitro. Int
J Radiat Oncol Biol Phys, 1996. 34(1): p. 251-66.
67. Haber, A.H. and B.E. Rothstein, Radiosensitivity and rate of cell division: "law of
Bergonie and Tribondeau". Science, 1969. 163(873): p. 1338-9.
68. Ritenour, E.R., Health effects of low level radiation: carcinogenesis, teratogenesis,
and mutagenesis. Semin Nucl Med, 1986. 16(2): p. 106-17.
69. Joiner, M.C., et al., Low-dose hypersensitivity: current status and possible
mechanisms. Int J Radiat Oncol Biol Phys, 2001. 49(2): p. 379-89.
70. Williams, D., Radiation carcinogenesis: lessons from Chernobyl. Oncogene, 2008.
27 Suppl 2: p. S9-18.
71. Kennedy, A.R., Factors that modify radiation-induced carcinogenesis. Health Phys,
2009. 97(5): p. 433-45.
72. Cox, R., The role of animal models in the development of knowledge of radiation
carcinogenesis and their potential contribution to judgements of risk at low doses. C
R Acad Sci III, 1999. 322(2-3): p. 135-8.
195
73. BEIR, National Academy of Sciences Committee on the Biological Effects of
Ionizing Radiation (BEIR) Report VII. Health Effects of Exposure to Low Levels of
Ionizing Radiations: Time for Reassessment? 2005.
74. Pierce, D.A. and D.L. Preston, Radiation-related cancer risks at low doses among
atomic bomb survivors. Radiat Res, 2000. 154(2): p. 178-86.
75. Preston, D.L., et al., Effect of recent changes in atomic bomb survivor dosimetry on
cancer mortality risk estimates. Radiat Res, 2004. 162(4): p. 377-89.
76. Preston, D.L., et al., Solid cancer incidence in atomic bomb survivors: 1958-1998.
Radiat Res, 2007. 168(1): p. 1-64.
77. UNSCEAR 2000. The United Nations Scientific Committee on the Effects of
Atomic Radiation. Health Phys, 2000. 79(3): p. 314.
78. Trott, K.R. and M. Rosemann, Molecular mechanisms of radiation carcinogenesis
and the linear, non-threshold dose response model of radiation risk estimation.
Radiat Environ Biophys, 2000. 39(2): p. 79-87.
79. http://www.medical.siemens.com/. 2010; Available from:
http://www.medical.siemens.com/.
80. OSHA. http://www.osha.gov. 2010; Available from: http://www.osha.gov.
81. ICRP. http://www.icrp.org/. 2010; Available from: http://www.icrp.org/.
82. Strauss, K.J. and S.C. Kaste, The ALARA (as low as reasonably achievable)
concept in pediatric interventional and fluoroscopic imaging: striving to keep
radiation doses as low as possible during fluoroscopy of pediatric patients--a white
paper executive summary. Radiology, 2006. 240(3): p. 621-2.
83. Wambersie, A., Patient dosimetry for X-rays used in medical imaging. ICRU Report
74., 2005, International Commission on Radiological Units and Measurements.
196
84. Aroua, A., et al., How to set up and apply reference levels in fluoroscopy at a
national level. Eur Radiol, 2007. 17(6): p. 1621-33.
85. Vano, E., et al., Patient dose in interventional radiology: a European survey. Radiat
Prot Dosimetry, 2008. 129(1-3): p. 39-45.
86. Vano, E., et al., Patient dose reference levels for interventional radiology: a national
approach. Cardiovasc Intervent Radiol, 2009. 32(1): p. 19-24.
87. Neofotistou, V., et al., Preliminary reference levels in interventional cardiology. Eur
Radiol, 2003. 13(10): p. 2259-63.
88. Padovani, R., et al., Reference levels at European level for cardiac interventional
procedures. Radiat Prot Dosimetry, 2008. 129(1-3): p. 104-7.
89. D'Helft, C., et al., Proposed preliminary diagnostic reference levels for three
common interventional cardiology procedures in Ireland. Radiat Prot Dosimetry,
2008. 129(1-3): p. 63-6.
90. Bogaert, E., K. Bacher, and H. Thierens, A large-scale multicentre study in Belgium
of dose area product values and effective doses in interventional cardiology using
contemporary X-ray equipment. Radiat Prot Dosimetry, 2008. 128(3): p. 312-23.
91. Paisley, E.M., et al., Patient radiation doses during invasive cardiac procedures
categorised by clinical code. Br J Radiol, 2004. 77(924): p. 1022-6.
92. Efstathopoulos, E.P., et al., Patient dosimetry during coronary interventions: a
comprehensive analysis. Am Heart J, 2004. 147(3): p. 468-75.
93. Miller, D.L., et al., Minimizing radiation-induced skin injury in interventional
radiology procedures. Radiology, 2002. 225(2): p. 329-36.
94. Wagner, L.K., P.J. Eifel, and R.A. Geise, Potential biological effects following high
X-ray dose interventional procedures. J Vasc Interv Radiol, 1994. 5(1): p. 71-84.

197
95. Shope, T.B., Radiation-induced skin injuries from fluoroscopy. Radiographics,
1996. 16(5): p. 1195-9.
96. Sovik, E., et al., Radiation-induced skin injury after percutaneous transluminal
coronary angioplasty. Case report. Acta Radiol, 1996. 37(3 Pt 1): p. 305-6.
97. Koenig, T.R., et al., Skin injuries from fluoroscopically guided procedures: part 1,
characteristics of radiation injury. AJR Am J Roentgenol, 2001. 177(1): p. 3-11.
98. Koenig, T.R., F.A. Mettler, and L.K. Wagner, Skin injuries from fluoroscopically
guided procedures: part 2, review of 73 cases and recommendations for minimizing
dose delivered to patient. AJR Am J Roentgenol, 2001. 177(1): p. 13-20.
99. Hymes, S.R., E.A. Strom, and C. Fife, Radiation dermatitis: clinical presentation,
pathophysiology, and treatment 2006. J Am Acad Dermatol, 2006. 54(1): p. 28-46.
100. Monaco, J.L., et al., Iatrogenic deep musculocutaneous radiation injury following
percutaneous coronary intervention. J Invasive Cardiol, 2003. 15(8): p. 451-3.
101. Jolles, B. and R.G. Harrison, Influence of wave length on biological effects --
"radation action sites" in the skin. Br J Radiol, 1970. 43(511): p. 501-2.
102. Hopewell, J.W., Mechanisms of the action of radiation on skin and underlying
tissues. Br J Radiol Suppl, 1986. 19: p. 39-47.
103. Morris, G.M. and J.W. Hopewell, Changes in the cell kinetics of pig epidermis after
single doses of X rays. Br J Radiol, 1988. 61(723): p. 205-11.
104. von Essen, C.F., Effect of field size on the reaction of pig skin to single doses of X
rays. Br J Radiol, 1982. 55(660): p. 936-7.
105. Hopewell, J.W., The skin: its structure and response to ionizing radiation. Int J
Radiat Biol, 1990. 57(4): p. 751-73.
198
106. Balter, S., et al., Fluoroscopically guided interventional procedures: a review of
radiation effects on patients' skin and hair. Radiology, 2010. 254(2): p. 326-41.
107. Faulkner, K., P. Ortiz-Lopez, and E. Vano, Patient dosimetry in diagnostic and
interventional radiology: a practical approach using trigger levels. Radiat Prot
Dosimetry, 2005. 117(1-3): p. 166-8.
108. Shrimpton, P.C., et al., NRPB Report 249. Survey of CT Practice in the UK Part 2:
Dosimetric Aspects, 1991.
109. Bor, D., et al., Comparison of effective doses obtained from dose-area product and
air kerma measurements in interventional radiology. Br J Radiol, 2004. 77(916): p.
315-22.
110. Brambilla, M., et al., Patient radiation doses and references levels in interventional
radiology. Radiol Med, 2004. 107(4): p. 408-18.
111. Ropolo, R., et al., [Evaluation of patient doses in interventional radiology]. Radiol
Med, 2001. 102(5-6): p. 384-90.
112. Huda, W. and N.A. Gkanatsios, Effective dose and energy imparted in diagnostic
radiology. Med Phys, 1997. 24(8): p. 1311-6.
113. Huda, W., et al., An approach for the estimation of effective radiation dose at CT in
pediatric patients. Radiology, 1997. 203(2): p. 417-22.
114. Gkanatsios, N.A. and W. Huda, Computation of energy imparted in diagnostic
radiology. Med Phys, 1997. 24(4): p. 571-9.
115. Theocharopoulos, N., et al., Energy imparted-based estimates of the effect of z
overscanning on adult and pediatric patient effective doses from multi-slice
computed tomography. Med Phys, 2007. 34(4): p. 1139-52.
199
116. Theocharopoulos, N., et al., Estimation of effective doses to adult and pediatric
patients from multislice computed tomography: A method based on energy
imparted. Med Phys, 2006. 33(10): p. 3846-56.
117. Huda, W. and W. He, Effective dose and carcinogenic risk at body CT (submitted).
AJR Am J Roentgenol, 2010.
118. Martin, C.J., A review of radiology staff doses and dose monitoring requirements.
Radiat Prot Dosimetry, 2009. 136(3): p. 140-57.
119. Niklason, L.T., M.V. Marx, and H.P. Chan, Interventional radiologists: occupational
radiation doses and risks. Radiology, 1993. 187(3): p. 729-33.
120. Mateya, C.F. and H.G. Claycamp, Phantom-derived estimation of effective dose
equivalent from X rays with and without a lead apron. Health Phys, 1997. 72(6): p.
842-7.
121. Theocharopoulos, N., et al., Occupational exposure in the electrophysiology
laboratory: quantifying and minimizing radiation burden. Br J Radiol, 2006.
79(944): p. 644-51.
122. Siiskonen, T., et al., Occupational radiation doses in interventional radiology:
simulations. Radiat Prot Dosimetry, 2008. 129(1-3): p. 36-8.
123. Vano, E., et al., Eye lens exposure to radiation in interventional suites: caution is
warranted. Radiology, 2008. 248(3): p. 945-53.
124. Whitby, M. and C.J. Martin, A study of the distribution of dose across the hands of
interventional radiologists and cardiologists. Br J Radiol, 2005. 78(927): p. 219-29.
125. Wyart, P., et al., [Contribution of self-surveillance of the personnel by electronic
radiation dosemeters in invasive cardiology]. Arch Mal Coeur Vaiss, 1997. 90(2): p.
233-8.

200
126. Marshall, N.W., K. Faulkner, and P. Clarke, An investigation into the effect of
protective devices on the dose to radiosensitive organs in the head and neck. Br J
Radiol, 1992. 65(777): p. 799-802.
127. Felmlee, J.P., et al., Hand dose measurements in interventional radiology. Health
Phys, 1991. 60(2): p. 265-7.
128. Renaud, L., A 5-y follow-up of the radiation exposure to in-room personnel during
cardiac catheterization. Health Phys, 1992. 62(1): p. 10-5.
129. Mann, J.T., 3rd, G. Cubeddu, and M. Arrowood, Operator Radiation Exposure in
PTCA: Comparison of Radial and Femoral Approaches. J Invasive Cardiol, 1996. 8
Suppl D: p. 22D-25D.
130. Watson, L.E., M.W. Riggs, and P.D. Bourland, Radiation exposure during
cardiology fellowship training. Health Phys, 1997. 73(4): p. 690-3.
131. Delichas, M., et al., Radiation exposure to cardiologists performing interventional
cardiology procedures. Eur J Radiol, 2003. 48(3): p. 268-73.
132. Tsapaki, V., et al., Occupational dose constraints in interventional cardiology
procedures: the DIMOND approach. Phys Med Biol, 2004. 49(6): p. 997-1005.
133. Vano, E., et al., Radiation exposure to medical staff in interventional and cardiac
radiology. Br J Radiol, 1998. 71(849): p. 954-60.
134. Efstathopoulos, E.P., et al., Patient and staff radiation dosimetry during cardiac
electrophysiology studies and catheter ablation procedures: a comprehensive
analysis. Europace, 2006. 8(6): p. 443-8.
135. Li, L.B., et al., Occupational exposure in pediatric cardiac catheterization. Health
Phys, 1995. 69(2): p. 261-4.
201
136. Efstathopoulos, E.P., et al., Medical personnel and patient dosimetry during
coronary angiography and intervention. Phys Med Biol, 2003. 48(18): p. 3059-68.
137. Goni, H., et al., Investigation of occupational radiation exposure during
interventional cardiac catheterisations performed via radial artery. Radiat Prot
Dosimetry, 2005. 117(1-3): p. 107-10.
138. Vano, E., et al., Lens injuries induced by occupational exposure in non-optimized
interventional radiology laboratories. Br J Radiol, 1998. 71(847): p. 728-33.
139. Pratt, T.A. and A.J. Shaw, Factors affecting the radiation dose to the lens of the eye
during cardiac catheterization procedures. Br J Radiol, 1993. 66(784): p. 346-50.
140. Smith, N.J., The ionising radiations regulations 1985. Br Dent J, 1986. 160(4): p.
135-7.
141. International Commission on Radiological Protection (ICRP) Publication 60. 1990
Recommendations of the International Commission on Radiological Protection. Ann
ICRP, 1991. 21(1-3): p. 1-201.
142. Clerinx, P., et al., Double-dosimetry algorithm for workers in interventional
radiology. Radiat Prot Dosimetry, 2008. 129(1-3): p. 321-7.
143. Rubinstein, R.Y., Simulation and the monte carlo method. 2nd ed. 2007, NY: John
Wiley & Sons.
144. Rebort, C.P. and G. Casella, Monte Carlo statistical methods. 2nd ed. 2004, NY:
Springer.
145. http://en.wikipedia.org/wiki/Monte_Carlo_algorithm. 2010; Available from:
http://en.wikipedia.org/wiki/Monte_Carlo_algorithm.
146. Forrest, B.B., Fundamentals of Monte Carlo Particle Tansport, 2010.

202
147. Neumann, J.V., Various techniques used in conjunction with random digits. J. Res.
Nat. Bur. Stand. Appl., 1951. Math Series 3: p. 36-38.
148. Brown, F.B. and Y. Nagaya, The MCNP5 random number generator. Trans. Am.
Nucl. Soc., 2002. [LA-UR-02-3782].
149. Everett, C.J. and E.D. Cashwell, A third Monte Carlo sampler. LA9721-MS, 1983.
150. MCNP, http://mcnp-green.lanl.gov/. 2010.
151. Brown, F.B., MCNP-a general Monte Carlo N-particle transport code, version 5.
Los Alamos National Laboratory Report, 2003(LA-UR-03-1987).
152. Bielajew, A.F., History, overview and recent improvements of EGS4. Technical
Report, 1994. PIRS-0436.
153. EGSnrc. http://irs.inms.nrc.ca/software/egsnrc/. 2010.
154. BEAMnrc. http://irs.inms.nrc.ca/software/beamnrc/. 2010.
155. Evgen'ev, M.B., et al., Penelope, a new family of transposable elements and its
possible role in hybrid dysgenesis in Drosophila virilis. Proc Natl Acad Sci U S A,
1997. 94(1): p. 196-201.
156. Sempau, J., et al., Monte Carlo simulation of electron beams from an accelerator
head using PENELOPE. Phys Med Biol, 2001. 46(4): p. 1163-86.
157. Paganetti, H. and B. Gottschalk, Test of GEANT3 and GEANT4 nuclear models for
160 MeV protons stopping in CH2. Med Phys, 2003. 30(7): p. 1926-31.
158. Carrier, J.F., et al., Validation of GEANT4, an object-oriented Monte Carlo toolkit,
for simulations in medical physics. Med Phys, 2004. 31(3): p. 484-92.
203
159. Jiang, H. and H. Paganetti, Adaptation of GEANT4 to Monte Carlo dose
calculations based on CT data. Med Phys, 2004. 31(10): p. 2811-8.
160. Poon, E., J. Seuntjens, and F. Verhaegen, Consistency test of the electron transport
algorithm in the GEANT4 Monte Carlo code. Phys Med Biol, 2005. 50(4): p. 681-
94.
161. Poon, E. and F. Verhaegen, Accuracy of the photon and electron physics in
GEANT4 for radiotherapy applications. Med Phys, 2005. 32(6): p. 1696-711.
162. Rannikko, S., et al., Computing patient doses of X-ray examinations using a patient
size- and sex-adjustable phantom. Br J Radiol, 1997. 70(835): p. 708-18.
163. van de Putte, S., et al., Correlation of patient skin doses in cardiac interventional
radiology with dose-area product. Br J Radiol, 2000. 73(869): p. 504-13.
164. BodyBuilder. http://www.whiterockscience.com/bodybuilder/bodybuilder.html.
2010; Available from:
http://www.whiterockscience.com/bodybuilder/bodybuilder.html.
165. Meric, N., Calculation of radiation dose to the lens of the eye using Monte Carlo
simulation. Appl Radiat Isot, 2001. 55(4): p. 557-60.
166. Struelens, L., et al., Effective doses in angiography and interventional radiology:
calculation of conversion coefficients for angiography of the lower limbs. Br J
Radiol, 2005. 78(926): p. 135-42.
167. STUK. http://www.stuk.fi/. 2010; Available from: http://www.stuk.fi/.
168. Xu, X.G., T.C. Chao, and A. Bozkurt, VIP-Man: an image-based whole-body adult
male model constructed from color photographs of the Visible Human Project for
multi-particle Monte Carlo calculations. Health Phys, 2000. 78(5): p. 476-86.
204
169. Bor, D., et al., Measurement and estimation of cardiologist dose received in
interventional examinations. AAPM 48th Annual Meeting, 2006.
170. ICRU Report No. 70: Image Quality in Chest Radiography, in Journal of the
ICRU2003, International Commission on Radiation Units and Measurements.
171. Webb, W.R., N.L. Müller, and D.P. Naidich, High-resolution CT of the Lung. 4th
ed. 2008, Philadelphia: Lippincott Williams & Wilkins (LWW).
172. Wallace, M.J., et al., Three-dimensional C-arm cone-beam CT: applications in the
interventional suite. J Vasc Interv Radiol, 2008. 19(6): p. 799-813.
173. Kalender, W.A. and Y. Kyriakou, Flat-detector computed tomography (FD-CT). Eur
Radiol, 2007. 17(11): p. 2767-79.
174. Vano, E., et al., Dynamic flat panel detector versus image intensifier in cardiac
imaging: dose and image quality. Phys Med Biol, 2005. 50(23): p. 5731-42.
175. Orth, R.C., et al., C-arm cone-beam CT: general principles and technical
considerations for use in interventional radiology. J Vasc Interv Radiol, 2008. 19(6):
p. 814-20.
176. Gupta, R., et al., Flat-panel volume CT: fundamental principles, technology, and
applications. Radiographics, 2008. 28(7): p. 2009-22.
177. NCRP, NCRP Report 160: Ionizing Radiation Exposure of the Population of the
United States. NCRP Publications, 2009.
178. Linton, O.W., et al., National conference on dose reduction in CT, with an emphasis
on pediatric patients. AJR Am J Roentgenol, 2003. 181(2): p. 321-9.
179. ICRP, ICRP Publication 87: Managing patient dose in computed tomography. 2000.
30(4).
205
180. Gies, M., et al., Dose reduction in CT by anatomically adapted tube current
modulation. I. Simulation studies. Med Phys, 1999. 26(11): p. 2235-47.
181. Kalender, W.A., H. Wolf, and C. Suess, Dose reduction in CT by anatomically
adapted tube current modulation. II. Phantom measurements. Med Phys, 1999.
26(11): p. 2248-53.
182. Huda, W., E.M. Scalzetti, and G. Levin, Technique factors and image quality as
functions of patient weight at abdominal CT. Radiology, 2000. 217(2): p. 430-5.
183. Kalender, W.A., Computed Tomography: Fundamentals, System Technology,
Image Quality, Applications. 2nd ed. 2005, Weinheim, Germany: Wiley-VCH
Verlag GmbH & Co.
184. Hsieh, J., Computed Tomography: Principles, Design, Artifacts, and Recent
Advances. 2003, Bellingham, Washington, USA: SPIE.
185. Vollmar, S.V. and W.A. Kalender, Reduction of dose to the female breast in
thoracic CT: a comparison of standard-protocol, bismuth-shielded, partial and tube-
current-modulated CT examinations. Eur Radiol, 2008. 18(8): p. 1674-82.
186. Carrington, C., SOMATOM definition flash dual source CT: leaving dose behind.
Siemens SOMATOM Sessions, 2008. Nov(23): p. 6-13.
187. Angel, E., et al., Monte Carlo simulations to assess the effects of tube current
modulation on breast dose for multidetector CT. Phys Med Biol, 2009. 54(3): p.
497-512.
188. Geleijns, J., et al., Quantitative assessment of selective in-plane shielding of tissues
in computed tomography through evaluation of absorbed dose and image quality.
Eur Radiol, 2006. 16(10): p. 2334-40.
206
189. Scarfe, W.C. and A.G. Farman, What is cone-beam CT and how does it work? Dent
Clin North Am, 2008. 52(4): p. 707-30, v.
190. Kyriakou, Y., M. Meyer, and W.A. Kalender, Technical note: comparing coherent
and incoherent scatter effects for cone-beam CT. Phys Med Biol, 2008. 53(10): p.
N175-85.
191. Kim, S., et al., Comparison of radiation doses between cone beam CT and multi
detector CT: TLD measurements. Radiat Prot Dosimetry, 2008. 132(3): p. 339-45.
192. Bushberg, J.T., et al., Essential Physics of Medical Imaging. 2nd ed. 2001,
Philadelphia: Lippincott Williams & Wilkins.
193. Wolbarst, A.B., Physics of Radiology. 2nd ed. 2000, Madison, Wisconsin: Medical
Physics. 376.
194. ICRP, ICRP Publication 103: The 2007 Recommendations of the ICRP. 2007. 37: p.
Nos 2-4.
195. Cristy, M. and K.F. Eckerman, Specific absorbed fractions of energy at various ages
from internal photon sources. I. Methods, 1987, Oak Ridge: Oak Ridge National
Laboratory.
196. Kalender, W.A., et al., Application- and patient size-dependent optimization of x-
ray spectra for CT. Med Phys, 2009. 36(3): p. 993-1007.
197. Huda, W., et al., Patient size and x-ray technique factors in head computed
tomography examinations. II. Image quality. Med Phys, 2004. 31(3): p. 595-601.
198. Stradiotti, P., et al., Metal-related artifacts in instrumented spine. Techniques for
reducing artifacts in CT and MRI: state of the art. Eur Spine J, 2009. 18 Suppl 1: p.
102-8.
207
199. Clemente, C.D., Anatomy - A Regional Atlas of the Human Body. 5th ed. 2006,
Philadelphia: Lippincott Williams & Wilkins.
200. McCollough, C.H., Automatic exposure control in CT: are we done yet? Radiology,
2005. 237(3): p. 755-6.
201. Semelka, R.C., et al., Imaging strategies to reduce the risk of radiation in CT
studies, including selective substitution with MRI. J Magn Reson Imaging, 2007.
25(5): p. 900-9.
202. ICRP, ICRP Publication 73: Radiological protection and safety in medicine. Annals
of the ICRP, 1996. 26(2).
203. Valentin, J., Managing patient dose in multi-detector computed
tomography(MDCT). ICRP Publication 102. Ann ICRP, 2007. 37(1): p. 1-79, iii.
204. Kalra, M.K., et al., Strategies for CT radiation dose optimization. Radiology, 2004.
230(3): p. 619-28.
205. Kalender, W.A., et al., Technical approaches to the optimisation of CT. Phys Med,
2008. 24(2): p. 71-9.
206. McCollough, C.H., M.R. Bruesewitz, and J.M. Kofler, Jr., CT dose reduction and
dose management tools: overview of available options. Radiographics : a review
publication of the Radiological Society of North America, Inc, 2006. 26(2): p. 503-
12.
207. Naidich, D.P., et al., Computed Tomography and Magnetic Resonance of the
Thorax. 4th ed. 2007, Philadelphia, PA: Lippincott Williams &Wilkins. 930.
208. Lee, C.H., et al., Radiation dose modulation techniques in the multidetector CT era:
from basics to practice. Radiographics : a review publication of the Radiological
Society of North America, Inc, 2008. 28(5): p. 1451-9.

208
209. van Straten, M., et al., The effect of angular and longitudinal tube current
modulations on the estimation of organ and effective doses in x-ray computed
tomography. Med Phys, 2009. 36(11): p. 4881-9.
210. ICRU, ICRU Report No. 74: Patient Dosimetry for X Rays used in Medical
Imaging. Journal of the ICRU, 2005. 5(2).
211. Hundt, W., et al., Dose reduction in multislice computed tomography. J Comput
Assist Tomogr, 2005. 29(1): p. 140-7.
212. Graser, A., et al., Dose reduction and image quality in MDCT colonography using
tube current modulation. AJR Am J Roentgenol, 2006. 187(3): p. 695-701.
213. National Academy of Sciences Committee on the Biological Effects of Ionizing
Radiation Report, V.I.I., Health Effects of Exposure to Low Levels of Ionizing
Radiations: Time for Reassessment?, 2005, National Research Council: Washington
DC.
214. ICRP, ICRP Publication 105: Radiation protection in medicine. Annals of the ICRP,
2007. 37(6): p. 1.
215. Huda, W., et al., Radiation-related cancer risks in a clinical patient population
undergoing cardiac CT. AJR Am J Roentgenol, 2011. 196(2): p. W159-65.
216. Muhogora, W.E., et al., Patient doses in CT examinations in 18 countries: initial
results from International Atomic Energy Agency projects. Radiat Prot Dosimetry,
2009. 136(2): p. 118-26.
217. McCollough, C.H., et al., Strategies for reducing radiation dose in CT. Radiol Clin
North Am, 2009. 47(1): p. 27-40.

209
218. Imanishi, Y., et al., Radiation-induced temporary hair loss as a radiation damage
only occurring in patients who had the combination of MDCT and DSA. Eur Radiol,
2005. 15(1): p. 41-6.
219. UNSCEAR, Effects of ionizing radiation. 2006.
220. Radiation protection in medicine. ICRP Publication 105. Ann ICRP, 2007. 37(6): p.
1-63.
221. Fujii, K., et al., Radiation dose evaluation in 64-slice CT examinations with adult
and paediatric anthropomorphic phantoms. Br J Radiol, 2009. 82(984): p. 1010-8.
222. Jones, D.G. and P.C. Shrimpton, NRPB-SR250 : Normalised Organ Doses for X-ray
Computed Tomography Calculated using Monte Carlo Techniques. 1993.
223. Cristy, M., Mathematical Phantoms Representing Children of Various Ages for Use
in Estimates of Internal Dose. U. S. Nuclear Regulatory Commission Report
NUREG/CR-1159, 1980.
224. Huda, W., et al., Organ doses to adult patients for chest CT. Med Phys, 2010. 37(2):
p. 842-7.
225. Beck, J.W., W.L. Dunn, and F. O'Foghludha, A Monte Carlo model for absorbed
dose calculations in computed tomography. Med Phys, 1983. 10(3): p. 314-20.
226. Boone, J.M. and J.A. Seibert, An accurate method for computer-generating tungsten
anode x-ray spectra from 30 to 140 kV. Med Phys, 1997. 24(11): p. 1661-70.
227. Deak, P.D., Y. Smal, and W.A. Kalender, Multisection CT protocols: sex- and age-
specific conversion factors used to determine effective dose from dose-length
product. Radiology, 2010. 257(1): p. 158-66.
210
228. Leschka, S., et al., Scan length adjustment of CT coronary angiography using the
calcium scoring scan: effect on radiation dose. AJR Am J Roentgenol, 2010. 194(3):
p. W272-7.
229. Huda, W., A. Sterzik, and S. Tipnis, X-ray beam filtration, dosimetry phantom size
and CT patient dose conversion factors. Phys Med Biol, 2010. 55(2): p. 551-61.
230. Lee, C.I., et al., Diagnostic CT scans: assessment of patient, physician, and
radiologist awareness of radiation dose and possible risks. Radiology, 2004. 231(2):
p. 393-8.
231. Li, X., et al., Patient-specific radiation dose and cancer risk estimation in CT: part
II. Application to patients. Med Phys, 2011. 38(1): p. 408-19.
232. Managing patient dose in computed tomography. A report of the International
Commission on Radiological Protection. Ann ICRP, 2000. 30(4): p. 7-45.
233. NCRP, Ionizing Radiation Exposure of the Population of the United States: NCRP
Report 160. 2009.
234. Huda, W. and F.A. Mettler, Volume CT dose index and dose-length product
displayed during CT: what good are they? Radiology, 2011. 258(1): p. 236-42.
235. McNitt-Gray, M.F., AAPM/RSNA Physics Tutorial for Residents: Topics in CT.
Radiation dose in CT. Radiographics, 2002. 22(6): p. 1541-53.
236. Huda, W., W.T. Rowlett, and U.J. Schoepf, Radiation dose at cardiac computed
tomography: facts and fiction. J Thorac Imaging, 2010. 25(3): p. 204-12.
237. Li, X., et al., Patient-specific dose estimation for pediatric chest CT. Med Phys,
2008. 35(12): p. 5821-8.
211
238. Nickoloff, E.L., A.K. Dutta, and Z.F. Lu, Influence of phantom diameter, kVp and
scan mode upon computed tomography dose index. Med Phys, 2003. 30(3): p. 395-
402.
239. Huda, W., K.M. Ogden, and M.R. Khorasani, Converting dose-length product to
effective dose at CT. Radiology, 2008. 248(3): p. 995-1003.
240. Borras, C., W. Huda, and C.G. Orton, Point/counterpoint. The use of effective dose
for medical procedures is inappropriate. Med Phys, 2010. 37(7): p. 3497-500.
241. Martin, C.J., Effective dose: how should it be applied to medical exposures? Br J
Radiol, 2007. 80(956): p. 639-47.
242. McCollough, C.H., J.A. Christner, and J.M. Kofler, How effective is effective dose
as a predictor of radiation risk? AJR Am J Roentgenol, 2010. 194(4): p. 890-6.
243. National Academy of Sciences Committee on the Biological Effects of Ionizing
Radiation (BEIR) Report VII. Health Effects of Exposure to Low Levels of Ionizing
Radiations: Time for Reassessment? 2005.
244. Huda, W., et al., Embryo dose estimates in body CT. AJR Am J Roentgenol, 2010.
194(4): p. 874-80.
245. Huda, W., et al., Computing effective dose in cardiac CT. Phys Med Biol, 2010.
55(13): p. 3675-84.
246. Israel, G.M., et al., Patient size and radiation exposure in thoracic, pelvic, and
abdominal CT examinations performed with automatic exposure control. AJR Am J
Roentgenol, 2010. 195(6): p. 1342-6.
247. Ogden, C.L., et al., Mean body weight, height, and body mass index, United States
1960-2002. Adv Data, 2004(347): p. 1-17.
212
248. Basic anatomical and physiological data for use in radiological protection: reference
values. A report of age- and gender-related differences in the anatomical and
physiological characteristics of reference individuals. ICRP Publication 89. Ann
ICRP, 2002. 32(3-4): p. 5-265.
249. Huda, W. and A. Vance, Patient radiation doses from adult and pediatric CT. AJR
Am J Roentgenol, 2007. 188(2): p. 540-6.
250. NCRP, Evaluation of the linear-nonthreshold dose-response model for ionizing
radiation: NCRP Report No. 136. 2001.
251. UNSCEAR., UNSCEAR 2006 Report: Effects of ionizing radiation. 2006.
252. Clarke, R.H., Radiation detriment: its quantification and use in setting standards.
Hum Exp Toxicol, 1991. 10(3): p. 149-57.
253. Huda, W., et al., Radiation doses and detriment from chest x-ray examinations. Phys
Med Biol, 1989. 34(10): p. 1477-92.
254. Hall, E.J. and A.J. Giaccia, Radiobiology for the radiologist. 6th ed. 2006,
Philadelphia, PA: Lippincott williams & wilkins.
255. Oikarinen, H., et al., Unjustified CT examinations in young patients. Eur Radiol,
2009. 19(5): p. 1161-5.
256. Achenbach, S., K. Anders, and W.A. Kalender, Dual-source cardiac computed
tomography: image quality and dose considerations. Eur Radiol, 2008. 18(6): p.
1188-98.
257. Joemai, R.M., J. Geleijns, and W.J. Veldkamp, Development and validation of a low
dose simulator for computed tomography. Eur Radiol, 2010. 20(4): p. 958-66.
258. Huda, W., Dose and image quality in CT. Pediatr Radiol, 2002. 32(10): p. 709-13;
discussion 751-4.
213
259. Krishnamoorthi, R., et al., Effectiveness of a staged US and CT protocol for the
diagnosis of pediatric appendicitis: reducing radiation exposure in the age of
ALARA. Radiology, 2011. 259(1): p. 231-9.
260. Murakami, Y., et al., Effect of tube voltage on image quality in 64-section
multidetector 3D CT angiography: Evaluation with a vascular phantom with
superimposed bone skull structures. AJNR Am J Neuroradiol, 2010. 31(4): p. 620-5.
261. Uffmann, M., et al., Flat-panel-detector chest radiography: effect of tube voltage on
image quality. Radiology, 2005. 235(2): p. 642-50.
262. Clemson Palmetto Cluster. http://citi.clemson.edu/palmetto. 2014; Available from:
http://citi.clemson.edu/palmetto.
263. Ogden, K., et al., Patient size and x-ray transmission in body CT. Health Phys,
2004. 86(4): p. 397-405.
264. MCNP - A General N-Particl Transport Code, Version 5. 2003.
265. Huda, W., Review of Radiologic Physics. 2010: Wolters Kluwer, Lippincott
Williams & Wilkins.
266. Kalender, W.A., Calculation of x-ray grid characteristics by Monte Carlo methods.
Phys Med Biol, 1982. 27(3): p. 353-61.
267. Pasternak, J.J. and E.E. Williamson, Clinical pharmacology, uses, and adverse
reactions of iodinated contrast agents: a primer for the non-radiologist. Mayo Clin
Proc, 2012. 87(4): p. 390-402.
268. Thomsen, H.S., Contrast media safety-an update. Eur J Radiol, 2011. 80(1): p. 77-
82.
269. Marin, D., et al., Body CT: technical advances for improving safety. AJR Am J
Roentgenol, 2011. 197(1): p. 33-41.

214
270. Mesa, A.V., et al., Dose distributions using kilovoltage x-rays and dose
enhancement from iodine contrast agents. Phys Med Biol, 1999. 44(8): p. 1955-68.
271. Solberg, T.D., K.S. Iwamoto, and A. Norman, Calculation of radiation dose
enhancement factors for dose enhancement therapy of brain tumours. Physics in
medicine and biology, 1992. 37(2): p. 439-43.
272. Verhaegen, F., et al., Dosimetric and microdosimetric study of contrast-enhanced
radiotherapy with kilovolt x-rays. Phys Med Biol, 2005. 50(15): p. 3555-69.
273. Santos Mello, R., et al., Radiation dose enhancement in tumors with iodine. Med
Phys, 1983. 10(1): p. 75-8.
274. Iwamoto, K.S., et al., Radiation dose enhancement therapy with iodine in rabbit
VX-2 brain tumors. Radiother Oncol, 1987. 8(2): p. 161-70.
275. Solberg, T.D., K.S. Iwamoto, and A. Norman, Calculation of radiation dose
enhancement factors for dose enhancement therapy of brain tumours. Phys Med
Biol, 1992. 37(2): p. 439-43.
276. Morris, K.N., M.D. Weil, and R. Malzbender, Radiochromic film dosimetry of
contrast-enhanced radiotherapy (CERT). Phys Med Biol, 2006. 51(22): p. 5915-25.
277. Schultz, B.J., et al., Monte Carlo simulation of contrast-enhanced whole brain
radiotherapy on a CT scanner. Med Phys, 2011. 38(8): p. 4672-80.
278. Amato, E., et al., A method to evaluate the dose increase in CT with iodinated
contrast medium. Med Phys, 2010. 37(8): p. 4249-56.
279. Amato, E., et al., Can contrast media increase organ doses in CT examinations? A
clinical study. AJR Am J Roentgenol, 2013. 200(6): p. 1288-93.
280. Zaidi, H. and M.R. Ay, Current status and new horizons in Monte Carlo simulation
of X-ray CT scanners. Med Biol Eng Comput, 2007. 45(9): p. 809-17.
215
281. Nelson, W.R., Hirayama, H., Rogers, D.W.O., SLAC Report 265: The EGS4 code
system. 1985.
282. Agosinelli, S., et al, Geant4—A simulation toolkit. Nucl. Instrum. Methods Phys.
Res. A, 2003. 506: p. 250-303.
283. Hobbie, R.K., Roth, B. J., Intermediate Physics for Medicine and Biology. 2007,
New York: Springer.
284. Huda, W., Review of Radiologic Physics. 3rd ed. 2012, Baltimore, MD: Lippincott
Williams & Wilkins.
285. Johns, H.E., Cunningham, J. R., Physics of Radiology. 4th ed. 1983, Springfield,
Illinois: Charles C Thomas Publisher.
286. NIST. X-ray Mass Attenuation Coefficients:
http://physics.nist.gov/PhysRefData/XrayMassCoef/ComTab/water.html. 2014.
287. Fenchel, S., et al., Effect of iodine concentration of contrast media on contrast
enhancement in multislice CT of the pancreas. Br J Radiol, 2004. 77(922): p. 821-
30.