monte carlo data envelopment analysis with genetic algorithm for knowledge management performance...
TRANSCRIPT
Expert Systems with Applications 39 (2012) 9348–9358
Contents lists available at SciVerse ScienceDirect
Expert Systems with Applications
journal homepage: www.elsevier .com/locate /eswa
Monte Carlo Data Envelopment Analysis with Genetic Algorithm forKnowledge Management performance measurement
Chuen Tse Kuah a, Kuan Yew Wong a,⇑, Wai Peng Wong b
a Department of Manufacturing and Industrial Engineering, Faculty of Mechanical Engineering, Universiti Teknologi Malaysia, 81310 UTM Skudai, Malaysiab School of Management, Universiti Sains Malaysia, 11800 Penang, Malaysia
a r t i c l e i n f o
Keywords:Knowledge Management (KM)Performance measurementData Envelopment Analysis (DEA)Monte Carlo simulationGenetic Algorithm (GA)
0957-4174/$ - see front matter � 2012 Elsevier Ltd. Adoi:10.1016/j.eswa.2012.02.140
⇑ Corresponding author. Tel.: +60 7 5534691; fax: +E-mail addresses: [email protected], kua
Wong).
a b s t r a c t
The paper targets to devise a genuine Knowledge Management (KM) performance measurement model ina stochastic setting based on Data Envelopment Analysis (DEA), Monte Carlo simulation and GeneticAlgorithm (GA). The proposed model evaluates KM using a set of proxy measures correlated with themajor KM processes. Data Collection Budget Allocation (DCBA) that maximizes the model accuracy isdetermined using GA. Additional data are generated and analyzed using a Monte-Carlo-enhanced DEAmodel to obtain the overall KM efficiency and KM processes’ efficiency scores. An application of themodel has been carried out to evaluate KM performance in higher educational institutions. It is found thatwith GA, the accuracy of the model has been greatly improved. Lastly, comparing with a conventionaldeterministic DEA model, the results from the proposed model would be more useful for managers todetermine future strategies to improve their KM.
� 2012 Elsevier Ltd. All rights reserved.
1. Introduction
Knowledge, expertise, and intellectual capital have been wellrecognized as important assets to achieve a continuous competi-tive advantage. Undoubtedly, an efficient Knowledge Management(KM) is the key to ensure an organization is utilizing its knowledgeassets in achieving high organizational performance. Evaluation ofthe efficiency of KM in an organization is thus important. Bench-marking with market competitors should also be done to discoverhow well the organization’s KM is performing in relation to itscompetitors. Despite the fact that such an evaluation model isimportant, there are only a limited number of models found in pastresearch.
Developing a performance measurement model for KM is chal-lenging in many aspects. Firstly, due to the intangible attribute ofknowledge, it is hard to measure how much knowledge is gener-ated and utilized in an organization. Secondly, the cause and effectrelationships between KM and organizational performance are stillnot being clearly defined, thus to relate KM performance to organi-zational performance would not be easy. Thirdly, to evaluate acomplex system such as KM, most of the time, there would bemultiple performance measures involved. The complex and inter-dependent relationships among the measures would be difficultto define or evaluate. Lastly, KM environment is highly dynamic,
ll rights reserved.
60 7 [email protected] (K.Y.
which means some performance measures may be subjected torandomness, and it would be very challenging to obtain a full setof accurate data. In addition, extensive data collection can hardlybe done due to the budget constraints on data collection.
This paper aims to address the issues mentioned above by pro-posing a KM performance measurement model devised based onthe Data Envelopment Analysis (DEA) methodology. The model isable to consolidate multiple performance measures into an effi-ciency score without having to define the complex relationshipsamong the measures. It is then enhanced with Monte Carlo simu-lation to handle stochastic data. Finally, the model accuracy hasbeen further improved by using Genetic Algorithm (GA).
The rest of the paper is structured as follows. Firstly, a briefreview on several applications of DEA related to KM will bepresented. This is followed by a discussion on the developed KMperformance measurement model. Then, an application of themodel to evaluate KM in higher educational institutions will beexhibited. The last section draws conclusions on the paper andhighlights some future research directions.
2. Literature review
DEA is a simple yet powerful methodology used to measure therelative efficiencies of a group of decision making units (DMUs)which converts multiple inputs into multiple outputs. It wasoriginally developed by Charnes, Cooper, and Rhodes (1978) andhas gained its popularity among researchers and practitionersthroughout the years. DEA has been applied in various fields and
C.T. Kuah et al. / Expert Systems with Applications 39 (2012) 9348–9358 9349
domains, for examples, banking (Camanho & Dyson, 2005), educa-tion (Agasisti & Pérez-Esparrells, 2010), airline (Yu & Chen, 2009),stock market (Deetz, Poddig, Sidorovitch, & Varmaz, 2009), govern-ment (Wang, Ran, Wang, & Shi, 2009), and supply chain (Wong &Wong, 2007).
There are a few DEA applications related to KM. Ahn and Chang(2004) applied DEA to estimate the linking matrices between theknowledge, process, and performance components. Their methodol-ogy assesses how much knowledge contributes to business perfor-mance. It can be useful to evaluate and compensate knowledgeworkers and to assist in making decisions on human capital develop-ment. However, some theoretical and practical issues remain, and atest using empirical data has not been reported.
Van Buren (1999) proposed an intellectual capital managementmodel that explains the transformation process of intellectual cap-ital stocks to firm performance. The link between intellectual cap-ital and business strategy was addressed by Joia (2000) using aproposed intangible corporate asset taxonomy. In the proposedframework, DEA was used to perform a benchmark analysis com-paring an organization’s business strategy action programs withthose of the competitors.
DEA was used by Wu, Tsai, Cheng, and Lai (2006) to evaluate thesuperiority of firms in terms of intellectual capital and manage-ment performance. It was found that DEA is a suitable tool forexamining intellectual capital stocks and how much firms shouldimprove in various aspects in order to become efficient.
The importance of intellectual capital had also been addressedin Yalama and Coskun (2007). They measured intellectual capitalby using a method called Value Added Intellectual Capital andtested the effect of intellectual capital performance on profitabilityusing DEA.
Wang and Guan (2005) reported an application of DEA to eval-uate the efficiency of a particular KM process, knowledge creation,in research groups. They found that the efficiency of knowledgeproduction is positively influenced by KM activities.
Being one of the building blocks of KM, a Knowledge Manage-ment System (KMS) is usually a costly investment. It is thus impor-tant to make sure that a KMS is performing well in an organization.Chen, Lu, and Yang (2009) used DEA to examine the performance ofelectricity distribution districts and explore the relationship be-tween a KMS and variations in the efficiency of companies. The re-sults showed that there is a positive relationship between a KMSand variations in organizational efficiency.
From the reviewed literature, it is found that the applications ofDEA for performance measurement in KM are very limited. More-over, a few shortcomings of past research have been identified.Firstly, all the applications mentioned above are only evaluatingsegments of KM rather than the overall KM context. In addition,as mentioned earlier, KM is stochastic in nature; however, noneof the past research has addressed this issue. Finally, none of theprevious studies has used optimization tools to optimize the per-formance of their models. Therefore, this research aims to addressthese shortcomings. It would be the first DEA application in theoverall KM context. In addition, Monte Carlo simulation is utilizedin this paper to address the stochastic issue. Lastly, GA will beimplemented in the proposed model to optimize its performance.
3. Developed KM performance measurement model
In this section, the developed model for KM performance mea-surement will be explained. Firstly, readers will be introduced tothe original DEA model devised by Charnes et al. (1978). Next,the DEA model is modified for evaluating KM performance. Lastly,its enhancement by Monte Carlo simulation and GA will beexplained.
3.1. The original DEA model
Talluri (2000) described DEA as a ‘‘multi-factor productivityanalysis model for measuring the relative efficiencies of a homog-enous set of DMUs’’. The underlying concept to find the relativeefficiency of each DMU is by comparing the input and output dataamong all DMUs. Assuming that there are n DMUs, each with m in-puts and s outputs, the relative efficiency score of a test DMU0 isobtained using the following model (Charnes et al., 1978):
max e0 ¼Ps
r¼1uryr0Pmi¼1v ixi0
s:t:Ps
r¼1uryrjPmi¼1v ixij
6 1; 8j
ur ;v i > 0; 8r; i
ð1Þ
where r = 1 to s, i = 1 to m, j = 1 to n, yrj = amount of output rproduced by DMU j, xij = amount of input i consumed by DMU j,ur = weight assigned to output yr, and vi = weight assigned toinput xi.
The model can be understood as follows. It determines the com-bination of weights (ur and vi) for DMU0 which is producing thehighest possible efficiency score e0 while limiting the efficiencyscores of all DMUs to be within 1. The model will be repeated ntimes to determine the optimum efficiency scores for all DMUs.DMUs with efficiency scores of 1 are considered as efficient, whilethose with scores less than 1 are perceived as inefficient.
3.2. Developed KM performance measurement framework with DEA
This section explains how the basic DEA model can be extendedto measure KM efficiency. It is difficult to measure the performanceof KM due to its intangible characteristics that include subjectivity,transferability, embeddedness, self-reinforcement, spontaneity,and perishability (Kluge, Stein, & Licht, 2001). Knowing that KMcan be viewed as a set of processes and activities that supports,facilitates, and leverages the development and use of knowledge(Dalkir, Wiseman, Shulha, & McIntyre, 2007), in this paper, an ap-proach is proposed to measure KM performance by evaluating itsprocesses both jointly and separately.
There is no unified and universally agreed definition for KMprocesses. In this paper, KM is divided into four activities whichare explained as follows:
1. Knowledge creation and acquisition – the process refers to thegeneration of new knowledge. It is evaluated based on the creativ-ity and ability of the knowledge workers to generate and acquirenew knowledge, ideas, products or services, and solutions.
2. Knowledge storing and retrieval – the process of storing andretrieving knowledge which can be kept in many forms, includ-ing electronic repositories and written documents. It is evalu-ated based on the ability of an institution to convert tacitknowledge into explicit knowledge and vice versa, store theknowledge, and enable its accessibility.
3. Knowledge dissemination and sharing – the process of distrib-uting knowledge to the workers and knowledge sharing amongthem. These can be achieved via face-to-face interactions ortechnological media such as emails and electronic newsletters.The process is gauged based on the ability of an institution todisseminate knowledge to the workers and the intensity ofknowledge sharing among them.
4. Knowledge utilization and application – the process takes placewhen workers are using knowledge to improve their work,solve problems, develop new products and inventions, and gen-erate intellectual properties. It is measured based on the extentof knowledge utilized by the workers.
9350 C.T. Kuah et al. / Expert Systems with Applications 39 (2012) 9348–9358
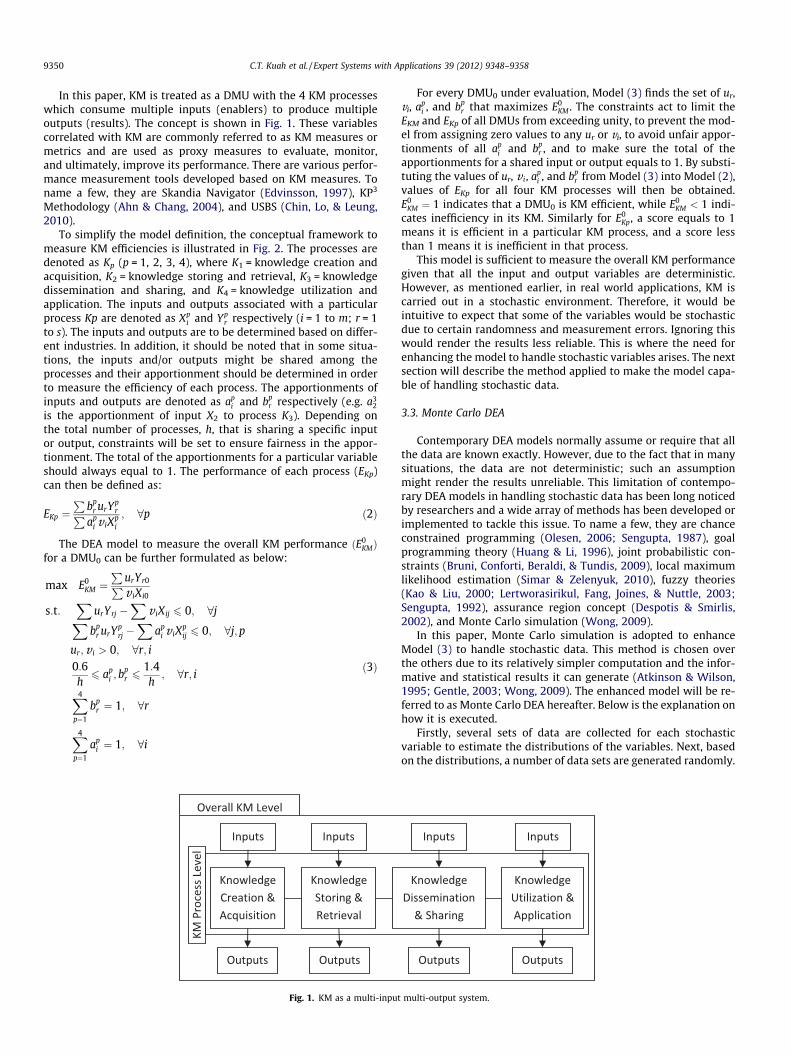
In this paper, KM is treated as a DMU with the 4 KM processeswhich consume multiple inputs (enablers) to produce multipleoutputs (results). The concept is shown in Fig. 1. These variablescorrelated with KM are commonly referred to as KM measures ormetrics and are used as proxy measures to evaluate, monitor,and ultimately, improve its performance. There are various perfor-mance measurement tools developed based on KM measures. Toname a few, they are Skandia Navigator (Edvinsson, 1997), KP3
Methodology (Ahn & Chang, 2004), and USBS (Chin, Lo, & Leung,2010).
To simplify the model definition, the conceptual framework tomeasure KM efficiencies is illustrated in Fig. 2. The processes aredenoted as Kp (p = 1, 2, 3, 4), where K1 = knowledge creation andacquisition, K2 = knowledge storing and retrieval, K3 = knowledgedissemination and sharing, and K4 = knowledge utilization andapplication. The inputs and outputs associated with a particularprocess Kp are denoted as Xp
i and Ypr respectively (i = 1 to m; r = 1
to s). The inputs and outputs are to be determined based on differ-ent industries. In addition, it should be noted that in some situa-tions, the inputs and/or outputs might be shared among theprocesses and their apportionment should be determined in orderto measure the efficiency of each process. The apportionments ofinputs and outputs are denoted as ap
i and bpr respectively (e.g. a3
2
is the apportionment of input X2 to process K3). Depending onthe total number of processes, h, that is sharing a specific inputor output, constraints will be set to ensure fairness in the appor-tionment. The total of the apportionments for a particular variableshould always equal to 1. The performance of each process (EKp)can then be defined as:
EKp ¼P
bpr urY
prP
api v iX
pi
; 8p ð2Þ
The DEA model to measure the overall KM performance ðE0KMÞ
for a DMU0 can be further formulated as below:
max E0KM ¼
PurYr0Pv iXi0
s:t:X
urYrj �X
v iXij 6 0; 8jXbp
r urYprj �
Xap
i v iXpij 6 0; 8j;p
ur; v i > 0; 8r; i0:6h6 ap
i ; bpr 6
1:4h; 8r; i
X4
p¼1
bpr ¼ 1; 8r
X4
p¼1
api ¼ 1; 8i
ð3Þ
Fig. 1. KM as a multi-input
For every DMU0 under evaluation, Model (3) finds the set of ur,vi, ap
i , and bpr that maximizes E0
KM . The constraints act to limit theEKM and EKp of all DMUs from exceeding unity, to prevent the mod-el from assigning zero values to any ur or vi, to avoid unfair appor-tionments of all ap
i and bpr , and to make sure the total of the
apportionments for a shared input or output equals to 1. By substi-tuting the values of ur, v i, ap
i , and bpr from Model (3) into Model (2),
values of EKp for all four KM processes will then be obtained.E0
KM ¼ 1 indicates that a DMU0 is KM efficient, while E0KM < 1 indi-
cates inefficiency in its KM. Similarly for E0Kp, a score equals to 1
means it is efficient in a particular KM process, and a score lessthan 1 means it is inefficient in that process.
This model is sufficient to measure the overall KM performancegiven that all the input and output variables are deterministic.However, as mentioned earlier, in real world applications, KM iscarried out in a stochastic environment. Therefore, it would beintuitive to expect that some of the variables would be stochasticdue to certain randomness and measurement errors. Ignoring thiswould render the results less reliable. This is where the need forenhancing the model to handle stochastic variables arises. The nextsection will describe the method applied to make the model capa-ble of handling stochastic data.
3.3. Monte Carlo DEA
Contemporary DEA models normally assume or require that allthe data are known exactly. However, due to the fact that in manysituations, the data are not deterministic; such an assumptionmight render the results unreliable. This limitation of contempo-rary DEA models in handling stochastic data has been long noticedby researchers and a wide array of methods has been developed orimplemented to tackle this issue. To name a few, they are chanceconstrained programming (Olesen, 2006; Sengupta, 1987), goalprogramming theory (Huang & Li, 1996), joint probabilistic con-straints (Bruni, Conforti, Beraldi, & Tundis, 2009), local maximumlikelihood estimation (Simar & Zelenyuk, 2010), fuzzy theories(Kao & Liu, 2000; Lertworasirikul, Fang, Joines, & Nuttle, 2003;Sengupta, 1992), assurance region concept (Despotis & Smirlis,2002), and Monte Carlo simulation (Wong, 2009).
In this paper, Monte Carlo simulation is adopted to enhanceModel (3) to handle stochastic data. This method is chosen overthe others due to its relatively simpler computation and the infor-mative and statistical results it can generate (Atkinson & Wilson,1995; Gentle, 2003; Wong, 2009). The enhanced model will be re-ferred to as Monte Carlo DEA hereafter. Below is the explanation onhow it is executed.
Firstly, several sets of data are collected for each stochasticvariable to estimate the distributions of the variables. Next, basedon the distributions, a number of data sets are generated randomly.
multi-output system.
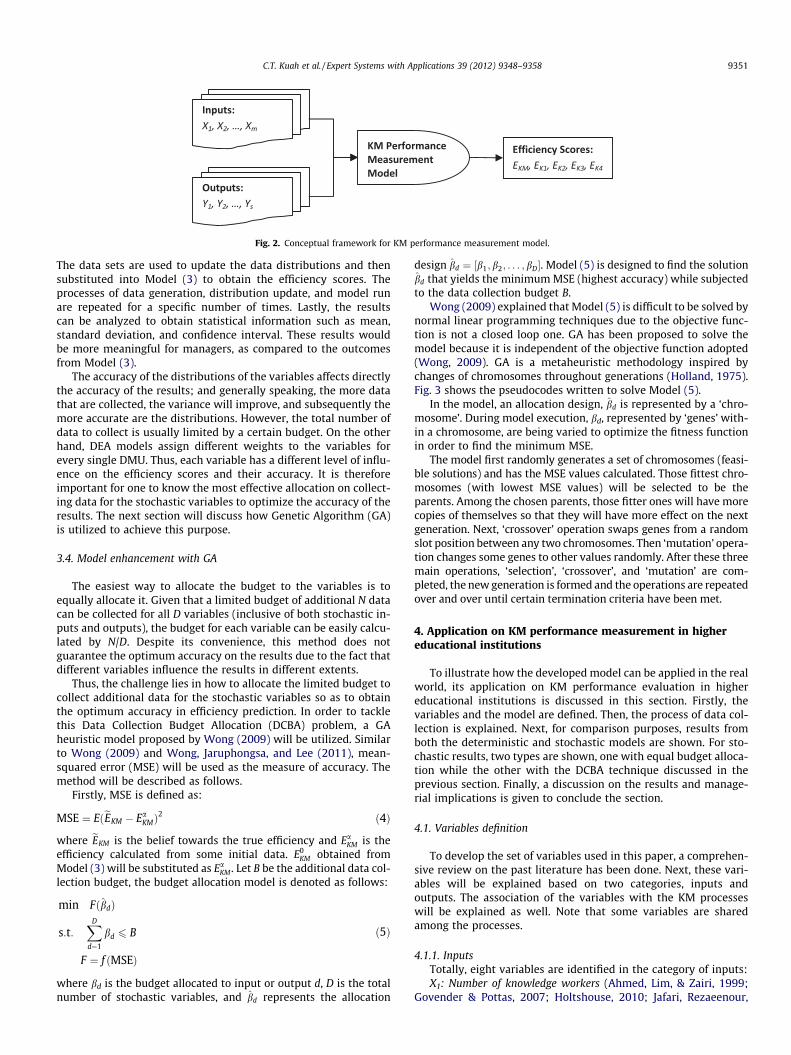
Fig. 2. Conceptual framework for KM performance measurement model.
C.T. Kuah et al. / Expert Systems with Applications 39 (2012) 9348–9358 9351
The data sets are used to update the data distributions and thensubstituted into Model (3) to obtain the efficiency scores. Theprocesses of data generation, distribution update, and model runare repeated for a specific number of times. Lastly, the resultscan be analyzed to obtain statistical information such as mean,standard deviation, and confidence interval. These results wouldbe more meaningful for managers, as compared to the outcomesfrom Model (3).
The accuracy of the distributions of the variables affects directlythe accuracy of the results; and generally speaking, the more datathat are collected, the variance will improve, and subsequently themore accurate are the distributions. However, the total number ofdata to collect is usually limited by a certain budget. On the otherhand, DEA models assign different weights to the variables forevery single DMU. Thus, each variable has a different level of influ-ence on the efficiency scores and their accuracy. It is thereforeimportant for one to know the most effective allocation on collect-ing data for the stochastic variables to optimize the accuracy of theresults. The next section will discuss how Genetic Algorithm (GA)is utilized to achieve this purpose.
3.4. Model enhancement with GA
The easiest way to allocate the budget to the variables is toequally allocate it. Given that a limited budget of additional N datacan be collected for all D variables (inclusive of both stochastic in-puts and outputs), the budget for each variable can be easily calcu-lated by N/D. Despite its convenience, this method does notguarantee the optimum accuracy on the results due to the fact thatdifferent variables influence the results in different extents.
Thus, the challenge lies in how to allocate the limited budget tocollect additional data for the stochastic variables so as to obtainthe optimum accuracy in efficiency prediction. In order to tacklethis Data Collection Budget Allocation (DCBA) problem, a GAheuristic model proposed by Wong (2009) will be utilized. Similarto Wong (2009) and Wong, Jaruphongsa, and Lee (2011), mean-squared error (MSE) will be used as the measure of accuracy. Themethod will be described as follows.
Firstly, MSE is defined as:
MSE ¼ EðeEKM � EaKMÞ
2 ð4Þ
where eEKM is the belief towards the true efficiency and EaKM is the
efficiency calculated from some initial data. E0KM obtained from
Model (3) will be substituted as EaKM . Let B be the additional data col-
lection budget, the budget allocation model is denoted as follows:
min Fðb̂dÞ
s:t:XD
d¼1
bd 6 B
F ¼ f ðMSEÞ
ð5Þ
where bd is the budget allocated to input or output d, D is the totalnumber of stochastic variables, and b̂d represents the allocation
design b̂d ¼ ½b1;b2; . . . ;bD�. Model (5) is designed to find the solutionb̂d that yields the minimum MSE (highest accuracy) while subjectedto the data collection budget B.
Wong (2009) explained that Model (5) is difficult to be solved bynormal linear programming techniques due to the objective func-tion is not a closed loop one. GA has been proposed to solve themodel because it is independent of the objective function adopted(Wong, 2009). GA is a metaheuristic methodology inspired bychanges of chromosomes throughout generations (Holland, 1975).Fig. 3 shows the pseudocodes written to solve Model (5).
In the model, an allocation design, b̂d is represented by a ‘chro-mosome’. During model execution, bd, represented by ‘genes’ with-in a chromosome, are being varied to optimize the fitness functionin order to find the minimum MSE.
The model first randomly generates a set of chromosomes (feasi-ble solutions) and has the MSE values calculated. Those fittest chro-mosomes (with lowest MSE values) will be selected to be theparents. Among the chosen parents, those fitter ones will have morecopies of themselves so that they will have more effect on the nextgeneration. Next, ‘crossover’ operation swaps genes from a randomslot position between any two chromosomes. Then ‘mutation’ opera-tion changes some genes to other values randomly. After these threemain operations, ‘selection’, ‘crossover’, and ‘mutation’ are com-pleted, the new generation is formed and the operations are repeatedover and over until certain termination criteria have been met.
4. Application on KM performance measurement in highereducational institutions
To illustrate how the developed model can be applied in the realworld, its application on KM performance evaluation in highereducational institutions is discussed in this section. Firstly, thevariables and the model are defined. Then, the process of data col-lection is explained. Next, for comparison purposes, results fromboth the deterministic and stochastic models are shown. For sto-chastic results, two types are shown, one with equal budget alloca-tion while the other with the DCBA technique discussed in theprevious section. Finally, a discussion on the results and manage-rial implications is given to conclude the section.
4.1. Variables definition
To develop the set of variables used in this paper, a comprehen-sive review on the past literature has been done. Next, these vari-ables will be explained based on two categories, inputs andoutputs. The association of the variables with the KM processeswill be explained as well. Note that some variables are sharedamong the processes.
4.1.1. InputsTotally, eight variables are identified in the category of inputs:X1: Number of knowledge workers (Ahmed, Lim, & Zairi, 1999;
Govender & Pottas, 2007; Holtshouse, 2010; Jafari, Rezaeenour,

Fig. 3. GA pseudocodes for budget allocation.
9352 C.T. Kuah et al. / Expert Systems with Applications 39 (2012) 9348–9358
Akhavan, & Fesharaki, 2010; Nathan & Soni, 2008; Robinson,Carrillo, Anumba, & Al-Ghassani, 2005; Ross, Ross, Dragonetti, &Edvinsson, 1998; Von Krough, Roos, & Kleine, 1999; Wen, 2009)– Knowledge workers are one of the fundamental elements ofKM. They generate new knowledge, ideas and solutions and storeall these in knowledge databases or idea banks for retrieval whenneeded. A worker’s mind itself is a reservoir for tacit knowledge.This tacit knowledge is normally shared most effectively throughpersonal interactions. Lastly, workers utilize knowledge and exper-tise available to solve problems and improve the organizationalperformance. This variable is a fundamental building block thatassociates with all 4 KM processes.
X2: Investment in IT and KMS per year (Ahmed et al., 1999; Alavi& Leidner, 2001; Ardichvili, Maurer, Li, Wentling, & Stuedemann,2005; Conley & Wei, 2009; Dalkir, 2005; Davenport & Prusak,2000; Ho, 2009; Holtshouse, 2010; Jafari et al., 2010; Riege,2005; Thomson, El-Haram, & Hardcastle, 2009; Von Krough et al.,1999; Wong, 2005; Wong & Aspinwall, 2005) – Apart from themanpower, IT and KMS are the two basic architectures of KM. Theyenable workers to acquire and store knowledge rapidly, distributeit, and make it easily searched, retrieved, and utilized. Moreover, ITand KMS support the collaborations and communications amongthe workers and enable the formation of virtual communities ofpractice (CoPs). Being the fundamental building block of KM, X2
is associated with all four KM processes as well.X3: Number of meetings for idea generation attended per employee
per month (Dalkir et al., 2007; Geisler, 2007; Jafari et al., 2010; Jos-une, Nekane, & Olga, 2009; Ross et al., 1998; Thomson et al., 2009;Wiig, 2004) – Examples of idea generation meetings are like brain-storming and strategic meetings. In such meetings, new knowledgeand ideas would be sparked and generated through interactionsand discussions among the workers. X3 is associated with K1. X3
has been identified as a stochastic variable as the number of suchmeetings is normally not certain and changes every month.
X4: Expenditures on training and educational programs per year(Ahmed et al., 1999; Conley & Wei, 2009; Dalkir et al., 2007; Geis-ler, 2007; Govender & Pottas, 2007; Holtshouse, 2010; Jafari et al.,2010; Jing, Yoshiteru, & Andrzej, 2009; Robinson et al., 2005; Rosset al., 1998; Thomson et al., 2009; Von Krough et al., 1999; Wen,2009; Wong, 2005; Wong & Aspinwall, 2005) – Ongoing trainingand educational programs are means to transfer up-to-date knowl-edge to the workers. Furthermore, upon digesting the obtainedknowledge, new knowledge or ideas would be generated by theworkers. This variable is therefore associated with both K1 and K3.
X5: Number of R&D projects per year (Ahmed et al., 1999;Caloghirou, Kastelli, & Tsakanikas, 2004; Chang, 2003; Govender& Pottas, 2007; Jafari et al., 2010; Jiang & Li, 2009; Von Kroughet al., 1999) – An organization’s success is greatly influenced by
its innovations. R&D projects are necessary for an organization tocreate new products, inventions and services. The number ofR&D projects serves as a proxy measure for the level of effortof an organization in developing new knowledge and thus it isassociated with K1.
X6: Working hours per employee spent for inputting knowledgeinto KMS per month (Costa, Meira, Jucá, & Ribeiro, 2010; Geisler,2007; Jafari et al., 2010; Liao & Xu, 2006; Nathan & Soni, 2008) –Knowledge and experiences that reside in a worker’s mind leavethe company together with him/her. Therefore, KMS is an impor-tant means to act as a reservoir for storing workers’ knowledge.With proper motivation, knowledge workers would spend timeto store their knowledge in KMS. X6 is associated with K2 and takenas a proxy measure for the effort spent by workers to transformtheir tacit knowledge into explicit knowledge stored in KMS. How-ever, due to the fact that every worker spends different amount oftime for this, X6 is identified as a stochastic variable.
X7: Number of knowledge sharing sessions attended per employeeper month (Geisler, 2007; Jafari et al., 2010; Josune et al., 2009;Lee, 2000; Ross et al., 1998; Thomson et al., 2009; Wiig, 2004) –Knowledge and experience sharing sessions are means to supporttacit-to-tacit knowledge sharing among the workers. By learningfrom others’ knowledge and experiences, workers are expected toperform better in their daily work. X7 is associated with K3. Thenumber of sessions attended by the workers every month variesand thus it is considered as stochastic.
X8: Expenditures on implementing ideas or solutions per year (Ala-vi & Leidner, 2001; Ho, 2009; Lee, Lee, & Kang, 2005; Liebowitz &Suen, 2000; Ross et al., 1998) – New ideas and solutions aredeemed worthless for an organization if they are not implementedor applied. Most of the time, there will be certain expenditures in-curred when implementing new ideas or solutions. X8 is thereforetaken as an input for K4.
4.1.2. OutputsTotally, nine variables are identified in the category of outputs:Y1: Number of new knowledge, ideas, and solutions created per em-
ployee per month (Davila, Epstein, & Shelton, 2006; Goldoni & Oli-veira, 2010; Govender & Pottas, 2007; Jing et al., 2009; Josuneet al., 2009; Lee, 2000; Liebowitz & Suen, 2000; Robinson et al.,2005; Ross et al., 1998; Wen, 2009) – New knowledge, ideas, andsolutions are created by the knowledge workers via the processof knowledge creation. In addition, by acquiring knowledge exter-nally, new ideas and solutions may be imported into a company aswell. This stochastic variable is associated with K1.
Y2: Number of new products, inventions, and services generated peryear (Ahmed et al., 1999; Beneito, 2006; Harlow, 2008; Holtshouse,2010; Jafari et al., 2010; Jiang & Li, 2009; Lee, 2000; Li, Huang, &
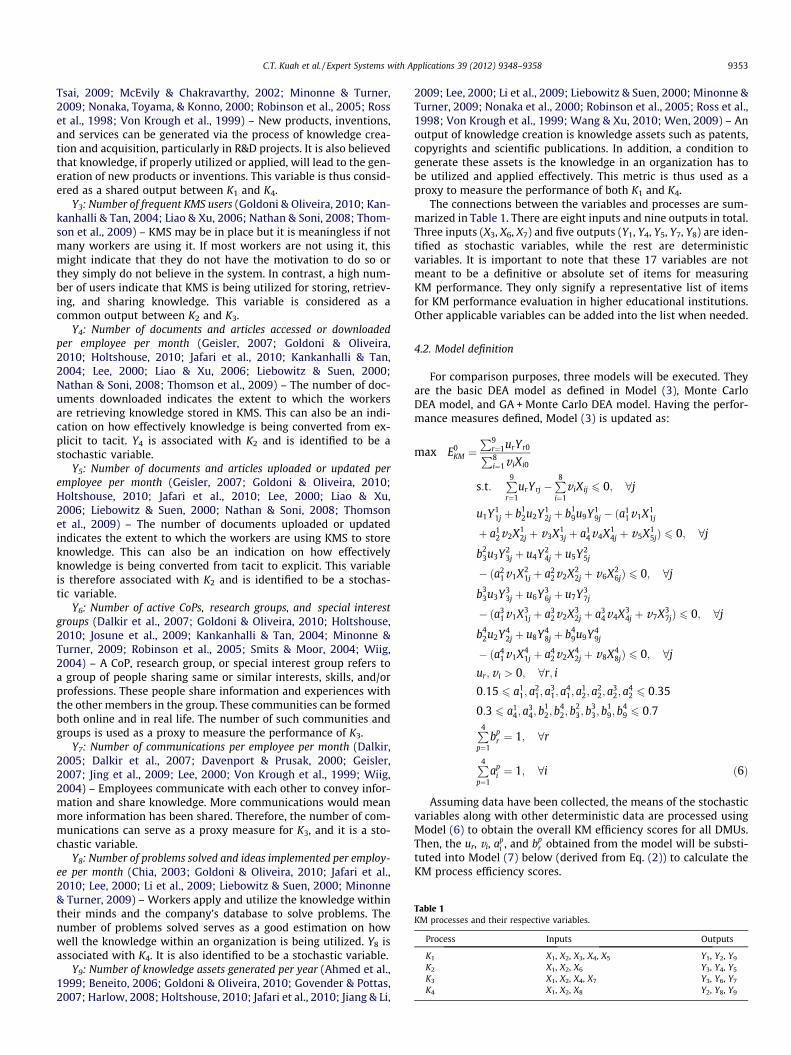
Table 1KM processes and their respective variables.
Process Inputs Outputs
K1 X1, X2, X3, X4, X5 Y1, Y2, Y9
K2 X1, X2, X6 Y3, Y4, Y5
K3 X1, X2, X4, X7 Y3, Y6, Y7
K4 X1, X2, X8 Y2, Y8, Y9
C.T. Kuah et al. / Expert Systems with Applications 39 (2012) 9348–9358 9353
Tsai, 2009; McEvily & Chakravarthy, 2002; Minonne & Turner,2009; Nonaka, Toyama, & Konno, 2000; Robinson et al., 2005; Rosset al., 1998; Von Krough et al., 1999) – New products, inventions,and services can be generated via the process of knowledge crea-tion and acquisition, particularly in R&D projects. It is also believedthat knowledge, if properly utilized or applied, will lead to the gen-eration of new products or inventions. This variable is thus consid-ered as a shared output between K1 and K4.
Y3: Number of frequent KMS users (Goldoni & Oliveira, 2010; Kan-kanhalli & Tan, 2004; Liao & Xu, 2006; Nathan & Soni, 2008; Thom-son et al., 2009) – KMS may be in place but it is meaningless if notmany workers are using it. If most workers are not using it, thismight indicate that they do not have the motivation to do so orthey simply do not believe in the system. In contrast, a high num-ber of users indicate that KMS is being utilized for storing, retriev-ing, and sharing knowledge. This variable is considered as acommon output between K2 and K3.
Y4: Number of documents and articles accessed or downloadedper employee per month (Geisler, 2007; Goldoni & Oliveira,2010; Holtshouse, 2010; Jafari et al., 2010; Kankanhalli & Tan,2004; Lee, 2000; Liao & Xu, 2006; Liebowitz & Suen, 2000;Nathan & Soni, 2008; Thomson et al., 2009) – The number of doc-uments downloaded indicates the extent to which the workersare retrieving knowledge stored in KMS. This can also be an indi-cation on how effectively knowledge is being converted from ex-plicit to tacit. Y4 is associated with K2 and is identified to be astochastic variable.
Y5: Number of documents and articles uploaded or updated peremployee per month (Geisler, 2007; Goldoni & Oliveira, 2010;Holtshouse, 2010; Jafari et al., 2010; Lee, 2000; Liao & Xu,2006; Liebowitz & Suen, 2000; Nathan & Soni, 2008; Thomsonet al., 2009) – The number of documents uploaded or updatedindicates the extent to which the workers are using KMS to storeknowledge. This can also be an indication on how effectivelyknowledge is being converted from tacit to explicit. This variableis therefore associated with K2 and is identified to be a stochas-tic variable.
Y6: Number of active CoPs, research groups, and special interestgroups (Dalkir et al., 2007; Goldoni & Oliveira, 2010; Holtshouse,2010; Josune et al., 2009; Kankanhalli & Tan, 2004; Minonne &Turner, 2009; Robinson et al., 2005; Smits & Moor, 2004; Wiig,2004) – A CoP, research group, or special interest group refers toa group of people sharing same or similar interests, skills, and/orprofessions. These people share information and experiences withthe other members in the group. These communities can be formedboth online and in real life. The number of such communities andgroups is used as a proxy to measure the performance of K3.
Y7: Number of communications per employee per month (Dalkir,2005; Dalkir et al., 2007; Davenport & Prusak, 2000; Geisler,2007; Jing et al., 2009; Lee, 2000; Von Krough et al., 1999; Wiig,2004) – Employees communicate with each other to convey infor-mation and share knowledge. More communications would meanmore information has been shared. Therefore, the number of com-munications can serve as a proxy measure for K3, and it is a sto-chastic variable.
Y8: Number of problems solved and ideas implemented per employ-ee per month (Chia, 2003; Goldoni & Oliveira, 2010; Jafari et al.,2010; Lee, 2000; Li et al., 2009; Liebowitz & Suen, 2000; Minonne& Turner, 2009) – Workers apply and utilize the knowledge withintheir minds and the company’s database to solve problems. Thenumber of problems solved serves as a good estimation on howwell the knowledge within an organization is being utilized. Y8 isassociated with K4. It is also identified to be a stochastic variable.
Y9: Number of knowledge assets generated per year (Ahmed et al.,1999; Beneito, 2006; Goldoni & Oliveira, 2010; Govender & Pottas,2007; Harlow, 2008; Holtshouse, 2010; Jafari et al., 2010; Jiang & Li,
2009; Lee, 2000; Li et al., 2009; Liebowitz & Suen, 2000; Minonne &Turner, 2009; Nonaka et al., 2000; Robinson et al., 2005; Ross et al.,1998; Von Krough et al., 1999; Wang & Xu, 2010; Wen, 2009) – Anoutput of knowledge creation is knowledge assets such as patents,copyrights and scientific publications. In addition, a condition togenerate these assets is the knowledge in an organization has tobe utilized and applied effectively. This metric is thus used as aproxy to measure the performance of both K1 and K4.
The connections between the variables and processes are sum-marized in Table 1. There are eight inputs and nine outputs in total.Three inputs (X3, X6, X7) and five outputs (Y1, Y4, Y5, Y7, Y8) are iden-tified as stochastic variables, while the rest are deterministicvariables. It is important to note that these 17 variables are notmeant to be a definitive or absolute set of items for measuringKM performance. They only signify a representative list of itemsfor KM performance evaluation in higher educational institutions.Other applicable variables can be added into the list when needed.
4.2. Model definition
For comparison purposes, three models will be executed. Theyare the basic DEA model as defined in Model (3), Monte CarloDEA model, and GA + Monte Carlo DEA model. Having the perfor-mance measures defined, Model (3) is updated as:
max E0KM ¼
P9r¼1urYr0P8i¼1v iXi0
s:t:P9r¼1
urYrj �P8i¼1
v iXij 6 0; 8j
u1Y11j þ b1
2u2Y12j þ b1
9u9Y19j � ða1
1v1X11j
þ a12v2X1
2j þ v3X13j þ a1
4v4X14j þ v5X1
5jÞ 6 0; 8j
b23u3Y2
3j þ u4Y24j þ u5Y2
5j
� ða21v1X2
1j þ a22v2X2
2j þ v6X26jÞ 6 0; 8j
b33u3Y3
3j þ u6Y36j þ u7Y3
7j
� ða31v1X3
1j þ a32v2X3
2j þ a34v4X3
4j þ v7X37jÞ 6 0; 8j
b42u2Y4
2j þ u8Y48j þ b4
9u9Y49j
� ða41v1X4
1j þ a42v2X4
2j þ v8X48jÞ 6 0; 8j
ur; v i > 0; 8r; i
0:15 6 a11; a
21; a
31; a
41; a
12; a
22; a
32; a
42 6 0:35
0:3 6 a14; a
34; b
12; b
42; b
23; b
33; b
19; b
49 6 0:7
P4p¼1
bpr ¼ 1; 8r
P4p¼1
api ¼ 1; 8i ð6Þ
Assuming data have been collected, the means of the stochasticvariables along with other deterministic data are processed usingModel (6) to obtain the overall KM efficiency scores for all DMUs.Then, the ur, vi, ap
i , and bpr obtained from the model will be substi-
tuted into Model (7) below (derived from Eq. (2)) to calculate theKM process efficiency scores.
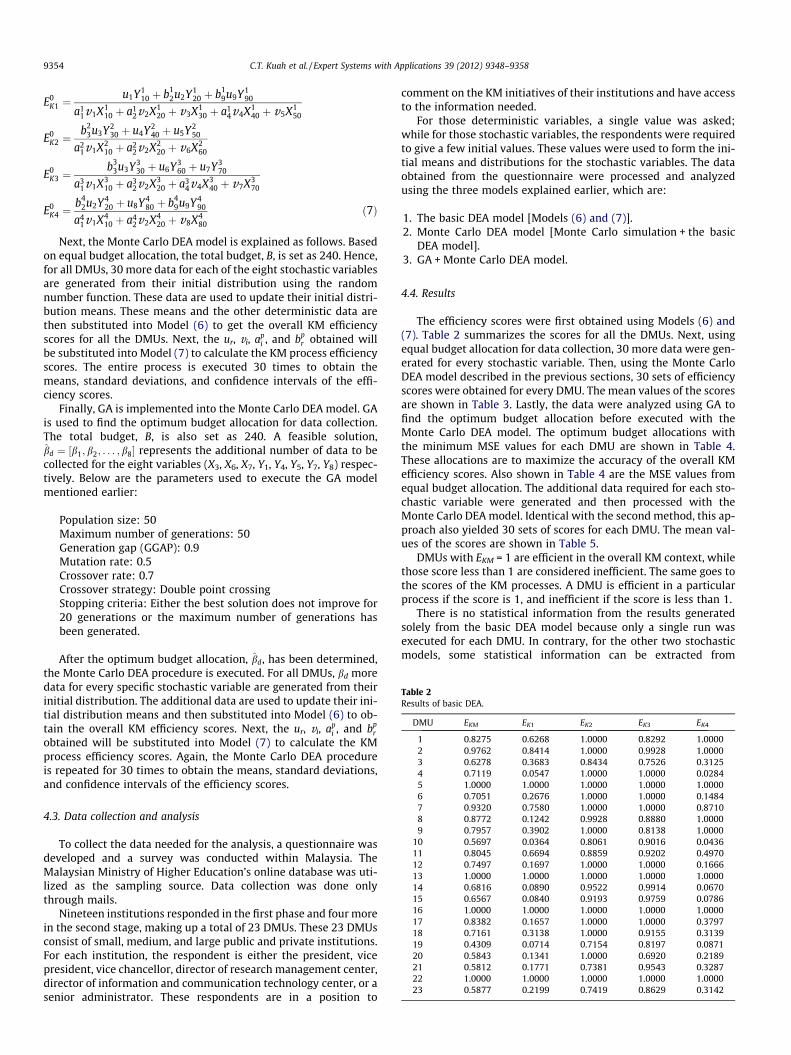
Table 2Results of basic DEA.
DMU EKM EK1 EK2 EK3 EK4
1 0.8275 0.6268 1.0000 0.8292 1.00002 0.9762 0.8414 1.0000 0.9928 1.00003 0.6278 0.3683 0.8434 0.7526 0.31254 0.7119 0.0547 1.0000 1.0000 0.02845 1.0000 1.0000 1.0000 1.0000 1.00006 0.7051 0.2676 1.0000 1.0000 0.14847 0.9320 0.7580 1.0000 1.0000 0.87108 0.8772 0.1242 0.9928 0.8880 1.00009 0.7957 0.3902 1.0000 0.8138 1.0000
10 0.5697 0.0364 0.8061 0.9016 0.043611 0.8045 0.6694 0.8859 0.9202 0.497012 0.7497 0.1697 1.0000 1.0000 0.166613 1.0000 1.0000 1.0000 1.0000 1.000014 0.6816 0.0890 0.9522 0.9914 0.067015 0.6567 0.0840 0.9193 0.9759 0.078616 1.0000 1.0000 1.0000 1.0000 1.000017 0.8382 0.1657 1.0000 1.0000 0.379718 0.7161 0.3138 1.0000 0.9155 0.313919 0.4309 0.0714 0.7154 0.8197 0.087120 0.5843 0.1341 1.0000 0.6920 0.218921 0.5812 0.1771 0.7381 0.9543 0.328722 1.0000 1.0000 1.0000 1.0000 1.000023 0.5877 0.2199 0.7419 0.8629 0.3142
9354 C.T. Kuah et al. / Expert Systems with Applications 39 (2012) 9348–9358
E0K1 ¼
u1Y110 þ b1
2u2Y120 þ b1
9u9Y190
a11v1X1
10 þ a12v2X1
20 þ v3X130 þ a1
4v4X140 þ v5X1
50
E0K2 ¼
b23u3Y2
30 þ u4Y240 þ u5Y2
50
a21v1X2
10 þ a22v2X2
20 þ v6X260
E0K3 ¼
b33u3Y3
30 þ u6Y360 þ u7Y3
70
a31v1X3
10 þ a32v2X3
20 þ a34v4X3
40 þ v7X370
E0K4 ¼
b42u2Y4
20 þ u8Y480 þ b4
9u9Y490
a41v1X4
10 þ a42v2X4
20 þ v8X480
ð7Þ
Next, the Monte Carlo DEA model is explained as follows. Basedon equal budget allocation, the total budget, B, is set as 240. Hence,for all DMUs, 30 more data for each of the eight stochastic variablesare generated from their initial distribution using the randomnumber function. These data are used to update their initial distri-bution means. These means and the other deterministic data arethen substituted into Model (6) to get the overall KM efficiencyscores for all the DMUs. Next, the ur, vi, ap
i , and bpr obtained will
be substituted into Model (7) to calculate the KM process efficiencyscores. The entire process is executed 30 times to obtain themeans, standard deviations, and confidence intervals of the effi-ciency scores.
Finally, GA is implemented into the Monte Carlo DEA model. GAis used to find the optimum budget allocation for data collection.The total budget, B, is also set as 240. A feasible solution,b̂d ¼ ½b1; b2; . . . ; b8� represents the additional number of data to becollected for the eight variables (X3, X6, X7, Y1, Y4, Y5, Y7, Y8) respec-tively. Below are the parameters used to execute the GA modelmentioned earlier:
Population size: 50Maximum number of generations: 50Generation gap (GGAP): 0.9Mutation rate: 0.5Crossover rate: 0.7Crossover strategy: Double point crossingStopping criteria: Either the best solution does not improve for20 generations or the maximum number of generations hasbeen generated.
After the optimum budget allocation, b̂d, has been determined,the Monte Carlo DEA procedure is executed. For all DMUs, bd moredata for every specific stochastic variable are generated from theirinitial distribution. The additional data are used to update their ini-tial distribution means and then substituted into Model (6) to ob-tain the overall KM efficiency scores. Next, the ur, vi, ap
i , and bpr
obtained will be substituted into Model (7) to calculate the KMprocess efficiency scores. Again, the Monte Carlo DEA procedureis repeated for 30 times to obtain the means, standard deviations,and confidence intervals of the efficiency scores.
4.3. Data collection and analysis
To collect the data needed for the analysis, a questionnaire wasdeveloped and a survey was conducted within Malaysia. TheMalaysian Ministry of Higher Education’s online database was uti-lized as the sampling source. Data collection was done onlythrough mails.
Nineteen institutions responded in the first phase and four morein the second stage, making up a total of 23 DMUs. These 23 DMUsconsist of small, medium, and large public and private institutions.For each institution, the respondent is either the president, vicepresident, vice chancellor, director of research management center,director of information and communication technology center, or asenior administrator. These respondents are in a position to
comment on the KM initiatives of their institutions and have accessto the information needed.
For those deterministic variables, a single value was asked;while for those stochastic variables, the respondents were requiredto give a few initial values. These values were used to form the ini-tial means and distributions for the stochastic variables. The dataobtained from the questionnaire were processed and analyzedusing the three models explained earlier, which are:
1. The basic DEA model [Models (6) and (7)].2. Monte Carlo DEA model [Monte Carlo simulation + the basic
DEA model].3. GA + Monte Carlo DEA model.
4.4. Results
The efficiency scores were first obtained using Models (6) and(7). Table 2 summarizes the scores for all the DMUs. Next, usingequal budget allocation for data collection, 30 more data were gen-erated for every stochastic variable. Then, using the Monte CarloDEA model described in the previous sections, 30 sets of efficiencyscores were obtained for every DMU. The mean values of the scoresare shown in Table 3. Lastly, the data were analyzed using GA tofind the optimum budget allocation before executed with theMonte Carlo DEA model. The optimum budget allocations withthe minimum MSE values for each DMU are shown in Table 4.These allocations are to maximize the accuracy of the overall KMefficiency scores. Also shown in Table 4 are the MSE values fromequal budget allocation. The additional data required for each sto-chastic variable were generated and then processed with theMonte Carlo DEA model. Identical with the second method, this ap-proach also yielded 30 sets of scores for each DMU. The mean val-ues of the scores are shown in Table 5.
DMUs with EKM = 1 are efficient in the overall KM context, whilethose score less than 1 are considered inefficient. The same goes tothe scores of the KM processes. A DMU is efficient in a particularprocess if the score is 1, and inefficient if the score is less than 1.
There is no statistical information from the results generatedsolely from the basic DEA model because only a single run wasexecuted for each DMU. In contrary, for the other two stochasticmodels, some statistical information can be extracted from
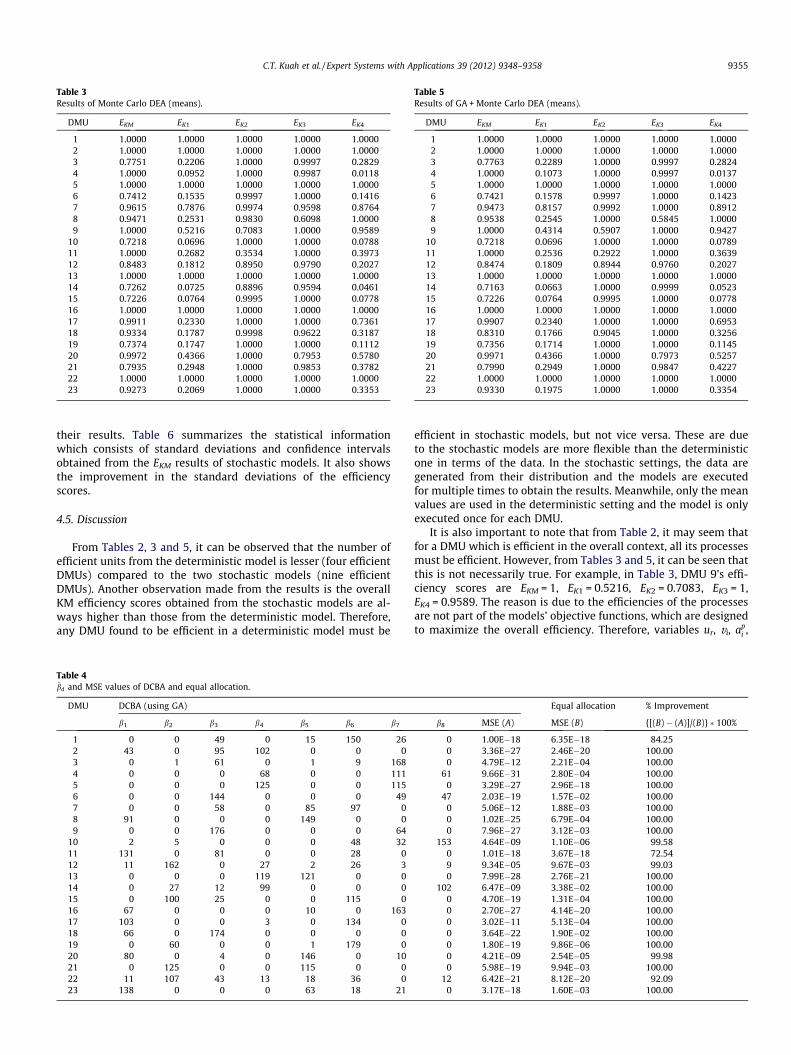
Table 3Results of Monte Carlo DEA (means).
DMU EKM EK1 EK2 EK3 EK4
1 1.0000 1.0000 1.0000 1.0000 1.00002 1.0000 1.0000 1.0000 1.0000 1.00003 0.7751 0.2206 1.0000 0.9997 0.28294 1.0000 0.0952 1.0000 0.9987 0.01185 1.0000 1.0000 1.0000 1.0000 1.00006 0.7412 0.1535 0.9997 1.0000 0.14167 0.9615 0.7876 0.9974 0.9598 0.87648 0.9471 0.2531 0.9830 0.6098 1.00009 1.0000 0.5216 0.7083 1.0000 0.9589
10 0.7218 0.0696 1.0000 1.0000 0.078811 1.0000 0.2682 0.3534 1.0000 0.397312 0.8483 0.1812 0.8950 0.9790 0.202713 1.0000 1.0000 1.0000 1.0000 1.000014 0.7262 0.0725 0.8896 0.9594 0.046115 0.7226 0.0764 0.9995 1.0000 0.077816 1.0000 1.0000 1.0000 1.0000 1.000017 0.9911 0.2330 1.0000 1.0000 0.736118 0.9334 0.1787 0.9998 0.9622 0.318719 0.7374 0.1747 1.0000 1.0000 0.111220 0.9972 0.4366 1.0000 0.7953 0.578021 0.7935 0.2948 1.0000 0.9853 0.378222 1.0000 1.0000 1.0000 1.0000 1.000023 0.9273 0.2069 1.0000 1.0000 0.3353
Table 5Results of GA + Monte Carlo DEA (means).
DMU EKM EK1 EK2 EK3 EK4
1 1.0000 1.0000 1.0000 1.0000 1.00002 1.0000 1.0000 1.0000 1.0000 1.00003 0.7763 0.2289 1.0000 0.9997 0.28244 1.0000 0.1073 1.0000 0.9997 0.01375 1.0000 1.0000 1.0000 1.0000 1.00006 0.7421 0.1578 0.9997 1.0000 0.14237 0.9473 0.8157 0.9992 1.0000 0.89128 0.9538 0.2545 1.0000 0.5845 1.00009 1.0000 0.4314 0.5907 1.0000 0.9427
10 0.7218 0.0696 1.0000 1.0000 0.078911 1.0000 0.2536 0.2922 1.0000 0.363912 0.8474 0.1809 0.8944 0.9760 0.202713 1.0000 1.0000 1.0000 1.0000 1.000014 0.7163 0.0663 1.0000 0.9999 0.052315 0.7226 0.0764 0.9995 1.0000 0.077816 1.0000 1.0000 1.0000 1.0000 1.000017 0.9907 0.2340 1.0000 1.0000 0.695318 0.8310 0.1766 0.9045 1.0000 0.325619 0.7356 0.1714 1.0000 1.0000 0.114520 0.9971 0.4366 1.0000 0.7973 0.525721 0.7990 0.2949 1.0000 0.9847 0.422722 1.0000 1.0000 1.0000 1.0000 1.000023 0.9330 0.1975 1.0000 1.0000 0.3354
C.T. Kuah et al. / Expert Systems with Applications 39 (2012) 9348–9358 9355
their results. Table 6 summarizes the statistical informationwhich consists of standard deviations and confidence intervalsobtained from the EKM results of stochastic models. It also showsthe improvement in the standard deviations of the efficiencyscores.
4.5. Discussion
From Tables 2, 3 and 5, it can be observed that the number ofefficient units from the deterministic model is lesser (four efficientDMUs) compared to the two stochastic models (nine efficientDMUs). Another observation made from the results is the overallKM efficiency scores obtained from the stochastic models are al-ways higher than those from the deterministic model. Therefore,any DMU found to be efficient in a deterministic model must be
Table 4b̂d and MSE values of DCBA and equal allocation.
DMU DCBA (using GA)
b1 b2 b3 b4 b5 b6 b7
1 0 0 49 0 15 150 262 43 0 95 102 0 0 03 0 1 61 0 1 9 1684 0 0 0 68 0 0 1115 0 0 0 125 0 0 1156 0 0 144 0 0 0 497 0 0 58 0 85 97 08 91 0 0 0 149 0 09 0 0 176 0 0 0 64
10 2 5 0 0 0 48 3211 131 0 81 0 0 28 012 11 162 0 27 2 26 313 0 0 0 119 121 0 014 0 27 12 99 0 0 015 0 100 25 0 0 115 016 67 0 0 0 10 0 16317 103 0 0 3 0 134 018 66 0 174 0 0 0 019 0 60 0 0 1 179 020 80 0 4 0 146 0 1021 0 125 0 0 115 0 022 11 107 43 13 18 36 023 138 0 0 0 63 18 21
efficient in stochastic models, but not vice versa. These are dueto the stochastic models are more flexible than the deterministicone in terms of the data. In the stochastic settings, the data aregenerated from their distribution and the models are executedfor multiple times to obtain the results. Meanwhile, only the meanvalues are used in the deterministic setting and the model is onlyexecuted once for each DMU.
It is also important to note that from Table 2, it may seem thatfor a DMU which is efficient in the overall context, all its processesmust be efficient. However, from Tables 3 and 5, it can be seen thatthis is not necessarily true. For example, in Table 3, DMU 9’s effi-ciency scores are EKM = 1, EK1 = 0.5216, EK2 = 0.7083, EK3 = 1,EK4 = 0.9589. The reason is due to the efficiencies of the processesare not part of the models’ objective functions, which are designedto maximize the overall efficiency. Therefore, variables ur, vi, ap
i ,
Equal allocation % Improvement
b8 MSE (A) MSE (B) {[(B) � (A)]/(B)} � 100%
0 1.00E�18 6.35E�18 84.250 3.36E�27 2.46E�20 100.000 4.79E�12 2.21E�04 100.00
61 9.66E�31 2.80E�04 100.000 3.29E�27 2.96E�18 100.00
47 2.03E�19 1.57E�02 100.000 5.06E�12 1.88E�03 100.000 1.02E�25 6.79E�04 100.000 7.96E�27 3.12E�03 100.00
153 4.64E�09 1.10E�06 99.580 1.01E�18 3.67E�18 72.549 9.34E�05 9.67E�03 99.030 7.99E�28 2.76E�21 100.00
102 6.47E�09 3.38E�02 100.000 4.70E�19 1.31E�04 100.000 2.70E�27 4.14E�20 100.000 3.02E�11 5.13E�04 100.000 3.64E�22 1.90E�02 100.000 1.80E�19 9.86E�06 100.000 4.21E�09 2.54E�05 99.980 5.98E�19 9.94E�03 100.00
12 6.42E�21 8.12E�20 92.090 3.17E�18 1.60E�03 100.00
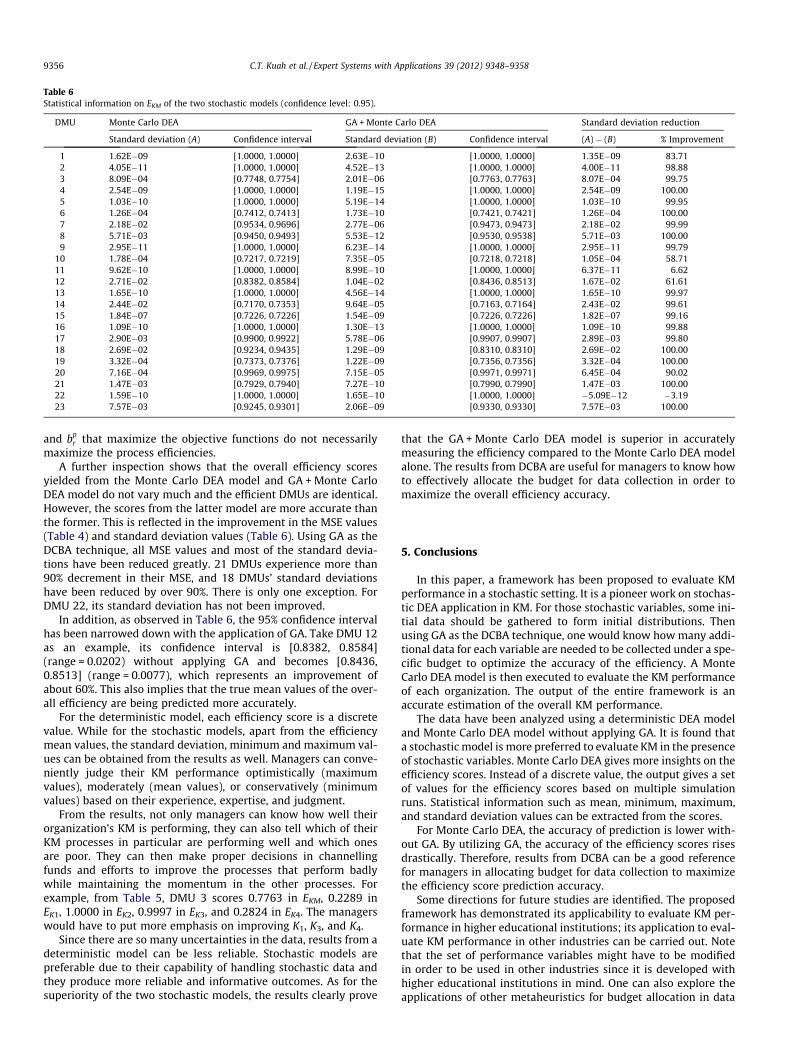
Table 6Statistical information on EKM of the two stochastic models (confidence level: 0.95).
DMU Monte Carlo DEA GA + Monte Carlo DEA Standard deviation reduction
Standard deviation (A) Confidence interval Standard deviation (B) Confidence interval (A) � (B) % Improvement
1 1.62E�09 [1.0000, 1.0000] 2.63E�10 [1.0000, 1.0000] 1.35E�09 83.712 4.05E�11 [1.0000, 1.0000] 4.52E�13 [1.0000, 1.0000] 4.00E�11 98.883 8.09E�04 [0.7748, 0.7754] 2.01E�06 [0.7763, 0.7763] 8.07E�04 99.754 2.54E�09 [1.0000, 1.0000] 1.19E�15 [1.0000, 1.0000] 2.54E�09 100.005 1.03E�10 [1.0000, 1.0000] 5.19E�14 [1.0000, 1.0000] 1.03E�10 99.956 1.26E�04 [0.7412, 0.7413] 1.73E�10 [0.7421, 0.7421] 1.26E�04 100.007 2.18E�02 [0.9534, 0.9696] 2.77E�06 [0.9473, 0.9473] 2.18E�02 99.998 5.71E�03 [0.9450, 0.9493] 5.53E�12 [0.9530, 0.9538] 5.71E�03 100.009 2.95E�11 [1.0000, 1.0000] 6.23E�14 [1.0000, 1.0000] 2.95E�11 99.79
10 1.78E�04 [0.7217, 0.7219] 7.35E�05 [0.7218, 0.7218] 1.05E�04 58.7111 9.62E�10 [1.0000, 1.0000] 8.99E�10 [1.0000, 1.0000] 6.37E�11 6.6212 2.71E�02 [0.8382, 0.8584] 1.04E�02 [0.8436, 0.8513] 1.67E�02 61.6113 1.65E�10 [1.0000, 1.0000] 4.56E�14 [1.0000, 1.0000] 1.65E�10 99.9714 2.44E�02 [0.7170, 0.7353] 9.64E�05 [0.7163, 0.7164] 2.43E�02 99.6115 1.84E�07 [0.7226, 0.7226] 1.54E�09 [0.7226, 0.7226] 1.82E�07 99.1616 1.09E�10 [1.0000, 1.0000] 1.30E�13 [1.0000, 1.0000] 1.09E�10 99.8817 2.90E�03 [0.9900, 0.9922] 5.78E�06 [0.9907, 0.9907] 2.89E�03 99.8018 2.69E�02 [0.9234, 0.9435] 1.29E�09 [0.8310, 0.8310] 2.69E�02 100.0019 3.32E�04 [0.7373, 0.7376] 1.22E�09 [0.7356, 0.7356] 3.32E�04 100.0020 7.16E�04 [0.9969, 0.9975] 7.15E�05 [0.9971, 0.9971] 6.45E�04 90.0221 1.47E�03 [0.7929, 0.7940] 7.27E�10 [0.7990, 0.7990] 1.47E�03 100.0022 1.59E�10 [1.0000, 1.0000] 1.65E�10 [1.0000, 1.0000] �5.09E�12 �3.1923 7.57E�03 [0.9245, 0.9301] 2.06E�09 [0.9330, 0.9330] 7.57E�03 100.00
9356 C.T. Kuah et al. / Expert Systems with Applications 39 (2012) 9348–9358
and bpr that maximize the objective functions do not necessarily
maximize the process efficiencies.A further inspection shows that the overall efficiency scores
yielded from the Monte Carlo DEA model and GA + Monte CarloDEA model do not vary much and the efficient DMUs are identical.However, the scores from the latter model are more accurate thanthe former. This is reflected in the improvement in the MSE values(Table 4) and standard deviation values (Table 6). Using GA as theDCBA technique, all MSE values and most of the standard devia-tions have been reduced greatly. 21 DMUs experience more than90% decrement in their MSE, and 18 DMUs’ standard deviationshave been reduced by over 90%. There is only one exception. ForDMU 22, its standard deviation has not been improved.
In addition, as observed in Table 6, the 95% confidence intervalhas been narrowed down with the application of GA. Take DMU 12as an example, its confidence interval is [0.8382, 0.8584](range = 0.0202) without applying GA and becomes [0.8436,0.8513] (range = 0.0077), which represents an improvement ofabout 60%. This also implies that the true mean values of the over-all efficiency are being predicted more accurately.
For the deterministic model, each efficiency score is a discretevalue. While for the stochastic models, apart from the efficiencymean values, the standard deviation, minimum and maximum val-ues can be obtained from the results as well. Managers can conve-niently judge their KM performance optimistically (maximumvalues), moderately (mean values), or conservatively (minimumvalues) based on their experience, expertise, and judgment.
From the results, not only managers can know how well theirorganization’s KM is performing, they can also tell which of theirKM processes in particular are performing well and which onesare poor. They can then make proper decisions in channellingfunds and efforts to improve the processes that perform badlywhile maintaining the momentum in the other processes. Forexample, from Table 5, DMU 3 scores 0.7763 in EKM, 0.2289 inEK1, 1.0000 in EK2, 0.9997 in EK3, and 0.2824 in EK4. The managerswould have to put more emphasis on improving K1, K3, and K4.
Since there are so many uncertainties in the data, results from adeterministic model can be less reliable. Stochastic models arepreferable due to their capability of handling stochastic data andthey produce more reliable and informative outcomes. As for thesuperiority of the two stochastic models, the results clearly prove
that the GA + Monte Carlo DEA model is superior in accuratelymeasuring the efficiency compared to the Monte Carlo DEA modelalone. The results from DCBA are useful for managers to know howto effectively allocate the budget for data collection in order tomaximize the overall efficiency accuracy.
5. Conclusions
In this paper, a framework has been proposed to evaluate KMperformance in a stochastic setting. It is a pioneer work on stochas-tic DEA application in KM. For those stochastic variables, some ini-tial data should be gathered to form initial distributions. Thenusing GA as the DCBA technique, one would know how many addi-tional data for each variable are needed to be collected under a spe-cific budget to optimize the accuracy of the efficiency. A MonteCarlo DEA model is then executed to evaluate the KM performanceof each organization. The output of the entire framework is anaccurate estimation of the overall KM performance.
The data have been analyzed using a deterministic DEA modeland Monte Carlo DEA model without applying GA. It is found thata stochastic model is more preferred to evaluate KM in the presenceof stochastic variables. Monte Carlo DEA gives more insights on theefficiency scores. Instead of a discrete value, the output gives a setof values for the efficiency scores based on multiple simulationruns. Statistical information such as mean, minimum, maximum,and standard deviation values can be extracted from the scores.
For Monte Carlo DEA, the accuracy of prediction is lower with-out GA. By utilizing GA, the accuracy of the efficiency scores risesdrastically. Therefore, results from DCBA can be a good referencefor managers in allocating budget for data collection to maximizethe efficiency score prediction accuracy.
Some directions for future studies are identified. The proposedframework has demonstrated its applicability to evaluate KM per-formance in higher educational institutions; its application to eval-uate KM performance in other industries can be carried out. Notethat the set of performance variables might have to be modifiedin order to be used in other industries since it is developed withhigher educational institutions in mind. One can also explore theapplications of other metaheuristics for budget allocation in data
C.T. Kuah et al. / Expert Systems with Applications 39 (2012) 9348–9358 9357
collection. Lastly, the performance measurement model proposedcan still be improved to reduce its computational complexity.
References
Agasisti, T., & Pérez-Esparrells, C. (2010). Comparing efficiency in a cross-countryperspective: The case of Italian and Spanish state universities. Higher Education,59(1), 85–103.
Ahmed, P. K., Lim, K. K., & Zairi, M. (1999). Measurement practice for knowledgemanagement. The Journal of Workplace Learning, 11(8), 304–311.
Ahn, J. H., & Chang, S. G. (2004). Assessing the contribution of knowledge tobusiness performance: The KP3 methodology. Decision Support Systems, 36(4),403–416.
Alavi, M., & Leidner, D. E. (2001). Review: Knowledge management and knowledgemanagement systems: Conceptual foundations and research issues. MISQuarterly, 25(1), 107–136.
Ardichvili, A., Maurer, M., Li, W., Wentling, T., & Stuedemann, R. (2005). Knowledgesharing through online communities of practice: The impact of culturalvariations. In Paper presented at the academy of HRD conference, Colorado (pp.685–692).
Atkinson, S., & Wilson, P. W. (1995). Comparing mean efficiency and productivityscores from small samples: A bootstrap methodology. Journal of ProductivityAnalysis, 6(2), 137–152.
Beneito, P. (2006). The innovative performance of in-house and contracted R&D interms of patents and utility models. Research Policy, 35(4), 502–517.
Bruni, M. E., Conforti, D., Beraldi, P., & Tundis, E. (2009). Probabilistically constrainedmodels for efficiency and dominance in DEA. International Journal of ProductionEconomics, 117(1), 219–228.
Caloghirou, Y., Kastelli, I., & Tsakanikas, A. (2004). Internal capabilities and externalknowledge sources: Complements or substitutes for innovative performance?Technovation, 24(1), 29–39.
Camanho, A. S., & Dyson, R. G. (2005). Cost efficiency measurement with priceuncertainty: A DEA application to bank branch assessments. European Journal ofOperational Research, 161(2), 432–446.
Chang, Y. (2003). Benefits of co-operation on innovative performance: Evidencefrom integrated circuits and biotechnology firms in the UK and Taiwan. R&DManagement, 33(4), 425–437.
Charnes, A., Cooper, W. W., & Rhodes, E. L. (1978). Measuring the efficiency ofdecision making units. European Journal of Operational Research, 2(6), 429–444.
Chen, L. C., Lu, W. M., & Yang, C. (2009). Does knowledge management matter?Assessing the performance of electricity distribution districts based on slacks-based data envelopment analysis. The Journal of the Operational Research Society,60(11), 1583–1593.
Chia, R. (2003). From knowledge-creation to the perfecting of action: Tao, Basho andpure experience as the ultimate ground of knowing. Human Relation, 56(8),953–981.
Chin, K. S., Lo, K. C., & Leung, J. P. F. (2010). Development of user-satisfaction-basedknowledge management performance measurement system with evidentialreasoning approach. Expert Systems with Applications, 37(1), 366–382.
Conley, C. A., & Wei, Z. (2009). Factors critical to knowledge management success.Advances in Developing Human Resources, 11(3), 334–348.
Costa, R. A., Meira, S. R. L., Jucá, P. M., & Ribeiro, R. A. (2010). Qualitative analysis of asocial knowledge management initiative in an innovation institution. In Paperpresented at the 14th international conference on computer supported cooperativework in design, Shanghai (pp. 251–256).
Dalkir, K. (2005). Knowledge management in theory and practice. Oxford: Elsevier.Dalkir, K., Wiseman, E., Shulha, M., & McIntyre, S. (2007). An intellectual capital
evaluation approach in a government organization. Management Decision, 45(9),1497–1509.
Davenport, T. H., & Prusak, L. (2000). Working knowledge: How organizations managewhat they know. Massachusetts: Harvard Business School Press.
Davila, T., Epstein, M. J., & Shelton, R. (2006). Making innovation work: How tomanage it, measure it, and profit from it. New Jersey: Pearson Education.
Deetz, M., Poddig, T., Sidorovitch, I., & Varmaz, A. (2009). An evaluation ofconditional multi-factor models in active asset allocation strategies: Anempirical study for the German stock market. Financial Markets and PortfolioManagement, 23(3), 285–313.
Despotis, D. K., & Smirlis, Y. G. (2002). Data envelopment analysis with imprecisedata. European Journal of Operational Research, 140(1), 24–36.
Edvinsson, L. (1997). Developing intellectual capital at Skandia. Journal of LongRange Planning, 30(3), 366–373.
Geisler, E. (2007). The metrics of knowledge: Mechanisms for preserving the valueof managerial knowledge. Business Horizons, 50(6), 467–477.
Gentle, J. E. (2003). Random number generation and Monte Carlo methods (2nd ed.).New York: Springer-Verlag.
Goldoni, V., & Oliveira, M. (2010). Knowledge management metrics in softwaredevelopment companies in Brazil. Journal of Knowledge Management, 14(2),301–313.
Govender, S. S., & Pottas, D. (2007). A model to assess the benefit value ofknowledge management in an IT service provider environment. In Paperpresented at the annual research conference of the South African institute ofcomputer scientists and information technologists on IT research in developingcountries, Sunshine Coast (pp. 36–45).
Harlow, H. (2008). The effect of tacit knowledge on firm performance. Journal ofKnowledge Management, 12(1), 148–163.
Ho, C. T. (2009). The relationship between knowledge management enablers andperformance. Industrial Management and Data Systems, 109(1), 98–117.
Holland, J. H. (1975). Adaptation in natural and artificial systems: An introductoryanalysis with application to biology, control and artificial intelligence. Michigan:University of Michigan Press.
Holtshouse, D. (2010). Knowledge work 2020: Thinking ahead about knowledgework. On the Horizon, 18(3), 193–203.
Huang, Z., & Li, S. X. (1996). Dominance stochastic models in data envelopmentanalysis. European Journal of Operational Research, 95(2), 390–403.
Jafari, M., Rezaeenour, J., Akhavan, P., & Fesharaki, M. N. (2010). Strategic knowledgemanagement in aerospace industries: A case study. Aircraft Engineering andAerospace Technology, 82(1), 60–74.
Jiang, X., & Li, Y. (2009). An empirical investigation of knowledge management andinnovative performance: The case of alliances. Research Policy, 38(2), 358–368.
Jing, T., Yoshiteru, N., & Andrzej, P. W. (2009). Knowledge management andknowledge creation in academia: A study based on surveys in a Japaneseresearch university. Journal of Knowledge Management, 13(2), 76–92.
Joia, L. A. (2000). Measuring intangible corporate assets: Linking business strategywith intellectual capital. Journal of Intellectual Capital, 1(1), 68–84.
Josune, S., Nekane, A., & Olga, R. (2009). Knowledge sharing and innovationperformance: A comparison between high-tech and low-tech companies.Journal of Intellectual Capital, 10(1), 22–36.
Kankanhalli, A., & Tan, B. C. Y. (2004). A review of metrics for knowledgemanagement systems and knowledge management initiatives. In Paperpresented at the Hawaii international conference on system sciences, Hawaii (pp.3717–3724).
Kao, C., & Liu, S. T. (2000). Fuzzy efficiency measures in data envelopment analysis.Fuzzy Sets and Systems, 113(3), 427–437.
Kluge, J., Stein, W., & Licht, T. (2001). Knowledge unplugged: The Mckinsey andcompany global survey on knowledge management. New York: Palgrave.
Lee, K. C., Lee, S., & Kang, I. W. (2005). KMPI: Measuring knowledge managementperformance. Information and Management, 42(3), 469–482.
Lee, L. L. (2000). Knowledge sharing metrics for large organizations. In D. Morey, M.Maybury, & B. Thuraisingham (Eds.), Knowledge management: Classic andcontemporary works. Cambridge: MIT Press.
Lertworasirikul, S., Fang, S. C., Joines, J. A., & Nuttle, H. L. W. (2003). Fuzzy dataenvelopment analysis (DEA): A possibility approach. Fuzzy Sets and Systems,139(2), 379–394.
Li, Y. H., Huang, J. W., & Tsai, M. T. (2009). Entrepreneurial orientation and firmperformance: The role of knowledge creation process. Industrial MarketingManagement, 38(4), 440–449.
Liao, S. M., & Xu, S. H. (2006). The road map to KM evaluation in organization: Aholistic framework. In Paper presented at the international conference onmanagement science and engineering, Lille (pp. 1393–1398).
Liebowitz, J., & Suen, C. (2000). Developing knowledge management metrics formeasuring intellectual capital. Journal of Intellectual Capital, 1(1), 54–67.
McEvily, S. K., & Chakravarthy, B. (2002). The persistence of knowledge-basedadvantage: An empirical test for product performance and knowledge. StrategicManagement Journal, 23(4), 285–305.
Minonne, C., & Turner, G. (2009). Evaluating knowledge management performance.Electronic Journal of Knowledge Management, 7(5), 583–592.
Nathan, G. S., & Soni, P. (2008). Knowledge management across permeable silos: Acase at Wipro Technologies. In Paper presented at the 4th IEEE internationalconference on management of innovation and technology, Bangkok (pp. 965–969).
Nonaka, I., Toyama, R., & Konno, N. (2000). SECI, Ba and leadership: A unified modelof dynamic knowledge creation. Journal of Long Range Planning, 33(1), 5–34.
Olesen, O. B. (2006). Comparing and combining two approaches for chanceconstrained DEA. Journal of Productivity Analysis, 26(2), 103–119.
Riege, A. (2005). Three-dozen knowledge sharing barriers managers must consider.Journal of Knowledge Management, 9(3), 18–35.
Robinson, H. S., Carrillo, P. M., Anumba, C. J., & Al-Ghassani, A. M. (2005).Performance measurement in knowledge management. In C. J. Anumba, C. O.Egbu, & P. M. Carrillo (Eds.), Knowledge management in construction (pp. 10–30).Oxford: Blackwell Publishing Ltd.
Ross, J., Ross, G., Dragonetti, N., & Edvinsson, L. (1998). Intellectual capital: Navigatingin the new business landscape. New York: New York University Press.
Sengupta, J. K. (1987). Data envelopment analysis for efficiency measurement in thestochastic case. Computers and Operations Research, 14(2), 117–129.
Sengupta, J. K. (1992). A fuzzy systems approach in data envelopment analysis.Computers and Mathematics with Applications, 24(8–9), 259–266.
Simar, L., & Zelenyuk, V. (2010). Stochastic FDH/DEA estimators for frontier analysis.Journal of Productivity Analysis, 36(1), 1–20.
Smits, M., & Moor, A. D. (2004). Measuring knowledge management effectiveness incommunities of practice. In Paper presented at the 37th Hawaii internationalconference on system sciences, Hawaii (pp. 1–9).
Talluri, S. (2000). Data envelopment analysis: Models and extensions. Decision Line(May, 2000), 8–11.
Thomson, C. S., El-Haram, M. A., & Hardcastle, C. (2009). Managing knowledge ofurban sustainability assessment. Proceedings of the Institution of Civil Engineers,Engineering Sustainability, 162(1), 35–43.
Van Buren, M. E. (1999). A yardstick for knowledge management. Training andDevelopment, 53(5), 71–78.
9358 C.T. Kuah et al. / Expert Systems with Applications 39 (2012) 9348–9358
Von Krough, G., Roos, J., & Kleine, D. (1999). Knowing in firms: Understanding,managing, and measuring knowledge. Walnut Creek: Altamira Press.
Wang, J., & Guan, J. (2005). The analysis and evaluation of knowledge efficiency inresearch groups. Journal of the American Society for Information Science andTechnology, 56(11), 1217–1226.
Wang, S., Ran, G., Wang, L., & Shi, B. (2009). An evaluation on performance of ruraleco-environment public expenditure of Chinese local governments: Theoreticaland empirical analysis. Frontiers of Earth Science in China, 3(4), 431–436.
Wang, Y. R., & Xu, Q. L. (2010). Research on impact of knowledge managementcapability to technology innovation performance. In Paper presented at the 17thinternational conference on industrial engineering and engineering management,Xiamen (pp. 1704–1708).
Wen, Y. F. (2009). An effectiveness measurement model for knowledgemanagement. Knowledge-Based Systems, 22(5), 363–367.
Wiig, K. (2004). People-focused knowledge management. Oxford: Elsevier.Wong, K. Y. (2005). Critical success factors for implementing knowledge
management in small and medium enterprises. Industrial Management andData Systems, 105(3), 261–279.
Wong, K. Y., & Aspinwall, E. (2005). An empirical study of the important factors forknowledge management adoption in the SME sector. Journal of KnowledgeManagement, 9(3), 64–82.
Wong, W. P. (2009). Performance evaluation of supply chain in stochasticenvironment: Using a simulation based DEA framework. International Journalof Business Performance and Supply Chain Modelling, 1(2–3), 203–228.
Wong, W. P., & Wong, K. Y. (2007). Supply chain performance measurementsystem using DEA modeling. Industrial Management and Data Systems, 107(3),361–381.
Wong, W. P., Jaruphongsa, W., & Lee, L. H. (2011). Budget allocation for effectivedata collection in predicting an accurate DEA efficiency score. IEEE Transactionson Automatic Control, 56(6), 1235–1246.
Wu, W. Y., Tsai, H. J., Cheng, K. Y., & Lai, M. (2006). Assessment of intellectual capitalmanagement in Taiwanese IC design companies: Using DEA and the Malmquistproductivity index. R&D Management, 36(5), 531–545.
Yalama, A., & Coskun, M. (2007). Intellectual capital performance of quoted bankson the Istanbul stock exchange market. Journal of Intellectual Capital, 8(2),256–271.
Yu, M. M., & Chen, P. C. (2009). Measuring air routes performance using a fractionalnetwork data envelopment analysis model. Central European Journal ofOperations Research, 19(1), 81–98.