montana public employee retirement administration
TRANSCRIPT

Montana Public Employee Retirement Administration
Experience Study
For the Six-year Period
Ending June 30, 2016
TABLE OF CONTENTS Section Page
I Summary of Results 1 II Economic Assumptions 6 III Demographic Assumptions 25 Rates of Mortality 26 Rates of Service Retirement 33 Rates of Disability Retirement 47 Rates of Withdrawal 55 Rates of Salary Increase 63 Miscellaneous Assumptions 71 IV Actuarial Methods 72
Appendix
A Historical June CPI (U) Index 74 B Social Security Administration Wage Index 75 C Summary of Recommended Actuarial Assumptions 76
May 5, 2017 Board of Trustees Montana Public Employee Retirement Administration Dear Members of the Board: We are pleased to submit the results of a study of the economic and demographic experience for the Montana Public Employee Retirement Administration. The purpose of this investigation is to assess the reasonability of the actuarial assumptions for each system. This investigation covers the six-year period ending June 30, 2016. The purpose of the study is to review the most recent experience in order to make judgments about future experience. Typically, the most recent five-year period is sufficient for this purpose. This experience study utilized the previous six years. As a result of the investigation, it is recommended that revised assumptions be adopted by the Board for future use. The experience studies for each system include all active members, retired members and beneficiaries of deceased members. The mortality experience was studied separately for pre-retirement, post-retirement and disability and also separately for males and females. Incidences of withdrawal, disability, retirement and compensation increases were investigated without regard to gender. This report shows comparisons between the actual and expected cases of separation from active service, actual and expected number of deaths, and actual and expected salary increases. Tables and graphs are used to show the actual decrement rates, the expected decrement rates and, where applicable, the proposed decrement rates. The newly proposed rates of decrement for all eight systems are shown in Appendix C of this report. In the actuary’s judgment, the recommended rates are suitable for use until further experience indicates that modifications are needed. Actuarial Assumptions are used to measure and budget future costs. Changing assumptions will not change the actual cost of future benefits.
Off
Cavanaugh Macdonald CC OO NN SS UU LL TT II NN GG,, LL LL CC
The experience and dedication you deserve
3550 Busbee Pkwy, Suite 250, Kennesaw, GA 30144 Phone (678) 388-1700 • Fax (678) 388-1730
www.CavMacConsulting.com Offices in Englewood, CO • Kennesaw, GA • Bellevue, NE
Board of Trustees May 5, 2017 Page 2
The experience study was performed by, and under the supervision of, independent actuaries who are Members of the American Academy of Actuaries with experience in performing valuations for public retirement systems. The undersigned meets the Qualification Standards of the American Academy of Actuaries to render the actuarial opinion contained herein.
Respectfully submitted,
Todd B. Green ASA, FCA, MAAA Joseph A. Nichols, ASA, EA, FCA, MAAA, MSPA Principal and Consulting Actuary Consulting Actuary
JMY\tbg:jan S:\2016\Montana PERA\Experience Study\MPERA Experience Study Report ending 2016 Draft.docx
Section I: Summary of Results
Cavanaugh Macdonald Consulting, LLC Page 1
SUMMARY OF RESULTS
Introduction This investigation covers the six-year period ending June 30, 2016.The purpose of an actuarial valuation is to provide a timely best estimate of the ultimate costs of a retirement system. Actuarial valuations of the Montana Public Employees Retirement Administration (MPERA) eight plans are prepared annually to determine the actuarial recommended contribution, funded status, and amortization periods necessary to achieve a 100% funded status. The valuations require the use of certain assumptions with respect to the occurrence of future events, such as rates of death, termination of employment, retirement age, and salary changes to estimate the obligations of the system. The basic purpose of an experience study is to determine whether the actuarial assumptions currently in use have adequately anticipated the actual emerging experience. This information, along with the professional judgment of system personnel and advisors, is used to evaluate the appropriateness of continued use of the current actuarial assumptions. When analyzing experience and assumptions, it is important to recognize that actual experience is reported in the short term while assumptions are intended to be long-term estimates of experience. Therefore, actual experience is expected to vary from study period to study period, without necessarily indicating a change in assumptions is needed. At the request of MPERA, Cavanaugh Macdonald Consulting, LLC (CMC), performed a study of the experience for the six-year period ending in 2016. This report presents the results, analysis, and resulting recommendations of our study. It is anticipated that the changes, if approved, will first be reflected in the July 1, 2017 actuarial valuations. These assumptions have been developed in accordance with generally recognized and accepted actuarial principles and practices that are consistent with the applicable Actuarial Standards of Practice adopted by the Actuarial Standards Board (ASB). While the recommended assumptions represent our best estimate of future experience, there are other reasonable assumption sets that could be supported by the results of this experience study. Those other sets of reasonable assumptions could produce liabilities and costs that are either higher or lower. Our Philosophy Similar to an actuarial valuation, the calculation of actual and expected experience is a fairly mechanical process, and differences between actuaries in this area are generally minor. However, the setting of assumptions differs, as it is more art than science. In this report, we have
Section I: Summary of Results
Cavanaugh Macdonald Consulting, LLC Page 2
recommended changes to certain assumptions. To explain our thought process, we offer a brief summary of our philosophy: • Don’t Overreact: When we see significant changes in experience, we generally do not
adjust our rates to reflect the entire difference. We will typically recommend rates somewhere between the old rates and the new experience. If the experience during the next study period shows the same result, we will probably recognize the trend at that point in time or at least move further in the direction of the observed experience. On the other hand, if experience returns closer to its prior level, we will not have overreacted, possibly causing volatility in the actuarial contribution rates.
• Anticipate Trends: If there is an identified trend that is expected to continue, we believe
that this should be recognized. An example is the retiree mortality assumption. It is an established trend that people are living longer. Therefore, we believe the best estimate of liabilities in the valuation should reflect the expected increase in life expectancy.
• Simplify: In general, we attempt to identify which factors are significant and eliminate or
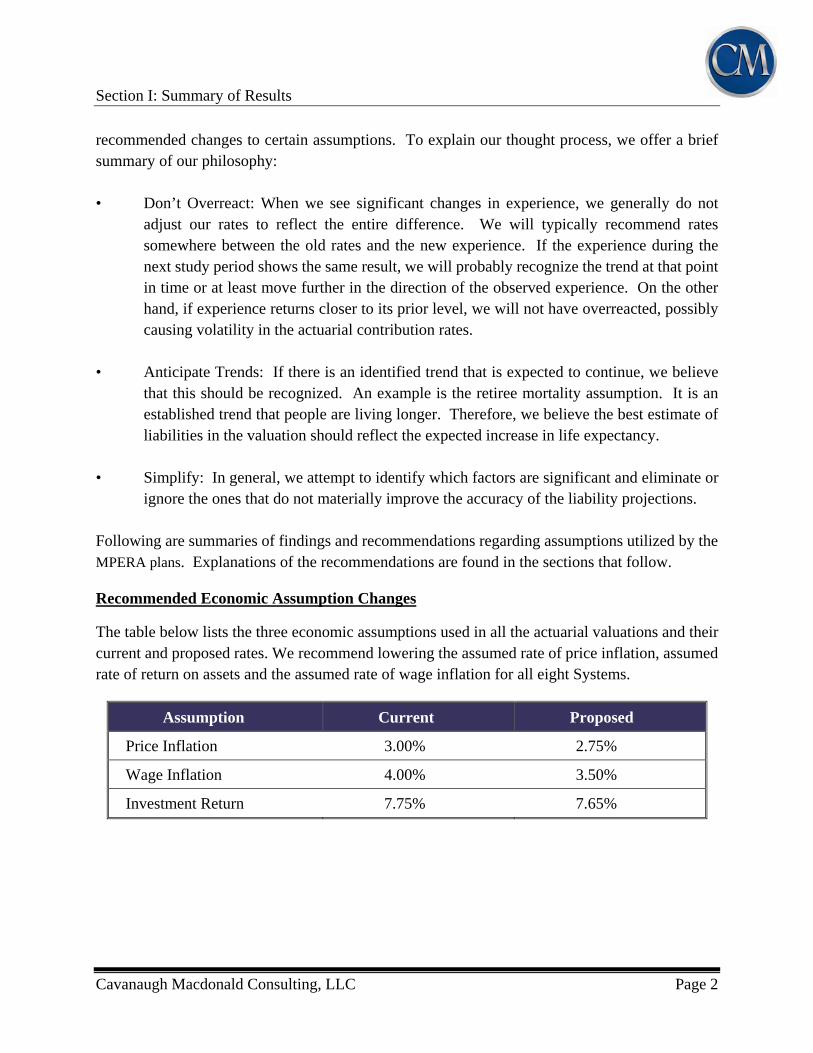
ignore the ones that do not materially improve the accuracy of the liability projections. Following are summaries of findings and recommendations regarding assumptions utilized by the MPERA plans. Explanations of the recommendations are found in the sections that follow. Recommended Economic Assumption Changes The table below lists the three economic assumptions used in all the actuarial valuations and their current and proposed rates. We recommend lowering the assumed rate of price inflation, assumed rate of return on assets and the assumed rate of wage inflation for all eight Systems.
Assumption Current Proposed
Price Inflation 3.00% 2.75%
Wage Inflation 4.00% 3.50%
Investment Return 7.75% 7.65%

Section I: Summary of Results
Cavanaugh Macdonald Consulting, LLC Page 3
Recommended Demographic Assumption Changes The table below lists the recommended demographic assumption changes based on experience during the last six years.
Retirement Plan Assumption Changes
Public Employees’ Retirement System Non-Disabled Mortality, Withdrawal, Merit Scale
Public Employees’ Retirement System Long-Term Disability Plan
Non-Disabled Mortality, Withdrawal, Merit Scale
Judges’ Retirement System Non-Disabled Mortality
Sheriffs’ Retirement System Non-Disabled Mortality, Withdrawal, Merit Scale
Game Wardens’ and Peace Officers’ Retirement System
Non-Disabled Mortality, Withdrawal, Merit Scale
Highway Patrol Officers’ Retirement System Non-Disabled Mortality, Merit Scale
Municipal Police Officers’ Retirement System Non-Disabled Mortality, Withdrawal, Merit Scale
Firefighters’ United Retirement System Non-Disabled Mortality, Withdrawal, Merit Scale
Volunteer Firefighters’ Compensation Act Non-Disabled Mortality, Withdrawal
Section I: Summary of Results
Cavanaugh Macdonald Consulting, LLC Page 4
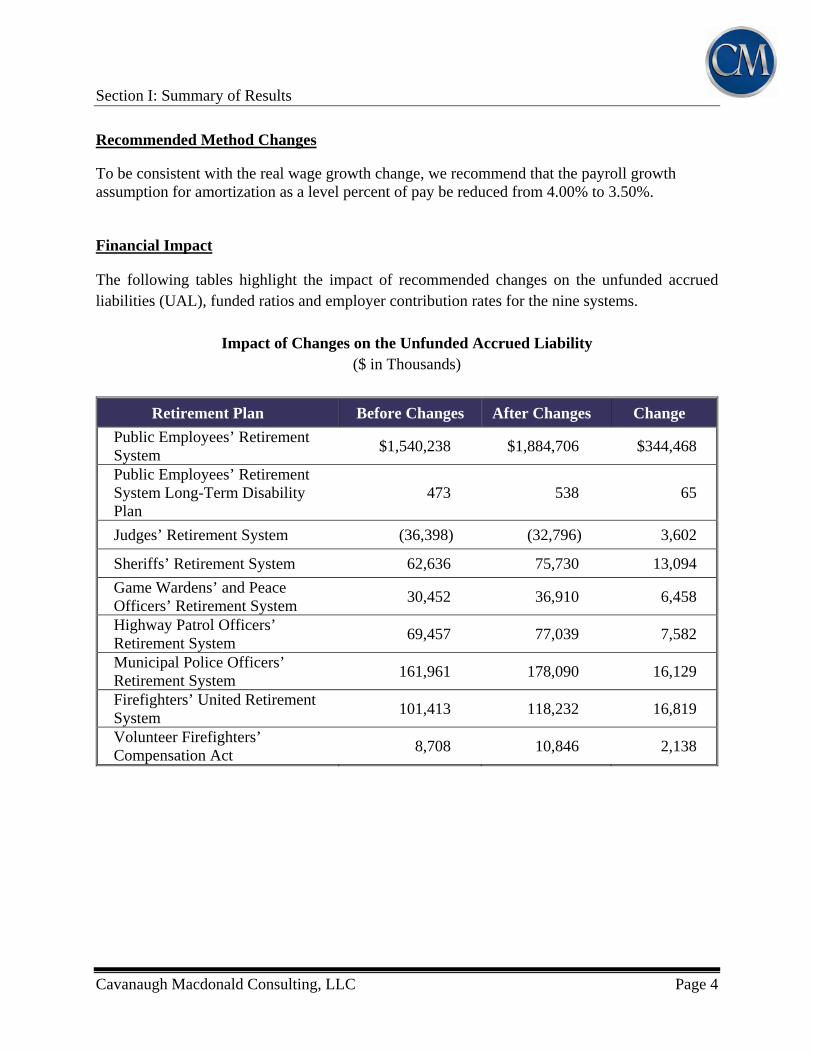
Recommended Method Changes To be consistent with the real wage growth change, we recommend that the payroll growth assumption for amortization as a level percent of pay be reduced from 4.00% to 3.50%.
Financial Impact
The following tables highlight the impact of recommended changes on the unfunded accrued liabilities (UAL), funded ratios and employer contribution rates for the nine systems.
Impact of Changes on the Unfunded Accrued Liability ($ in Thousands)
Retirement Plan Before Changes After Changes Change
Public Employees’ Retirement System
$1,540,238 $1,884,706 $344,468
Public Employees’ Retirement System Long-Term Disability Plan
473 538 65
Judges’ Retirement System (36,398) (32,796) 3,602
Sheriffs’ Retirement System 62,636 75,730 13,094
Game Wardens’ and Peace Officers’ Retirement System
30,452 36,910 6,458
Highway Patrol Officers’ Retirement System
69,457 77,039 7,582
Municipal Police Officers’ Retirement System
161,961 178,090 16,129
Firefighters’ United Retirement System
101,413 118,232 16,819
Volunteer Firefighters’ Compensation Act
8,708 10,846 2,138
Section I: Summary of Results
Cavanaugh Macdonald Consulting, LLC Page 5
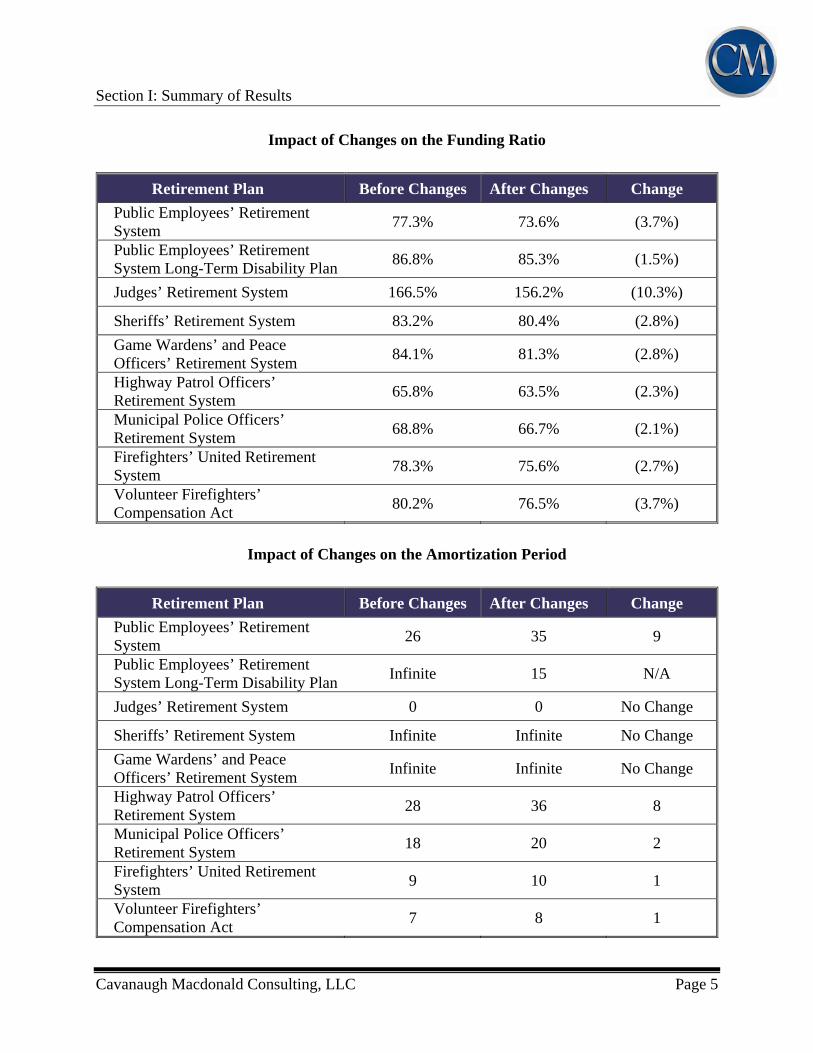
Impact of Changes on the Funding Ratio
Retirement Plan Before Changes After Changes Change
Public Employees’ Retirement System
77.3% 73.6% (3.7%)
Public Employees’ Retirement System Long-Term Disability Plan
86.8% 85.3% (1.5%)
Judges’ Retirement System 166.5% 156.2% (10.3%)
Sheriffs’ Retirement System 83.2% 80.4% (2.8%)
Game Wardens’ and Peace Officers’ Retirement System
84.1% 81.3% (2.8%)
Highway Patrol Officers’ Retirement System
65.8% 63.5% (2.3%)
Municipal Police Officers’ Retirement System
68.8% 66.7% (2.1%)
Firefighters’ United Retirement System
78.3% 75.6% (2.7%)
Volunteer Firefighters’ Compensation Act
80.2% 76.5% (3.7%)
Impact of Changes on the Amortization Period
Retirement Plan Before Changes After Changes Change
Public Employees’ Retirement System
26 35 9
Public Employees’ Retirement System Long-Term Disability Plan
Infinite 15 N/A
Judges’ Retirement System 0 0 No Change
Sheriffs’ Retirement System Infinite Infinite No Change
Game Wardens’ and Peace Officers’ Retirement System
Infinite Infinite No Change
Highway Patrol Officers’ Retirement System
28 36 8
Municipal Police Officers’ Retirement System
18 20 2
Firefighters’ United Retirement System
9 10 1
Volunteer Firefighters’ Compensation Act
7 8 1
Section II: Economic Assumptions
Cavanaugh Macdonald Consulting, LLC Page 6
ECONOMIC ASSUMPTIONS
Economic assumptions include: the long-term investment return (net of investment expenses), price inflation, wage inflation (the across-the-board portion of salary increases), and
The salary increase assumption is made up of both wage inflation and a merit salary scale. The merit salary scale is actually a demographic assumption and will be discussed with the demographic assumptions. Unlike demographic assumptions, economic assumptions do not lend themselves to analysis based heavily upon internal historical patterns. Because both general wage increases and investment return are influenced more by external forces which are difficult to accurately predict over the long term. The investment return and general wage increase assumptions are generally selected on the basis of expectations in an inflation-free environment and then increased by the long-term expectation for price inflation. Sources of data considered in the analysis and selection of the economic assumptions included:
Historical observations of price and wage inflation statistics and investment returns The 2016 Social Security Trustees Report Future expectations of the Board of Investments consultants U. S. Department of the Treasury bond rates Assumptions used by other large public retirement systems, based on the Public Fund
Survey, published by the National Association of State Retirement Administrators. Guidance regarding the selection of economic assumptions for measuring pension obligations is provided by Actuarial Standard of Practice (ASOP) No. 27, Selection of Economic Assumptions for Measuring Pension Obligations. Because no one knows what the future holds, the actuary must use professional judgment to estimate possible future economic outcomes. These estimates are based on a mixture of past experience, future expectations, and professional judgment. ACTUARIAL STANDARD OF PRACTICE NUMBER 27
Actuarial Standards of Practice are issued by the Actuarial Standards Board to provide guidance to actuaries with respect to certain aspects of performing actuarial work. As mentioned earlier, Actuarial Standard of Practice Number 27 (ASOP 27) is the standard that addresses the selection of economic assumptions for measuring pension obligations. Therefore, our analysis of the expected rate of return, as well as other economic assumptions, was performed following the guidance in ASOP 27.
ASOP 27 applies to the selection of economic assumptions to measure obligations under any defined benefit pension plan that is not a social insurance program (e.g., Social Security).
The standard recommends the actuary review appropriate recent and long-term historical economic data, but advises the actuary not to give undue weight to recent experience. Furthermore, it advises the actuary to consider that some historical economic data may not be appropriate for use in
Section II: Economic Assumptions
Cavanaugh Macdonald Consulting, LLC Page 7
developing assumptions for future periods due to changes in the underlying environment. Each economic assumption should individually satisfy this standard. In addition, with respect to any particular valuation, each economic assumption should be consistent with all other economic assumptions over the measurement period.
ASOP 27 recognizes that economic data and analyses are available from a variety of sources, including representatives of the plan sponsor, investment advisors, economists, and other professionals. The actuary is permitted to incorporate the views of experts, but the selection or advice must reflect the actuary’s professional judgment.
Since the last experience study was performed, the Actuarial Standards Board has issued a revised ASOP 27. The prior standard included the use of a “best estimate range” in developing economic assumptions, but this approach is no longer acceptable. The current standard calls for the actuary to select a “reasonable” assumption. For this purpose, an assumption is reasonable if it has the following characteristics:
a. it is appropriate for the purpose of the measurement;
b. it reflects the actuary’s professional judgment;
c. it takes into account historical and current economic data that is relevant as of the measurement date;
d. it reflects the actuary’s estimate of future experience, the actuary’s observation of the estimates inherent in market data, or a combination thereof; and
e. it has no significant bias (i.e., it is neither significantly optimistic nor pessimistic), except when provisions for adverse deviation or plan provisions that are difficult to measure are included.
The standard goes on to discuss a “range of reasonable assumptions” which in part states “the actuary should also recognize that different actuaries will apply different professional judgment and may choose different reasonable assumptions. As a result, a range of reasonable assumptions may develop both for an individual actuary and across actuarial practice.”
The remaining section of this report will address the relevant types of economic assumptions used in the actuarial valuation to determine the obligations of MPERA. In our opinion, the economic assumptions proposed in this report have been developed in accordance with ASOP No. 27.
Section II: Economic Assumptions
Cavanaugh Macdonald Consulting, LLC Page 8
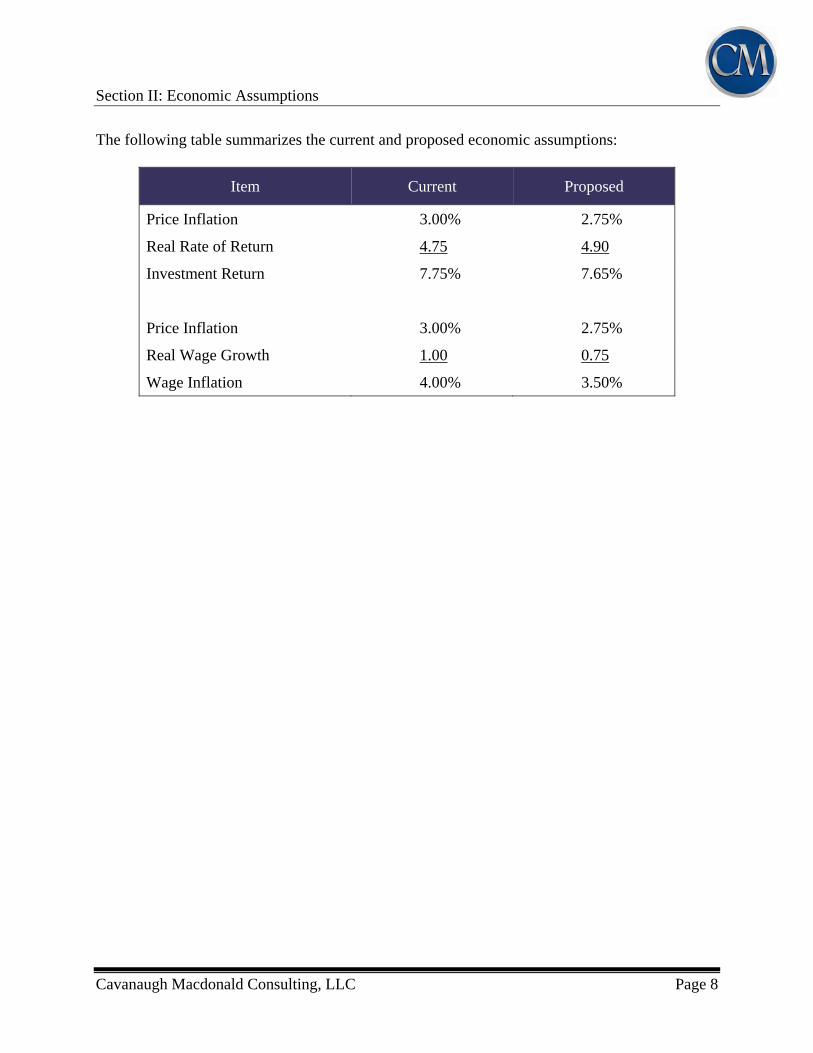
The following table summarizes the current and proposed economic assumptions:
Item Current Proposed
Price Inflation 3.00% 2.75%
Real Rate of Return 4.75 4.90
Investment Return 7.75% 7.65%
Price Inflation 3.00% 2.75%
Real Wage Growth 1.00 0.75
Wage Inflation 4.00% 3.50%
Section II: Economic Assumptions
Cavanaugh Macdonald Consulting, LLC Page 9
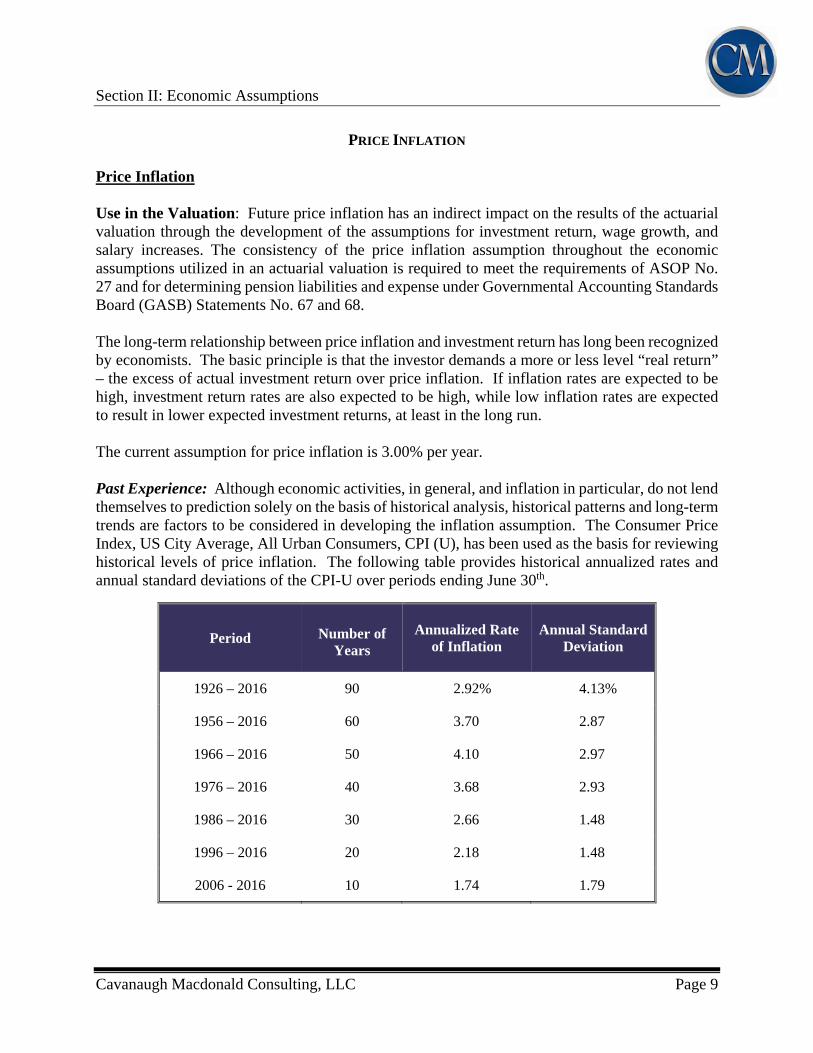
PRICE INFLATION Price Inflation Use in the Valuation: Future price inflation has an indirect impact on the results of the actuarial valuation through the development of the assumptions for investment return, wage growth, and salary increases. The consistency of the price inflation assumption throughout the economic assumptions utilized in an actuarial valuation is required to meet the requirements of ASOP No. 27 and for determining pension liabilities and expense under Governmental Accounting Standards Board (GASB) Statements No. 67 and 68. The long-term relationship between price inflation and investment return has long been recognized by economists. The basic principle is that the investor demands a more or less level “real return” – the excess of actual investment return over price inflation. If inflation rates are expected to be high, investment return rates are also expected to be high, while low inflation rates are expected to result in lower expected investment returns, at least in the long run. The current assumption for price inflation is 3.00% per year. Past Experience: Although economic activities, in general, and inflation in particular, do not lend themselves to prediction solely on the basis of historical analysis, historical patterns and long-term trends are factors to be considered in developing the inflation assumption. The Consumer Price Index, US City Average, All Urban Consumers, CPI (U), has been used as the basis for reviewing historical levels of price inflation. The following table provides historical annualized rates and annual standard deviations of the CPI-U over periods ending June 30th.
Period Number of Years
Annualized Rate of Inflation
Annual Standard Deviation
1926 – 2016 90 2.92% 4.13%
1956 – 2016 60 3.70 2.87
1966 – 2016 50 4.10 2.97
1976 – 2016 40 3.68 2.93
1986 – 2016 30 2.66 1.48
1996 – 2016 20 2.18 1.48
2006 - 2016 10 1.74 1.79
Section II: Economic Assumptions
Cavanaugh Macdonald Consulting, LLC Page 10
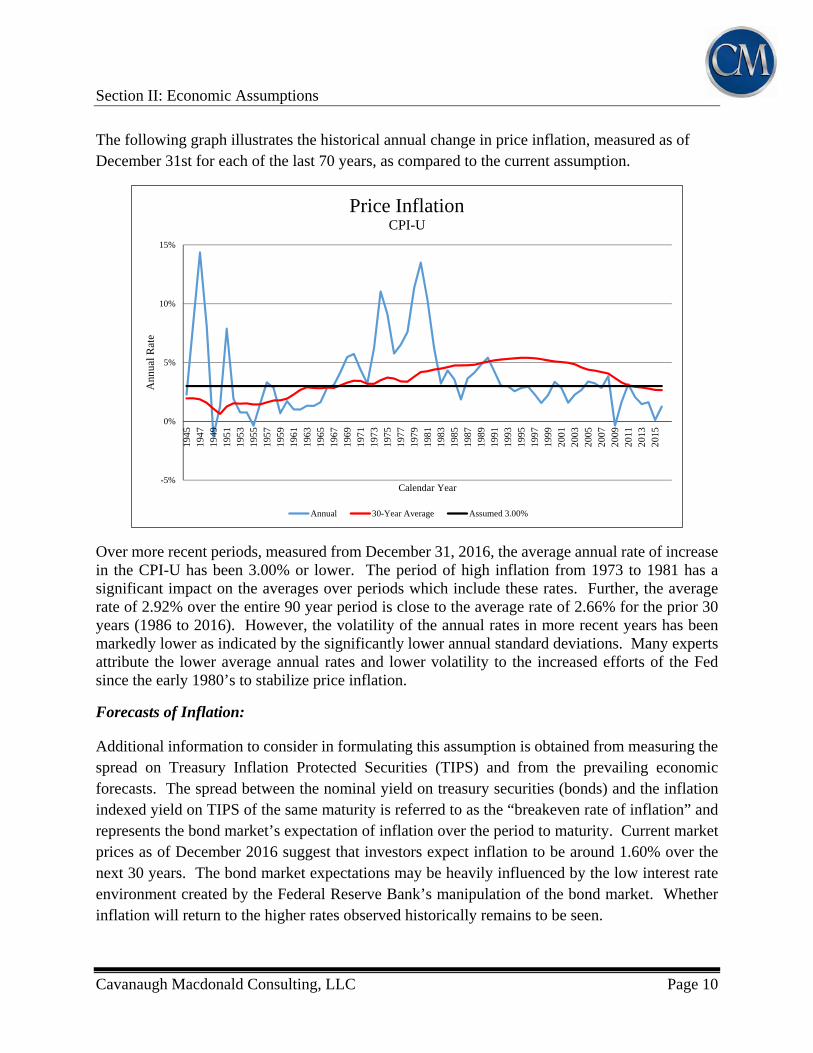
The following graph illustrates the historical annual change in price inflation, measured as of December 31st for each of the last 70 years, as compared to the current assumption.
Over more recent periods, measured from December 31, 2016, the average annual rate of increase in the CPI-U has been 3.00% or lower. The period of high inflation from 1973 to 1981 has a significant impact on the averages over periods which include these rates. Further, the average rate of 2.92% over the entire 90 year period is close to the average rate of 2.66% for the prior 30 years (1986 to 2016). However, the volatility of the annual rates in more recent years has been markedly lower as indicated by the significantly lower annual standard deviations. Many experts attribute the lower average annual rates and lower volatility to the increased efforts of the Fed since the early 1980’s to stabilize price inflation.
Forecasts of Inflation:
Additional information to consider in formulating this assumption is obtained from measuring the spread on Treasury Inflation Protected Securities (TIPS) and from the prevailing economic forecasts. The spread between the nominal yield on treasury securities (bonds) and the inflation indexed yield on TIPS of the same maturity is referred to as the “breakeven rate of inflation” and represents the bond market’s expectation of inflation over the period to maturity. Current market prices as of December 2016 suggest that investors expect inflation to be around 1.60% over the next 30 years. The bond market expectations may be heavily influenced by the low interest rate environment created by the Federal Reserve Bank’s manipulation of the bond market. Whether inflation will return to the higher rates observed historically remains to be seen.
-5%
0%
5%
10%
15%
1945
1947
1949
1951
1953
1955
1957
1959
1961
1963
1965
1967
1969
1971
1973
1975
1977
1979
1981
1983
1985
1987
1989
1991
1993
1995
1997
1999
2001
2003
2005
2007
2009
2011
2013
2015
Ann
ual R
ate
Calendar Year
Price InflationCPI-U
Annual 30-Year Average Assumed 3.00%
Section II: Economic Assumptions
Cavanaugh Macdonald Consulting, LLC Page 11
Although many economists forecast lower inflation than the assumption used by retirement plans, they are generally looking at a shorter time horizon than is appropriate for a pension valuation. To consider a longer, similar time frame, we looked at the expected increase in the CPI by the Office of the Chief Actuary for the Social Security Administration. In the most recent report (May 2016), the projected average annual increase in the CPI over the next 75 years was estimated to be 2.60%, under the intermediate cost assumption. The range of inflation assumptions used in the Social Security 75-year modeling, which includes a low and high cost scenario, in addition to the intermediate cost projection, was 2.00% to 3.20%. Additionally, based upon information provided from the “Survey of Professional Forecasters” published by the Philadelphia Federal Reserve Bank, the median expected annual rate of inflation for the 10 years beginning January 1, 2017 is 2.30%.
Finally, it is worth noting that RVK, the investment consultant retained by the MPERA, publishes a capital market report, which includes US inflation. Their current long-term inflation assumption is 2.30%, noting their assumption is below historical averages, but above short-term expectations.
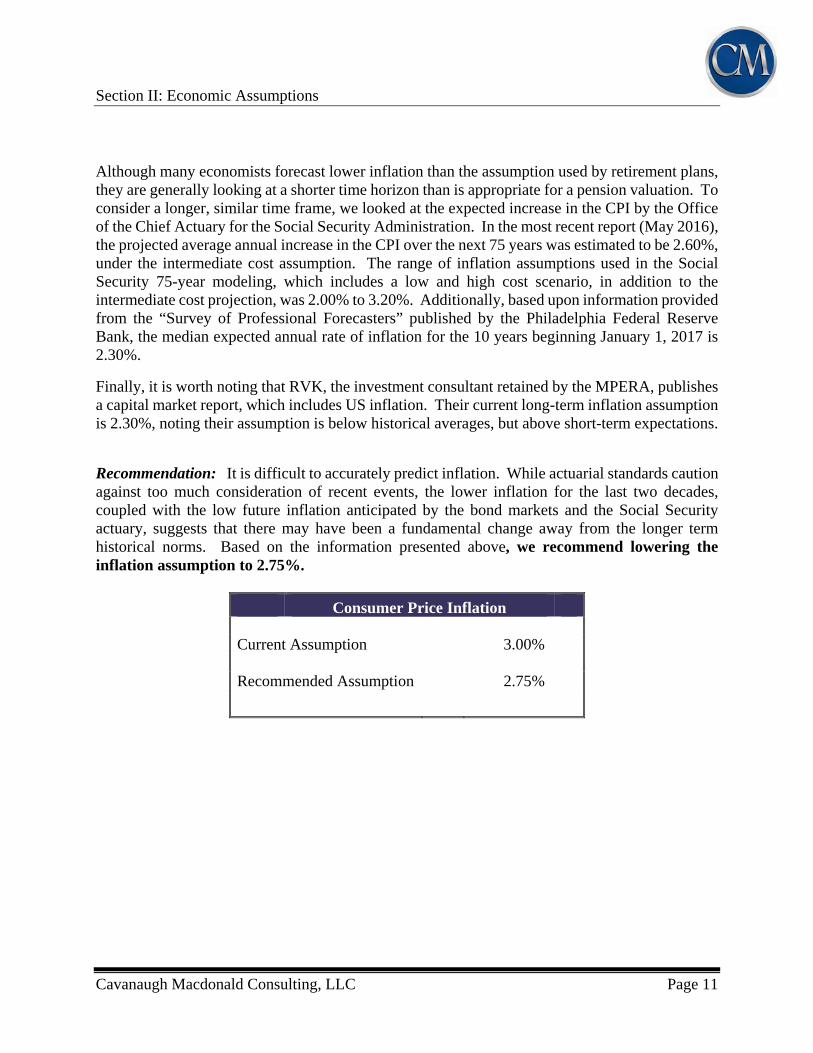
Recommendation: It is difficult to accurately predict inflation. While actuarial standards caution against too much consideration of recent events, the lower inflation for the last two decades, coupled with the low future inflation anticipated by the bond markets and the Social Security actuary, suggests that there may have been a fundamental change away from the longer term historical norms. Based on the information presented above, we recommend lowering the inflation assumption to 2.75%.
Consumer Price Inflation Current Assumption 3.00%
Recommended Assumption 2.75%
Section II: Economic Assumptions
Cavanaugh Macdonald Consulting, LLC Page 12
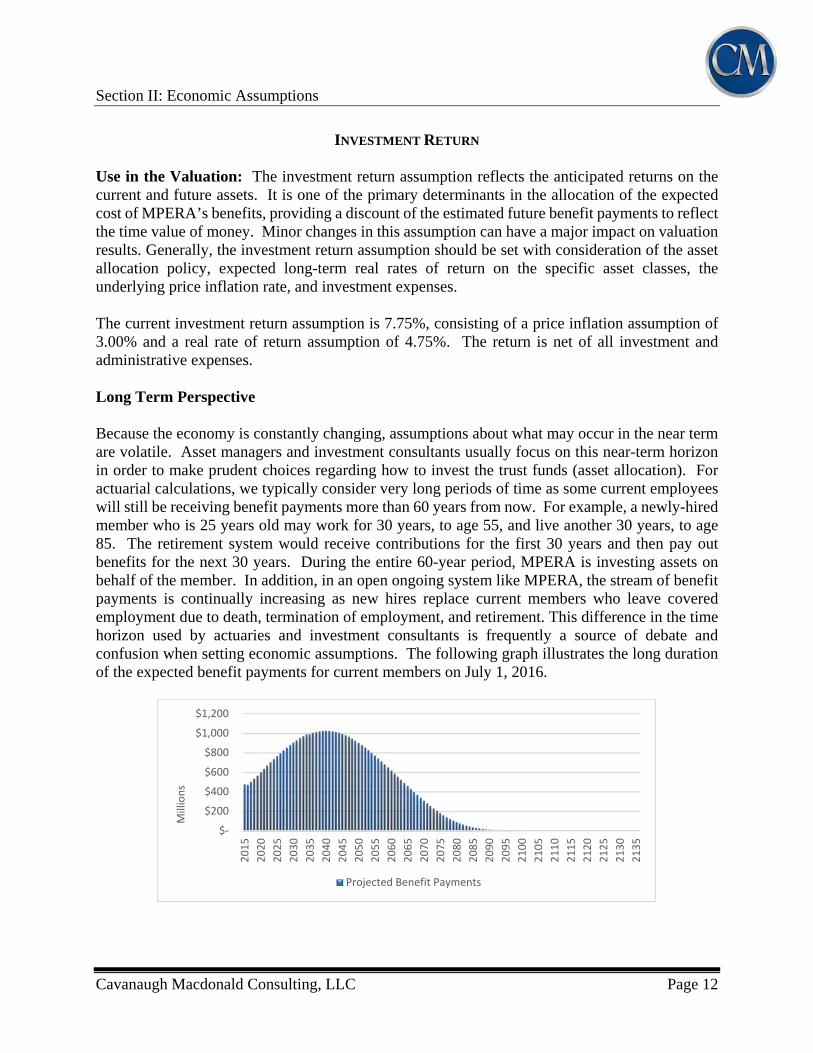
INVESTMENT RETURN Use in the Valuation: The investment return assumption reflects the anticipated returns on the current and future assets. It is one of the primary determinants in the allocation of the expected cost of MPERA’s benefits, providing a discount of the estimated future benefit payments to reflect the time value of money. Minor changes in this assumption can have a major impact on valuation results. Generally, the investment return assumption should be set with consideration of the asset allocation policy, expected long-term real rates of return on the specific asset classes, the underlying price inflation rate, and investment expenses. The current investment return assumption is 7.75%, consisting of a price inflation assumption of 3.00% and a real rate of return assumption of 4.75%. The return is net of all investment and administrative expenses. Long Term Perspective Because the economy is constantly changing, assumptions about what may occur in the near term are volatile. Asset managers and investment consultants usually focus on this near-term horizon in order to make prudent choices regarding how to invest the trust funds (asset allocation). For actuarial calculations, we typically consider very long periods of time as some current employees will still be receiving benefit payments more than 60 years from now. For example, a newly-hired member who is 25 years old may work for 30 years, to age 55, and live another 30 years, to age 85. The retirement system would receive contributions for the first 30 years and then pay out benefits for the next 30 years. During the entire 60-year period, MPERA is investing assets on behalf of the member. In addition, in an open ongoing system like MPERA, the stream of benefit payments is continually increasing as new hires replace current members who leave covered employment due to death, termination of employment, and retirement. This difference in the time horizon used by actuaries and investment consultants is frequently a source of debate and confusion when setting economic assumptions. The following graph illustrates the long duration of the expected benefit payments for current members on July 1, 2016.
$‐
$200
$400
$600
$800
$1,000
$1,200
2015
2020
2025
2030
2035
2040
2045
2050
2055
2060
2065
2070
2075
2080
2085
2090
2095
2100
2105
2110
2115
2120
2125
2130
2135
Millions
Projected Benefit Payments
Section II: Economic Assumptions
Cavanaugh Macdonald Consulting, LLC Page 13
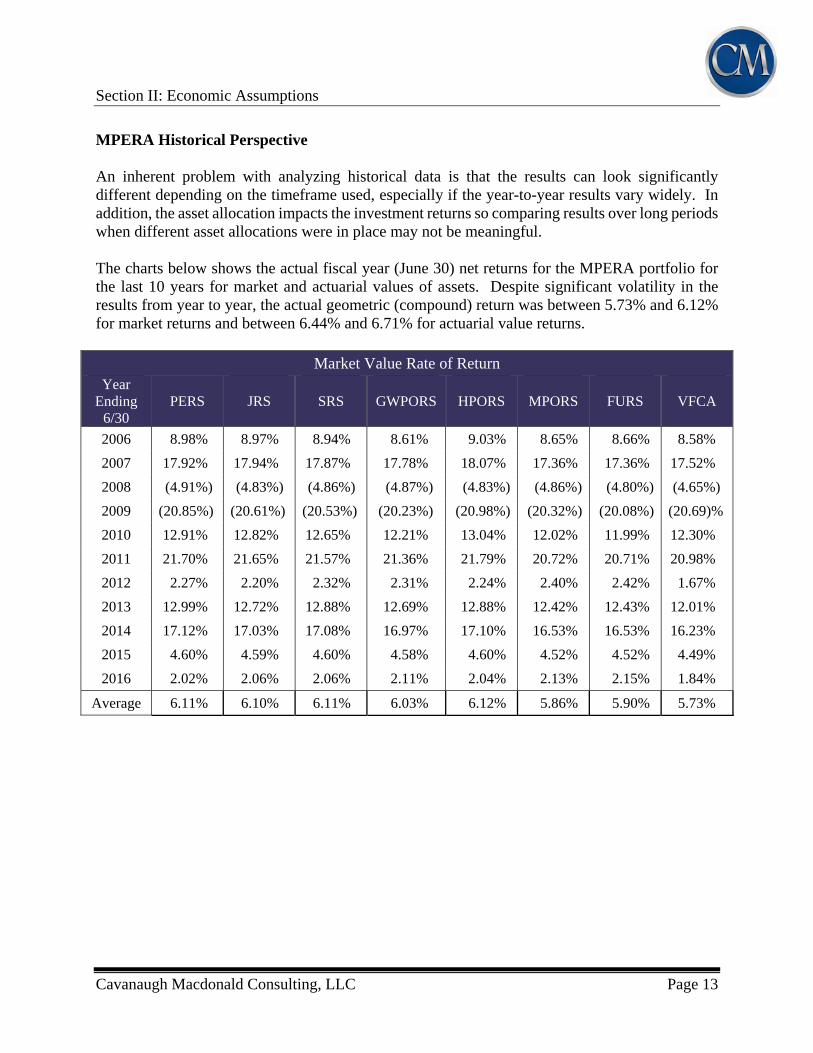
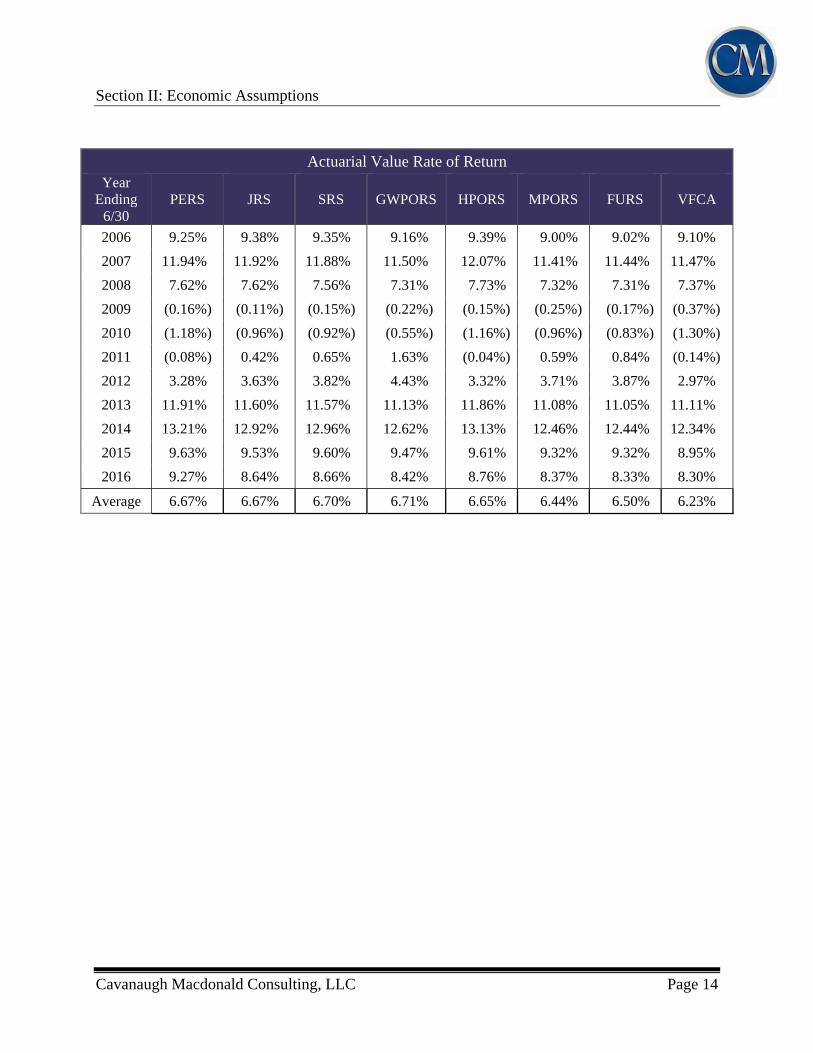
MPERA Historical Perspective An inherent problem with analyzing historical data is that the results can look significantly different depending on the timeframe used, especially if the year-to-year results vary widely. In addition, the asset allocation impacts the investment returns so comparing results over long periods when different asset allocations were in place may not be meaningful. The charts below shows the actual fiscal year (June 30) net returns for the MPERA portfolio for the last 10 years for market and actuarial values of assets. Despite significant volatility in the results from year to year, the actual geometric (compound) return was between 5.73% and 6.12% for market returns and between 6.44% and 6.71% for actuarial value returns.
Market Value Rate of Return Year
Ending 6/30
PERS
JRS
SRS
GWPORS
HPORS
MPORS
FURS
VFCA
2006 8.98% 8.97% 8.94% 8.61% 9.03% 8.65% 8.66% 8.58%
2007 17.92% 17.94% 17.87% 17.78% 18.07% 17.36% 17.36% 17.52%
2008 (4.91%) (4.83%) (4.86%) (4.87%) (4.83%) (4.86%) (4.80%) (4.65%)
2009 (20.85%) (20.61%) (20.53%) (20.23%) (20.98%) (20.32%) (20.08%) (20.69)%
2010 12.91% 12.82% 12.65% 12.21% 13.04% 12.02% 11.99% 12.30%
2011 21.70% 21.65% 21.57% 21.36% 21.79% 20.72% 20.71% 20.98%
2012 2.27% 2.20% 2.32% 2.31% 2.24% 2.40% 2.42% 1.67%
2013 12.99% 12.72% 12.88% 12.69% 12.88% 12.42% 12.43% 12.01%
2014 17.12% 17.03% 17.08% 16.97% 17.10% 16.53% 16.53% 16.23%
2015 4.60% 4.59% 4.60% 4.58% 4.60% 4.52% 4.52% 4.49%
2016 2.02% 2.06% 2.06% 2.11% 2.04% 2.13% 2.15% 1.84%
Average 6.11% 6.10% 6.11% 6.03% 6.12% 5.86% 5.90% 5.73%
Section II: Economic Assumptions
Cavanaugh Macdonald Consulting, LLC Page 14
Actuarial Value Rate of Return
Year Ending
6/30 PERS
JRS
SRS
GWPORS
HPORS
MPORS
FURS
VFCA
2006 9.25% 9.38% 9.35% 9.16% 9.39% 9.00% 9.02% 9.10%
2007 11.94% 11.92% 11.88% 11.50% 12.07% 11.41% 11.44% 11.47%
2008 7.62% 7.62% 7.56% 7.31% 7.73% 7.32% 7.31% 7.37%
2009 (0.16%) (0.11%) (0.15%) (0.22%) (0.15%) (0.25%) (0.17%) (0.37%)
2010 (1.18%) (0.96%) (0.92%) (0.55%) (1.16%) (0.96%) (0.83%) (1.30%)
2011 (0.08%) 0.42% 0.65% 1.63% (0.04%) 0.59% 0.84% (0.14%)
2012 3.28% 3.63% 3.82% 4.43% 3.32% 3.71% 3.87% 2.97%
2013 11.91% 11.60% 11.57% 11.13% 11.86% 11.08% 11.05% 11.11%
2014 13.21% 12.92% 12.96% 12.62% 13.13% 12.46% 12.44% 12.34%
2015 9.63% 9.53% 9.60% 9.47% 9.61% 9.32% 9.32% 8.95%
2016 9.27% 8.64% 8.66% 8.42% 8.76% 8.37% 8.33% 8.30%
Average 6.67% 6.67% 6.70% 6.71% 6.65% 6.44% 6.50% 6.23%
Section II: Economic Assumptions
Cavanaugh Macdonald Consulting, LLC Page 15
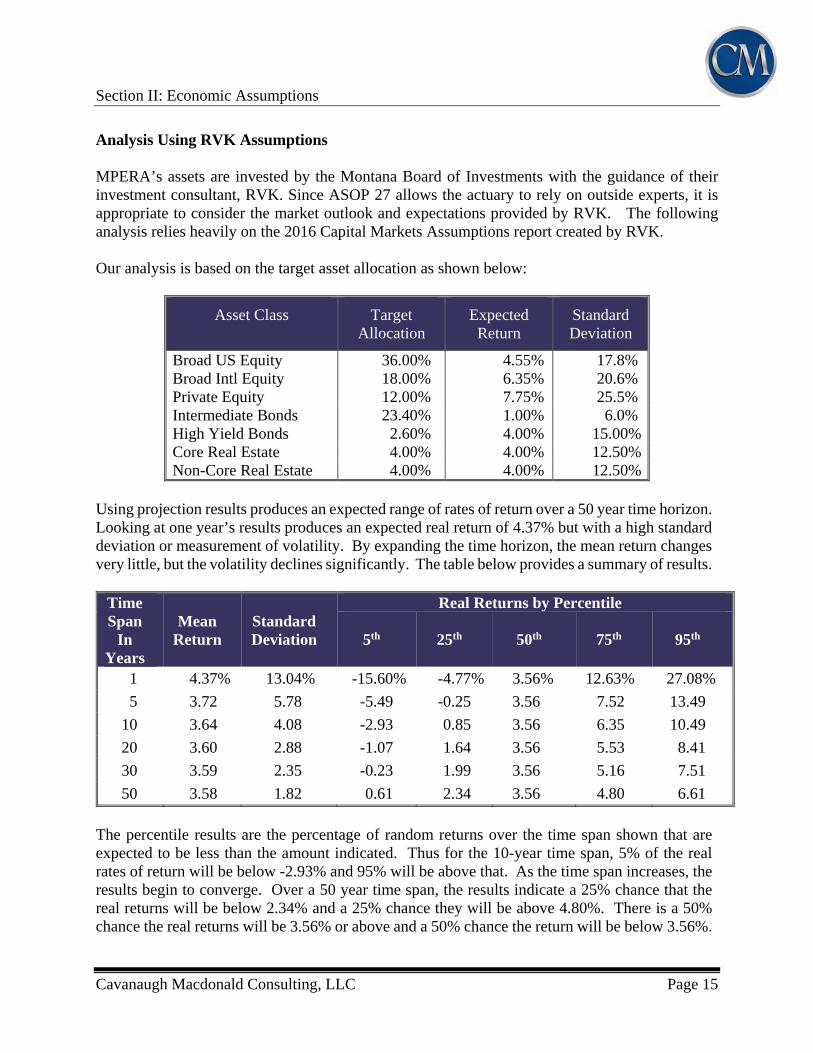
Analysis Using RVK Assumptions MPERA’s assets are invested by the Montana Board of Investments with the guidance of their investment consultant, RVK. Since ASOP 27 allows the actuary to rely on outside experts, it is appropriate to consider the market outlook and expectations provided by RVK. The following analysis relies heavily on the 2016 Capital Markets Assumptions report created by RVK. Our analysis is based on the target asset allocation as shown below:
Asset Class Target Allocation
Expected Return
Standard Deviation
Broad US Equity 36.00% 4.55% 17.8% Broad Intl Equity Private Equity
18.00% 12.00%
6.35% 7.75%
20.6% 25.5%
Intermediate Bonds 23.40% 1.00% 6.0% High Yield Bonds 2.60% 4.00% 15.00% Core Real Estate 4.00% 4.00% 12.50% Non-Core Real Estate 4.00% 4.00% 12.50%
Using projection results produces an expected range of rates of return over a 50 year time horizon. Looking at one year’s results produces an expected real return of 4.37% but with a high standard deviation or measurement of volatility. By expanding the time horizon, the mean return changes very little, but the volatility declines significantly. The table below provides a summary of results.
Time Span
In Years
Mean Return
Standard Deviation
Real Returns by Percentile
5th 25th 50th 75th 95th
1 4.37% 13.04% -15.60% -4.77% 3.56% 12.63% 27.08%
5 3.72 5.78 -5.49 -0.25 3.56 7.52 13.49
10 3.64 4.08 -2.93 0.85 3.56 6.35 10.49
20 3.60 2.88 -1.07 1.64 3.56 5.53 8.41
30 3.59 2.35 -0.23 1.99 3.56 5.16 7.51
50 3.58 1.82 0.61 2.34 3.56 4.80 6.61
The percentile results are the percentage of random returns over the time span shown that are expected to be less than the amount indicated. Thus for the 10-year time span, 5% of the real rates of return will be below -2.93% and 95% will be above that. As the time span increases, the results begin to converge. Over a 50 year time span, the results indicate a 25% chance that the real returns will be below 2.34% and a 25% chance they will be above 4.80%. There is a 50% chance the real returns will be 3.56% or above and a 50% chance the return will be below 3.56%.
Section II: Economic Assumptions
Cavanaugh Macdonald Consulting, LLC Page 16
Many investment firms and investment consulting firms produce estimates of future asset returns. While it might seem desirable to directly compare these estimates, there are at least two considerations that we believe weaken the credibility of such efforts. First, most of the estimates of expected returns are produced for five- to ten-year investment horizons. In light of the current interest rate environment, comparison of those results to RVK results, which are intended to reflect a 30+-year time horizon, are not applicable. Second, asset class expectations are dependent on the construction of the portfolio. Other investment consultants may have in mind a different blend of large versus small stocks or growth versus value equities. There are also comparison challenges in certain asset classes such as international stock (emerging or developed markets), bonds (duration and credit quality), and alternatives (a very broadly interpreted category). For these two reasons, we believe trying to compare the expected return developed by RVK with the assumptions of another group of investment professionals may lead to an invalid comparison. Since RVK has qualified professionals on its staff and is in the best position to understand its own portfolio and the reasonable expectations given their investment style, we prefer to rely heavily on their analysis. While we like the idea of using a forward looking model, the weakness with that approach is that the assumptions being used are set by investment managers and consultants who are typically focusing on a much shorter time period (five to ten years). Therefore, those assumptions may not necessarily be appropriate for the longer timeframe used by actuaries (30 to 50 years). The fact that the capital market assumptions are short-term assumptions is evident by the fact that most investment consulting firms change their capital market assumptions at least annually. If the investment return assumption was set equal to the expected return based on the capital market assumptions each year or even in every experience study, it could create significant volatility in the funded ratios and amortization periods. Our goal is to choose an assumption that will be reasonable in the long term (30 to 50 years) with adjustment only when there are compelling changes to investment policy or evidence of a change in the long-term trends in the capital markets.
Section II: Economic Assumptions
Cavanaugh Macdonald Consulting, LLC Page 17
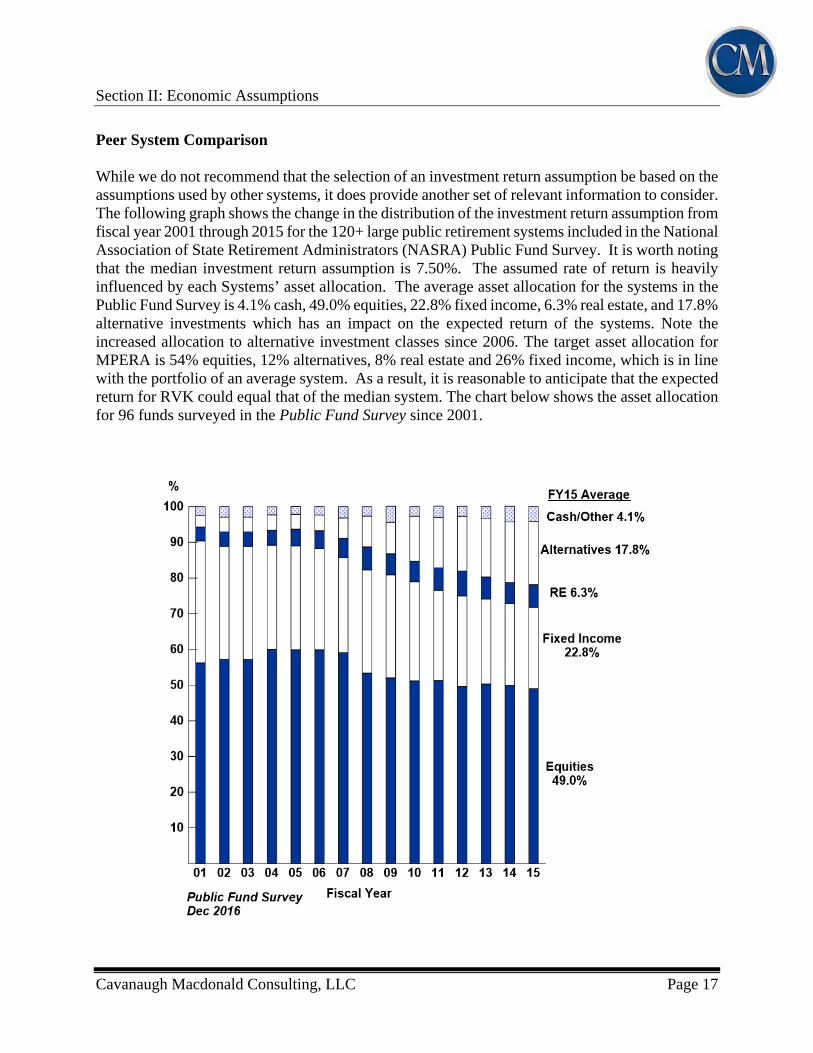
Peer System Comparison While we do not recommend that the selection of an investment return assumption be based on the assumptions used by other systems, it does provide another set of relevant information to consider. The following graph shows the change in the distribution of the investment return assumption from fiscal year 2001 through 2015 for the 120+ large public retirement systems included in the National Association of State Retirement Administrators (NASRA) Public Fund Survey. It is worth noting that the median investment return assumption is 7.50%. The assumed rate of return is heavily influenced by each Systems’ asset allocation. The average asset allocation for the systems in the Public Fund Survey is 4.1% cash, 49.0% equities, 22.8% fixed income, 6.3% real estate, and 17.8% alternative investments which has an impact on the expected return of the systems. Note the increased allocation to alternative investment classes since 2006. The target asset allocation for MPERA is 54% equities, 12% alternatives, 8% real estate and 26% fixed income, which is in line with the portfolio of an average system. As a result, it is reasonable to anticipate that the expected return for RVK could equal that of the median system. The chart below shows the asset allocation for 96 funds surveyed in the Public Fund Survey since 2001.
Section II: Economic Assumptions
Cavanaugh Macdonald Consulting, LLC Page 18
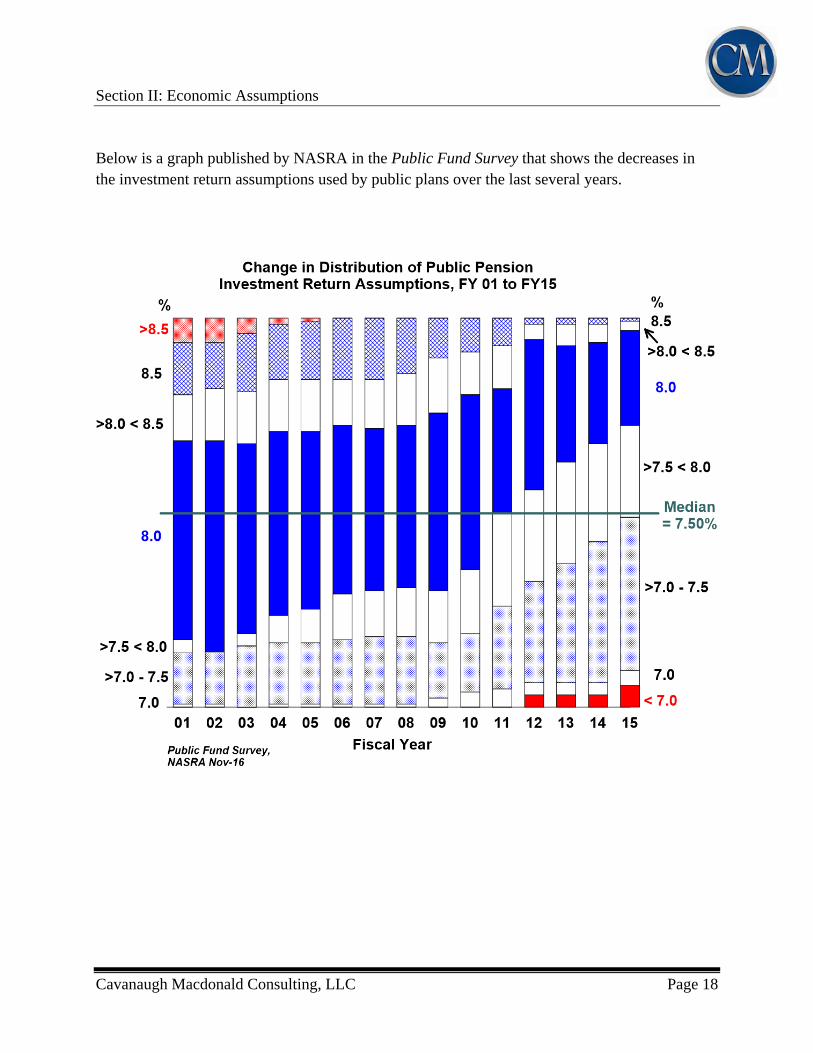
Below is a graph published by NASRA in the Public Fund Survey that shows the decreases in the investment return assumptions used by public plans over the last several years.
Section II: Economic Assumptions
Cavanaugh Macdonald Consulting, LLC Page 19
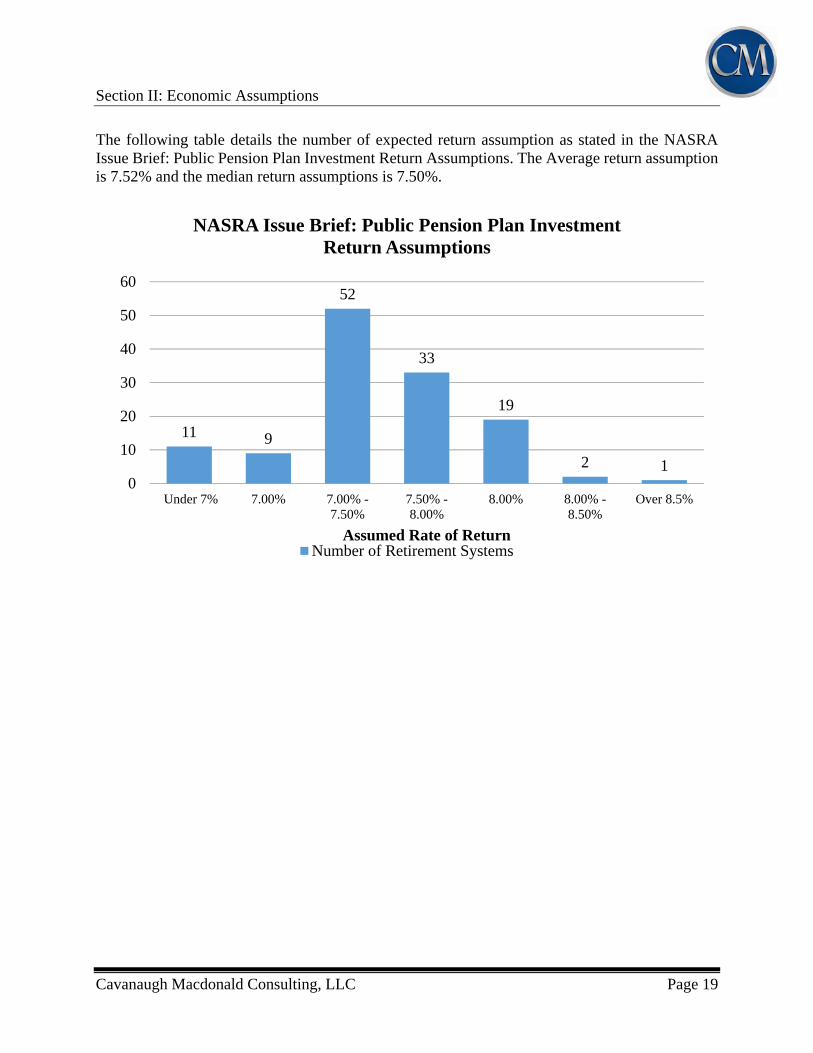
The following table details the number of expected return assumption as stated in the NASRA Issue Brief: Public Pension Plan Investment Return Assumptions. The Average return assumption is 7.52% and the median return assumptions is 7.50%.
11 9
52
33
19
2 10
10
20
30
40
50
60
Under 7% 7.00% 7.00% -7.50%
7.50% -8.00%
8.00% 8.00% -8.50%
Over 8.5%
Assumed Rate of Return
NASRA Issue Brief: Public Pension Plan Investment Return Assumptions
Number of Retirement Systems
Section II: Economic Assumptions
Cavanaugh Macdonald Consulting, LLC Page 20
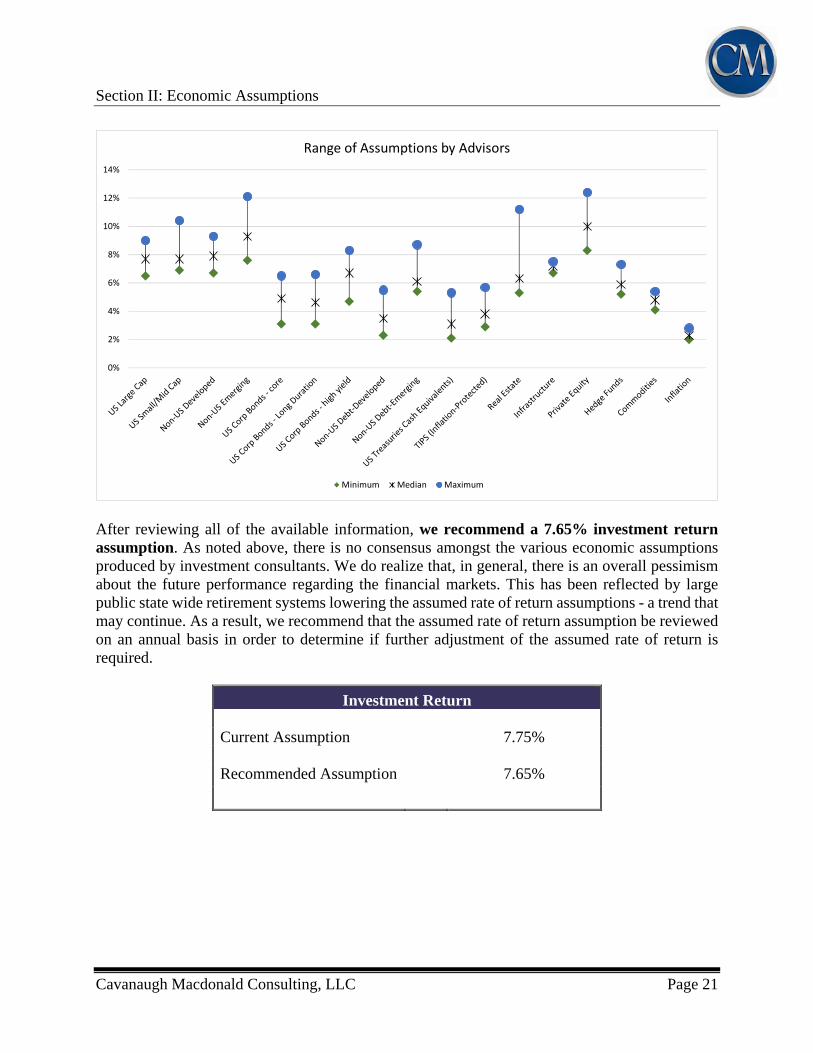
Recommendation: By actuarial standards we are required to maintain a long-term perspective in setting all assumptions, including the investment return assumption. Therefore, we believe we must be careful not to let recent experience or the short-term expectations impact our judgment regarding the appropriateness of the current assumption over the long term. This is a challenging time to develop a recommendation for the investment return assumption. We need to recognize that there is no right answer to the question as no one knows what the future holds. This is evident with the wide range of forward looking capital market assumptions produced by various investment consultants. Horizon Actuarial Services prepares an annual study in which they survey various investment advisors and provide ranges of results as well as averages. The 2016 Survey included a total of 35 investment advisors who provided their capital market assumptions of which 12 provided both short-term and long-term assumptions. It is worth noting that this Survey has historically been prepared for the multiemployer (Taft-Hartley) plan community and initially included assumptions only from investment advisors serving those plans. The Survey has expanded over the years and now includes assumptions from investment advisors outside of the Taft-Hartley community including consultants such as Aon Hewitt, New England Pension Consultants (NEPC), Callan Associates, Willis Towers Watson, JP Morgan, RVK, SEI, UBS, Summit Strategies, Blackrock and PCA who work with public plans. The graph on the following page shows the minimum, maximum and median return assumption for each asset class for the 12 firms providing long-term assumptions in the Horizon Survey. Expected returns shown below are annualized (geometric).
Section II: Economic Assumptions
Cavanaugh Macdonald Consulting, LLC Page 21
After reviewing all of the available information, we recommend a 7.65% investment return assumption. As noted above, there is no consensus amongst the various economic assumptions produced by investment consultants. We do realize that, in general, there is an overall pessimism about the future performance regarding the financial markets. This has been reflected by large public state wide retirement systems lowering the assumed rate of return assumptions - a trend that may continue. As a result, we recommend that the assumed rate of return assumption be reviewed on an annual basis in order to determine if further adjustment of the assumed rate of return is required.
Investment Return Current Assumption 7.75%
Recommended Assumption 7.65%
0%
2%
4%
6%
8%
10%
12%
14%
Range of Assumptions by Advisors
Minimum Median Maximum
Section II: Economic Assumptions
Cavanaugh Macdonald Consulting, LLC Page 22
WAGE INFLATION
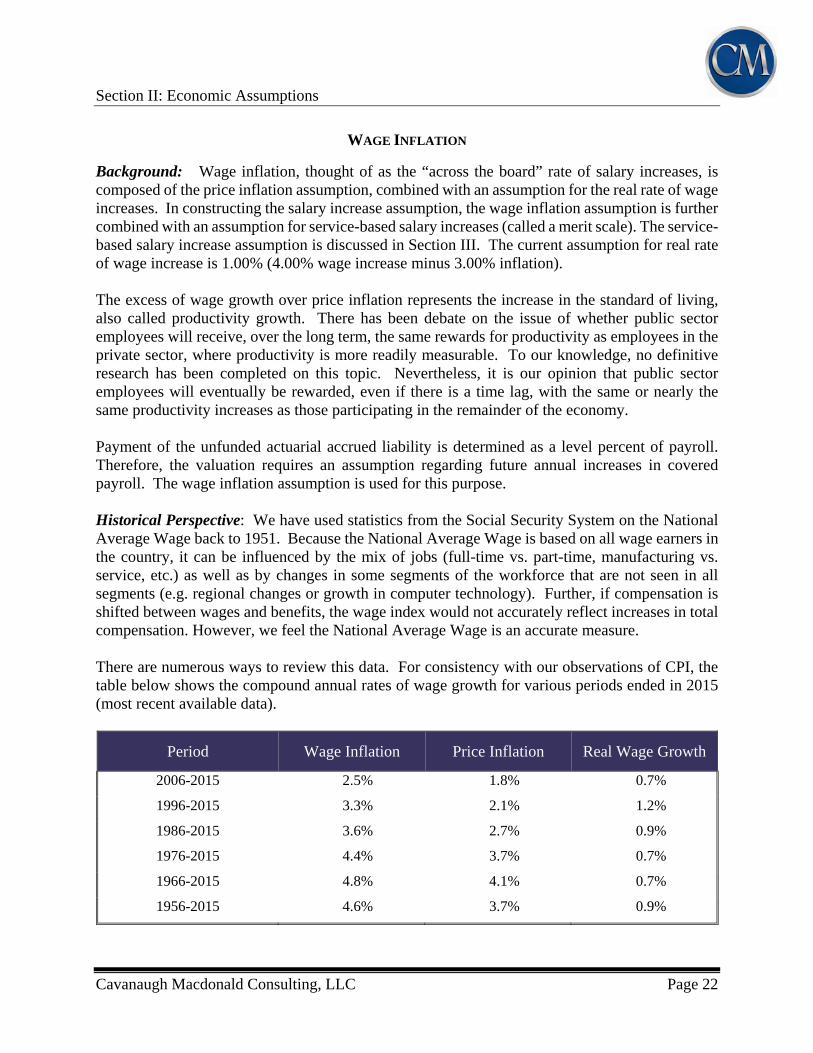
Background: Wage inflation, thought of as the “across the board” rate of salary increases, is composed of the price inflation assumption, combined with an assumption for the real rate of wage increases. In constructing the salary increase assumption, the wage inflation assumption is further combined with an assumption for service-based salary increases (called a merit scale). The service-based salary increase assumption is discussed in Section III. The current assumption for real rate of wage increase is 1.00% (4.00% wage increase minus 3.00% inflation). The excess of wage growth over price inflation represents the increase in the standard of living, also called productivity growth. There has been debate on the issue of whether public sector employees will receive, over the long term, the same rewards for productivity as employees in the private sector, where productivity is more readily measurable. To our knowledge, no definitive research has been completed on this topic. Nevertheless, it is our opinion that public sector employees will eventually be rewarded, even if there is a time lag, with the same or nearly the same productivity increases as those participating in the remainder of the economy. Payment of the unfunded actuarial accrued liability is determined as a level percent of payroll. Therefore, the valuation requires an assumption regarding future annual increases in covered payroll. The wage inflation assumption is used for this purpose. Historical Perspective: We have used statistics from the Social Security System on the National Average Wage back to 1951. Because the National Average Wage is based on all wage earners in the country, it can be influenced by the mix of jobs (full-time vs. part-time, manufacturing vs. service, etc.) as well as by changes in some segments of the workforce that are not seen in all segments (e.g. regional changes or growth in computer technology). Further, if compensation is shifted between wages and benefits, the wage index would not accurately reflect increases in total compensation. However, we feel the National Average Wage is an accurate measure. There are numerous ways to review this data. For consistency with our observations of CPI, the table below shows the compound annual rates of wage growth for various periods ended in 2015 (most recent available data).
Period Wage Inflation Price Inflation Real Wage Growth
2006-2015 2.5% 1.8% 0.7%
1996-2015 3.3% 2.1% 1.2%
1986-2015 3.6% 2.7% 0.9%
1976-2015 4.4% 3.7% 0.7%
1966-2015 4.8% 4.1% 0.7%
1956-2015 4.6% 3.7% 0.9%
Section II: Economic Assumptions
Cavanaugh Macdonald Consulting, LLC Page 23
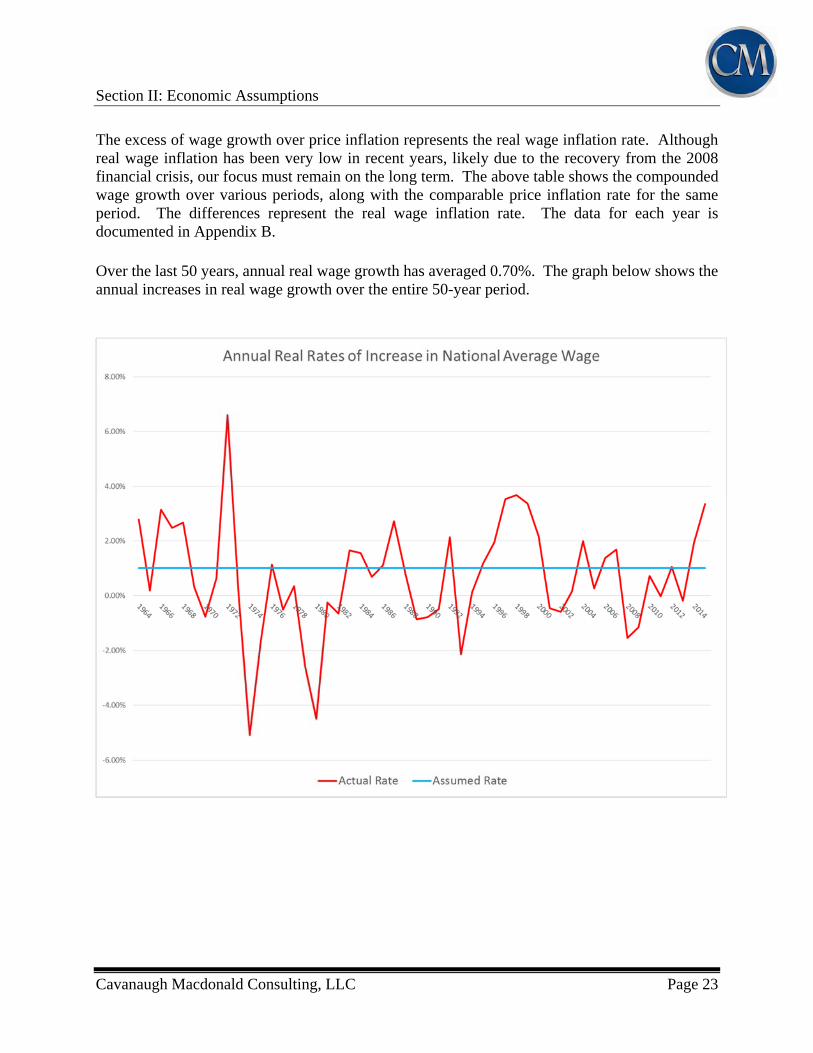
The excess of wage growth over price inflation represents the real wage inflation rate. Although real wage inflation has been very low in recent years, likely due to the recovery from the 2008 financial crisis, our focus must remain on the long term. The above table shows the compounded wage growth over various periods, along with the comparable price inflation rate for the same period. The differences represent the real wage inflation rate. The data for each year is documented in Appendix B. Over the last 50 years, annual real wage growth has averaged 0.70%. The graph below shows the annual increases in real wage growth over the entire 50-year period.
Section II: Economic Assumptions
Cavanaugh Macdonald Consulting, LLC Page 24
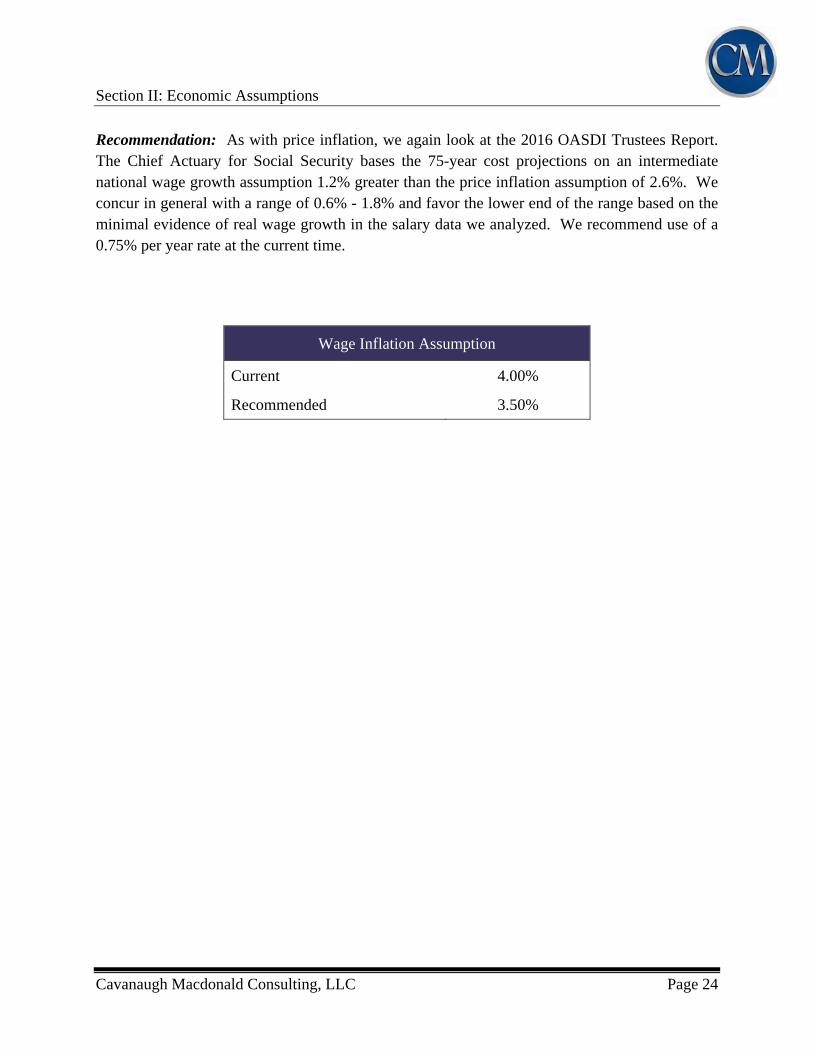
Recommendation: As with price inflation, we again look at the 2016 OASDI Trustees Report. The Chief Actuary for Social Security bases the 75-year cost projections on an intermediate national wage growth assumption 1.2% greater than the price inflation assumption of 2.6%. We concur in general with a range of 0.6% - 1.8% and favor the lower end of the range based on the minimal evidence of real wage growth in the salary data we analyzed. We recommend use of a 0.75% per year rate at the current time.
Wage Inflation Assumption
Current 4.00%
Recommended 3.50%
Section III: Demographic Assumptions
Cavanaugh Macdonald Consulting, LLC Page 25
DEMOGRAPHIC ASSUMPTIONS
There are several demographic assumptions used in the actuarial valuations performed for systems in the Montana Public Employee Retirement Administration. They are:
Rates of Post-retirement Mortality Rates of Post-retirement Disabled Mortality Rates of Pre-Retirement Mortality Rates of Service Retirement Rates of Disability Retirement Rates of Withdrawal Rates of Salary Increase for Merit and Promotions
The Actuarial Standards Board has issued Actuarial Standard of Practice (ASOP) No. 35, “Selection of Demographic and Other Noneconomic Assumptions for Measuring Pension Obligations”, which provides guidance to actuaries in selecting demographic assumptions for measuring obligations under defined benefit plans. In our opinion, the demographic assumptions recommended in this report have been developed in accordance with ASOP No. 35. The purpose of a study of demographic experience is to compare what actually happened to the membership during the study period with what was expected to happen based on the assumptions used in the most recent actuarial valuations. Studies of demographic experience generally involve three steps:
First, the number of members changing membership status, called decrements, during the study is tabulated by age, duration, gender, group, and membership class (active, retired, etc.).
Next, the number of members expected to change status is calculated by multiplying certain membership statistics, called exposure, by the expected rates of decrement.
Finally, the number of actual decrements is compared with the number of expected decrements. The comparison is called the actual to expected ratio (A/E Ratio), and is expressed as a percentage.
In general, if the actual experience differs significantly from the overall expected results, or if the pattern of actual decrements, or rates of decrement, by age, gender, or duration deviates significantly from the expected pattern, new assumptions are considered. Recommended revisions are normally not an exact representation of the experience during the observation period. Professional judgment is required to set assumptions for future experience from past trends and current evidence, including a determination of the amount of weight to assign to the most recent experience.

Section III: Demographic Assumptions
Cavanaugh Macdonald Consulting, LLC Page 26
The remainder of this section presents the results of the demographic study. We have prepared charts and graphs that show a comparison of the actual and expected decrements and the overall ratio of actual-to-expected results under the current assumptions. If a change is being proposed, the revised actual-to-expected ratios are shown as well.
RATES OF MORTALITY Mortality tables are a fundamental assumption in actuarial valuations. Benefits are typically paid over a retiree’s lifetime so it is important to appropriately reflect what a typical lifetime looks like. In addition, deaths before retirement typically result in the payout of benefits to a spouse or survivor. For valuation purposes, we must consider mortality tables for retirees, beneficiaries of retirees, disabled retirees, and active members. Retiree and Beneficiary Mortality The post-retirement mortality rates used in the actuarial valuation project the percentage of retirees who are expected to die in a given future year. This assumption typically has the most significant impact on liability projections. Based upon the long term trend of mortality improvement, actuaries seek to account for future improvements in longevity, either by directly projecting future improvements, or by maintaining a sufficient margin in expected rates of mortality to allow for future improvement. We propose that the selected table reflect some degree of future improvement now, thereby providing a margin for improvement. The current table is the RP-2000 Combined Employee and Annuitant Mortality Table projected to 2015 using scale AA. This table is used for all non-disabled members.
Section III: Demographic Assumptions
Cavanaugh Macdonald Consulting, LLC Page 27
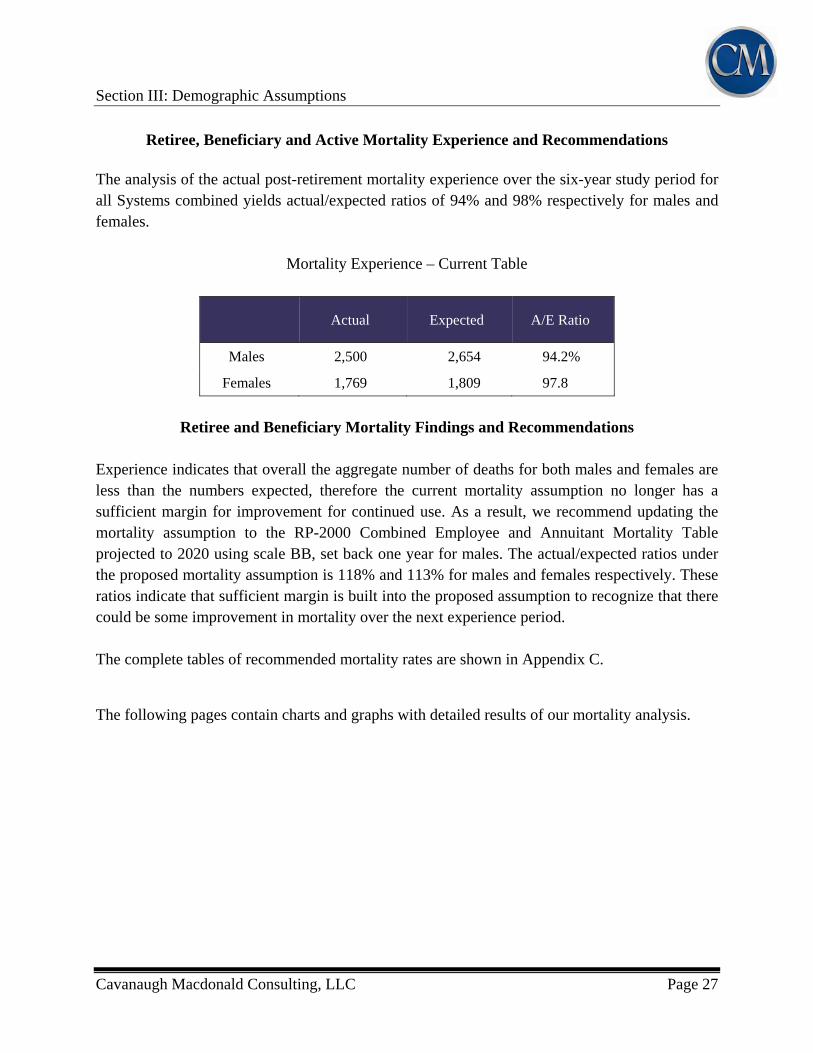
Retiree, Beneficiary and Active Mortality Experience and Recommendations The analysis of the actual post-retirement mortality experience over the six-year study period for all Systems combined yields actual/expected ratios of 94% and 98% respectively for males and females.
Mortality Experience – Current Table
Actual Expected A/E Ratio
Males 2,500 2,654 94.2%
Females 1,769 1,809 97.8
Retiree and Beneficiary Mortality Findings and Recommendations
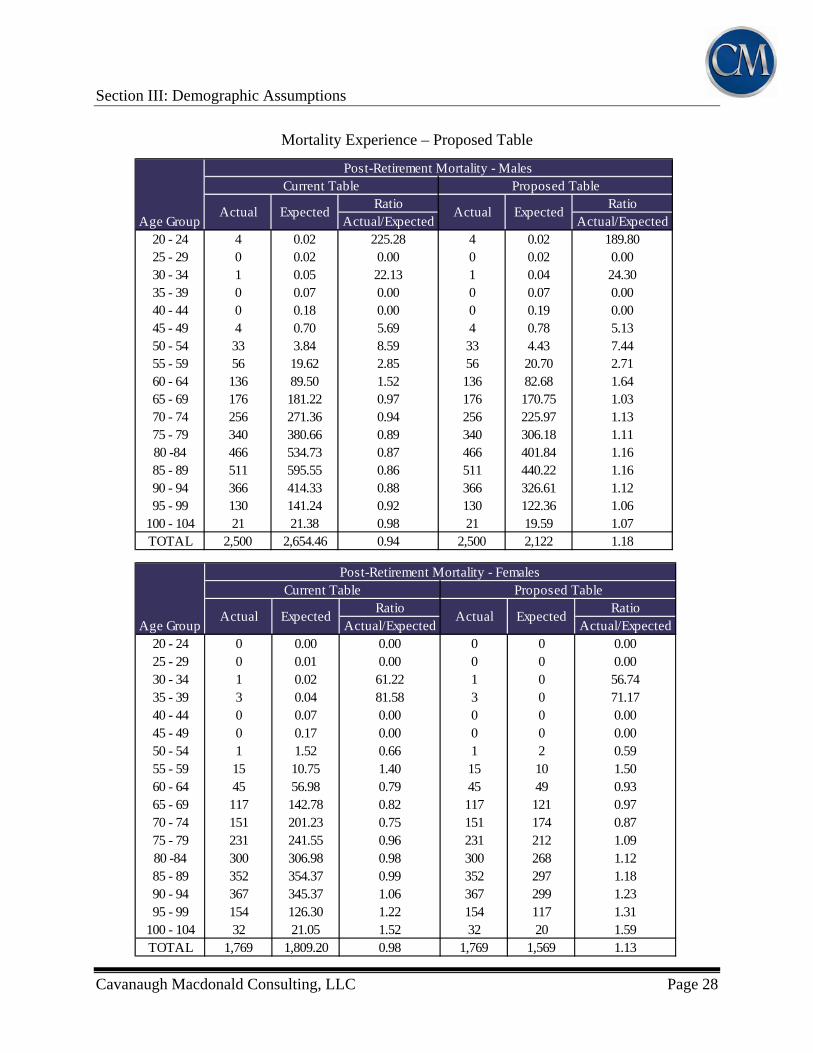
Experience indicates that overall the aggregate number of deaths for both males and females are less than the numbers expected, therefore the current mortality assumption no longer has a sufficient margin for improvement for continued use. As a result, we recommend updating the mortality assumption to the RP-2000 Combined Employee and Annuitant Mortality Table projected to 2020 using scale BB, set back one year for males. The actual/expected ratios under the proposed mortality assumption is 118% and 113% for males and females respectively. These ratios indicate that sufficient margin is built into the proposed assumption to recognize that there could be some improvement in mortality over the next experience period. The complete tables of recommended mortality rates are shown in Appendix C.
The following pages contain charts and graphs with detailed results of our mortality analysis.
Section III: Demographic Assumptions
Cavanaugh Macdonald Consulting, LLC Page 28
Ratio RatioActual/Expected Actual/Expected
20 - 24 0 0.00 0.00 0 0 0.0025 - 29 0 0.01 0.00 0 0 0.0030 - 34 1 0.02 61.22 1 0 56.7435 - 39 3 0.04 81.58 3 0 71.1740 - 44 0 0.07 0.00 0 0 0.0045 - 49 0 0.17 0.00 0 0 0.0050 - 54 1 1.52 0.66 1 2 0.5955 - 59 15 10.75 1.40 15 10 1.5060 - 64 45 56.98 0.79 45 49 0.9365 - 69 117 142.78 0.82 117 121 0.9770 - 74 151 201.23 0.75 151 174 0.8775 - 79 231 241.55 0.96 231 212 1.0980 -84 300 306.98 0.98 300 268 1.1285 - 89 352 354.37 0.99 352 297 1.1890 - 94 367 345.37 1.06 367 299 1.2395 - 99 154 126.30 1.22 154 117 1.31
100 - 104 32 21.05 1.52 32 20 1.59TOTAL 1,769 1,809.20 0.98 1,769 1,569 1.13
Age Group
Post-Retirement Mortality - FemalesCurrent Table Proposed Table
Actual Expected Actual Expected
Ratio RatioActual/Expected Actual/Expected
20 - 24 4 0.02 225.28 4 0.02 189.8025 - 29 0 0.02 0.00 0 0.02 0.0030 - 34 1 0.05 22.13 1 0.04 24.3035 - 39 0 0.07 0.00 0 0.07 0.0040 - 44 0 0.18 0.00 0 0.19 0.0045 - 49 4 0.70 5.69 4 0.78 5.1350 - 54 33 3.84 8.59 33 4.43 7.4455 - 59 56 19.62 2.85 56 20.70 2.7160 - 64 136 89.50 1.52 136 82.68 1.6465 - 69 176 181.22 0.97 176 170.75 1.0370 - 74 256 271.36 0.94 256 225.97 1.1375 - 79 340 380.66 0.89 340 306.18 1.1180 -84 466 534.73 0.87 466 401.84 1.1685 - 89 511 595.55 0.86 511 440.22 1.1690 - 94 366 414.33 0.88 366 326.61 1.1295 - 99 130 141.24 0.92 130 122.36 1.06
100 - 104 21 21.38 0.98 21 19.59 1.07TOTAL 2,500 2,654.46 0.94 2,500 2,122 1.18
Age Group
Post-Retirement Mortality - MalesCurrent Table Proposed Table
Actual Expected Actual Expected
Mortality Experience – Proposed Table
Section III: Demographic Assumptions
Cavanaugh Macdonald Consulting, LLC Page 29
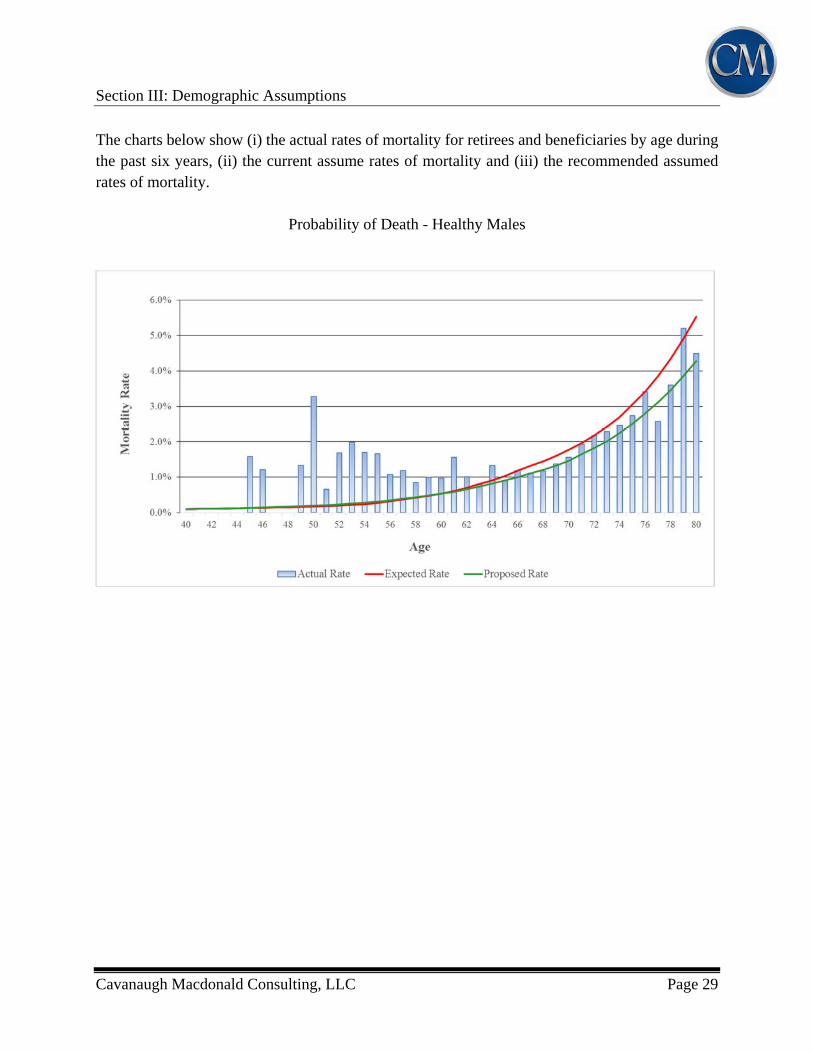
The charts below show (i) the actual rates of mortality for retirees and beneficiaries by age during the past six years, (ii) the current assume rates of mortality and (iii) the recommended assumed rates of mortality.
Probability of Death - Healthy Males
Section III: Demographic Assumptions
Cavanaugh Macdonald Consulting, LLC Page 30
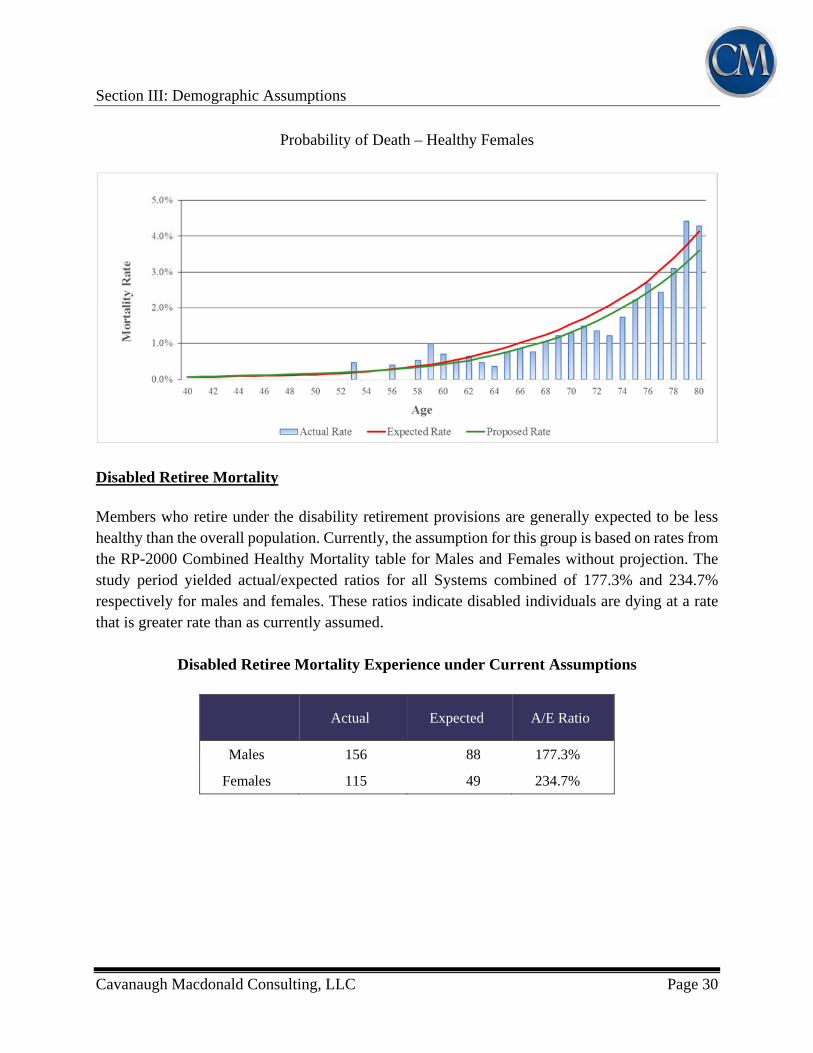
Probability of Death – Healthy Females
Disabled Retiree Mortality Members who retire under the disability retirement provisions are generally expected to be less healthy than the overall population. Currently, the assumption for this group is based on rates from the RP-2000 Combined Healthy Mortality table for Males and Females without projection. The study period yielded actual/expected ratios for all Systems combined of 177.3% and 234.7% respectively for males and females. These ratios indicate disabled individuals are dying at a rate that is greater rate than as currently assumed.
Disabled Retiree Mortality Experience under Current Assumptions
Actual Expected A/E Ratio
Males 156 88 177.3%
Females 115 49 234.7%
Section III: Demographic Assumptions
Cavanaugh Macdonald Consulting, LLC Page 31
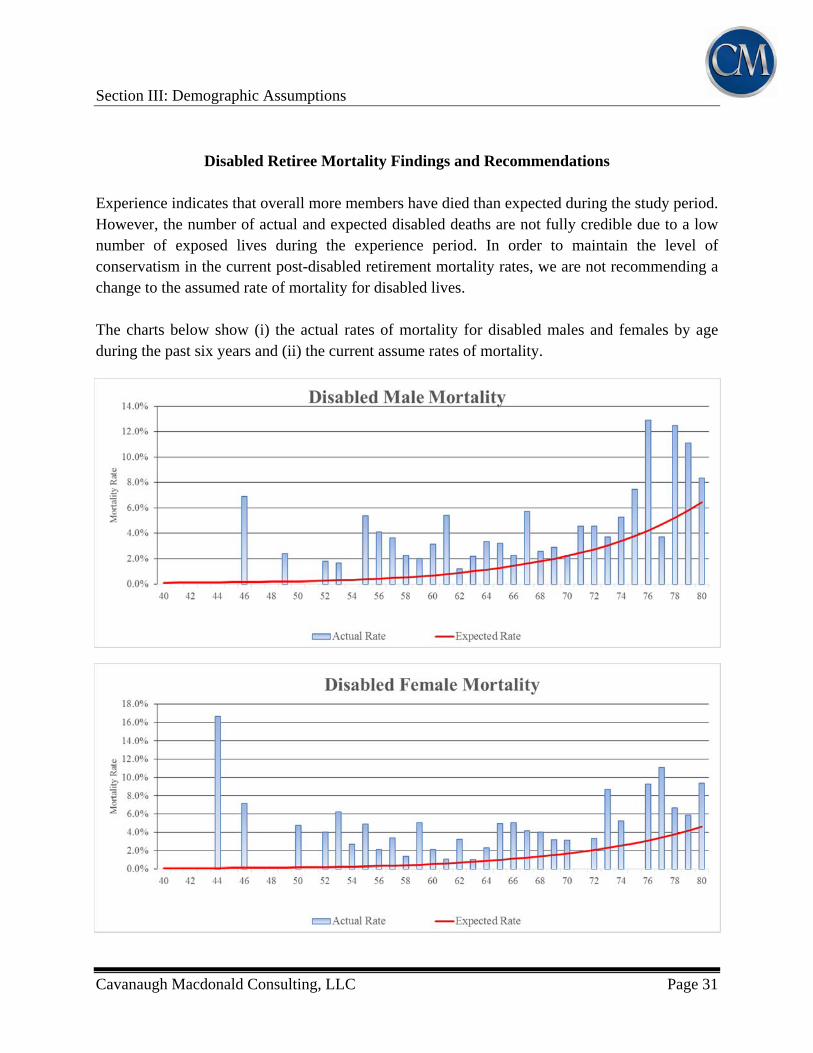
Disabled Retiree Mortality Findings and Recommendations
Experience indicates that overall more members have died than expected during the study period. However, the number of actual and expected disabled deaths are not fully credible due to a low number of exposed lives during the experience period. In order to maintain the level of conservatism in the current post-disabled retirement mortality rates, we are not recommending a change to the assumed rate of mortality for disabled lives. The charts below show (i) the actual rates of mortality for disabled males and females by age during the past six years and (ii) the current assume rates of mortality.
Section III: Demographic Assumptions
Cavanaugh Macdonald Consulting, LLC Page 32
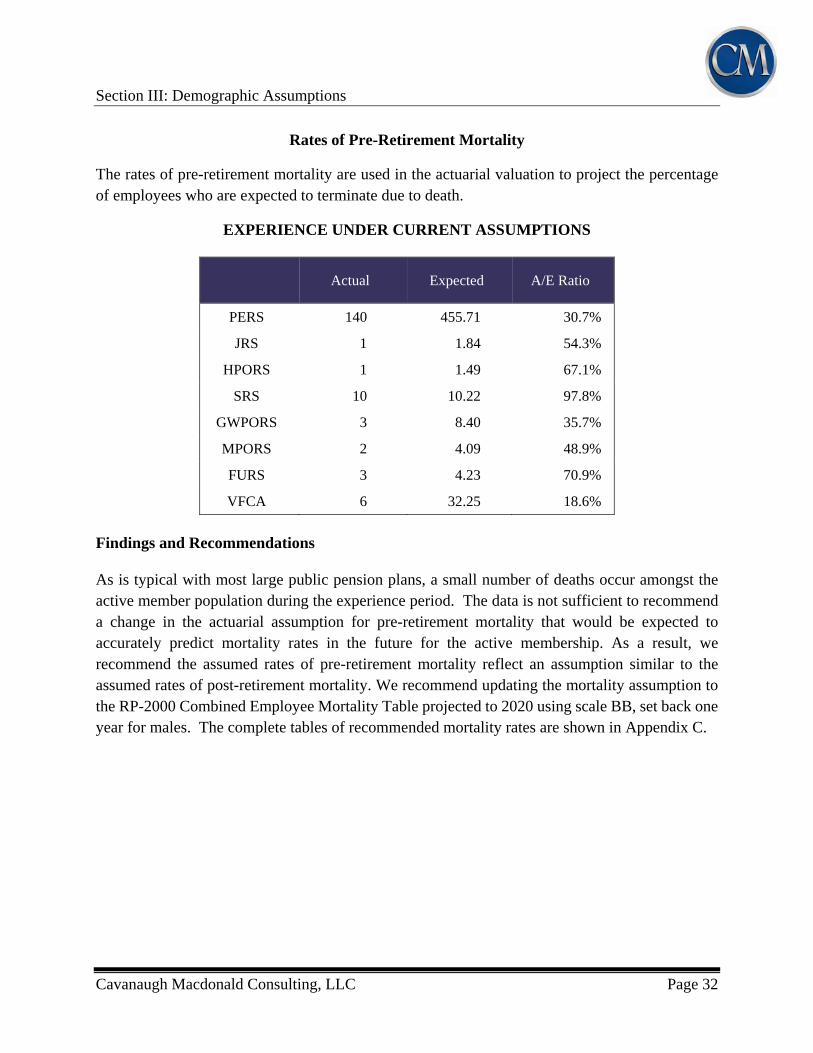
Rates of Pre-Retirement Mortality
The rates of pre-retirement mortality are used in the actuarial valuation to project the percentage of employees who are expected to terminate due to death.
EXPERIENCE UNDER CURRENT ASSUMPTIONS
Actual Expected A/E Ratio
PERS 140 455.71 30.7%
JRS 1 1.84 54.3%
HPORS 1 1.49 67.1%
SRS 10 10.22 97.8%
GWPORS 3 8.40 35.7%
MPORS 2 4.09 48.9%
FURS 3 4.23 70.9%
VFCA 6 32.25 18.6%
Findings and Recommendations As is typical with most large public pension plans, a small number of deaths occur amongst the active member population during the experience period. The data is not sufficient to recommend a change in the actuarial assumption for pre-retirement mortality that would be expected to accurately predict mortality rates in the future for the active membership. As a result, we recommend the assumed rates of pre-retirement mortality reflect an assumption similar to the assumed rates of post-retirement mortality. We recommend updating the mortality assumption to the RP-2000 Combined Employee Mortality Table projected to 2020 using scale BB, set back one year for males. The complete tables of recommended mortality rates are shown in Appendix C.
Section III: Demographic Assumptions
Cavanaugh Macdonald Consulting, LLC Page 33
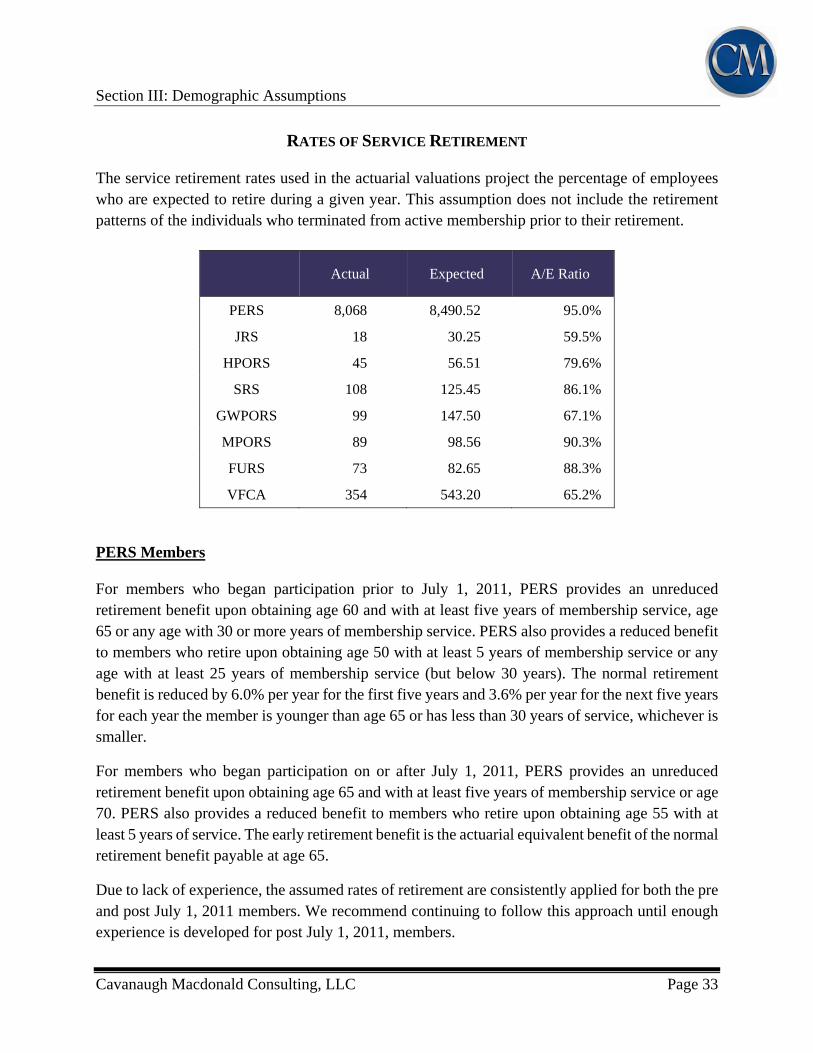
RATES OF SERVICE RETIREMENT The service retirement rates used in the actuarial valuations project the percentage of employees who are expected to retire during a given year. This assumption does not include the retirement patterns of the individuals who terminated from active membership prior to their retirement.
Actual Expected A/E Ratio
PERS 8,068 8,490.52 95.0%
JRS 18 30.25 59.5%
HPORS 45 56.51 79.6%
SRS 108 125.45 86.1%
GWPORS 99 147.50 67.1%
MPORS 89 98.56 90.3%
FURS 73 82.65 88.3%
VFCA 354 543.20 65.2%
PERS Members For members who began participation prior to July 1, 2011, PERS provides an unreduced retirement benefit upon obtaining age 60 and with at least five years of membership service, age 65 or any age with 30 or more years of membership service. PERS also provides a reduced benefit to members who retire upon obtaining age 50 with at least 5 years of membership service or any age with at least 25 years of membership service (but below 30 years). The normal retirement benefit is reduced by 6.0% per year for the first five years and 3.6% per year for the next five years for each year the member is younger than age 65 or has less than 30 years of service, whichever is smaller.
For members who began participation on or after July 1, 2011, PERS provides an unreduced retirement benefit upon obtaining age 65 and with at least five years of membership service or age 70. PERS also provides a reduced benefit to members who retire upon obtaining age 55 with at least 5 years of service. The early retirement benefit is the actuarial equivalent benefit of the normal retirement benefit payable at age 65.
Due to lack of experience, the assumed rates of retirement are consistently applied for both the pre and post July 1, 2011 members. We recommend continuing to follow this approach until enough experience is developed for post July 1, 2011, members.
Section III: Demographic Assumptions
Cavanaugh Macdonald Consulting, LLC Page 34
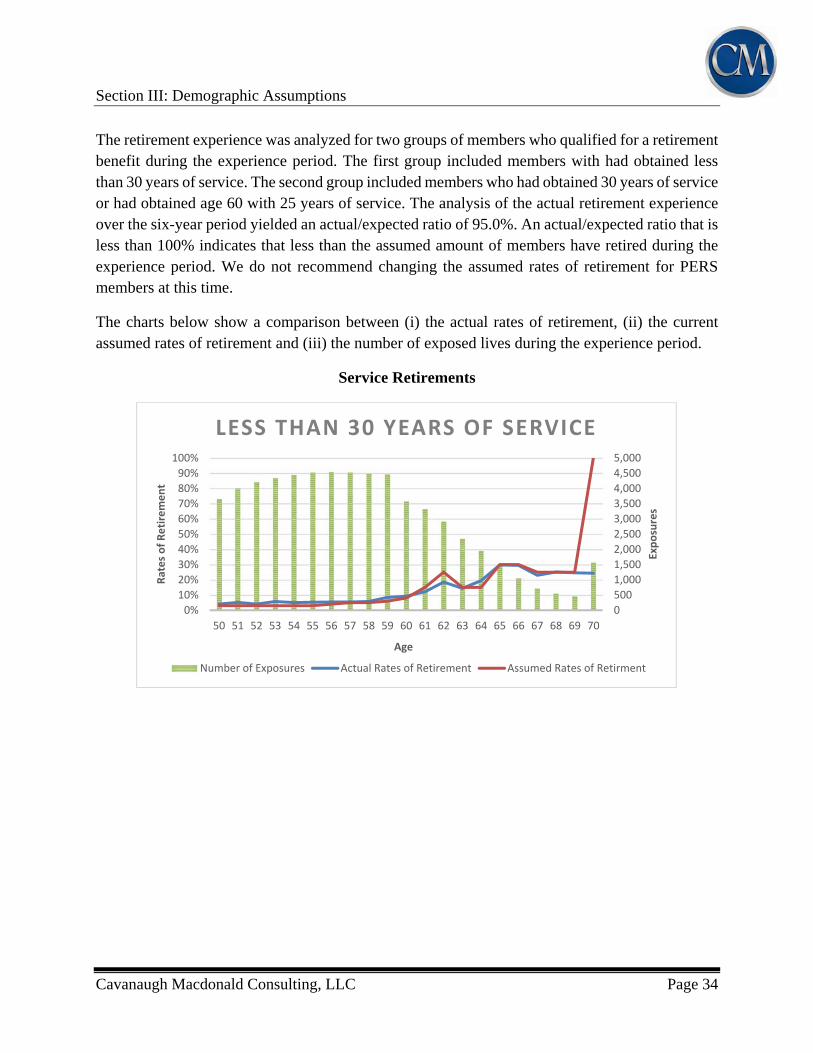
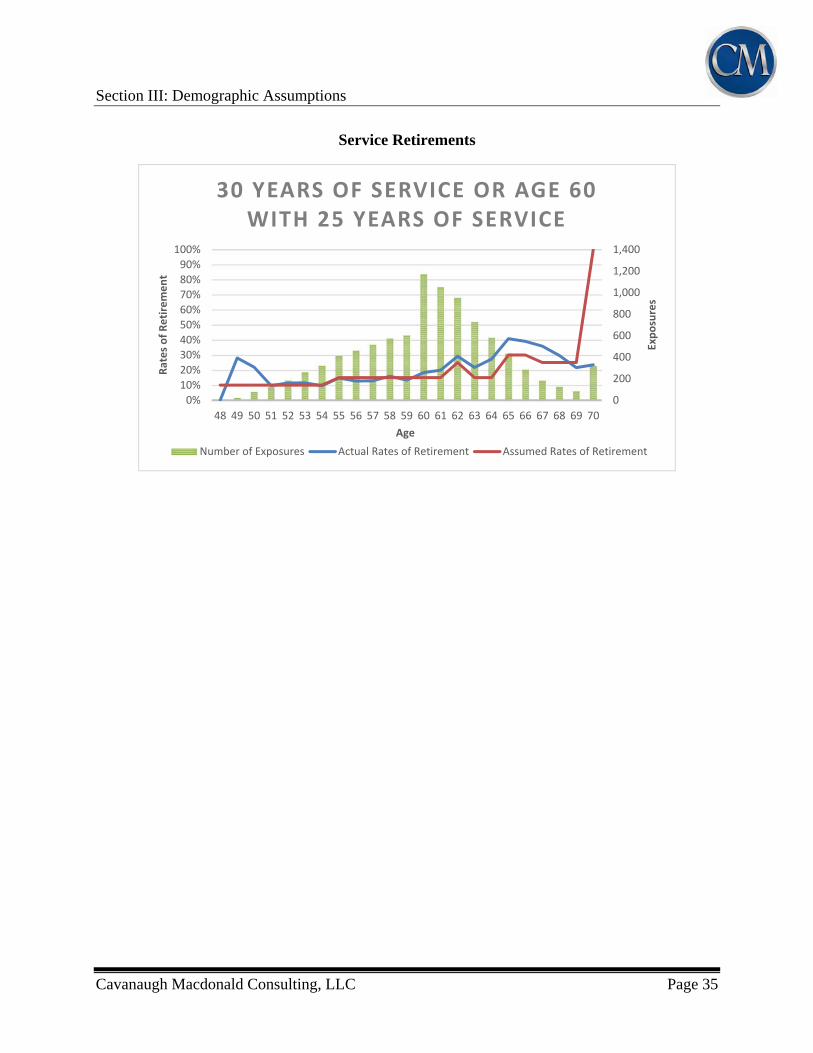
The retirement experience was analyzed for two groups of members who qualified for a retirement benefit during the experience period. The first group included members with had obtained less than 30 years of service. The second group included members who had obtained 30 years of service or had obtained age 60 with 25 years of service. The analysis of the actual retirement experience over the six-year period yielded an actual/expected ratio of 95.0%. An actual/expected ratio that is less than 100% indicates that less than the assumed amount of members have retired during the experience period. We do not recommend changing the assumed rates of retirement for PERS members at this time.
The charts below show a comparison between (i) the actual rates of retirement, (ii) the current assumed rates of retirement and (iii) the number of exposed lives during the experience period.
Service Retirements
0
500
1,000
1,500
2,000
2,500
3,000
3,500
4,000
4,500
5,000
0%
10%
20%
30%
40%
50%
60%
70%
80%
90%
100%
50 51 52 53 54 55 56 57 58 59 60 61 62 63 64 65 66 67 68 69 70
Exposures
Rates of Retirement
Age
LESS THAN 30 YEARS OF SERVICE
Number of Exposures Actual Rates of Retirement Assumed Rates of Retirment
Section III: Demographic Assumptions
Cavanaugh Macdonald Consulting, LLC Page 35
Service Retirements
0
200
400
600
800
1,000
1,200
1,400
0%
10%
20%
30%
40%
50%
60%
70%
80%
90%
100%
48 49 50 51 52 53 54 55 56 57 58 59 60 61 62 63 64 65 66 67 68 69 70
Exposures
Rates of Retirement
Age
30 YEARS OF SERVICE OR AGE 60 WITH 25 YEARS OF SERVICE
Number of Exposures Actual Rates of Retirement Assumed Rates of Retirement
Section III: Demographic Assumptions
Cavanaugh Macdonald Consulting, LLC Page 36
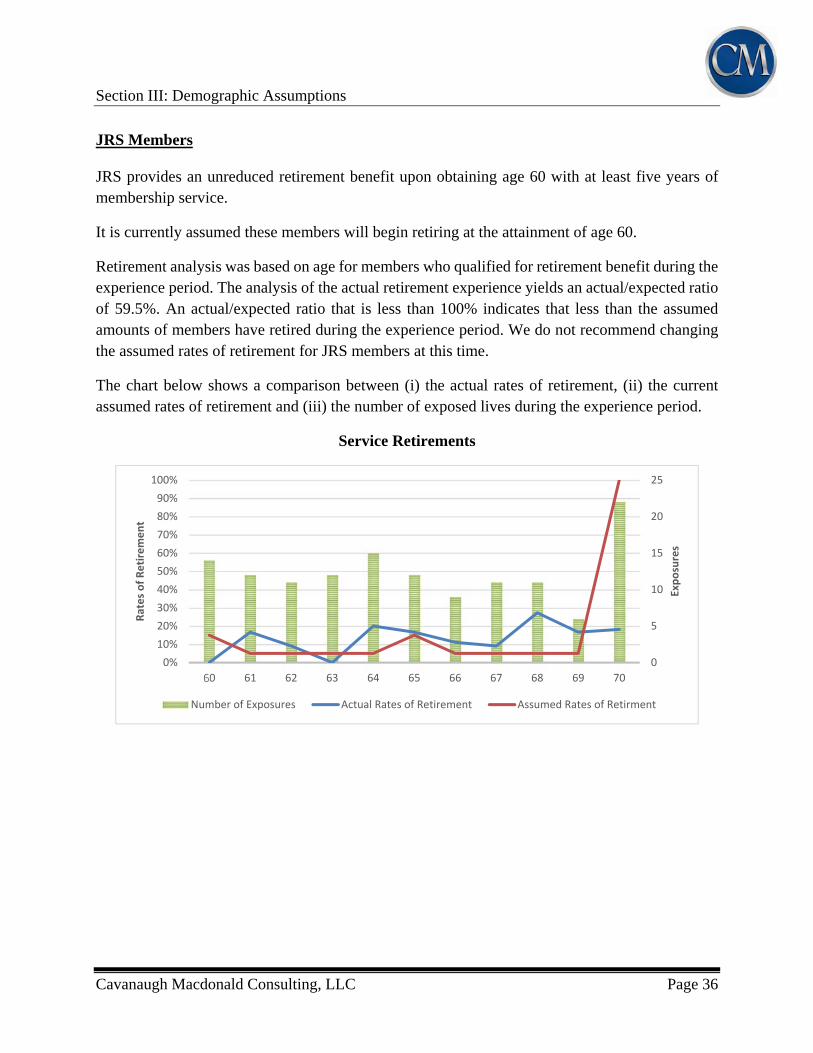
JRS Members JRS provides an unreduced retirement benefit upon obtaining age 60 with at least five years of membership service.
It is currently assumed these members will begin retiring at the attainment of age 60.
Retirement analysis was based on age for members who qualified for retirement benefit during the experience period. The analysis of the actual retirement experience yields an actual/expected ratio of 59.5%. An actual/expected ratio that is less than 100% indicates that less than the assumed amounts of members have retired during the experience period. We do not recommend changing the assumed rates of retirement for JRS members at this time.
The chart below shows a comparison between (i) the actual rates of retirement, (ii) the current assumed rates of retirement and (iii) the number of exposed lives during the experience period.
Service Retirements
0
5
10
15
20
25
0%
10%
20%
30%
40%
50%
60%
70%
80%
90%
100%
60 61 62 63 64 65 66 67 68 69 70Exposures
Rates of Retirement
Number of Exposures Actual Rates of Retirement Assumed Rates of Retirment

Section III: Demographic Assumptions
Cavanaugh Macdonald Consulting, LLC Page 37
HPORS Members HPORS provides an unreduced retirement benefit upon the completion of 20 years of membership service. HPORS also provides actuarially reduced benefits (from age 60) to members hired before July 1, 2013 who retire before reaching normal retirement age with at least five years of membership service, as well as to members hired after July 1, 2013 who retire before reaching normal retirement age with at least 10 years of membership service.
It is currently assumed that HPORS members will begin retiring upon obtaining any age with 20 years of membership service or upon obtaining age 60 and 5 years of service.
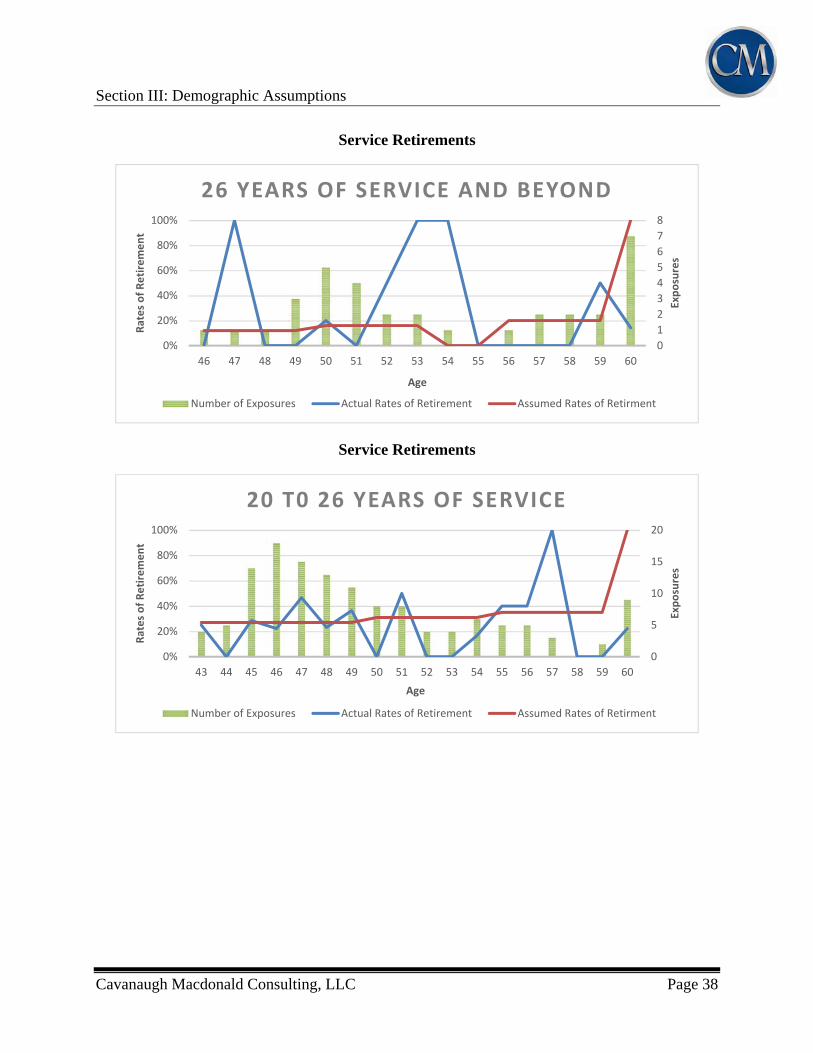
HPORS includes a Deferred Retirement Option Plan (DROP). A member is eligible to enter the DROP upon obtaining 20 years of service. The DROP allows active members to accumulate their retirement benefit with interest while continuing to remain employed for up to 60 months. If a member chooses the DROP, the DROP member’s monthly retirement benefit along with the required member contributions are accumulated in a hypothetical DROP account. Upon exiting the DROP, the member will begin receiving directly, their monthly retirement allowance, which was determined on the date they entered the DROP and will receive their DROP account balance accumulated with interest as a lump sum. The assumed rates of retirement are increased for members with 20 up to 26 years of service to account for members choosing to enter the DROP.
The retirement experience was analyzed for two groups of members who qualified for an unreduced retirement benefit during the experience period. The first group included members with 20 up to 26 years of service and the second group has member with 26 or more years of service. The analysis of the actual retirement experience yields an actual/expected ratio of 79.6%. An actual/expected ratio less than 100% indicates that the current assumption for retirements overestimated the number of retirements during the experience period. We do not recommend changing the assumed rates of retirement for HPORS members at this time.
The charts below show a comparison between (i) the actual rates of retirement, (ii) the current assumed rates of retirement and (iii) the number of exposed lives during the experience period.
Section III: Demographic Assumptions
Cavanaugh Macdonald Consulting, LLC Page 38
Service Retirements
Service Retirements
0
1
2
3
4
5
6
7
8
0%
20%
40%
60%
80%
100%
46 47 48 49 50 51 52 53 54 55 56 57 58 59 60
Exposures
Rates of Retirement
Age
26 YEARS OF SERVICE AND BEYOND
Number of Exposures Actual Rates of Retirement Assumed Rates of Retirment
0
5
10
15
20
0%
20%
40%
60%
80%
100%
43 44 45 46 47 48 49 50 51 52 53 54 55 56 57 58 59 60Exposures
Rates of Retirement
Age
20 T0 26 YEARS OF SERVICE
Number of Exposures Actual Rates of Retirement Assumed Rates of Retirment
Section III: Demographic Assumptions
Cavanaugh Macdonald Consulting, LLC Page 39
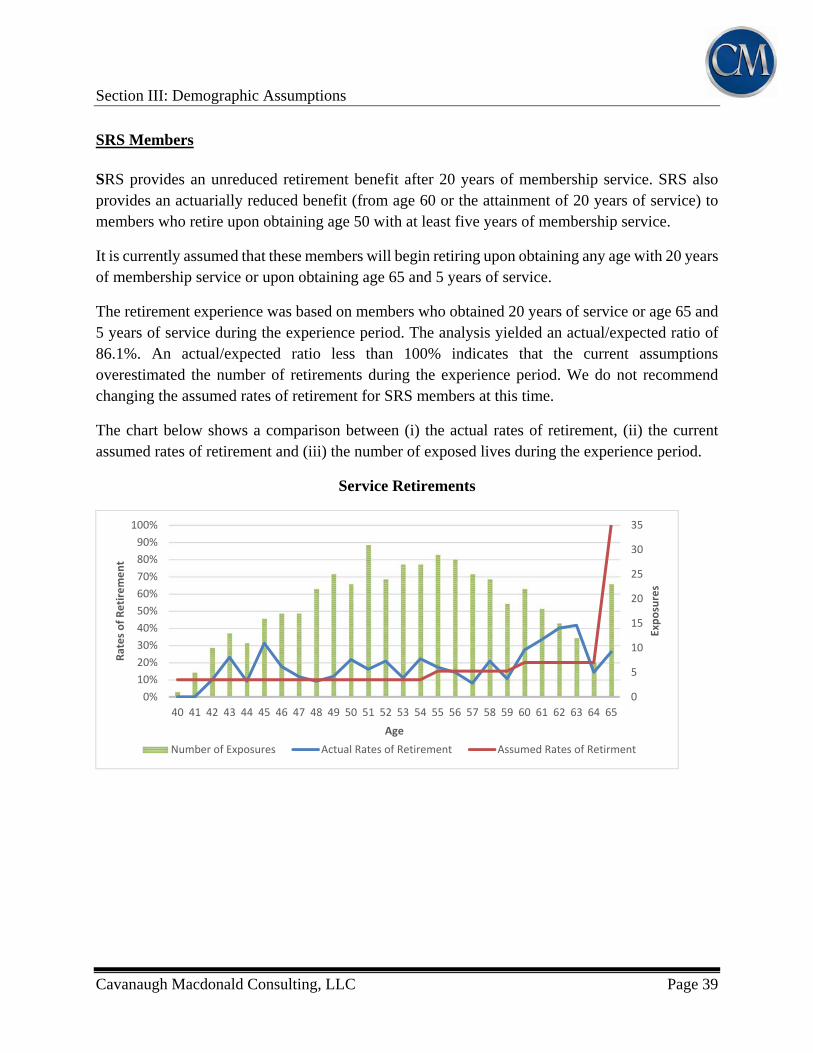
SRS Members SRS provides an unreduced retirement benefit after 20 years of membership service. SRS also provides an actuarially reduced benefit (from age 60 or the attainment of 20 years of service) to members who retire upon obtaining age 50 with at least five years of membership service.
It is currently assumed that these members will begin retiring upon obtaining any age with 20 years of membership service or upon obtaining age 65 and 5 years of service.
The retirement experience was based on members who obtained 20 years of service or age 65 and 5 years of service during the experience period. The analysis yielded an actual/expected ratio of 86.1%. An actual/expected ratio less than 100% indicates that the current assumptions overestimated the number of retirements during the experience period. We do not recommend changing the assumed rates of retirement for SRS members at this time.
The chart below shows a comparison between (i) the actual rates of retirement, (ii) the current assumed rates of retirement and (iii) the number of exposed lives during the experience period.
Service Retirements
0
5
10
15
20
25
30
35
0%
10%
20%
30%
40%
50%
60%
70%
80%
90%
100%
40 41 42 43 44 45 46 47 48 49 50 51 52 53 54 55 56 57 58 59 60 61 62 63 64 65
Exposures
Rates of Retirement
Age
Number of Exposures Actual Rates of Retirement Assumed Rates of Retirment
Section III: Demographic Assumptions
Cavanaugh Macdonald Consulting, LLC Page 40
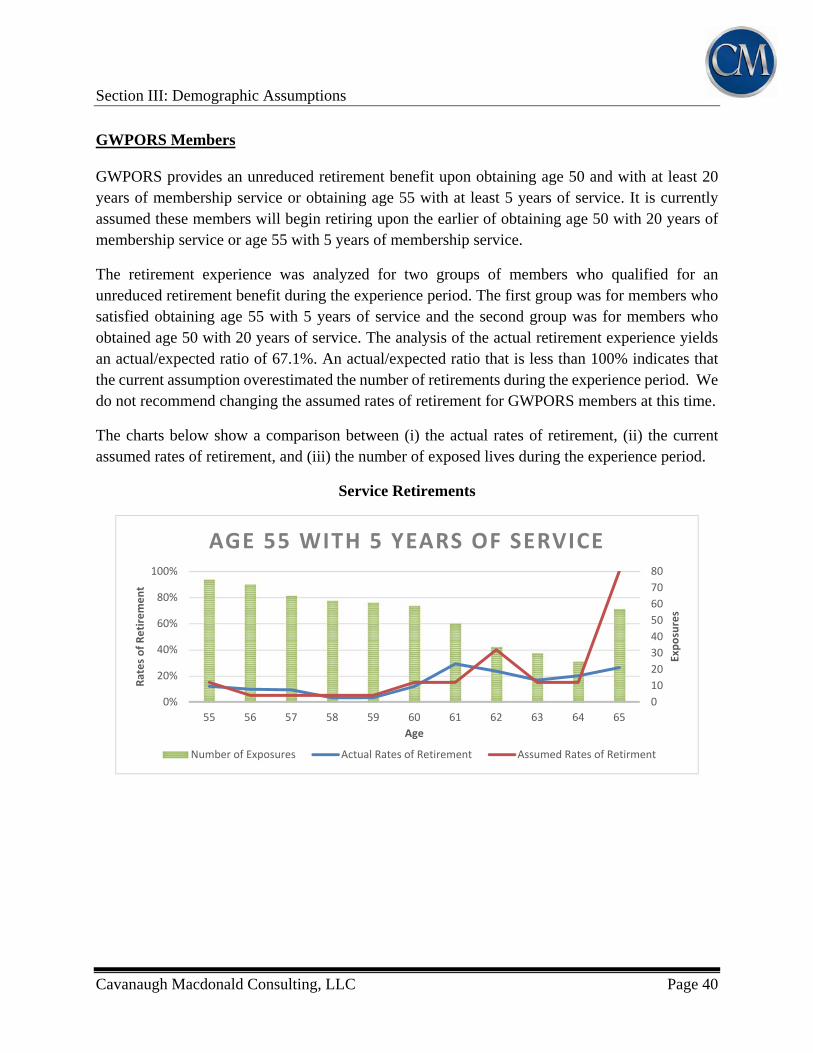
GWPORS Members GWPORS provides an unreduced retirement benefit upon obtaining age 50 and with at least 20 years of membership service or obtaining age 55 with at least 5 years of service. It is currently assumed these members will begin retiring upon the earlier of obtaining age 50 with 20 years of membership service or age 55 with 5 years of membership service.
The retirement experience was analyzed for two groups of members who qualified for an unreduced retirement benefit during the experience period. The first group was for members who satisfied obtaining age 55 with 5 years of service and the second group was for members who obtained age 50 with 20 years of service. The analysis of the actual retirement experience yields an actual/expected ratio of 67.1%. An actual/expected ratio that is less than 100% indicates that the current assumption overestimated the number of retirements during the experience period. We do not recommend changing the assumed rates of retirement for GWPORS members at this time.
The charts below show a comparison between (i) the actual rates of retirement, (ii) the current assumed rates of retirement, and (iii) the number of exposed lives during the experience period.
Service Retirements
0
10
20
30
40
50
60
70
80
0%
20%
40%
60%
80%
100%
55 56 57 58 59 60 61 62 63 64 65
Exposures
Rates of Retirement
Age
AGE 55 WITH 5 YEARS OF SERVICE
Number of Exposures Actual Rates of Retirement Assumed Rates of Retirment
Section III: Demographic Assumptions
Cavanaugh Macdonald Consulting, LLC Page 41
Service Retirements
0
5
10
15
20
0%
20%
40%
60%
80%
100%
50 51 52 53 54 55 56 57 58 59 60 61 62 63 64 65
Exposures
Rates of Retirement
Age
AGE 50 WITH 20 YEARS OF SERVICE
Number of Exposures Actual Rates of Retirement Assumed Rates of Retirment
Section III: Demographic Assumptions
Cavanaugh Macdonald Consulting, LLC Page 42
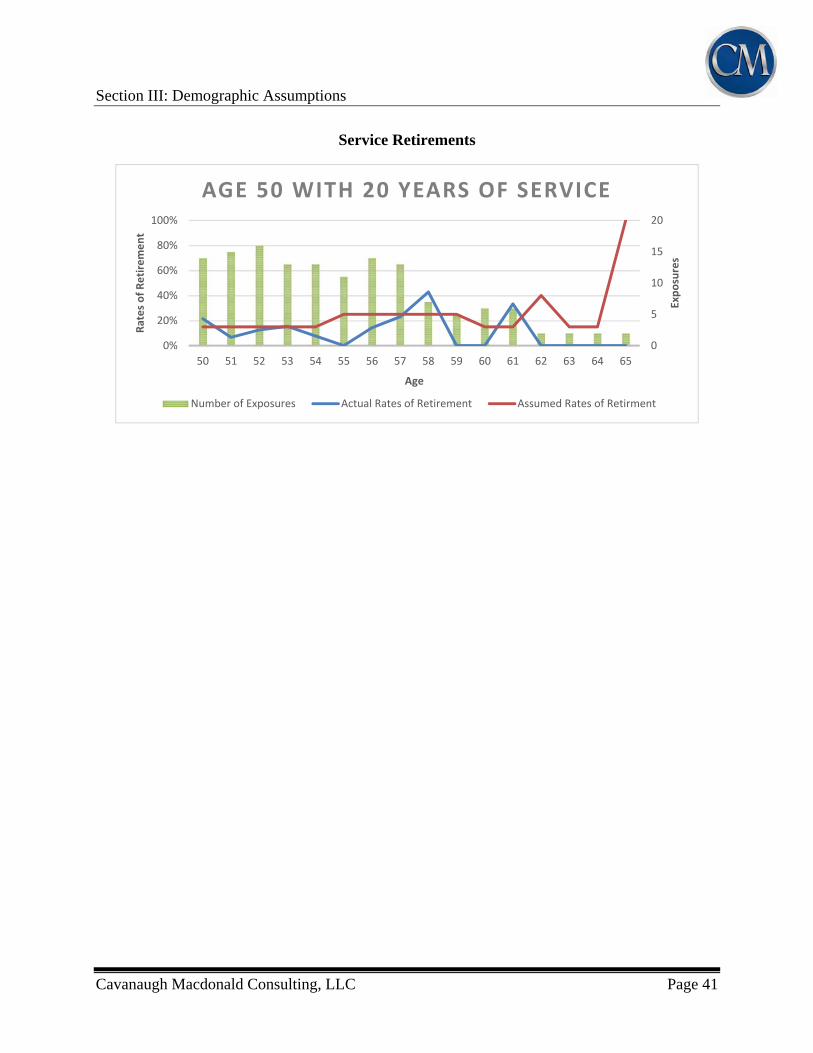
MPORS Members MPORS provides an unreduced retirement benefit upon obtaining age 50 and with at least 5 years of membership service or any age with at least 20 years of membership service. It is currently assumed these members will begin retiring upon the earlier of obtaining 20 years of membership service, regardless of age, or age 65 with at least 5 years of service.
MPORS includes a Deferred Retirement Option Plan (DROP). A member is eligible to enter the DROP upon obtaining 20 years of service. The DROP allows active members to accumulate their retirement benefit with interest while continuing to remain employed for up to 60 months. If a member chooses the DROP, the DROP member’s monthly retirement benefit, including cost-of-living increases, are accumulated in a hypothetical DROP account. Upon exiting the DROP, the member will begin receiving directly, their monthly retirement allowance which was determined on the date they entered the DROP, including increases for cost-of-living adjustments, and will receive their DROP account balance accumulated with interest as a lump sum. The assumed rates of retirement are increased for 20 up to 26 years of service to account for members choosing to enter the DROP.
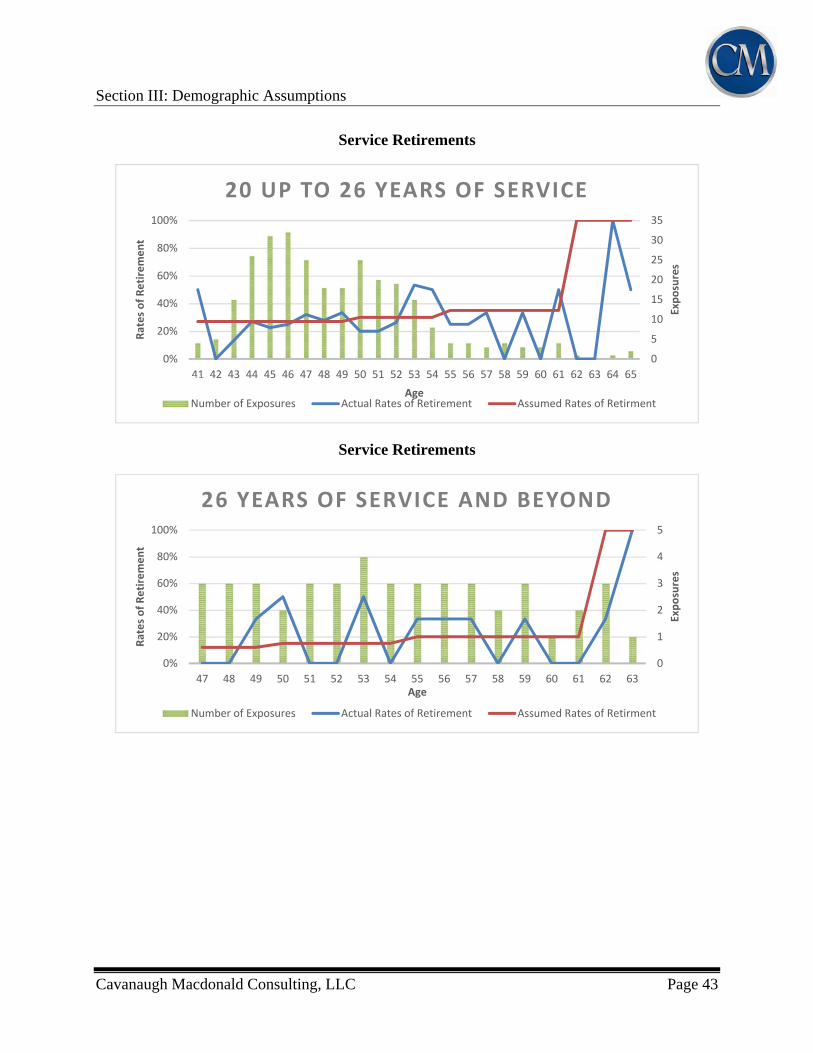
The retirement experience was analyzed for two groups of members who qualified for an unreduced retirement benefit during the experience period. The first group included members with 20 up to 26 years of service and the second group included those members with 26 years of service and beyond for being eligible for a retirement benefit. The analysis of the actual retirement experience yields an actual/expected ratio of 90.3%. An actual/expected ratio less than 100% indicates that the current assumption overestimated the number of retirements during the experience period. We do not recommend changing the assumed rates of retirement for MPORS members at this time.
The charts below show a comparison between (i) the actual rates of retirement, (ii) the current assumed rates of retirement and (iii) the number of exposed lives during the experience period.
Section III: Demographic Assumptions
Cavanaugh Macdonald Consulting, LLC Page 43
Service Retirements
Service Retirements
0
5
10
15
20
25
30
35
0%
20%
40%
60%
80%
100%
41 42 43 44 45 46 47 48 49 50 51 52 53 54 55 56 57 58 59 60 61 62 63 64 65
Exposures
Rates of Retirement
Age
20 UP TO 26 YEARS OF SERVICE
Number of Exposures Actual Rates of Retirement Assumed Rates of Retirment
0
1
2
3
4
5
0%
20%
40%
60%
80%
100%
47 48 49 50 51 52 53 54 55 56 57 58 59 60 61 62 63Exposures
Rates of Retirement
Age
26 YEARS OF SERVICE AND BEYOND
Number of Exposures Actual Rates of Retirement Assumed Rates of Retirment
Section III: Demographic Assumptions
Cavanaugh Macdonald Consulting, LLC Page 44
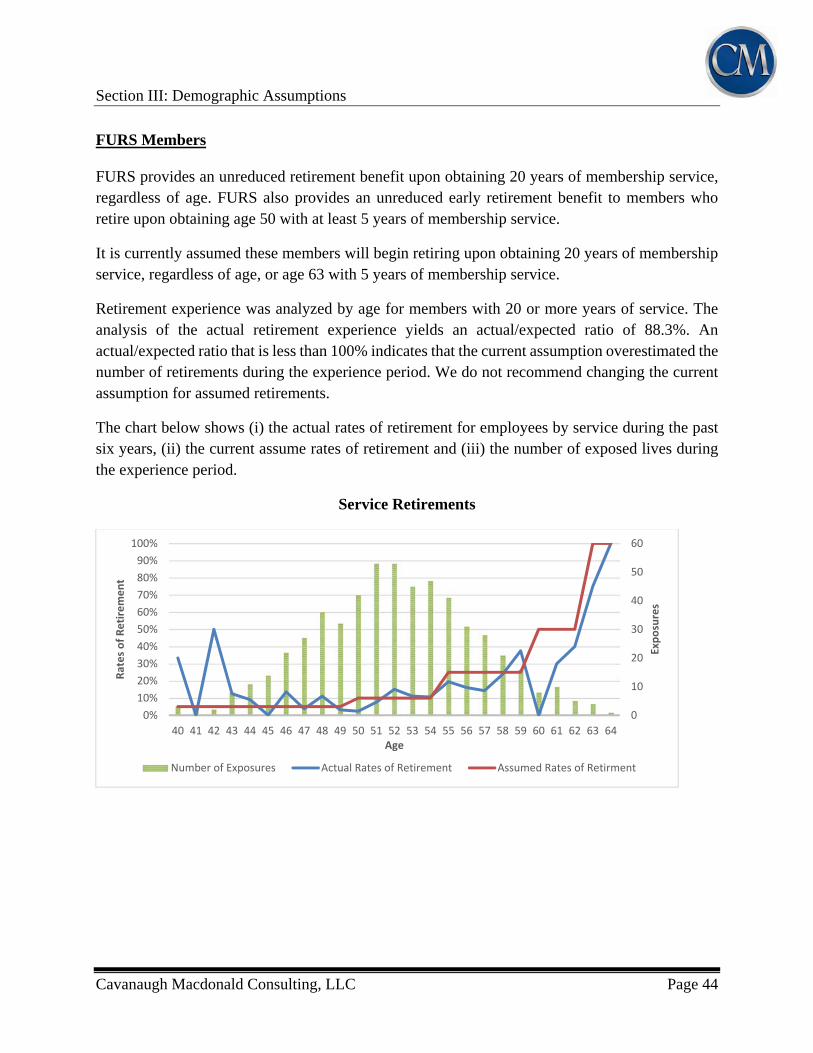
FURS Members FURS provides an unreduced retirement benefit upon obtaining 20 years of membership service, regardless of age. FURS also provides an unreduced early retirement benefit to members who retire upon obtaining age 50 with at least 5 years of membership service.
It is currently assumed these members will begin retiring upon obtaining 20 years of membership service, regardless of age, or age 63 with 5 years of membership service.
Retirement experience was analyzed by age for members with 20 or more years of service. The analysis of the actual retirement experience yields an actual/expected ratio of 88.3%. An actual/expected ratio that is less than 100% indicates that the current assumption overestimated the number of retirements during the experience period. We do not recommend changing the current assumption for assumed retirements.
The chart below shows (i) the actual rates of retirement for employees by service during the past six years, (ii) the current assume rates of retirement and (iii) the number of exposed lives during the experience period.
Service Retirements
0
10
20
30
40
50
60
0%
10%
20%
30%
40%
50%
60%
70%
80%
90%
100%
40 41 42 43 44 45 46 47 48 49 50 51 52 53 54 55 56 57 58 59 60 61 62 63 64
Exposures
Rates of Retirement
Age
Number of Exposures Actual Rates of Retirement Assumed Rates of Retirment
Section III: Demographic Assumptions
Cavanaugh Macdonald Consulting, LLC Page 45
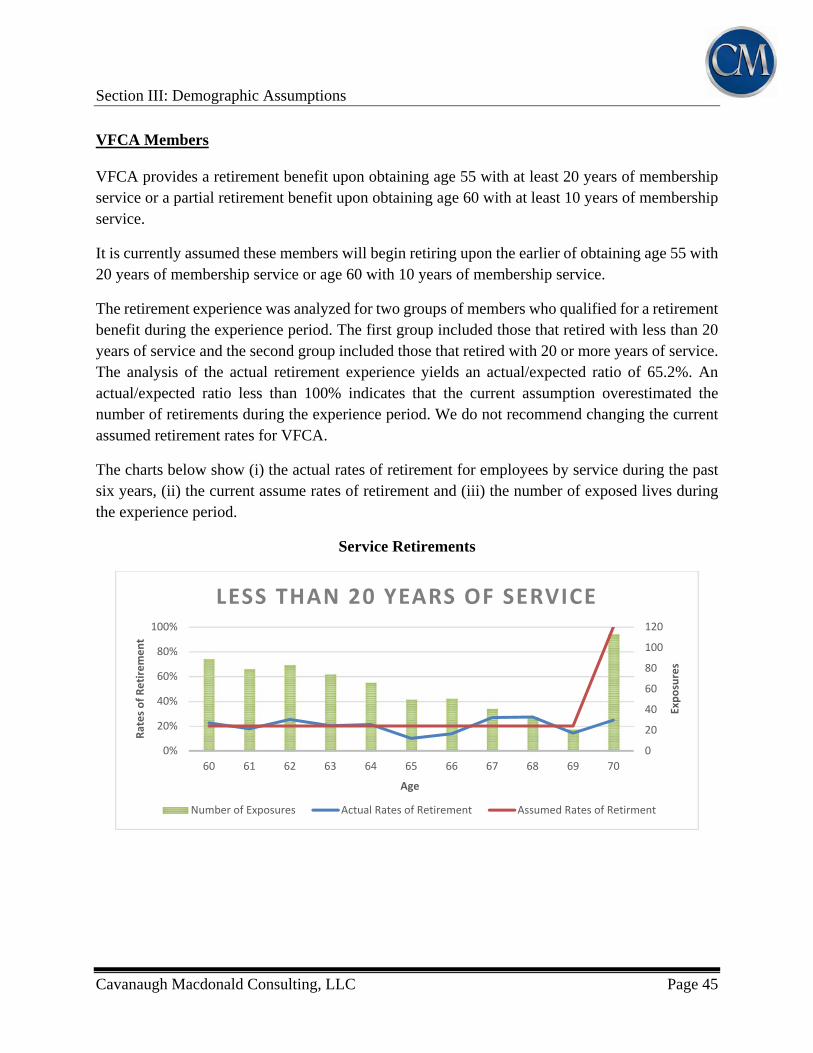
VFCA Members VFCA provides a retirement benefit upon obtaining age 55 with at least 20 years of membership service or a partial retirement benefit upon obtaining age 60 with at least 10 years of membership service.
It is currently assumed these members will begin retiring upon the earlier of obtaining age 55 with 20 years of membership service or age 60 with 10 years of membership service.
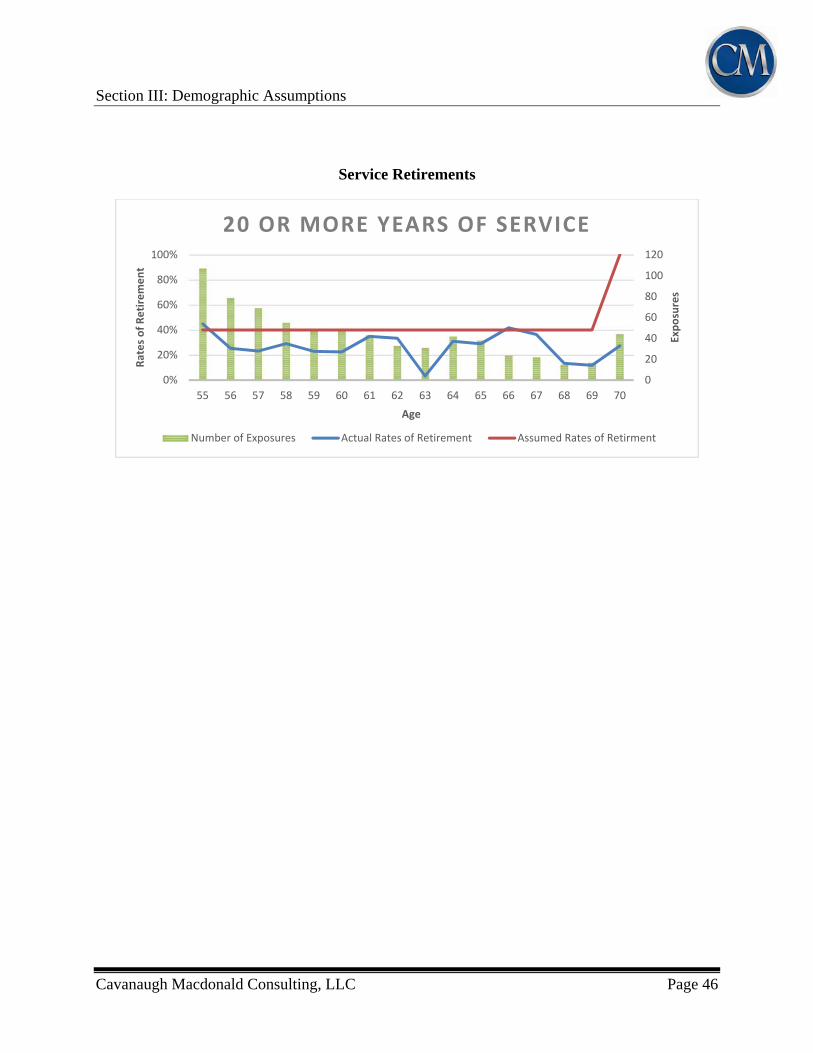
The retirement experience was analyzed for two groups of members who qualified for a retirement benefit during the experience period. The first group included those that retired with less than 20 years of service and the second group included those that retired with 20 or more years of service. The analysis of the actual retirement experience yields an actual/expected ratio of 65.2%. An actual/expected ratio less than 100% indicates that the current assumption overestimated the number of retirements during the experience period. We do not recommend changing the current assumed retirement rates for VFCA.
The charts below show (i) the actual rates of retirement for employees by service during the past six years, (ii) the current assume rates of retirement and (iii) the number of exposed lives during the experience period.
Service Retirements
0
20
40
60
80
100
120
0%
20%
40%
60%
80%
100%
60 61 62 63 64 65 66 67 68 69 70
Exposures
Rates of Retirement
Age
LESS THAN 20 YEARS OF SERVICE
Number of Exposures Actual Rates of Retirement Assumed Rates of Retirment
Section III: Demographic Assumptions
Cavanaugh Macdonald Consulting, LLC Page 46
Service Retirements
0
20
40
60
80
100
120
0%
20%
40%
60%
80%
100%
55 56 57 58 59 60 61 62 63 64 65 66 67 68 69 70
Exposures
Rates of Retirement
Age
20 OR MORE YEARS OF SERVICE
Number of Exposures Actual Rates of Retirement Assumed Rates of Retirment
Section III: Demographic Assumptions
Cavanaugh Macdonald Consulting, LLC Page 47
RATES OF DISABILITY RETIREMENT
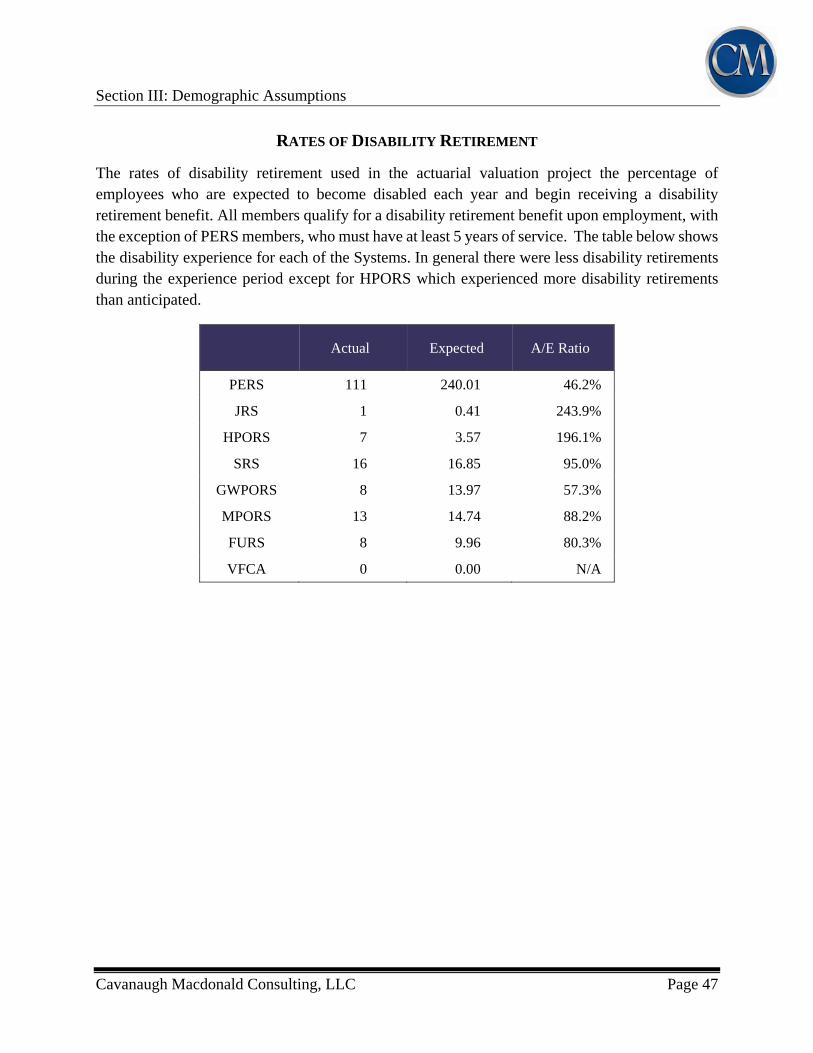
The rates of disability retirement used in the actuarial valuation project the percentage of employees who are expected to become disabled each year and begin receiving a disability retirement benefit. All members qualify for a disability retirement benefit upon employment, with the exception of PERS members, who must have at least 5 years of service. The table below shows the disability experience for each of the Systems. In general there were less disability retirements during the experience period except for HPORS which experienced more disability retirements than anticipated.
Actual Expected A/E Ratio
PERS 111 240.01 46.2%
JRS 1 0.41 243.9%
HPORS 7 3.57 196.1%
SRS 16 16.85 95.0%
GWPORS 8 13.97 57.3%
MPORS 13 14.74 88.2%
FURS 8 9.96 80.3%
VFCA 0 0.00 N/A
Section III: Demographic Assumptions
Cavanaugh Macdonald Consulting, LLC Page 48
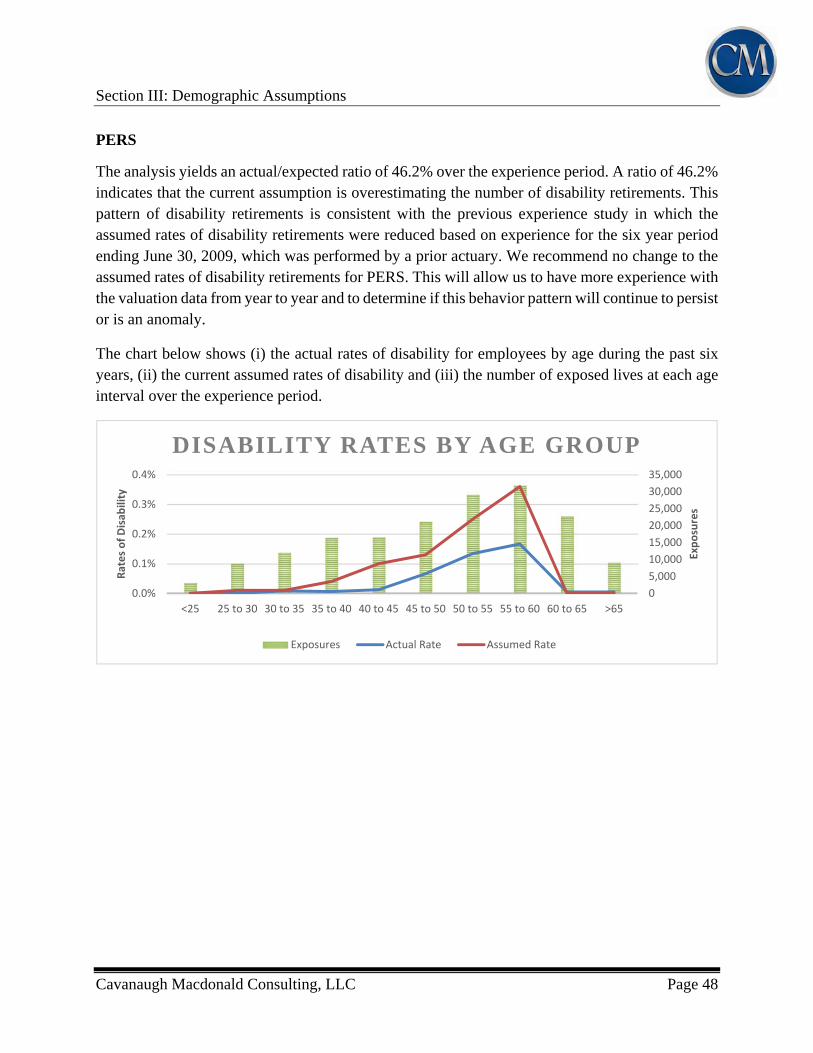
PERS
The analysis yields an actual/expected ratio of 46.2% over the experience period. A ratio of 46.2% indicates that the current assumption is overestimating the number of disability retirements. This pattern of disability retirements is consistent with the previous experience study in which the assumed rates of disability retirements were reduced based on experience for the six year period ending June 30, 2009, which was performed by a prior actuary. We recommend no change to the assumed rates of disability retirements for PERS. This will allow us to have more experience with the valuation data from year to year and to determine if this behavior pattern will continue to persist or is an anomaly.
The chart below shows (i) the actual rates of disability for employees by age during the past six years, (ii) the current assumed rates of disability and (iii) the number of exposed lives at each age interval over the experience period.
0
5,000
10,000
15,000
20,000
25,000
30,000
35,000
0.0%
0.1%
0.2%
0.3%
0.4%
<25 25 to 30 30 to 35 35 to 40 40 to 45 45 to 50 50 to 55 55 to 60 60 to 65 >65
Exposures
Rates of Disab
ility
DISABILITY RATES BY AGE GROUP
Exposures Actual Rate Assumed Rate
Section III: Demographic Assumptions
Cavanaugh Macdonald Consulting, LLC Page 49
JRS Members
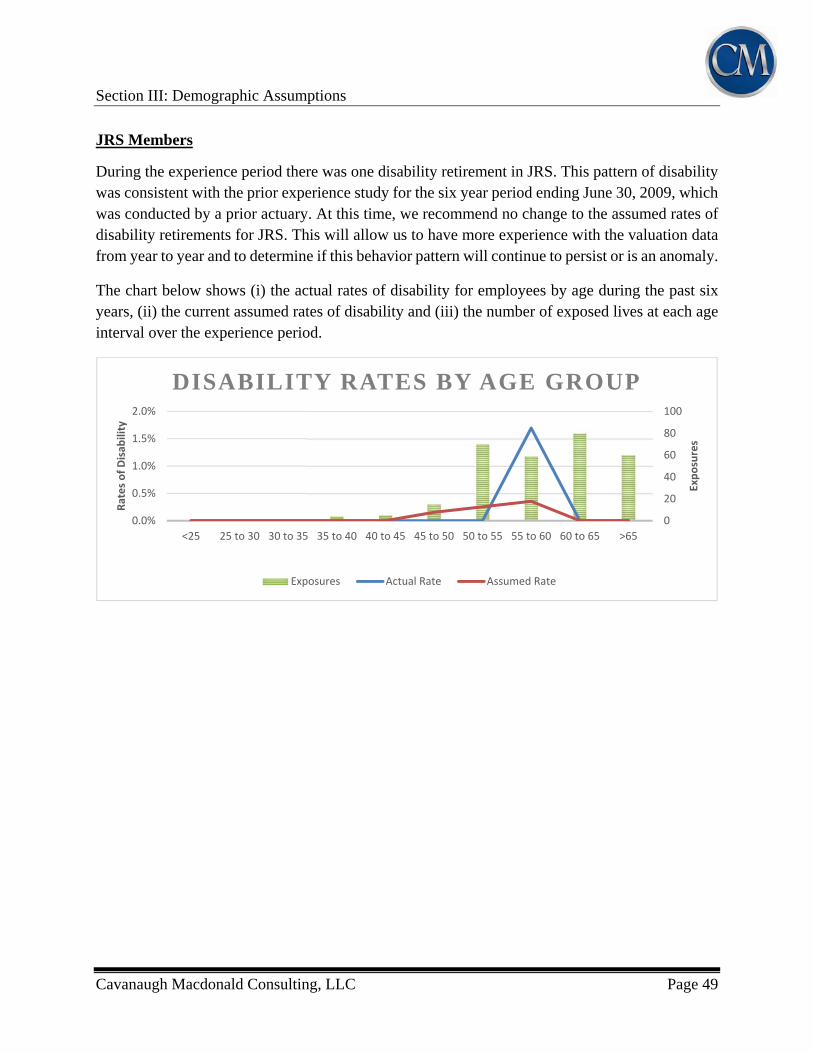
During the experience period there was one disability retirement in JRS. This pattern of disability was consistent with the prior experience study for the six year period ending June 30, 2009, which was conducted by a prior actuary. At this time, we recommend no change to the assumed rates of disability retirements for JRS. This will allow us to have more experience with the valuation data from year to year and to determine if this behavior pattern will continue to persist or is an anomaly.
The chart below shows (i) the actual rates of disability for employees by age during the past six years, (ii) the current assumed rates of disability and (iii) the number of exposed lives at each age interval over the experience period.
0
20
40
60
80
100
0.0%
0.5%
1.0%
1.5%
2.0%
<25 25 to 30 30 to 35 35 to 40 40 to 45 45 to 50 50 to 55 55 to 60 60 to 65 >65
Exposures
Rates of Disab
ility
DISABILITY RATES BY AGE GROUP
Exposures Actual Rate Assumed Rate
Section III: Demographic Assumptions
Cavanaugh Macdonald Consulting, LLC Page 50
HPORS Members
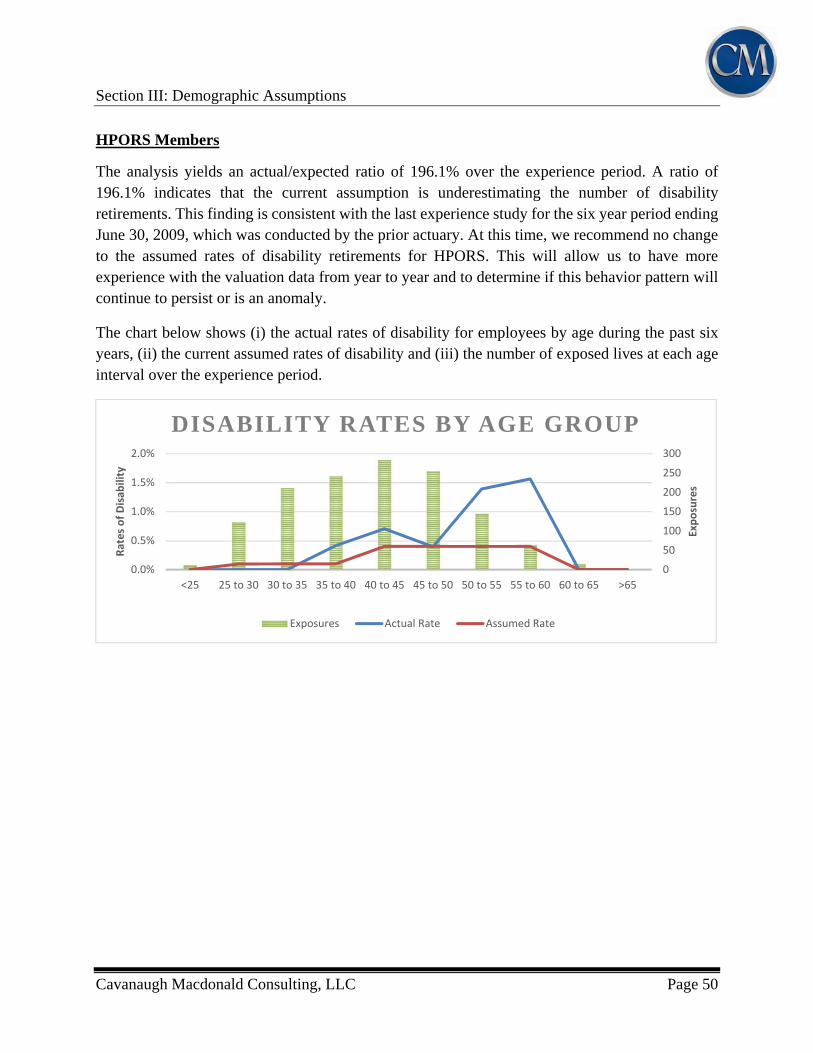
The analysis yields an actual/expected ratio of 196.1% over the experience period. A ratio of 196.1% indicates that the current assumption is underestimating the number of disability retirements. This finding is consistent with the last experience study for the six year period ending June 30, 2009, which was conducted by the prior actuary. At this time, we recommend no change to the assumed rates of disability retirements for HPORS. This will allow us to have more experience with the valuation data from year to year and to determine if this behavior pattern will continue to persist or is an anomaly.
The chart below shows (i) the actual rates of disability for employees by age during the past six years, (ii) the current assumed rates of disability and (iii) the number of exposed lives at each age interval over the experience period.
0
50
100
150
200
250
300
0.0%
0.5%
1.0%
1.5%
2.0%
<25 25 to 30 30 to 35 35 to 40 40 to 45 45 to 50 50 to 55 55 to 60 60 to 65 >65
Exposures
Rates of Disab
ility
DISABILITY RATES BY AGE GROUP
Exposures Actual Rate Assumed Rate
Section III: Demographic Assumptions
Cavanaugh Macdonald Consulting, LLC Page 51
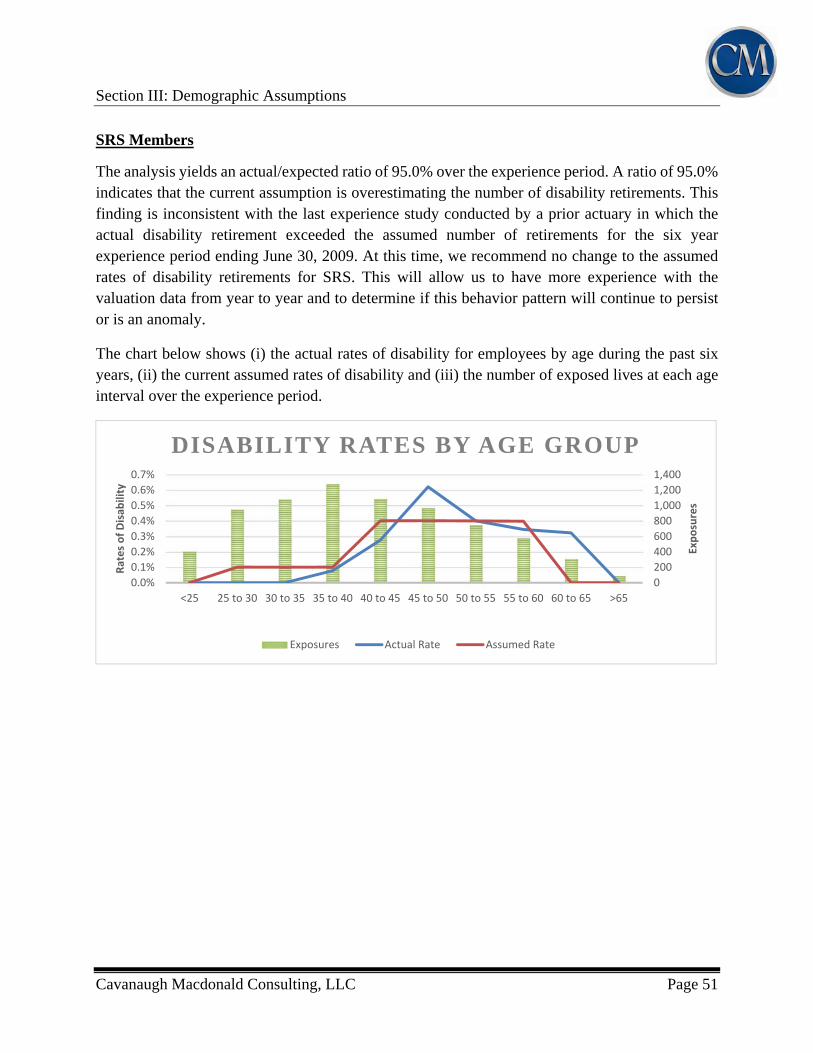
SRS Members
The analysis yields an actual/expected ratio of 95.0% over the experience period. A ratio of 95.0% indicates that the current assumption is overestimating the number of disability retirements. This finding is inconsistent with the last experience study conducted by a prior actuary in which the actual disability retirement exceeded the assumed number of retirements for the six year experience period ending June 30, 2009. At this time, we recommend no change to the assumed rates of disability retirements for SRS. This will allow us to have more experience with the valuation data from year to year and to determine if this behavior pattern will continue to persist or is an anomaly.
The chart below shows (i) the actual rates of disability for employees by age during the past six years, (ii) the current assumed rates of disability and (iii) the number of exposed lives at each age interval over the experience period.
0
200
400
600
800
1,000
1,200
1,400
0.0%
0.1%
0.2%
0.3%
0.4%
0.5%
0.6%
0.7%
<25 25 to 30 30 to 35 35 to 40 40 to 45 45 to 50 50 to 55 55 to 60 60 to 65 >65
Exposures
Rates of Disab
ility
DISABILITY RATES BY AGE GROUP
Exposures Actual Rate Assumed Rate
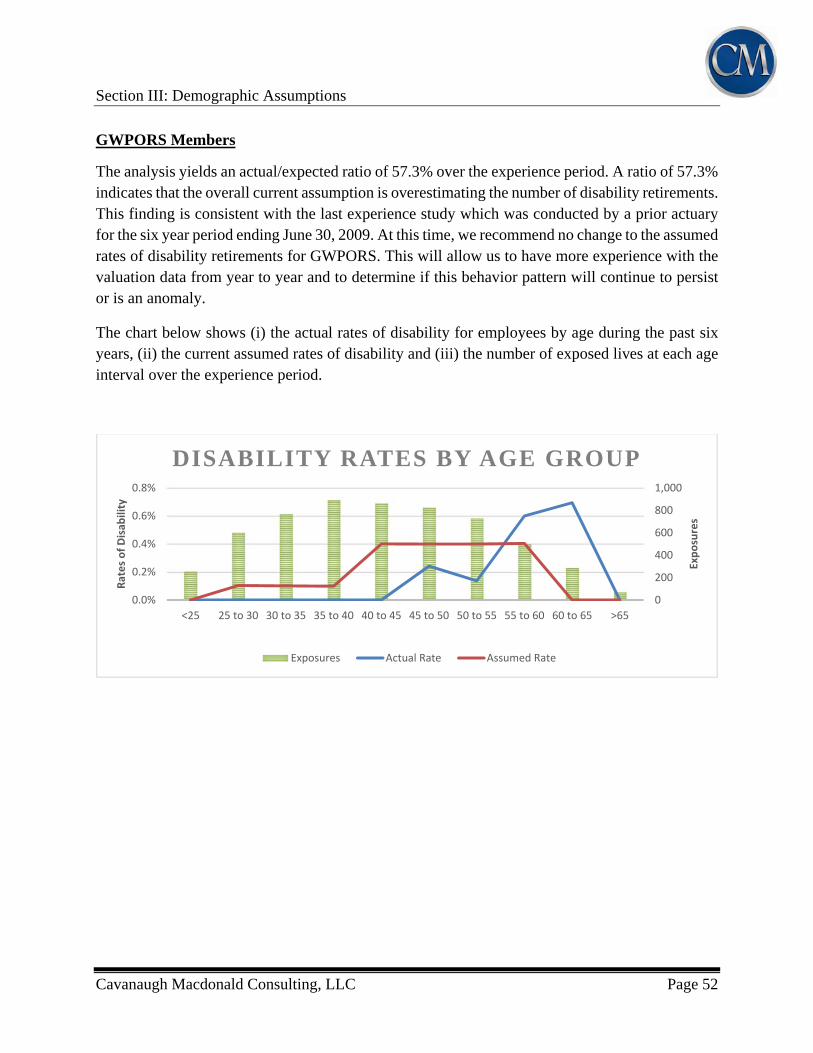
Section III: Demographic Assumptions
Cavanaugh Macdonald Consulting, LLC Page 52
GWPORS Members
The analysis yields an actual/expected ratio of 57.3% over the experience period. A ratio of 57.3% indicates that the overall current assumption is overestimating the number of disability retirements. This finding is consistent with the last experience study which was conducted by a prior actuary for the six year period ending June 30, 2009. At this time, we recommend no change to the assumed rates of disability retirements for GWPORS. This will allow us to have more experience with the valuation data from year to year and to determine if this behavior pattern will continue to persist or is an anomaly.
The chart below shows (i) the actual rates of disability for employees by age during the past six years, (ii) the current assumed rates of disability and (iii) the number of exposed lives at each age interval over the experience period.
0
200
400
600
800
1,000
0.0%
0.2%
0.4%
0.6%
0.8%
<25 25 to 30 30 to 35 35 to 40 40 to 45 45 to 50 50 to 55 55 to 60 60 to 65 >65
Exposures
Rates of Disab
ility
DISABILITY RATES BY AGE GROUP
Exposures Actual Rate Assumed Rate
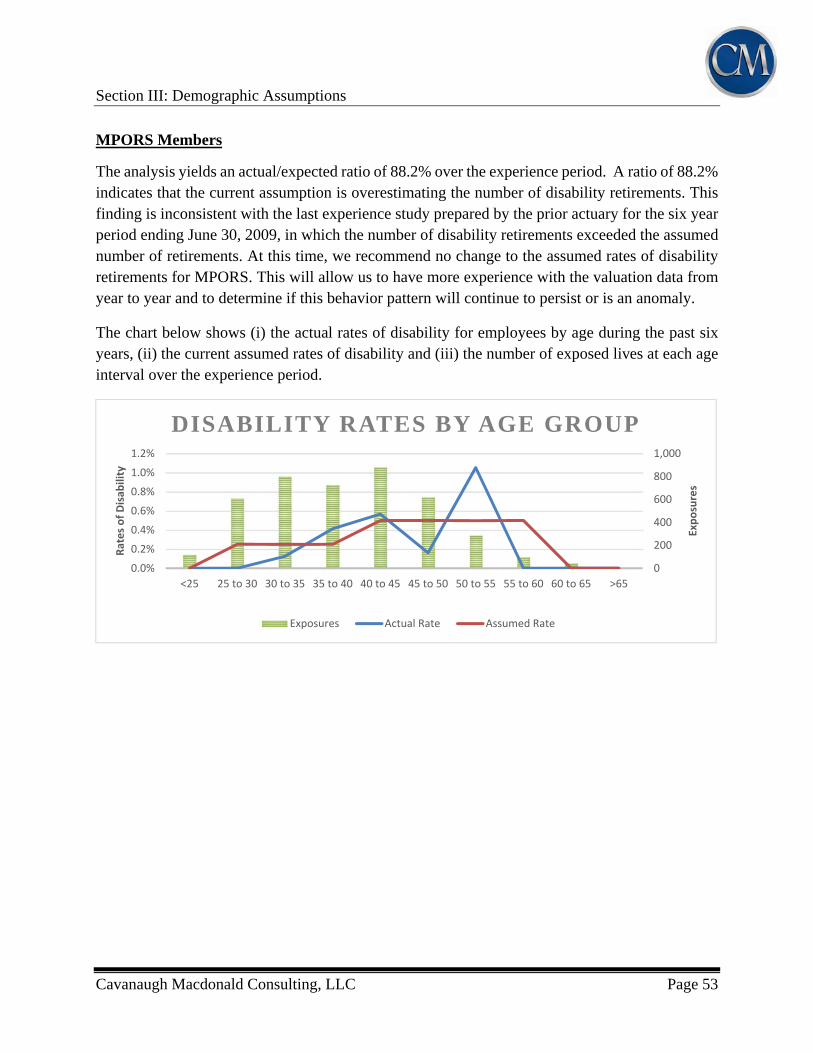
Section III: Demographic Assumptions
Cavanaugh Macdonald Consulting, LLC Page 53
MPORS Members
The analysis yields an actual/expected ratio of 88.2% over the experience period. A ratio of 88.2% indicates that the current assumption is overestimating the number of disability retirements. This finding is inconsistent with the last experience study prepared by the prior actuary for the six year period ending June 30, 2009, in which the number of disability retirements exceeded the assumed number of retirements. At this time, we recommend no change to the assumed rates of disability retirements for MPORS. This will allow us to have more experience with the valuation data from year to year and to determine if this behavior pattern will continue to persist or is an anomaly.
The chart below shows (i) the actual rates of disability for employees by age during the past six years, (ii) the current assumed rates of disability and (iii) the number of exposed lives at each age interval over the experience period.
0
200
400
600
800
1,000
0.0%
0.2%
0.4%
0.6%
0.8%
1.0%
1.2%
<25 25 to 30 30 to 35 35 to 40 40 to 45 45 to 50 50 to 55 55 to 60 60 to 65 >65
Exposures
Rates of Disab
ility
DISABILITY RATES BY AGE GROUP
Exposures Actual Rate Assumed Rate
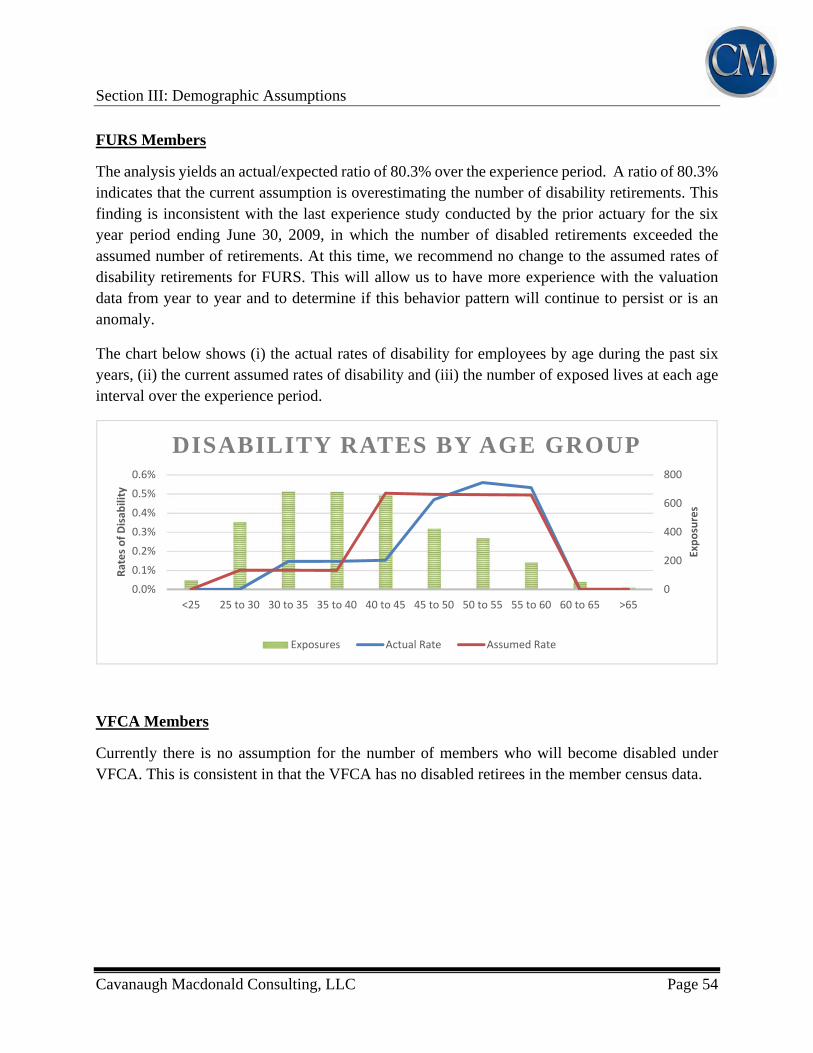
Section III: Demographic Assumptions
Cavanaugh Macdonald Consulting, LLC Page 54
FURS Members
The analysis yields an actual/expected ratio of 80.3% over the experience period. A ratio of 80.3% indicates that the current assumption is overestimating the number of disability retirements. This finding is inconsistent with the last experience study conducted by the prior actuary for the six year period ending June 30, 2009, in which the number of disabled retirements exceeded the assumed number of retirements. At this time, we recommend no change to the assumed rates of disability retirements for FURS. This will allow us to have more experience with the valuation data from year to year and to determine if this behavior pattern will continue to persist or is an anomaly.
The chart below shows (i) the actual rates of disability for employees by age during the past six years, (ii) the current assumed rates of disability and (iii) the number of exposed lives at each age interval over the experience period.
VFCA Members
Currently there is no assumption for the number of members who will become disabled under VFCA. This is consistent in that the VFCA has no disabled retirees in the member census data.
0
200
400
600
800
0.0%
0.1%
0.2%
0.3%
0.4%
0.5%
0.6%
<25 25 to 30 30 to 35 35 to 40 40 to 45 45 to 50 50 to 55 55 to 60 60 to 65 >65
Exposures
Rates of Disab
ility
DISABILITY RATES BY AGE GROUP
Exposures Actual Rate Assumed Rate
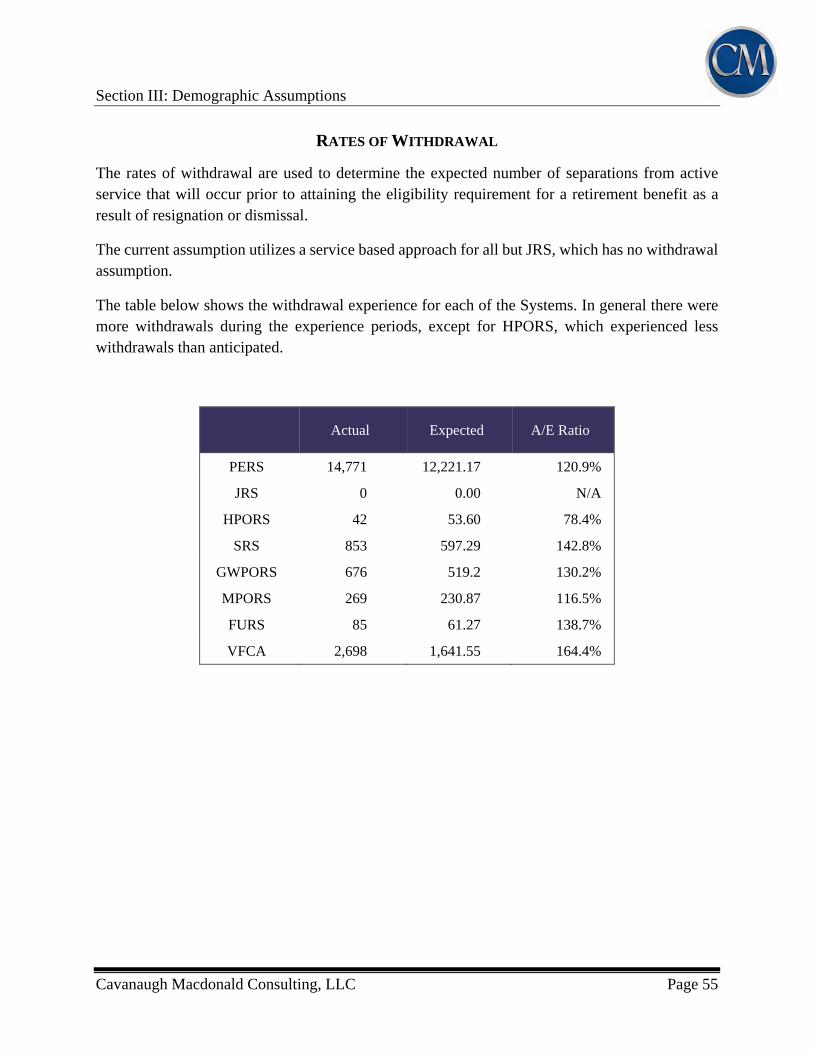
Section III: Demographic Assumptions
Cavanaugh Macdonald Consulting, LLC Page 55
RATES OF WITHDRAWAL
The rates of withdrawal are used to determine the expected number of separations from active service that will occur prior to attaining the eligibility requirement for a retirement benefit as a result of resignation or dismissal.
The current assumption utilizes a service based approach for all but JRS, which has no withdrawal assumption.
The table below shows the withdrawal experience for each of the Systems. In general there were more withdrawals during the experience periods, except for HPORS, which experienced less withdrawals than anticipated.
Actual Expected A/E Ratio
PERS 14,771 12,221.17 120.9%
JRS 0 0.00 N/A
HPORS 42 53.60 78.4%
SRS 853 597.29 142.8%
GWPORS 676 519.2 130.2%
MPORS 269 230.87 116.5%
FURS 85 61.27 138.7%
VFCA 2,698 1,641.55 164.4%
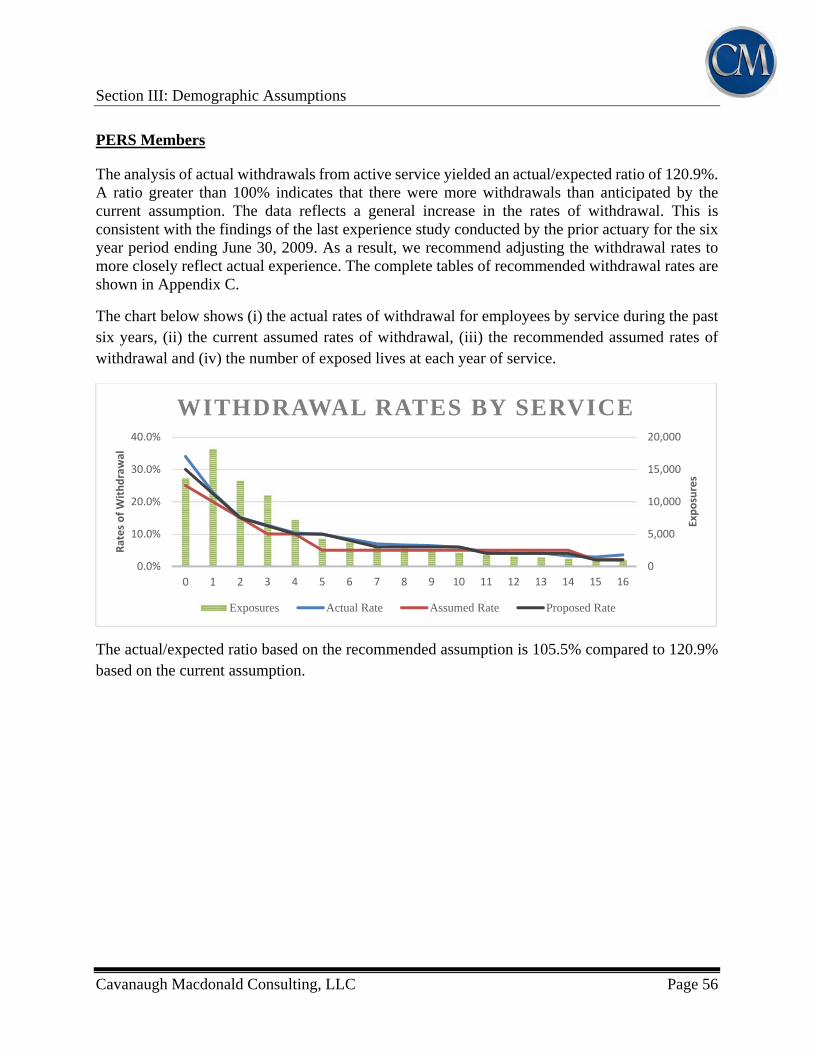
Section III: Demographic Assumptions
Cavanaugh Macdonald Consulting, LLC Page 56
PERS Members
The analysis of actual withdrawals from active service yielded an actual/expected ratio of 120.9%. A ratio greater than 100% indicates that there were more withdrawals than anticipated by the current assumption. The data reflects a general increase in the rates of withdrawal. This is consistent with the findings of the last experience study conducted by the prior actuary for the six year period ending June 30, 2009. As a result, we recommend adjusting the withdrawal rates to more closely reflect actual experience. The complete tables of recommended withdrawal rates are shown in Appendix C.
The chart below shows (i) the actual rates of withdrawal for employees by service during the past six years, (ii) the current assumed rates of withdrawal, (iii) the recommended assumed rates of withdrawal and (iv) the number of exposed lives at each year of service.
The actual/expected ratio based on the recommended assumption is 105.5% compared to 120.9% based on the current assumption.
0
5,000
10,000
15,000
20,000
0.0%
10.0%
20.0%
30.0%
40.0%
0 1 2 3 4 5 6 7 8 9 10 11 12 13 14 15 16
Exposures
Rates of Withdrawal
WITHDRAWAL RATES BY SERVICE
Exposures Actual Rate Assumed Rate Proposed Rate
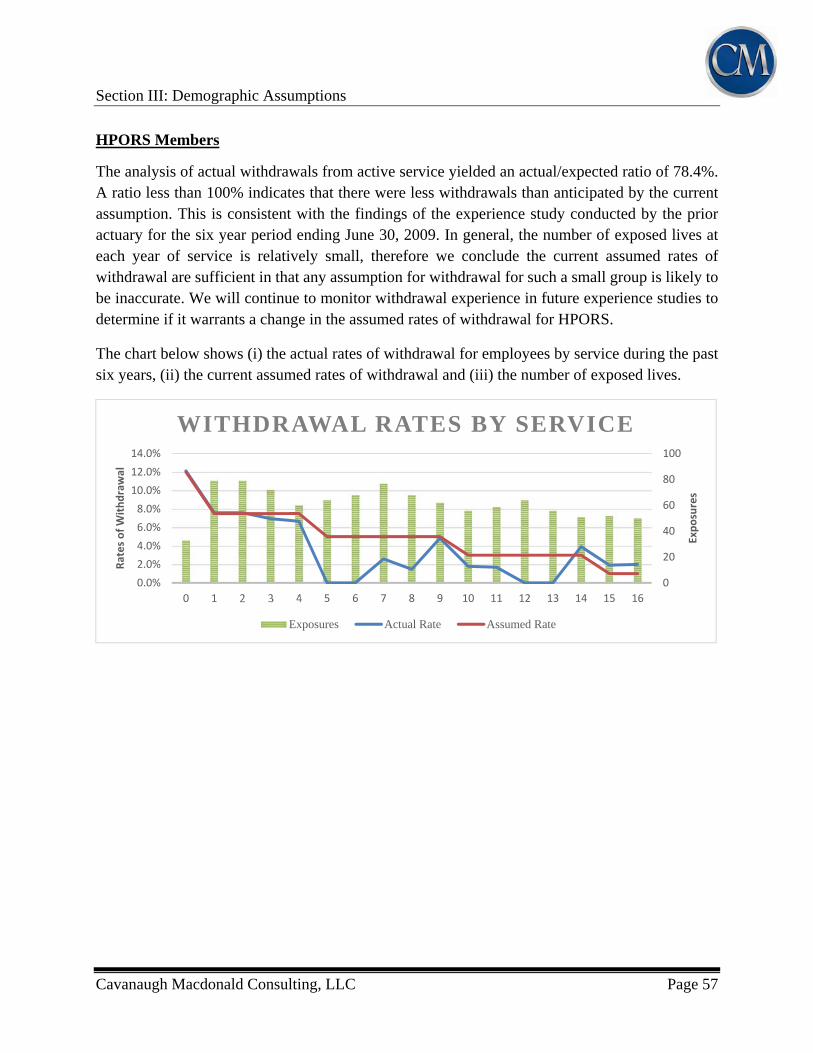
Section III: Demographic Assumptions
Cavanaugh Macdonald Consulting, LLC Page 57
HPORS Members
The analysis of actual withdrawals from active service yielded an actual/expected ratio of 78.4%. A ratio less than 100% indicates that there were less withdrawals than anticipated by the current assumption. This is consistent with the findings of the experience study conducted by the prior actuary for the six year period ending June 30, 2009. In general, the number of exposed lives at each year of service is relatively small, therefore we conclude the current assumed rates of withdrawal are sufficient in that any assumption for withdrawal for such a small group is likely to be inaccurate. We will continue to monitor withdrawal experience in future experience studies to determine if it warrants a change in the assumed rates of withdrawal for HPORS.
The chart below shows (i) the actual rates of withdrawal for employees by service during the past six years, (ii) the current assumed rates of withdrawal and (iii) the number of exposed lives.
0
20
40
60
80
100
0.0%
2.0%
4.0%
6.0%
8.0%
10.0%
12.0%
14.0%
0 1 2 3 4 5 6 7 8 9 10 11 12 13 14 15 16
Exposures
Rates of Withdrawal
WITHDRAWAL RATES BY SERVICE
Exposures Actual Rate Assumed Rate
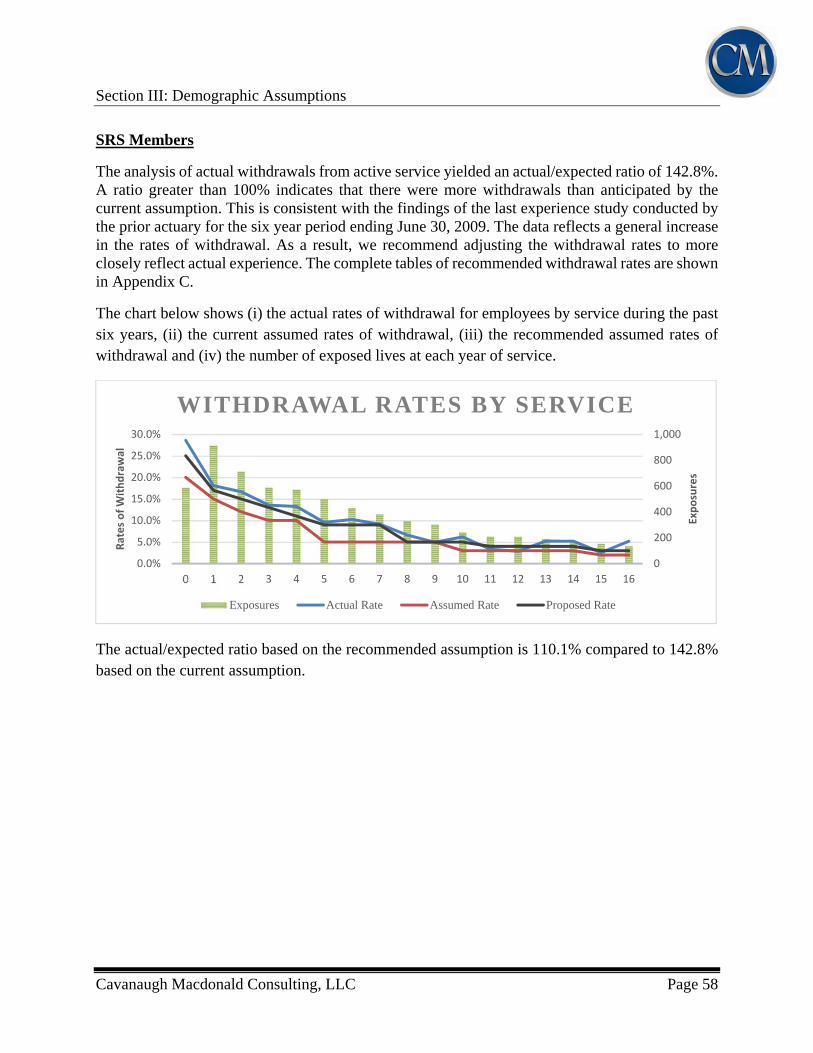
Section III: Demographic Assumptions
Cavanaugh Macdonald Consulting, LLC Page 58
SRS Members
The analysis of actual withdrawals from active service yielded an actual/expected ratio of 142.8%. A ratio greater than 100% indicates that there were more withdrawals than anticipated by the current assumption. This is consistent with the findings of the last experience study conducted by the prior actuary for the six year period ending June 30, 2009. The data reflects a general increase in the rates of withdrawal. As a result, we recommend adjusting the withdrawal rates to more closely reflect actual experience. The complete tables of recommended withdrawal rates are shown in Appendix C.
The chart below shows (i) the actual rates of withdrawal for employees by service during the past six years, (ii) the current assumed rates of withdrawal, (iii) the recommended assumed rates of withdrawal and (iv) the number of exposed lives at each year of service.
The actual/expected ratio based on the recommended assumption is 110.1% compared to 142.8% based on the current assumption.
0
200
400
600
800
1,000
0.0%
5.0%
10.0%
15.0%
20.0%
25.0%
30.0%
0 1 2 3 4 5 6 7 8 9 10 11 12 13 14 15 16
Exposures
Rates of Withdrawal
WITHDRAWAL RATES BY SERVICE
Exposures Actual Rate Assumed Rate Proposed Rate
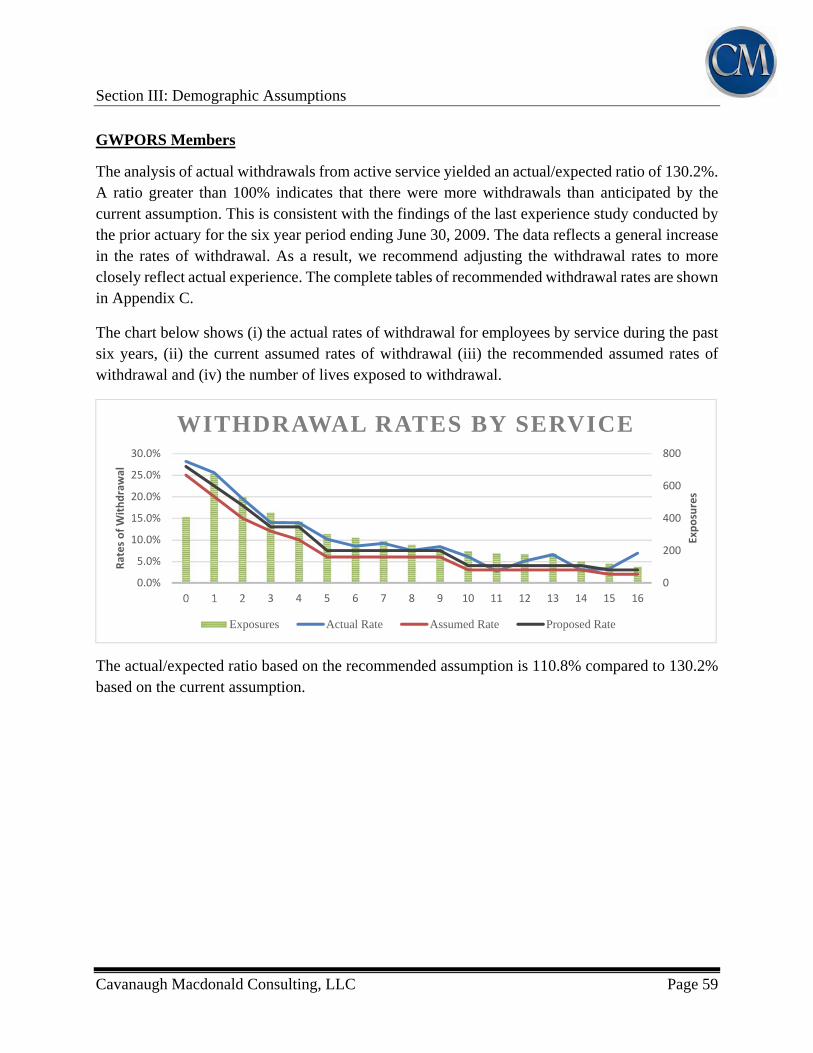
Section III: Demographic Assumptions
Cavanaugh Macdonald Consulting, LLC Page 59
GWPORS Members
The analysis of actual withdrawals from active service yielded an actual/expected ratio of 130.2%. A ratio greater than 100% indicates that there were more withdrawals than anticipated by the current assumption. This is consistent with the findings of the last experience study conducted by the prior actuary for the six year period ending June 30, 2009. The data reflects a general increase in the rates of withdrawal. As a result, we recommend adjusting the withdrawal rates to more closely reflect actual experience. The complete tables of recommended withdrawal rates are shown in Appendix C.
The chart below shows (i) the actual rates of withdrawal for employees by service during the past six years, (ii) the current assumed rates of withdrawal (iii) the recommended assumed rates of withdrawal and (iv) the number of lives exposed to withdrawal.
The actual/expected ratio based on the recommended assumption is 110.8% compared to 130.2% based on the current assumption.
0
200
400
600
800
0.0%
5.0%
10.0%
15.0%
20.0%
25.0%
30.0%
0 1 2 3 4 5 6 7 8 9 10 11 12 13 14 15 16
Exposures
Rates of Withdrawal
WITHDRAWAL RATES BY SERVICE
Exposures Actual Rate Assumed Rate Proposed Rate
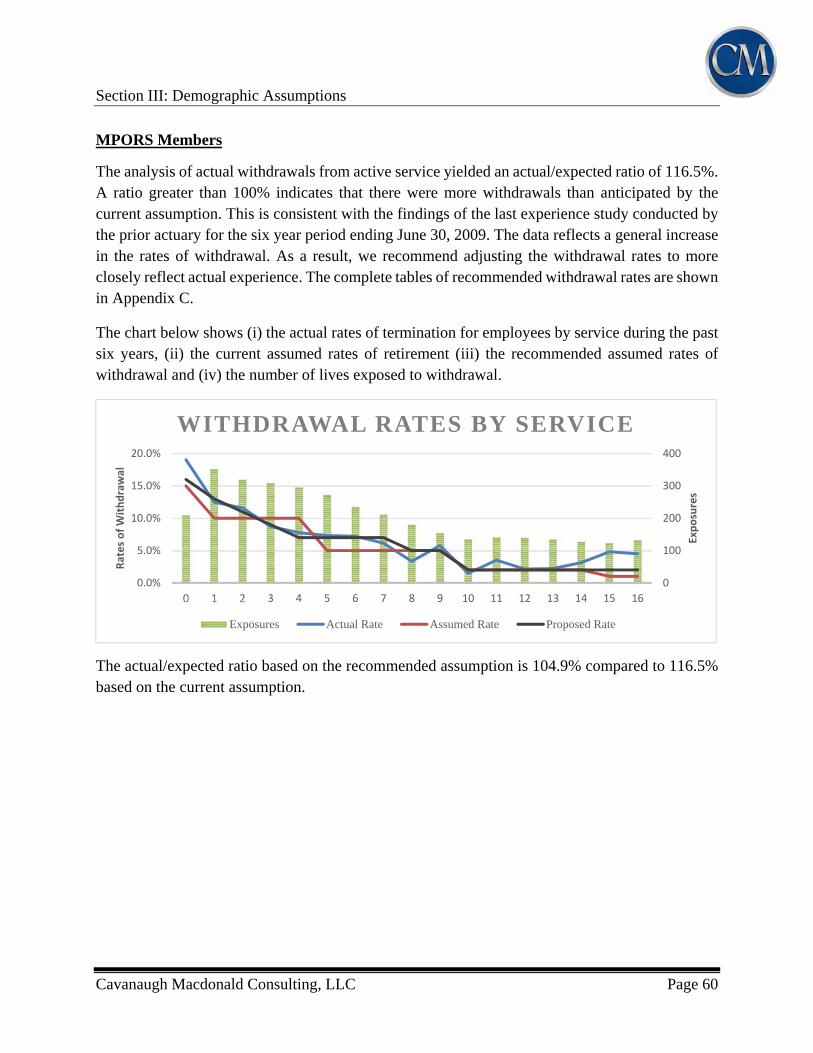
Section III: Demographic Assumptions
Cavanaugh Macdonald Consulting, LLC Page 60
MPORS Members
The analysis of actual withdrawals from active service yielded an actual/expected ratio of 116.5%. A ratio greater than 100% indicates that there were more withdrawals than anticipated by the current assumption. This is consistent with the findings of the last experience study conducted by the prior actuary for the six year period ending June 30, 2009. The data reflects a general increase in the rates of withdrawal. As a result, we recommend adjusting the withdrawal rates to more closely reflect actual experience. The complete tables of recommended withdrawal rates are shown in Appendix C.
The chart below shows (i) the actual rates of termination for employees by service during the past six years, (ii) the current assumed rates of retirement (iii) the recommended assumed rates of withdrawal and (iv) the number of lives exposed to withdrawal.
The actual/expected ratio based on the recommended assumption is 104.9% compared to 116.5% based on the current assumption.
0
100
200
300
400
0.0%
5.0%
10.0%
15.0%
20.0%
0 1 2 3 4 5 6 7 8 9 10 11 12 13 14 15 16
Exposures
Rates of Withdrawal
WITHDRAWAL RATES BY SERVICE
Exposures Actual Rate Assumed Rate Proposed Rate
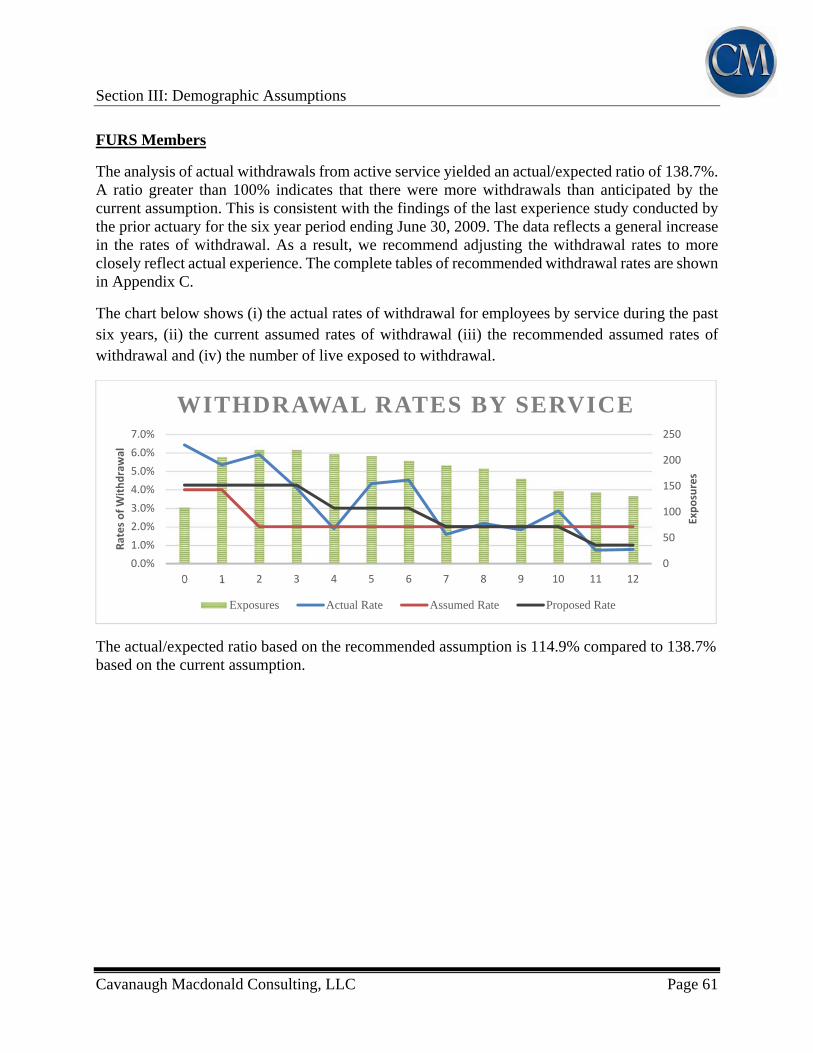
Section III: Demographic Assumptions
Cavanaugh Macdonald Consulting, LLC Page 61
FURS Members
The analysis of actual withdrawals from active service yielded an actual/expected ratio of 138.7%. A ratio greater than 100% indicates that there were more withdrawals than anticipated by the current assumption. This is consistent with the findings of the last experience study conducted by the prior actuary for the six year period ending June 30, 2009. The data reflects a general increase in the rates of withdrawal. As a result, we recommend adjusting the withdrawal rates to more closely reflect actual experience. The complete tables of recommended withdrawal rates are shown in Appendix C.
The chart below shows (i) the actual rates of withdrawal for employees by service during the past six years, (ii) the current assumed rates of withdrawal (iii) the recommended assumed rates of withdrawal and (iv) the number of live exposed to withdrawal.
The actual/expected ratio based on the recommended assumption is 114.9% compared to 138.7% based on the current assumption.
0
50
100
150
200
250
0.0%
1.0%
2.0%
3.0%
4.0%
5.0%
6.0%
7.0%
0 1 2 3 4 5 6 7 8 9 10 11 12
Exposures
Rates of Withdrawal
WITHDRAWAL RATES BY SERVICE
Exposures Actual Rate Assumed Rate Proposed Rate
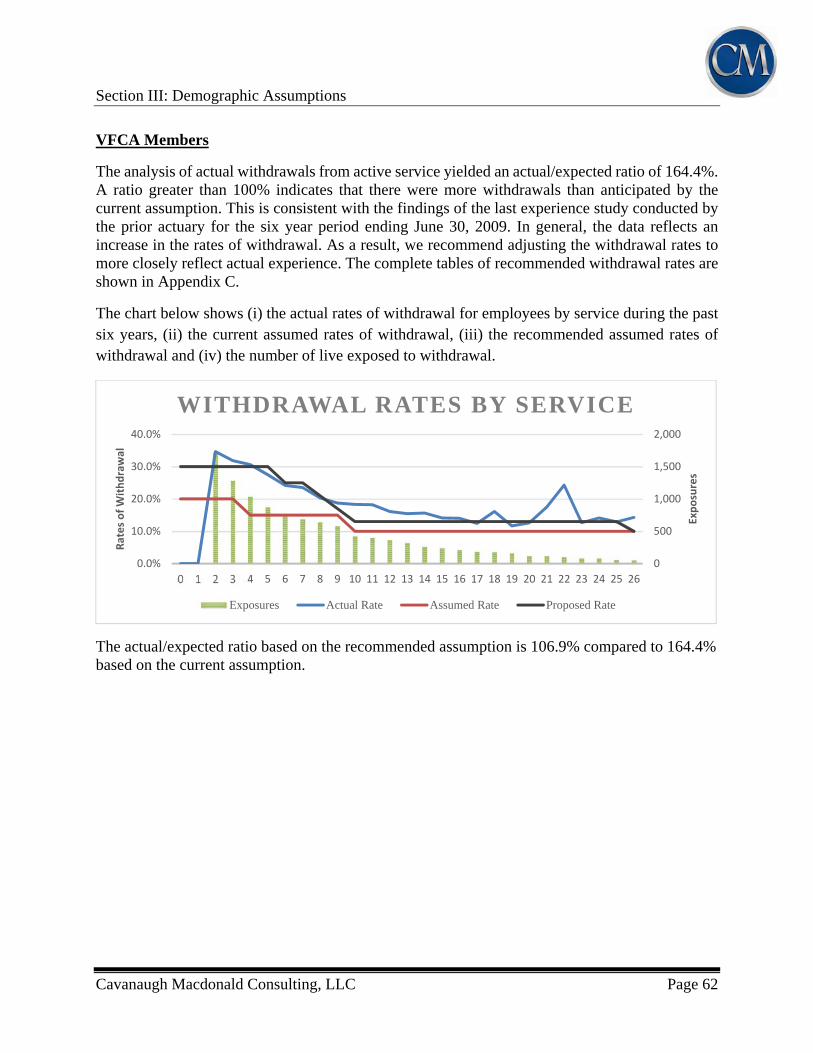
Section III: Demographic Assumptions
Cavanaugh Macdonald Consulting, LLC Page 62
VFCA Members
The analysis of actual withdrawals from active service yielded an actual/expected ratio of 164.4%. A ratio greater than 100% indicates that there were more withdrawals than anticipated by the current assumption. This is consistent with the findings of the last experience study conducted by the prior actuary for the six year period ending June 30, 2009. In general, the data reflects an increase in the rates of withdrawal. As a result, we recommend adjusting the withdrawal rates to more closely reflect actual experience. The complete tables of recommended withdrawal rates are shown in Appendix C.
The chart below shows (i) the actual rates of withdrawal for employees by service during the past six years, (ii) the current assumed rates of withdrawal, (iii) the recommended assumed rates of withdrawal and (iv) the number of live exposed to withdrawal.
The actual/expected ratio based on the recommended assumption is 106.9% compared to 164.4% based on the current assumption.
0
500
1,000
1,500
2,000
0.0%
10.0%
20.0%
30.0%
40.0%
0 1 2 3 4 5 6 7 8 9 10 11 12 13 14 15 16 17 18 19 20 21 22 23 24 25 26
Exposures
Rates of Withdrawal
WITHDRAWAL RATES BY SERVICE
Exposures Actual Rate Assumed Rate Proposed Rate
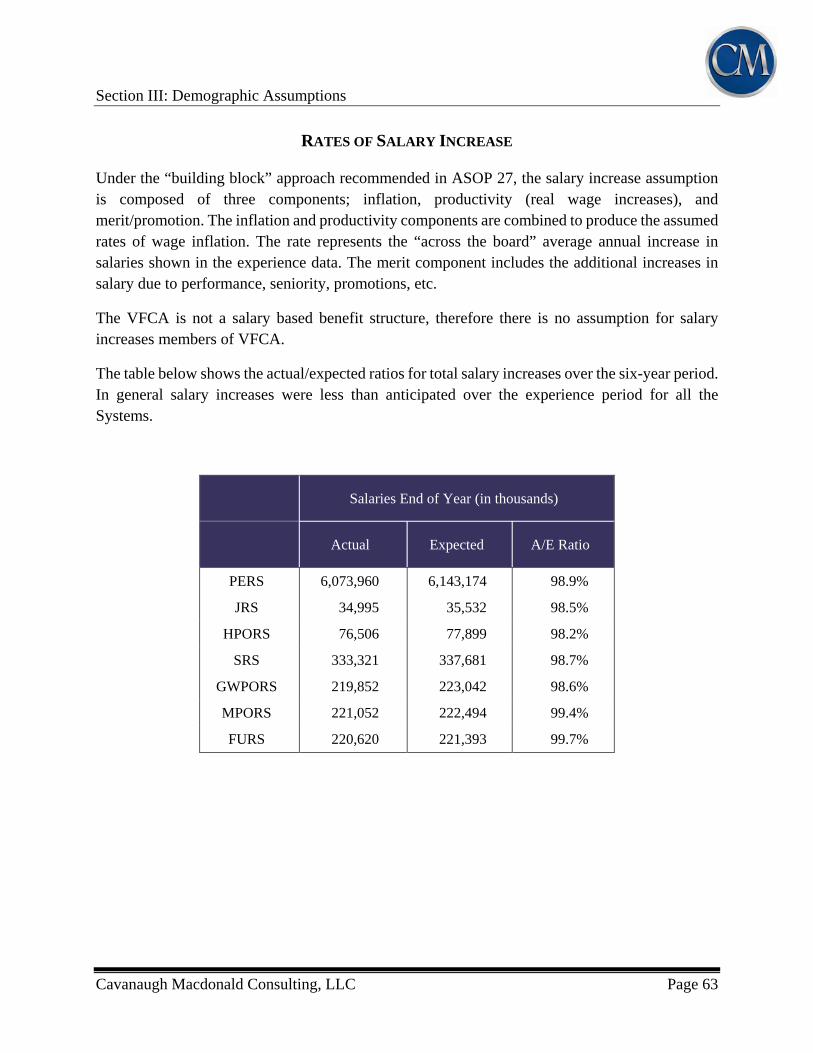
Section III: Demographic Assumptions
Cavanaugh Macdonald Consulting, LLC Page 63
RATES OF SALARY INCREASE
Under the “building block” approach recommended in ASOP 27, the salary increase assumption is composed of three components; inflation, productivity (real wage increases), and merit/promotion. The inflation and productivity components are combined to produce the assumed rates of wage inflation. The rate represents the “across the board” average annual increase in salaries shown in the experience data. The merit component includes the additional increases in salary due to performance, seniority, promotions, etc.
The VFCA is not a salary based benefit structure, therefore there is no assumption for salary increases members of VFCA.
The table below shows the actual/expected ratios for total salary increases over the six-year period. In general salary increases were less than anticipated over the experience period for all the Systems.
Salaries End of Year (in thousands)
Actual Expected A/E Ratio
PERS 6,073,960 6,143,174 98.9%
JRS 34,995 35,532 98.5%
HPORS 76,506 77,899 98.2%
SRS 333,321 337,681 98.7%
GWPORS 219,852 223,042 98.6%
MPORS 221,052 222,494 99.4%
FURS 220,620 221,393 99.7%
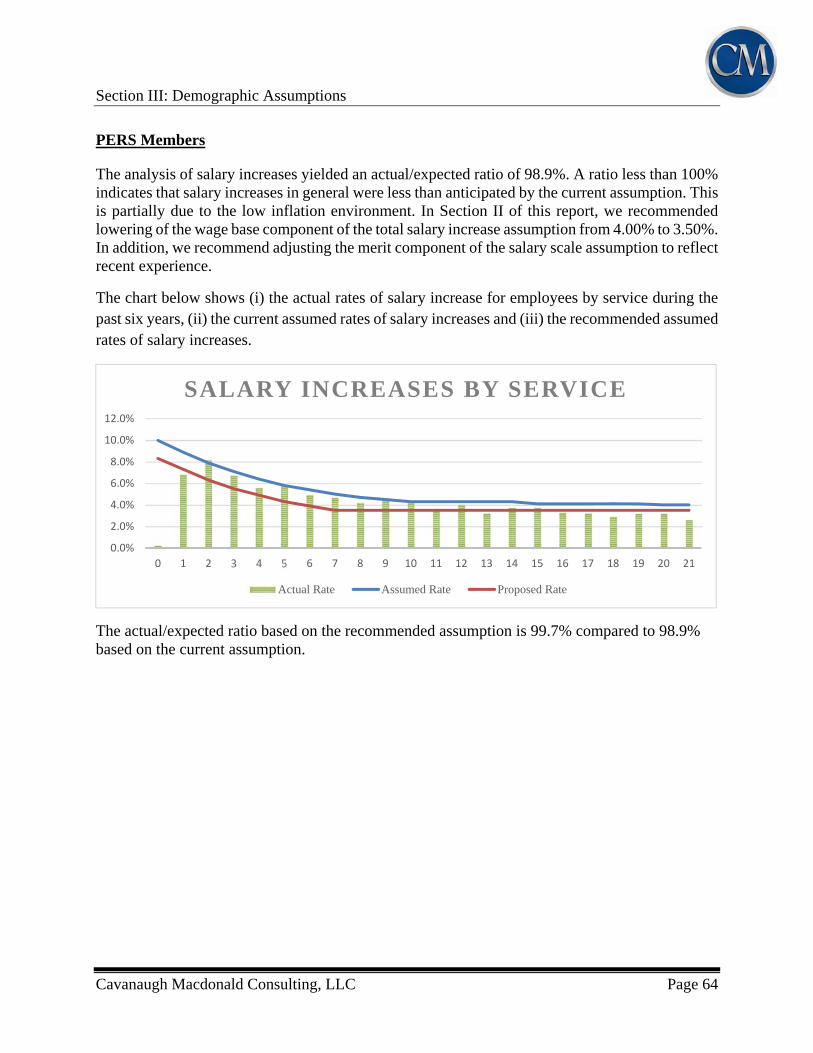
Section III: Demographic Assumptions
Cavanaugh Macdonald Consulting, LLC Page 64
PERS Members
The analysis of salary increases yielded an actual/expected ratio of 98.9%. A ratio less than 100% indicates that salary increases in general were less than anticipated by the current assumption. This is partially due to the low inflation environment. In Section II of this report, we recommended lowering of the wage base component of the total salary increase assumption from 4.00% to 3.50%. In addition, we recommend adjusting the merit component of the salary scale assumption to reflect recent experience.
The chart below shows (i) the actual rates of salary increase for employees by service during the past six years, (ii) the current assumed rates of salary increases and (iii) the recommended assumed rates of salary increases.
The actual/expected ratio based on the recommended assumption is 99.7% compared to 98.9% based on the current assumption.
0.0%
2.0%
4.0%
6.0%
8.0%
10.0%
12.0%
0 1 2 3 4 5 6 7 8 9 10 11 12 13 14 15 16 17 18 19 20 21
SALARY INCREASES BY SERVICE
Actual Rate Assumed Rate Proposed Rate
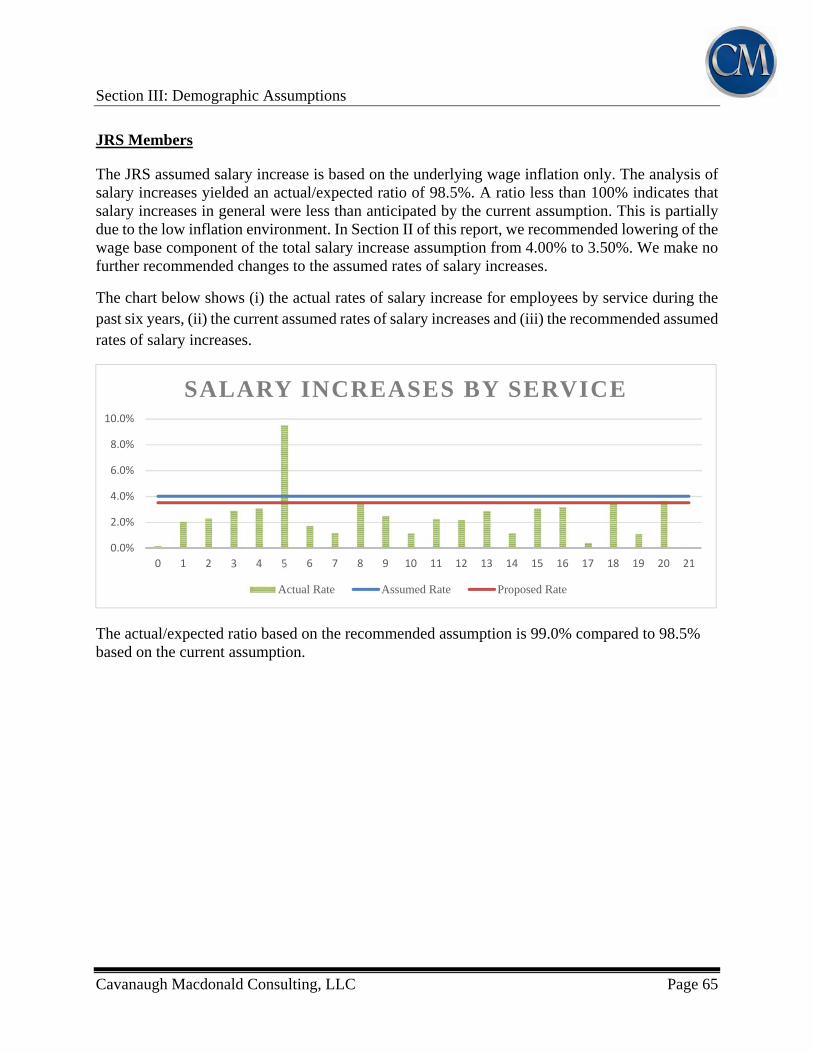
Section III: Demographic Assumptions
Cavanaugh Macdonald Consulting, LLC Page 65
JRS Members
The JRS assumed salary increase is based on the underlying wage inflation only. The analysis of salary increases yielded an actual/expected ratio of 98.5%. A ratio less than 100% indicates that salary increases in general were less than anticipated by the current assumption. This is partially due to the low inflation environment. In Section II of this report, we recommended lowering of the wage base component of the total salary increase assumption from 4.00% to 3.50%. We make no further recommended changes to the assumed rates of salary increases.
The chart below shows (i) the actual rates of salary increase for employees by service during the past six years, (ii) the current assumed rates of salary increases and (iii) the recommended assumed rates of salary increases.
The actual/expected ratio based on the recommended assumption is 99.0% compared to 98.5% based on the current assumption.
0.0%
2.0%
4.0%
6.0%
8.0%
10.0%
0 1 2 3 4 5 6 7 8 9 10 11 12 13 14 15 16 17 18 19 20 21
SALARY INCREASES BY SERVICE
Actual Rate Assumed Rate Proposed Rate
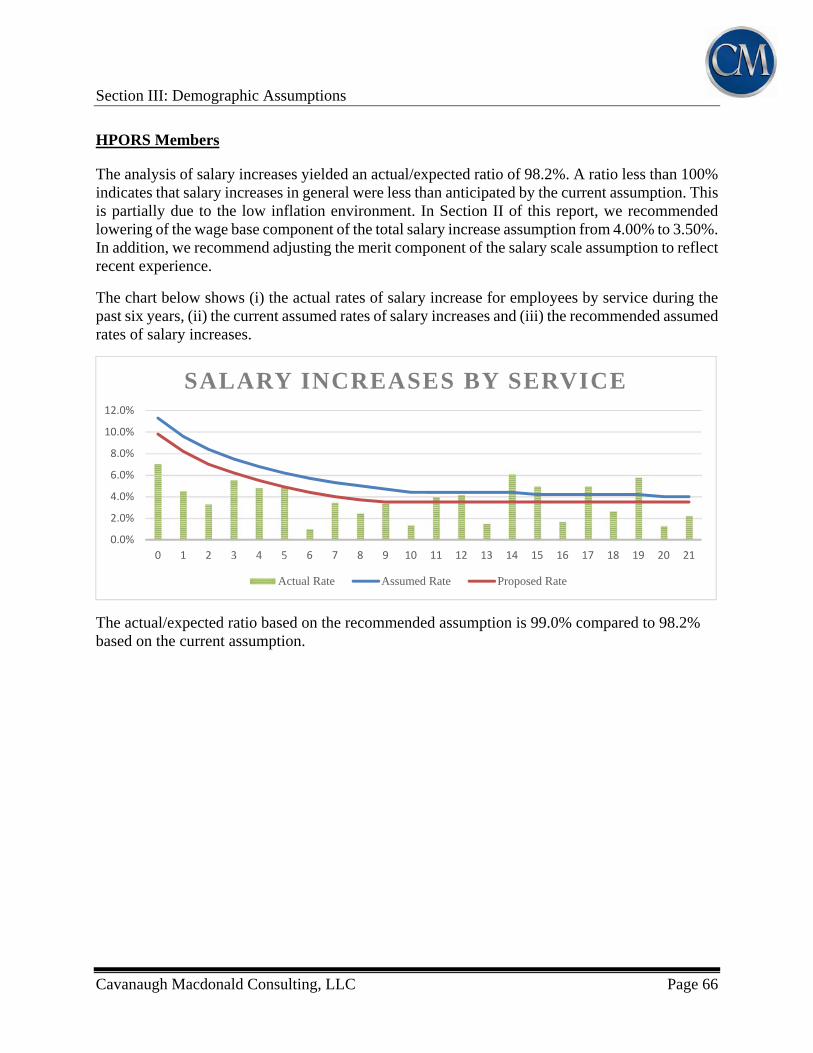
Section III: Demographic Assumptions
Cavanaugh Macdonald Consulting, LLC Page 66
HPORS Members
The analysis of salary increases yielded an actual/expected ratio of 98.2%. A ratio less than 100% indicates that salary increases in general were less than anticipated by the current assumption. This is partially due to the low inflation environment. In Section II of this report, we recommended lowering of the wage base component of the total salary increase assumption from 4.00% to 3.50%. In addition, we recommend adjusting the merit component of the salary scale assumption to reflect recent experience.
The chart below shows (i) the actual rates of salary increase for employees by service during the past six years, (ii) the current assumed rates of salary increases and (iii) the recommended assumed rates of salary increases.
The actual/expected ratio based on the recommended assumption is 99.0% compared to 98.2% based on the current assumption.
0.0%
2.0%
4.0%
6.0%
8.0%
10.0%
12.0%
0 1 2 3 4 5 6 7 8 9 10 11 12 13 14 15 16 17 18 19 20 21
SALARY INCREASES BY SERVICE
Actual Rate Assumed Rate Proposed Rate
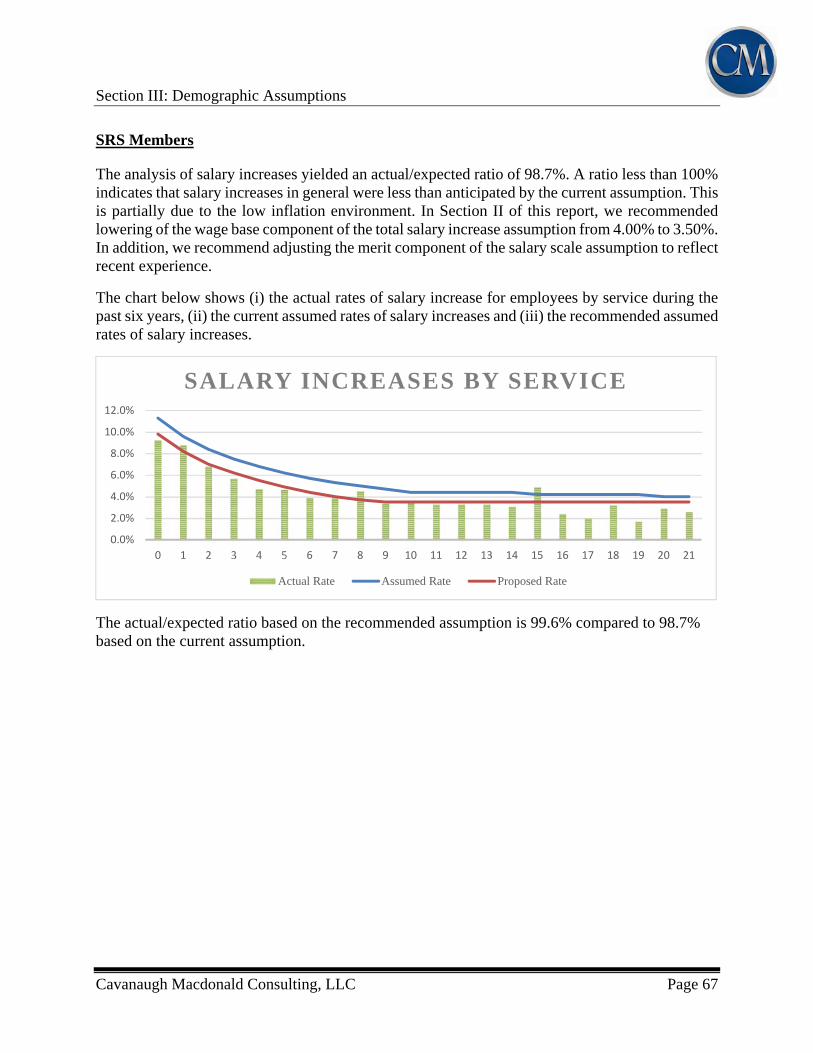
Section III: Demographic Assumptions
Cavanaugh Macdonald Consulting, LLC Page 67
SRS Members
The analysis of salary increases yielded an actual/expected ratio of 98.7%. A ratio less than 100% indicates that salary increases in general were less than anticipated by the current assumption. This is partially due to the low inflation environment. In Section II of this report, we recommended lowering of the wage base component of the total salary increase assumption from 4.00% to 3.50%. In addition, we recommend adjusting the merit component of the salary scale assumption to reflect recent experience.
The chart below shows (i) the actual rates of salary increase for employees by service during the past six years, (ii) the current assumed rates of salary increases and (iii) the recommended assumed rates of salary increases.
The actual/expected ratio based on the recommended assumption is 99.6% compared to 98.7% based on the current assumption.
0.0%
2.0%
4.0%
6.0%
8.0%
10.0%
12.0%
0 1 2 3 4 5 6 7 8 9 10 11 12 13 14 15 16 17 18 19 20 21
SALARY INCREASES BY SERVICE
Actual Rate Assumed Rate Proposed Rate
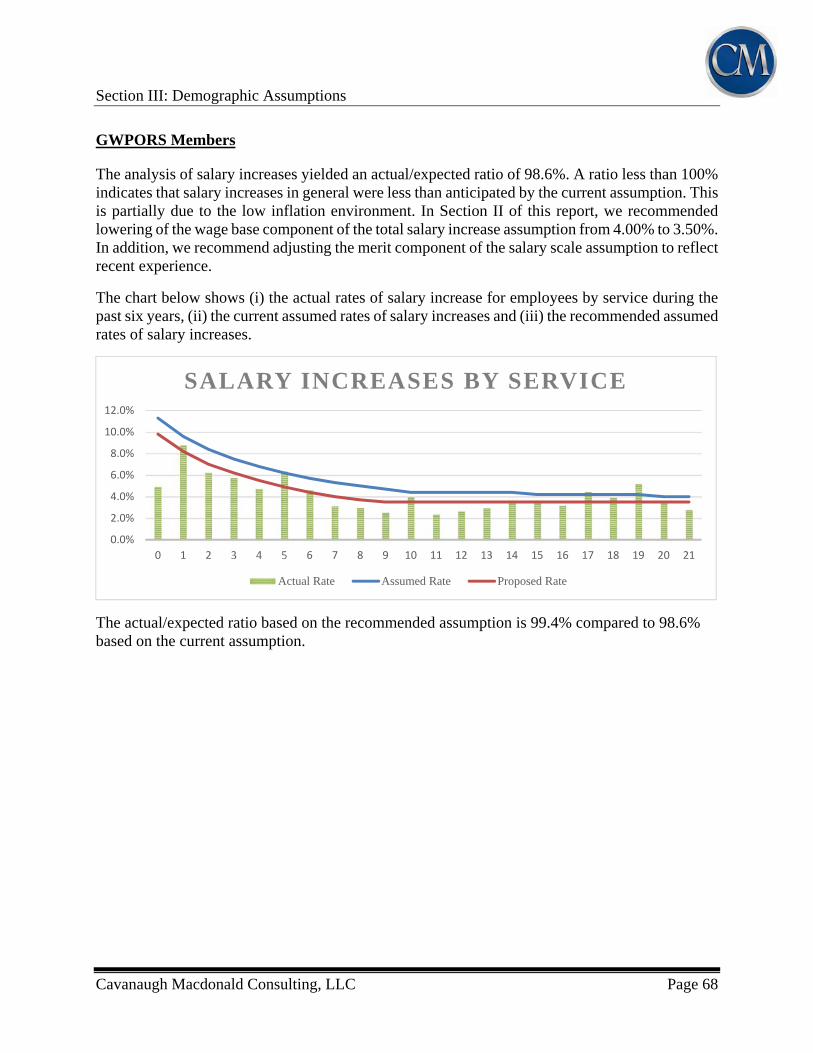
Section III: Demographic Assumptions
Cavanaugh Macdonald Consulting, LLC Page 68
GWPORS Members
The analysis of salary increases yielded an actual/expected ratio of 98.6%. A ratio less than 100% indicates that salary increases in general were less than anticipated by the current assumption. This is partially due to the low inflation environment. In Section II of this report, we recommended lowering of the wage base component of the total salary increase assumption from 4.00% to 3.50%. In addition, we recommend adjusting the merit component of the salary scale assumption to reflect recent experience.
The chart below shows (i) the actual rates of salary increase for employees by service during the past six years, (ii) the current assumed rates of salary increases and (iii) the recommended assumed rates of salary increases.
The actual/expected ratio based on the recommended assumption is 99.4% compared to 98.6% based on the current assumption.
0.0%
2.0%
4.0%
6.0%
8.0%
10.0%
12.0%
0 1 2 3 4 5 6 7 8 9 10 11 12 13 14 15 16 17 18 19 20 21
SALARY INCREASES BY SERVICE
Actual Rate Assumed Rate Proposed Rate

Section III: Demographic Assumptions
Cavanaugh Macdonald Consulting, LLC Page 69
MPORS Members
The analysis of salary increases yielded an actual/expected ratio of 99.4%. A ratio less than 100% indicates that salary increases in general were less than anticipated by the current assumption. This is partially due to the low inflation environment. In Section II of this report, we recommended lowering of the wage base component of the total salary increase assumption from 4.00% to 3.50%. In addition, we recommend adjusting the merit component of the salary scale assumption to reflect recent experience.
The chart below shows (i) the actual rates of salary increase for employees by service during the past six years, (ii) the current assumed rates of salary increases and (iii) the recommended assumed rates of salary increases.
The actual/expected ratio based on the recommended assumption is 100.2% compared to 99.4% based on the current assumption.
0.0%
2.0%
4.0%
6.0%
8.0%
10.0%
12.0%
14.0%
0 1 2 3 4 5 6 7 8 9 10 11 12 13 14 15 16 17 18 19 20 21
SALARY INCREASES BY SERVICE
Actual Rate Assumed Rate Proposed Rate
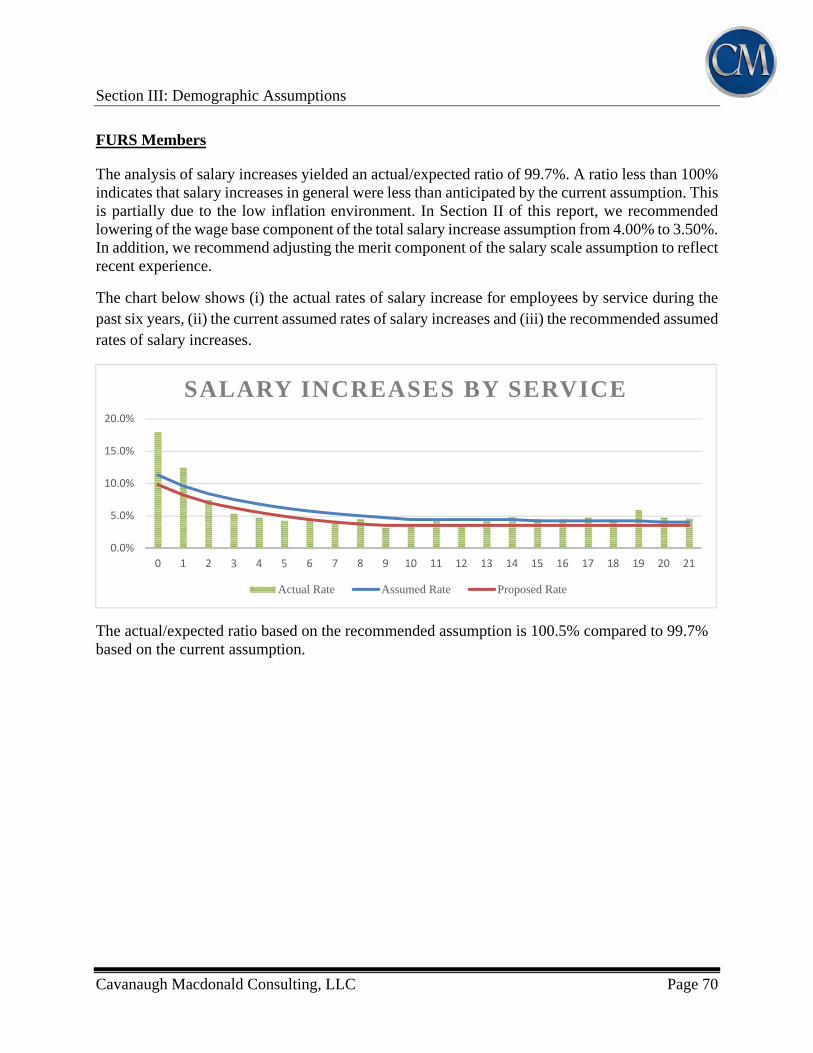
Section III: Demographic Assumptions
Cavanaugh Macdonald Consulting, LLC Page 70
FURS Members
The analysis of salary increases yielded an actual/expected ratio of 99.7%. A ratio less than 100% indicates that salary increases in general were less than anticipated by the current assumption. This is partially due to the low inflation environment. In Section II of this report, we recommended lowering of the wage base component of the total salary increase assumption from 4.00% to 3.50%. In addition, we recommend adjusting the merit component of the salary scale assumption to reflect recent experience.
The chart below shows (i) the actual rates of salary increase for employees by service during the past six years, (ii) the current assumed rates of salary increases and (iii) the recommended assumed rates of salary increases.
The actual/expected ratio based on the recommended assumption is 100.5% compared to 99.7% based on the current assumption.
0.0%
5.0%
10.0%
15.0%
20.0%
0 1 2 3 4 5 6 7 8 9 10 11 12 13 14 15 16 17 18 19 20 21
SALARY INCREASES BY SERVICE
Actual Rate Assumed Rate Proposed Rate
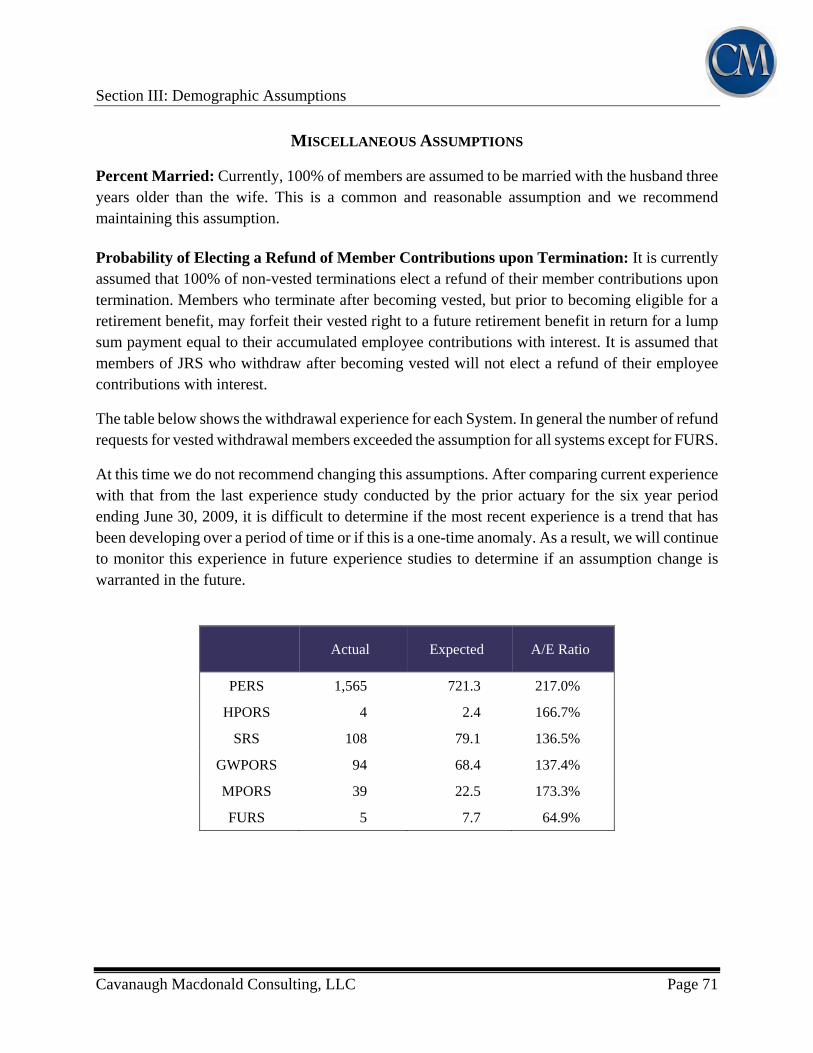
Section III: Demographic Assumptions
Cavanaugh Macdonald Consulting, LLC Page 71
MISCELLANEOUS ASSUMPTIONS
Percent Married: Currently, 100% of members are assumed to be married with the husband three years older than the wife. This is a common and reasonable assumption and we recommend maintaining this assumption. Probability of Electing a Refund of Member Contributions upon Termination: It is currently assumed that 100% of non-vested terminations elect a refund of their member contributions upon termination. Members who terminate after becoming vested, but prior to becoming eligible for a retirement benefit, may forfeit their vested right to a future retirement benefit in return for a lump sum payment equal to their accumulated employee contributions with interest. It is assumed that members of JRS who withdraw after becoming vested will not elect a refund of their employee contributions with interest.
The table below shows the withdrawal experience for each System. In general the number of refund requests for vested withdrawal members exceeded the assumption for all systems except for FURS.
At this time we do not recommend changing this assumptions. After comparing current experience with that from the last experience study conducted by the prior actuary for the six year period ending June 30, 2009, it is difficult to determine if the most recent experience is a trend that has been developing over a period of time or if this is a one-time anomaly. As a result, we will continue to monitor this experience in future experience studies to determine if an assumption change is warranted in the future.
Actual Expected A/E Ratio
PERS 1,565 721.3 217.0%
HPORS 4 2.4 166.7%
SRS 108 79.1 136.5%
GWPORS 94 68.4 137.4%
MPORS 39 22.5 173.3%
FURS 5 7.7 64.9%
Section IV: Actuarial Methods
Cavanaugh Macdonald Consulting, LLC Page 72
ACTUARIAL METHODS
Actuarial valuations utilize methods to determine the liabilities, assets, and costs of the systems. While these are not like other assumptions that may change over time, an experience study is still a good opportunity to review these methods to see if they are still appropriate for systematically funding the promised benefits. Significant methods are described below. Actuarial Cost Method: The cost method is used to allocate the present value of benefits between past service (actuarial accrued liability) and future service (normal cost). Currently, the valuation applies the entry age normal cost method. This is the most widely used cost method of large public sector plans and has demonstrated the highest degree of stability as compared to alternative methods. We recommend no change in the use of this method. Actuarial Value of Assets: The purpose of asset smoothing is to dampen the impact that market volatility has on valuation results by spreading the unexpected market gains and losses over several years. Currently, the System uses a smoothing method that recognizes 25% of the difference between the assumed rate of return on the market value of assets and the actual rate of return on the market value of assets. We recommend no change to the current method at this time. Amortization Method: The unfunded actuarial accrued liability is amortized using a level percentage of payroll method over the amortization period. The payroll growth assumption is used to determine the percentage of payroll required over the remaining amortization period to fully amortize the unfunded liability. The current wage inflation assumption is being changed from 4.00% to 3.50%. We recommend the same change for the payroll growth assumption be made. Interest on Member Contributions: The assumed crediting rate on member contributions is 3.50% per year. We recommend lowering the assumed crediting rate on member contributions to 2.75% per year to be consistent with the proposed inflation assumption.
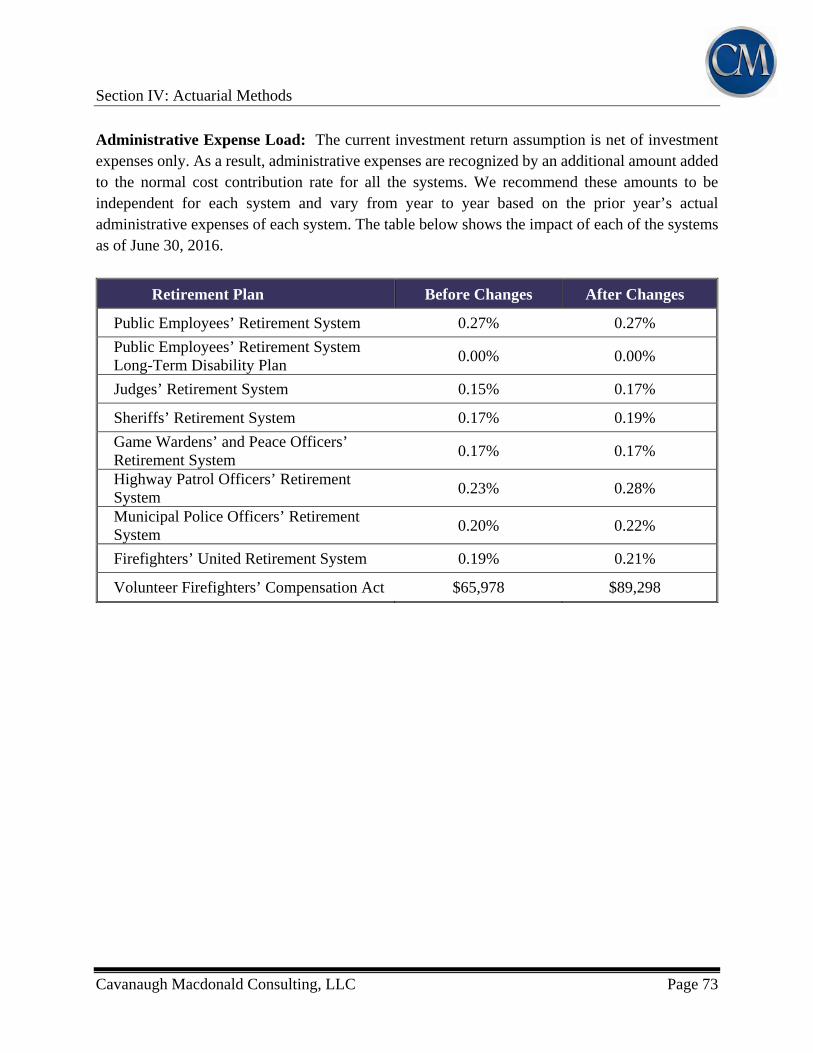
Section IV: Actuarial Methods
Cavanaugh Macdonald Consulting, LLC Page 73
Administrative Expense Load: The current investment return assumption is net of investment expenses only. As a result, administrative expenses are recognized by an additional amount added to the normal cost contribution rate for all the systems. We recommend these amounts to be independent for each system and vary from year to year based on the prior year’s actual administrative expenses of each system. The table below shows the impact of each of the systems as of June 30, 2016.
Retirement Plan Before Changes After Changes
Public Employees’ Retirement System 0.27% 0.27%
Public Employees’ Retirement System Long-Term Disability Plan
0.00% 0.00%
Judges’ Retirement System 0.15% 0.17%
Sheriffs’ Retirement System 0.17% 0.19%
Game Wardens’ and Peace Officers’ Retirement System
0.17% 0.17%
Highway Patrol Officers’ Retirement System
0.23% 0.28%
Municipal Police Officers’ Retirement System
0.20% 0.22%
Firefighters’ United Retirement System 0.19% 0.21%
Volunteer Firefighters’ Compensation Act $65,978 $89,298
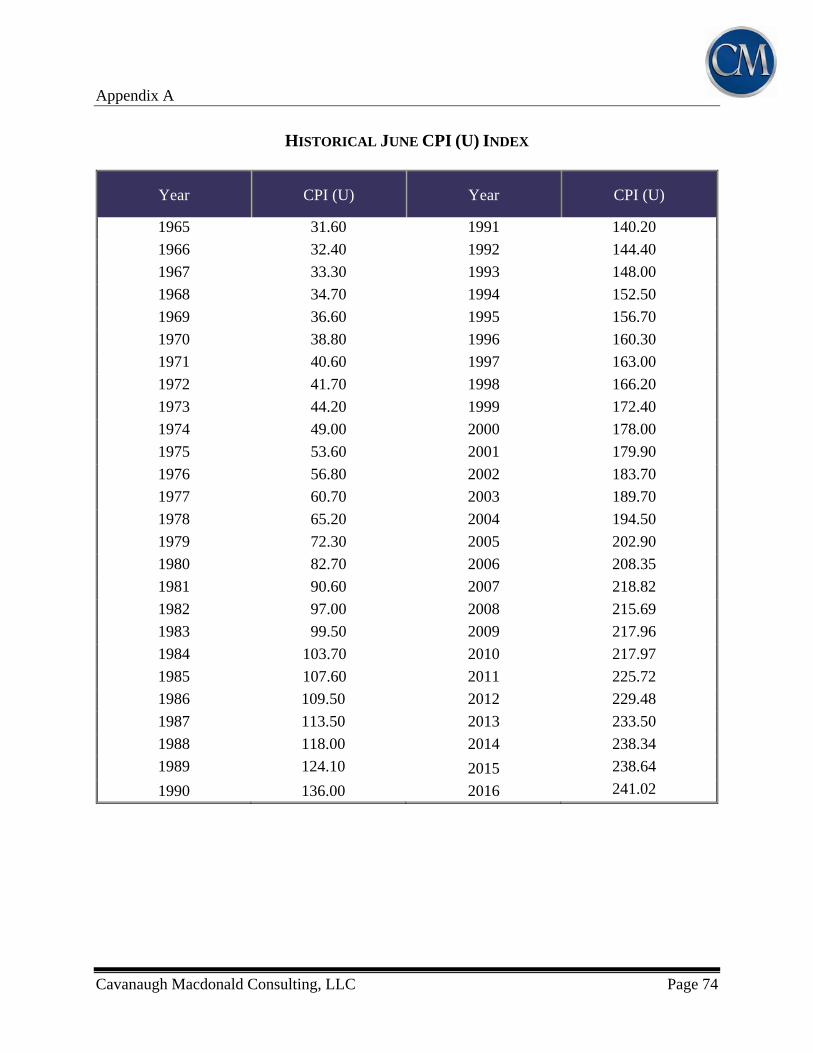
Appendix A
Cavanaugh Macdonald Consulting, LLC Page 74
HISTORICAL JUNE CPI (U) INDEX
Year CPI (U) Year CPI (U)
1965 31.60 1991 140.20
1966 32.40 1992 144.40
1967 33.30 1993 148.00
1968 34.70 1994 152.50
1969 36.60 1995 156.70
1970 38.80 1996 160.30
1971 40.60 1997 163.00
1972 41.70 1998 166.20
1973 44.20 1999 172.40
1974 49.00 2000 178.00
1975 53.60 2001 179.90
1976 56.80 2002 183.70
1977 60.70 2003 189.70
1978 65.20 2004 194.50
1979 72.30 2005 202.90
1980 82.70 2006 208.35
1981 90.60 2007 218.82
1982 97.00 2008 215.69
1983 99.50 2009 217.96
1984 103.70 2010 217.97
1985 107.60 2011 225.72
1986 109.50 2012 229.48
1987 113.50 2013 233.50
1988 118.00 2014 238.34
1989 124.10 2015 238.64
1990 136.00 2016 241.02
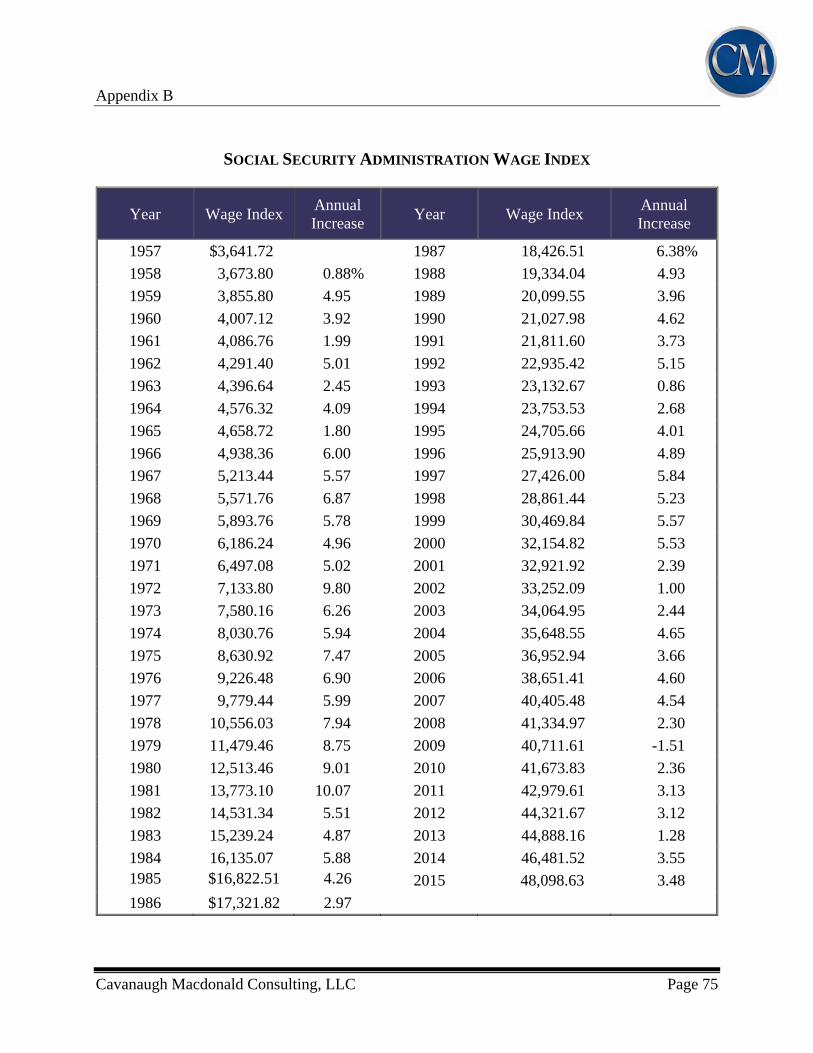
Appendix B
Cavanaugh Macdonald Consulting, LLC Page 75
SOCIAL SECURITY ADMINISTRATION WAGE INDEX
Year Wage Index Annual Increase
Year Wage Index Annual Increase
1957 $3,641.72 1987 18,426.51 6.38%
1958 3,673.80 0.88% 1988 19,334.04 4.93
1959 3,855.80 4.95 1989 20,099.55 3.96
1960 4,007.12 3.92 1990 21,027.98 4.62
1961 4,086.76 1.99 1991 21,811.60 3.73
1962 4,291.40 5.01 1992 22,935.42 5.15
1963 4,396.64 2.45 1993 23,132.67 0.86
1964 4,576.32 4.09 1994 23,753.53 2.68
1965 4,658.72 1.80 1995 24,705.66 4.01
1966 4,938.36 6.00 1996 25,913.90 4.89
1967 5,213.44 5.57 1997 27,426.00 5.84
1968 5,571.76 6.87 1998 28,861.44 5.23
1969 5,893.76 5.78 1999 30,469.84 5.57
1970 6,186.24 4.96 2000 32,154.82 5.53
1971 6,497.08 5.02 2001 32,921.92 2.39
1972 7,133.80 9.80 2002 33,252.09 1.00
1973 7,580.16 6.26 2003 34,064.95 2.44
1974 8,030.76 5.94 2004 35,648.55 4.65
1975 8,630.92 7.47 2005 36,952.94 3.66
1976 9,226.48 6.90 2006 38,651.41 4.60
1977 9,779.44 5.99 2007 40,405.48 4.54
1978 10,556.03 7.94 2008 41,334.97 2.30
1979 11,479.46 8.75 2009 40,711.61 -1.51
1980 12,513.46 9.01 2010 41,673.83 2.36
1981 13,773.10 10.07 2011 42,979.61 3.13
1982 14,531.34 5.51 2012 44,321.67 3.12
1983 15,239.24 4.87 2013 44,888.16 1.28
1984 16,135.07 5.88 2014 46,481.52 3.55 1985 $16,822.51 4.26 2015 48,098.63 3.48
1986 $17,321.82 2.97
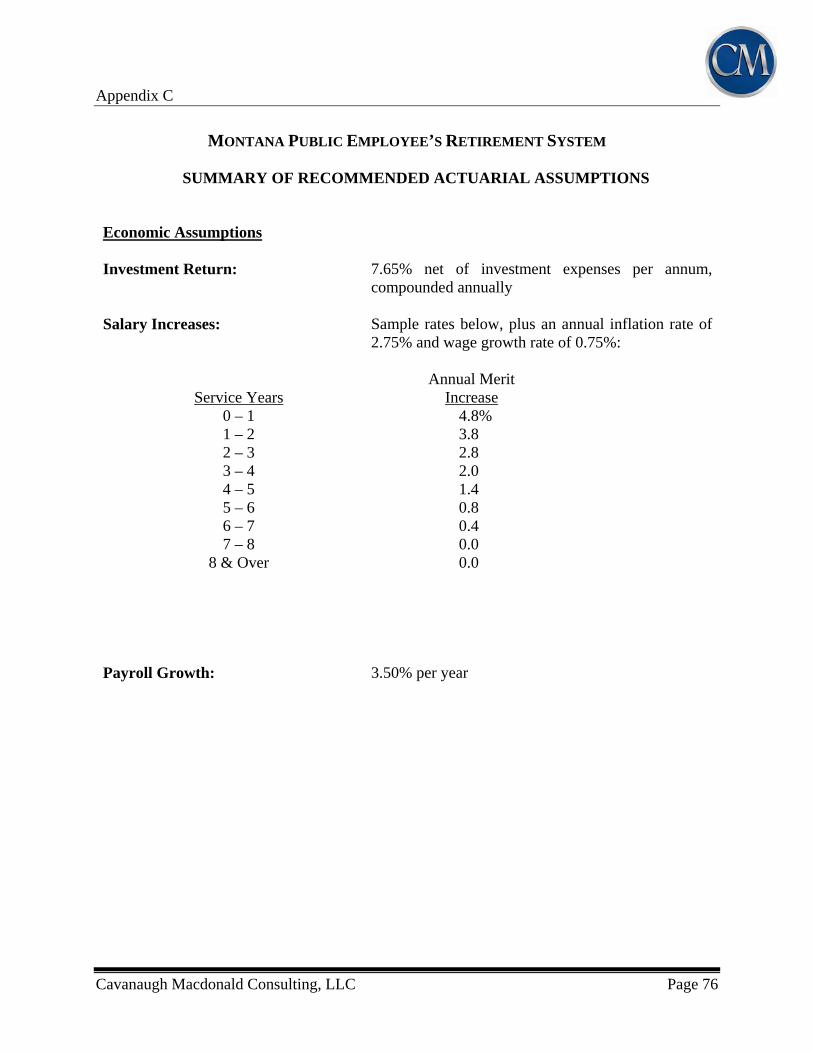
Appendix C
Cavanaugh Macdonald Consulting, LLC Page 76
MONTANA PUBLIC EMPLOYEE’S RETIREMENT SYSTEM
SUMMARY OF RECOMMENDED ACTUARIAL ASSUMPTIONS
Economic Assumptions Investment Return: 7.65% net of investment expenses per annum,
compounded annually Salary Increases: Sample rates below, plus an annual inflation rate of
2.75% and wage growth rate of 0.75%:
Annual Merit Service Years Increase
0 – 1 4.8% 1 – 2 3.8 2 – 3 2.8 3 – 4 2.0 4 – 5 1.4 5 – 6 0.8 6 – 7 0.4 7 – 8 0.0
8 & Over 0.0
Payroll Growth: 3.50% per year
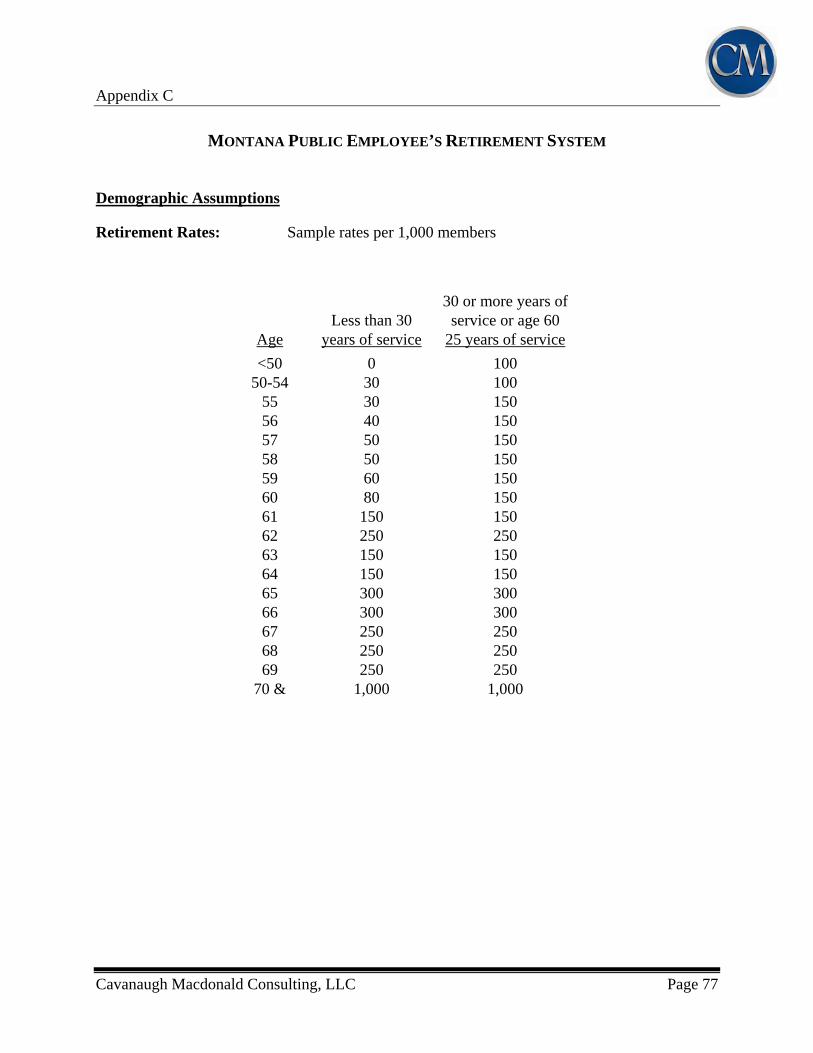
Appendix C
Cavanaugh Macdonald Consulting, LLC Page 77
MONTANA PUBLIC EMPLOYEE’S RETIREMENT SYSTEM
Demographic Assumptions
Retirement Rates: Sample rates per 1,000 members
30 or more years of Less than 30 service or age 60
Age years of service 25 years of service
<50 0 100 50-54 30 100
55 30 150 56 40 150 57 50 150 58 50 150 59 60 150 60 80 15061 150 15062 250 25063 150 15064 150 15065 300 30066 300 30067 250 25068 250 25069 250 250
70 & 1,000 1,000

Appendix C
Cavanaugh Macdonald Consulting, LLC Page 78
MONTANA PUBLIC EMPLOYEE’S RETIREMENT SYSTEM
Demographic Assumptions (continued)
Mortality Rates
Active participants RP-2000 Combined Employee and Annuitant Mortality Projected to 2020 using Scale BB, set back one year for males.
Disabled pensioners RP-2000 Combined Employee and Annuitant
Mortality Tables with no projections.
Retired Healthy pensioners RP-2000 Combined Employee and Annuitant Mortality Projected to 2020 using Scale BB, set back one year for males.
Disability Rates: Sample disability rates per 1,000 members
Nearest
Age
Male 22 0.0 27 0.1 32 0.1 37 0.4 42 1.0 47 1.3 52 2.5 57 3.6 60 0.0 62 0.0
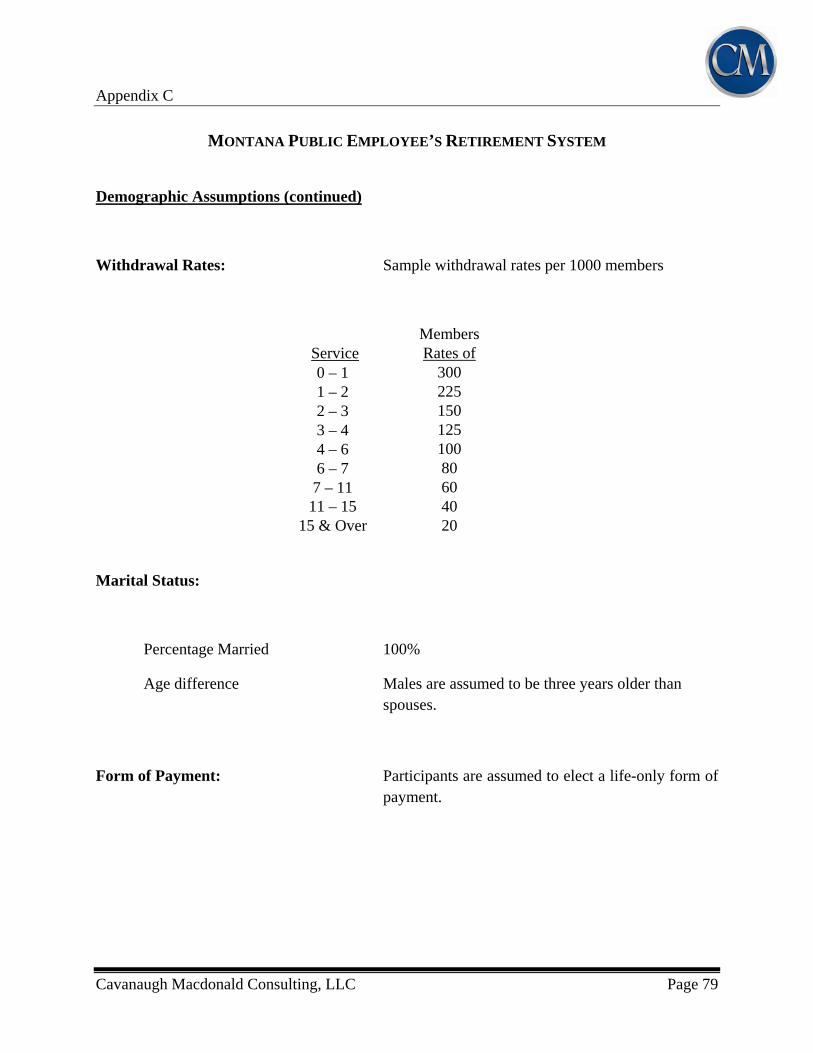
Appendix C
Cavanaugh Macdonald Consulting, LLC Page 79
MONTANA PUBLIC EMPLOYEE’S RETIREMENT SYSTEM
Demographic Assumptions (continued)
Withdrawal Rates: Sample withdrawal rates per 1000 members
Members Service Rates of 0 – 1 300 1 – 2 225 2 – 3 150 3 – 4 125 4 – 6 100 6 – 7 80 7 – 11 60 11 – 15 40
15 & Over 20
Marital Status:
Percentage Married 100%
Age difference Males are assumed to be three years older than spouses.
Form of Payment: Participants are assumed to elect a life-only form of payment.
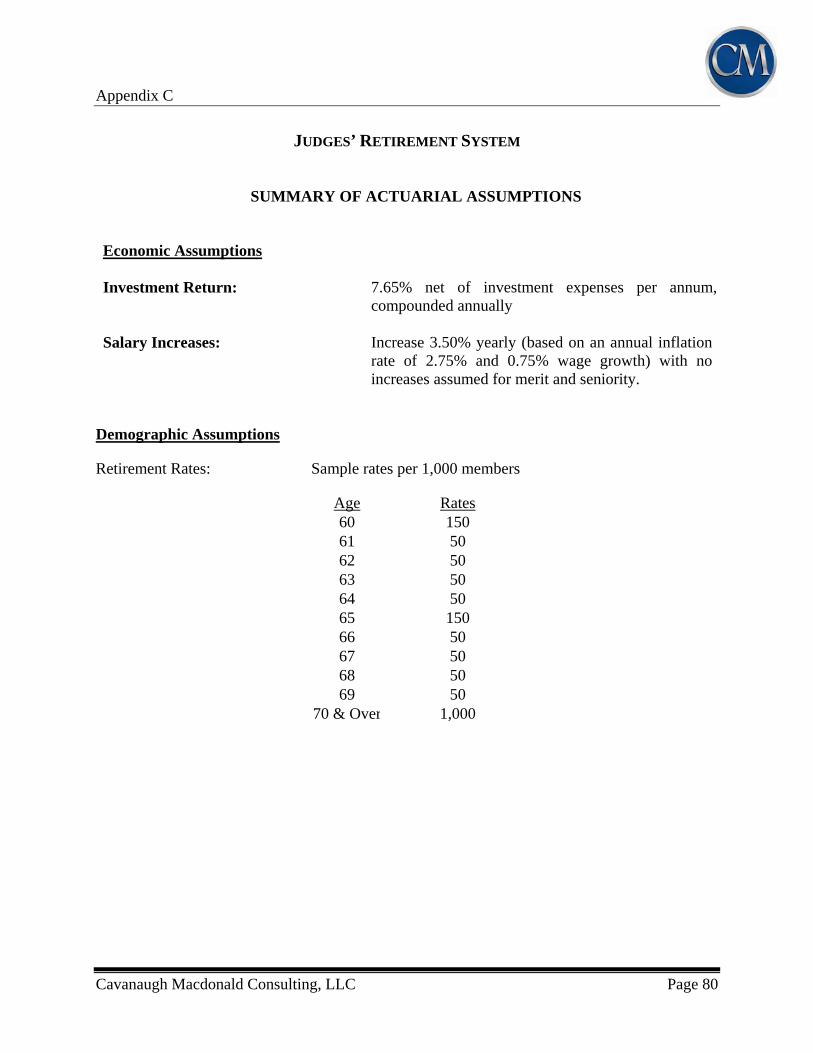
Appendix C
Cavanaugh Macdonald Consulting, LLC Page 80
JUDGES’ RETIREMENT SYSTEM
SUMMARY OF ACTUARIAL ASSUMPTIONS
Demographic Assumptions
Retirement Rates: Sample rates per 1,000 members
Age Rates 60 150 61 5062 5063 5064 5065 15066 5067 5068 5069 50
70 & Over 1,000
Economic Assumptions Investment Return: 7.65% net of investment expenses per annum,
compounded annually Salary Increases: Increase 3.50% yearly (based on an annual inflation
rate of 2.75% and 0.75% wage growth) with no increases assumed for merit and seniority.
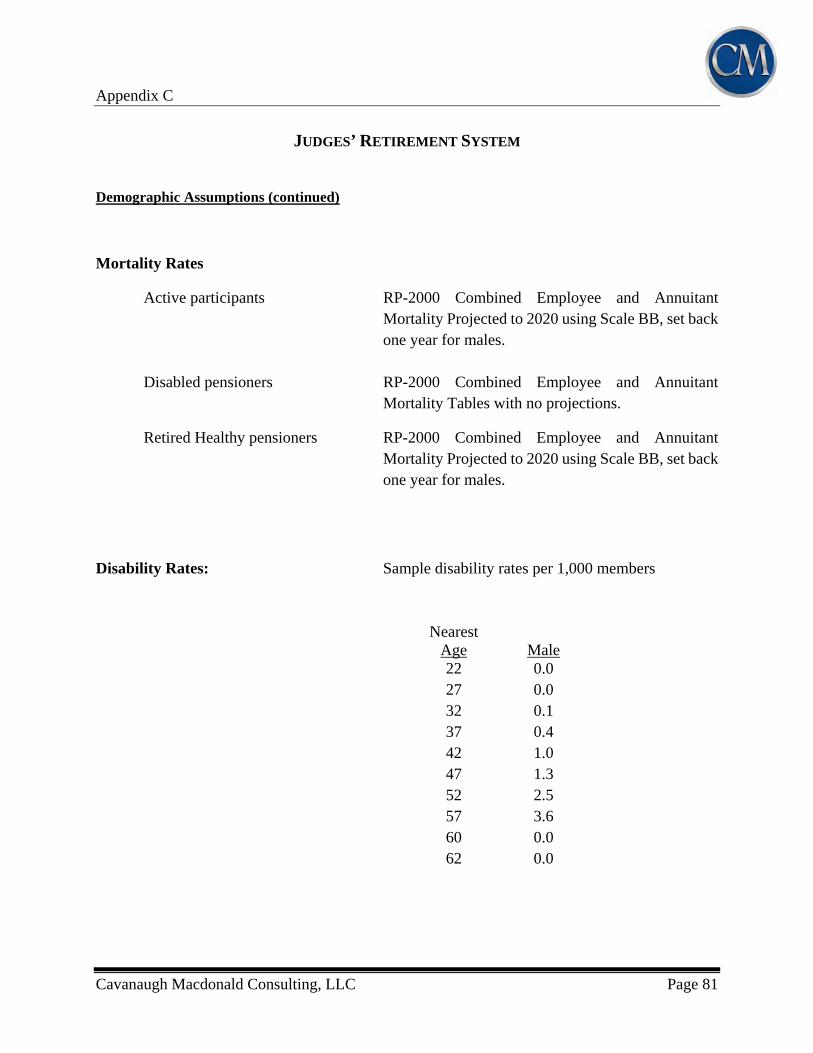
Appendix C
Cavanaugh Macdonald Consulting, LLC Page 81
JUDGES’ RETIREMENT SYSTEM
Demographic Assumptions (continued)
Mortality Rates
Active participants RP-2000 Combined Employee and Annuitant Mortality Projected to 2020 using Scale BB, set back one year for males.
Disabled pensioners RP-2000 Combined Employee and Annuitant
Mortality Tables with no projections.
Retired Healthy pensioners RP-2000 Combined Employee and Annuitant Mortality Projected to 2020 using Scale BB, set back one year for males.
Disability Rates: Sample disability rates per 1,000 members
Nearest
Age
Male 22 0.0 27 0.0 32 0.1 37 0.4 42 1.0 47 1.3 52 2.5 57 3.6 60 0.0 62 0.0
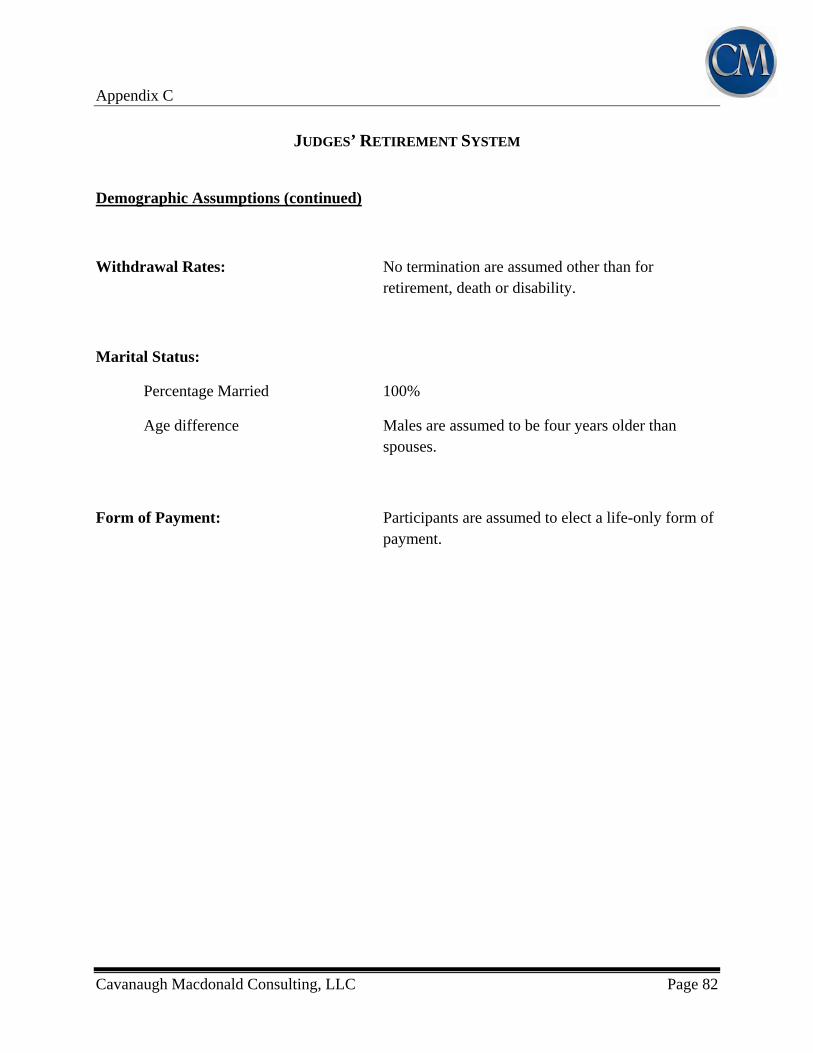
Appendix C
Cavanaugh Macdonald Consulting, LLC Page 82
JUDGES’ RETIREMENT SYSTEM
Demographic Assumptions (continued)
Withdrawal Rates: No termination are assumed other than for retirement, death or disability.
Marital Status:
Percentage Married 100%
Age difference Males are assumed to be four years older than spouses.
Form of Payment: Participants are assumed to elect a life-only form of payment.
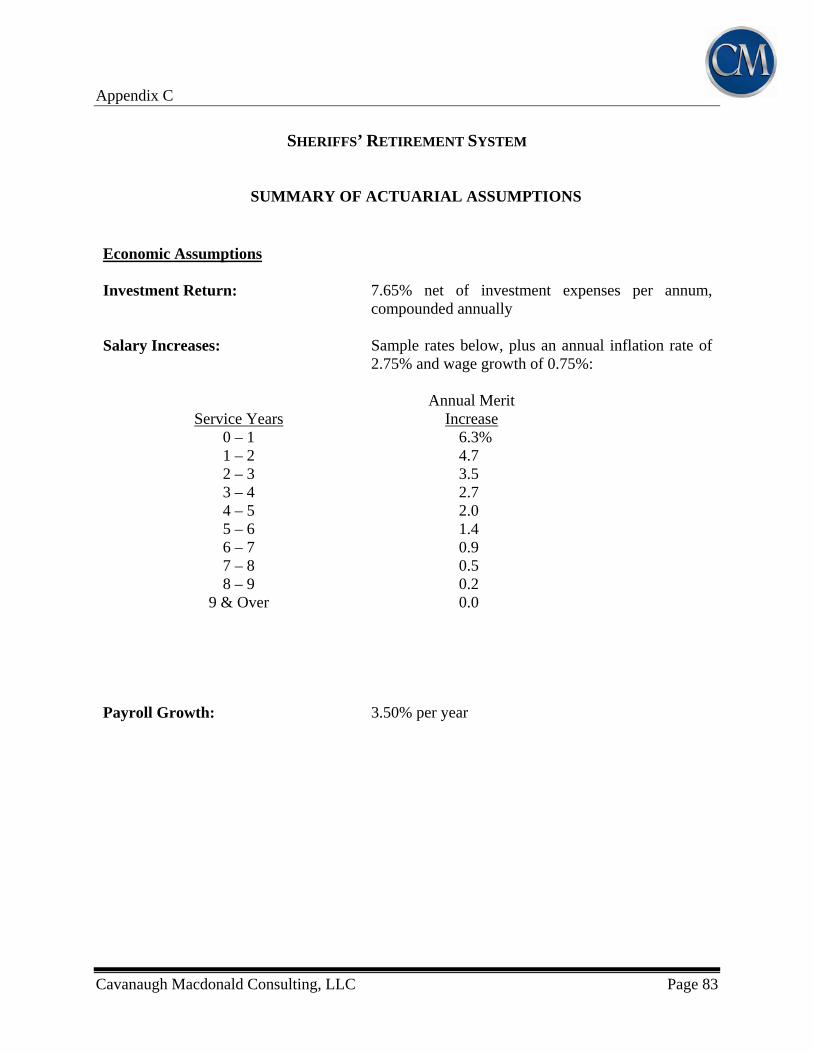
Appendix C
Cavanaugh Macdonald Consulting, LLC Page 83
SHERIFFS’ RETIREMENT SYSTEM
SUMMARY OF ACTUARIAL ASSUMPTIONS
Economic Assumptions Investment Return: 7.65% net of investment expenses per annum,
compounded annually Salary Increases: Sample rates below, plus an annual inflation rate of
2.75% and wage growth of 0.75%:
Annual Merit Service Years Increase
0 – 1 6.3% 1 – 2 4.7 2 – 3 3.5 3 – 4 2.7 4 – 5 2.0 5 – 6 1.4 6 – 7 0.9 7 – 8 0.5 8 – 9 0.2
9 & Over 0.0
Payroll Growth: 3.50% per year
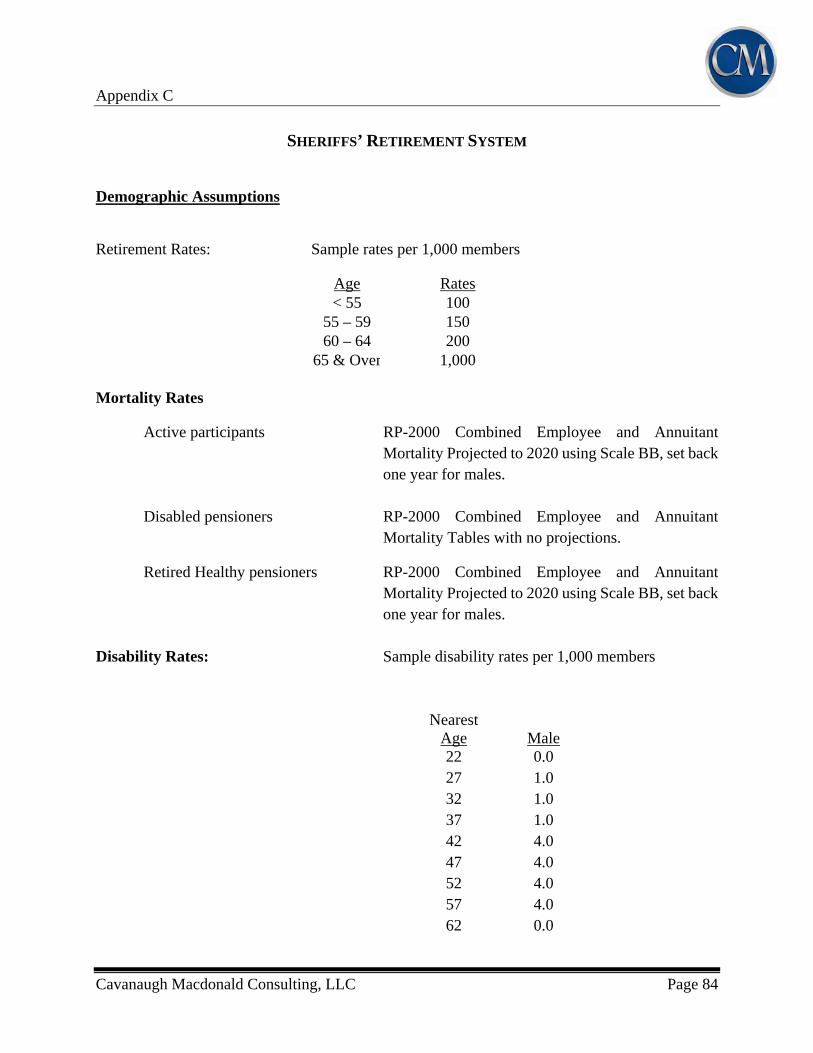
Appendix C
Cavanaugh Macdonald Consulting, LLC Page 84
SHERIFFS’ RETIREMENT SYSTEM
Demographic Assumptions
Retirement Rates: Sample rates per 1,000 members
Age Rates < 55 100
55 – 59 15060 – 64 200
65 & Over 1,000 Mortality Rates
Active participants RP-2000 Combined Employee and Annuitant Mortality Projected to 2020 using Scale BB, set back one year for males.
Disabled pensioners RP-2000 Combined Employee and Annuitant
Mortality Tables with no projections.
Retired Healthy pensioners RP-2000 Combined Employee and Annuitant Mortality Projected to 2020 using Scale BB, set back one year for males.
Disability Rates: Sample disability rates per 1,000 members
Nearest
Age
Male 22 0.0 27 1.0 32 1.0 37 1.0 42 4.0 47 4.0 52 4.0 57 4.0 62 0.0
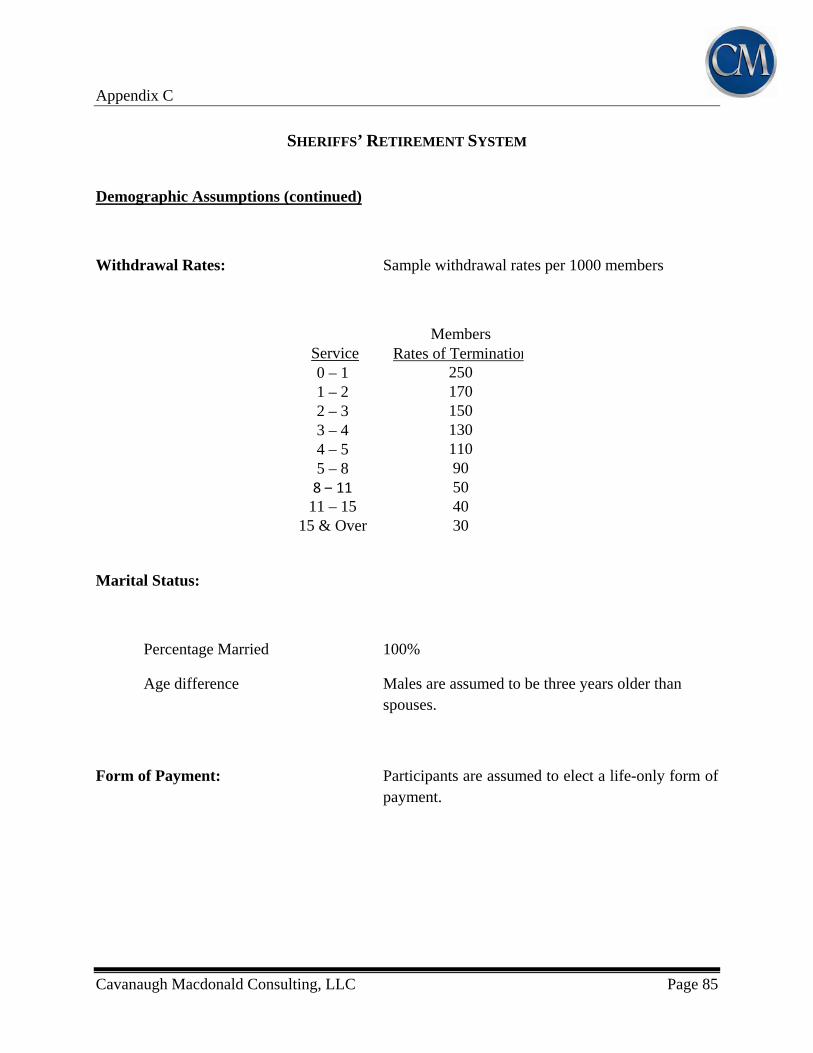
Appendix C
Cavanaugh Macdonald Consulting, LLC Page 85
SHERIFFS’ RETIREMENT SYSTEM
Demographic Assumptions (continued)
Withdrawal Rates: Sample withdrawal rates per 1000 members
Members Service Rates of Termination0 – 1 250 1 – 2 170 2 – 3 150 3 – 4 130 4 – 5 110 5 – 8 90 8 – 11 50
11 – 15 40 15 & Over 30
Marital Status:
Percentage Married 100%
Age difference Males are assumed to be three years older than spouses.
Form of Payment: Participants are assumed to elect a life-only form of payment.
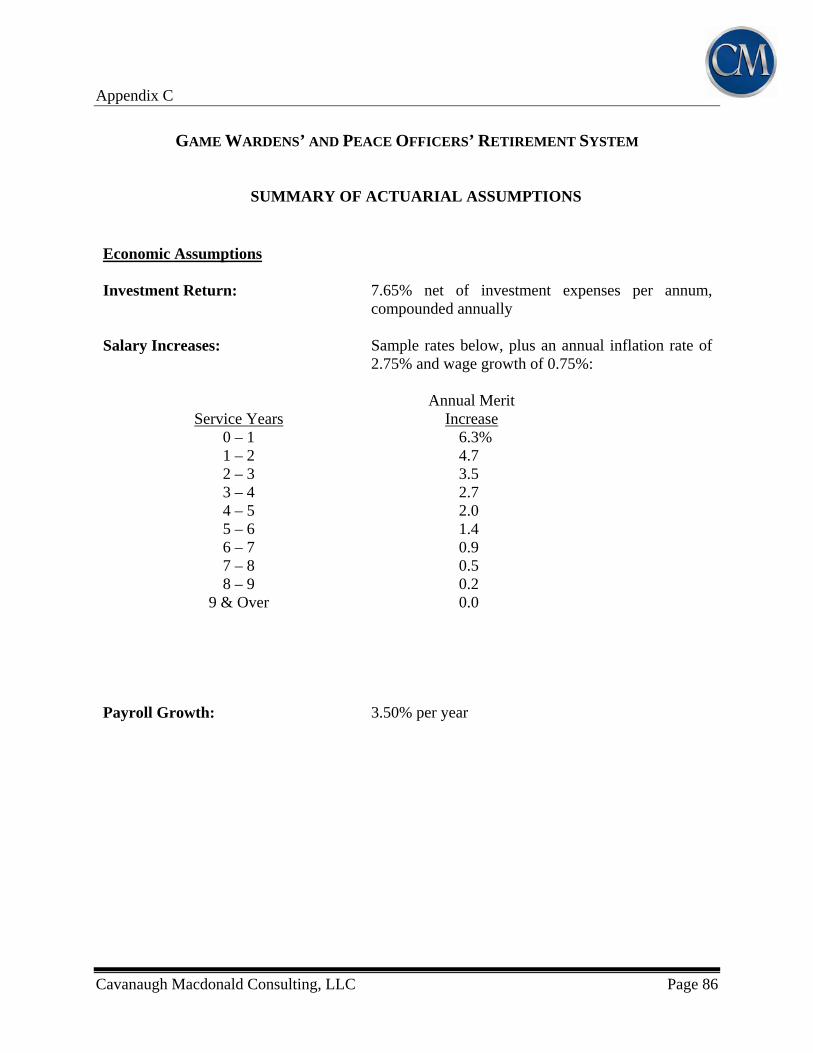
Appendix C
Cavanaugh Macdonald Consulting, LLC Page 86
GAME WARDENS’ AND PEACE OFFICERS’ RETIREMENT SYSTEM
SUMMARY OF ACTUARIAL ASSUMPTIONS
Economic Assumptions Investment Return: 7.65% net of investment expenses per annum,
compounded annually Salary Increases: Sample rates below, plus an annual inflation rate of
2.75% and wage growth of 0.75%:
Annual Merit Service Years Increase
0 – 1 6.3% 1 – 2 4.7 2 – 3 3.5 3 – 4 2.7 4 – 5 2.0 5 – 6 1.4 6 – 7 0.9 7 – 8 0.5 8 – 9 0.2
9 & Over 0.0
Payroll Growth: 3.50% per year
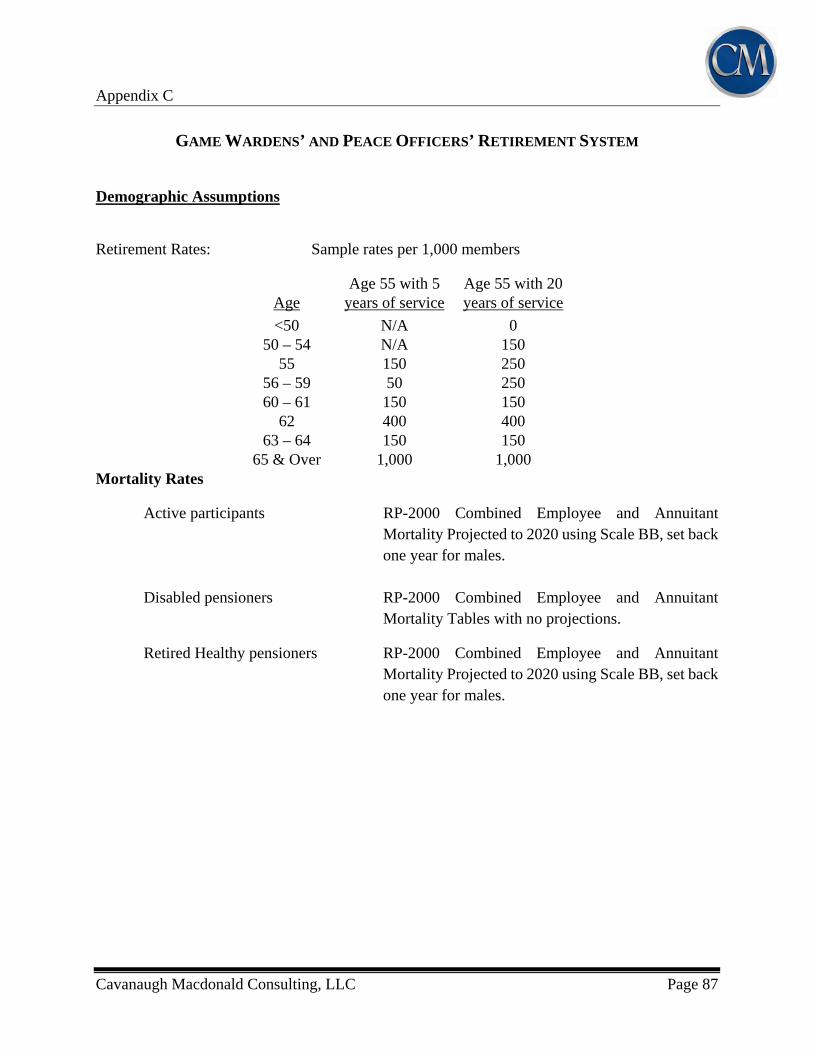
Appendix C
Cavanaugh Macdonald Consulting, LLC Page 87
GAME WARDENS’ AND PEACE OFFICERS’ RETIREMENT SYSTEM
Demographic Assumptions
Retirement Rates: Sample rates per 1,000 members
Age 55 with 5 Age 55 with 20 Age years of service years of service
<50 N/A 0 50 – 54 N/A 150
55 150 250 56 – 59 50 250 60 – 61 150 150
62 400 400 63 – 64 150 150
65 & Over 1,000 1,000Mortality Rates
Active participants RP-2000 Combined Employee and Annuitant Mortality Projected to 2020 using Scale BB, set back one year for males.
Disabled pensioners RP-2000 Combined Employee and Annuitant
Mortality Tables with no projections.
Retired Healthy pensioners RP-2000 Combined Employee and Annuitant Mortality Projected to 2020 using Scale BB, set back one year for males.
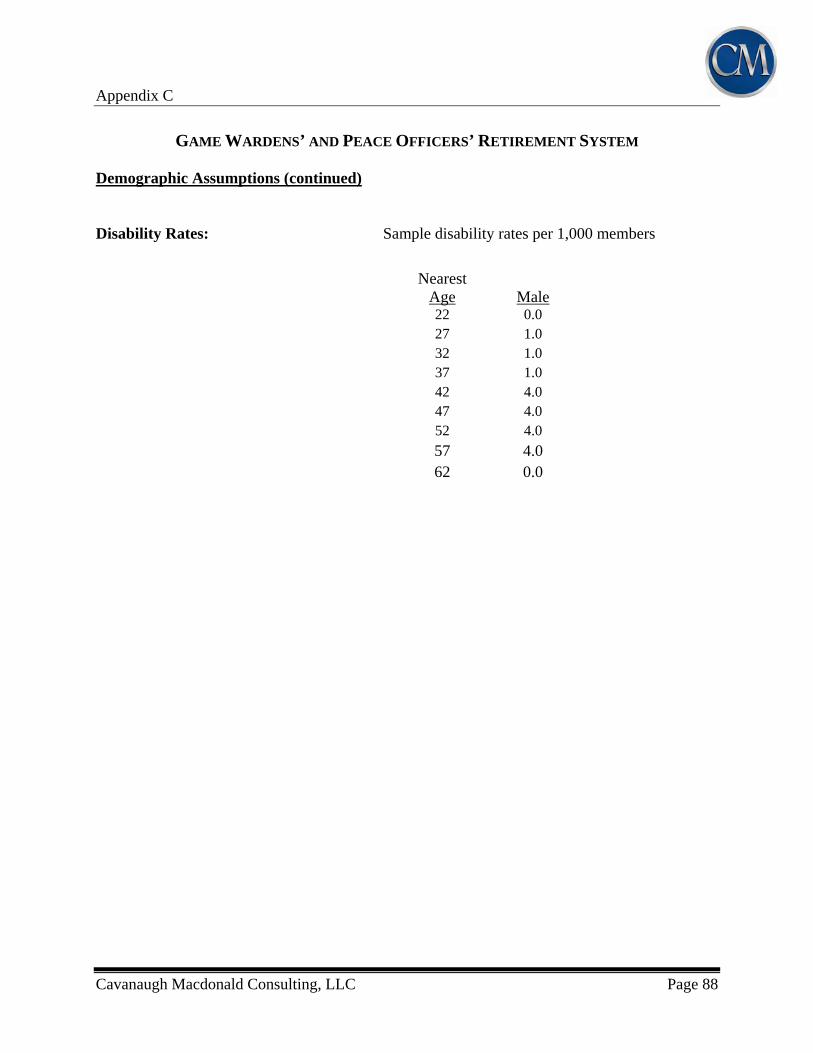
Appendix C
Cavanaugh Macdonald Consulting, LLC Page 88
GAME WARDENS’ AND PEACE OFFICERS’ RETIREMENT SYSTEM
Demographic Assumptions (continued)
Disability Rates: Sample disability rates per 1,000 members
Nearest Age
Male
22 0.0 27 1.0 32 1.0 37 1.0 42 4.0 47 4.0 52 4.0
57 4.0 62 0.0
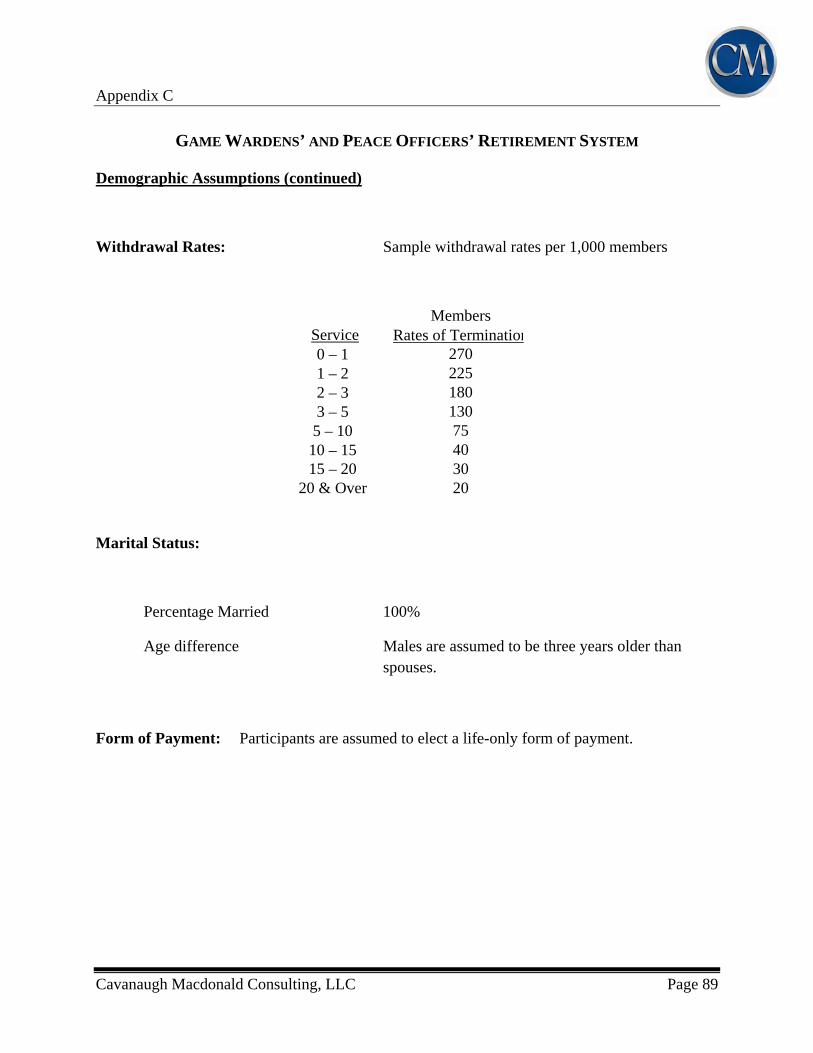
Appendix C
Cavanaugh Macdonald Consulting, LLC Page 89
GAME WARDENS’ AND PEACE OFFICERS’ RETIREMENT SYSTEM
Demographic Assumptions (continued)
Withdrawal Rates: Sample withdrawal rates per 1,000 members
Members Service Rates of Termination0 – 1 270 1 – 2 225 2 – 3 180 3 – 5 130 5 – 10 75 10 – 15 40 15 – 20 30
20 & Over 20
Marital Status:
Percentage Married 100%
Age difference Males are assumed to be three years older than spouses.
Form of Payment: Participants are assumed to elect a life-only form of payment.

Appendix C
Cavanaugh Macdonald Consulting, LLC Page 90
HIGHWAY PATROL OFFICERS’ RETIREMENT SYSTEM
SUMMARY OF ACTUARIAL ASSUMPTIONS
Economic Assumptions Investment Return: 7.65% net of investment expenses per annum,
compounded annually Salary Increases: Sample rates below, plus an annual inflation rate of
2.75% and wage growth of 0.75%:
Annual Merit Service Years Increase
0 – 1 6.3% 1 – 2 4.7 2 – 3 3.5 3 – 4 2.7 4 – 5 2.0 5 – 6 1.4 6 – 7 0.9 7 – 8 0.5 8 – 9 0.2
9 & Over 0.0
Payroll Growth: 3.50% per year
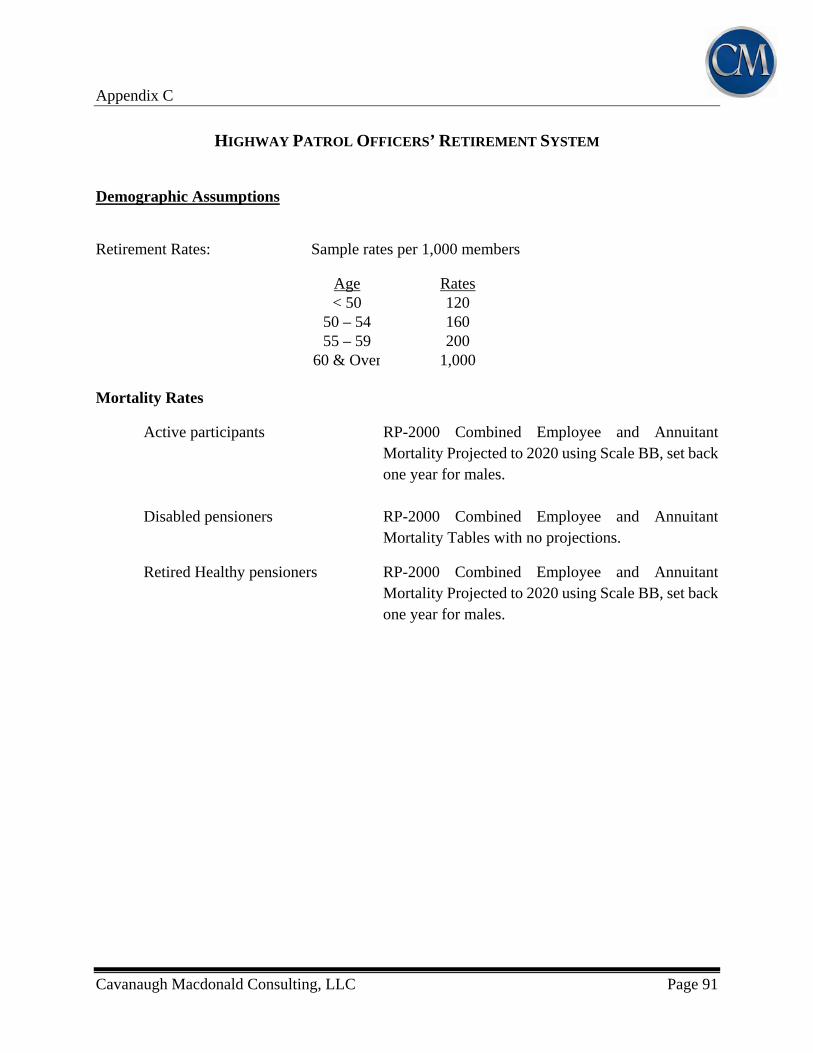
Appendix C
Cavanaugh Macdonald Consulting, LLC Page 91
HIGHWAY PATROL OFFICERS’ RETIREMENT SYSTEM
Demographic Assumptions
Retirement Rates: Sample rates per 1,000 members
Age Rates < 50 120
50 – 54 16055 – 59 200
60 & Over 1,000 Mortality Rates
Active participants RP-2000 Combined Employee and Annuitant Mortality Projected to 2020 using Scale BB, set back one year for males.
Disabled pensioners RP-2000 Combined Employee and Annuitant
Mortality Tables with no projections.
Retired Healthy pensioners RP-2000 Combined Employee and Annuitant Mortality Projected to 2020 using Scale BB, set back one year for males.
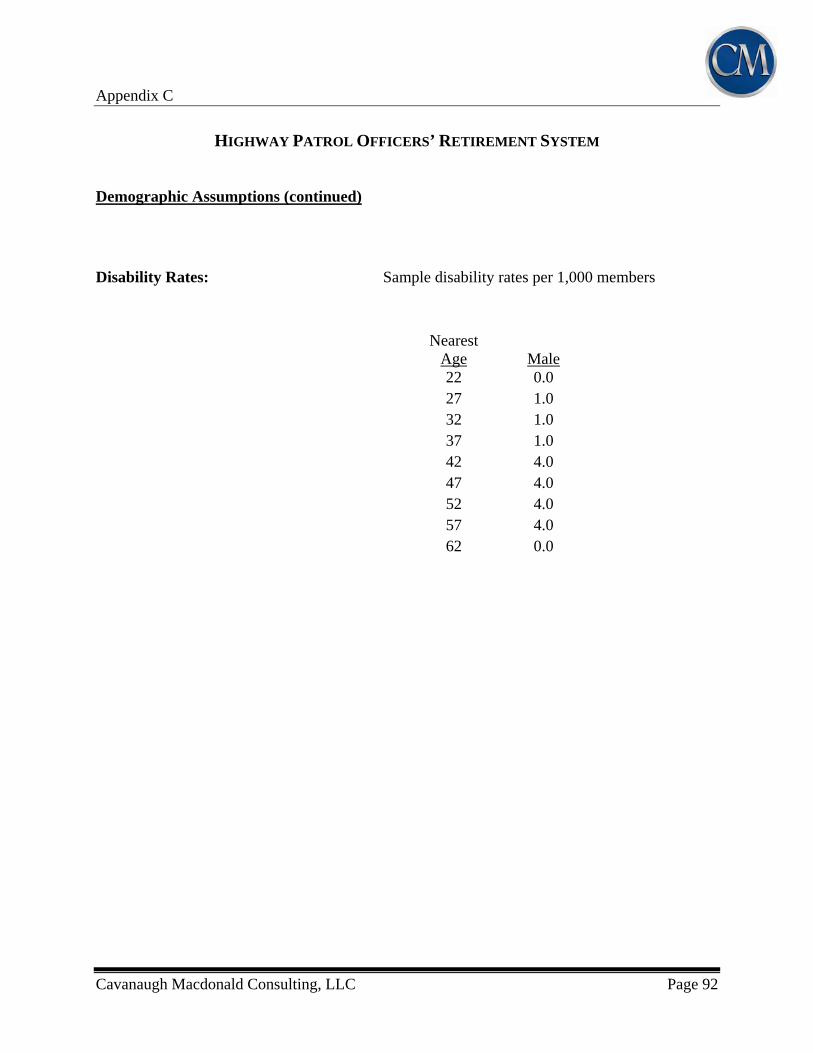
Appendix C
Cavanaugh Macdonald Consulting, LLC Page 92
HIGHWAY PATROL OFFICERS’ RETIREMENT SYSTEM
Demographic Assumptions (continued)
Disability Rates: Sample disability rates per 1,000 members
Nearest
Age
Male 22 0.0 27 1.0 32 1.0 37 1.0 42 4.0 47 4.0 52 4.0 57 4.0 62 0.0
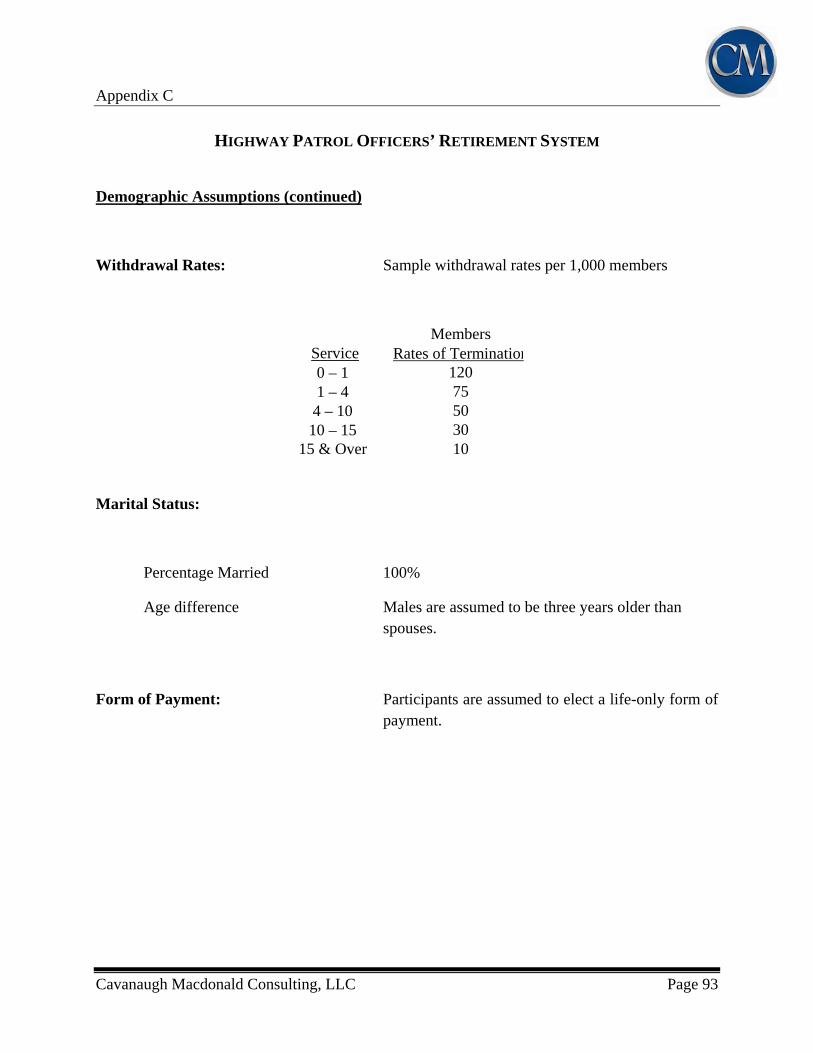
Appendix C
Cavanaugh Macdonald Consulting, LLC Page 93
HIGHWAY PATROL OFFICERS’ RETIREMENT SYSTEM
Demographic Assumptions (continued)
Withdrawal Rates: Sample withdrawal rates per 1,000 members
Members Service Rates of Termination0 – 1 120 1 – 4 75 4 – 10 50 10 – 15 30
15 & Over 10
Marital Status:
Percentage Married 100%
Age difference Males are assumed to be three years older than spouses.
Form of Payment: Participants are assumed to elect a life-only form of payment.

Appendix C
Cavanaugh Macdonald Consulting, LLC Page 94
MUNICIPAL POLICE OFFICERS’ RETIREMENT SYSTEM
SUMMARY OF ACTUARIAL ASSUMPTIONS
Economic Assumptions Investment Return: 7.65% net of investment expenses per annum,
compounded annually Salary Increases: Sample rates below, plus an annual inflation rate of
2.75% and wage growth of 0.75%:
Annual Merit Service Years Increase
0 – 1 6.6% 1 – 2 4.9 2 – 3 3.7 3 – 4 2.8 4 – 5 2.1 5 – 6 1.5 6 – 7 1.0 7 – 8 0.6 8 – 9 0.2
9 & Over 0.0
Payroll Growth: 3.50% per year
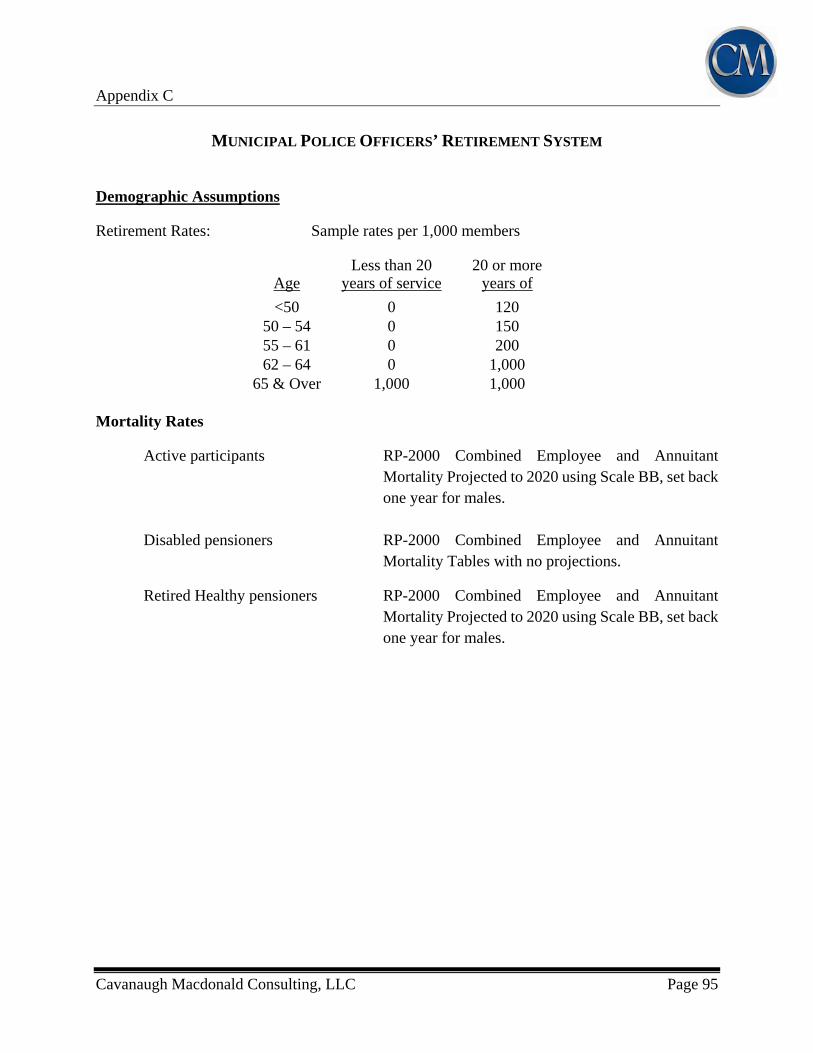
Appendix C
Cavanaugh Macdonald Consulting, LLC Page 95
MUNICIPAL POLICE OFFICERS’ RETIREMENT SYSTEM
Demographic Assumptions
Retirement Rates: Sample rates per 1,000 members
Less than 20 20 or moreAge years of service years of
<50 0 120 50 – 54 0 150 55 – 61 0 200 62 – 64 0 1,000
65 & Over 1,000 1,000 Mortality Rates
Active participants RP-2000 Combined Employee and Annuitant Mortality Projected to 2020 using Scale BB, set back one year for males.
Disabled pensioners RP-2000 Combined Employee and Annuitant
Mortality Tables with no projections.
Retired Healthy pensioners RP-2000 Combined Employee and Annuitant Mortality Projected to 2020 using Scale BB, set back one year for males.
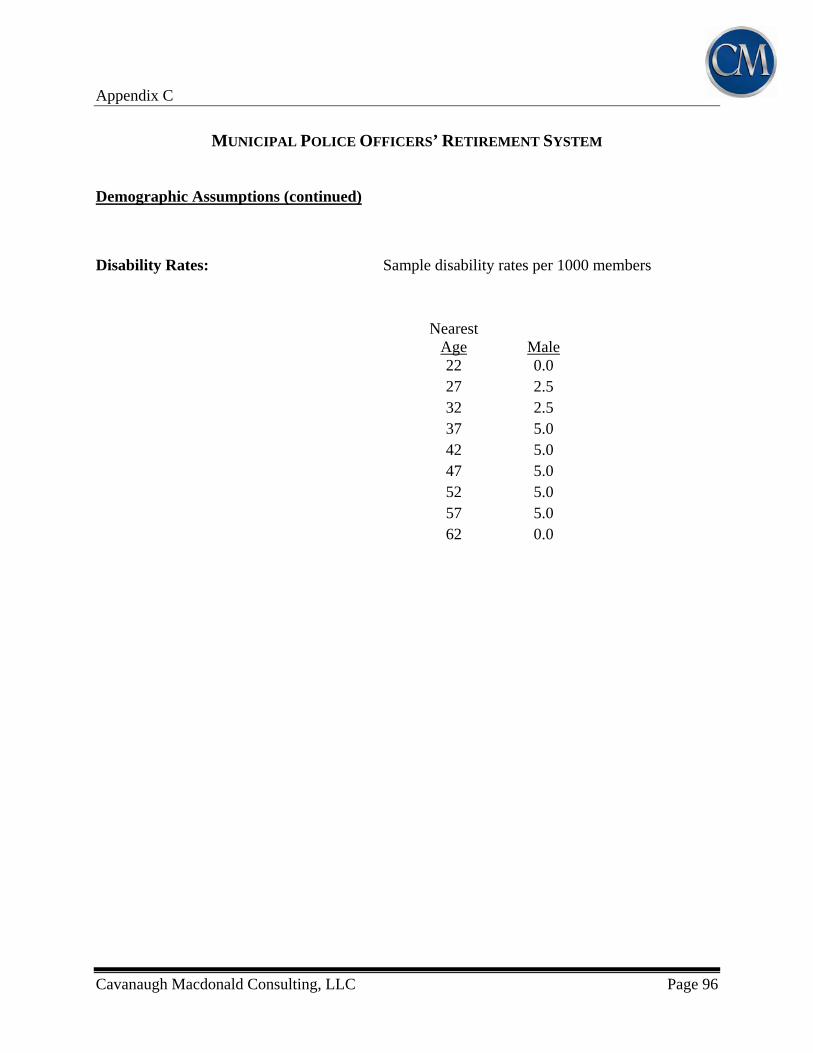
Appendix C
Cavanaugh Macdonald Consulting, LLC Page 96
MUNICIPAL POLICE OFFICERS’ RETIREMENT SYSTEM
Demographic Assumptions (continued)
Disability Rates: Sample disability rates per 1000 members
Nearest
Age
Male 22 0.0 27 2.5 32 2.5 37 5.0 42 5.0 47 5.0 52 5.0 57 5.0 62 0.0
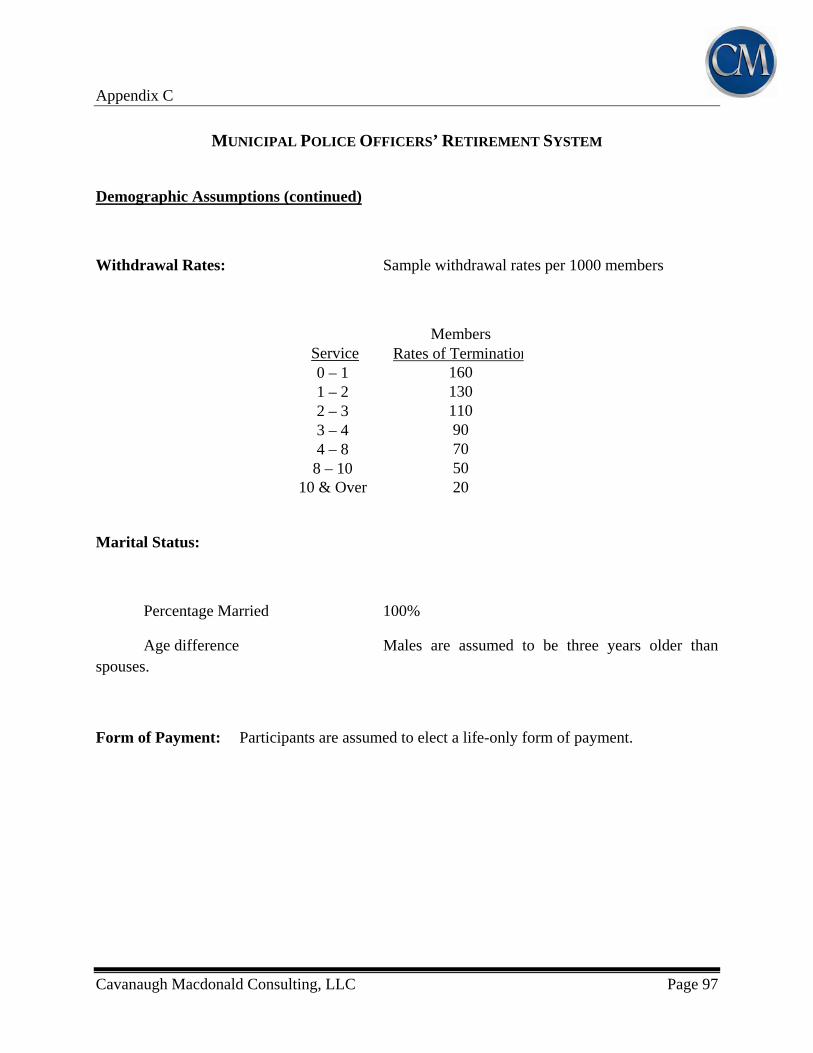
Appendix C
Cavanaugh Macdonald Consulting, LLC Page 97
MUNICIPAL POLICE OFFICERS’ RETIREMENT SYSTEM
Demographic Assumptions (continued)
Withdrawal Rates: Sample withdrawal rates per 1000 members
Members Service Rates of Termination0 – 1 160 1 – 2 130 2 – 3 110 3 – 4 90 4 – 8 70 8 – 10 50
10 & Over 20
Marital Status:
Percentage Married 100%
Age difference Males are assumed to be three years older than spouses.
Form of Payment: Participants are assumed to elect a life-only form of payment.
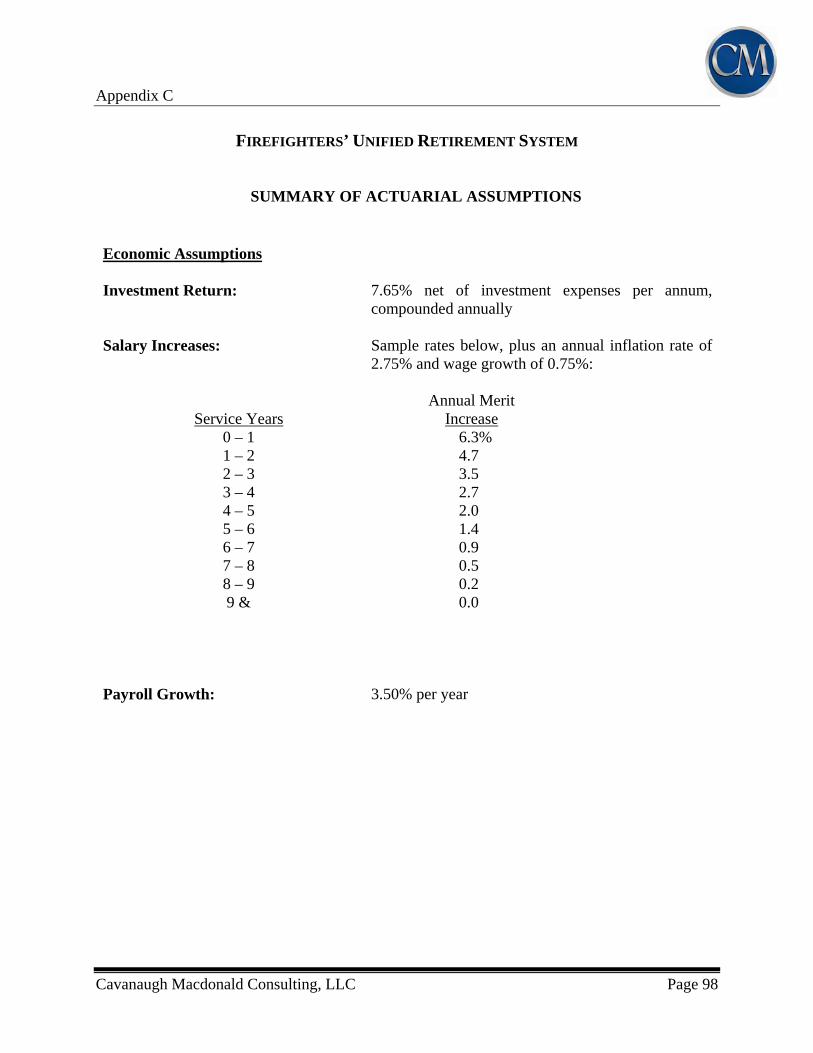
Appendix C
Cavanaugh Macdonald Consulting, LLC Page 98
FIREFIGHTERS’ UNIFIED RETIREMENT SYSTEM
SUMMARY OF ACTUARIAL ASSUMPTIONS
Economic Assumptions Investment Return: 7.65% net of investment expenses per annum,
compounded annually Salary Increases: Sample rates below, plus an annual inflation rate of
2.75% and wage growth of 0.75%:
Annual Merit Service Years Increase
0 – 1 6.3% 1 – 2 4.7 2 – 3 3.5 3 – 4 2.7 4 – 5 2.0 5 – 6 1.4 6 – 7 0.9 7 – 8 0.5 8 – 9 0.2 9 & 0.0
Payroll Growth: 3.50% per year
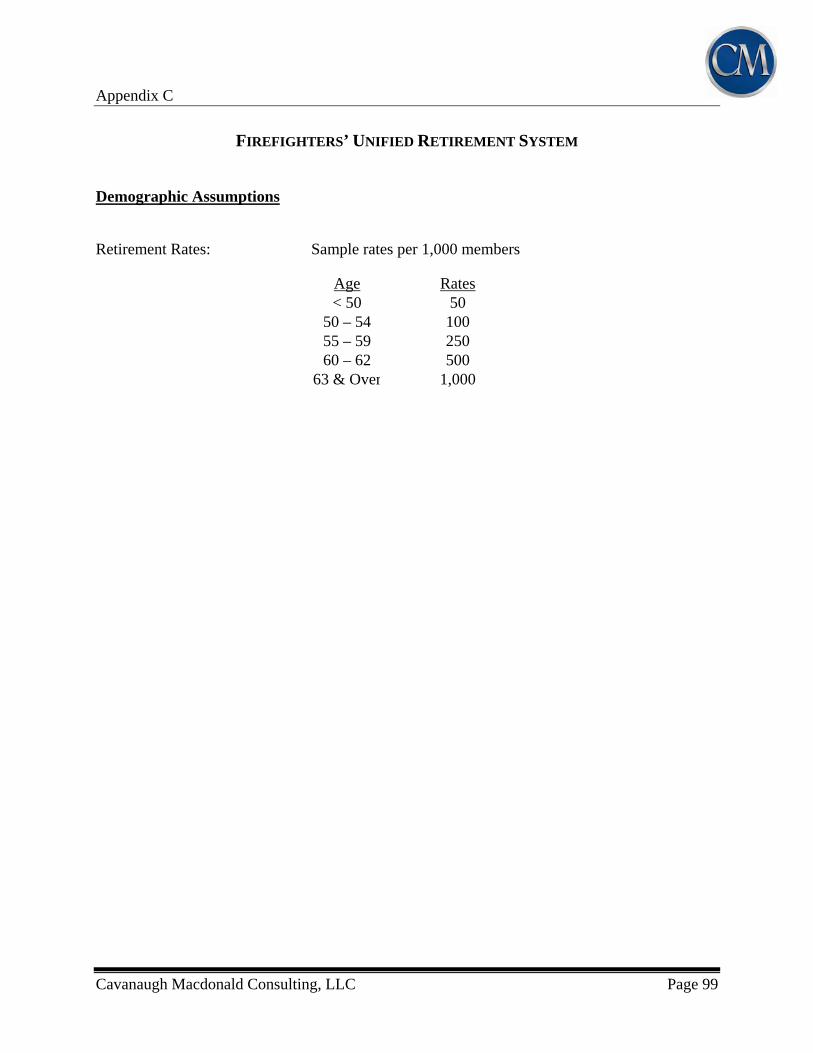
Appendix C
Cavanaugh Macdonald Consulting, LLC Page 99
FIREFIGHTERS’ UNIFIED RETIREMENT SYSTEM
Demographic Assumptions
Retirement Rates: Sample rates per 1,000 members
Age Rates < 50 50
50 – 54 10055 – 59 25060 – 62 500
63 & Over 1,000
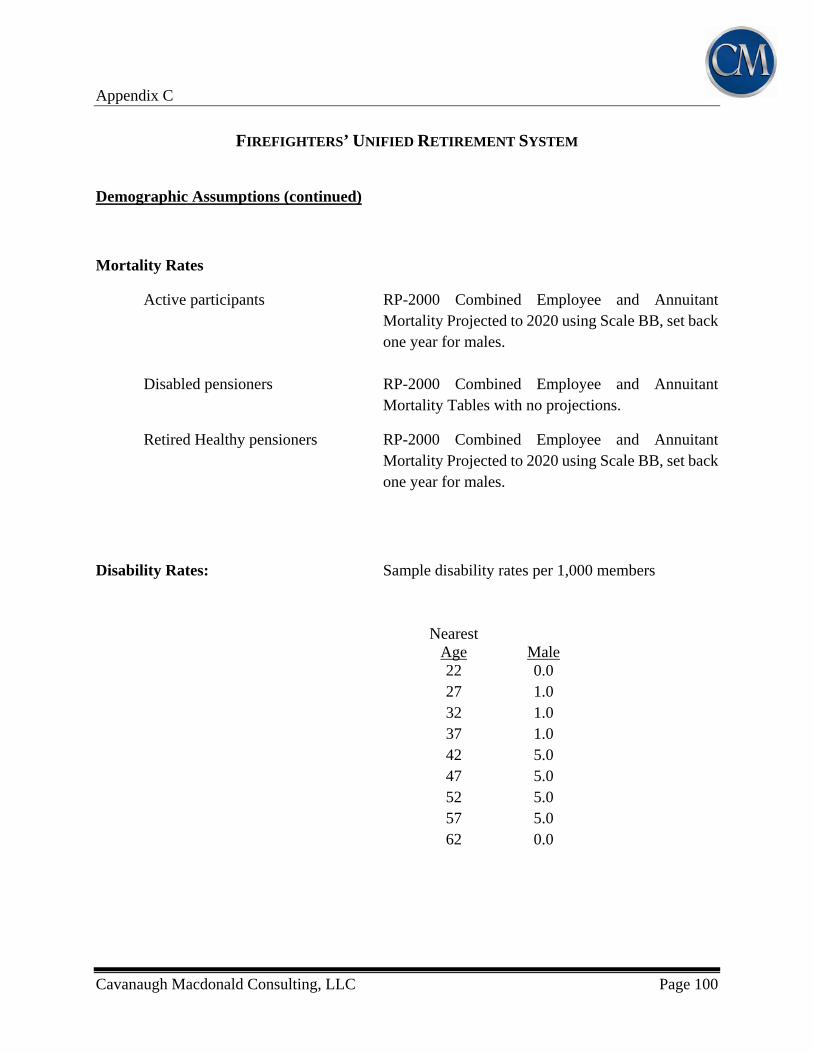
Appendix C
Cavanaugh Macdonald Consulting, LLC Page 100
FIREFIGHTERS’ UNIFIED RETIREMENT SYSTEM
Demographic Assumptions (continued)
Mortality Rates
Active participants RP-2000 Combined Employee and Annuitant Mortality Projected to 2020 using Scale BB, set back one year for males.
Disabled pensioners RP-2000 Combined Employee and Annuitant
Mortality Tables with no projections.
Retired Healthy pensioners RP-2000 Combined Employee and Annuitant Mortality Projected to 2020 using Scale BB, set back one year for males.
Disability Rates: Sample disability rates per 1,000 members
Nearest
Age
Male 22 0.0 27 1.0 32 1.0 37 1.0 42 5.0 47 5.0 52 5.0 57 5.0 62 0.0
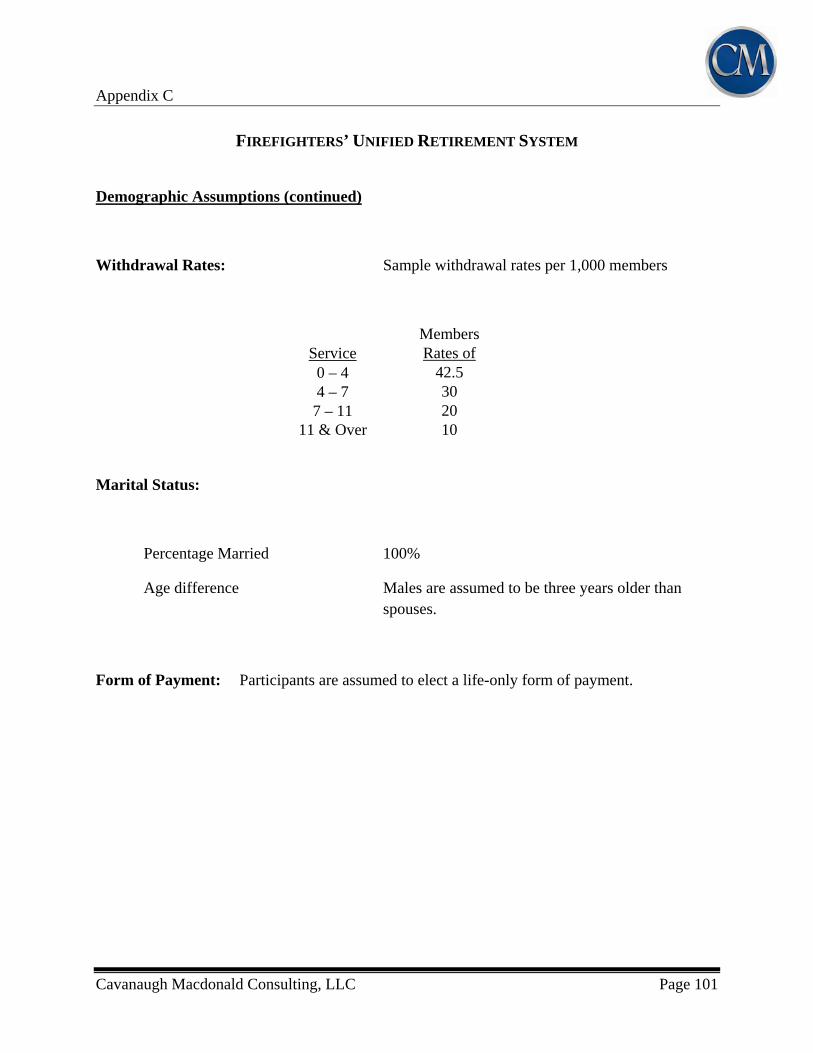
Appendix C
Cavanaugh Macdonald Consulting, LLC Page 101
FIREFIGHTERS’ UNIFIED RETIREMENT SYSTEM
Demographic Assumptions (continued)
Withdrawal Rates: Sample withdrawal rates per 1,000 members
Members Service Rates of
0 – 4 42.5 4 – 7 30 7 – 11 20
11 & Over 10
Marital Status:
Percentage Married 100%
Age difference Males are assumed to be three years older than spouses.
Form of Payment: Participants are assumed to elect a life-only form of payment.
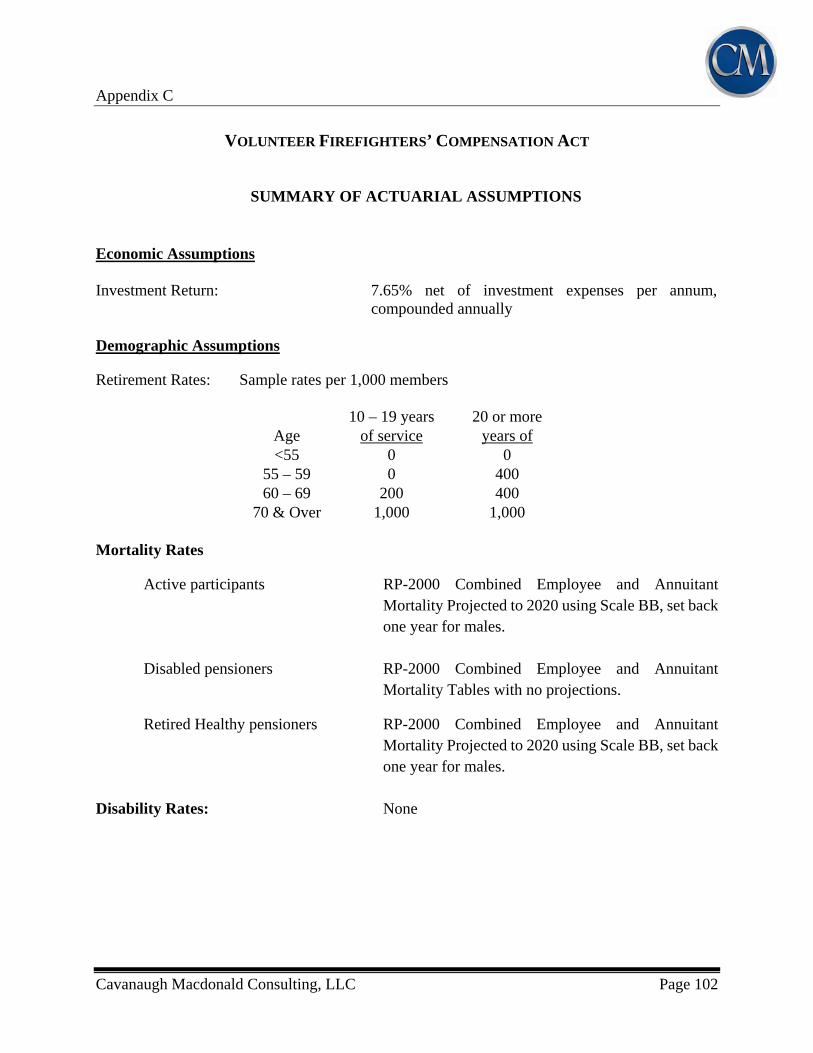
Appendix C
Cavanaugh Macdonald Consulting, LLC Page 102
VOLUNTEER FIREFIGHTERS’ COMPENSATION ACT
SUMMARY OF ACTUARIAL ASSUMPTIONS
Demographic Assumptions
Retirement Rates: Sample rates per 1,000 members
10 – 19 years 20 or more Age of service years of <55 0 0
55 – 59 0 400 60 – 69 200 400
70 & Over 1,000 1,000 Mortality Rates
Active participants RP-2000 Combined Employee and Annuitant Mortality Projected to 2020 using Scale BB, set back one year for males.
Disabled pensioners RP-2000 Combined Employee and Annuitant
Mortality Tables with no projections.
Retired Healthy pensioners RP-2000 Combined Employee and Annuitant Mortality Projected to 2020 using Scale BB, set back one year for males.
Disability Rates: None
Economic Assumptions Investment Return: 7.65% net of investment expenses per annum,
compounded annually
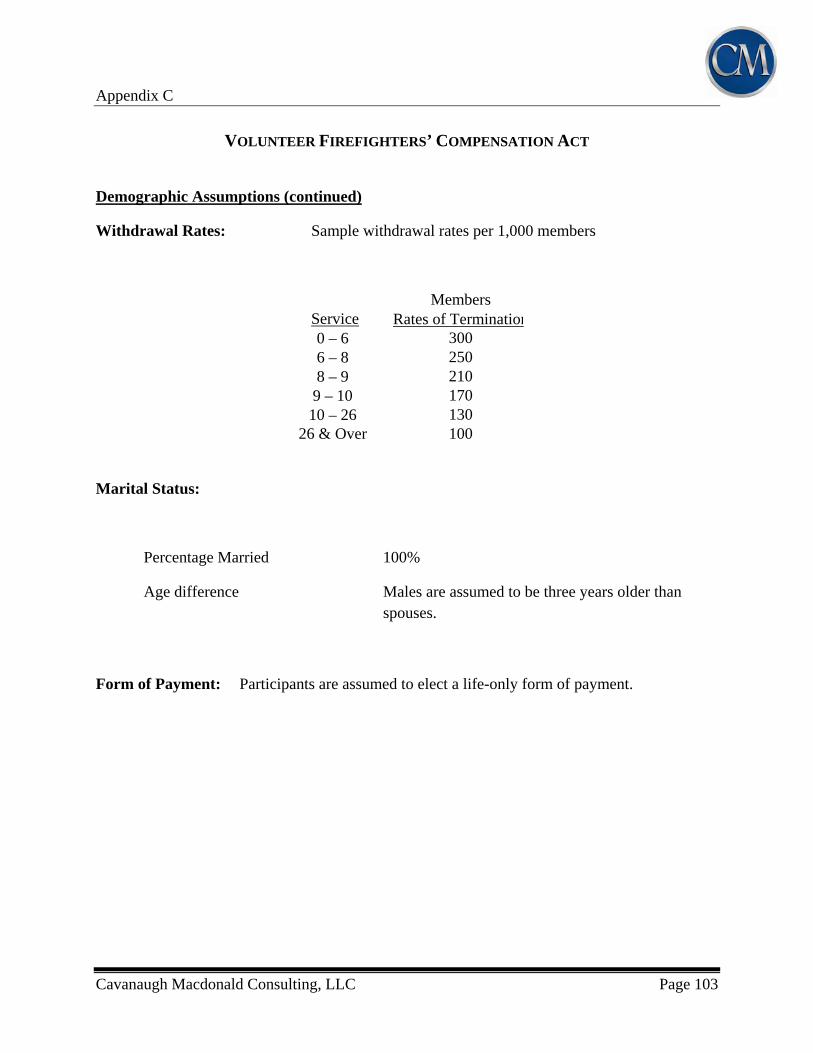
Appendix C
Cavanaugh Macdonald Consulting, LLC Page 103
VOLUNTEER FIREFIGHTERS’ COMPENSATION ACT
Demographic Assumptions (continued)
Withdrawal Rates: Sample withdrawal rates per 1,000 members
Members Service Rates of Termination0 – 6 300 6 – 8 250 8 – 9 210 9 – 10 170 10 – 26 130
26 & Over 100
Marital Status:
Percentage Married 100%
Age difference Males are assumed to be three years older than spouses.
Form of Payment: Participants are assumed to elect a life-only form of payment.