monmouth county, nj substance abuse stats
TRANSCRIPT

New Jersey Drug and Alcohol Abuse Treatment
Substance Abuse Overview 2014
Monmouth County
Prepared by Limei Zhu
Department of Human Services Division of Mental Health and Addiction Services
Office of Planning, Research, Evaluation and Prevention Trenton, New Jersey
May 2015

DEPARTMENT OF HUMAN SERVICES
DIVISION OF MENTAL HEALTH AND ADDICTION SERVICES 222 SOUTH WARREN STREET
PO BOX 700 TRENTON, NJ 08625 Elizabeth Connolly
Act Commissioner Chris Christie
Governor LYNN A. KOVICH
Assistant Commissioner May 2015
This statewide Substance Abuse Overview provides statistics on substance abuse treatment in New Jersey for calendar year 2014. In 2014 there were 65,553 treatment admissions and 62,525 discharges reported to the New Jersey Department of Human Services, Division of Mental Health and Addiction Services by substance abuse treatment providers. These reports were submitted through the web-based New Jersey Substance Abuse Monitoring System (NJ-SAMS). A few changes in this report now include on Fee-For-Services admissions, Federal Poverty Level and discharge continuing care.
Reports for individual counties include:
° Admissions for Substance Abuse Treatment by County of Residence ° Admissions for Substance Abuse Treatment by County of Treatment Provider ° Substance Abuse Admissions by Municipality and Primary Drug ° Substance Abuse Admissions by Primary Drug within Municipality ° Map for Number of Substance Abuse Admissions by Municipality of Residence ° Admissions by Municipality of Residence, Age Group and Primary Drug ° Admissions by Age Group, Gender and Primary Drug ° Discharges for Substance Abuse Treatment by County of Residence ° Discharges for Substance Abuse Treatment by County of Treatment Provider
If you have any questions about this report you may contact us by email at [email protected] or by telephone at (609) 292-8930. Sincerely,
Suzanne Borys, Ed. D., Assistant Division Director Office of Planning, Research, Evaluation and Prevention

New Jersey Substance Abuse Monitoring System (NJ-SAMS) Substance Abuse Treatment Admissions 1/1/2014-12/31/2014 Resident of Monmouth County Primary Drug** Highest School Grade Completed Alcohol 1,585 31% Completed High School 2,526 42% Heroin 1,998 39% Some College 1,403 23% Other Opiates 381 7% Cocaine 270 5% Employment Status Marijuana 749 15% Unemployed 1,605 27% Other Drugs 148 3% Student 313 5% Not in Labor Force 1,262 21% Intravenous Drug Users 1,843 30% Employed Full/Part Time 1,951 32% Not Assessed 918 15% Smoke Tobacco (Yes)** 3,178 62% Living Arrangement Level of Care Homeless 130 2% Outpatient Care (OP) 2,012 33% Dependent Living/Institution 652 11% Intensive Outpatient (IOP) 1,163 19% Independent Living 4,432 73% Partial Hospitalization 32 1% Opioid Maintenance OP 608 10% Marital Status Opioid Maintenance IOP 38 1% Single/Divorced 5,056 84% Extended Care 0 0% Married/Civil Union 724 12% Halfway House 148 2% Widowed 68 1% Long-Term Residential 143 2% Separated 201 3% Short-Term Residential 789 13% Hospital Based Residential 1 0% Legal Problem* Detox Residential 736 12% None 1,530 25% Detox Hospital 5 0% Case Pending 680 11% Detox Outpatient Non-Methadone 4 0% Probation/Parole 1,456 24% Detox Outpatient Methadone 153 3% DWI License Suspension 881 15% Non-traditional Program 1 0% Drug Court 461 8% Early Prevention 216 4% DCCP (DYFS)/Family Court 367 6% Other 207 3% Medication Assisted Therapy Planned in Treatment Methadone 828 14% Arrest in the Last 30 Days (Yes) 257 4% Suboxone 197 3% Special Population* Referral Source DCCP (DYFS)/CPSAI 411 7% Self-referral 1,956 32% DWI/DUI 1,517 25% Family/Friend 364 6% Developmental Disability 13 0% Addiction Services Program 566 9% Blind and Visually Impaired 8 0% Workforce NJ SAI 83 1% Deaf and Hard of Hearing 10 0% DCCP (formerly DYFS) 258 4% Mental Health 114 2% Federal Poverty Level (0-133%)** 3,477 78% Criminal Justice 1,490 25% IDRC 871 14% Health Insurance at Admission* Other/Not Assessed 325 5% No Insurance 4,284 71% Medicaid 915 15% Sex Medicare 133 2% Male 3,991 66% Private Insurance 923 15% Female 2,055 34% Other Insurance 202 3% Age at Admission Treated in County of Residence 4,797 79% Under 18 252 4% 18-21 619 10% County Where Patient Was Treated 22-24 689 11% Atlantic 79 1% Middlesex 88 1% 25-29 1,254 21% Bergen 19 0% Monmouth 4,797 79% 30-34 925 15% Burlington 0 0% Morris 25 0% 35-44 1,083 18% Camden 1 0% Ocean 302 5% 45-54 845 14% Cape May 0 0% Passaic 213 4% 55 and over 381 6% Cumberland 24 0% Salem 0 0% Essex 82 1% Somerset 166 3% Race/Ethnicity Gloucester 28 0% Sussex 91 2% White (non-Hispanic) 4,679 77% Hudson 44 1% Union 31 1% Black (non-Hispanic) 849 14% Hunterdon 12 0% Warren 2 0% Hispanic Origin 473 8% Mercer 45 1% Other 0 0% Other 48 1% Fee For Service Admissions 1,875 31% Total Admissions = 6,049 Fee For Service Unique Clients 1,263 29% Unduplicated Clients Admitted = 4,420 *Totals may be greater than 100% because of multiple responses. **Percentage calculations excluded missing values.

New Jersey Substance Abuse Monitoring System (NJ-SAMS) Substance Abuse Treatment Admissions 1/1/2014-12/31/2014 Treatment Site in Monmouth County Primary Drug** Highest School Grade Completed Alcohol 1,687 27% Completed High School 2,923 37% Heroin 2,613 42% Some College 1,643 21% Other Opiates 478 8% Cocaine 314 5% Employment Status Marijuana 891 14% Unemployed 1,936 25% Other Drugs 214 3% Student 409 5% Not in Labor Force 1,778 23% Intravenous Drug Users 2,833 36% Employed Full/Part Time 2,017 26% Not Assessed 1,738 22% Smoke Tobacco (Yes)** 4,113 67% Living Arrangement Level of Care Homeless 162 2% Outpatient Care (OP) 1,995 25% Dependent Living/Institution 958 12% Intensive Outpatient (IOP) 1,206 15% Independent Living 5,144 65% Partial Hospitalization 5 0% Opioid Maintenance OP 610 8% Marital Status Opioid Maintenance IOP 37 0% Single/Divorced 6,735 85% Extended Care 0 0% Married/Civil Union 778 10% Halfway House 180 2% Widowed 95 1% Long-Term Residential 113 1% Separated 270 3% Short-Term Residential 1,889 24% Hospital Based Residential 0 0% Legal Problem* Detox Residential 1,426 18% None 1,842 23% Detox Hospital 4 0% Case Pending 907 12% Detox Outpatient Non-Methadone 0 0% Probation/Parole 1,681 21% Detox Outpatient Methadone 210 3% DWI License Suspension 836 11% Non-traditional Program 1 0% Drug Court 726 9% Early Prevention 202 3% DCCP (DYFS)/Family Court 379 5% Other 286 4% Medication Assisted Therapy Planned in Treatment Methadone 875 11% Arrest in the Last 30 Days (Yes) 326 4% Suboxone 84 1% Special Population* Referral Source DCCP (DYFS)/CPSAI 399 5% Self-referral 3,066 39% DWI/DUI 1,776 23% Family/Friend 453 6% Developmental Disability 17 0% Addiction Services Program 1,004 13% Blind and Visually Impaired 9 0% Workforce NJ SAI 106 1% Deaf and Hard of Hearing 10 0% DCPP (formerly DYFS) 229 3% Mental Health 113 1% Federal Poverty Level (0-133%)** 4,897 78% Criminal Justice 1,778 23% IDRC 796 10% Health Insurance at Admission* Other/Not Assessed 309 4% No Insurance 5,883 75% Medicaid 1,052 13% Sex Medicare 155 2% Male 5,309 67% Private Insurance 1,054 13% Female 2,566 33% Other Insurance 224 3% Age at Admission Treated in County of Residence 4,797 61% Under 18 371 5% 18-21 733 9% County of Residence 22-24 964 12% Atlantic 123 2% Middlesex 612 8% 25-29 1,678 21% Bergen 98 1% Monmouth 4,797 61% 30-34 1,250 16% Burlington 166 2% Morris 117 1% 35-44 1,379 18% Camden 188 2% Ocean 1,029 13% 45-54 1,068 14% Cape May 87 1% Passaic 27 0% 55 and over 434 6% Cumberland 81 1% Salem 31 0% Essex 33 0% Somerset 44 1% Race/Ethnicity Gloucester 80 1% Sussex 9 0% White (non-Hispanic) 6,202 79% Hudson 52 1% Union 86 1% Black (non-Hispanic) 1,010 13% Hunterdon 9 0% Warren 45 1% Hispanic Origin 590 7% Mercer 130 2% Other 34 0% Other 76 1% Fee For Service Admissions 2,666 34% Total Admissions = 7,878 Fee For Service Unique Client 1,652 29% Unduplicated Clients Admitted = 5,668 *Totals may be greater than 100% because of multiple responses. **Percentage calculation excluded missing values.

Substance Abuse Admissions by Municipality and Primary Drug 2014 NJ Resident Admissions
Primary Drug Alcohol Cocaine/
Crack Heroin Other
Opiates Marijuana/ Hashish
Other Drugs
Unknown Total
Monmouth County
N % N % N % N % N % N % N % N % Aberdeen Twp 28 2 8 3 28 1 8 2 3 0 1 1 12 1 88 1Allenhurst Boro 2 0 1 0 2 1 2 0 7 0Allentown Boro 7 0 2 0 2 1 1 1 7 1 19 0Asbury Park City 119 8 51 19 144 7 21 5 101 13 8 5 44 5 488 8Atlantic Highlands B 23 1 1 0 31 2 1 0 8 1 3 2 8 1 75 1Avon By The Sea Boro 7 0 1 0 12 1 3 1 1 0 3 0 27 0Belmar Boro 35 2 6 2 47 2 8 2 7 1 3 2 25 3 131 2Bradley Beach Boro 21 1 2 1 25 1 1 0 5 1 2 1 8 1 64 1Brielle Boro 16 1 15 1 2 0 7 1 40 1Colts Neck Township 9 1 1 0 14 1 2 1 1 0 3 2 8 1 38 1Deal Boro 1 0 1 0 1 0 2 1 2 0 1 1 8 0Eatontown Boro 43 3 8 3 57 3 11 3 30 4 3 2 18 2 170 3Englishtown Boro 7 0 8 3 15 1 2 1 4 1 1 1 9 1 46 1Fair Haven Boro 18 1 1 0 3 0 1 0 2 0 25 0Farmingdale Boro 7 0 1 0 27 1 4 1 5 1 13 1 57 1Freehold Boro 31 2 2 1 41 2 6 2 26 3 2 1 14 2 122 2Freehold Twp 53 3 8 3 67 3 19 5 19 3 8 5 52 6 226 4Hazlet Twp 47 3 4 1 62 3 18 5 19 3 3 2 18 2 171 3Highlands Boro 26 2 2 1 34 2 7 2 5 1 2 1 7 1 83 1Holmdel Twp 19 1 20 1 8 2 8 1 2 1 11 1 68 1Howell Twp 68 4 6 2 128 6 30 8 34 5 5 3 69 8 340 6Interlaken Boro 2 0 3 0 2 0 7 0Keansburg Boro 50 3 13 5 111 6 39 10 32 4 13 9 29 3 287 5Keyport Boro 34 2 7 3 50 3 14 4 10 1 1 1 28 3 144 2Little Silver Boro 10 1 4 0 3 1 4 1 1 1 3 0 25 0Long Branch City 114 7 26 10 135 7 19 5 43 6 6 4 48 5 391 6Manalapan Twp 29 2 9 3 51 3 14 4 22 3 8 5 38 4 171 3Manasquan Boro 28 2 2 1 34 2 3 1 7 1 1 1 17 2 92 2Marlboro Twp 28 2 2 1 33 2 8 2 9 1 27 3 107 2Matawan Boro 42 3 7 3 37 2 5 1 8 1 5 3 21 2 125 2Middletown Twp 118 7 10 4 167 8 42 11 47 6 10 7 64 7 458 8Millstone Twp 6 0 5 0 2 1 3 0 1 1 2 0 19 0Monmouth Beach Boro 4 0 4 1 7 0 4 1 1 0 6 1 26 0Neptune City Boro 21 1 7 3 46 2 3 1 18 2 3 2 16 2 114 2Neptune Twp 113 7 23 9 118 6 15 4 109 15 8 5 35 4 421 7Ocean Twp 73 5 5 2 57 3 11 3 46 6 9 6 19 2 220 4Oceanport Boro 16 1 3 1 15 1 1 0 7 1 11 1 53 1Red Bank Boro 84 5 11 4 46 2 10 3 27 4 3 2 29 3 210 3Roosevelt Boro 1 0 1 1 2 0Rumson Boro 11 1 6 0 2 0 3 2 1 0 23 0Sea Bright Boro 10 1 4 0 1 0 15 0Sea Girt Boro 7 0 5 0 4 1 5 1 21 0Shrewsbury Boro 7 0 8 0 2 0 17 0Shrewsbury Twp 6 0 2 0 1 0 1 0 10 0South Belmar Boro 1 0 4 0 1 0 6 0Spring Lake Boro 6 0 1 0 6 0 3 1 4 1 2 1 4 0 26 0Spring Lake Hts Boro 10 1 16 1 1 0 1 1 7 1 35 1Tinton Falls Boro 45 3 4 1 23 1 6 2 31 4 2 1 17 2 128 2Union Beach Boro 16 1 7 3 34 2 7 2 6 1 3 2 11 1 84 1Upper Freehold Twp 2 0 2 0Wall Twp 42 3 4 1 70 4 11 3 11 1 5 3 27 3 170 3West Long Branch B 16 1 3 1 23 1 1 0 3 0 9 1 55 1Not Stated 48 3 10 4 103 5 13 3 11 1 13 9 94 10 292 5Total 1585 100 270 100 1998 100 390 100 749 100 147 100 910 100 6049 100


Substance Abuse Admissions by Primary Drug within Municipality 2014 NJ Resident Admissions
Primary Drug Alcohol Cocaine/
Crack Heroin Other
Opiates Marijuana/ Hashish
Other Drugs
Unknown Total Monmouth County
N % N % N % N % N % N % N % N % Aberdeen Twp 28 32 8 9 28 32 8 9 3 3 1 1 12 14 88 100Allenhurst Boro 2 29 1 14 2 29 2 29 7 100Allentown Boro 7 37 2 11 2 11 1 5 7 37 19 100Asbury Park City 119 24 51 10 144 30 21 4 101 21 8 2 44 9 488 100Atlantic Highlands B 23 31 1 1 31 41 1 1 8 11 3 4 8 11 75 100Avon By The Sea Boro 7 26 1 4 12 44 3 11 1 4 3 11 27 100Belmar Boro 35 27 6 5 47 36 8 6 7 5 3 2 25 19 131 100Bradley Beach Boro 21 33 2 3 25 39 1 2 5 8 2 3 8 13 64 100Brielle Boro 16 40 15 38 2 5 7 18 40 100Colts Neck Township 9 24 1 3 14 37 2 5 1 3 3 8 8 21 38 100Deal Boro 1 13 1 13 1 13 2 25 2 25 1 13 8 100Eatontown Boro 43 25 8 5 57 34 11 6 30 18 3 2 18 11 170 100Englishtown Boro 7 15 8 17 15 33 2 4 4 9 1 2 9 20 46 100Fair Haven Boro 18 72 1 4 3 12 1 4 2 8 25 100Farmingdale Boro 7 12 1 2 27 47 4 7 5 9 13 23 57 100Freehold Boro 31 25 2 2 41 34 6 5 26 21 2 2 14 11 122 100Freehold Twp 53 23 8 4 67 30 19 8 19 8 8 4 52 23 226 100Hazlet Twp 47 27 4 2 62 36 18 11 19 11 3 2 18 11 171 100Highlands Boro 26 31 2 2 34 41 7 8 5 6 2 2 7 8 83 100Holmdel Twp 19 28 20 29 8 12 8 12 2 3 11 16 68 100Howell Twp 68 20 6 2 128 38 30 9 34 10 5 1 69 20 340 100Interlaken Boro 2 29 3 43 2 29 7 100Keansburg Boro 50 17 13 5 111 39 39 14 32 11 13 5 29 10 287 100Keyport Boro 34 24 7 5 50 35 14 10 10 7 1 1 28 19 144 100Little Silver Boro 10 40 4 16 3 12 4 16 1 4 3 12 25 100Long Branch City 114 29 26 7 135 35 19 5 43 11 6 2 48 12 391 100Manalapan Twp 29 17 9 5 51 30 14 8 22 13 8 5 38 22 171 100Manasquan Boro 28 30 2 2 34 37 3 3 7 8 1 1 17 18 92 100Marlboro Twp 28 26 2 2 33 31 8 7 9 8 27 25 107 100Matawan Boro 42 34 7 6 37 30 5 4 8 6 5 4 21 17 125 100Middletown Twp 118 26 10 2 167 36 42 9 47 10 10 2 64 14 458 100Millstone Twp 6 32 5 26 2 11 3 16 1 5 2 11 19 100Monmouth Beach Boro
4 15 4 15 7 27 4 15 1 4 6 23 26 100
Neptune City Boro 21 18 7 6 46 40 3 3 18 16 3 3 16 14 114 100Neptune Twp 113 27 23 5 118 28 15 4 109 26 8 2 35 8 421 100Ocean Twp 73 33 5 2 57 26 11 5 46 21 9 4 19 9 220 100Oceanport Boro 16 30 3 6 15 28 1 2 7 13 11 21 53 100Red Bank Boro 84 40 11 5 46 22 10 5 27 13 3 1 29 14 210 100Roosevelt Boro 1 50 1 50 2 100Rumson Boro 11 48 6 26 2 9 3 13 1 4 23 100Sea Bright Boro 10 67 4 27 1 7 15 100Sea Girt Boro 7 33 5 24 4 19 5 24 21 100Shrewsbury Boro 7 41 8 47 2 12 17 100Shrewsbury Twp 6 60 2 20 1 10 1 10 10 100South Belmar Boro 1 17 4 67 1 17 6 100Spring Lake Boro 6 23 1 4 6 23 3 12 4 15 2 8 4 15 26 100Spring Lake Hts Boro 10 29 16 46 1 3 1 3 7 20 35 100Tinton Falls Boro 45 35 4 3 23 18 6 5 31 24 2 2 17 13 128 100Union Beach Boro 16 19 7 8 34 40 7 8 6 7 3 4 11 13 84 100Upper Freehold Twp 2 100 2 100

Wall Twp 42 25 4 2 70 41 11 6 11 6 5 3 27 16 170 100West Long Branch B 16 29 3 5 23 42 1 2 3 5 9 16 55 100Not Stated 48 16 10 3 103 35 13 4 11 4 13 4 94 32 292 100Total 1585 26 270 4 1998 33 390 6 749 12 147 2 910 15 6049 100

Howell Township
Middletown Township
Neptune Township
Long Branch City
Asbury Park City
Middletown Township
2014 Monmouth County Substance Abuse Admissions by Municipality of Residence
LegendMonCOUNT
2 - 4041 - 9293 - 144145 - 287288 - 488
Top Five Municipalities1 Asbury Park City 4882 Neptune Township 4213 Long Branch City 3914 Howell Township 3405 Long Branch City 391
Data: NJSAMS 2015 February DownloadReport Date: May, 2015
NJ Department of Human Services Division of Mental Health and Addiction Services Research, Planning and Evaluation Unit¹ 0 0.8 1.6 2.40.4
Miles

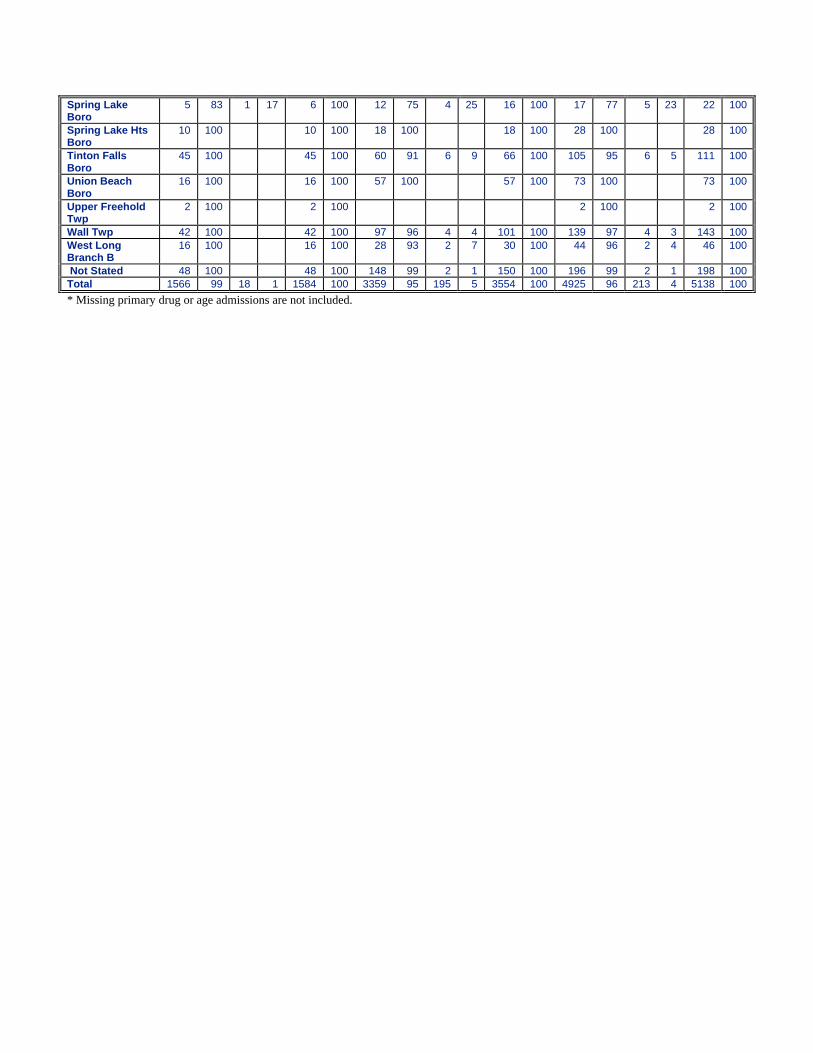
Admissions by Municipality of Residence, Age Group and Primary Drug 2014 NJ Resident Admissions
Alcohol Drugs Total 18 & Over Under
18 Total 18 & Over Under
18 Total 18 & Over Under
18 Total
Monmouth County
N % N % N % N % N % N % N % N % N % Aberdeen Twp 28 100 28 100 46 96 2 4 48 100 74 97 2 3 76 100Allenhurst Boro 2 100 2 100 3 100 3 100 5 100 5 100Allentown Boro 7 100 7 100 5 100 5 100 12 100 12 100Asbury Park City
119 100 119 100 318 98 7 2 325 100 437 98 7 2 444 100
Atlantic Highlands B
23 100 23 100 39 89 5 11 44 100 62 93 5 7 67 100
Avon By The Sea Boro
7 100 7 100 16 94 1 6 17 100 23 96 1 4 24 100
Belmar Boro 33 94 2 6 35 100 69 97 2 3 71 100 102 96 4 4 106 100Bradley Beach Boro
21 100 21 100 32 91 3 9 35 100 53 95 3 5 56 100
Brielle Boro 16 100 16 100 17 100 17 100 33 100 33 100Colts Neck Township
9 100 9 100 20 95 1 5 21 100 29 97 1 3 30 100
Deal Boro 1 100 1 100 7 100 7 100 8 100 8 100Eatontown Boro 43 100 43 100 102 94 7 6 109 100 145 95 7 5 152 100Englishtown Boro
7 100 7 100 29 97 1 3 30 100 36 97 1 3 37 100
Fair Haven Boro 16 89 2 11 18 100 5 100 5 100 21 91 2 9 23 100Farmingdale Boro
7 100 7 100 35 95 2 5 37 100 42 95 2 5 44 100
Freehold Boro 31 100 31 100 69 90 8 10 77 100 100 93 8 7 108 100Freehold Twp 51 96 2 4 53 100 116 96 5 4 121 100 167 96 7 4 174 100Hazlet Twp 46 98 1 2 47 100 97 92 9 8 106 100 143 93 10 7 153 100Highlands Boro 26 100 26 100 47 94 3 6 50 100 73 96 3 4 76 100Holmdel Twp 17 89 2 11 19 100 35 92 3 8 38 100 52 91 5 9 57 100Howell Twp 66 97 2 3 68 100 193 95 10 5 203 100 259 96 12 4 271 100Interlaken Boro 2 100 2 100 3 100 3 100 5 100 5 100Keansburg Boro 50 100 50 100 201 97 7 3 208 100 251 97 7 3 258 100Keyport Boro 34 100 34 100 78 95 4 5 82 100 112 97 4 3 116 100Little Silver Boro 10 100 10 100 11 92 1 8 12 100 21 95 1 5 22 100Long Branch City
114 100 114 100 222 97 7 3 229 100 336 98 7 2 343 100
Manalapan Twp 28 100 28 100 96 92 8 8 104 100 124 94 8 6 132 100Manasquan Boro
28 100 28 100 45 96 2 4 47 100 73 97 2 3 75 100
Marlboro Twp 27 96 1 4 28 100 48 92 4 8 52 100 75 94 5 6 80 100Matawan Boro 42 100 42 100 59 95 3 5 62 100 101 97 3 3 104 100Middletown Twp 114 97 4 3 118 100 260 94 16 6 276 100 374 95 20 5 394 100Millstone Twp 6 100 6 100 11 100 11 100 17 100 17 100Monmouth Beach Boro
4 100 4 100 16 100 16 100 20 100 20 100
Neptune City Boro
21 100 21 100 69 90 8 10 77 100 90 92 8 8 98 100
Neptune Twp 113 100 113 100 251 92 22 8 273 100 364 94 22 6 386 100Ocean Twp 73 100 73 100 115 90 13 10 128 100 188 94 13 6 201 100Oceanport Boro 16 100 16 100 25 96 1 4 26 100 41 98 1 2 42 100Red Bank Boro 83 99 1 1 84 100 88 91 9 9 97 100 171 94 10 6 181 100Roosevelt Boro 2 100 2 100 2 100 2 100Rumson Boro 11 100 11 100 11 100 11 100 22 100 22 100Sea Bright Boro 10 100 10 100 4 100 4 100 14 100 14 100Sea Girt Boro 7 100 7 100 6 67 3 33 9 100 13 81 3 19 16 100Shrewsbury Boro
7 100 7 100 10 100 10 100 17 100 17 100
Shrewsbury Twp 6 100 6 100 3 100 3 100 9 100 9 100South Belmar Boro
5 100 5 100 5 100 5 100
Spring Lake Boro
5 83 1 17 6 100 12 75 4 25 16 100 17 77 5 23 22 100
Spring Lake Hts Boro
10 100 10 100 18 100 18 100 28 100 28 100
Tinton Falls Boro
45 100 45 100 60 91 6 9 66 100 105 95 6 5 111 100
Union Beach Boro
16 100 16 100 57 100 57 100 73 100 73 100
Upper Freehold Twp
2 100 2 100 2 100 2 100
Wall Twp 42 100 42 100 97 96 4 4 101 100 139 97 4 3 143 100West Long Branch B
16 100 16 100 28 93 2 7 30 100 44 96 2 4 46 100
Not Stated 48 100 48 100 148 99 2 1 150 100 196 99 2 1 198 100Total 1566 99 18 1 1584 100 3359 95 195 5 3554 100 4925 96 213 4 5138 100* Missing primary drug or age admissions are not included.

Admissions by Age Group, Gender and Primary Drug 2014 NJ Resident Admissions
Gender Female Male
Total* Monmouth
N % N % N % Alcohol 9 50.0 9 50.0 18 100.0 Heroin 2 25.0 6 75.0 8 100.0 Other Opiates 3 42.9 4 57.1 7 100.0 Marijuana/Hashish 33 19.9 133 80.1 166 100.0 Other Drugs 8 57.1 6 42.9 14 100.0 Unknown 4 10.3 35 89.7 39 100.0
0-17
Total* 59 23.4 193 76.6 252 100.0 Alcohol 76 30.6 172 69.4 248 100.0 Heroin 188 40.1 281 59.9 469 100.0 Other Opiates 20 42.6 27 57.4 47 100.0 Marijuana/Hashish 77 30.4 176 69.6 253 100.0 Other Drugs 16 32.7 33 67.3 49 100.0 Unknown 82 33.9 160 66.1 242 100.0
18-24
Total* 459 35.1 849 64.9 1308 100.0 Alcohol 380 30.9 848 69.1 1228 100.0 Heroin 584 39.0 914 61.0 1498 100.0 Other Opiates 120 36.6 208 63.4 328 100.0 Marijuana/Hashish 97 29.5 232 70.5 329 100.0 Other Drugs 129 37.4 216 62.6 345 100.0 Unknown 194 31.6 419 68.4 613 100.0
25-59
Total* 1504 34.6 2837 65.4 4341 100.0 Alcohol 23 26.1 65 73.9 88 100.0 Heroin 5 21.7 18 78.3 23 100.0 Other Opiates 8 100.0 8 100.0 Marijuana/Hashish 1 100.0 1 100.0 Other Drugs 1 12.5 7 87.5 8 100.0 Unknown 4 25.0 12 75.0 16 100.0
60&Over
Total* 33 22.9 111 77.1 144 100.0 Alcohol 488 30.8 1094 69.2 1582 100.0 Heroin 779 39.0 1219 61.0 1998 100.0 Other Opiates 143 36.7 247 63.3 390 100.0 Marijuana/Hashish 207 27.6 542 72.4 749 100.0 Other Drugs 154 37.0 262 63.0 416 100.0 Unknown 284 31.2 626 68.8 910 100.0
Total*
Total* 2055 34.0 3990 66.0 6045 100.0 * Unknown age or gender admissions are not included.

New Jersey Substance Abuse Monitoring System (NJ-SAMS) Substance Abuse Treatment Discharges 1/1/2014- 12/31/2014 Resident of Monmouth County Level of Care Living Arragements at Discharge Outpatient Care (OP) 1,937 34% Homeless 138 2% Intensive Outpatient (IOP) 1,121 19% Dependent Living/Institution 985 17% Partial Hospitalization 36 1% Independent Living 4,479 78% Opioid Maintenance OP 542 9% Opioid Maintenance IOP 34 1% Employment Status at Discharge Extended Care 1 0% Unemployed 1,259 22% Halfway House 149 3% Student 273 5% Long-Term Residential 148 3% Not in Labor Force 1,570 27% Short-Term Residential 781 14% Employed Full/Part Time 2,184 38% Hospital Based Residential 0 0% Not Assessed 491 8% Detox Residential 671 12% Detox Hospital 7 0% Reasons for Discharge or Treatment not Completed Detox Outpatient Non-Methadone 4 0% Treatment Plan Completed 3,230 56% Detox Outpatient Methadone 149 3% Quit or Dropped Out 1,100 19% Non-Traditional Program 2 0% Needs Different Level of Care 429 7% Early Intervention 195 3% Unable to Meet Client's Other Needs 15 0% Administrative Discharge 221 4% Sex Exhaustion of Payment Source 40 1% Male 3,836 66% Incarcerated 179 3% Female 1,938 34% Medical Discharge/Deceased 40 1% Other 41 1% Age at Discharge Under 18 174 3% Continuing Care 18-21 599 10% No Continuing care needed 1,403 24% 22-24 665 12% Refused or Unable to Continue 1,103 19% 25-29 1,193 21% Continue Care 1,645 28% 30-34 880 15% 35-44 1,063 18% Significant Problems or Conditions 45-54 826 14% Mental Health Problem 1,205 21% 55 and over 377 7% Compulsive Gambling 18 0% Unknown 0 0% Physical Disability or Handicap 80 1% Victim of Physical Abuse or Neglect 218 4% Race/Ethnicity Victim of Sexual Abuse 160 3% White 4,507 78% Pregnancy 55 1% Black 765 13% Suicide Attempt 49 1% Hispanic 466 8% Runaway Behavior 120 2% Other 39 1% Neglect or Abuse of Own Children 175 3% Not Assessed 0 0% Child of Substance Abuser 364 6% Batterer 23 0% Mental Illness/Co-Occurring Disorder Criminal Activity 531 9% 3,443 60% Other 139 2% Client Goal Achieved/Partially Achieved at Discharge * Arrested in the Last 30 days (Yes) 190 3% Alcohol or Drug Problem 3,579 68% Educational 717 38% County Where Patient Was Treated Employment or Vocational 872 38% Atlantic 71 1% Middlesex 103 2% Family Situation 1,934 67% Bergen 18 0% Monmouth 4,580 79% Psychological or Mental Health 1,945 70% Burlington 0 0% Morris 24 0% Physical Health 1,462 69% Camden 0 0% Ocean 263 5% Legal 2,158 65% Cape May 0 0% Passaic 207 4% Cumberland 26 0% Salem 0 0% Drug and Alcohol Use at Discharge Essex 88 2% Somerset 175 3% Not Using Alcohol or Drugs 3,214 56% Gloucester 27 0% Sussex 91 2% Using Alcohol 349 6% Hudson 35 1% Union 17 0% Using Drugs 896 16% Hunterdon 7 0% Warren 2 0% Unknown 1,020 18% Mercer 43 1% Other 0 0% Total Discharges = 5,777 Unduplicated Clients Discharged = 4,339 * Percentage for goal achievment based on total clients for whom goal was applicable. All other percentages are based on total discharges.

New Jersey Substance Abuse Monitoring System (NJ-SAMS) Substance Abuse Treatment Discharges 1/1/2014- 12/31/2014 Treatment Site in Monmouth County Level of Care Living Arragements at Discharge Outpatient Care (OP) 1,904 25% Homeless 173 2% Intensive Outpatient (IOP) 1,156 15% Dependent Living/Institution 1,656 22% Partial Hospitalization 43 1% Independent Living 5,357 71% Opioid Maintenance OP 578 8% Opioid Maintenance IOP 41 1% Employment Status at Discharge Extended Care 2 0% Unemployed 1,878 25% Halfway House 180 2% Student 344 5% Long-Term Residential 115 2% Not in Labor Force 2,272 30% Short-Term Residential 1,817 24% Employed Full/Part Time 2,184 29% Hospital Based Residential 0 0% Not Assessed 827 11% Detox Residential 1,276 17% Detox Hospital 4 0% Reasons for Discharge or Treatment not Completed Detox Outpatient Non-Methadone 0 0% Treatment Plan Completed 4,570 61% Detox Outpatient Methadone 207 3% Quit or Dropped Out 1,230 16% Non-Traditional Program 2 0% Needs Different Level of Care 483 6% Early Intervention 180 2% Unable to Meet Client's Other Needs 30 0% Administrative Discharge 235 3% Sex Exhaustion of Payment Source 47 1% Male 5,024 67% Incarcerated 180 2% Female 2,478 33% Medical Discharge/Deceased 50 1% Other 45 1% Age at Discharge Under 18 249 3% Continuing Care 18-21 720 10% No Continuing care needed 1,411 19% 22-24 919 12% Refused or Unable to Continue 1,434 19% 25-29 1,597 21% Continue Care 2,915 39% 30-34 1,189 16% 35-44 1,350 18% Significant Problems or Conditions 45-54 1,048 14% Mental Health Problem 1,327 18% 55 and over 433 6% Compulsive Gambling 16 0% Unknown 0 0% Physical Disability or Handicap 86 1% Victim of Physical Abuse or Neglect 227 3% Race/Ethnicity Victim of Sexual Abuse 163 2% White 5,945 79% Pregnancy 73 1% Black 933 12% Suicide Attempt 52 1% Hispanic 550 7% Runaway Behavior 61 1% Other 50 1% Neglect or Abuse of Own Children 146 2% Not Assessed 27 0% Child of Substance Abuser 404 5% Batterer 25 0% Mental Illness/Co-Occurring Disorder Criminal Activity 504 7% 3,932 52% Other 145 2% Client Goal Achieved/Partially Achieved at Discharge * Arrested in the Last 30 days (Yes) 188 3% Alcohol or Drug Problem 4,824 72% Educational 1,525 64% County of Residence Employment or Vocational 1,785 61% Atlantic 111 1% Middlesex 586 8% Family Situation 2,735 58% Bergen 105 1% Monmouth 4,580 61% Psychological or Mental Health 2,459 71% Burlington 140 2% Morris 104 1% Physical Health 2,433 76% Camden 160 2% Ocean 992 13% Legal 2,738 69% Cape May 83 1% Passaic 31 0% Cumberland 74 1% Salem 31 0% Drug and Alcohol Use at Discharge Essex 35 0% Somerset 45 1% Not Using Alcohol or Drugs 4,536 60% Gloucester 74 1% Sussex 9 0% Using Alcohol 357 5% Hudson 46 1% Union 76 1% Using Drugs 986 13% Hunterdon 11 0% Warren 40 1% Unknown 1,020 14% Mercer 128 2% Other 44 1% Total Discharges = 7,505 Unduplicated Clients Discharged = 5,584 * Percentage for goal achievment based on total clients for whom goal was applicable. All other percentages are based on total discharges.