monitoring training... · web view: given a controlled text reading passage at her instructional...
TRANSCRIPT
1
ProgressMonitoringParticipant HandoutPacket

2
Learning Targets I can develop and implement a progress monitoring system to:
Define and identify methods of measurement
Collect and graph progress data Analyze, Interpret and make
instructional decisions about my students Demonstrate the linkage between
progress monitoring and writing present levels for annual goal development
Communicate progress monitoring data

3
Spring_________________________
Winter Summer ____________________ ________________________
Fall
_________________

4
Progress Monitoring System: The ____ and _______ used to ______, _____and ______ data and ultimately measure progress to provide evidence of student performance specific to IEP annual goals.
Purpose of Progress Monitoring (IEP Guidance Document, page 67)
• __________ and report progress toward goals
• __________ the effectiveness of instructional services
• __________ instructional decisions and make adjustments
• __________ current level of learning/behavior/performance
• __________ data for the reevaluation process
• _________ if the student continues to meet eligibility and need specially designed
Instruction
Notes:__________________________________________________________________________________________________________________________________________________________________________________________________________________________________________________________________________________________________________________________________________________________________

5
The Importance of Baseline
________ __________ describes the student’s current performance of a skill or strategy in measurable terms.
The baseline serves as a starting point for IEP instruction.
Baseline data for an initial IEP is based on __________ __________, ________ ______ ____________ ____ and __________ _____ within the integrated assessment report.
Baseline data for __________ IEPs is based on IEP _________ ___________.
Two Measures for Calculating the Baseline
Median
________ number in an ordered list If you have an even number of ______, take the average of the two middle
scores.Example:
Scores: 48, 54, 67, 52, 35Place scores in number order and the median is the score in the middle35, 48, 52, 54, 67 – the median is 52
Mean
___________ average Sum of all scores ________ by number of scores
Example:Scores: 48, 54, 67, 52, 35 Total /No of scores: 256/5 = 51.2%
Notes:__________________________________________________________________________________________________________________________________________________________________________________________________________________

6
________________________________________________________________________________________________________________________________________________
Methods of Measurement
Remember…..“If you cannot measure it, you cannot improve it.”
Characteristics of Effective Methods of Measurement:
Provide for ________ and _________ data collection
Uses an ____________ measure each time ______ for analysis of performance ____ ____ (e.g., create graph of data to
determine progress toward goal) Requires a _____ amount of time for _________ information; involves _______ in data collection, when appropriate
Item 36 (Record Review Document)
Notes:
YES: there is evidence of progress data collection (graphs, charts, checklists, etc.) and analysis (written summary of data analysis) for each annual goal.
NOTE:
Data collection must contain the goal and match the frequency defined in each annual goal. Each data point must include a date (month/day/year). On-going progress data may be kept in a separate location from the due process folder, if the evidence of final analysis (cumulative graphs, charts, checklists) and the written summary of the analysis are added to the student’s due process record when the IEP is reviewed. Any supporting evidence not uploaded to IC must be available upon request of the reviewer during the DLS consolidated monitoring process.

7
Curriculum Based Measurement: is an ________ using ______ to _______ the ______ of student __________. Probes are ______ ____ _______ made up of academic ______ taken from the general curriculum.
Examples: Oral reading fluency probesMath computation probesMath concepts and application probes
Non-examples of CBM: Universal Screener (MAP, DIBELS)GradesKPREP AssessmentsEnd of Course Assessments
Notes: ________________________________________________________________________________________________________________________________________________________________________________________________________________________________________________________________________________________________
Direct Measurement: Involves______ observation of ___________ and _________ __________ of student response.
Examples: _________ Count/ Event _________Time Sampling/ ________ RecordingDuration _________Latency Recording___________ABC Recording (Analysis) __________ Recordings (must have an additional method of measurement)Checklists________ Record
• There are three types of interval recording.

8
• Whole interval time sampling, observe the student for a few seconds at designated intervals and notice whether the behavior occurs for the whole interval that you are looking for it.
• Partial interval recording, mark whether the behavior occurred at least once during the short observation interval.
• Momentary time sampling, look up immediately at pre-designated points and notice whether the behavior is occurring at that precise moment.
Notes:__________________________________________________________________________________________________________________________________________________________________________________________________________________________________________________________________________________________
Indirect Measurement: Involves using _______ ________ to review ________ ____________
Examples: RubricsGoal ___________ Scaling Checklist_________ Interview (must have an additional method of measurement)Student _____-____________ FormScoring Guide__________ Product Teacher Made ______
Notes:__________________________________________________________________________________________________________________________________________________________________________________________________________________________________________________________________________________________________________________________________________________________________

9
Authentic Assessment: Measures a student’s _______________ in tasks and situations that resemble real-life _______ and ___________. This type of assessment is closely aligned with and ____________ student ________________.
Examples: ________ Interview/ConferenceOral __________Portfolio_____ SamplesAnnotation
Notes:__________________________________________________________________________________________________________________________________________________________________________________________________________________________________________________________________________________________________________________________________________________________________

10
Method of Measurement Scenarios
Scenario Method of Measurement(Direct, Indirect, CBM, AA)
Type of Measurement
1
2
3
4
5
6
7
8
Methods of Measurement
Curriculum Based Measurement (CBM):
Oral reading fluency probesMath computation probesMath concepts and application probes
Direct:
Frequency Count/ Event RecordingTime Sampling/ Interval RecordingDuration RecordingLatency Recording
ScatterplotABC Recording (Analysis) Anecdotal RecordingsChecklistsRunning Record
Indirect:
RubricsGoal Attainment Scaling ChecklistTeacher Interview

11
Student Self-Monitoring FormScoring GuidePermanent Product Teacher Made Tests
Authentic Assessment (AA):
Student Interview/ConferenceOral InterviewPortfolioWork SamplesAnnotation
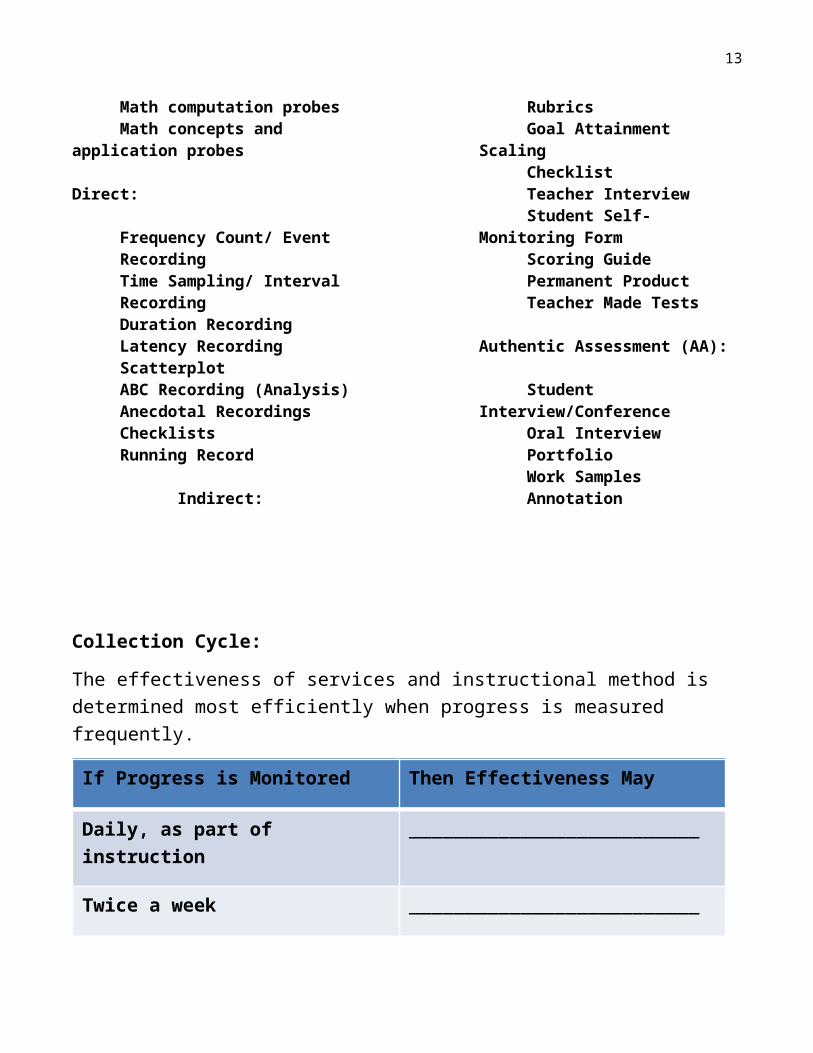
Collection Cycle:
The effectiveness of services and instructional method is determined most efficiently when progress is measured frequently.
If Progress is Monitored Then Effectiveness May
Daily, as part of instruction __________________________
Twice a week __________________________
Weekly __________________________
______________
Quarterly __________________________
Six Steps to Graph Data1. A student will have a _________, _______ graph for each annual goal.
2. The ______ (horizontal line) of the graph is ______ with the ____, time, or _____. Include overall year at bottom.
3. The y-axis (________ line) of the graph is labeled with the _____, amount, numbers, or ___________.
4. Plot _________ an aim line.

12
5. Add a _____ point each time you _________ ________.
6. Record _____________ changes on the _____ with a ________ dotted line.
Aim line—means the ____ a teacher takes to ____ a student from their ________ to the ___________ criterion (____) within a designated _____ period.
Steps to drawing an aim line
1. Draw a line connecting the baseline score to the criterion score
Goal: Given a controlled text reading passage at her instructional level, Candace will read aloud a 50 word passage with 2 miscues or less on 3 out of 4 reading assessments.
Baseline: Given a guided reading passage on her instruction level, and following multiple exposures to the passage, Candace reads 50 words with 18 miscues
Candace Activity – Practice drawing an aim line
13
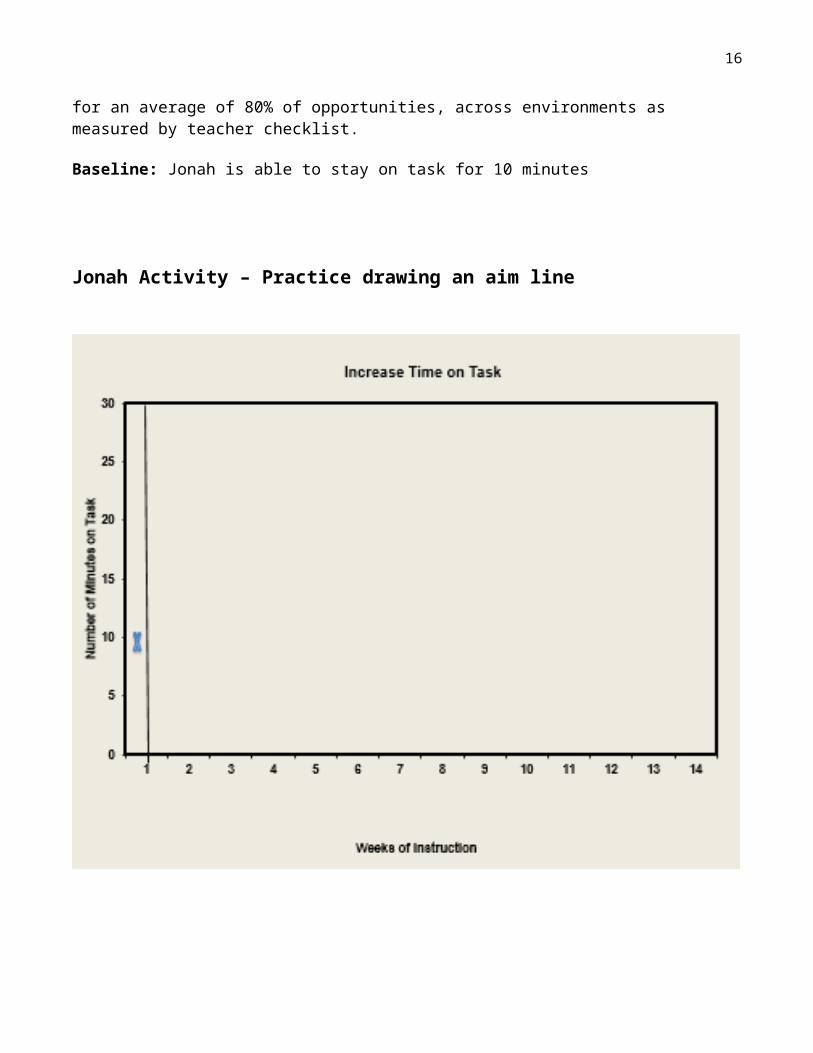
Goal: With the use of taught self-regulation strategies and self-monitoring checklists, Jonah will begin an independent task and remain focused on the task for at least 30 minutes, free from adult prompts, for an average of 80% of opportunities, across environments as measured by teacher checklist.
Baseline: Jonah is able to stay on task for 10 minutes
Jonah Activity – Practice drawing an aim line

14
Trend Line
Trend line represents the line of best fit drawn through a series of data points
Steps to drawing a trend line
Start with at least seven or eight data points. A trend-line is a line drawn in the data path to indicate the direction (trend) of the
observed behavior. Begin with the first point after the baseline. Draw the line to cover the most points.

15
Practice drawing a trend line:
16
17

18
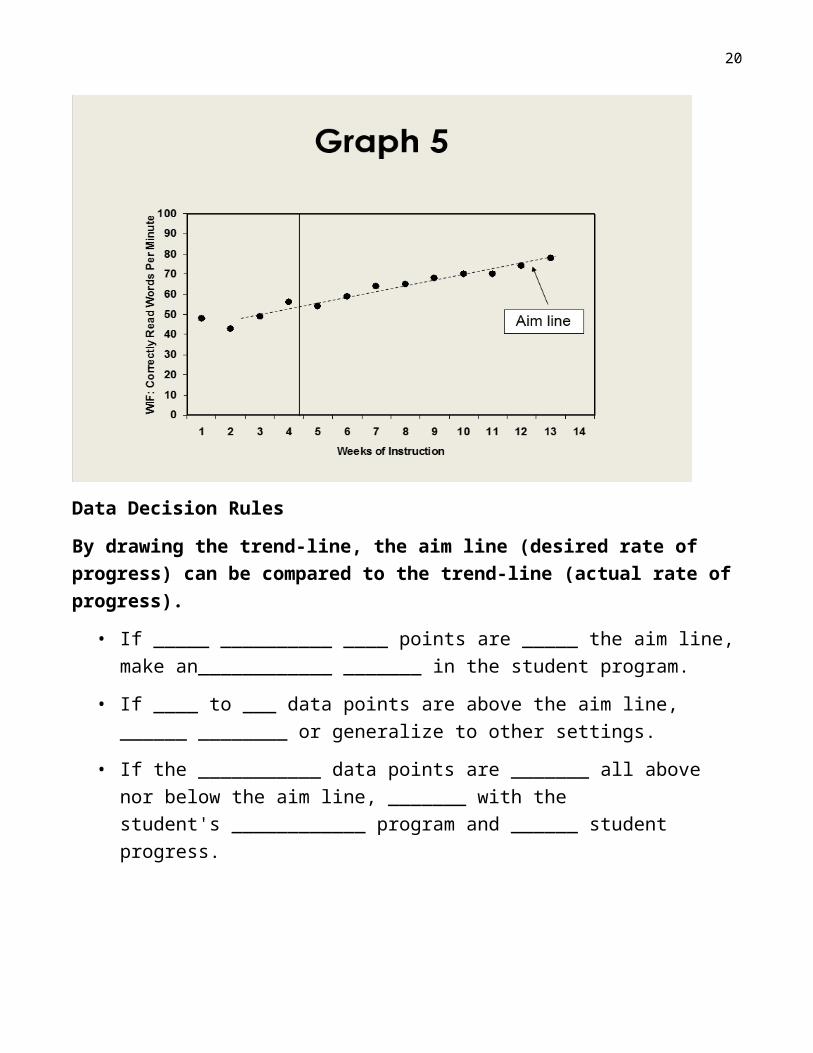
Data Decision Rules
By drawing the trend-line, the aim line (desired rate of progress) can be compared to the trend-line (actual rate of progress).
• If _____ __________ ____ points are _____ the aim line, make an____________ _______ in the student program.
• If ____ to ___ data points are above the aim line, ______ ________ or generalize to other settings.
• If the ___________ data points are _______ all above nor below the aim line, _______ with the student's ____________ program and ______ student progress.
Notes: ________________________________________________________________________________________________________________________________________________________________________________________________________________________________________________________________________________________________________________________________________________________________________________________________________________________________________________________________________________________________________________________

19
Based on data points, aim line and trend line, is student on target to meet goal?
What do you plan to report to parents at the specified reporting intervals?
Does the graph indicate a need for change in instruction? Why or why not?
Analysis of Graph 1:
________________________________________________________________________________________________________________________________________________________________________________________________________________________________________________________________________________________________________________________________________________________________________________________________________________________________________________________________________________________________________________________
20
Based on data points, aim line and trend line, is student on target to meet goal?
What do you plan to report to parents at the specified reporting intervals?
Does the graph indicate a need for change in instruction? Why or why not?
Analysis of Graph 2:
________________________________________________________________________________________________________________________________________________________________________________________________________________________________________________________________________________________________________________________________________________________________________________________________________________________________________________________________________________________________________________________

21
Based on data points, aim line and trend line, is student on target to meet goal?
What do you plan to report to parents at the specified reporting intervals?
Does the graph indicate a need for change in instruction? Why or why not?
Analysis of Graph 3:
________________________________________________________________________________________________________________________________________________________________________________________________________________________________________________________________________________________________________________________________________________________________________________________________________________________________________________________________________________________________________________________
22
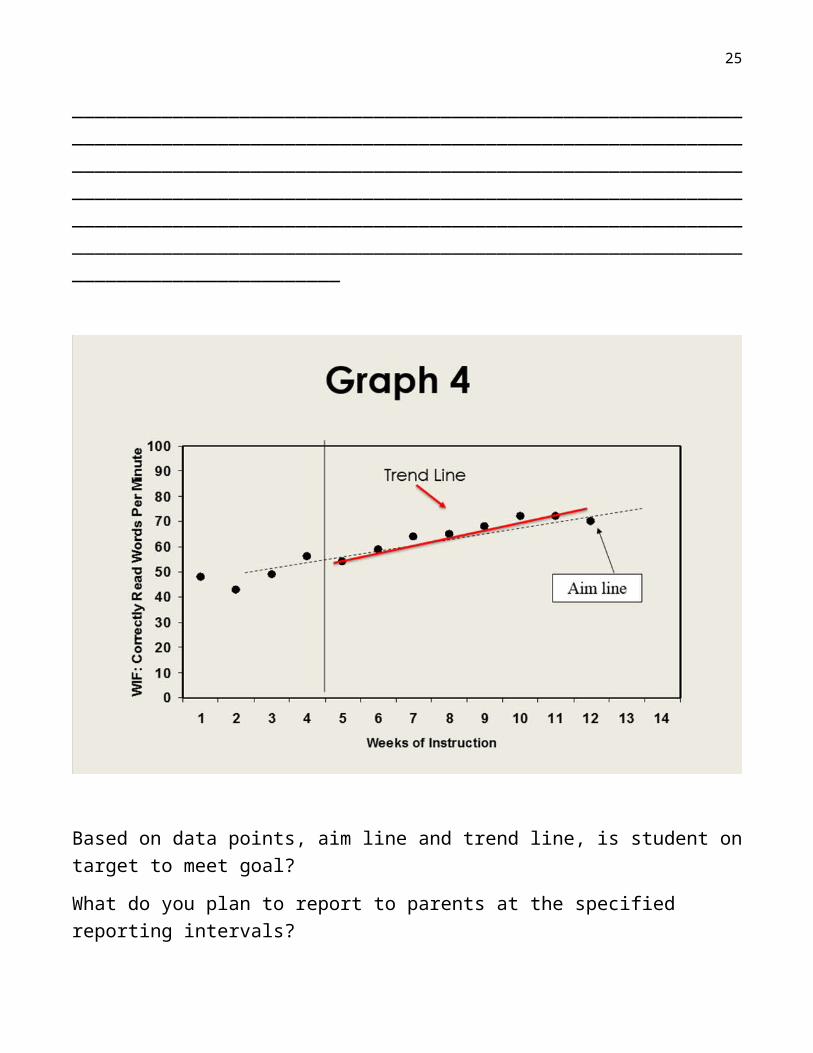
Based on data points, aim line and trend line, is student on target to meet goal?
What do you plan to report to parents at the specified reporting intervals?
Does the graph indicate a need for change in instruction? Why or why not?
Analysis of Graph 4:
________________________________________________________________________________________________________________________________________________________________________________________________________________________________________________________________________________________________________________________________________________________________________________________________________________________________________________________________________________________________________________________

23
Examples of progress reporting with analysis of data:
Example of student not progressing:John is currently not on target to meet his goal. His data indicated that an instructional change was needed due to scores dropping from 52% to 45%. On 01/25/20xx, Repeated Reading was added as a strategy to teach reading fluency. After three more data points, Choral Reading was added (02/25/20xx) as another instructional change was required due to scores dropping from 50% to 45%. Since this strategy has been implemented, John increased to 48% (from 45%). Progress will continue to be monitored utilizing this instructional strategy.
Example of student progressing:At the beginning of the reporting period, Charlie was not making progress toward his goal. On Nov. 15, due to scores of 49%, 48%, 45% and 48%, paired reading was added as an instructional strategy to increase reading fluency. Since that strategy began, Charlie has increased his scores to 62%. However, the two most recent data collection opportunities have shown a decrease. This could be due to Charlie missing several days of school with the flu. This strategy will continue being implemented and progress will continue to be monitored.
Example of a student meeting goal:Based on data, Lizzie is currently exceeding her goal. She began this progress reporting period producing /s/ sounds in all positions of words at 63% and is now producing them 80% of the time. The focus will now be on generalizing across all academic areas. Progress will continue to be monitored.

24
Annual Goal “End of IEP Cycle”
Written Analysis Activity Directions (Mark)
Highlight Activity
1. Read reading goal
2. Review baseline data and progress monitoring data for this IEP goal
3. Write an analysis of progress for the entire year end annual goal. Include the following required items:
a. Baseline from current IEP—Underline
b. Progress from baseline to end of IEP cycle—Blue
c. Include SDI utilized and tell whether strategy was effective—Green
d. Identify and analyze any notable decreases or increases in progress—Orange
e. Identify whether the student regressed or failed to recoup the skills previously taught after breaks in instruction—Yellow
Mark’s baseline of answering comprehension questions at the 2nd grade level was 40%. His goal was to
answer 5 comprehension questions at his instructional level with 80% accuracy on 4 out of 5 occasions
as measured with teacher-made tests and checklists. During the first 6 weeks of his IEP cycle, Mark
initially made steady progress with the support of explicit instruction, modeling, and visual strategies
which effectively helped Mark answer 4 out of 5 comprehension questions. As teacher assistance was
faded, his progress toward the goal of answering comprehension questions decreased with 3 data
points below the aim line. SDI supports were effectively changed to increase scaffolded instruction
including teacher modeling, one to one feedback, and visual strategies (story map). With this in place,
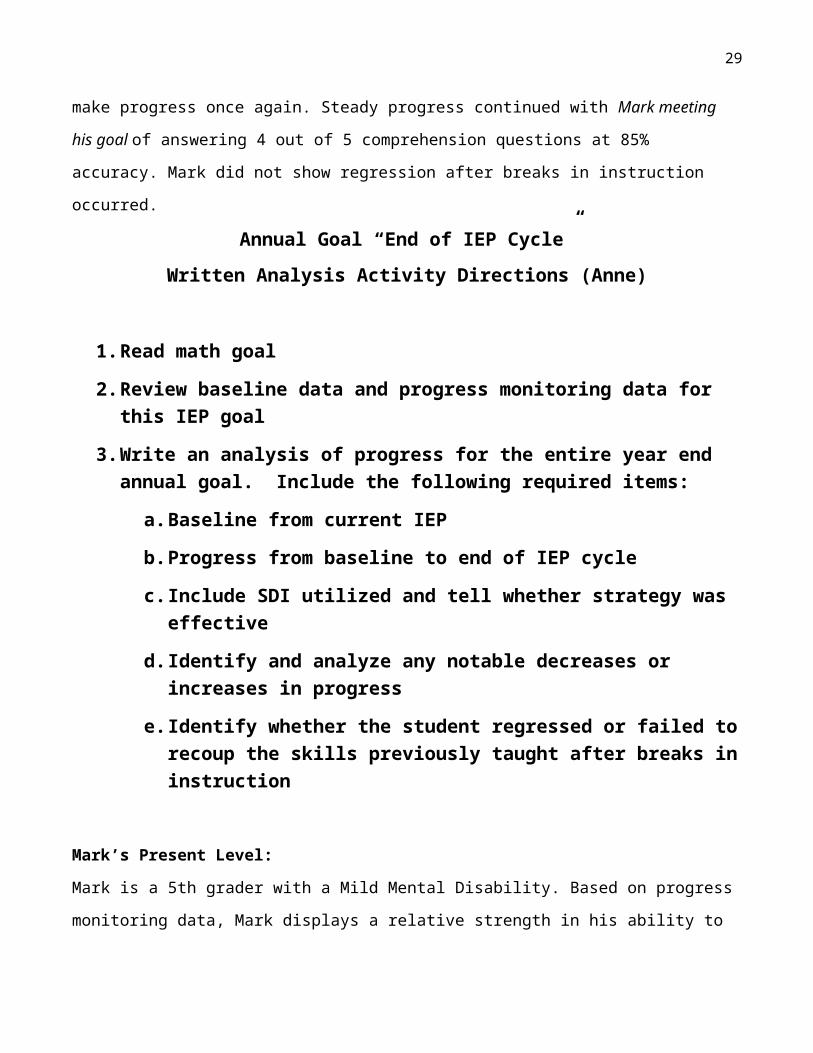
Mark began to make progress once again. Steady progress continued with Mark meeting his goal of
answering 4 out of 5 comprehension questions at 85% accuracy. Mark did not show regression after
breaks in instruction occurred.
25
Annual Goal “End of IEP Cycle”
Written Analysis Activity Directions (Anne)
1. Read math goal
2. Review baseline data and progress monitoring data for this IEP goal
3. Write an analysis of progress for the entire year end annual goal. Include the following required items:
a. Baseline from current IEP
b. Progress from baseline to end of IEP cycle
c. Include SDI utilized and tell whether strategy was effective
d. Identify and analyze any notable decreases or increases in progress
e. Identify whether the student regressed or failed to recoup the skills previously taught after breaks in instruction
Mark’s Present Level:
Mark is a 5th grader with a Mild Mental Disability. Based on progress monitoring data, Mark displays a
relative strength in his ability to answer literal questions with 90% accuracy at the 3rd grade
instructional level with explicit instruction, modeling, guided practice, and visual strategies. Mark
answers comprehension questions with 85% accuracy at the 1st grade level. His baseline for answering
comprehension questions at the 2nd grade instructional level is 40%. Mark’s MAP scores support his
identified deficits in reading. Mark’s 5th grade peers can cite specific, important examples and details to
support inferences. Mark has difficulty identifying important details from a story which makes it
difficult for Mark to make inferences. Mark’s identified deficits in reading have an adverse effect on his
ability to comprehend and complete grade level assignments and participate in class discussions.

26
Mark Reading Annual Goal #1:
When given a 2nd grade reading passage, Mark will answer 5 comprehension questions with 80%
accuracy on 4 out of 5 occasions at least twice a week as measured with teacher-made tests.
Written End of IEP Cycle Analysis:
________________________________________________________________________________________________________________________________________________________________________________________________________________________________________________________________________________________________________________________________________________________________________________________________________________________________________________________________________________________________________________________________________________________________________________________________________________________________________________________________________________________________________________________________________________________________________________________________________________________________________________________________________________________________________________________________________________________________________________________________________________________________________________________________________________________________________________________________________________________________________________________________________________________________________________________________________________________________________________________________________________________________________________________________________________________________________________________________________________________________________________________________________________________________________________________________________________________________________________________________________________________________________________________

27
Culminating Activity
Present Level, Goal, Method of Measurement, Graph Alignment Activity
Task #1 (Mark)
Mark’s Present Level:
Mark is a 5th grader with a Mild Mental Disability. Based on progress monitoring data, Mark
displays a relative strength in his ability to answer literal questions with 90% accuracy at the
3rd grade instructional level with explicit instruction, modeling, guided practice, and visual
strategies. Mark answers comprehension questions with 85% accuracy at the 1st grade level.
His baseline for answering comprehension questions at the 2nd grade instructional level is
40%. Mark’s KPREP score of Apprentice support identified deficits in reading. Mark’s 5 th grade
peers can cite specific, important examples and details to support inferences. Mark has
difficulty identifying important details from a story which makes it difficult for Mark to make
inferences. Mark’s identified deficits in reading have an adverse effect on his ability to
comprehend and complete grade level assignments and participate in class discussions.
Mark Reading Annual Goal #1:
When given a 2nd grade reading passage, Mark will answer 5 comprehension questions with
80% accuracy on 4 out of 5 occasions at least twice a week as measured with teacher-made
tests.

28
Mark Method of Measurement – Main MofM: Indirect Measurement Specific MofM: Teacher Made Test
Reading Passage:
Heading West: Learn About a Pioneer's Life
Long ago, people traveled west across the United States to settle in new places. Those people were called pioneers. Most pioneers moved west to start a new life. Read on to learn more about life as a pioneer.
Building Homes
Many pioneers built log cabins. Log cabins are houses made from logs and mud. Pioneers stacked logs on top of one another. Then they put mud in between the logs to keep out the wind and rain. Most log cabins were small because it took pioneers so long to build them. Many log cabins had only one room. Most pioneers burned a fire to keep their log cabins warm.
Making Clothes
Most pioneers made their own clothing. It was usually made of leather, cotton, or wool. Pioneers dried animal skins to make leather. They used the leather to make shoes and belts. Pioneers spun wool or cotton into yarn and wove it into cloth. Women would make wool yarn with a special tool called a spinning wheel.
Teaching Children
At first, pioneer children learned math, reading, and writing at home. Pioneer parents taught their children. As more people came to town, workers built a schoolhouse. Then the pioneers hired a teacher for the children.
Getting Food
At first, pioneers had to get their own food. They picked berries and nuts. Pioneers also hunted and fished. They planted crops such as corn and squash. When towns formed, the pioneers built small stores called general stores. People could buy supplies such as flour, coffee, and salt there.
Pioneer Chores
Pioneer children helped their families by doing chores around their house. Chores are small jobs. The list shows some chores for pioneer girls and boys.
Girls
spin yarn sew and knit churn butter make soap
29
make candlesBoys
herd cattle tend crops cut hay tame horses
Comprehension Questions:
1. What did pioneers use to build their homes?
A. Mud B. Bricks C. Logs D. Stone
2. Where did pioneers get food?
A. Hunting B. Fishing C. Shopping D. All of the Above
3. What kinds of jobs did pioneer boys have?
A. Doctor B. Herd Cattle C. Teacher D. Baseball Player
4. What is the passage mostly about?
A. Making Friends B. Money C. Baseball D. Pioneer Lives
5. What kinds of jobs did pioneer girls have?
A. Churn Butter B. Tame Horses C. Work at the Mall D. Police Officer
Adapted from Copyright © 2003 Weekly Reader Corporation. All rights reserved. Used by permission. Weekly Reader is a registered trademark of Weekly Reader Corporation.
1. How would you justify this as one of Mark’s Annual Goals?2. Will the Method of Measurement selected above measure the Annual Goal?
30
31
Culminating Activity
Present Level, Goal, Method of Measurement, Graph Alignment Activity
Task #2 (Anne)
Anne’s Present Level:
Anne is a 9th grade student with a Specific Learning Disability in math calculation and
reasoning. Anne learns best by using manipulatives and written steps when completing
equations. Anne’s SDI supports were most effective when direct instruction was provided and
followed with modeling and independent practice while using a written step by step process.
Based on progress monitoring data, Anne’s strength is applying order of operations to solve
two step equations. Anne’s concerns include solving linear and quadratic equations. Her
baseline for solving one variable linear equations is 30% on 4 out of 5 consecutive trials. Most
of Anne’s peers can solve one and two variable linear equations with 80% accuracy. Anne’s
adverse effect in solving linear and quadratic equations impacts her ability to solve problems in
math class.
Anne’s goal # 1:
When given linear equations, Anne will apply a step-by-step process for solving linear
equations with at least 75% accuracy on the process as evidenced on 4 out of 5 consecutive
work samples as measured weekly by a checklist.

32
Anne Method of Measurement – Main MofM: Indirect Measurement Specific MofM: process checklist
Process Checklist:
Steps to Solving Linear Equations Checklist
Step 1
Simplify both sides of the equation as much as possible.
Step 2
Move all variable terms to one side of the equation and all constant terms to the other side of the equation.
Step 3
Isolate variable (make the coefficient 1) on one side of the equation and solution on the other side.
Step 4
Check that your solution is correct by substituting it back into the original equation to see if it makes a true statement (both sides equal the same value).
Solving Linear Equations: Like Variable on Both Sides
Solve each equation.
1) 6r+7=13+7r 2) 13−4x=1−x
3) −7x−3x+2=−8x−8 4) −8−x=x−4x
5) −14+6b+7−2b=1+5b

33
Please review all of the above information and answer these questions.
1. Does the Present Level have all of the required components? __________________
2. How does the Present Level set the foundation for Anne’s Annual Goal? How would you justify this is as an Annual Goal? __________________________________________________________________________________________________________________________________________________________________________________________________________________________________________________________________________________________________________________________________________________________________________
3. How does the Method of Measurement selected actually measure the Annual Goal?
____________________________________________________________________________________________________________________________________________________________________________________________________________________________________________________________________________________________________________________________________________________________________________
4. What does 75% 4 out of 5 consecutive work samples mean?

34
____________________________________________________________________________________________________________________________________________________________________________________________________________________________________________________________________________________________________________________________________________________________________________
5. How is a checklist different from a process checklist?
____________________________________________________________________________________________________________________________________________________________________________________________________________________________________________________________________________________________________________________________________________________________________________

35
Resources
Calculating Percentage: #Correct/Total being Monitored = %
Example:
Candace read 30 words/80 = 37%
Rachel solved 2 problems/10 = 20%
Rate of learning: Rate of learning means a student’s growth in achievement or behavior over time compared to prior levels of performance (comparison to self) and peer growth rates (comparison to age peers)
Determining the Rate of Learning:
• Find the baseline. Candace’s baseline for reading words aloud is 20%. She reads 20 out of 100 words.
• Subtract baseline number from the goal. Candace’s goal is to read 80 words out of 100. Subtract 20 from 80 to equal 60. You are expecting Candace to read 80 words at the completion of the IEP.
• Divide the difference between the baseline and the criterion in the goal by the number of days, weeks, or months of projected implementation.
• The difference is 60 words between baseline and criterion. The number of months for completion is 12.
• 60 words /12 months = 5 Candace should be learning 5 words a month.

36
Curriculum Based Measurement:
• Easy CBM http://www.easycbm.com/
• Reading Passages for fluency and comprehension http://www.readworks.org
• Reading Probes https://readtheory.org/
Direct Measurement:
• http://behaviordoctor.org/material-download /
• http://www.onsetasc.org/Page/32
• http://www.ecsd-fl.schoolloop.com/best/data
Indirect Measurement:
Goal Attainment:
http://canchild.ca/elearning/dcd_pt_workshop/assets/planning-interventions- goals/goal-attainment-scaling.pdf
Permanent Product:
http://www.specialconnections.ku.edu/~specconn/page/assessment/ddm/pdf/ Permanent_Product_toolrevised.pdf