monitoring the performance of fishways and fish passage works
TRANSCRIPT

Monitoring the performanceof fishways and fish
passage works
M.J. Jones and J.P. O’Connor
November 2017
Arthur Rylah Institute for Environmental Research Technical Report Series Number 257

AcknowledgementsThe authors would like to thank Greg Woodward and Joel Rawlinson (DELWP) for assisting withproject inception, development and management and many useful discussions regarding the project.We would also like to thank the project steering committee of Denis Lovric (CCMA), Mark Turner(GBCMA) and Duncan Hill (Fisheries Victoria) for their technical support. Ivor Stuart, Paul Reich andJarod Lyon, Andrew Berghuis, Joel Rawlinson and Tarmo Raadik are thanked for their comments onthe document.
AuthorsM.J. Jones and J.P. O’ConnorArthur Rylah Institute for Environmental Research, Department of Environment, Land, Water andPlanning, 123 Brown Street, Heidelberg, Victoria 3084.
CitationJones, M.J. and O’Connor, J.P. (2017). Monitoring the performance of fishways and fish passageworks. Arthur Rylah Institute for Environmental Research. Technical Report Series No. 257.Department of Environment, Land, Water and Planning, Heidelberg, Victoria.
Photo creditFront cover: Broken Creek, with fishway exit and weir pool. (photo: Matthew Jones)
© The State of Victoria Department of Environment, Land, Water and Planning, November 2017
This work is licensed under a Creative Commons Attribution 4.0 International licence. You are free to re-use the work under thatlicence, on the condition that you credit the State of Victoria as author. The licence does not apply to any images, photographs orbranding, including the Victorian Coat of Arms, the Victorian Government logo and the Department of Environment, Land, Water andPlanning (DELWP) logo and the Arthur Rylah Institute logo. To view a copy of this licence, visithttp://creativecommons.org/licenses/by/4.0/ISBN 978-1-76047-833-9 (print)ISBN 978-1-76047-834-6 (pdf)ISSN 1835-3827 (print)ISSN 1835-3835 (pdf)
DisclaimerThis publication may be of assistance to you but the State of Victoria and its employees do not guarantee that the publication is withoutflaw of any kind or is wholly appropriate for your particular purposes and therefore disclaims all liability for any error, loss or otherconsequence which may arise from you relying on any information in this publication.
AccessibilityIf you would like to receive this publication in an alternative format, please telephone theDELWP Customer Service Centre on 136186, email [email protected],or via the National Relay Service on 133 677 www.relayservice.com.au. This document isalso available on the internet at ari.vic.gov.au.

Summary ..........................................................................................................................................................1
1 Introduction....................................................................................................................................2
1.1 Fishway performance....................................................................................................................4
1.2 Objective of this document ..........................................................................................................4
2 Background....................................................................................................................................5
2.1 Common Victorian fishway designs............................................................................................52.1.1 Vertical-slot fishway......................................................................................................................52.1.2 Rock-ramp fishway........................................................................................................................52.1.3 Fish lock .........................................................................................................................................52.1.4 Fish lift ............................................................................................................................................52.1.5 Denil fishway..................................................................................................................................52.1.6 Bypass fishways............................................................................................................................6
3 Fishway assessment logic ...........................................................................................................7
3.1 Previous fishway assessments....................................................................................................7
3.2 Generic fishway assessment principles .....................................................................................7
3.3 Generic fishway assessment methods .......................................................................................73.3.1 Ecological assessments ...............................................................................................................83.4.1 Hydraulics assessment...............................................................................................................22
4 Proposed generic fishway evaluation methods .......................................................................24
4.1 Ecological assessment description ..........................................................................................244.1.1 Abundance (presence/absence), length-frequency method...................................................244.1.2 Presence/absence, length-frequency method..........................................................................25
4.2 Hydraulic assessment description ............................................................................................26
4.3 Fishway assessment scoring description ................................................................................26
4.4 Using the proposed evaluation methods..................................................................................314.4.1 Vertical-slot and Denil fishways .............................................................................................314.4.2 Rock ramp and bypass fishway...............................................................................................344.4.3 Fish lock and fish lift .................................................................................................................39
5 Trial of aerial photography and 3D modelling to hydraulically assess a rock-rampfishway 41
6 Conclusion ...................................................................................................................................47
Appendix 1: Examples of past fishway assessments with details on key attributes.............................48
Appendix 2: Case study — Ecological and hydraulic assessment methods for monitoringfish passage facilities....................................................................................................................................50
References .....................................................................................................................................................71
Contents

ii Monitoring the performance of fishways and fish passage works

Monitoring the performance of fishways and fish passage works 1
The construction of dams, weirs, and regulators has reduced riverine connectivity, fragmentedhabitats, and impacted the life history of fish and aquatic biota. Reducing the longitudinal and lateraldimension of river-floodplain systems, for example, has adversely affected the migratory behaviour ofsome fish, with some species unable to complete part of their life-cycle.
Fishways can be used to mitigate some of the adverse impacts of these barriers. They are now beingconstructed on the longitudinal and lateral dimension of riverine systems, and the technology is beingadapted to aid the movement of aquatic biota at road culverts.
The construction of fishways requires significant investment, so it is essential that each fishwaydesign enables fish to pass effectively if these structures are to contribute effectively to programsaimed at restoring connectivity. However, in Victoria, up to 70% of fishways built to date have eithernot been assessed for passage efficiency or are thought not to pass fish as efficiently as they could.
This document supports a Victorian Government initiative to improve the overall health of native fishpopulations and instream connectivity of Victoria’s waterways by developing a set of principles androbust methods for assessing Victoria’s fishways on a consistent basis. The document specificallyaddresses Action 11.8 of the Victorian Waterway Management Strategy (VWMS), which is ‘Developand implement a statewide program for monitoring the performance of fishways and fish passageworks’. The document also supports part of Policy 11.10 of the VWMS, ‘Programs will be put in placeto ensure the operation, performance and maintenance of fishways and other fish passage works aremonitored and continue to meet best practice standards’, which also fits with Action 17.3 of theintervention monitoring framework.
The methods proposed for monitoring fishway performance use techniques common to fishwayassessment in Australia and internationally, and have been refined during a short-term on-groundassessment phase (Appendix 2), in combination with liaison with other fishway researchers. Anassessment scoring technique is proposed, which is a unique approach to documenting andsummarising the qualitative and quantitative data collected, to determine the overall efficiency of afishway. A new method of collecting hydraulic information (i.e. headloss, slope) on fishways via aerialphotography with three-dimensional modelling was also trialled with promising results, and warrantsfurther investigation.
The methods outlined in this document will ensure that fishway assessments are consistent, enablingfishways to be benchmarked against each other and ensuring the best possible outcomes for fishpassage, catchment connectivity and system restoration in Victoria.
Summary

2 Monitoring the performance of fishways and fish passage works
The development of infrastructure such as dams, weirs, regulators, and culverts has reduced thelongitudinal and lateral connectivity of Australia’s river-floodplain systems through the presence ofphysical barriers and a reduction in the magnitude of flooding (Maheshwari et al. 1995; Gehrke et al.1995; Jones & Stuart 2008). Such flow alterations, combined with the presence of instreamstructures, have impacted the ability of native fish to move and migrate, because most instreamstructures alter the hydraulic (flows) conditions beyond the swimming ability of fish, or completelyprevent movement past the barrier (Baumgartner 2006).
Fish need to move in order to obtain food and shelter, and to reproduce (O'Connor et al. 2005; Jones& Stuart 2009; Koehn et al. 2009). Some fish species can obtain all their requirements within a singlereach of a river, but others need to migrate large distances or access seawater in order to completetheir life-cycle (Llewellyn 1968; Reynolds 1983, Crook et al. 2006). The most problematic of these arediadromous species, which are required to migrate between the sea and freshwater to complete theirlife-cycle (Crook et al. 2010), and for which the presence of an instream barrier may represent a majorhindrance to population dynamics (Katano et al. 2006). Restricting the movement of native fish mayalso lead to accumulations downstream of barriers, and consequent elevated levels of predation(Jones & Stuart 2008).
In Australia, fishways are now used to mitigate the adverse impacts of instream barriers on fishmovement (Barrett 2004). They are not only being installed on barriers in the longitudinal dimension,but also on the lateral dimension, giving fish access to important floodplain habitats (Baumgartner etal. 2012b). Improving the connectivity of waterways through fishway construction should also reducehabitat fragmentation and help to improve native fish populations (Barrett 2004; Barrett & Lintermans2008).
Fishway construction can be expensive, but if barrier removal is not practical then fishways become auseful option to mitigate the impacts of the barrier. Once a fishway has been installed, there is a needto ensure that passage efficiency meets the design specifications and fish can pass the barriereffectively. Inefficient or poorly designed fishways may not reduce the adverse impacts of instreambarriers on fish movement despite a significant effort and capital outlay. Surprisingly, in Victoria, it isestimated that up to 70% of fishways have either not been assessed, or are not working as efficientlyas they could (O'Brien et al. 2010). Therefore, understanding the effectiveness of constructedfishways is a priority if connectivity is to be restored across Victoria’s waterways.
The Victorian Waterway Management Strategy (VWMS) provides a framework for government toimprove Victoria’s waterways while meeting its obligations for waterway management and addressingcommunity expectations (Figure 1). The VWMS consists of policies and actions with sets of guidingprinciples and management approaches for various management areas. Underpinning themanagement approach is an adaptive management framework aimed at improving our understandingof how the proposed actions contribute to achieving the desired objectives. In practice, some of theVWMS’s policies are aimed at improving connectivity and therefore passage for native fish, and theinitial steps are to gather contemporary information on fishway design, operation, maintenance, andperformance.
1 Introduction

Monitoring the performance of fishways and fish passage works 3
Figure 1.1: Role of Action 11.8 of VWMS in assessing fishway efficiency with flow on biological effects and association with Action 17.3 ofthe Intervention Monitoring Framework.

4 Monitoring the performance of fishways and fish passage works
1.1 Fishway performanceFishway performance can be measured over a number of spatial and temporal scales. At the local(i.e. fishway) scale, a fishway must meet its ecological performance objectives (e.g. pass all fish thefishway is designed for, over a specified range of river flow conditions), or the objectives used todesign the fishway (during the concept and detailed design stage), while performing to designspecifications (i.e. internal fishway hydraulics measured after construction must reflect that detailedduring the design stage). These may include a number of guiding principles. For example, thefishway may be required to operate at a particular percentage of stream discharge events (e.g.medium to low flows on a receding river), or operate during a high flow event (e.g. up to and includinga 1-in-5 year flow event), or across a range of discharge events (e.g. commence to flow up to andincluding a 1-in-1 year flow event), and be able to pass a particular suite of species and sizes of fish.
At the catchment scale, fishway effectiveness may be evaluated by a number of methods, such aslong-term monitoring in the upstream catchment to measure changes in the fish community, includingchanges in species presence/absence or changes in sizes distribution. An appropriate samplingdesign must be employed to ensure any changes can be detected and confidently attributed to thefishway construction. Fishway performance may also be measured through a reduction in fishaccumulations immediately downstream, although fish accumulations may be seasonal or related tostream discharge or other factors such as predation (O'Connor et al. 2015a).
1.2 Objective of this documentThis document provides the rationale and develops guidelines for consistent and robustmethodologies to evaluate Victorian fishways. This information should support waterway managersand researchers in gathering the necessary data on changes resulting from fishway construction andto improve their design and operation to ensure that management objectives are achieved.
Specifically, this document addresses Action 11.8 of the Victorian Waterway Management Strategy(VWMS), which is ‘Develop and implement a statewide program for monitoring the performance offishways and fish passage works’. This Action is designed to assess the efficiency of a constructedfishway, to ensure that it functions to design, thereby avoiding the adverse impacts of inefficientfishways (Figure 1). This document also supports part of Policy 11.10 of the VWMS, ‘Programs willbe put in place to ensure the operation, performance and maintenance of fishways and other fishpassage works are monitored and continue to meet best practice standards’.
Specific objectives are as follows:1 Outline relevant fishway types in Victoria.2 Outline fishway assessment logic including:
a Reviewing previous fishway assessmentsb Identifying generic fishway assessment principlesc Documenting generic fishway assessment methods.
3 Propose and test a set of generic fishway assessment method that can be adapted on a site-by-site basis (Appendix 2).
4 Trial the use of aerial photography with three-dimensional computer modelling as a means ofgathering hydraulic information on a rock-ramp fishway.

Monitoring the performance of fishways and fish passage works 5
2 Background2.1 Common Victorian fishway designsSix basic fishway designs are present in Australia, including vertical-slot, rock-ramp, fish lock, fish lift,Denil and fish bypass, however vertical-slot and rock-ramp fishways are most prevalent in Victoria.Barrier height, stream hydrology, species present within a waterway, fish size-class ranges, capitalcost, unique site parameters (e.g. substrate type), and internal hydraulics, are the main determinantsof which fishway type will be used at a particular barrier. The following section provides a summary ofbasic fishway types, however refer to O’Connor et al. (2015b) for a more detailed description.
2.1.1 Vertical-slot fishwayVertical-slot fishways are typically constructed on barriers up 6 m high. They have a relatively low-gradient concrete channel structure (e.g. 1h : 22 – 32l) connected by a series of vertical slots thatdivide the fishway into a series of pools. More pools generally indicate a gentler gradient, and longfishways may have resting pools to allow fish to recuperate during their ascent. The vertical slot runsthe full depth of each fishway pool (facilitating operation over a range of water levels), and the slotangles the water across the fishway pool, dissipating the energy of the water at the same time. Thehead loss, or height difference between each pool, determines the water velocity and pool turbulence(along with the pool dimensions), which in turn determine the size and species of fish capable ofsuccessfully passing the fishway.
2.1.2 Rock-ramp fishwayRock-ramp fishways are most commonly used for barriers less than 2 m in height, and they typicallyhave gentle slopes (i.e.>1h : 25l). Rock-ramp fishways are typically constructed of strategicallyplaced rocks, but they can be made of an artificial substrate such as concrete blocks. Rocks may beplaced semi-randomly in the waterway for a natural aesthetic look, or they may be placed in ridgelines and have associated formalised pools. Rock-ramps may be full or partial width; that is, they maycover the full width of the waterway or only part of the width. Full width rock-ramps allow for greaterrange of head water variation compared with partial width rock-ramps. The fishway slope, and gapbetween rocks influence the discharge of the fishway and the internal turbulence and water velocity,which control the species and size-classes of fish able to move through. Rock-ramps also haveinterstitial spaces capable of passing other aquatic fauna (e.g. turtles and invertebrates).
2.1.3 Fish lockFish locks are used to move fish over high barriers (i.e. dams), typically 5–15 m high, although insome cases the design may be the most suitable for smaller structures. Fish locks are often used topass small and large fish in the same fishway or when the capital cost of constructing a vertical-slotfishway is too high. Functionally, fish locks operate in a similar way to a navigation lock designed tomove boats past barriers, with gates at the entrance, a holding chamber, and gates at the exit. Fishlocks have four basic phases: attraction, filling, exit, and transition. In the attraction phase, theentrance gates are open to allow fish to enter the holding chamber. The entrance gates are thenclosed during the filling phase, then the exit gates open to allow fish to exit the chamber upstream ofthe barrier. The system then transitions back to the attraction phase. The filling phase can beachieved via pipework which fills from the bottom (Ardnacrusha design), or top (Borland or opendesign). The default cycle time of the automated control system (programmable logic controller, PLC)will depend on the species present (O’Connor et al. 2015b).
2.1.4 Fish liftFish lifts are generally used for stream barriers higher than 10 m. Fish lifts transport a single ‘hopper’of water and fish to the upstream side of the barrier, which contrasts with a fish lock, in which thechamber fills with water to allow fish to passively ascend to the height of the exit location. Like a fishlock, however, fish lifts are usually automated. Entrance into the fish lift can be via an entrancechannel or a short section of vertical-slot fishway.
2.1.5 Denil fishwayA Denil fishway may be used on barriers less than under 4 m high and is often used in combinationwith a vertical-slot fishway. Denil fishways may be used as the primary fishway, but their discharge is

6 Monitoring the performance of fishways and fish passage works
usually greater than a vertical-slot fishway and they generally target large fish that are capable ofnegotiating relatively fast water velocities (e.g. 1.8 m/s) and steep slopes (e.g. 1h : 8l). The Denildesign consists of a rectangular chute with closely spaced triangular baffles or vanes located alongthe sides and bottom and set at 45°, causing part of the flow to turn back on itself and thus reducingvelocity against which fish must ascend (Clay 1995). The strong flow associated with Denil fishwaysreduces the deposition of sediment and provides good attraction flows for fishway entrance efficiency.
2.1.6 Bypass fishwaysA fish bypass may be used for small to medium barriers (e.g. 2–6 m high). Although similar to a rockfishway, bypasses usually have a more conservative slope (i.e. 1v : 50h). Bypass fishways look like anatural stream, with pools, meanders and riffles and an earthen or rocky channel. Unfortunately theapplication of fish bypasses is limited by variable headwater levels, so they should only be used insituations where headwater variation is limited (e.g. a static weir pool). Bypass fishways can betailored for individual species or whole fish communities. They can also pass other aquatic faunaincluding turtles and invertebrates.

Monitoring the performance of fishways and fish passage works 7
3 Fishway assessment logic3.1 Previous fishway assessmentsTo develop the guideline logic, a total of 26 past fishway investigations were reviewed for a range ofinformation, including type of data collected, fishway assessment techniques, and fishway analysismethod (Appendix 1). The investigations included a range of scientific papers and unpublishedreports. Preference was given to reports with relevance to Australian conditions.
Although this review was not exhaustive it highlighted the common approaches to fishwayassessments, and the data obtained has been used to inform an approach suited to Victoria’s fishwayassessment objectives. Most of the documents used were published accounts from both Australianand International journals, but a number of unpublished Australian reports were also used.
Because the design of each fishway and target fish species was different, each fishway was assessedslightly differently, in terms of assessment duration, techniques and objectives. Despite this,investigations generally targeted the whole fish community, but some assessments focused onparticular target species (Appendix 1). Most of the investigations did not mention the target speciesor size classes. The range of assessment techniques included, PIT tagging, radio-telemetry, fishwaytrapping, video recordings, mark–recapture, and electrofishing. Fishways were generally sampledover a 24-hour period, although the duration of some was shorter. The number of fishway trappingreplicates ranged from 2 to 100, but was unclear in some investigations. Fishway traps weregenerally checked up to two times over a 24-hour period, and typical data collected includedabundance, length-frequency, behaviour, hydraulics, passage efficiency and attraction efficiency.
The data collected from this review, combined with expert opinion, was used to inform the genericfishway assessment principles and analysis methods proposed in the following sections.
3.2 Generic fishway assessment principlesDespite the breadth of literature reviewed in developing this guideline, all assessments generallyconformed to a similar set of assessment principles. These were largely based on ecological data,including ascent success, attraction efficiency, abundance information, length-frequencycomparisons, and behavioural information. However, hydraulic information was also provided, albeitless frequently, and included information such as fishway slope, turbulence levels and fishwaydimensions.
From this information a set of generic fishway assessment principles were identified to help guide thedevelopment of the fishway assessment guidelines, as follows:• The fishway design, including water depth, water velocity, turbulence and slope, is suitable for all
target species.• All target species sampled at the entrance should also be sampled at the exit.• The size classes of target fish present at the entrance should also be present at the exit.• The constructed fishway reflects the design, with minimal variation.• The fishway operates over the designed range of flow conditions.
3.3 Generic fishway assessment methodsFishway assessments may be completed using a number of different methods, but some may bemore practical than others, depending upon the objectives of the investigation. In Australia, trappingthe entrance and exit of a fishway is generally the first method of assessment used, but if this is notpossible then electrofishing and trapping, electrofishing only, or mark–recapture may be used. Theuse of PIT tagging in fishway assessments in Australia is a relatively recent advance (i.e. since 2003),and has been used mainly to provide supplementary information to a trapping assessment method.Radio-tagging has also been used, but mainly for complex fishway assessments where behaviouralinformation can inform the management of a structure (Stuart et al. 2010).
The following section details common assessment designs which may be used to assess fishways inVictoria. Assessing the fishway hydraulics and accumulations downstream of a structure are alsodiscussed.

8 Monitoring the performance of fishways and fish passage works
3.3.1 Ecological assessmentsTrapping
Fish passing through a fishway present researchers with a unique opportunity to sample part of themigratory fish population and thus evaluate the fishway against its ecological and design objectives.To assess vertical-slot fishways, sampling is typically undertaken using tailored traps covered in meshof a suitable size for the target species (Figure 3.1). Fishway traps may also be used in fish locks andfish lifts, being placed at the entrance or exit.
Figure 3.1: Fishway trap used to sample vertical-slot fishway (exit), and in position (entrance).
Sampling the entrance and exit of a fishway is similar to a treatment and control experiment forfishway ascent success. The control is the entrance of the fishway, which is typically representativeof the fish population downstream of the barrier, while the exit is the treatment, or the test for the fishtrying to ascend the fishway. Differences in the fish population (diversity, abundance, size-class)between the entrance and the exit can generally be attributed to the effect of the fishway. (Note that atrue control must also involve sampling downstream of the fishway entrance, as small fish may not beable to enter the fishway entrance trap when operating at full discharge. Alternatively, a controlsample may be collected by the fishway entrance trap if fishway discharge is reduced by partiallyclosing the fishway exit gates, which in effect reduces water velocity and turbulence at the entrance.)
Trash screens should be used to prevent debris from clogging the mesh on the traps; trash screenare set upstream of the trap to filter the water for debris (Figure 3.2). Debris build-up on the trap maylead to restricted water flow through the fishway, decreasing the water level downstream of the trapsubstantially. This is referred to as headloss, or the difference between upstream and downstreamwater levels. Maintaining a consistent headloss throughout the sample period is imperative given thata higher headloss at the trap entrance may prevent small fish (which will be weaker swimmers) fromentering. A build-up of debris can also decrease the attraction flow at the entrance of the fishway.Trash screens also need to be cleaned regularly in order to obtain a consistent sample within afishway trap.
One-way funnels and screens can be used in fishway pools as an alternative when traps are notpractical to handle, e.g. where there is no gantry to lift the trap (Figure 3.2). Funnels and screensmay be more appropriate to use on pool or Denil fishways, where the pool is used as the holding areafor the fish. Unlike fishway traps where the trap can be lifted out to access the fish, flows through thefishway may need to be shut off to enable the fish to be collected by electrofishing or dip-netting.
Biological measurements taken at both the entrance and exit include species presence/absence,individual length and abundance. For each replicate (i.e. entrance and exit sample) sample, asufficient number of individuals of each species should be measured for length to determine if there is

Monitoring the performance of fishways and fish passage works 9
a statistical size difference between the entrance and exit samples. Total abundance may also berecorded, but comparisons between entrance and exit are somewhat confounded by trap design(often entrance and exit traps differ) and trap shyness and therefore abundance data needs tointerpreted with this limitation in mind.
If possible, a pilot investigation should be undertaken to determine the appropriate duration to trap(i.e. 1–24 hours). A one-hour sample may be used and progressively increased until a representativesample is captured (refer to tables below). This may be one hour if large numbers of fish are present,or 24 hours (or longer) if few fish are present. This method can be applied to samples collectedduring the day or night, depending upon the objective of the investigation. Seasonal and diel effectson fish movement must also be considered, as some fish species or size classes of fish only moveduring a discrete part of the day or year, or in particular flow conditions.
Figure 3.2: Left: Funnel on the exit of a Denil fishway in the Murray River, used to prevent fishfrom making return movements. Right: Screens to prevent fish escaping and trash fromreaching the funnel.
Importantly, an appropriate time period must be allowed to pass between top and bottom sampling toenable a representative sample to be collected. For example, enough time should be allowed to passafter entrance sampling to enable fish to successfully redistribute throughout the fishway and reachthe exit prior to commencing the exit sample; this will vary with species and fishway length. Similarly,if the fish are diurnal then enough time must be allowed each day for them to ascend the fishway priorto commencing trapping the exit or entrance. This also relies on the assumption that diurnal fishgenerally do not reside in the fishway overnight. If this assumption is not valid, then implementing aLatin square design (blocking for time) may help to overcome this issue; that is, each sample is to becompleted at each of the allocated sample periods throughout the day. For example, the entranceand exit of a fishway is sampled at set periods throughout the day (e.g. 9–11 am, 12–2 pm, 4–6 pm).
One of the limitations of trapping is trap shyness. Fish can repeatedly attempt to enter traps prior toactually entering, or escape traps after entering (Stuart & Mallen-Cooper 1999). Escapement alsoneeds to be considered when designing a trap and when designing the sampling procedure. Onemethod to quantify escapement and trap shyness at each sample location is the use of a DIDSONsonar to count the number of fish entering and exiting the trap prior to completing the sample.
10 Monitoring the performance of fishways and fish passage works
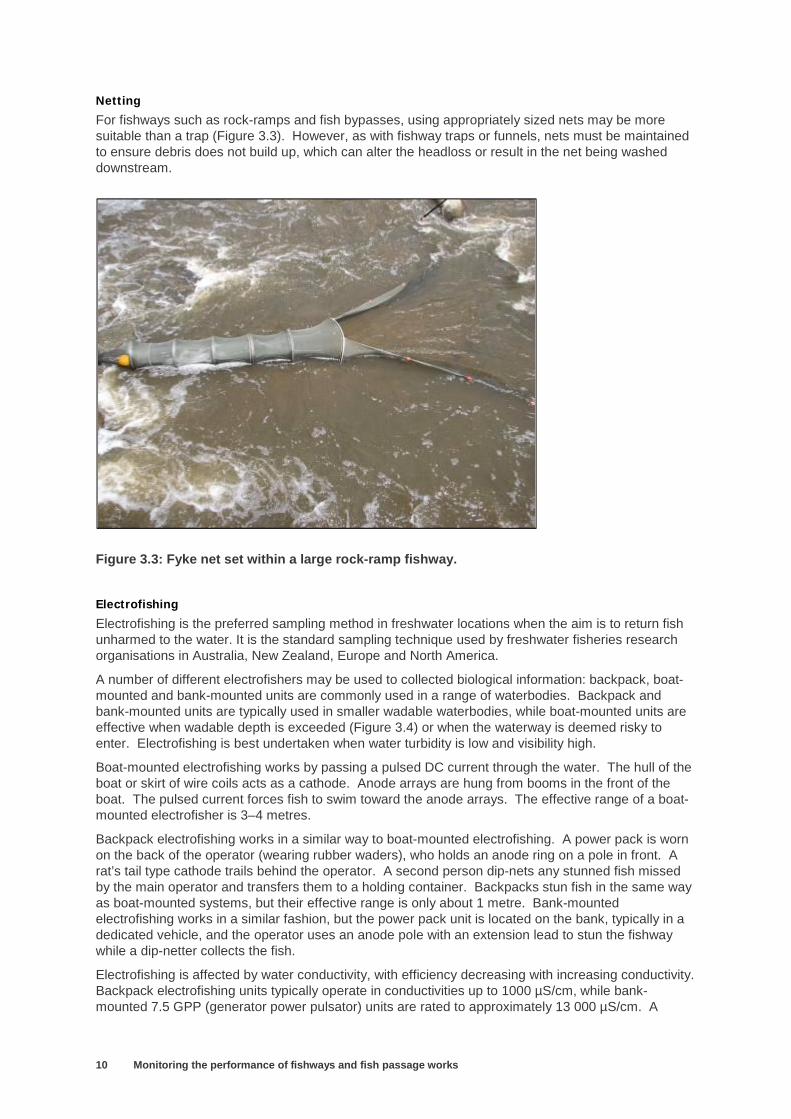
Netting
For fishways such as rock-ramps and fish bypasses, using appropriately sized nets may be moresuitable than a trap (Figure 3.3). However, as with fishway traps or funnels, nets must be maintainedto ensure debris does not build up, which can alter the headloss or result in the net being washeddownstream.
Figure 3.3: Fyke net set within a large rock-ramp fishway.
Electrofishing
Electrofishing is the preferred sampling method in freshwater locations when the aim is to return fishunharmed to the water. It is the standard sampling technique used by freshwater fisheries researchorganisations in Australia, New Zealand, Europe and North America.
A number of different electrofishers may be used to collected biological information: backpack, boat-mounted and bank-mounted units are commonly used in a range of waterbodies. Backpack andbank-mounted units are typically used in smaller wadable waterbodies, while boat-mounted units areeffective when wadable depth is exceeded (Figure 3.4) or when the waterway is deemed risky toenter. Electrofishing is best undertaken when water turbidity is low and visibility high.
Boat-mounted electrofishing works by passing a pulsed DC current through the water. The hull of theboat or skirt of wire coils acts as a cathode. Anode arrays are hung from booms in the front of theboat. The pulsed current forces fish to swim toward the anode arrays. The effective range of a boat-mounted electrofisher is 3–4 metres.
Backpack electrofishing works in a similar way to boat-mounted electrofishing. A power pack is wornon the back of the operator (wearing rubber waders), who holds an anode ring on a pole in front. Arat’s tail type cathode trails behind the operator. A second person dip-nets any stunned fish missedby the main operator and transfers them to a holding container. Backpacks stun fish in the same wayas boat-mounted systems, but their effective range is only about 1 metre. Bank-mountedelectrofishing works in a similar fashion, but the power pack unit is located on the bank, typically in adedicated vehicle, and the operator uses an anode pole with an extension lead to stun the fishwaywhile a dip-netter collects the fish.
Electrofishing is affected by water conductivity, with efficiency decreasing with increasing conductivity.Backpack electrofishing units typically operate in conductivities up to 1000 µS/cm, while bank-mounted 7.5 GPP (generator power pulsator) units are rated to approximately 13 000 µS/cm. A

Monitoring the performance of fishways and fish passage works 11
5 GPP boat-mounted unit is rated to 5500 µS/cm. Despite this, electrofishing may be conducted inestuaries, and a new electrofishing unit (Hans Grassl EL65 II GI 1) is being developed to operate upto 35 000 µS/cm.
Electrofishing can be used to assess a number of different fishway types. Rock-ramp fishways andfish bypasses, for example, may be sampled by electrofishing only, while vertical-slot fishways(traditionally sampled by trapping) may be electrofished at the entrance if trapping cannot beundertaken effectively. Electrofishing is also an active technique and therefore may be completedover a much shorter time period compared with trapping.
Fishway assessments involving electrofishing are generally completed by dividing the site intorepeatable sampling zones, such as downstream of the fishway, entrance of the fishway, middle offishway, fishway exit, and upstream of the fishway. Each zone may be electrofished for a consistentperiod (i.e. electrofishing time on), with the assessment comparing catches between zones. Areaswhere the relative abundance or size structure of the fish population change may indicate that theremay be a competing attraction flow distracting fish from the entrance, or unsuitable hydraulicconditions at the approach or within the fishway preventing fish of particular size classes from movingfarther. Statistical analyses of species abundance and length frequency of different sample zones willhelp to determine this.
One of the limitations of electrofishing is that it is size-selective (Dolan & Miranda 2003); that is, it ismore efficient at catching larger fish than smaller fish, and electrofishing efficiency changes with waterdepth and water clarity, i.e. where the electric field does not reach into fish habitat or where fish canbe hard to observe in deep water or are washed away by high discharges. This may be problematicwhen assessing rock-ramp fishways that are wadable at low or medium discharges but not at higherdischarges. Furthermore, some fish may migrate only on high discharges, so that the technique maybe exposed to significant bias.
Figure 3.4: Boat (left) and bank-mounted (right) electrofishing.
Mark–recaptureMark–recapture studies are used in fishway assessments to determine the movement behaviour offish, or to measure fishway efficiency or passage success. A mark–recapture investigation involvescapturing fish, marking or tagging them, and releasing them at their capture site. The subsequentrecapture of these fish allows researchers to calculate distance moved and time since release, andprovides data on various behavioural aspects.When using mark–recapture to assess fish passage efficiency, the fish may be released in theimmediate vicinity of the fishway entrance, but they may also be released downstream of the fishwayentrance depending upon the objectives of the investigation, e.g. to determine fishway entranceefficiency. Trapping at the fishway exit will help to determine passage success, and sampling riverinehabitats upstream of the fishway by electrofishing may also be used to determine passage efficiency.
12 Monitoring the performance of fishways and fish passage works
Because a percentage of the marked population may move out of the study area entirely, this methodmust be validated when determining overall passage efficiency of the tagged population.Furthermore, mark–recapture involves handling the fish prior to beginning the experiment, andhandling fish is known to cause adverse side effects or abnormal behaviour (Conte 2004; Wedemeyer1976). Anaesthesia and surgery in particular can affect behaviour and physiology (Adams et al. 1998;Bridger & Booth 2003), and a percentage of fish can also become infected, shed their tag, or die(Lucas 1989; Summerfelt & Mosier 1984; Ward et al. 2008).
Mark–recapture investigations should therefore recognise the effects of capture, handling andmarking methods on fish behaviour prior to interpreting results. Previous research has allowed aminimum waiting period of two weeks during warmer months and four weeks during cooler months formark–recapture involving anaesthesia and surgery (Jones 2009). If possible, the fishway should notbe operational during this period.
PIT tagging
A passive integrated transponder (PIT) is an inert tag implanted into an animal to track itsmovements. PIT tags have been used on mammals, birds, reptiles, amphibians and invertebrates.Data collected from PIT tags provides information on individuals, populations and communities, inaddition to behaviour, physiology, management, conservation and commercial harvest.
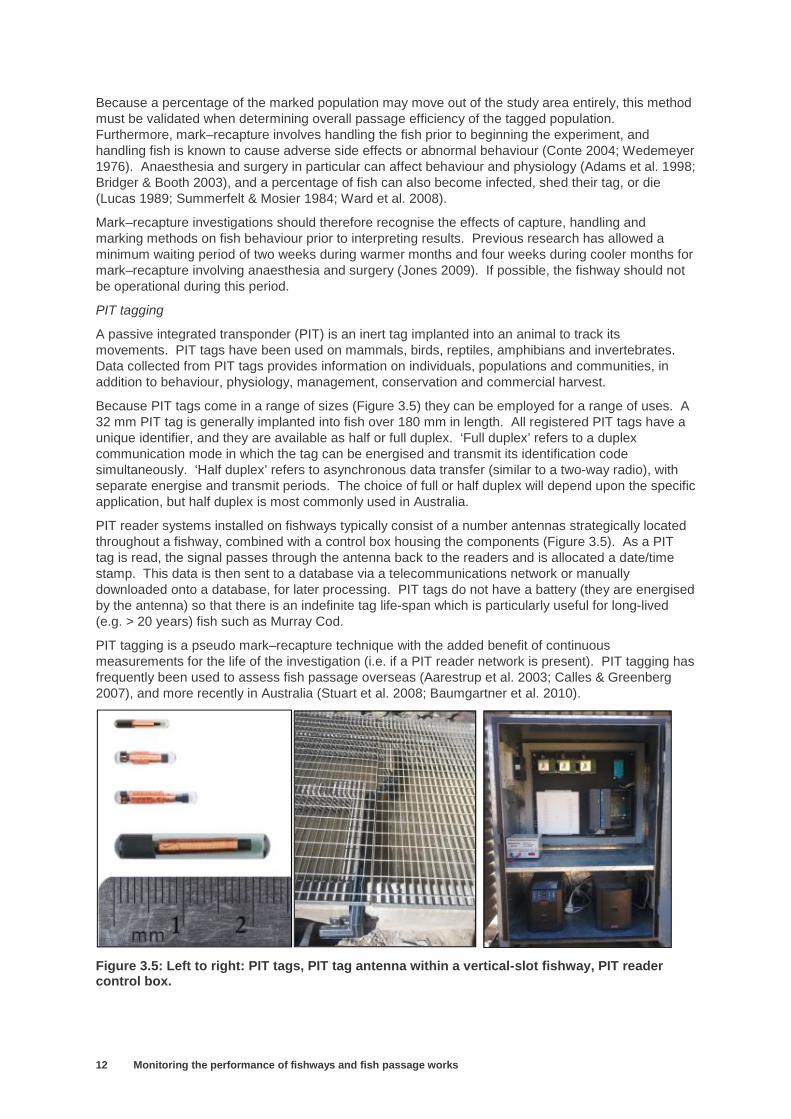
Because PIT tags come in a range of sizes (Figure 3.5) they can be employed for a range of uses. A32 mm PIT tag is generally implanted into fish over 180 mm in length. All registered PIT tags have aunique identifier, and they are available as half or full duplex. ‘Full duplex’ refers to a duplexcommunication mode in which the tag can be energised and transmit its identification codesimultaneously. ‘Half duplex’ refers to asynchronous data transfer (similar to a two-way radio), withseparate energise and transmit periods. The choice of full or half duplex will depend upon the specificapplication, but half duplex is most commonly used in Australia.
PIT reader systems installed on fishways typically consist of a number antennas strategically locatedthroughout a fishway, combined with a control box housing the components (Figure 3.5). As a PITtag is read, the signal passes through the antenna back to the readers and is allocated a date/timestamp. This data is then sent to a database via a telecommunications network or manuallydownloaded onto a database, for later processing. PIT tags do not have a battery (they are energisedby the antenna) so that there is an indefinite tag life-span which is particularly useful for long-lived(e.g. > 20 years) fish such as Murray Cod.
PIT tagging is a pseudo mark–recapture technique with the added benefit of continuousmeasurements for the life of the investigation (i.e. if a PIT reader network is present). PIT tagging hasfrequently been used to assess fish passage overseas (Aarestrup et al. 2003; Calles & Greenberg2007), and more recently in Australia (Stuart et al. 2008; Baumgartner et al. 2010).
Figure 3.5: Left to right: PIT tags, PIT tag antenna within a vertical-slot fishway, PIT readercontrol box.

Monitoring the performance of fishways and fish passage works 13
PIT tag readers are generally placed in the entrance, middle and exit of the fishway, but may also beplaced downstream and upstream of the fishway to monitor the movement behaviour of fish. Fish aregenerally tagged and released immediately downstream of the fishway, but may be released into theentrance of the fishway depending upon the objectives of the investigation. Passage success iscalculated as the number of successful ascents versus the number of unsuccessful ascents, howeverdepending on the objectives of the investigation, timing of movement and time taken to ascend mayalso be important.
Importantly, to assess fishway efficiency with PIT tags effectively, a diverse range of fish species andsize classes should be tagged. However, if the fishway is only designed for a limited number ofspecies or a limited size-class, then this may be slightly easier to achieve.
The adverse effects of fish capture, handling and marking fish also apply to the PIT tagging method,and a minimum waiting period (prior to interpreting results) may need to be considered to minimisepotential for abnormal behaviour. Similarly, the number of fish moving out of the study area, or beingremoved by anglers, needs to be considered in the assessment design.
External tags
Externally tagging fish is one method for identifying marked fish in a mark–recapture investigation(Figure 3.6). External tagging is also a good method for determining fishway success at thecatchment scale, where angling species are tagged across the catchment. Fisheries researchers inAustralia have been externally tagging fish since the early 1960s, with amateur anglers playing asignificant role in providing data to fisheries researchers. Anglers record the date, capture site,species, length, and weight (if possible), allowing researchers to compare these data to the initialcapture information and thereby determine movement pathways, distance travelled and time at large.Tag–recapture may also provide information on the time take for the species to distribute itself acrossthe catchment when movement pathways are restored.
Figure 3.6: A golden perch implanted with a dart tag.

14 Monitoring the performance of fishways and fish passage works
Chemical marking
Chemical marking is another method for identifying marked fish in a mark–recapture investigation.Common chemical marking methods used in fisheries research include the use of calcein and alizarinred (Wilson et al. 1987) (Figure 3.7). The marking method has been used on Golden Perch (Crook etal. 2009) and a number of different galaxiid species (unpubl. data), and the technique has no knownadverse side effects outside of the capture and handling procedure. Once marked, researchers canidentify marked individuals by illuminating them with a fluorescent light. Researchers wanting tochemically mark fish should refer to the detailed methods outlined in Crook et al. (2009).
Figure 3.7: Example of a chemically marked fish under fluorescent light: calcein (left) andalizarin red (right).
Radio and acoustic tagging
In Australia, radio and acoustic tagging have been used for ecological investigations since the early1990s. Radio and acoustic tagging allow researchers to track or monitor the movement behaviour ofindividual animals in a range of environments, and the technology is therefore applicable to a widevariety of situations, including fishway assessments.
Both radio and acoustic tagging involve two main components; a transmitter and a receiver. Acoustictracking can only be used under water, while radio tracking can also be used in terrestrialinvestigations. The receivers are mounted above water for radio-telemetry (Figure 3.8), while thereceivers of acoustic telemetry are generally located underwater (Figure 3.9).
Networks of radio and acoustic tagging equipment have been established along large stretches ofriverine systems and migration corridors (Eiler 1995). The restricted nature of most rivers makesthem an ideal environment to track the movements of animals due to their natural bottleneck effect onmovement pathways and consequent high detection rates.
Radio-tagging has been used to assess a variety of fishways, particularly for fishway attractionefficiency (the ability of fish to find the fishway entrance). Attraction efficiency is very important forfishways because fish first need to find the fishway entrance to successfully ascend, and inenvironments such as hydro-electric power stations, where noise and turbulence are usually high,locating the entrance of a fishway may prove to be difficult. Flows over a weir or hydroelectric powerstation, for example, may be manipulated to determine the most suitable fishway attraction flows.
Radio-tagging has been used in a similar manner to PIT tagging, with antennas placed at theentrance and exit (and throughout the fishway) to determine ascent success (i.e. number ofunsuccessful ascents versus number of successful ascents). Antennas may also be erecteddownstream of the fishway or at barriers or fishways farther up the catchment, thereby allowing theoverall fate of the fish to be determined.
The adverse effects of fish capture, handling and marking on fish also apply to the radio-taggingmethod, and a minimum waiting period (prior to interpreting results) may need to be considered tominimise the potential for abnormal behaviour. Similarly, the number of fish moving out of the studyarea should be considered in the design.

Monitoring the performance of fishways and fish passage works 15
Figure 3.8: Top left: Golden perch with external dart tag and radio-transmitter implanted.Bottom left: Radio tag. Right: Radio-tracking tower with directional antennas at the junction ofa river anabranch to track the movements of fish.
Figure 3.9: Acoustic receiver and tag.

16 Monitoring the performance of fishways and fish passage works
Video recording
Video or digital recording is another tool that can be used to monitor the movements of animalsthrough fishways. Video cameras may be used to observe animal behaviour and therefore collect adiverse range of behavioural information. They can also be used to collect species identification,distributional and abundance information, including within a fishway (Figure 11).
Once a video site is established, the system can collect significant quantities of information without aresearcher present. However, the footage obtain also requires significant real time post-processing(i.e. someone must quantify the visual data manually) unless specific software has been developed toprocess it. For this reason video recording may be best suited to obtaining behavioural informationrather than quantifiable information. Video cameras also require good water clarity to obtain clearimages and regular maintenance to minimise algal growth, and can be prone to trapping debris. Theycan also be difficult to clean safely and effectively without isolating the fishway.
Figure 3.10: Underwater video camera installed on the Milwaukee River fishway, Wisconsin, bythe US Fish and Wildlife Service for the Ozaukee County Planning and Parks Department.
Alternative ecological assessment techniques
A number of alternative and highly technical methods are available to researchers to monitorfishways, including split-beam hydroacoustics, dual-frequency identification sonar (DIDSON), VAKIRiverwatcher, and automatic resistivity counters. However, these methods required specific training,possibly software development for data analyses, and significant post-recording analysis andinterpretation of fish behaviour. For these reasons these techniques are not generally recommendedfor fishway assessments. Despite this, a brief description of each technology is listed below, and linksfor further information about these technologies are provided.
Sonar
Split beam hydroacoustics and DIDSON utilise sonar (sound navigation and ranging). Sonar is theuse of sound propagation to communicate with or detect objects in the water, while hydroacoustics isthe general term for the application of sound in water. Hydroacoustics can be used to detect water
Monitoring the performance of fishways and fish passage works 17
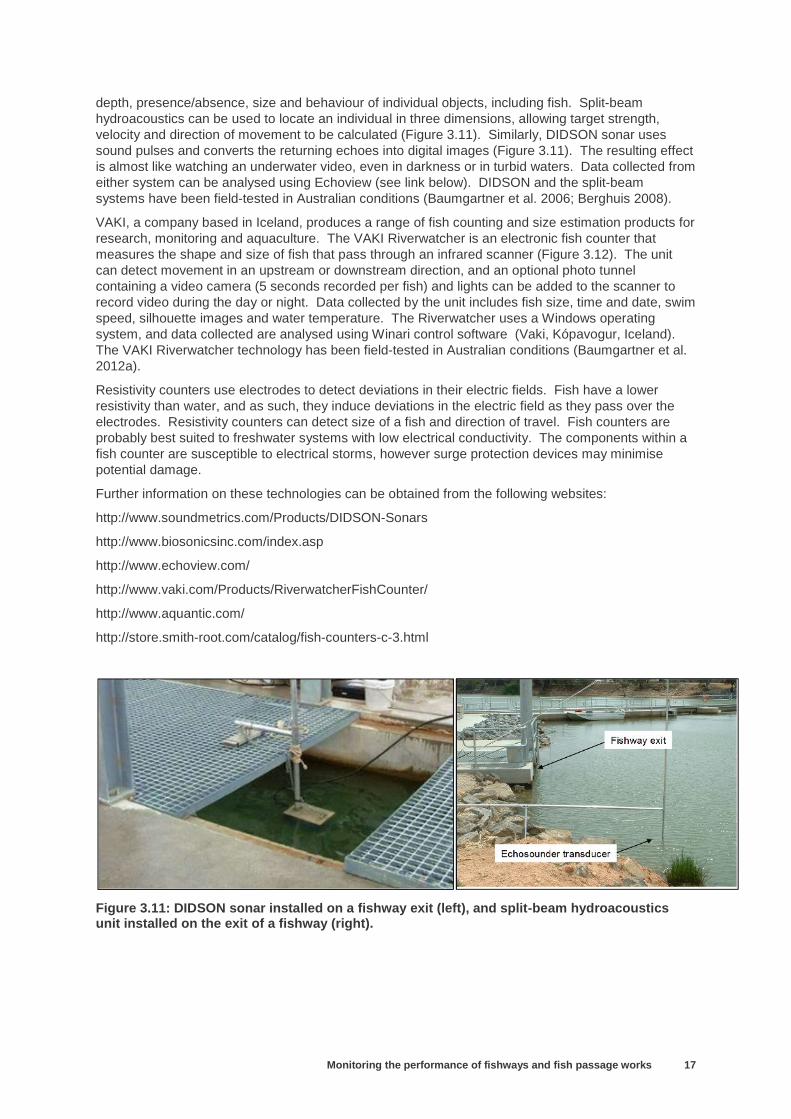
depth, presence/absence, size and behaviour of individual objects, including fish. Split-beamhydroacoustics can be used to locate an individual in three dimensions, allowing target strength,velocity and direction of movement to be calculated (Figure 3.11). Similarly, DIDSON sonar usessound pulses and converts the returning echoes into digital images (Figure 3.11). The resulting effectis almost like watching an underwater video, even in darkness or in turbid waters. Data collected fromeither system can be analysed using Echoview (see link below). DIDSON and the split-beamsystems have been field-tested in Australian conditions (Baumgartner et al. 2006; Berghuis 2008).
VAKI, a company based in Iceland, produces a range of fish counting and size estimation products forresearch, monitoring and aquaculture. The VAKI Riverwatcher is an electronic fish counter thatmeasures the shape and size of fish that pass through an infrared scanner (Figure 3.12). The unitcan detect movement in an upstream or downstream direction, and an optional photo tunnelcontaining a video camera (5 seconds recorded per fish) and lights can be added to the scanner torecord video during the day or night. Data collected by the unit includes fish size, time and date, swimspeed, silhouette images and water temperature. The Riverwatcher uses a Windows operatingsystem, and data collected are analysed using Winari control software (Vaki, Kópavogur, Iceland).The VAKI Riverwatcher technology has been field-tested in Australian conditions (Baumgartner et al.2012a).
Resistivity counters use electrodes to detect deviations in their electric fields. Fish have a lowerresistivity than water, and as such, they induce deviations in the electric field as they pass over theelectrodes. Resistivity counters can detect size of a fish and direction of travel. Fish counters areprobably best suited to freshwater systems with low electrical conductivity. The components within afish counter are susceptible to electrical storms, however surge protection devices may minimisepotential damage.
Further information on these technologies can be obtained from the following websites:
http://www.soundmetrics.com/Products/DIDSON-Sonars
http://www.biosonicsinc.com/index.asp
http://www.echoview.com/
http://www.vaki.com/Products/RiverwatcherFishCounter/
http://www.aquantic.com/
http://store.smith-root.com/catalog/fish-counters-c-3.html
Figure 3.11: DIDSON sonar installed on a fishway exit (left), and split-beam hydroacousticsunit installed on the exit of a fishway (right).

18 Monitoring the performance of fishways and fish passage works
Figure 3.12: VAKI Riverwatcher next to, and within a fishway exit.
Fish accumulations
Monitoring the abundance and composition of fish downstream of a structure may be used todocument change following barrier construction or removal, or when the impacts of a barrier aremitigated through the construction of a fishway. Monitoring the downstream accumulation of fish mayneed to be undertaken over a number of years, given that fish accumulations and speciescomposition can vary with season and year. Each site should also be sampled repeatedly to ensurethat robust statistical analyses can be performed.
Monitoring should include sites located close to the barrier (treatment) and downstream outside thearea of influence of the barrier, or in a neighbouring catchment (control). Control sites allowresearchers to determine the natural temporal dynamics of the fish population unrestricted by abarrier, making it possible to compare the project outcomes with sites located immediatelydownstream of the barrier. Prior to establishing control sites, researchers should endeavour toundertake a pilot sample of the fish population to ensure that the relative abundance and speciescomposition are representative and that the sites are suitable as controls.
When a fishway commences operation, the composition of the fish population immediatelydownstream of the barrier should alter by declining in abundance, while the control site locatedoutside the influence area should be more or less unchanged (relative to natural variation).Monitoring should take into account the time of year the fishway is opened and the period when fishaccumulations generally occur.
If funding for a longer-term monitoring program is not available, a short-term assessment may targetkey accumulation periods for the barrier. Along the Murray River, for example, the key accumulationperiod may be between September–December during a rising river. Thus researchers target thisperiod, aiming to achieve a suitable number of sample replicates at both the control and treatmentsites.
Fishway attraction
The attraction of fish to the entrance of a fishway is vitally important for passage success. A largebarrier such as a weir or regulator can be hundreds of metres wide, while the entrance of a fishway orlock is typically less than 1 m. Fishway attraction flows may be refined by manipulating the weir gatesettings to eliminate recirculation or eddies around the entrance, and to ensure that the fishway

Monitoring the performance of fishways and fish passage works 19
entrance discharge is not masked by flows from the weir (or elsewhere), so that the integrity of thefishway flow is maintained (O'Connor et al. 2015b).
Appropriate fishway attraction settings may also be determined through monitoring. Radio or acoustictagging and PIT tagging are the two best two methods for this. The behaviour of fish taggedimmediately downstream of the barrier or fishway entrance may be monitored as the weir settings,and hence the attraction conditions, are manipulated. This should also be repeated during low,medium and high flows to determine the nature of movement around the structure over a range offlow conditions. For details of methods to refine fishway attraction flows, refer to O’Connor et al.(2015b, 2017).Data analyses
Fishway assessments generally collect a range of data including species diversity, length-frequency,relative abundance, hydrology, and to a smaller extent, behavioural data (Appendix 1). Non-parametric tests used in fishway data analyses include the Kolmogorov–Smirnov test, Wilcoxon’srank-sum test (Mann–Whitney U-test), Kruskal–Wallis test, chi-square, t-test, G-test, and descriptivestatistics (Appendix 1). Common parametric tests include ANOVA, ANOSIM, regression analysis,MDS ordinations and contingency analysis. Researchers should have a clear understanding of themethod of analysis and obtain biometric advice prior to commencing sampling.
Length frequency data is generally analysed using the Kolmogorov–Smirnov test (refer to the casestudy below), while relative abundance data is generally analysed by ANOVA, MDS ordination anddescriptive statistics (Appendix 1). However, this information does not preclude the researchers fromusing a different method or a more advanced technique.

20 Monitoring the performance of fishways and fish passage works
Case Study: Kolmogorov-Smirnov test
Generally, researchers use a Kolmogorov–Smirnov (KS) test to determine if the length frequencydistributions of two samples are the same. For analyses involving fishways, this test typicallycompares lengths of fish captured at the entrance (or downstream) and exit (or upstream). Asignificantly different KS test indicates that the distributions are different, and may indicate aproblem within the fishway (e.g. a blockage) or that the fishway design is inappropriate.
To interpret this data correctly, a histogram is typically plotted. Percentage frequency is best usedover frequency alone because the KS test adjusts each treatment for the total number of samples,and so the results are easier to interpret, i.e. differences can be readily identified. Descriptivestatistics such as mean, minimum, maximum, standard deviation, mode and median are alsohelpful for documenting differences between the samples.
The following example concerns galaxiids, for which length data was collected from upstream anddownstream of a rock-ramp fishway. The raw data is provided in Table 3.1 and plotted in Figure3.13a. A KS test of this data indicated that the samples were the same; that is, there is nodifference in the size-class of fish located upstream and downstream of the fishway. For thepurposes of this demonstration, the data was also analysed with fish smaller than 70 mm excludedfrom the upstream sample, which produced a significant KS result (Figure 3.13b). This resultwarrants further investigation to determine the cause of the difference. Descriptive statistics canalso be used to demonstrate a difference in mean, minimum, standard deviation and median forthe two examples (Table 3.1).
Table 3.1: Summary data of fish lengths collected upstream and downstream of a rock-ramp fishway.
Sample collectedfrom
No. Mean Min. Max. SD Mode Median
All length data Downstream offishway
492 88.4 46 159 19.3 78 84
All length data Upstream of fishway 511 88.7 53 180 20.1 80 85
Length data> 70 mm**
Upstream of fishway 455 91.9 70 180 19 80 87
** denotes KS test significance

Monitoring the performance of fishways and fish passage works 21
Figure 3.13: (a) Kolmogorov–Smirnov (KS) test results for a fish species upstream (red) anddownstream (black) of a rock-ramp fishway. (b) KS test results with a subset of small fish(< 70 mm long) excluded from the analysis to demonstrate a significant result. Arrowindicates the area that contributed to the significant KS difference.
Length (mm)
0 20 40 60 80 100 120 140 160 180 2000
2
4
6
8
10
12
14
16
18
% F
requ
ency
0
2
4
6
8
10
12
14
16
18
KS test statistic = 0.043n=1003
P=0.740
Fish <70mm omitted from U/S sample
KS test statistic = 0.130n=947
P=0.001
a)
b)

22 Monitoring the performance of fishways and fish passage works
3.4.1 Hydraulics assessmentFishway hydraulics
The construction of a fishway is equally as important as the design, and checking the constructedfishway against design specifications is one of the first steps in assessing a fishway to determine itsfunctional success.
After the fishway is completed, a number of measurements should be made with the fishway filledwith water but before it is put into operation. This is known as wet commissioning. During wetcommissioning the hydraulic conditions outlined during the detailed design phase should bemeasured against what has been constructed. Common parameters include headloss, slope, length,width, water depth, slot widths, and entrance location relative to the upstream migration limit such asa weir wall. For example, if a vertical-slot fishway is designed to have 100 mm of head differencebetween each of the fishway pools, then this should be confirmed during the wet commissioning.Similarly, slot width and other parameters should also be measured against design specifications. A5% tolerance overall (from entrance to exit) of actual versus constructed slot width is generallyacceptable. Water velocity may also be measured, but obtaining consistent and relevant readingscan be difficult, particularly in rock-ramp or fish bypasses where natural rocks of different shapes andsizes are used and hydraulic roughness is present.
For rock-ramp and bypass fishways where concrete is generally not used, the commissioning processmay allow a tolerance greater than 5% because of the unpredictable or imprecise nature of rockplacement and earthworks compared with concrete. However, basic measurements such asheadloss, water depth and slope should meet design specifications with the agreed level of tolerance.Following wet commissioning, an assessment of the operational fishway can commence.
For existing fishways, managers of instream structures and researchers may not have access to thedesign specification against which the fishway can be assessed. When this occurs, researchers andmanagers should determine the fish species present within the waterway, and develop objectives forthe fishway. Once this has been established, hydraulic monitoring can be assessed relative to knownhydraulic requirements for the target species.
Rock-ramp and bypass fishways in particular are prone to movements in the crest rocks, the toe rocksand occasionally the foundations. Monitoring the location of each of the rock ridges, in addition to thecrest, should be undertaken on a regular basis (O'Connor et al. 2015b) and after major flow events.
In addition, effective attraction flows are a common oversight when fishways are constructed at weirs.A hydraulically correct fishway may not work efficiently if fishway attraction flows are not aligned withthe fishway entrance. Flows over a weir for example, can easily overpower fishway attraction flowsbecause they are generally orders of magnitude larger than a fishway out-flow, and fish are generallyattracted to the largest flow. Therefore operation of the weir must consider the effect on fishwayattraction flows, especially during key migratory periods.Contemporary fishway design guidelines
The guidelines for the design, approval and construction of fishways (O'Connor et al. 2017) set outthe contemporary design knowledge for successful fishway design and construction. The essence ofthe document is summarised in the table below and includes attributes that are important forsuccessful fishway design, including fishway depth, pool volumes, slot widths, turbulence, watervelocities, slope and headloss (Table 1). We use the attributes outlined in this table as a foundationfor a hydraulics assessment and fish assessment scoring (refer to section 4.3).

Monitoring the performance of fishways and fish passage works 23
Table 3.2: Contemporary guidelines for the design and construction of fishways (O’Connor et al. 2017).
Vertical-slot fishway
FishLength(mm)
Targetdepth
(m)
Minimum poolvolume (L)
Min.slot
width(mm)
TargetTurbulence(W/m3) (Cd
=0.7)a
Max. slotwater
velocity(m/s)b
Slope
Pool topool
headloss(mm)
Minimumheadloss @
entrance(mm)a
Maximumwater
velocity atfishway exit
channel(m/s)
Entrance and exitflow vectors (deg.
from streamcentreline)
Headlossat trash
racks(mm)
Minimum plungepool depth of weir
for downstreammigrantsc
Weir style fordownstream
migrants
Location of entrance and exitrespectivelyd
20–99 > 0.5 825 (1.5 × 1.1 m) 100 < 25 < 1.20 > 1:30 < 75 45 0.05 < 90°, no recirculation < 20 40% of MHD Overshot U/S or D/S migration limit100–199 > 0.75 2800 (2.5 × 1.5 m) 150 < 30 < 1.40 > 1:30 < 100 60 0.15 < 90°, no recirculation < 20 40% of MHD Overshot U/S or D/S migration limit200–699 > 1.0 5000 (2.5 × 2 m) 250 < 50 < 1.6 > 1:25 < 120 72 0.3 < 90°, no recirculation < 20 40% of MHD Overshot U/S or D/S migration limit
700+ > 1.5 10500 (3.5 × 2 m) 350 < 50 < 1.8 > 1:20 < 165 100 0.3 < 90°, no recirculation < 20 50% of MHD Overshot U/S or D/S migration limit
Rock-ramp fishwayFish
Length(mm)
Targetdepth
(m)
Minimum poolvolume (litres)
Minslot
width(mm)
Targetturbulence
(W/m3)(Cd of0.7)*
Maximum slotwater velocity(ms–1) @ vena
contracta
Slope
Pool topool
Headloss(mm)
Minimumheadloss @
entrance(mm)*
Maximumwater
velocity @fishway exit
(ms–1)
Entrance and exitflow vectors(degree from
stream centreline)
Lateralridge
slope (Sitespecific
decision)
Minimum plungepool depth of weir
for downstreammigrants (partial
width)
Weir style fordownstream
migrants(partial width)
Location of entrance
20–99 > 0.3 1500 (2.5 × 2 m) 100 < 25 <1.20 > 1 : 30 < 75 45 0.05 < 90°, no recirculation > 1 : 6 40% of MHD Overshot U/S or D/S migrationlimit U/S migration limit
100–199 > 0.5 2500 (2.5 × 2 m) 150 < 30 <1.4 > 1 : 30 < 100 60 0.15 < 90°, no recirculation > 1 : 6 40% of MHD Overshot U/S or D/S migrationlimit U/S migration limit
200–699 > 0.6 6000 (4.5 × 2 m) 250 < 50 <1.6 > 1 : 25 < 120 72 0.3 < 90°, no recirculation > 1 : 6 40% of MHD Overshot U/S or D/S migrationlimit U/S migration limit
700+ > 1.0 10000 (4 × 2.5 m) 350 < 50 <1.8 > 1 : 20 < 120 90 0.3 < 90°, no recirculation > 1 : 6 50% of MHD Overshot U/S or D/S migrationlimit U/S migration limit
Notes:a over operational flow rangeb measured at vena contractac MHD = maximum head differentiald U/S = upstream, D/S = downstream

24 Monitoring the performance of fishways and fish passage works
The following fishway assessment methods were developed from a review of the literature combinedwith unpublished data on best practice for fishway assessments. The objective of these methods is toprovide waterway managers and fisheries researchers with a consistent approach to assessing theeffectiveness of Victorian fishways. Understanding the role of fishway assessment and the adaptivemanagement feedback from research will inevitably lead to improvements in the design andunderstanding of fishways, and improvements in Victoria’s waterways for instream biota.
As each fishway is unique, the following methods should be used as a guide rather than step-by-stepinstructions on how to assess all fishways. Fishway types have been grouped according to similarityand assessment methods used: vertical-slot fishway with Denil fishway, fish lock with fish lift, androck-ramp fishway with fish bypass.
Fishway assessment methods have been divided into hydraulic and ecological assessments, withecological assessments divided into an abundance/length-frequency method, and apresence/absence, length-frequency method (Figure 4.1). Two options for ecological assessmentshave been provided to give greater flexibility to waterway managers when undertaking assessments.The presence/absence, length-frequency method is targeted towards short-term assessments wherelarge numbers of fish are present. The hydraulic assessment method is similar regardless of the typeof fishway, and is intended to cover most of the measurable hydraulic components of a fishway.
Ecological and hydraulic assessments have an assessment scoring table, which is designed to beused as a method to assess the constructed fishway against the designed fishway. Any significantdeviation from design should become evident, and a course of action to rectify issues can then beimplemented. This is intended to indicate a general rather than definitive course of action. Alloutcomes should be referred to a fishway expert to determine the degree of deviation and acceptablelimits.
The structure of the assessment and scoring methods is shown in Figure 4.1. This flow diagram isdivided into two categories for ease of interpretation: assessment structure, and assessment scoring.Each category of the structure is explained below, and each of the proposed fishway assessmentmethods is described in the text and accompanying tables. The tables, designed to be read from leftto right, are designed to provide the necessary information to undertake a successful fishwayassessment. Definitions of the fishway measurements are shown in Table 4.1.
The proposed fishway evaluation methods were tested on two coastal fishways: the Barham Riverrock-ramp fishway and the Barwon River vertical-sot fishway (Appendix 2). The outcomes of theecological and hydraulic assessment complemented each other. Specifically, a number of hydraulicanomalies were identified by the methods, and the influence of these anomalies contributed towardsthe ecological performance and outcomes.
4.1 Ecological assessment description4.1.1 Abundance (presence/absence), length-frequency methodThe abundance, length-frequency method can be undertaken using a number of methods, includingelectrofishing, trapping or mark-recapture. This method of assessment is intended to provideresearchers with a replicated design that is suitable for both parametric and non-parametric statisticaltests. Because migration of fish is highly variable, migration through the fishway will also be highlyvariable, and it will alter with season, life-history stage, and diel movement behaviour. For example,some fish such as galaxiids move during the day, while others such as lampreys move during thenight. Therefore the number of replicates must be maximised to account for the variations inmovement timing (including season), and a minimum of 12 replicates has been suggested to accountfor such variation, although the literature suggests that the number of replicates can be substantiallyhigher (Appendix 1). Moreover, the timing of these replicates should be targeted towards smaller fishthat move early in the migratory season.
4 Proposed generic fishway evaluationmethods

Monitoring the performance of fishways and fish passage works 25
When assessing fishways, a minimum amount of time between collecting fish from the entrance andthe exit is also suggested to account for the time taken for fish to ascend the fishway, as this will varyaccording to the fish species present, fishway length and number of baffles, and percentage of thewaterway to be sampled; this was generally not mentioned in the reviewed literature, but it may havebeen completed in practice. In the guidelines presented here it is assumed that small fish and longfishways mean additional time for fish to ascend, but if only part of the fishway (i.e. full-width rock-ramp) is sampled then less time is required because fish can continue to ascend even duringsampling. Some investigations have randomised the entrance and exit samples as a way of dealingwith this issue. However, this only solves part of the bias problem, as sampling the exit during theearly morning may not allow enough time for diurnal fish to ascend and become trapped.
The sample duration has not been defined, although the literature suggests that 24 hours is common(Appendix 1). The sample duration typically may be refined through a pilot investigation. Sampleduration may also need to take into account variation in behaviour and catchability of the targetspecies, and the abundances encountered. Traps should be checked at least once for a 24 hoursample, to ensure the removal of fish and trash accumulated on the trap, and all individuals should beidentified to species level for each sample. Preservation of voucher specimens should be consideredfor small species such as galaxiids, which are often difficult to identify in the juvenile phase.All individuals collected during each treatment should be counted, and if possible a minimum of 100individuals of each species should be measured per replicate. This will allow an appropriatecomparison to be made between the length of fish at the fishway entrance and the length of fish at theexit. The total number of fish measured during each treatment (entrance and exit) should be morethan 300 to allow a Kolmogorov–Smirnov test to be completed. If possible the entrance samplesshould include more than 150 individuals of each species at or smaller than the minimum sizeobjective for the fishway; the timing of the assessment should coincide with the movement of smallindividuals of the target species. Similarly, for mark–recapture a minimum of 300 individuals ofvarious size classes should be tagged to obtain a representative sample. Species that occur in lowabundances (e.g. threatened species) can be assessed separately, using whatever data wascollected.
Importantly, assessments must be based on sampling undertaken when the fishway is operatingwithin the design specifications. For example, a fishway operating outside its specifications (e.g.during a flood) may be inefficient, so the data collected might not be representative. Refer toAppendix 2 for testing and application of these methods.
4.1.2 Presence/absence, length-frequency methodThe presence/absence, length-frequency method can be undertaken using a number of methods,including electrofishing, electrofishing and trapping, or trapping alone. This method does not requirea replicated design because the analysis compares the presence of species at both the entrance andexit, and via the length-frequency distributions. The presence-absence method, however, relies on allfish being collected downstream (i.e. entrance or river), being present at the exit, with the absence ofone common species or more an indication that there may be a problem with the fishway design,operation, or performance.
The sample duration for this method is not predetermined and, like the abundance method, a pilotinvestigation is suggested to determine the duration for the highest catch rates and greatest speciesrepresentation.
The minimum sample period for entrance/exit trapping is irrelevant for the presence/absence method,as the aim is to ensure that all species are present and that there is no difference between the length-frequency distribution between entrance and exit for target species and size classes. Species life-history must be considered when assessing the fishway against design objectives, because some fishmay only be active during daylight hours, at dawn or dusk, or at night, in addition to seasonalmovement behaviour.
The effect of electrofishing on the health of the fish also needs to be considered, and a minimumwaiting period of six hours between electrofishing shots has been suggested (with an additional30 minutes for every five fishway baffles), and different areas of the river can be targeted to minimiseany impact. Entrance samples are standardised to five minutes of electrofishing power-on time.

26 Monitoring the performance of fishways and fish passage works
Unlike the abundance method, if suitable fish numbers are collected to gain a representative sample(more than 300 individuals of each target species) at all sites (i.e. entrance/exit orupstream/downstream), then the sampling can be completed. This may occur quickly, or samplingmay need to continue over an extended period. Importantly, the entrance sample must include morethan 150 individuals of each species at or smaller than the minimum size objective for the fishway toensure that the fishway’s operating limit is tested. The timing of the assessment should coincide withthe movement of small size classes of target species. Refer to Appendix 2 for testing and applicationof these methods.
4.2 Hydraulic assessment descriptionThe hydraulic assessment method can be applied to all fishway types (Table 4.2). It is intended tocover all of the measurable hydraulic components of a fishway, including slope, fishway dimensions,headloss, slot width, upstream migration limit, and debris loads. These are defined in Table 4.2. Anydeviation from the proposed fishway design is to be recorded as a percentage departure, withsignificant departures being highlighted for further investigation (refer to Appendix 2). Importantly, thismonitoring document assumes that all fishways, but particularly mechanical fishways (fish lock andlifts), have undergone a thorough dry and wet commissioning process and have had the fishwayattraction flows and lock cycles refined. The fishway commissioning process is outlined in the bestpractice guidelines for design, approval and construction (O’Connor et al. 2017).
4.3 Fishway assessment scoring descriptionThe fishway assessment scoring is divided into two categories: ecological assessments and hydraulicassessments (Table 4.3). The assessment scoring summarises the results and conclusions of thefishway assessment.
The ecological assessment scoring is designed to ensure that:• the fishway is suitable for the species present• target species are present at the entrance and exit• the timing of the assessment coincides with the movement of small size classes of target species• there is no difference in length-frequency at the entrance and exit.Relative fish abundance has also been included, but the abundance results should be interpreted withcaution because abundances are typically influenced by a range of factors, including season, flow,water temperature and time of day. A replicated sampling design is required to interpret relativeabundance data with sufficient certainty.
The hydraulic assessment ensures that the fishway meets the design specifications, or is inaccordance with the new guidelines for design, approval and construction of fishways (O’Connor et al.2017). That is, the fishway parameters, including water depth, pool volume, slot width, water velocity,slope, headloss and auxiliary water accurately reflect the design. The upstream migration limit (i.e.the farthest upstream that a fish can move relative to the instream barrier) is also included to ensurethat the fishway entrance is in a suitable position (i.e. within 0.5 m) at all stream discharges. Commontools used to obtain hydraulic information from fishways include tape measures (8 m and 30 m), depthpole, laser level, rangefinder and water velocity meter.
It has been suggested that the researcher or manager should consult a fishway expert to rectify anyissues identified. Discussions may also involve the designer of the structure if they are known.Obtaining the original design drawings or design brief is the first step in rectifying fishwayperformance issues, but if this is not available then the outcomes should be compared withcontemporary designs (O'Connor et al. 2017). Refer to Appendix 2 for the application of theassessment scoring.

Monitoring the performance of fishways and fish passage works 27
Figure 4.1: Structure of the fishway assessment and scoring methods.

28 Monitoring the performance of fishways and fish passage works
Table 4.1: Fishway assessment parameters with definitions.Fi
shw
ay M
easu
rem
ents
Ecological Assessment ExplanationSample Location Area to be sampled.Trap type Method of sampling to be used, may include fishway traps, funnel and screens, nets, or electrofishing. When electrofishing, a minimum waitingperiod of 6 hours between electrofishing shots should be adopted to minimise damage to fish. Electrofishing at the fishway entrance may be usedas an alternative to trapping the fishway entrance when traps and funnels/screens are not practical.Minimum waiting period Length of time required to avoid negative sampling bias between sample locations i.e. entrance or exit. Sampling bias may occur if sampling theentrance and then the exit, as fish need time to ascend the fishway before reaching the exit. Therefore, an appropriate length of time must be givento allow fish to ascend before beginning the sample. For vertical-slot and Denil fishways, the length of time will vary with fish size and number offishway baffles, while, for rock-ramp and fish bypasses, the length of time will vary with fishway size and % of waterway to be sampled.Fishway size The number of baffles within a fishway.Sample duration Time taken to collect a representative sample – a pilot investigation may need to be completed prior to the experiment.Minimum number of replicates (ent/exit) Recommended minimum number of replicates required to obtain a statistically viable sampleTraps checks/replicate Number of times the trap may be checked per replicateSpecies ID/replicate Number of species that should be identified per replicateNumber of individuals measured/rep/sp Number of individuals (per species) that should be measured for each replicateMinimum number measured/sp (in total) Minimum number of individuals to be measured per species for the entire experimentSize-ranges Number of fish required at the minimum design range of the fishway to obtain a representative sample.Sub-sample Sub-sampling is required to shorten fish processing time when large numbers of fish are captured. A minimum of 5 tubs of fish are used to obtaina sub-sample. This involves counting the total number of tubs taken to account for all fish, then identifying and counting how many fish of eachspecies are present in 5 tubs. This will allow the researcher to extrapolate how many fish of each species were present in the total sample.Seasonality Seasonal sampling may be required to capture all target species.Assessment timing The fishway assessment must be conducted when stream discharge is within the target discharge for the fishway.Hydraulics AssessmentTarget depth (m) Water depth of each fishway pool and at the slotMinimum pool volume Volume of the pool based on minimum target depths (L x W x H)Minimum slot width Width of the slot at all baffles.Maximum water velocity at vena contracta Maximum water velocity at the vena contracta (i.e. jet of water at the slot)Slope Slope of the fishway between entrance and exit.Headloss Difference in water height between fishway pools.Minimum headloss at fishway entrance Difference between the river height (at entrance) and first poolMaximum water velocity at fishway exit Maximum water velocity at the exitHeadloss at trash racks Maximum headloss at the fishway trash racksEntrance and exit flow vectors Angle/direction of flow at the entrance and exitEntrance/exit location Location of the entrance/exit at the upstream migration limitDebris Amount of matter (or %) blocking normal fishway operation.Fishway auxiliary water Additional water supplied to maintain design headloss within poolsMinimum plunge pool depth Minimum depth of the weir/barrier plunge pool.Lock/lift cycle time Length of time it takes the lock to complete all phases of the cycle i.e. attraction, filling, exiting, transition.Lock/lift entrance attraction flows Maximum water velocity during attraction phaseLock/lift chamber/hopper conditions Turbulence conditions within the lock/lift chamber/hopper

Monitoring the performance of fishways and fish passage works 29
Table 4.2: Hydraulics assessment.
Hydraulics AssessmentVertical-slot, Denil, Rock-ramp, fish bypass fishwayTarget depth Measure water depth in all pools and baffles, record % difference from contemporary designMinimum pool volume Measure the length and width and multiply by pool depth, record % difference from contemporary designMinimum slot width Measure slot-width at all fishway baffles, record % difference from contemporary designMaximum water velocity @ vena contracts Measure the water velocity at the vena contracta, record % difference from contemporary designSlope Measure slope of fishway at regular intervals, record % difference from contemporary designHeadloss Measure headloss between all pools (plot level), record % difference from contemporary designMinimum headloss at fishway entrance Measure headloss at entrance over a range of operational tail water levels, record % difference from contemporarydesign**Maximum water velocity at fishway exit channel Measure water velocity in the fishway exit channel, record % difference from contemporary design**Headloss at trash racks Measure headloss at trash racks, record % difference from contemporary design**Entrance and exit flow vectors Draw flow vectors on map of fishway/river, record % difference from contemporary design**Entrance /exit location Is the entrance/exit location at the upstream/downstream migration limit (<0.5 m), record % difference fromcontemporary design**Debris Estimate % of fishway covered in debris**Fishway auxiliary water (if present) Does it cause excessive turbulence or adverse flow patterns (Yes or No) at the discharge point**Minimum plunge pool depth Measure weir/barrier headloss, record % difference from contemporary design
Fish Lock or Fish Lift (in addition to ** above)Post-construction commissioning by construction contractors Check that the commissioning process is complete (if not, refer to O’Connor 2017 for guidance).Lock/lift cycle time Reflects design phase operation for the current conditionsLock/lift entrance attraction flows Measure water velocity during entrance attraction phase, record % difference from contemporary design.Lock/lift chamber/hopper conditions Is turbulence excessive during filling or draining phase

30 Monitoring the performance of fishways and fish passage works
Table 4.3: Assessment scoring all fishway types (Note, not all categories are relevant to all fishway types).
Acceptable %deviation fromcontemporarydesign
Measureddeviation%
% deviationfromcontemporarydesign
Course of actionwhen non-conforming
Ecological AssessmentFishway type is suitable for species present Yes or No Seek expert adviceFishway hydraulics are suitable for fish species and reflect contemporary deign Yes or No Seek expert adviceTarget species are present at both fishway entrance and exit Seek expert adviceSize range of target fish species is at minimum target size at the fishway <2 Seek expert adviceTarget size ranges are present at the entrance and exit of fishway <2 Seek expert adviceAbundance Entrance vs exit abundance <30 Seek expert adviceEntrance and exit location are at migration limit Yes or No Seek expert adviceHydraulic AssessmentTarget Depth 5 Seek expert adviceMinimum pool volume 2 (5) Seek expert adviceMinimum slot width 2 (5) Seek expert adviceMaximum water velocity at the vena contracta Seek expert adviceSlope 2 (5) Seek expert adviceHeadloss 2 (5) Seek expert adviceMinimum headloss at fishway entrance 5 Seek expert adviceMaximum water velocity at fishway exit channel 10 Seek expert adviceHeadloss at trash racks 0 Seek expert adviceEntrance and exit flow vectors 0 Seek expert adviceEntrance/exit location 10 Seek expert adviceDebris % presence within fishway 5 Seek expert adviceFishway auxiliary water (if present) causes excessive turbulence Yes or No Seek expert adviceMinimum plunge pool depth suitable Yes or No Seek expert adviceLock/lift cycle time (reflects design) Yes or No Seek expert adviceLock/lift entrance attraction flows suitable Yes or No Seek expert adviceLock/lift chamber/hopper turbulence excessive Yes or No Seek expert advice
Comments77 Warrants further investigation – differences in abundance may be related to seasonal influences and/or sample sizes. Relates to trapping and funnel/screen methods only (i.e. excludes electrofishing).() = greater tolerance allowed for rock-ramps and bypass fishways.

Monitoring the performance of fishways and fish passage works 31
4.4 Using the proposed evaluation methodsThe assessment methods have been formatted into tables to aid interpretation of the methodparameters (Tables 4.5–4.9). Each table contains a unique set of assessment methods applicable toeach fishway group, and separated into abundance (presence-absence)/length-frequency, andpresence-absence/length-frequency method. Application of these methods are also documented inAppendix 2.
All fishway assessments should be completed during the target species migration period, andseasonal sampling may be required to obtain all migratory species. Similarly, assessments must becompleted when the fishway is operating within its operational range (i.e. not flooding), and at anappropriate time of the day for the target species.
An important division in evaluation methods can also be made between coastal and inland systems,as coastal species are often diadromous, motivated to move upstream, and an assumption that smallsize-classes found upstream of fishways during spring are likely to have recently migrated through thefishway. However, for inland fishways and species which are often found, and breed, either side of aninstream barrier, no assumptions can be made about passage through a fishway. For this reason,electrofishing upstream and downstream of an inland fishway has been omitted from the collectionmethod (Table 4.4). However, in certain circumstances, such as an inland riverine system beingdepleted/depauperate of target species or size-classes, then electrofishing may be appropriate,however it should be treated on a case by case basis.
4.4.1 Vertical-slot and Denil fishwaysTwo different evaluation methods are proposed to assess vertical-slot and Denil fishways, entranceand exit trapping only, and exit trapping and entrance electrofishing. Exit trapping has been chosenfor both evaluation methods, as exit trapping is the most effective method of collecting fish as theypass through a fishway (i.e. restricted area). Obtaining an entrance sample can either be completedby trapping the fishway entrance to collect fish as they enter, or by electrofishing immediatelydownstream of the fishway entrance. Entrance samples for both evaluation methods need to obtain arepresentative sample of the species and size-ranges, and sampling the stream immediatelydownstream of the fishway should obtain this. However, trapping the fishway entrance for arepresentative sample must include a reduction in the headloss, velocity and turbulence at theentrance baffle, and this can be achieved by partially shutting the fishway exit gate. By doing this,smaller fish size-classes can enter the entrance trap without being subject to excessive hydraulicconditions.Abundance (presence-absence)/length-frequency
The abundance/length-frequency method of assessment may be completed using traps or funnelsand screens (Table 4.5). No minimum waiting period is required if sampling the exit then entrance,however when sampling the exit after the entrance, a minimum waiting period is required. Thisminimum waiting period depends upon number of baffles (and so fishway length), and the targetspecies.
The sample duration may be determined during a pilot investigation which should aim to capture asmany fish as possible and complete as many replicates as possible. A minimum of 12 replicates issuggested and 100 individuals of each species to be measured/identified for each replicate. If limitednumbers of fish are present, it is recommended that a minimum number of 300 fish at each treatment(i.e. upstream/downstream) be collected for analysis. If large numbers are encountered, then sub-sampling may be completed.Presence-absence/length-frequency
The presence-absence/length-frequency method may be completed using trapping (including funnelsand screens) at the entrance and exit, or by electrofishing the entrance and trapping the exit (Table4.5). This procedure is similar to the abundance method, but without the replication. Instead,sampling is repeated until 100% of the target species are obtain at the entrance and the numberstabilised at the exit, and at least 300 individuals per species are obtained (at each treatment i.e.entrance/exit) for length analysis. Further, 150 individuals representative of the minimum sizeobjective of the fishway should be collected—the timing of the assessment should therefore, coincidewith the movement of small size-classes of target species. If electrofishing at the entrance, then five

32 Monitoring the performance of fishways and fish passage works
minutes of electrofishing time on with six hours of rest between each sampling event is suggested toallow fish to recover.
Table 4.4: Collection and ecological assessment methods for coastal and inland fishwaygroups.
Coastal Collection Methods Ecological Assessment Method
Vertical-slot/Denil
Entrance and Exit trapping Abundance (Presence/Absence), Length-Frequency
Electrofish immediatelydownstream and upstream
*Abundance (Presence/Absence), Length-Frequency
Electrofish immediatelydownstream and trap exit
Presence/Absence, Length-Frequency
Rock-ramp/bypass
Trap immediately downstream ofentrance and immediatelyupstream of exit
Abundance (Presence/Absence), Length-Frequency
Electrofish immediatelydownstream and upstream
*Abundance (Presence/Absence), Length-Frequency
Electrofish immediatelydownstream and trap immediatelyupstream
Presence/Absence, Length-Frequency
Fish Lock/lift Entrance and Exit trapping Abundance (Presence/Absence), Length-Frequency
Electrofish immediatelydownstream and upstream
*Abundance (Presence/Absence), Length-Frequency
Electrofish immediatelydownstream and trap exit
Presence/Absence, Length-Frequency
Inland Collection Methods Ecological Assessment Method
Vertical-slot/Denil
Entrance and Exit trapping Abundance (Presence/Absence), Length-Frequency
Electrofish immediatelydownstream and trap exit
Presence/Absence, Length-Frequency
Rock-ramp/bypass
Trap immediately downstream ofentrance and immediatelyupstream of exit
Abundance (Presence/Absence), Length-Frequency
Electrofish immediatelydownstream and trap immediatelyupstream
Presence/Absence, Length-Frequency
Fish Lock/lift Entrance and Exit trapping Abundance (Presence/Absence), Length-Frequency
Electrofish immediatelydownstream and trap exit
Presence/Absence, Length-Frequency*Electrofishing efficiency (and water depth) should be similar either side of the fishway structure—the upstream sample may needto be positioned outside the weir pool

Monitoring the performance of fishways and fish passage works 33
Table 4.5: Assessment method for a vertical-slot or Denil (/pool) type fishway (trapping exit and entrance only, or trapping exit and electrofishingat entrance).
Ecological AssessmentAbundance (presence–absence)/length–frequencySample location Entrance and exitTrap type Trap or funnel/screen
Minimum waiting period (hrs) Sample the exit, then the entrance nilSample the entrance, then the exit (varies with fishway size and target species) Small-bodiedfishway Large-bodied fishwayFishway Size (based on number of baffles within fishway) Less than 10 1–2 (hr) 30 min10–20 2–5 (hr) 1–2 (hr)20–30 5–7 (hr) 2–5 (hr)30–40 7–10 (h) 5–7 (h)40–60 10–24 (h) 7–10 (h)Sample duration (hrs) 1–24Min. no. replicates (entrance/exit) 12Trap checks/set ≤2Species ID/rep 100%No. target individuals measured/rep/sp 100Minimum number to be measured/sp (in total) entrance > 300, exit > 300 if possibleSub-sample (If >5 tub present) YSeasonality YAssessment timing YPresence–absence/length–frequency methodSample location Entrance ExitTrap type Trap, funnel/screen, electrofishing Trap, funnel/screenSample duration 1–24 h (trap) (5 min electrofishing time on) 1–24 hMinimum waiting period between trap locations 0 0Min. no. sets (ent/exit) Repeat until 100% of target species are present Repeat until the number of species presentstabilisesTrap checks/set <2 (for 24 h set) <2 (for 24 h set)Species ID/set 100% 100%No. Individuals measured/sp >300 if possible >300 if possibleSize-ranges Must include >150 individuals/sp at or smaller than the minimum size objective for thefishway Measure all fish sampled (up to 1000/sp)Sub-sample If >5 tubs present If >5 tubs presentSeasonality Y YAssessment timing Y Y
34 Monitoring the performance of fishways and fish passage works
4.4.2 Rock ramp and bypass fishwayRock-ramp and bypass fishway designs are highly variable and may include a high degree of bottomroughness from rocks, and are often have rapid moving water, making sampling challenging.Therefore, four different evaluation methods have been proposed to provide greater assessmentflexibility, including; entrance and exit trapping; exit trapping and entrance electrofishing;electrofishing only; and mark-recapture (Tables 4.6–4.8).Abundance (presence-absence)/length-frequency
For entrance and exit trapping, the sample duration, minimum number of replicates, number ofindividuals required and measured is the same as the abundance-length frequency method ofassessing a vertical-slot/Denil fishway. However, a rock-ramp or bypass fishway can be sampled withvariable levels of trap coverage, reflecting the nature of the structure — full or partial width. Further,no minimum waiting period has been proposed between entrance/exit samples when less than 30%of the fishway/bypass movement pathway is sampled with a trap, however if the trap covers 80-100%of the fishway movement pathway, then minimum waiting periods between samples is being proposedto allow fish to move from the entrance to the exit prior to sampling (Table 4.6).
Assessing a rock-ramp and bypass fishway via electrofishing can be achieved by dividing samplinginto reaches such as downstream of entrance, at entrance, middle of fishway and exit — thisincreases the resolution of the assessment. The minimum number of replicates, number ofindividuals required and measured, is the same as the abundance-length frequency method ofassessing a vertical-slot/Denil fishway, however this method of collection uses electrofishing seconds(300) as a replicate (Table 4.7). A minimum waiting period of six hours between electrofishingreplicates, plus 30 min for every five ridges/baffles (i.e. a five-ridge rock-ramp minimum waiting periodis 6.5 hours, a 10 baffle–7 hours, a 20 baffle–8 hours etc.) is suggested to maintain fish health, and toallow fish to continue to move through the fishway.
Mark-recapture may be used to assess the performance of rock-ramp and bypass fishways, provideda representative sample of fish species and size-classes can be obtained and marked, it may also beused as supplementary data for other fishways types (Table 4.8). In this method, fish are caughtdownstream of the fishway using any gear type, but are either released at their capture site, or maybe translocated much closer to the fishway entrance, however, this must be controlled for in thedesign. A range of marking methods can be applied including external dart tagging, fin clipping,chemical marking, implanting coded or PIT tags, and radio/acoustic tagging.
The exit of the fishway is trapped to collect marked fish and a minimum of 1000 fish/sp (if possible) isrecommended for this assessment, given that the exit is to be trapped (monitored) continuously overa short time period (i.e. 7–10 days). Fewer numbers of fish are able to be marked, but they should betrapped (monitored) over a longer duration to increase the return rate. Monitoring a fishway usingradio/acoustic tagging should require fewer individuals to be marked, as fish passage behaviour(including fishway attraction) can be taken into account.Presence-absence/Length-frequency
Entrance and exit trapping, or exit trapping and entrance electrofishing may be used to assess rock-ramp fishways and bypass fishways for the presence-absence/length-frequency method (Table 4.6).Sample duration for trapping may be determined during a pilot investigation. If electrofishing, fiveminutes of electrofishing time on is suggested for the entrance with six hours rest between shots tomaintain fish health. Electrofishing and trapping may be repeated until 100% of target species ispresent at the entrance and the species number stabilises at the exit. Details on individual speciescollected remain the same as the vertical-slot/Denil presence-absence/Length-Frequency method,and a minimum of 300 individuals per species to be collected at the entrance and exit, and at least150 individuals per species collected at or smaller than the minimum size objective for the fishway—the timing of the assessment should therefore, coincide with the movement of small size-classes oftarget species.
Electrofishing only may also be used as a method of collecting data for rock-ramp and bypass fishway(Table 4.7). The presence-absence method of collection is the same as the abundance-lengthfrequency method, however electrofishing downstream of the fishway must continue until all targetspecies are present in the sample, and electrofishing through the fishway and upstream shouldcontinue until the number of species stabilises. The details on individual fish collected remain similar

Monitoring the performance of fishways and fish passage works 35
to other assessment methods, with a minimum of 300 individuals per species to be collected at theentrance and exit, and at least 150 individuals per species collected at or smaller than the minimumsize objective for the fishway—this will be influenced by the timing of the assessment.

36 Monitoring the performance of fishways and fish passage works
Table 4.6: Assessment method for a rock-ramp and bypass fishway (trapping exit and entrance, or trapping the exit and electrofishing the entrance).
Ecological AssessmentAbundance (presence–absence)/length–frequencySample location Entrance and exitTrap type Trap (trap or nets)Minimum waiting period (hrs) Sample exit, then entrance nilSample entrance, then exit <30% of waterway sampled withtrap 80–100% of waterway sampled with trap (hr)Fishway Size (based on number of baffles withinfishway) No. ridges (baffles) 1–3@ nil 30 min4–6@ nil 1–2 (hr)7–9@ nil 2–5 (hr)10–13@ nil 5–7 (hr)13+@ nil 7–10 (hr)Sample duration (hrs) 1–24Min. no. replicates (ent/exit) 12Trap checks/rep ≤2Species ID/rep 100%No. target individuals measured/rep/sp 100Minimum number to be measured/sp (in total) Entrance > 300, Exit > 300 if possibleSub-sample (If >5 tub present) YSeasonality YAssessment timing Y
Presence–absence/length–frequency methodSample location Entrance ExitTrap type Trap, electrofishing TrapSample duration 1–24 hours (trap) (5 min electrofishing 1–24 hoursMinimum waiting period between trap locations nil nilMin. no. sets (ent/exit) Repeat until 100% of target species are present Repeat until the number of species present stabilisesTrap checks/set <2 (for 24 hour set) <2 (for 24 hour set)Species ID/set 100% 100%No. Individuals measured/sp >300 if possible >300 if possibleSize-ranges Must include >150 individuals/sp at or smaller than the minimum size objective for thefishway Measure all fish sampled (up to 1000/sp)Sub-sample If >5 tubs present If >5 tubs presentSeasonality Y YAssessment timing Y Y@ Times are based on a fish bypasses less than 150 m long.

Monitoring the performance of fishways and fish passage works 37
Table 4.7: Assessment method for a rock-ramp and bypass fishway (electrofishing).
Ecological AssessmentAbundance (presence–absence)/length–frequencySample locations Downstream of entrance, through fishway, upstream of fishwayTrap type ElectrofishingSample duration 300 seconds/locationMin. no. replicates (below ent/ent/middle/exit) 12Species ID/rep 100%No. target individuals measured/rep/sp 100Minimum number to be measured/sp (in total) Entrance > 300, Exit > 300 if possibleSub-sample (If >5 tub present) YSeasonality YAssessment timing Y
Presence–absence/length–frequency methodSample location Downstream of entrance, through fishway, upstream of fishwayTrap type ElectrofishingSample duration 300 seconds/locationMin. No. sets Downstream of entrance Through fishway/upstream of fishwayRepeat until 100% of target species are present at entrance Repeat until the number of species presentstabilisesSpecies ID/set 100% 100%No. Individuals measured/sp > 300 if possible > 300 if possibleSize-ranges Must include >150 individuals/sp at or smaller than the minimum size objective for thefishway Measure all fish sampled (up to 1000/sp)Sub-sample If >5 tubs present If >5 tubs presentSeasonality Y YAssessment timing Y Y

38 Monitoring the performance of fishways and fish passage works
Table 4.8: Assessment method for a rock-ramp and bypass fishway (mark-recapture)
Ecological AssessmentAbundance (presence-absence)/Length-frequencySample locations Downstream of Entrance, ExitTrap type Electrofishing (downstream ent) and Trapping (exit)No. tagged individuals/sp Up to 1000 downstream of fishway entranceSize-range of tagged individuals/sp 100% of fishway target size-rangesSample duration 24 hour exit trapping for minimum of 7–10 daysSpecies ID/24 h 100%No. Individuals measured/sp at exit/24 h 100%Seasonality YAssessment timing Y

Monitoring the performance of fishways and fish passage works 39
4.4.3 Fish lock and fish liftTwo different methods have been proposed to assess fish locks and fish lifts including, entrance andexit trapping only, and exit trapping and entrance electrofishing.Abundance (presence-absence)/length-frequency
The abundance/length-frequency method of assessment can be completed by entrance and exittrapping (Table 4.9). The duration of the sample can be determined during a pilot investigation,however it must relate to the cycles of the lock/lift. A minimum of 12 replicates is suggested for theabundance method. There is no minimum waiting period between sampling the entrance or exit forthe abundance method, as the exit sample is essentially fish collected from the entrance of thefishway, which is being constantly replenished from the downstream waterway. Details on individualspecies collected remain the same as other assessment methods, with a minimum of 300 individualsper species to be collected at the entrance and exitPresence-absence/length-frequency
Like the vertical-slot/Denil assessment, the presence-absence method may include the use ofelectrofishing to collect a representative sample of fish located at the entrance of the fishway orfurther downstream. A minimum of 300 seconds of electrofishing time on and 6 hours between shotsis suggested to maintain fish health.
Details on individual species collected remain the same as other assessment methods, with aminimum of 300 individuals per species to be collected at the entrance and exit, and at least 150individuals per species collected at/or smaller than the minimum size objective for the fishway—thiswill be influenced by the timing of the assessment relatively to key movement periods.

40 Monitoring the performance of fishways and fish passage works
Table 4.9: Assessment method for a fish lock and fish lift (trapping exit and entrance, or trapping the exit and electrofishing the entrance).
Ecological AssessmentAbundance (presence–absence)/length–frequencySample Location Entrance and exitTrap type TrapSet duration 1–15 (2 hour) cyclesMinimum waiting period Sample the exit, then the entrance nilSample the entrance, then the exit nilMin. no. replicates (ent/exit) 12Trap checks/set ≤2Species ID/rep 100%No. target individuals measured/rep/sp 100Minimum number to be measured/sp (in total) entrance > 300, exit > 300 if possibleSub-sample (If >5 tub present) YSeasonality YAssessment timing Y
Presence–absence/length–frequency methodSample location Entrance ExitSet duration 1–15 (2 hour) cycles (5 min electrofishing time on$$) 1–15 (2 hour) cyclesMinimum waiting period between trap locations nil nilMin. No. sets (ent/exit) Repeat until 100% of target species are present Repeat until the number of speciespresent stabilisesTrap checks/set 0–2 (12 cycles) 0–2 (12 cycles)Species ID/set 100% 100%No. Individuals measured/sp >300/sp. if possible >300/sp. if possibleSize-ranges Must include >150 individuals/sp at or smaller than the minimum size objective for thefishway Measure all fish sampled (up to1000/sp)Sub-sample If >5 tubs present If >5 tubs presentSeasonality Y YAssessment timing Y Y

Monitoring the performance of fishways and fish passage works 41
Digital mapping specialists (Aerometrex) were commissioned to capture georeferenced data from therock-ramp fishway at Dights Falls on the Yarra River, Collingwood, to investigate the potential of thistechnique as a monitoring tool for certain parameters of rock-ramp fishway hydraulics. Specificparameters thought to be measurable from such a technique include fishway dimensions such aslength, width, slope, and headloss.
High resolution Digital Photography and ground control survey points were used to capturegeoreferenced data on 31 May 2016 at 11:00 am (Figure 5.1). Stream discharge at the time wasapproximately 496 ML/d.
Digital photography was captured with a high resolution (36MP) Canon D810 camera from a locallycommissioned Robinson 44 helicopter. A total of 412 high resolution oblique photographs (pixel sizeat capture was 25 mm GSD) were captured in 15 min of aerial surveying, and a locally commissionedsurveyor verified GPS coordinates and height data for six ground survey points. Existing aerialsurveys from previous years captured using a large format digital mapping camera (UltraCam-X withIMU, GNSS), with a gyro-stabilised mount on board, were also used to control and check the newsurvey.
Ground survey points were then used to compose all images into a common relative coordinatesystem (MGA coordinate system) and 3-dimensional mesh data was extracted using the Aero3Dproproprietary software. Normally orientated imagery was then placed onto mesh face and manual editscorrected data where automation had not worked.
The three-dimensional image product was viewed with TerraExplorer for desktops (Skyline SoftwareSystems). Horizontal data was presented as Geocentric Datum Australia 1994, while vertical datumwas presented as Australian Height Datum (AHD). Map projection was MGA Zone 55. Spatialaccuracy of the data (XYZ) was <50 mm on well-defined surfaces.
Georeferenced data from Aerometrex was then uploaded into ArcGis10 for data mining purposes, anddigital elevation and near neighbour maps were produced (Figures 5.2, 5.3). The area mapped inArcGIS was restricted to the rock-ramp fishway immediately downstream of the Dights Falls weir. Thedigital elevation map displayed the raw data while the near neighbour analysis interrogated theelevation data within a specified radius of each pixel to produce a map of range (min-max) inelevation over a defined distance (Figures 5.2, 5.3). Near neighbour analysis was completed at 5, 10,20, and 30 cm radius and elevation categories were grouped into categories of approximately 0.15 m,as this height represents an approximate theoretical threshold for fish passage in a rock-ramp fishway(noting 0.05 m error associated with elevation data).
The 30 cm near neighbour analysis appeared to produce the most useful information, as it moreaccurately reflected the scale at which elevation change occurred in such a complex rock system.The analysis revealed the presence of potential fish movement pathways (<0.015 m elevationchange) throughout the fishway (Figure 4), however these were less obvious from the area leading tothe vertical-slot fishway entrances just downstream of the weir wall. A previous investigation into theperformance of the Dights Falls rock-ramp and vertical-slot fishways found that fish were unable toascend the upper reaches of the rock-ramp fishway during high stream discharges (>1000 ML/d)(O'Connor et al. 2015a). Therefore, this method of remotely analysing the elevations at lowdischarges may be helpful in identifying potential movement pathways and problematic zones,however this requires further investigation.
The length and width of the fishway and the pools between baffles were readily measured using theArcMap measurement tool. From the entrance baffle to the upstream migration limit of the vertical-slot fishway was approximately 73 m, while the fishway ranged in width from 13.7–45 m. The slope ofthe fishway and fall between each baffle were readily obtained from the digital elevation map, and theoverall slope of the fishway, using the fishway length, was approximately 1:46 (height : length). Thissits well within the 1:40 slope suggested for contemporary fishway design.
5 Trial of aerial photography and 3D modellingto hydraulically assess a rock-ramp fishway

42 Monitoring the performance of fishways and fish passage works
Although analysis of the georeferenced data is preliminary, it does demonstrate that a number ofdifferent quantitative assessments on fishways hydraulics can be completed remotely via ArcGIS.Quantitative assessments include length, width, slope, and headloss across the overall fishway andwithin reaches of the fishway. While the near neighbour analysis identified headloss throughout thefishway allowing for the identification of potential problematic areas, and although not fully explored,the detrending technique could be used to compare reaches within a fishway to ensure consistentdesign. Another potential benefit of this aerial/modelling technique is that the field data collection canbe completed at numerous sites in one surveying trip if they are within close proximity. Furthermore,fishway sites can be monitored over various temporal scales making any alteration to the hydraulicperformance easier to detect. The data presented here is a trial of a new technique commonly usedin other industries, future researchers should attempt to explore its application to fishway monitoringand assessment.

Monitoring the performance of fishways and fish passage works 43
Figure 5.1: Digital elevation map of the rock-ramp fishway downstream of Dights Falls weir.

44 Monitoring the performance of fishways and fish passage works
Figure 5.2: Digital elevation map of Dights Falls rock-ramp fishway and weir, with elevation classifications (m) shown.
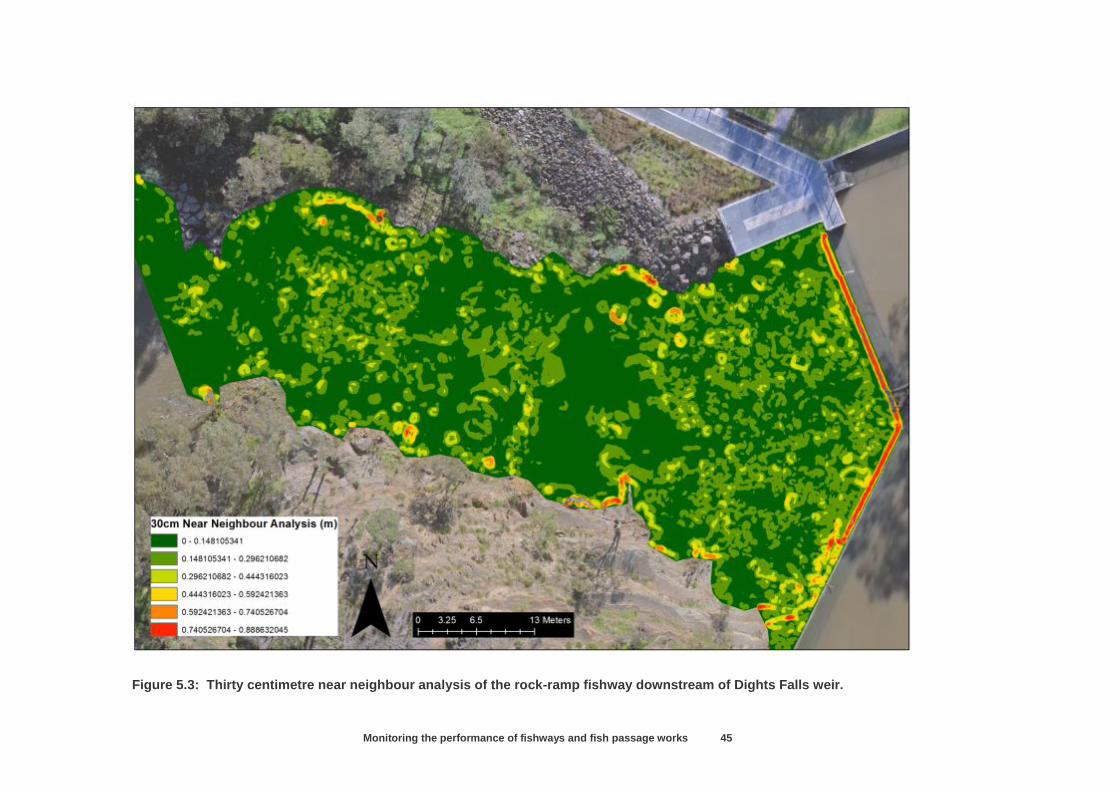
Monitoring the performance of fishways and fish passage works 45
Figure 5.3: Thirty centimetre near neighbour analysis of the rock-ramp fishway downstream of Dights Falls weir.

46 Monitoring the performance of fishways and fish passage works
Figure 5.4: Thirty centimetre near neighbour analysis with potential movement pathways and general areas of larger head losses shown.

Monitoring the performance of fishways and fish passage works 47
Up to 70% of Victoria’s fishways have either not been assessed for their efficiency in providingunimpeded fish passage, or are not working as efficiently as they could (O'Brien et al. 2010). Thispresents a range of management issues for Victoria’s waterway authorities, specifically whenbiodiversity values and restoration efforts are considered.
This document provides a set of guidelines for Victoria’s researchers and waterway managers toassess fishways based on a consistent contemporary approach. The proposed methods usetechniques common to fishway assessments in Australia and overseas, and include measurement ofboth ecological and hydraulic parameters. Reporting of hydraulic performance has not previouslybeen a priority for fishway assessments, yet contemporary researchers consider it vital for assessingecological functionality against contemporary design. These new guidelines will therefore, ensure thebest possible outcomes for fish passage, catchment connectivity, and system restoration in Victoria.
The document addresses Action 11.8 of the Victorian Waterway Management Strategy (VWMS),which is ‘Develop and implement a statewide program for monitoring the performance of fishways andfish passage works’. The document also forms part of Policy 11.1 of the VWMS, ‘Programs will be putin place to ensure the operation, performance and maintenance of fishways and other fish passageworks are monitored and continue to meet best practice standards’.
6 Conclusion

48 Monitoring the performance of fishways and fish passage works
Appendix 1: Examples of past fishway assessments with details on key attributesEfficiency Assessments
Paper Fishway type Country Site name Fishway gradient(baffle headloss) Target fish
Targetsize-range
(mm)Method of assessment Sample
durationNo.
replicatesTraps
checked Key data collected Analysis method
(Stuart et al. 2008) Vertical-slot Australia Murray River, Lock 8 1:32 (0.1 m) Whole fish community 40–1000 Entrance & Exit trapping 24 hours 40 (plus 17 exitsamples) 2 abundancelength–frequency Wilcoxon’s rank sum test: abundance (ent/exit).Kolmogorov–Smirnov two-tailed test: length–frequency (ent/exit).PIT tagging - - ascent success descriptive statisticsDIDSON Sonar - - fish behaviour used for observation on trap shyness(Stuart & Mallen-Cooper 1999) Vertical-slot Australia Fitzroy River 1:20 (0.97 m) Whole fish community Unknown Entrance & Exit trapping 24 hours 37 2 abundancelength–frequency Wilcoxon’s rank sum test: abundance (ent/exit).Kolmogorov–Smirnov two-tailed test: length–frequency (ent/exit)descriptive statistics(Stuart & Berghuis 2002) Vertical-slot Australia Burnett River 1:15 (0.1 m) Whole fish community Unknown Entrance & Exit trapping 24 hours 100 2 abundancelength–frequency Wilcoxon’s rank sum test: abundance (ent/exit).Kolmogorov–Smirnov two-tailed test: length–frequency (ent/exit)descriptive statistics(Baumgartner et al. 2010) Vertical-slot Australia Murray River, Lock 9 1:32 (0.1 m) Whole fish community 30–1000 Entrance & Exit trapping 24 hours 16 2 abundancelength-frequency
two-way ANOSIM, one-way ANOVABray–Curtis similaritiesMDS ordinationtwo-tailed Kolmogorov-Smirnov testdescriptive statisticsPIT tagging ascent/descent informationbehavioural descriptive statistics(Baumgartner et al. 2010) Vertical-slot Australia Murray River, Lock 10 1:32 (0.1 m) Whole fish community 30–1000 Entrance & Exit trapping 24 hours 14 2 abundancelength–frequency
two-way ANOSIM, one-way ANOVABray–Curtis similaritiesMDS ordinationtwo-tailed Kolmogorov-Smirnov testdescriptive statisticsPIT tagging ascent/descent informationbehavioural descriptive statistics(Baumgartner et al. 2010) Vertical-slot Australia Murray River, Lock 7 1:32 (0.1 m) Whole fish community 30–1000 Exit trapping only 24 hours 40? 2 abundancelength–frequency MDS ordinationtwo-tailed Kolmogorov–Smirnov testdescriptive statisticsPIT tagging ascent/descent informationbehavioural descriptive statistics(Thiem et al. 2013) Vertical-slot Canada Richelieu River (0.15 m) 5 key species Unclear PIT tagging and trapping (mainly forcapture) Unclear 492 fish PIT tagged 2/day ascent/descent informationbehaviouralpassage efficiencyabundance/length
descriptive statisticsT-testWilcoxon rank sum testSpearman rank correlationone-way ANOVATukey test(Bryant et al. 1999) Steep pass (Denil) Alaska Margaret Creek 1:4 Whole fish community Exit trapping only 24 hours unclear unclear abundancelength–frequency descriptive statisticsT-testregression(Schmetterling et al. 2002) Denil USA Blackfoot Rivertributaries 1:6.3 or 15.8% 3 species Unknown Mark-Recapture 5–7 days 1 - abundancelength–frequency chi-square testt-test(Schmetterling et al. 2002) Denil USA 1:10.4 or 9.6% Brown trout Unknown Mark-Recapture (control/translocation) 5–7 days 1 - abundancelength–frequency chi-square testt-test(Schmetterling et al. 2002) Denil USA 1:6.1 or 16.4% 2 target species Unknown Mark-Recapture (control/translocation) 5–7 days 1 - abundancelength–frequency chi-square testt-test(Bunt et al. 1999) Denil USA Grand River 1:10 or 10% 2 target species Unknown Exit Trapping, mark-recaptureRadio-telemetry Unclear 2/day abundancelength–frequencybehaviouralfishway hydraulics
one-way ANOVAChi-square testcontingency analysis for proportionsdescriptive statistics(Bunt et al. 1999) Denil USA 1:5 or 20% 2 target species Unknown Exit trapping, mark-recaptureRadio-telemetry unclear 2/day abundancelength–frequencybehaviouralfishway hydraulics
one-way ANOVAchi-square testcontingency analysis for proportionsdescriptive statistics(Schwalme et al. 1985) Denil USA Lesser Slave River 1:10 or 10% Whole fish community Unknown Exit TrappingEntrance - Seine net downstream 640 hours (across the3 fishways) unclear Exit 2/day abundancelengthfishway hydraulicsblood samples
descriptive statisticsG-statisticregression1:5 or 20% Whole fish community Unknown Exit TrappingEntrance - Seine net downstream 640 hours (across the3 fishways) unclear Exit 2/day abundancelengthfishway hydraulics descriptive statisticsG-statisticregression(Schwalme et al. 1985) Vertical-slot USA Lesser Slave River Whole fish community Unknown Exit TrappingEntrance - Seine net downstream 640 hours (across the3 fishways) unclear Exit 2/day abundancelengthfishway hydraulics descriptive statisticsG-statisticregression
(Croze et al. 2008) Fish lift and Fish lock France River Garonne N/A Atlantic salmon Unclear Radio-tagging 2 years (Mar–August) 25 fish - behaviouralascent successattraction efficiencyhydraulicsdescriptive statisticsOne-sample Kolmogorov–Smirnov testFriedman test (chi-square)linear regressionMann-Whitney U-test
(Barry & Kynard 1986) Fish lift (2) USA Connecticut River N/A American shad Unclear Radio-tagging 2 years 34 fish behaviouralascent successattraction efficiencyhydraulicschi-squareNewman-KeulsANOVAdescriptive statistics(Sprankle 2005) Fish lift USA Merrimack River N/A American shad Unclear Radio-tagging Unclear 72 fish behaviouralascent success descriptive statisticschi-square (Zar)ANOVA
(Santos et al. 2002) Fish lift Portugal Lima River N/A Whole fish community Unknown Video Camera (On fish lift and exit) 11 Months 1 min video every4 hour lift cycle 2218 behaviouralascent successhydraulicone-way ANOVAmultiple comparisons test (Tukey?)contingency tables – simultaneous test procedureMann–Whitney rank sum teststepwise multiple regression(Calles & Greenberg 2007) Nature Like fishway(2) Sweden River Eman 2.5% and 1.8% Whole fish community Unknown PIT taggingTrappingElectrofishing 3.5 years Unclear Unclear ascent successfish length descriptive statisticsMann–Whitney testKruskal–Wallis test
(Aarestrup et al. 2003) Nature like bypass Denmark Tirsbaek Brook 1.6% Brow sea trout Unknown ElectrofishingPIT tagging Monitoring overautumn /winter for 2years 32 fish N/A attraction and passage efficiencybehavioural chi-square with Yates correctionANOVAKruskal–WallisWatson–Williamson two sample

Monitoring the performance of fishways and fish passage works 49
Paper Fishway type Country Site name Fishway gradient(baffle headloss) Target fish
Targetsize-range
(mm)Method of assessment Sample
durationNo.
replicatesTraps
checked Key data collected Analysis method
(Santos et al. 2005) Nature like bypass Portugal Lima River 3.8% Whole fish community Most size-classes Video Camera (on fish lift and exit)Electrofishing 117 days - - hydraulicbypass efficiencyfrequency of hours passageT-teststepwise multiple regressionDurbin–Watson statisticdescriptive statistics
(Schmutz et al. 1998) Nature like bypass Austria Marchfeldkanal – a manmade channel 12 pools, 9-22 cm headloss Whole fish community Unclear Electrofishing downstream (i.e.entrance)Fishway trap (exit)Radio-tracking Monitoring between1993-1995 15 Pike perch(radio-tracking) - passage efficiencybehavioural descriptive statisticsG-test(Franklin et al. 2012)
Rock-rampPool and weirStep-pass Bypass(rock-ramp)Step-pass USA Town brookEast River1:24 or 4.2%1:7 or 14.3%1:10 or 9.6%1:14 or 7.1%1: 3.4 or 29.6%
Alewives Various PIT tagging unclear 793 fish - passage efficiencybehaviouraldescriptive statisticsmultiple logistic regressiontwo-tailed t-testKaplan–Meier and life tables analysisCox’s proportional hazards regression
(Litvan et al. 2008) Grade controlstructures (rock-ramps) USA Turkey Creek 5 fishways1:12.6 -1:18.3 4 target species Unclear Mark-recaptureElectrofishing(Passive gear (nets)Angling) 4 years 3011 fish tagged - passage efficiencybehavioural descriptive statistics(O'Brien 1997) Rock-ramp Australia Barwon River 1:16 Whole fish community 40–250 Glass eel trapElectrofishingFish marking (Bismark brown R) Approx.. 16 hours(traps) 3 - ascent successfish lengths descriptive statistics(Beatty et al. 2007)) Rock-ramp (2) Australia Margaret River 1:20 Whole fish community Unknown Exit trapping (fyke nets) 24 hours unclear - abundancelength–frequency descriptive statisticsElectrofishing ? unclear - abundancelength–frequency descriptive statistics(Thorncraft & Harris 1997) Rock-ramp Australia Macquarie RivuletWyong RiverBell RiverMacintyre River 1:20 Whole fish community Unknown Entrance and Exit sampling (using nets,traps) 24 hours 2-4- - abundancelength–frequency descriptive statistics(Thorncraft & Harris 1997) Fish Lock Australia Murray River N/A Whole fish community Whole fishcommunity ElectrofishingEntrance and exit trapping
Entrance trapping -UnclearExit trapping– approx.12 hours2 @ entrances6 entrance tower7 at exit - abundancelength–frequency descriptive statistics
(Stuart et al. 2007) Fish Lock Australia Fitzroy River N/A Whole fish community Whole fishcommunity Entrance and exit trapping(incl. lock cycle exp) 24 hours 69 - abundancelength–frequency Wilcoxon’s rank sum test: abundance (ent/exit).Kolmogorov–Smirnov two-tailed test: length–frequency (ent/exit)Friedman repeated measured analysisdescriptive statisticsWhole fish community Whole fishcommunity Downstream of entrance - Fyke andPanel nets (accumulation) 6 hours - - abundancelength–frequency generalized linear modelGenstat RPAIRShannon’s H’(McGill 2001) Rock-ramp Australia Thomson River 1:30 (0.1 m) Whole fish community Unknown Entrance and exit fyke nettingElectrofishing 24 hours (netting) Approx.. 8 (netting)4 (electrofishing) 2 (nettingonly) abundancelength–frequency Kolmogorov–Smirnov signed rank testWilcoxon signed rank testdescriptive statistics(Zampatti & Bice 2014) Fish Lock Australia Murray Rover N/A Fish <100 mm Whole fishcommunity Entrance and exit trapping 24 hours 14 Unknown abundancelength–frequency descriptive statisticsKolmogorov–Smirnov two-tailed testPERMANOVAVertical-slot Australia Murray River 1:23 Fish >100 mm Whole fishcommunity Entrance and exit trapping 24 hours 6 (paired samples) Unknown abundancelength–frequency descriptive statisticsKolmogorov–Smirnov two-tailed testPERMANOVA(Mallen-Cooper & Brand 2007) Submerged orifice Australia Murray River 1:9 Whole fish community Unknown Entrance and exit trapping 22 hours 8 (paired samples) Unclear abundancelength–frequency descriptive statisticsKolmogorov–Smirnov test

50 Monitoring the performance of fishways and fish passage works
SummaryFish passage facilities range in size, design and function, and include attributes aimed at themovement needs of the local fish community. Assessing the functionality of a fishway structureagainst its design is important for reconciling design objectives with passage efficiency. Ecologicalassessments are typically completed by state or federal agencies and consultant groups, using arange of collection techniques and assessment methods. Little consistency in assessment methodsexists between organisations, individuals, or fishway types, leading to a range of outcomes that areoften not comparable.
We designed a range of ecological and hydraulic assessment methods for common fishway types(vertical-slot, rock-ramp, fish bypass, fish lift and fish lock) to improve the consistency of fishwayassessments across the state of Victoria, Australia. The ecological assessment method consisted oftwo sub-methods including a replicated and quantifiable design, and an abundance andpresence/absence length-frequency design. Assessment methods were applied to a coastal rock-ramp fishway over a two year period to compare outcome consistency. The methods were alsoapplied retrospectively to a coastal vertical-slot fishway to test the applicability of these methods todifferent fishway types.
Ecological outcomes of the proposed assessment methods were consistent between method typeindicating that the range of proposed methods can be used to assess the efficiency of a range of fishpassage facilities. Future fishway investigations should aim to utilise the assessment methods as aguide to improve fishway monitoring, and therefore, overall functionality of fishways throughoutVictoria.
IntroductionFishways are known to provide longitudinal passage for fish at weirs, dams, regulators and roadculverts (Stuart & Mallen-Cooper 1999). Fishway structures are now being installed to maintain orimprove fish populations for biodiversity values at a local, regional, and state scale (Barrett & Mallen-Cooper 2006; Baumgartner et al. 2014). Understanding the efficiency of a fishway is important forgauging the success of such an intervention at providing passage. Similarly, consistency infunctionality is required for achieving passage at a reach, catchment, and basin scale.
Assessing fishway functionality can only be completed via a monitoring program, and monitoringoutcomes can improve the design of future fishways. Methods for assessing fishways vary and mayinclude fishway trapping, electrofishing, mark-recapture, radio or acoustic tagging, hydroacoustics,sonar, or PIT tag reader systems (Baumgartner et al. 2010; Bunt et al. 1999). The methods employedmay also reflect the availability of funds or the organisation or individuals involved.
Historically, the outcomes of a monitoring program help to gauge the success of the intervention at alocal level (i.e. the fishway). However, the scales of restoration efforts are cumulative, and occur overa large spatial and temporal range (Bedford 1999; Neeson et al. 2015), so the intervention successneeds to be consistent and contemporary over these broader spatial scales. Our understanding ofmovement requirements of native fish has progressed significantly in the last 15-20 years, so there isa clear need to ensure that fishway designs, and so assessments, remain contemporary andcomparable through time.
We designed a set of methods to assess Victoria’s fishways to gain consistent and comparableoutcomes across fishway assessments. The proposed methods take into account ecological andhydraulic aspects of the fishway assessment and target common fishway types occurring in Victoria:rock-ramp, vertical-slot, bypass, fish lock, and fish lift. The methods have been developed to identifyfishways not functioning to design/contemporary design. The methods also include an overall
Appendix 2:Case study — Ecological and hydraulicassessment methods for monitoring fishpassage facilities

Monitoring the performance of fishways and fish passage works 51
assessment scoring designed to enhance the decision making processes around fishwayremediation.
To test the robustness of these assessment methods, two coastal fishways, a rock-ramp and vertical-slot, were assessed. Following this, the proposed methods have been refined and the outcomes arediscussed. Future investigations are encouraged to apply these methods to fishway assessments.However, fishway designs and assessment methods are always changing, and a contemporaryapproach is required to improve the applicability and relevance.
Site descriptionsBarham River rock-ramp fishway
The Barham River rock ramp fishway is located in southern Victoria near Apollo Bay (Figure 5). TheBarham River catchment is approximately 75 km2 and the Barham River east branch has an averagedaily discharge of approximately 54ML/d (ranging from 0-3,843 ML/d) and an annual discharge ofapproximately 50GL with the majority of flows occurring in the winter-spring period (Victorian DataWarehouse, DELWP). Opening of the Barham River estuary mouth occurs during wetter periodshowever, artificial openings can occur over the summer months to reduce the inundation of low-lyingcampgrounds at Apollo Bay.
The Barham River east branch is largely unregulated, however a low-level flow gauging station(concrete apron) exists approximately eight river kilometres upstream of the estuary mouth (Figure 5).The flow gauge has had a rock-ramp fishway constructed downstream to improve movement fornative fish. The fishway is a lateral ridge rock-ramp with seven ridges, a slope of 1:25 and headlossof 120 mm at each fishway ridge. This fishway was designed to pass small-medium sized native fishincluding juvenile diadromous species such as galaxiids and tupong but also adult Australian grayling.
A total of nine fish species are known to occur in the Barham River east branch, eight of which arenative species (Table 1). All native fish species are considered diadromous.
Figure 5. Rock-ramp fishway downstream of a stream gauging station on the Barham Rivereast branch.

52 Monitoring the performance of fishways and fish passage works
Table 1. Species previously recorded in the Barham River each branch post 1985 (VictorianBiodiversity Atlas).
Species Common name DiadromousNativeGalaxias maculatus Common Galaxias Yes
Galaxias truttaceus Spotted Galaxias Yes
Galaxias brevipinnis Climbing Galaxias Yes
Prototroctes maraena Australian Grayling Yes
Anguilla Australis Short-finned Eel Yes
Pseudaphritis urvillii Tupong Yes
Mordacia mordax Short-headed Lamprey Yes
Geotria australis Pouched Lamprey Yes
IntroducedSalmo trutta Brown trout
Barwon River vertical-slot fishway
The Barwon River fishway is located approximately 15 km downstream of Geelong. The fishway isconstructed at a tidal barrage (Figure 6), which was constructed in the late 1930s and is locatedapproximately 1.5 km upstream of Lake Connewarre. The tidal barrage consists of a sheet-pilestructure and two floating gates to control upstream water levels to a crest height of 0.85 m AHD(Figure 7). The weir was installed to prevent upstream incursion of salt water, and to maintainupstream levels of freshwater for irrigation and recreation. The barrage forms a barrier between freshand estuarine water and the fish species associated with these habitats. The tidal range below thebarrage is 0 to 0.5 m AHD.
The fishway is a 29 metre long, precast concrete, vertical-slot design, comprising 12 baffles with a75 mm head loss between each baffle resulting in a total head differential along the entire length ofthe fishway of 0.85 m (this will vary depending on head and tail water levels). Turbulence is 18 W/m3
and the slope of the fishway is 1v:30h. Cell dimensions are 1200 mm wide x 2400 mm long, with slotwidths tapering (0.18 m tapering to 0.14 m wide slots). A continuous layer of small rocks has beeninstalled in the floor of the fishway to enhance passage of small demersal fish and crustaceans.
The freshwater discharge into the estuary from the fishway is 6.6 ML/d. The fishway operates with apool depth of 0.4 to 0.6 m which was limited by the upstream invert being set at 0.45 m due tostakeholder concerns relating to the unlikely event of the fishway significantly reducing the weir poollevel. The downstream fishway invert was set at –0.40 m AHD which provided a minimum depth of0.4 m even when the tide was low (0.0 m AHD). To increase fish attraction, an auxiliary flow isintroduced at the fishway entrance by a small box culvert.
A total of 41 species have previously been recorded in the Barwon River/estuary complex (Table 2).Twenty of these fish are considered to be estuarine/marine, 14 are considered to be freshwaterspecies, and seven are introduced. A total of eight freshwater species are considered to bediadromous.

Monitoring the performance of fishways and fish passage works 53
Figure 6. Barwon River vertical-slot fishway with fishway exit trap shown in position.
Figure 7. Tidal barrage gates on the Barwon River

54 Monitoring the performance of fishways and fish passage works
Table 2. Species list from the Barwon River including the lower estuary, modified from(Hindell et al. 2008).
Common name Species Diadromous
NativeEstuarine/MarineArripis georgianus Australian Herring NoGirella tricuspidata Luderick NoRhombosolea tapirina Greenback Flounder NoPseudocaranx dentex Silver Trevally NoHyperlophus vittatus Sandy Sprat NoStigmatopora argus Spotted Pipefish NoAmmotretis rostratus Longsnout Flounder NoTetractenos glaber Smooth Toadfish NoSillaginodes punctatus King George Whiting NoArripis trutta esper Australian Salmon NoAldrichetta fosteri Yellow-eye Mullet NoMugil cephalus Sea Mullet NoPomatomus saltatrix Tailor NoAtherinosoma microstoma Small-mouthed Hardyhead NoArenigobius bifrenatus Bridled Goby NoAfurcagobius tamarensis Tamar Goby NoTasmanogobius lasti Scary’s Tasman Goby NoSciaena Antarctica Mulloway NoAcanthopagrus butcheri Black Bream NoMacquaria colonorum Estuary Perch No
FreshwaterPrototroctes maraena Australian Grayling YesGeotria australis Pouched Lamprey YesMordacia mordax Short-headed Lamprey YesPseudaphritis urvillii Tupong YesAnguilla australis Short-finned Eel YesGalaxias brevipinnis Broad-finned Galaxias YesGalaxias truttaceus Spotted Galaxias YesGalaxias maculatus Common Galaxias YesGadopsis marmoratus River Blackfish NoEdelia obscura Yarra Pygmy-perch NoRetropinna semoni Australian Smelt NoPhilypnodon grandiceps Flat-headed Gudgeon NoNannoperca australis Southern Pygmy-perch NoSalmo trutta Brown Trout No
IntroducedOncorhynchus mykiss Rainbow Trout NoCyprinus carpio Carp NoCarassius auratus Goldfish NoGambusia holbrooki Gambusia NoPerca fluviatilis Redfin NoRutilus rutilus Roach NoTinca tinca Tench No

Monitoring the performance of fishways and fish passage works 55
MethodsBiological and hydraulic sampling
Barham River
Data was collected from the Barham River rock-ramp fishway using fyke netting and back-packelectrofishing, while fish used in the mark-recapture experiment were caught downstream of thefishway using the back-pack electrofisher, and the fish at the exit were trapped using a fyke net. Forthe mark-recapture experiment, fish were marked with Calcein, which fluoresce under ultraviolet light.The Calcein marking procedure followed those outlined in (Crook et al. 2009). G. maculatus was thetarget species for the Barham River fishway assessment as they were abundant at the time ofsampling.
A total of 10, 24-hour entrance/exit fyke netting replicates were completed as part of the abundance(presence-absence)/length-frequency method on the Barham River fishway. Fyke netting occurredover three separate weeks from 1st December 2014 – 4th February 2015. While, 10, five minuteelectrofishing replicates (upstream/downstream) were also completed for the abundance (presence-absence)/length-frequency method. Each site was then left for six hours to recover from the effects ofelectrofishing. Back-pack electrofishing samples were completed over two weeks from 4th February2015 – 26th March 2015. Data used for the presence/absence method for both fyke netting andelectrofishing was based on the first 300 fish collected for each treatment site regardless of replicatenumber.
A total of 744 fish were marked as part of the Calcein marking experiment, with the mark-recapturedata collected over two weeks from 12th January 2016 – 19th February 2016. Of the 744 fish marked,422 were used in the passage experiment, while the remaining 322 fish were held in a holding cage inthe Barham River during each week of sampling, in order to gain an estimate mortality associatedwith the calcein marking procedure — this was less than 8%. At the completion of the mortalityexperiment, each fish was then measured, and this data was used in the length-frequency analysis,while all fish captured in the fishway exit net were measured before being released.
To prevent fish from moving out of the study area, a fine mesh stop net was placed 50 m downstreamof the fishway entrance, and a fine mesh stop net was also used immediately upstream of the fishwayto direct fish that successfully ascended the fishway, towards the exit fyke net.Barwon River
The Barwon River vertical-slot fishway was assessed using an entrance and exit trap. A total of 12,90 min entrance/exit trapping replicates were completed as part of the abundance (presence-absence)/length-frequency method of assessment. The samples were collected over two separatetrips twice monthly between from September 2013 — February 2014. Data for the presence-absence/length-frequency analysis was obtained from samples collected in September – November2013.
Fish captured during both the Barham and Barwon Rivers fishway assessments were counted andidentified to the species level, and up to 50 individuals for each replicate were measured for thelength-frequency analysis. Descriptive and non-parametric statistics were used to analyse the datacollected at both fishways. Specifically, a Mann-Whitney U-test, and a Kolmogorov–Smirnov testwere used to analyse abundance and length-frequency data respectively. Parametric statistics(ANOVA) were applied to the abundance data at both fishway sites, however the assumptions forparametric statistics were not met. For more detail on the ecological and hydraulic assessmentmethods refer to Chapter 4 in the main document.

56 Monitoring the performance of fishways and fish passage works
ResultsEcological assessment, Barham River (rock-ramp fishway)
Electrofishing
Abundance / length-frequency method
A total of seven fish species were captured during electrofishing surveys, one of which wasintroduced (Table 3). All of these species were captured upstream and downstream of the fishway.Galaxias maculatus was the most common species encountered and they occurred in statisticallysimilar abundances upstream and downstream of the fishway (Figure 8). Length-frequency analysisindicated that the size of G. maculatus located downstream of the rock-ramp fishway was statisticallysimilar to those located upstream of the fishway (Figure 9).
Table 3. Details of fish species collected in the Barham River rock-ramp fishway using thebackpack electrofisher only.
Species Common nameD/S
EntranceTotal U/S Exit Total
NativeGalaxias maculatus Common Galaxias Yes 1056 Yes 1078Galaxias truttaceus Spotted Galaxias Yes 2 Yes 10Prototroctes maraena Australian Grayling Yes 10 Yes 42Mordacia mordax Short-headed Lamprey Yes 21 Yes 23Anguilla Australis Short-finned Eel Yes 103 Yes 78Pseudaphritis urvillii Tupong Yes 33 Yes 39IntroducedSalmo trutta Brown Trout Yes 38 Yes 87
Figure 8. Mean catch of G. maculatus per minute (±1SE) downstream and upstream of theBarham River fishway. The Mann-Whitney U-test result is indicated.
Mea
n C
PUE
(fish
/min
)
0
5
10
15
20Galaxias maculatus
n=2206Mann-Whitney U test = 46
P =0.762
Downstream Upstream

Monitoring the performance of fishways and fish passage works 57
Figure 9. Length-frequency plot of Galaxias maculatus captured upstream and downstream ofthe rock-ramp fishway in the Barham River. Kolmogorov–Smirnov test results for each samplelocation are shown.
Presence–absence / length-frequency method
A total of seven fish species were captured during electrofishing surveys, one of which wasintroduced (Table 4). All seven species were captured upstream and downstream of the fishway.G. maculatus was the most common species encountered. Length-frequency analysis indicated thatthe size of G. maculatus located downstream of the rock-ramp fishway was statistically similar tothose located upstream of the fishway (Figure 10).
Table 4. Details of fish species collected in the Barham River rock-ramp fishway using thebackpack electrofisher only.
Species Common nameD/S
EntranceTotal U/S Exit Total
NativeGalaxias maculatus Common Galaxias Yes 578 Yes 615Galaxias truttaceus Spotted Galaxias Yes 1 Yes 7Prototroctes maraena Australian Grayling Yes 10 Yes 8Mordacia mordax Short-headed Lamprey Yes 14 Yes 12Anguilla Australis Short-finned Eel Yes 51 Yes 28Pseudaphritis urvillii Tupong Yes 19 Yes 22IntroducedSalmo trutta Brown Trout Yes 19 Yes 29
Length (mm)
0 20 40 60 80 100 120 140 160 180 200
% F
requ
ency
0
2
4
6
8
10
12
14
16
18
DownstreamUpstream
Galaxias maculatusn=1003
KS test statistic = 0.043P = 0.740

58 Monitoring the performance of fishways and fish passage works
Figure 10. Length frequency histogram of fish upstream and downstream of the Barham Riverfishway. Kolmogorov–Smirnov test results for each sample location are shown.
Fyke netting
Abundance / length-frequency method
A total of six fish species were captured during fyke netting surveys, one of which was introduced(Table 5). With the exception of Australian grayling, which was only captured upstream of thefishway, all other species were present upstream and downstream of the fishway. G. maculatus wasthe most common species encountered and they occurred in statistically similar abundancesupstream and downstream of the fishway (Figure 11). Length-frequency analysis indicated that thesize of G. maculatus located downstream of the rock-ramp fishway was statistically smaller than thoselocated upstream of the fishway (Figure 12). Additional analysis of the length-frequency data(separate by sample period) indicated that during the December sampling, fish collected downstreamof the rock-ramp were statistically smaller than those upstream of the fishway. However, during thelate January/early February sample, this statistical difference was absent (Figure 13).
Table 5. Details of fish species collected in the Barham River rock-ramp fishway using fykenetting.
Species Common nameD/S
EntranceTotal U/S Exit Total
NativeGalaxias maculatus Common Galaxias Yes 1922 Yes 234Prototroctes maraena Australian Grayling – Yes 2Pseudaphritis urvillii Tupong Yes 7 Yes 2Anguilla Australis Short-finned Eel Yes 35 Yes 25Mordacia mordax Short-headed Lamprey Yes 5 Yes 3IntroducedSalmo trutta Brown Trout Yes 1 Yes 1

Monitoring the performance of fishways and fish passage works 59
Figure 11. Catch of G. maculatus per 24 h (±1SE) using fyke net upstream and downstream ofthe Barham fishway.
Figure 12. Length frequency of fish upstream and downstream of the Barham River fishway.Note total fish used in the analysis is slightly less than the 300 recommended.
Mea
n C
atch
/24h
r
0
50
100
150
200
250
300
350
400
450
500
550
Downstream of fishway Upstream of fishway
n=2156Galaxias maculatus
Mann-Whitney U-test statistic = 67.5P=0.185
Length (mm)
0 10 20 30 40 50 60 70 80 90 100 110 120 130 140 150 160
% F
requ
ency
0
5
10
15
20
25
30
35
40
Downstream of fishwayUpstream of fishway
Galaxias maculatusn=499
KS test statistic = 0.384P=0.001

60 Monitoring the performance of fishways and fish passage works
Figure 13. Length-frequency plot of Galaxias maculatus captured upstream and downstreamof rock-ramp fishway in the Barham River. Fish were collected using fyke netting on twoseparate occasions December and late January/early February. Kolmogorov–Smirnov testresults are also shown.
0 10 20 30 40 50 60 70 80 90 100 110 120 130 140 150
% F
requ
ency
0
5
10
15
20
25
30
35
40
45
50
55
Downstream of fishwayUpstream of fishway
December
Length (mm)
0 10 20 30 40 50 60 70 80 90 100 110 120 130 140 1500
2
4
6
8
10
12
14
16
18
Downstream of fishwayUpstream of fishway
Late January/early February
KS test statistic = 0.149P=0.108
n=231
n=268
KS test statistic = 0.423P=0.001

Monitoring the performance of fishways and fish passage works 61
Mark–recapture
Abundance/length-frequency method
Mark–recapture analysis was completed on G. maculatus, the most abundant species collectedduring the Barham River investigation. A total of 764 fish were used in the experiment ranging in sizefrom 47–150 mm (av. 95.04 mm). This analysis was completed over two separate weeks in Januaryand February 2016. Length-frequency analysis completed on fish located downstream of the fishwayfound no statistical difference between sample weeks (Kolmogorov–Smirnov test statistic = 0.118,P=0.345) and as such, additional analysis was completed using combined data. The length of G.maculatus collected downstream and upstream of the Barham River fishway was statistically different(Kolmogorov–Smirnov test statistic = 0.199, P=0.001) (Figure 14). Fish 60–80 mm occurred in highabundance downstream of the fishway compared with upstream of the fishway.
Figure 14. Length-frequency graph of Calcein marked G. maculatus upstream anddownstream of the Barham River fishway. The Kolmogorov–Smirnov test result are shown.

62 Monitoring the performance of fishways and fish passage works
Hydraulic assessment, Barham River (rock-ramp fishway)
Fishway design details were not available for the Barham River rock-ramp, therefore the constructeddesign was compared with contemporary design. Water depth throughout the rock-ramp fishwayranged from 10–300 mm, which was substantially less than the 500 mm recommended, and as such,pool volume was also less than recommended (Table 6). Slot width ranged from 10–150 mm acrossthe face of most fishway baffles, despite the minimum width recommended being 150 mm. Slope ofthe fishway was 1:24.8, less than 1:30 suggested with contemporary design. Headloss at the fishwayranged from 31–164 mm, with the majority of headloss measurements outside the suggested 75 mmsuggested with contemporary design (Figure 15). Headloss at the fishway entrance wasapproximately half the suggested minimum of 60 mm. Entrance and exit flow vectors were excellentand the entrance and exit location was also excellent as the structure is a full width fishway.
Figure 15. Headloss (mean with range) at a number of locations across each rock-ridge at theBarham River fishway. The dotted red line indicates the target headloss range forcontemporary design.

Monitoring the performance of fishways and fish passage works 63
Table 6. Barham River rock-ramp ecological and hydraulic assessment scoring.
MeasuredDesigndetails
Measureddeviation(%)from design
Acceptable %deviation fromcontemporary
design
Contemporary design
Hydraulic AssessmentDepth 10–300 mm (av. 80 mm) N/A N/A 5 500 mm
Pool volume 1030–2620 L N/A N/A (5) 2500 LMinimum slot width 10–150 mm N/A N/A (5) 150
Maximum water velocity at the vena contracta ** N/A N/A 1.2Slope 1:24.8 N/A N/A (5) >1:30
Headloss (31 mm – 164 mm) N/A N/A (5) <75Minimum headloss at fishway entrance 31 mm N/A N/A 5 60
Maximum water velocity at fishway exit channel ** N/A N/A 10 0.05Headloss at trash racks N/A N/A N/A 0 N/A
Entrance and exit flow vectors Excellent N/A N/A 0 <90o, no recirculationEntrance/exit location Full width fishway N/A N/A 10 U/S–D/S migration limit
Debris% presence withinfishway
5% N/AN/A 5 ?
Fishway auxiliary water (if present) causes excessive turbulence Yes or No N/A N/A N/A N/ALock cycle time (reflects design) Yes or No N/A N/A N/A N/A
Minimum plunge pool depth suitable Yes or No N/A N/A N/A N/A
Ecological AssessmentFishway type is suitable for species present Yes or No Yes
Fishway hydraulics are suitable for fish species and reflectcontemporary deign
Yes or NoNo (see comment)
Target species are present at both fishway entrance and exit Yes or No Yes 0Size range of target fish species is at minimum target size at the fishway Yes or No Yes <2
Target size ranges are present at the entrance and exit of fishway Yes or No Yes <2
Abundance77 Entrance vs exitabundance
EF (<1%), Fyke Net(>800%)
<30
Comments
Average depth is less than required although there was not much water in river. Slot width highly variable and consistently less than100 mm. Slope is steeper than required. Headloss at baffle 1, 2 and fishway exit appears to be on the higher end of contemporarydesign – maintenance required. Minimum headloss at entrance is less than recommended. ** water velocity was not measured on siteas it was impracticable to measure at the vena contracta as they were shallow and narrow
() = greater tolerance allowed for rock-ramps and bypass fishways (with respect to % deviation from contemporary design).

64 Monitoring the performance of fishways and fish passage works
Ecological Assessment, Barwon River (vertical-slot fishway)
Presence–absence / length-frequency
Fifteen fish species were captured during trapping surveys on the Barwon River, two of which wereintroduced (Table 7). Two species were present at the exit, but absent from the entrance, while threespecies present at the entrance were absent from the exit. G. Maculatus was the most commonspecies encountered and they occurred in statistically similar abundances upstream and downstreamof the fishway (Figure 16). Length-frequency analysis indicated that the size of G. maculatusdownstream of the fishway was statistically different to those located upstream (Figure 17).
Table 7. Details of fish species collected in the Barwon River vertical-slot fishway.
Species Common name Entrance Total Exit Total
NativePrototroctes maraena Australian Grayling Yes 12 Yes 36Retropinna semoni Australian Smelt Yes 119 Yes 76Galaxias brevipinnis Broad finned Galaxias Yes 1 No 0Galaxias maculatus Common Galaxias Yes 10179 Yes 3496Philypnodon grandiceps Flathead Gudgeon Yes 142 Yes 52Mugil cephalus Sea Mullet Yes 4 Yes 2Anguilla Australis Short-finned Eel Yes 1 No 0Atherinosoma microstoma Small-mouthed Hardyhead No 0 Yes 1Nannoperca australis Southern Pygmy-perch Yes 4 Yes 2Galaxias truttaceus Spotted Galaxias Yes 22 Yes 2Tetractenos glaber Smooth Toadfish No 0 Yes 1Pseudaphritis urvillii Tupong Yes 195 Yes 97Aldrichetta fosteri Yellow-eye Mullet Yes 51 Yes 12IntroducedGambusia holbrooki Gambusia Yes 3 No 0Perca fluviatilis Redfin Perch Yes 3 Yes 6
Presence–absence / length-frequency
Eleven fish species were captured during the trapping surveys (Table 8). Two species were absentfrom the exit sample, namely broad finned galaxias and short finned eel. G. maculatus was the mostabundant species encountered. The length-frequency of G. maculatus collected during the presence-absence method was statistically different to those located upstream of the fishway (Figure 18).
Table 8. Details of fish species collected in the Barwon River vertical-slot fishway
Species Common name Entrance Total Exit Total
NativePrototroctes maraena Australian Grayling Yes 9 Yes 36Retropinna semoni Australian Smelt Yes 62 Yes 72Galaxias brevipinnis Broad finned Galaxias Yes 1 No 0Galaxias maculatus Common Galaxias Yes 9477 Yes 3159Philypnodon grandiceps Flathead Gudgeon Yes 69 Yes 12Perca fluviatilis Redfin Perch Yes 3 Yes 6Mugil cephalus Sea Mullet Yes 4 Yes 2Anguilla Australis Short-finned Eel Yes 1 No 0Nannoperca australis Southern Pygmy-perch Yes 4 Yes 2Galaxias truttaceus Spotted Galaxias Yes 22 Yes 2Pseudaphritis urvillii Tupong Yes 148 Yes 40

Monitoring the performance of fishways and fish passage works 65
Figure 16. Mean catch of G. maculatus per 90 min trapping (±1SE) downstream and upstreamof the Barham River fishway. The Mann-Whitney U-test result is indicated.
Figure 17. Length-frequency plot of G. maculatus captured upstream and downstream of thevertical-slot fishway in the Barwon River. Kolmogorov–Smirnov test results are also shown.

66 Monitoring the performance of fishways and fish passage works
Figure 18. Length frequency of fish upstream and downstream of the Barwon River fishway.
Hydraulic assessment, Barwon River (vertical-slot fishway)
The design details of the Barwon River vertical-slot fishway have previously been documented(O'Connor et al. 2015a), so measurement taken during this investigation could be compared againstthe design (Table 9). Pool depth was less than both designed/contemporary design, with the fishwaygenerally being shallower towards the exit. Similarly, pool volume was less thandesigned/contemporary design. Headloss varied considerable from 0–100% different from bothdesign/contemporary. Entrance location was > 0.5 m from upstream migration limit, while exitlocation was approximately 26 m upstream of the downstream migration limit for fish. The auxiliarywater provided did not cause excessive turbulence at the entrance cell of the fishway. All otherparameter measured were in line with the design details

Monitoring the performance of fishways and fish passage works 67
Table 9. Barwon River vertical-slot fishway assessment scoring.
Measured Design details
Measureddeviation (%)from design
Acceptable %deviation from
contemp. designContemporary design
Hydraulic Assessment
Depth 0.15–0.7 m 0.4–0.6 m –37.5% – 116.7% 5 0.75 mPool volume 400–1850 L 1056–1584 L –62.1% – 116.8 2 2800 L
Minimum slot width 0.18–0.14 0.18-0.14 tapering 0% 2 150 mmMaximum water velocity at the vena contracta 1.2 1.21 <1% 1.2 ms-1
Slope 1:30 1:30 <2% 2 >1:30Headloss 0–75 mm 75 mm 0–100% 2 <75 mm
Minimum headloss at fishway entrance 0 Unknown - 5 <45 mmMaximum water velocity at fishway exit channel Not measured Unknown - 10 0.05 ms-1
Headloss at trash racks Unknown - 0 <20 mmEntrance and exit flow vectors <90o <90o 0% 0 <90o, no recirculation
Entrance/exit location 3 m / 26 m Unknown 10 U/S and D/S migration limitDebris % presence within fishway <5% 5 ?
Fishway auxiliary water (if present) causes excessiveturbulence
Yes or NoNo Auxiliary Water
No
Lock cycle time (reflects design) Yes or No N/A N/A - N/A
Minimum plunge pool depth suitable Yes or NoN/A N/A
-40% of maximum head
differentialEcological Assessment
Fishway type is suitable for species present Yes or No Yes YesFishway hydraulics are suitable for fish species and reflect
contemporary deignYes or No No Yes
Target species are present at both fishway entrance and exit Yes or No Yes 0 YesSize range of target fish species is at minimum target size at
the fishwayYes or No Yes <2 Yes
Target size ranges are present at the entrance and exit offishway
Yes or No Yes <2 Yes
Abundance77 Entrance vs exitabundance
<35% <30 <30%
CommentsPool depth < designed/contemporary design. Pool volume is less than designed/contemporary design. Headloss varies considerably: 0–100% differentfrom design. Entrance location is > 0.5 m from upstream migration limit, while exit location is approximately 26 m up of the downstream migration limit.
77 Warrants further investigation – differences in abundance may be related to seasonal influences and/or sample sizes. Relates to trapping and funnel/screen methods only (i.e. excludes electrofishing)

Guidelines for fish passage at small structures 68
DiscussionThe fishway assessment guidelines tested in this document identified hydraulic anomalies associated withtwo different fishway designs, with outcomes from these anomalies reflected in the ecological assessmentfindings. Such results are a positive step forward for determining the efficiency of Victoria’s fishways and foridentifying areas for improvement.
Barham River fishway
The hydraulics assessment on the Barham River rock ramp fishway identified a number of parameters thathave the potential to adversely affect fish movement. Headloss appeared highly variable throughout thefishway and generally exceeded the minimum 75 mm suggested for contemporary design for small–mediumsized fish. The second, third, and fourth baffle in particular, showed a considerable departure from therecommended maximum headloss, and it indicates that small fish (<50 mm) may have difficulty ascending.
The ecological assessment (both the abundance and presence-absence assessment) complimented thehydraulic results, finding significant length-frequency differences for both fyke netting and mark-recapturecollection methods. The significant length-frequency analysis for fyke netting was largely driven by thepresence of small sized (<60 mm) G. maculatus downstream of the fishway in the December sample, whichwere unable to ascend. However, separation of this data into the two sample periods, December and lateJanuary/early February, reverted the result to a non-significant one. This outcome is likely a reflection of fishcohorts growing to a threshold size for passage as the season progresses.
The length-frequency analysis completed on the mark-recapture method of assessment was also significant.This data was collected in 2016, a year later than the fyke netting data, and was largely driven by thepresence of higher abundances of 60-80 mm sized fish in the downstream sample, compared with theupstream sample. Fish ≤60 mm where present at the exit of the fishway despite the significant result, soecologically, this data indicates that the fishway was functioning for smaller size-classes at the time ofsampling, which was January–February 2016.
In contrast to previous collection methods, data collected via electrofishing (both abundance andpresence/absence methods) was not significant for either the abundance or presence-absencelength/frequency methods. And like the mark-recapture investigation, this data was collected late in the fishmigration season, February/March, when fish cohorts had had a chance to grow out, and were thereforecapable of passing the fishway. These results reinforce the notion that fishway assessments looking todetermine if a fishway is functioning for small size-classes, must sample during the known migratory periodfor the target species, and account for growth of fish cohorts if the sample periods ranges over a largetemporal scale.
Sampling over larger temporal scale has however, demonstrated that the upstream movement of smallersize-classes has been hindered by the hydraulic inefficiencies of the rock-ramp fishway, particularly withreduced water depth and high headloss throughout the fishway. It also demonstrated however, that as thefish cohorts grew, they were able to successfully ascend the fishway albeit after a delay.
Delaying migrating fish suggests that accumulations may be occurring downstream, and although there wereno significant differences between the upstream and downstream abundances there was a trend towardsmore fish being present downstream than upstream. Delaying migrating fish has ecological consequencesgiven that their vulnerability to competition for resources and predation is increased when accumulatingdownstream of a barrier (Baumgartner 2007).
All species were found upstream and downstream of the rock-ramp fishway, with the exception of G.truttaceus, a relatively uncommon species, which was absent from the fyke netting samples (for bothabundance and presence/absence methods), and Australian grayling which was only found in the exitsample but not the entrance. While two native fish species previously recorded from the Barham Riversystem, namely Galaxias brevipinnis and Geotria australis, were absent from the all experimental methods.This result emphasises the importance of sampling over a range of temporal scales, if assessing the fishwayis being assessed for passage of previously recorded species.
Managers wanting to improve the functionality of the Barham River east branch rock-ramp fishway shouldconsider implementing a maintenance schedule to regularly remove debris from the fishway to prevent itfrom adversely affecting passage performance. Removal of sediment build-up near the entrance of thefishway is also recommended. Additional rock-work could also be completed to improve the water depth andheadloss throughout the fishway.

Monitoring the performance of fishways and fish passage works 69
Barwon River vertical slot fishway
The hydraulic assessment completed on the Barwon River fishway identified a number of departures fromdesign, however almost all of the anomalies documented can be attributed to the influence of the tide, andrestrictions placed on the fishway design by stakeholders concerns over draining of the weir pool. The invertof the exit, in particular has been set at 0.45 m, which has resulted in shallowing of the fishway towards theexit. Water depths as low as 0.15 m has been found during low tide, and contemporary design for a fishwaytargeting small-medium sized fish suggests a minimum depth of 0.75 m throughout the fishway. Theinfluence of the entrance and exit inverts levels has also reduced the pool volume and headloss variationranges from 0–100% of design.
Fishway depth, pool volume and headloss are however, all being influenced by the tide. Pool depth exceedsdesign (@116%) during high tide, while pool volume also exceeds design (@116%) during high tide. Depthsand pool volumes larger than planed can generally be considered a positive, except if the fishway is downed-out and hydraulic conditions are adversely affected. High tail water levels caused by high tides reduced theheadloss in the low reaches of the fishway to zero (drown out), as invert of the entrance of the fishway is -0.45 m. Contemporary design of fishways ensures that there is no less than 45 mm of headloss at thefishway entrance for small-bodied fish species, with no more than 75 mm headloss throughout the fishway.However, zero headloss (and drown-out conditions) was evident at high tide. The presence of auxiliarywater during these drown-out periods is a positive addition to the fishway, and will maintain some attractionflows.
The location of the fishway entrance was at the upstream migration limit, however it was at least 3 m fromthe attraction flows from the barrage gates—a strong attraction flow, and this is likely to reduce fishwayattraction efficiency and so fish passage. Similarly, the exit of the fishway was at least 26 m upstream of thedownstream migration limit, making it difficult for downstream migrants to find the movement pathway.
Like the Barham River fishway assessment, the abundance and presence-absence/length frequencymethods of assessment were consistent for the length-frequency. Entrance and exit samples weresignificantly different for both methods, and it is possible that the hydraulic parameters that different fromdesign/contemporary design may have contributed to the significant result. However, the statisticalvariations in size-classes between the entrance and exit samples were not obvious on the length-frequencygraphs, but there was a slightly higher abundance of smaller size-classes (<45 mm) at the entrance, whilethe exit sample had a few large size fish >110 mm. The presence of more small size-classes at the entrancecompared with the exit does not however, indicate that there is a major efficiency problem with the fishway,as small-sized fish are passing through. This result highlights the importance of interpreting the data forecological meaning rather than statistical meaning.
The abundances of G. Maculatus trapped at the entrance and exit of the Barwon River fishway werestatistically similar, with the large variation in abundances between replicates contributing to the result. Thisoutcome indicates that fish are not accumulating downstream at the entrance. However, the abundance ofG. maculatus downstream exceeds the 30% recommended as acceptable in contemporary design. Thisresult however, was only 34% (4% difference), and combined with the non-significant result for abundance, itis not considered a major issue for the fishway. Downstream abundances can change rapidly and areinfluenced by a range of factors including flow, tide, time of day, and season (Baumgartner 2006). Similarly,two species (broad finned galaxiid and short-finned eel) collected at the fishway entrance were absent fromthe fishway exit sample. However, both species were recorded in low abundances at the fishway entrance,therefore their absence from the fishway exit should not be considered an unusual result. Further, thespecies present during the sampling was substantially less than that recorded in historical records (Table 3),however data from this report came from numerous datasets (from the Victorian Biodiversity Atlas) withdifferent aims in the Geelong region (including some marine species since the mid 1900s), rather than beingspecifically from the Barwon breakwater barrage.
ConclusionTesting of the fishway assessment guidelines was applied to two different coastal fishways with promisingresults for the application of the assessment methods. Fishways located on northern flowing systems maynot pass large abundances of fish as observed in coastal systems, particularly medium-large bodied nativefish. Small-bodied species such as Australian Smelt, Unspecked Hardyhead, Carp Gudgeon and FlatheadGudgeon can dominate catches in large numbers, however they may not be the target species. Measuringat least 300 fish for each treatment will help to ensure that appropriate length-frequency analysis can be

70 Guidelines for fish passage at small structures
completed with confidence. While, maximising the amount of the data used in the analysis is paramount fora successful outcome.
This document outlines the results of a set of standardised assessment methods aimed at improvingoutcomes for Victoria’s fishways. The methods take into account ecological and hydraulic aspects of thefishway assessment and target a range of fishway types. The methods developed and tested during thisinvestigation have identified ecological and hydraulic anomalies of underperforming fishways. Havingaccess to assessment methods/guidelines will allow mangers of waterways to have confidence in themethods being used to assess fishway performance. The assessment methods will also allow comparisonsagainst contemporary design, in addition to identifying parameters where fishway performance can beimproved.

Monitoring the performance of fishways and fish passage works 71
Aarestrup, K., Lucas, M.C. & Hansen, J.A. 2003. Efficiency of a nature-like bypass channel for sea trout(Salmo trutta) ascending a small Danish stream studied by PIT telemetry. Ecology of Freshwater Fish 12:160-168.
Adams, N.S., Rondorf, D.W., Evans, S.D., Kelly, J.E. & Perry, R.W. 1998. Effects of surgically and gastricallyimplanted radio transmitters on swimming performance and predator avoidance of juvenile Chinook salmon(Oncorhynchus tshawytscha). Canadian Journal of Fisheries and Aquatic Sciences 55: 781-787.
Barrett, J. 2004. Introducing the Murray-Darling Basin Native Fish Strategy and initial steps towardsdemonstration reaches. Ecological Management & Restoration 5: 15-23.
Barrett, J. & Lintermans, M. 2008. The Sea to Lake Hume: Restoring fish passage in the Murray River.Canberra: Murray-Darling Basin Commission, Canberra.
Barrett, J. & Mallen-Cooper, M. 2006. The Murray River's 'Sea to Hume Dam' fish passage program:Progress to date and lessons learned. Ecological Management and Restoration 7: 173-183.
Barry, T. & Kynard, B. 1986. Attraction of adult American shad to fish lifts at Holyoke Dam, ConnecticutRiver. North American Journal of Fisheries Management 6: 233-241.
Baumgartner, L., Zampatti, B., Jones, M., Stuart, I. & Mallen-Cooper, M. 2014. Fish passage in the Murray-Darling Basin, Australia: Not just an upstream battle. Ecological Management & Restoration 15: 28-39.
Baumgartner, L.J. 2006. Population estimation methods to quantify temporal variation in fish accumulationsdownstream of a weir. Fisheries Management and Ecology 13: 355-364.
Baumgartner, L.J. 2007. Diet and feeding habits of predatory fishes upstream and downstream of a low-levelweir. Journal of Fish Biology 70: 879-894.
Baumgartner, L.J., Bettanin, M., McPherson, J., Jones, M., Zampatti, B. & Beyer, K. 2012a. Influence ofturbidity and passage rate on the efficiency of an infrared counter to enumerate and measure riverine fish.Journal of applied Ichthyology 28: 531-536.
Baumgartner, L.J., Boys, C.A., Stuart, I.G. & Zampatti, B.P. 2010. Evaluating migratory fish behaviour andfishway performance: testing a combined assessment methodology. Australian Journal of Zoology 58: 154-164.
Baumgartner, L.J., Marsden, T., Singhanouvong, D., Phonekhampheng, O., Stuart, I.G. & Thorncraft, G.2012b. Using an experimental in situ fishway to provide key design criteria for lateral fish passage in tropicalrivers: a case study from the Mekong River, central Lao PDR. River Research and Applications 28: 1217-1229.
Baumgartner, L.J., Reynoldson, N., Cameron, L. & Stanger, J. 2006. Assessment of Dual-frequencyIdentification Sonar (DIDSON) for application in fish migration studies. No. 84. New South WalesDepartment of Primary Industries, Narrandera, 33 pp.
Beatty, S.J., Morgan, D.L. & Torre, A. 2007. Restoring ecological connectivity in the Margaret River: WesternAustralia's first rock-ramp fishways. Ecological Management & Restoration 8: 224-228.
Bedford, B.L. 1999. Cumulative effects on wetland landscapes: Links to wetland restoration in the UnitedStates and southern Canada. Wetlands 19: 775-788.
Berghuis, A.P. 2008. Performance of a single frequency split-beam hydroacoustic system: an innovative fishcounting technology. No. 177. Heidelberg, Victoria, Australia: Arthur Rylah Institute for EnvironmentalResearch, Department of Sustainability and Environment, 19 pp.
Bridger, C.J. & Booth, R.K. 2003. The effects of biotelemetry transmitter presence and attachmentprocedures on fish physiology and behaviour. Reviews in Fisheries Science 11: 13-34.
Bryant, M.D., Frenette, B.J. & McCurdy, S.J. 1999. Colonization of a watershed by anadromous salmonidsfollowing the Installation of a fish ladder in Margaret Creek, southeast Alaska. North American Journal ofFisheries Management 19: 1129-1136.
Bunt, C.M., Katopodis, C. & McKinley, R.S. 1999. Attraction and passage efficiency of white suckers andsmallmouth bass by two Denil fishways. North American Journal of Fisheries Management 19: 793-803.
References

72 Guidelines for fish passage at small structures
Calles, E.O. & Greenberg, L.A. 2007. The use of two nature-like fishways by some fish species in theSwedish River Emån. Ecology of Freshwater Fish 16: 183-190.
Clay, C.H. 1995. Design of Fishways and Other Fish Facilities. Boca Raton, Florida: Lewis Publishers. 248pp.
Conte, F.S. 2004. Stress and the welfare of cultured fish. Applied Animal Behaviour Science 86: 205-223.
Crook, D.A., Koster, W.M., Macdonald, J.I., Nicol, S.J., Belcher, C.A., Dawson, D.R., O'Mahony, D.J., Lovett,D., Walker, A. & Bannam, L. 2010. Catadromous migrations by female tupong (Pseudaphritis urvillii) incoastal streams in Victoria, Australia. Marine and Freshwater Research 61: 474-483.
Crook, D.A., Macdonald, J.I., O'Connor, J.P. & Barry, B. 2006. Use of otolith chemistry to examine patternsof diadromy in the threatened Australian grayling Prototroctes maraena. Journal of Fish Biology 69: 1330-1344.
Crook, D.A., O’Mahony, D., Sanger, A.C., Munro, A.R., Gillanders, B.M. & Thurstan, S. 2009. Developmentand evaluation of methods for osmotic induction marking of golden perch (Macquaria ambigua) with calceinand alizarin red S. North American Journal of Fisheries Management 29: 279-287.
Croze, O., Bau, F. & Delmouly, L. 2008. Efficiency of a fish lift for returning Atlantic salmon at a large-scalehydroelectric complex in France. Fisheries Management and Ecology 15: 467-476.
Dolan, C.R. & Miranda, L.E. 2003. Immobilization thresholds of electrofishing relative to fish size.Transactions of the American Fisheries Society 132: 969-976.
Eiler, J.H. 1995. A remote satellite-linked tracking system for studying Pacific salmon with radio telemetry.Transactions of the American Fisheries Society 124: 184-193.
Franklin, A.E., Haro, A., Castro-Santos, T. & Noreika, J. 2012. Evaluation of nature-like and technicalfishways for the passage of alewives at two coastal streams in New England. Transactions of the AmericanFisheries Society 141: 624-637.
Gehrke, P.C., Brown, P., Schiller, C.B., Moffatt, D.B. & Bruce, A.M. 1995. River regulation and fishcommunities in the Murray-Darling river system, Australia. Regulated Rivers: Research & Management 11:363-375.
Hindell, J.S., Stuart, I. & Jones, M. 2008. Assessment and recommendations on restoring fish passageacross the Lower Breakwater Tidal Barrage of the Barwon River.: Arthur Rylah Institute for EnvironmentalResearch, 24 pp.
Jones, M. 2009. Fish movements and the impacts of regulators in the Barmah-Millewa Forest. PhD thesis.Melbourne: La Trobe University, Melbourne. 145 pp.
Jones, M.J. & Stuart, I.G. 2008. Regulated floodplains - a trap for unwary fish. Fisheries Management andEcology 15: 71-79.
Jones, M.J. & Stuart, I.G. 2009. Lateral movement of common carp (Cyprinus carpio L.) in a large lowlandriver and floodplain. Ecology of Freshwater Fish 18: 72-82.
Katano, O., Nakamura, T., Abe, S., Yamamoto, S. & Baba, Y. 2006. Comparison of fish communitiesbetween above- and below-dam sections of small streams; barrier effect to diadromous fishes. Journal ofFish Biology 68: 767-782.
Koehn, J.D., McKenzie, J.A., O’Mahony, D.J., Nicol, S.J., O’Connor, J.P. & O’Connor, W.G. 2009.Movements of Murray cod (Maccullochella peelii peelii) in a large Australian lowland river. Ecology ofFreshwater Fish 18: 594-602.
Litvan, M.E., Pierce, C.L., Stewart, T.W. & Larson, C.J. 2008. Fish Passage in a Western Iowa StreamModified by Grade Control Structures. North American Journal of Fisheries Management 28: 1384-1397.
Llewellyn, L.C. 1968. Tagging gives answers to fish growth queries. The Fisherman 3: 1-5.
Lucas, M.C. 1989. Effects of implanted dummy transmitters on mortality, growth and tissue reaction inrainbow trout, Salmo gairdneri Richardson. Journal of Fish Biology 35: 577-587.
Maheshwari, B.L., Walker, K.F. & McMahon, T.A. 1995. Effects of regulation on the flow regime of the riverMurray, Australia. Regulated Rivers: Research & Management 10: 15-38.
Mallen-Cooper, M. & Brand, D.A. 2007. Non-salmonids in a salmonid fishway: what do 50 years of data tellus about past and future fish passage? Fisheries Management and Ecology 14: 319-332.

Monitoring the performance of fishways and fish passage works 73
McGill, D.A. 2001. Fairmont weir rock-ramp fishway assessment. Third Australian Technical Workshop onFishways. Sunshine Coast: Monash University, 63-75 pp.
Neeson, T.M., Ferris, M.C., Diebel, M.W., Doran, P.J., O’Hanley, J.R. & McIntyre, P.B. 2015. Enhancingecosystem restoration efficiency through spatial and temporal coordination. Proceedings of the NationalAcademy of Sciences 112: 6236-6241.
O'Brien, T. 1997. Rock Fishways in Victoria. Second National Fishway Technical Workshop. Rockhampton:Queensland Department of Primary Industries, 193-202 pp.
O'Brien, T., Ryan, T.J., Stuart, I. & Saddlier, S. 2010. Review of fishways in Victoria 1996-2009. No. 216.Heidelberg, Victoria: Arthur Rylah Institute for Environmental Research, 35 pp.
O'Connor, J.P., Jones, M. & Pickworth, A. 2015a. Assessment of the Dights Falls fishway complex.Unpublished report, Arthur Rylah Institute for Environmental Research. Department of Environment, Land,Water and Planning, Heidelberg, 49 pp.
O’Connor, J., Mallen-Cooper, M. and Stuart, I. 2015b. Performance, operation and maintenance guidelinesfor fishways and fish passage works. Arthur Rylah Institute for Environmental Research Technical ReportNo. 262 for the Water and Catchments Group, Department of Environment, Land, Water and Planning.Arthur Rylah Institute for Environmental Research, Department of Environment, Land, Water and Planning,Heidelberg, Victoria.
O'Connor, J.P., O'Mahony, D.J. & O'Mahony, J.M. 2005. Movements of Macquaria ambigua, in the MurrayRiver, south eastern Australia. Journal of Fish Biology 66: 392-403.
O’Connor, J., Stuart, I. and Jones, M. 2017. Guidelines for the design, approval and construction of fishways.Arthur Rylah Institute for Environmental Research. Technical Report Series No. 274. Department ofEnvironment, Land, Water and Planning, Heidelberg, Victoria.
Reynolds, L.F. 1983. Migration patterns of five fish species in the Murray-Darling River system. Marine andFreshwater Research 34: 857-871.
Santos, J.M., Ferreira, M.T., Godinho, F.N. & Bochechas, J. 2002. Performance of fish lift recently built at theTouvedo Dam on the Lima River, Portugal. Journal of applied Ichthyology 18: 118-123.
Santos, J.M., Ferreira, M.T., Godinho, F.N. & Bochechas, J. 2005. Efficacy of a nature-like bypass channel ina Portuguese lowland river. Journal of applied Ichthyology 21: 381-388.
Schmetterling, D.A., Pierce, R.W. & Liermann, B.W. 2002. Efficacy of three Denil fish ladders for low-flowfish passage in two tributaries to the Blackfoot River, Montana. North American Journal of FisheriesManagement 22: 929-933.
Schmutz, S., Giefing, C. & Wiesner, C. 1998. The efficiency of a nature-like bypass channel for pike-perch(Stizostedion lucioperca) in the Marchfeldkanal system. Hydrobiologia 371-372: 355-360.
Schwalme, K., Mackay, W.C. & Lindner, D. 1985. Suitability of vertical slot and Denil fishways for passingnorth-temperate, non-salmonid fish. Canadian Journal of Fisheries and Aquatic Sciences 42: 1815-1822.
Sprankle, K. 2005. Interdam movements and passage attraction of American shad in the lower MerrimackRiver main stem. North American Journal of Fisheries Management 25: 1456-1466.
Stuart, I.G. & Berghuis, A.P. 2002. Upstream passage of fish through a vertical-slot fishway in an Australiansubtropical river. Fisheries Management and Ecology 9: 111-122.
Stuart, I.G., Berghuis, A.P., Long, P.E. & Mallen-Cooper, M. 2007. Do fish locks have potential in tropicalrivers? River Research and Applications 23: 269-286.
Stuart, I.G., Koehn, J.D., O'Brien, T.A., McKenzie, J.A. & Quinn, G.P. 2010. Too close for comfort: a fishwayexit and a hydro-power station inlet. Marine and Freshwater Research 61: 23-33.
Stuart, I.G. & Mallen-Cooper, M. 1999. An assessment of the effectiveness of a vertical-slot fishway for non-salmonid fish at a tidal barrier on a large tropical/subtropical river. Regulated Rivers: Research &Management 15: 575-590.
Stuart, I.G., Zampatti, B.P. & Baumgartner, L.J. 2008. Can a low-gradient vertical-slot fishway providepassage for a lowland river fish community? Marine and Freshwater Research 59: 332-346.
Summerfelt, R.C. & Mosier, D. 1984. Transintestinal expulsion of surgically implanted dummy transmitters bychannel catfish. Transactions of the American Fisheries Society 113: 760-766.

74 Guidelines for fish passage at small structures
Thiem, J.D., Binder, T.R., Dumont, P., Hatin, D., Hatry, C., Katopodis, C., Stamplecoskie, K.M. & Cooke, S.J.2013. Multispecies fish passage behaviour in a vertical slot fishway on the Richeliew River, Quebec,Canada. River Research and Applications 29: 582-592.
Thorncraft, G. & Harris, J.H. 1997. Rock-ramp and lock fishways as tools for solving fish passage problemsin New South Wales, Australia. Second National Fishway Technical Workshop. Rockhampton: QueenslandDepartment of Primary Industries, 203-215 pp.
Ward, D.L., Childs, M.R. & Persons, W.R. 2008. PIT tag retention and tag induced mortality in juvenilebonytail and Gila chub. Fisheries Management and Ecology 15: 159-161.
Wedemeyer, G.A. 1976. Physiological response of juvenile coho salmon (Oncorhynchus kisutch) andrainbow trout (Salmo gairdneri) to handling and crowding stress in intensive fish culture. Journal of theFisheries Research Board of Canada 33: 2699-2702.
Wilson, C.A., Beckman, D.W. & Dean, J.M. 1987. Calcein as a fluorescent marker of otoliths of larval andjuvenile fish. Transactions of the American Fisheries Society 116: 668-670.
Zampatti, B. & Bice, C. 2014. Assessment of a high gradient vertical slot fishway and an automated fishlockat Lock 3 for providing passage of whole fish community. Unpublished report, South Australian Researchand Development Institute, Adelaide, Australia, pp. 178-193.

ari.vic.gov.au