monitoring the organic matter quality highlights the ways
TRANSCRIPT
HAL Id: insu-03169242https://hal-insu.archives-ouvertes.fr/insu-03169242
Submitted on 15 Mar 2021
HAL is a multi-disciplinary open accessarchive for the deposit and dissemination of sci-entific research documents, whether they are pub-lished or not. The documents may come fromteaching and research institutions in France orabroad, or from public or private research centers.
L’archive ouverte pluridisciplinaire HAL, estdestinée au dépôt et à la diffusion de documentsscientifiques de niveau recherche, publiés ou non,émanant des établissements d’enseignement et derecherche français ou étrangers, des laboratoirespublics ou privés.
Distributed under a Creative Commons Attribution| 4.0 International License
Monitoring the Organic Matter Quality Highlights theWays in Which Organic Matter Is Removed from
Wetland SoilAnne-Catherine Pierson-Wickmann, Mélanie Davranche, Julien Kerloc’H,
Charlotte Catrouillet, Elaheh Lotfi-Kalahroodi
To cite this version:Anne-Catherine Pierson-Wickmann, Mélanie Davranche, Julien Kerloc’H, Charlotte Catrouillet, Ela-heh Lotfi-Kalahroodi. Monitoring the Organic Matter Quality Highlights the Ways in Which OrganicMatter Is Removed from Wetland Soil. Geosciences, MDPI, 2021, 11 (3), pp.134. 10.3390/geo-sciences11030134. insu-03169242
geosciences
Article
Monitoring the Organic Matter Quality Highlights the Ways inWhich Organic Matter Is Removed from Wetland Soil
Anne-Catherine Pierson-Wickmann 1,* , Mélanie Davranche 1, Julien Kerloc’h 1, Charlotte Catrouillet 1
and Elaheh Lotfi-Kalahroodi 1,2
Citation: Pierson-Wickmann, A.-C.;
Davranche, M.; Kerloc’h, J.;
Catrouillet, C.; Lotfi-Kalahroodi, E.
Monitoring the Organic Matter
Quality Highlights the Ways in
Which Organic Matter Is Removed
from Wetland Soil. Geosciences 2021,
11, 134. https://doi.org/
10.3390/geosciences11030134
Academic Editors:
Malgorzata Grybos and
Jesus Martinez-Frias
Received: 18 November 2020
Accepted: 9 March 2021
Published: 13 March 2021
Publisher’s Note: MDPI stays neutral
with regard to jurisdictional claims in
published maps and institutional affil-
iations.
Copyright: © 2021 by the authors.
Licensee MDPI, Basel, Switzerland.
This article is an open access article
distributed under the terms and
conditions of the Creative Commons
Attribution (CC BY) license (https://
creativecommons.org/licenses/by/
4.0/).
1 University Rennes, CNRS, Géosciences Rennes—UMR 6118, F-35000 Rennes, France;[email protected] (M.D.); [email protected] (J.K.);[email protected] (C.C.); [email protected] (E.L.-K.)
2 Institut des Sciences Analytiques et de Physico-Chimie pour l’Environnement et les Matériaux, IPREM,UMR 5254, CNRS-Université de Pau et des Pays de l’Adour, 2 Avenue P. Angot—Technopôle Hélioparc,64000 Pau, France
* Correspondence: [email protected]; Tel.: +33-(0)223233227
Abstract: It has long been considered that ferric phases stabilize organic matter (OM) in soils.Temporarily waterlogged soils, in which Fe is submitted to regular reductive solubilization andoxidizing precipitation, have often been used to study these processes. However, few studieshave been interested in the evolution of the OM quality under such conditions. We thereforeexperimentally investigated the impact of a redox cycle on the quality of the dissolved organic matter(DOM) from wetland soil. The DOM quality was monitored using a combination of analyses runon the elements (%C, %N, C/N), isotopes (δ15N, δ13C), optical index (specific UV absorbance at254 nm), and fluorescence indexes (FI, HIX, BIX). In addition, the cation and anion concentrationswere also determined in the soil solutions throughout the experiment. As classically demonstrated,OM is solubilized as terrestrial aromatic molecules in the first stage of the reducing period, andthen as nonaromatic molecules until the end of the reduction, in response to the dissimilatoryreductive dissolution of Fe-oxyhydroxides in the soil. More interestingly, we demonstrate that thereintroduction of O2 involves significant lysis of reducing bacterial cells involving the production ofsmall labile organic carbon which represents a significant pathway for OM degradation. Moreover, inresponse to the physical constraints, the newly formed Fe-OM precipitates produce small aggregatesrich in aromatic OM that are expected to disseminate in the environment, representing a secondsignificant way to remove OM.
Keywords: wetland; redox fluctuations; carbon isotopic composition
1. Introduction
The organic matter (OM) cycle cannot be dissociated from that of Fe in differentenvironmental systems such as soils, sediments, surface waters and permafrosts (in re-sponse to thawing), or peatlands and wetlands. Several studies have demonstrated thatthe stabilization of OM is related to the presence of ferric species [1–3]. More specifically inwetlands, ferric species enhance the biodecomposition of natural organic matter (NOM) byacting as terminal acceptor electrons during soil waterlogging periods. In contrast, in re-sponse to the water level decrease in wetland soils, in the presence of high amounts of OM,Fe(III) precipitates with DOM, forming aggregates of Fe and OM nanoparticles expected tostabilize OM [4]. Herndon et al. [5] showed that, by complexing low-molecular-weight OM,i.e., the most labile and bioavailable carbon, ferric species inhibit the microbial degradationof OM. Through 14C analysis, Hall et al. [6] demonstrated that the C residence time inhumid soil is positively correlated with the crystallinity of the Fe(III) oxyhydroxides. Chenet al. [7] also demonstrated that the alternation of redox conditions results in decreased Cdegradation and increased crystallinity of the ferric species. They suggest that repeated
Geosciences 2021, 11, 134. https://doi.org/10.3390/geosciences11030134 https://www.mdpi.com/journal/geosciences
Geosciences 2021, 11, 134 2 of 14
redox cycles induce the loss of dissolved organic matter (DOM), which is coprecipitatedas Fe-OM aggregates, but that part of the DOM bound to Fe-minerals is preserved fromthe degradation involved via the reducing conditions. However, many of these processesdepend on the variations in the quality and composition of the OM water during theredox cycles. Organic matter coating and binding processes with minerals depend on theirbinding sites, site density, molecular weight, and/or physicochemical structure (molecularvs. colloidal). However, in many studies dedicated to the impact of redox variations on OMdegradation, DOM is considered whole and is only monitored by measuring the dissolvedorganic carbon (DOC) concentration. However, all of these processes are theoreticallyaccompanied by transformations of the DOM quality and source variations.
Despite our understanding of the impact of the Fe cycle on DOM degradation orprotection, few data are available on the variation in DOM quality within a redox cycle.The whole DOM quality and source variations can be specifically followed and studiedusing simple spectroscopic methods (UV–Vis absorbance, 3D fluorescence) and the C andN isotopic composition (δ13C and δ15N) [8–10]. For this purpose, we performed a seriesof successive reduction/oxidation incubations using natural wetland soil. The C and Nisotopic compositions were measured over time and combined with measurements of theDOM quality evolution with time and redox-alternating conditions. Element solutionchemistry and thermodynamic modeling approach were also used.
2. Materials and Methods
All of the chemicals used were of analytical grade. The solutions were prepared withdeionized water (Milli-Q system, Millipore). The containers used were (i) soaked in 10%ultrapure HNO3 for 48 h at 60 C to remove all possible contaminant sources, (ii) soaked inand then rinsed with Milli-Q water for 24 h at 60 C, and (iii) finally dried at 30 C.
2.1. Soil Sampling and Soil Characteristics
The soil sample was collected in a riparian wetland, the so-called Mercy wetland,located in the Kervidy-Naizin catchment (Brittany, north-western France), belonging tothe French network of long-term Environmental Research Observatories (ORE Agrhys).Numerous hydrological and biogeochemical studies [11–14] provided good informationabout the water sources and pathways throughout the hydrological periods.
The Mercy wetland regularly undergoes periodic fluctuations in the water level,leading to the establishment of redox cycles involving Fe [12,13,15–17].
The soil sample corresponds to an aliquot of the upper organo-mineral horizon (Ah)from a Planosol (according to the WRB classification), developed on Proterozoic schists.This schist is mainly composed of quartz, muscovite, chlorite, K-Felspar, and plagio-clase [18]. The soil horizons comprise a large number of secondary minerals, includingillite, smectite, kaolinite, various Fe-oxyhydroxides, such as hematite and goethite, andMn oxides [11].
The soil sample was collected in February 2013 during the water table rise. The soilwas air-dried for five days and sieved to 2 mm [19].
2.2. Experimental Setup
The experimental procedure was based on a two-stage experiment using a soil sus-pension, settled under reducing and then under oxidizing conditions. The soil suspensionwas prepared at a 1:20 ratio of dry soil/solution by mixing 50 g of soil with a solutioncontaining 30 mg L−1 of Cl−, 30 mg L−1 of NO3
−, and 10 mg L−1 of SO42− to mimic
the anion composition of the soil solution in the Mercy wetland during the rise of thewater table.
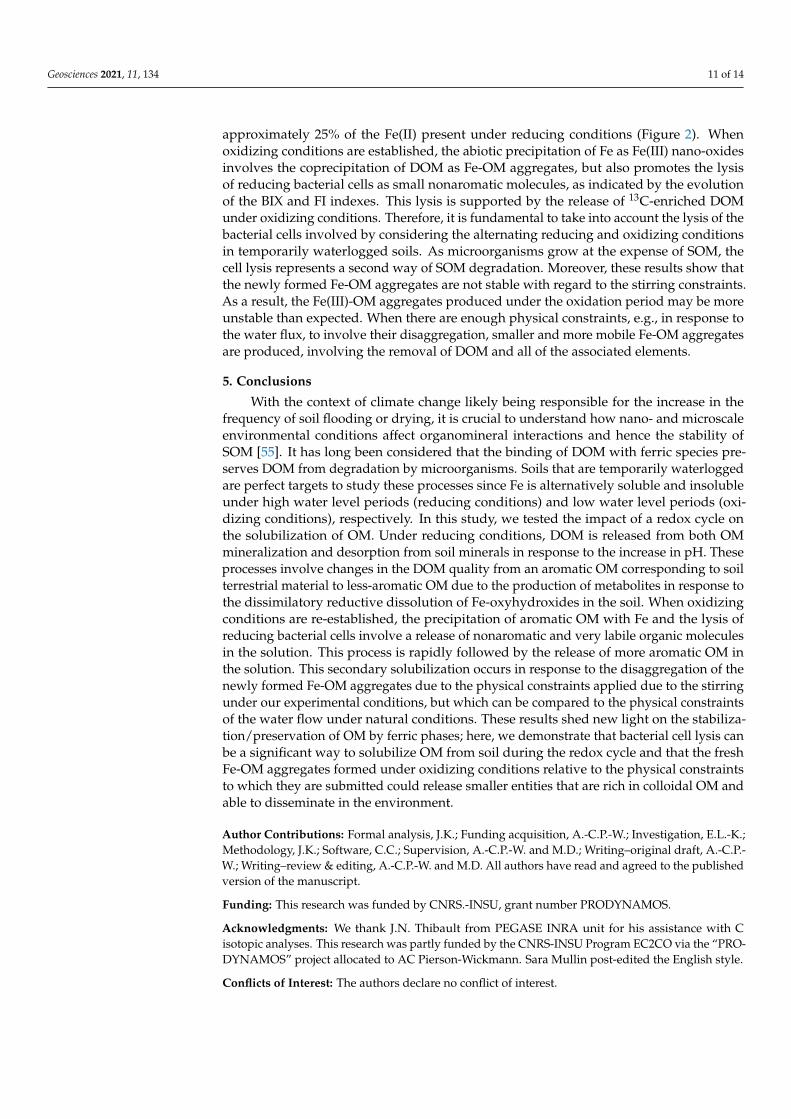
The suspension was placed in an air-tight, 1 L batch reactor (Guerin, Biolafite) at30 C (Figure A1 of Appendix A). Prior to the start of the experiment, the soil suspensionwas gently stirred under aerobic conditions for the first two days until the pH and DOCconcentrations stabilized. The suspension was continuously and gently stirred, with a
Geosciences 2021, 11, 134 3 of 14
stream of N2 continuously supplied via an autogas injection system at 2 L min−1 for thefirst 5 h and then at 0.2 L min−1. The Eh and pH of the suspension were monitored withcombination electrodes (405-DPAS-SC-K8S/225 Mettler Toledo (Greifensee, Switzerland)for the pH and Pt4805-DPAS-SC-K8S/225 Mettler Toledo (Greifensee, Switzerland) forthe Eh). Approximately 30 mL of the soil suspension was drawn off daily with a sterilesyringe (under N2 gas in the anaerobic treatments), centrifuged for 10 min at 1950 g, anddirectly filtered through a 0.2 µm cellulose acetate membrane filter (Millipore, Burlington,MA, USA). The experiments were carried out in duplicate, and the errors bars reportedin each figure represent the analysis standard errors. On the collected soil solutions, theDOC, Fe(II), cation, and anion concentrations were determined, as well as the SUVA and3D fluorescence of the soil solutions and δ13C and δ15N values for both the soil solutions.
2.3. Analytical Procedures2.3.1. Elemental Concentrations
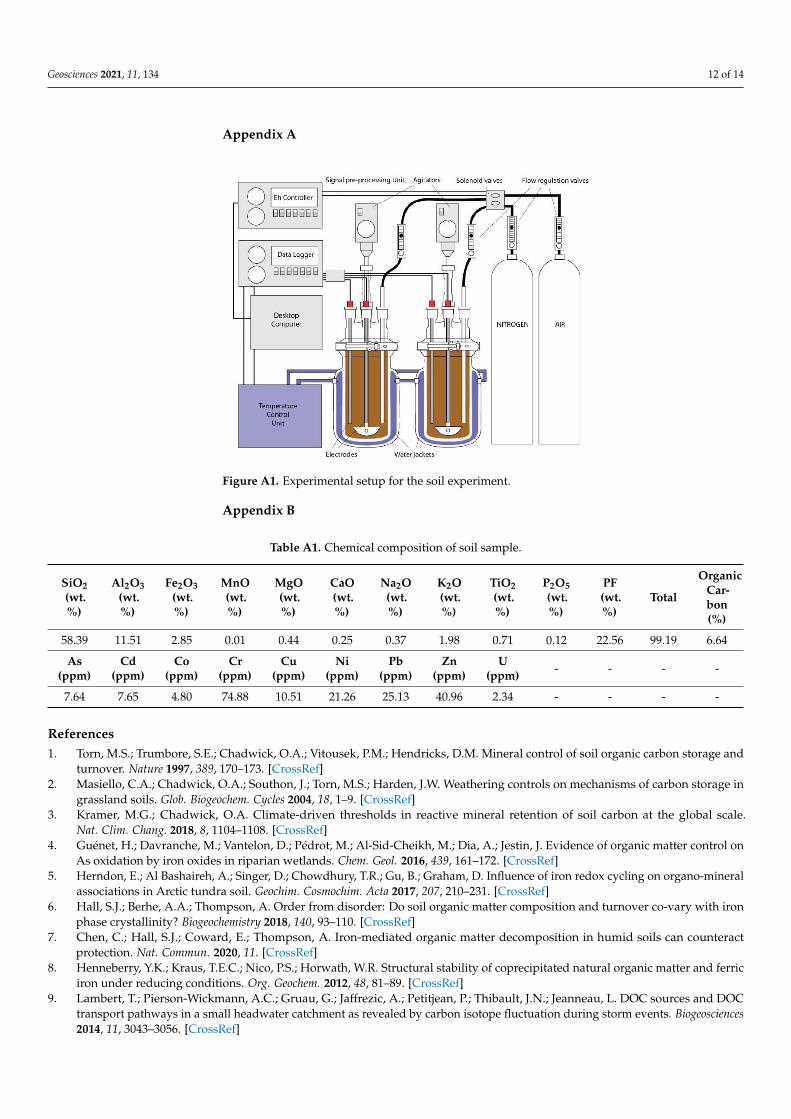
After fusion of the whole-rock sample with LiBO2 flux and acidic dissolution withHNO3, the major and trace element composition was determined at the CNRS AnalyticalResearch Facility (SARM, CNRS, France) by ICP-OES and ICP-MS (Table A1 of Appendix B).The soil organic carbon content was determined using a carbon-sulfur analyzer (Leco SC144DRPC) (Table A1). The soil sample contained 1.40 wt % of Fe and 6.64 wt % of organiccarbon.
For the soil solutions, the major and trace element concentrations were determinedusing an Agilent Technologies HP 7100 inductively coupled plasma–mass spectrometry(ICP-MS) system in the Geosciences Laboratory at Rennes University (Rennes, France).Briefly, each soil solution was acid-digested two times with 14 N HNO3 at 90 C in a cleanSavillex® (Eden Prairie, MN, USA) digestion vessel and evaporated to complete dryness.In the case of a high DOC concentration, 20 drops of ultrapure hydrogen peroxide (H2O2,of ultrapure grade) were added to the samples in order to ensure the total oxidation ofthe organic matter, and then the vessel was closed and heated on a hot plate (80 C) for24 h. Afterwards, the solution was evaporated. The samples were then dissolved in 0.37 NHNO3 and analyzed. International geostandard SLRS-4 (riverine water reference) was usedto check the validity and reproducibility of the analyses. The typical rates of uncertainty(including all error sources) are <5% for all of the trace elements, whereas for major anions,the uncertainty lies between 2% and 5%, depending on the concentration levels.
The dissolved organic carbon (DOC) and dissolved inorganic carbon (DIC) concen-trations of the soil solutions were analyzed with a Total Organic Carbon (TOC) analyzer(Shimadzu TOC-V-CSH). The accuracy of the DOC measurements was estimated at ±5%for all of the samples using a standard solution of potassium hydrogen phthalate. Ionchromatography measurements were performed on a Dionex DX-120 system. Respec-tively, the detection and quantification limits are 0.27 and 0.89 mg L−1 for NO3
−, 0.32and 1.06 mg L−1 for Cl−, and 0.38 and 1.25 mg L−1 for SO4
2−, with an estimated accuracyof ±5%.
The concentrations of Fe(II) in the soil solutions were determined with the 1.10 phenan-throline colorimetric method (AFNOR NF T90-017 (AFNOR, 1997)) at 510 nm using a UV–Vis spectrophotometer (UVIKON XS, Bio-Tek Instruments, Saint Quentin Yvelines, France).
2.3.2. Stable Carbon and Nitrogen Isotopic Compositions
The carbon and nitrogen isotopic compositions of the soil solutions (δ13Csolution,δ15Nsolution) and soil (δ13Csoil, δ15Nsoil) values were determined at the Stable Isotope Labo-ratory of the PEGASE Joint Research Unit of the INRA in Saint-Gilles, France. Each soilsolution aliquot was filtrated through a previously washed 0.2 µm acetate filter and thenacidified by adding 1 mL of 1 N HCl to remove all traces of inorganic carbon. The solutionsamples were then frozen and freeze-dried before analysis. Each soil sample was alsoacidified by adding 1 N HCl and then rinsed with Milli-Q water in order to remove anytrace of inorganic carbon. Each soil sample was frozen and freeze-dried before analysis.
Geosciences 2021, 11, 134 4 of 14
The δ13C and δ15N of both soil and soil solutions were determined using an elementalanalyzer (Vario Micro Cube, Elementar) interfaced with an isotope ratio mass spectrometer(IRMS) (VG Isoprime). Tin capsules were used for sample loading. The δ13C or δ15N valuesare expressed as relative to the international standard Vienna Pee Dee Belemnite (V-PDB)or atmospheric N2, as follows:
δ13C or δ15N (‰) = [(Rsample/Rstandard) − 1] × 1000 (1)
where Rstandard and Rsample are the ratios of 13C/12C or 15N/14N in the standard and sam-ple.
International standards were also measured for the analysis period: (i) USGS 24(δ13C = −16.0 ± 0.1‰ (n = 8)), (ii) ANU sucrose (δ13C = −10.5 ± 0.1‰ (n = 8)), (iii) Glu-tamine (δ13C = −14.5 ± 0.1‰; δ15N = 0.9 ± 0.1‰ (n = 8)), (iv) urea (δ13C − 38.1 ± 0.1‰;δ15N = 0.0 ± 0.1‰ (n = 8)), and (v) Glutamic acid (δ13C = −27.6 ± 0.1‰; δ15N = 3.8 ± 0.1‰(n = 8)). The accuracy of the measured δ13C values is better than ±0.2‰, based on repeatedmeasurements of the samples and standards.
2.3.3. Spectroscopic Analyses
The dissolved organic matter was characterized using UV–Vis absorbance and fluo-rescence. The absorption spectra (UV–Vis) of the soil solutions were determined with aPerkin-Elmer Lambda 20 spectrophotometer in a 1 cm quartz cuvette, with a wavelengthranging from 200 to 600 nm with 0.5 nm increments. The specific UV absorbance measuredat 254 nm (SUVA) characterizes the absorption in the mass units following this equation:SUVA (L mgC−1 m−1) = A254 (m−1)/[DOC] (mgC L−1). SUVA is often used as a proxyfor DOM aromaticity (aromaticity = 6.52 SUVA + 3.63) [20]. The absorption propertiesmeasured at 280 and 287 nm are correlated with both the apparent molecular weight andaromaticity of the aquatic natural organic matter [21,22]. Distilled water was used as ablank. Possible interference due to Fe(III) absorbance at A254 nm was taken into account(<5%) based on repeated measurements of the soil water extracts with variable levels ofFe(III) enrichment, and the SUVA values were corrected for the presence of iron.
All of the soil solutions were analyzed using a Perkin-Elmer LS 55 spectrofluorometerin a 10 mm quartz cuvette. The soil solutions were diluted with deionized water until A254was below 0.10 to minimize the inner filter effect [23] and were subsequently analyzedusing a 3D-fluorescence excitation–emission matrix (3D-FEEM). The three-dimensionalexcitation–emission fluorescence spectra were obtained by collecting individual emissionspectra (250–600 nm) over a range of excitation wavelengths (200–420 nm), with a 0.5 nmincrement and a scan speed of 1500 nm min−1, and then by merging the data together intoa single three-dimensional data file. Instrument stability was determined using the Ramanpeak of deionized water excited at 350 nm, with the emission monitored at 395 nm assuggested by Lawaetz and Stedmon [24]. Raman scattering was mitigated by subtracting ablank EEM spectrum collected on deionized (18.2 MΩ) water from each corrected EEM.The FI, BIX, and HIX values were determined using data from the corrected EEM spectra.
2.4. Speciation Modeling
Modeling calculations were performed with PHREEQC/Model VI [25]. The modelwas used to calculate the speciation (saturation index, redox, sorption, etc.) in organic-richsolutions. This model assumes that the complexation of ions by humic substances occursthrough eight discrete sites: four weak sites (carboxylic groups) and four strong sites(phenolic groups). The “minteq.v4” database was completed by both (i) the solubilityconstants of the reduced soil phases that were possibly encountered in this soil from [26],such as green rusts (GR1(Cl−) with log K = 28.3; GR2(SO4
2−) with log K = 3.9) and hydroxyl-green rusts (hydroGR2 with log K = 25.4), and (ii) model VI specific binding parameterscorresponding to the complexation of Ca, Mg, Al(III), Fe(II), and Fe(III) with the organicmatter. Specific binding parameters for Ca and Mg are from Tipping [27], those for Al(III)and Fe(III) are from Marsac et al. [28], and those for Fe(II) are from Catrouillet et al. [29].

Geosciences 2021, 11, 134 5 of 14
The speciation was calculated from the chemical composition of the experimental soilsolutions at each sampling point.
3. Results3.1. Evolution of the Soil Solution Chemistry
The evolution of the elemental composition of the wetland soil with the anoxicand oxic periods is consistent with the establishment of reducing and oxidizing con-ditions [12,30–32].
During the reducing period (0–497 h), pH increased from 6.3 ± 0.2 to 7.5 ± 0.3 inresponse to the consumption of H+ by the reduction reactions. The Eh progressively de-creased from 519 to −8.2 mV, reflecting the establishment of moderate reducing conditions(Figure 1a).
Geosciences 2021, 11, x FOR PEER REVIEW 5 of 14
such as green rusts (GR1(Cl−) with log K = 28.3; GR2(SO42−) with log K = 3.9) and hydroxyl-
green rusts (hydroGR2 with log K = 25.4), and (ii) model VI specific binding parameters
corresponding to the complexation of Ca, Mg, Al(III), Fe(II), and Fe(III) with the organic
matter. Specific binding parameters for Ca and Mg are from Tipping [27], those for Al(III)
and Fe(III) are from Marsac et al. [28], and those for Fe(II) are from Catrouillet et al. [29].
The speciation was calculated from the chemical composition of the experimental soil so-
lutions at each sampling point.
3. Results
3.1. Evolution of the Soil Solution Chemistry
The evolution of the elemental composition of the wetland soil with the anoxic and
oxic periods is consistent with the establishment of reducing and oxidizing conditions
[12,30–32].
During the reducing period (0–497 h), pH increased from 6.3 ± 0.2 to 7.5 ± 0.3 in re-
sponse to the consumption of H+ by the reduction reactions. The Eh progressively de-
creased from 519 to −8.2 mV, reflecting the establishment of moderate reducing conditions
(Figure 1a).
Figure 1. Temporal evolution of the (a) pH and Eh of the soil solutions; (b) nitrate, acetate, dissolved organic carbon (DOC)
and dissolved inorganic carbon (DIC) concentrations (mg L−1) relative to time (in hours).
Iron(II) and acetate, a by-product of the consumption of OC by bacteria, were pro-
duced as soon as the solution was free of NO3 (< quantification limit 0.5 mg L−1) at t = 160–
184 h (Figures 1b and 2). The iron(II) and total Fe (Fetot) concentrations were similar, sug-
gesting that the released Fe corresponded to Fe(II) (Figure 2). The maximum Fe(II) con-
centrations reached 14.4 ± 1.4 mg L−1 at t = 425 h, along with the maximum acetate concen-
tration of 174.5 mg L−1, which represented 49% of the produced DOC at the end of the
reduction period. This indicates the onset of Fe-oxyhydroxides reductive biodissolution.
0 100 200 300 400 500 600 700
0
50
100
150
200
250
300
350
400
5.0
5.5
6.0
6.5
7.0
7.5
8.0
(b)
(a)
Reduction stage
pH
Oxidation stage
-100
0
100
200
300
400
500
600
Eh
(mV
)
DIC
(m
g.L
-1)
DO
C (
mg
.L-1)
Time (hours)
0
10
20
30
40
50
0
50
100
150
200
Ac
eta
te (m
g.L
-1)
0
10
20
30
40
50
Nitra
te (m
g.L
-1)
Figure 1. Temporal evolution of the (a) pH and Eh of the soil solutions; (b) nitrate, acetate, dissolved organic carbon (DOC)and dissolved inorganic carbon (DIC) concentrations (mg L−1) relative to time (in hours).
Iron(II) and acetate, a by-product of the consumption of OC by bacteria, were producedas soon as the solution was free of NO3 (< quantification limit 0.5 mg L−1) at t = 160–184 h(Figures 1b and 2). The iron(II) and total Fe (Fetot) concentrations were similar, suggestingthat the released Fe corresponded to Fe(II) (Figure 2). The maximum Fe(II) concentrationsreached 14.4 ± 1.4 mg L−1 at t = 425 h, along with the maximum acetate concentration of174.5 mg L−1, which represented 49% of the produced DOC at the end of the reductionperiod. This indicates the onset of Fe-oxyhydroxides reductive biodissolution. ReleasedFe(II) mainly occurs as Fe(II)-organic complexes (90–100%), as shown by the modelingcalculations (Figure 3).
Geosciences 2021, 11, 134 6 of 14
Geosciences 2021, 11, x FOR PEER REVIEW 6 of 14
Released Fe(II) mainly occurs as Fe(II)-organic complexes (90–100%), as shown by the
modeling calculations (Figure 3).
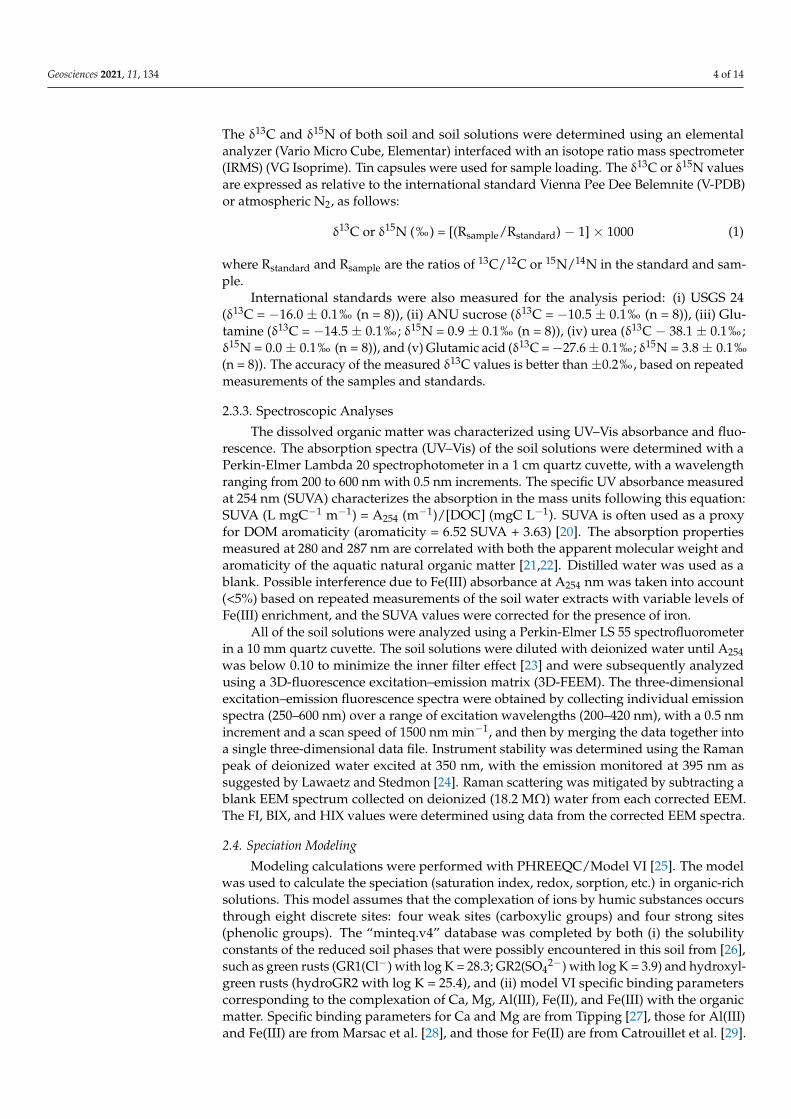
Figure 2. Temporal evolution of the DOC concentration and total Fe and Fe(II) concentrations (mg
L−1).
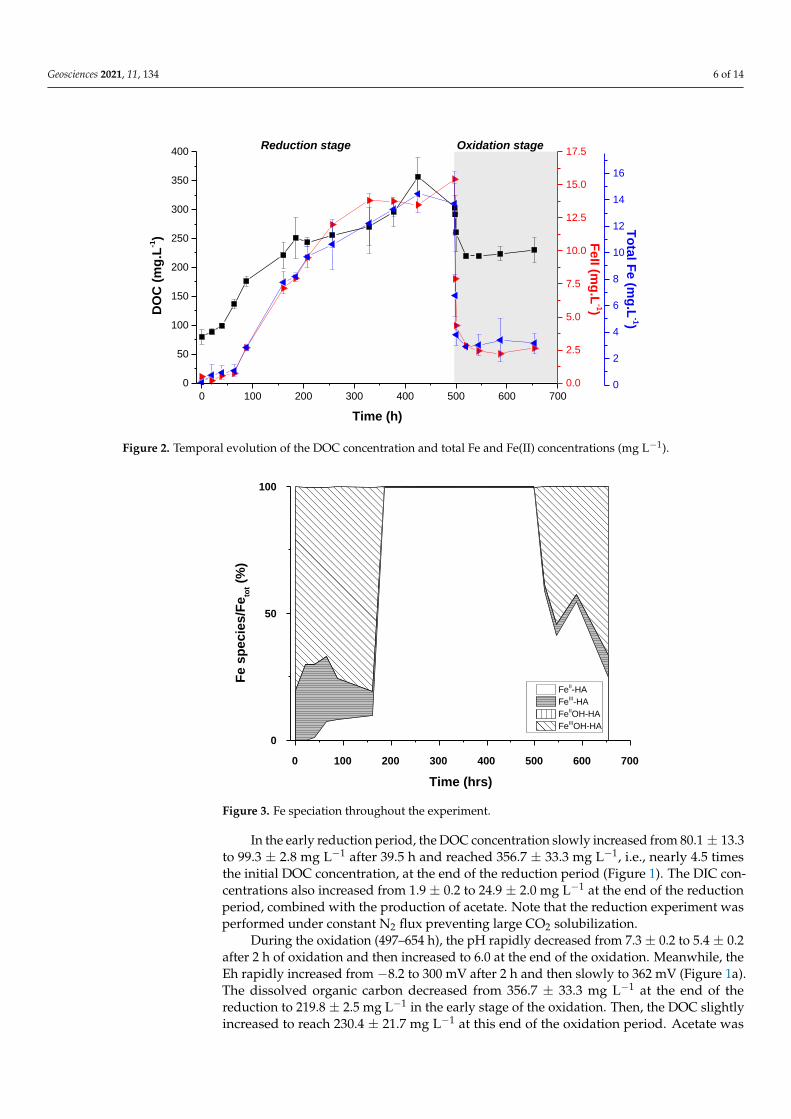
Figure 3. Fe speciation throughout the experiment.
In the early reduction period, the DOC concentration slowly increased from 80.1 ±
13.3 to 99.3 ± 2.8 mg L−1 after 39.5 h and reached 356.7 ± 33.3 mg L−1, i.e., nearly 4.5 times
the initial DOC concentration, at the end of the reduction period (Figure 1). The DIC con-
centrations also increased from 1.9 ± 0.2 to 24.9 ± 2.0 mg L−1 at the end of the reduction
period, combined with the production of acetate. Note that the reduction experiment was
performed under constant N2 flux preventing large CO2 solubilization.
During the oxidation (497–654 h), the pH rapidly decreased from 7.3 ± 0.2 to 5.4 ± 0.2
after 2 h of oxidation and then increased to 6.0 at the end of the oxidation. Meanwhile, the
Eh rapidly increased from −8.2 to 300 mV after 2 h and then slowly to 362 mV (Figure 1a).
0 100 200 300 400 500 600 700
0
50
100
150
200
250
300
350
400 D
OC
(m
g.L
-1)
Time (h)
Reduction stage Oxidation stage
0.0
2.5
5.0
7.5
10.0
12.5
15.0
17.5
FeII (m
g.L
-1)
0
2
4
6
8
10
12
14
16
To
tal F
e (m
g.L
-1)
0 100 200 300 400 500 600 700
0
50
100
Fe s
pecie
s/F
eto
t (%
)
Time (hrs)
FeII-HA
FeIII-HA
FeIIOH-HA
FeIIIOH-HA
Figure 2. Temporal evolution of the DOC concentration and total Fe and Fe(II) concentrations (mg L−1).
Geosciences 2021, 11, x FOR PEER REVIEW 6 of 14
Released Fe(II) mainly occurs as Fe(II)-organic complexes (90–100%), as shown by the
modeling calculations (Figure 3).
Figure 2. Temporal evolution of the DOC concentration and total Fe and Fe(II) concentrations (mg
L−1).
Figure 3. Fe speciation throughout the experiment.
In the early reduction period, the DOC concentration slowly increased from 80.1 ±
13.3 to 99.3 ± 2.8 mg L−1 after 39.5 h and reached 356.7 ± 33.3 mg L−1, i.e., nearly 4.5 times
the initial DOC concentration, at the end of the reduction period (Figure 1). The DIC con-
centrations also increased from 1.9 ± 0.2 to 24.9 ± 2.0 mg L−1 at the end of the reduction
period, combined with the production of acetate. Note that the reduction experiment was
performed under constant N2 flux preventing large CO2 solubilization.
During the oxidation (497–654 h), the pH rapidly decreased from 7.3 ± 0.2 to 5.4 ± 0.2
after 2 h of oxidation and then increased to 6.0 at the end of the oxidation. Meanwhile, the
Eh rapidly increased from −8.2 to 300 mV after 2 h and then slowly to 362 mV (Figure 1a).
0 100 200 300 400 500 600 700
0
50
100
150
200
250
300
350
400
DO
C (
mg
.L-1)
Time (h)
Reduction stage Oxidation stage
0.0
2.5
5.0
7.5
10.0
12.5
15.0
17.5
FeII (m
g.L
-1)
0
2
4
6
8
10
12
14
16
To
tal F
e (m
g.L
-1)
0 100 200 300 400 500 600 700
0
50
100
Fe s
pecie
s/F
eto
t (%
)
Time (hrs)
FeII-HA
FeIII-HA
FeIIOH-HA
FeIIIOH-HA
Figure 3. Fe speciation throughout the experiment.
In the early reduction period, the DOC concentration slowly increased from 80.1 ± 13.3to 99.3 ± 2.8 mg L−1 after 39.5 h and reached 356.7 ± 33.3 mg L−1, i.e., nearly 4.5 timesthe initial DOC concentration, at the end of the reduction period (Figure 1). The DIC con-centrations also increased from 1.9 ± 0.2 to 24.9 ± 2.0 mg L−1 at the end of the reductionperiod, combined with the production of acetate. Note that the reduction experiment wasperformed under constant N2 flux preventing large CO2 solubilization.
During the oxidation (497–654 h), the pH rapidly decreased from 7.3 ± 0.2 to 5.4 ± 0.2after 2 h of oxidation and then increased to 6.0 at the end of the oxidation. Meanwhile, theEh rapidly increased from −8.2 to 300 mV after 2 h and then slowly to 362 mV (Figure 1a).The dissolved organic carbon decreased from 356.7 ± 33.3 mg L−1 at the end of thereduction to 219.8 ± 2.5 mg L−1 in the early stage of the oxidation. Then, the DOC slightlyincreased to reach 230.4 ± 21.7 mg L−1 at this end of the oxidation period. Acetate was

Geosciences 2021, 11, 134 7 of 14
still present after 2 h, reaching 170 mg L−1, and then it completely disappeared. The DICalso significantly decreased to approximately 2.0 mg L−1; this value is close to the oneobtained at the beginning of the redox cycle. The abiotic oxidation of Fe(II) by O2 alsoproduces CO2 [33–35]; however, the venting of the reactor to produce oxic conditionsinvolved significant CO2 degassing. After this significant decrease, DIC progressivelyincreased to reach 3.7 ± 0.4 mg L−1 at the end of the experiment. This concentration isapproximately 100 times higher than the DIC concentration expected due to atmosphericCO2 solubilization. This DIC concentration combined with the weak increase in DOCsuggests a possible OM degradation. Iron(II) (from 15.4 ± 1.5 mg L−1 to 2.2 ± 0.4 mg L−1)and Fetot (14.4 ± 1.4 mg L−1 to approximately 3.1 ± 0.2 mg L−1) decreased rapidly inresponse to the O2 increase and subsequent Fe oxidation and precipitation (Figures 1band 2). However, both Fe(II) and Fetot stabilized rapidly (since t = 19.5 h) at about 3.1 and4.7 mg L−1, respectively, indicating that approximately 65% of the dissolved Fe is presentas Fe(II). Moreover, this final Fe(II) concentration remains larger than that at the beginningof the redox cycle.
3.2. PHREEQC-Model VI Modeling
PHREEQC-Model VI modeling was used to determine the Fe speciation and saturationindexes of the potential Fe(II)/Fe(III) newly formed minerals that could precipitate underreducing and oxidizing periods (Figure 3). The results showed that from 0 to 39.5 h, nearly100% of the Fe in solution was present as Fe(III), as Fe(III)-organic complexes. From 39.6 to160.5 h, roughly 7–10% of the Fe occurred as Fe(II) complexed to organic ligands (Figure 4).From 184.5 to 500 h, Fe(II)-organic complexes were the dominant Fe species in solution,even at the beginning of the oxidizing period. After 519.5 h, the Fe(II)-organic complexeswere less present, down to 24.5% at the end of the experiment, while the Fe(III)-organiccomplexes represented the dominant Fe species. Both at the beginning of the reducingperiod and at the end of the oxidizing period, when Fe was mainly bound to DOM, thesolution was saturated with respect to ferrihydrite (−0.5 < saturation index (SI) < +0.5).
Geosciences 2021, 11, x FOR PEER REVIEW 7 of 14
The dissolved organic carbon decreased from 356.7 ± 33.3 mg L−1 at the end of the reduc-
tion to 219.8 ± 2.5 mg L−1 in the early stage of the oxidation. Then, the DOC slightly in-
creased to reach 230.4 ± 21.7 mg L−1 at this end of the oxidation period. Acetate was still
present after 2 h, reaching 170 mg L−1, and then it completely disappeared. The DIC also
significantly decreased to approximately 2.0 mg L−1; this value is close to the one obtained
at the beginning of the redox cycle. The abiotic oxidation of Fe(II) by O2 also produces CO2
[33–35]; however, the venting of the reactor to produce oxic conditions involved signifi-
cant CO2 degassing. After this significant decrease, DIC progressively increased to reach
3.7 ± 0.4 mg L−1 at the end of the experiment. This concentration is approximately 100 times
higher than the DIC concentration expected due to atmospheric CO2 solubilization. This
DIC concentration combined with the weak increase in DOC suggests a possible OM deg-
radation. Iron(II) (from 15.4 ± 1.5 mg L−1 to 2.2 ± 0.4 mg L−1) and Fetot (14.4 ± 1.4 mg L−1 to
approximately 3.1 ± 0.2 mg L−1) decreased rapidly in response to the O2 increase and sub-
sequent Fe oxidation and precipitation (Figures 1b and 2). However, both Fe(II) and Fetot
stabilized rapidly (since t = 19.5 h) at about 3.1 and 4.7 mg L−1, respectively, indicating that
approximately 65% of the dissolved Fe is present as Fe(II). Moreover, this final Fe(II) con-
centration remains larger than that at the beginning of the redox cycle.
3.2. PHREEQC-Model VI Modeling
PHREEQC-Model VI modeling was used to determine the Fe speciation and satura-
tion indexes of the potential Fe(II)/Fe(III) newly formed minerals that could precipitate
under reducing and oxidizing periods (Figure 3). The results showed that from 0 to 39.5
h, nearly 100% of the Fe in solution was present as Fe(III), as Fe(III)-organic complexes.
From 39.6 to 160.5 h, roughly 7–10% of the Fe occurred as Fe(II) complexed to organic
ligands (Figure 4). From 184.5 to 500 h, Fe(II)-organic complexes were the dominant Fe
species in solution, even at the beginning of the oxidizing period. After 519.5 h, the Fe(II)-
organic complexes were less present, down to 24.5% at the end of the experiment, while
the Fe(III)-organic complexes represented the dominant Fe species. Both at the beginning
of the reducing period and at the end of the oxidizing period, when Fe was mainly bound
to DOM, the solution was saturated with respect to ferrihydrite (−0.5 < saturation index
(SI) < +0.5).
Figure 4. Saturation indices for the hydroxy green rusts: [FeIII2FeII(OH)8] and [FeIIFeIII(OH)5], goethite
and ferrihydrite versus time for the incubation experiment modeled with PHREEQC/Model VI [25].
0 100 200 300 400 500 600 700
-15
-10
-5
0
5
10
Satu
rati
on
in
dex
Time (hours)
Ferrihydrite
Hydroxygreenrust
Goethite
Reduction stage Oxidation stage
Figure 4. Saturation indices for the hydroxy green rusts: [FeIII2FeII(OH)8] and [FeIIFeIII(OH)5],
goethite and ferrihydrite versus time for the incubation experiment modeled withPHREEQC/Model VI [25].
3.3. Spectroscopic Properties of Bulk DOM
At the early stage of the reducing period, SUVA and HIX increased from 3.19 to4.48 and from 56 to 77.7, respectively (Figure 5), suggesting that DOM was composed of

Geosciences 2021, 11, 134 8 of 14
aromatic molecules (humic-like DOM). Then, SUVA and HIX decreased continuously toreach 3.19 and 23, respectively, indicating a decreasing DOM aromaticity.
Geosciences 2021, 11, x FOR PEER REVIEW 8 of 14
3.3. Spectroscopic Properties of Bulk DOM
At the early stage of the reducing period, SUVA and HIX increased from 3.19 to 4.48
and from 56 to 77.7, respectively (Figure 5), suggesting that DOM was composed of aro-
matic molecules (humic-like DOM). Then, SUVA and HIX decreased continuously to
reach 3.19 and 23, respectively, indicating a decreasing DOM aromaticity.
At the beginning of the oxidation, all of the fluorescence indices significantly de-
creased concomitantly with the DOC, DIC, acetate, and Fe concentrations in response to
the precipitation of Fe as Fe(III)-OM nanoaggregates and their subsequent sedimentation
[4,10,36–38]. However, BIX and FI rapidly increased to reach their highest values at 0.41
and 1.6, respectively, indicating that DOM was mainly constituted of microbial-derived
DOM [39]. After 19.5 h of oxidation, BIX and FI decreased, whereas SUVA and HIX in-
creased, which is consistent with the release of aromatic DOM in the solution. This release
seems to dominate the DOM composition, since BIX and FI increased once again after 19.5
h, whereas SUVA and HIX remained constant.
Figure 5. Evolution of the fluorescence and UV indexes during and between the reducing and
oxidizing periods.
3.4. Carbon Isotopic Composition of DOC during the Experiment
The δ13Csolution values displayed a narrow range, averaging −29.2 ± 0.2‰ (from −28.9
to −29.4‰) and −28.9 ± 0.1‰ during both the reduction and oxidation periods, respec-
tively. These values are typical of C3 plants and in the same range as those already ob-
served in both soil and soil solutions at the same site [13,40]. For information, the soil OM
(SOM) remained constant all throughout the experiment, and within the same range
as the soil solution, with a δ13Csoil of −29.2 ± 0.2‰. During the reduction period, between
39.5 and 63.5 h, even if the δ13Csolution range remains narrow, the small but significant var-
iation indicates an enrichment in 12C by 0.5‰ in the soil solution.
From 63.5 to 160.5 h, the δ13Csolution slowly increased (to −29.1‰) but never reached its
initial value (Figure 6). This period corresponds to an increase in pH (from 6.9 to 7.2) and
to the release of aromatic organic molecules in the solution, as indicated by the concomi-
tant SUVA and DOC increase. However, here, this significant release does not entirely
mask the signal of the 13C-enriched microbial metabolites.
With regard to oxidation, δ13C increased from −29.4 to −28.8‰ and became enriched
in 13C.
-100 0 100 200 300 400 500 600 700
-1
0
1
2
3
4
5
SU
VA
Time (hr)
0
10
20
30
40
50
60
70
80H
IX
0.0
0.5
1.0
1.5
2.0
FI
0.0
0.1
0.2
0.3
0.4
0.5
BIX
Reduction stage Oxidation stage
Figure 5. Evolution of the fluorescence and UV indexes during and between the reducing and oxidizing periods.
At the beginning of the oxidation, all of the fluorescence indices significantly decreasedconcomitantly with the DOC, DIC, acetate, and Fe concentrations in response to the precipi-tation of Fe as Fe(III)-OM nanoaggregates and their subsequent sedimentation [4,10,36–38].However, BIX and FI rapidly increased to reach their highest values at 0.41 and 1.6, re-spectively, indicating that DOM was mainly constituted of microbial-derived DOM [39].After 19.5 h of oxidation, BIX and FI decreased, whereas SUVA and HIX increased, which isconsistent with the release of aromatic DOM in the solution. This release seems to dominatethe DOM composition, since BIX and FI increased once again after 19.5 h, whereas SUVAand HIX remained constant.
3.4. Carbon Isotopic Composition of DOC during the Experiment
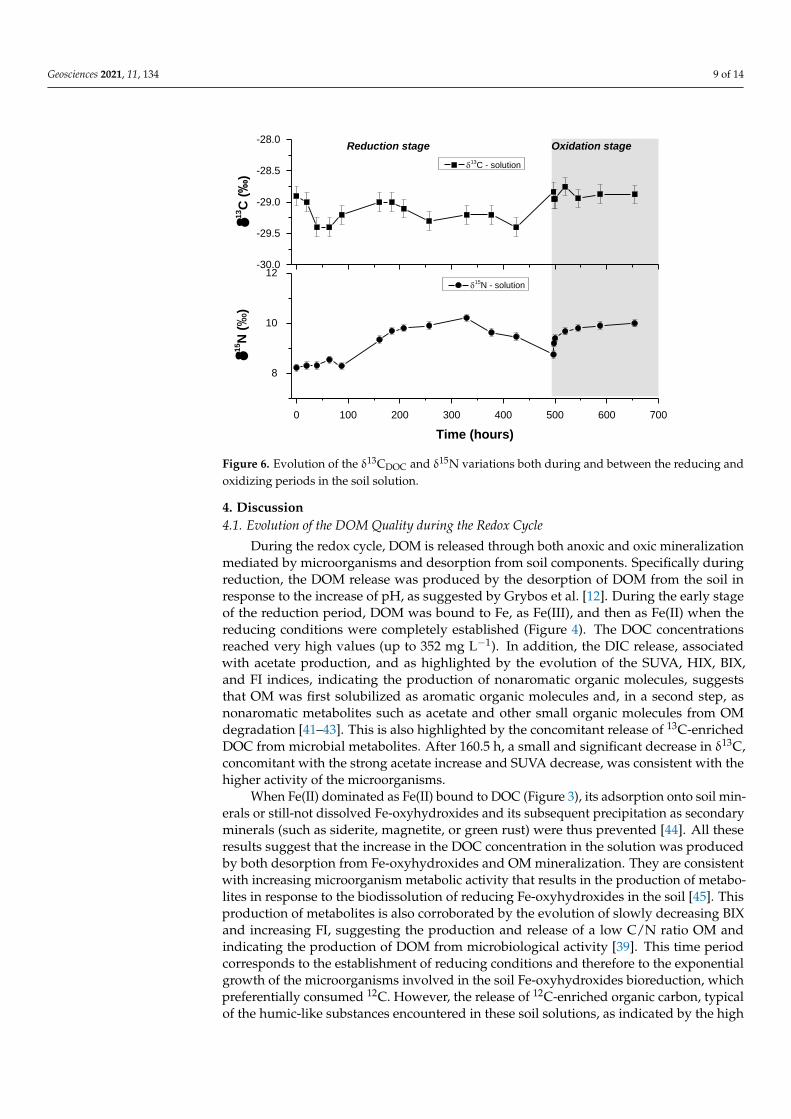
The δ13Csolution values displayed a narrow range, averaging −29.2 ± 0.2‰ (from−28.9 to −29.4‰) and −28.9 ± 0.1‰ during both the reduction and oxidation periods,respectively. These values are typical of C3 plants and in the same range as those alreadyobserved in both soil and soil solutions at the same site [13,40]. For information, the soilOM (SOM) remained constant all throughout the experiment, and within the same rangeas the soil solution, with a δ13Csoil of −29.2 ± 0.2‰. During the reduction period, between39.5 and 63.5 h, even if the δ13Csolution range remains narrow, the small but significantvariation indicates an enrichment in 12C by 0.5‰ in the soil solution.
From 63.5 to 160.5 h, the δ13Csolution slowly increased (to −29.1‰) but never reachedits initial value (Figure 6). This period corresponds to an increase in pH (from 6.9 to 7.2) andto the release of aromatic organic molecules in the solution, as indicated by the concomitantSUVA and DOC increase. However, here, this significant release does not entirely mask thesignal of the 13C-enriched microbial metabolites.
With regard to oxidation, δ13C increased from −29.4 to −28.8‰ and became enrichedin 13C.
During the first 100 h of the reducing period, the δ15Nsolution remained stable at closeto 8‰, equivalent to the constant δ15Nsoil (+7.9 ± 0.2‰) and then regularly increased toreach 10‰. Under the oxidizing period, after a decrease of the initial value to 8‰, theδ15Nsolution increased once again to reach 10‰.
Geosciences 2021, 11, 134 9 of 14
Geosciences 2021, 11, x FOR PEER REVIEW 9 of 14
During the first 100 h of the reducing period, the δ15Nsolution remained stable at close
to 8‰, equivalent to the constant δ15Nsoil (+7.9 ± 0.2‰) and then regularly increased to
reach 10‰. Under the oxidizing period, after a decrease of the initial value to 8‰, the
δ15Nsolution increased once again to reach 10‰.
Figure 6. Evolution of the δ13CDOC and δ15N variations both during and between the reducing and
oxidizing periods in the soil solution.
4. Discussion
4.1. Evolution of the DOM Quality during the Redox Cycle
During the redox cycle, DOM is released through both anoxic and oxic mineraliza-
tion mediated by microorganisms and desorption from soil components. Specifically dur-
ing reduction, the DOM release was produced by the desorption of DOM from the soil in
response to the increase of pH, as suggested by Grybos et al. [12]. During the early stage
of the reduction period, DOM was bound to Fe, as Fe(III), and then as Fe(II) when the
reducing conditions were completely established (Figure 4). The DOC concentrations
reached very high values (up to 352 mg L−1). In addition, the DIC release, associated with
acetate production, and as highlighted by the evolution of the SUVA, HIX, BIX, and FI
indices, indicating the production of nonaromatic organic molecules, suggests that OM
was first solubilized as aromatic organic molecules and, in a second step, as nonaromatic
metabolites such as acetate and other small organic molecules from OM degradation [41–
43]. This is also highlighted by the concomitant release of 13C-enriched DOC from micro-
bial metabolites. After 160.5 h, a small and significant decrease in δ13C, concomitant with
the strong acetate increase and SUVA decrease, was consistent with the higher activity of
the microorganisms.
When Fe(II) dominated as Fe(II) bound to DOC (Figure 3), its adsorption onto soil
minerals or still-not dissolved Fe-oxyhydroxides and its subsequent precipitation as sec-
ondary minerals (such as siderite, magnetite, or green rust) were thus prevented [44]. All
these results suggest that the increase in the DOC concentration in the solution was pro-
duced by both desorption from Fe-oxyhydroxides and OM mineralization. They are con-
sistent with increasing microorganism metabolic activity that results in the production of
metabolites in response to the biodissolution of reducing Fe-oxyhydroxides in the soil
[45]. This production of metabolites is also corroborated by the evolution of slowly de-
creasing BIX and increasing FI, suggesting the production and release of a low C/N ratio
-30.0
-29.5
-29.0
-28.5
-28.0
0 100 200 300 400 500 600 700
8
10
12
Oxidation stage
13C
(‰
)
13
C - solution
Reduction stage
15N
(‰
)
Time (hours)
15
N - solution
Figure 6. Evolution of the δ13CDOC and δ15N variations both during and between the reducing andoxidizing periods in the soil solution.
4. Discussion4.1. Evolution of the DOM Quality during the Redox Cycle
During the redox cycle, DOM is released through both anoxic and oxic mineralizationmediated by microorganisms and desorption from soil components. Specifically duringreduction, the DOM release was produced by the desorption of DOM from the soil inresponse to the increase of pH, as suggested by Grybos et al. [12]. During the early stageof the reduction period, DOM was bound to Fe, as Fe(III), and then as Fe(II) when thereducing conditions were completely established (Figure 4). The DOC concentrationsreached very high values (up to 352 mg L−1). In addition, the DIC release, associatedwith acetate production, and as highlighted by the evolution of the SUVA, HIX, BIX,and FI indices, indicating the production of nonaromatic organic molecules, suggeststhat OM was first solubilized as aromatic organic molecules and, in a second step, asnonaromatic metabolites such as acetate and other small organic molecules from OMdegradation [41–43]. This is also highlighted by the concomitant release of 13C-enrichedDOC from microbial metabolites. After 160.5 h, a small and significant decrease in δ13C,concomitant with the strong acetate increase and SUVA decrease, was consistent with thehigher activity of the microorganisms.
When Fe(II) dominated as Fe(II) bound to DOC (Figure 3), its adsorption onto soil min-erals or still-not dissolved Fe-oxyhydroxides and its subsequent precipitation as secondaryminerals (such as siderite, magnetite, or green rust) were thus prevented [44]. All theseresults suggest that the increase in the DOC concentration in the solution was producedby both desorption from Fe-oxyhydroxides and OM mineralization. They are consistentwith increasing microorganism metabolic activity that results in the production of metabo-lites in response to the biodissolution of reducing Fe-oxyhydroxides in the soil [45]. Thisproduction of metabolites is also corroborated by the evolution of slowly decreasing BIXand increasing FI, suggesting the production and release of a low C/N ratio OM andindicating the production of DOM from microbiological activity [39]. This time periodcorresponds to the establishment of reducing conditions and therefore to the exponentialgrowth of the microorganisms involved in the soil Fe-oxyhydroxides bioreduction, whichpreferentially consumed 12C. However, the release of 12C-enriched organic carbon, typicalof the humic-like substances encountered in these soil solutions, as indicated by the high
Geosciences 2021, 11, 134 10 of 14
SUVA values [9,40], seems to mask the 12C consumption via the metabolic activity ofthe microorganisms.
During oxidation, when O2 was reintroduced in the system, close to 70% of theDOC disappeared from the solution and Fe(II) was oxidized as Fe(III), hydrolyzed, andpartially precipitated as newly formed amorphous nano ferric oxides with colloidal DOMas previously demonstrated by Guenet et al. [4,37] and Beauvois et al. [46] (Figure 4).This decrease in DOC results in an instantaneous decrease in all of the DOM qualityindexes. After that, BIX and FI increased once again, thereby suggesting that fresh DOMwas produced in response to the lysis of reducing bacterial cells, as also highlighted bythe remaining DOM in the soil solutions enriched in 13C relative to the reduced solution(+0.6‰), corresponding to released 13C-enriched microbial DOM. The precipitation ofFe-oxyhydroxides seems to preferentially adsorb 12C-enriched DOM following microbialcell lysis. The relative increase in δ15Nsolution observed during the reducing conditionsfollowed by the oxidizing conditions can be explained either by the preferential gain ofnitrogen enriched in 15N or the loss of a fraction depleted in 15N. In some bacterial cultures,the total proteins within a cell have been found to be enriched in 15N relative to the bulknitrogen [47]. The increase in the δ15N values with the degradation of OM could partlyreflect the selective gain in proteins. The activity of the microorganisms may modify theδ15N value through the consumption and fractionation of the soil N organic matter contentbut also via the increase in the bacterial biomass [48,49].
After this first oxidative step, aromatic molecules were progressively released inthe solution, concomitantly with a slight increase in Fe(III), indicating the abiotic oxida-tion/precipitation of Fe involves the precipitation/sedimentation of Fe-OM aggregatesand the release of Fe-OM colloids. This release may be due to the continuous stirring ofthe suspension and the subsequent disaggregation of a part of the freshly formed Fe-OMaggregates. This disaggregation is also expected in natural systems in response to the es-tablishment of the water flow. This release represents approximately 22% of the previouslysedimented DOM. This result highlights the binding of Fe with the most aromatic moleculesduring its precipitation. Several studies have demonstrated that Fe nano-oxides are boundto DOM via inner spheres formed between Fe and C in bidentate complexes [4,46,50]. Thesecomplexes are preferentially formed with molecules that have high binding site densitiessuch as aromatic humic molecules. However, a small part of Fe is maintained as Fe(II) dueto its binding with DOM. These results may be explained by (i) the preferential retention ofsmall nonaromatic organic molecules in the solution in response to the preferential bindingof aromatic organic molecules with the newly formed Fe(III) nano-oxides [51] or (ii) theproduction of small organic molecules due to the lysis of reducing bacterial cells underoxidizing conditions.
4.2. Impact on Soil OM Degradation and Preservation
In soil, the stabilization of OM through its binding to minerals has long been consid-ered to prevent OM degradation by microorganisms [1,52,53]. Generally, it is admittedthat ferric oxyhydroxides preserve, via their binding, SOM from degradation. Severalmechanisms have been evoked for the stabilization of OM by ferric species, such as thecoprecipitation of DOM with ferric oxide particles or nano-oxides, sorption to highly crys-tallized Fe oxides, or inhibition of the consumption of labile C by microorganisms due totheir binding to ferric species [54].
In the present study, the evolution of the DOM quality relative to the redox conditions,combined with recent studies on the structure of the Fe-OM associations, shed new lighton these hypotheses. Under reducing conditions, OM degradation occurs by producingand releasing CO2 as well as metabolites in sufficient amounts that are able to modifythe quality indexes of the terrestrial aromatic molecules. These organic molecules act aselectron donors for a microbial consortium, as previously shown by Dia et al. [45]. Theyare also bound to Fe as ferrous species. This strong binding allows the preservation ofa significant amount of Fe(II) even under oxidizing conditions. Here, it may represent
Geosciences 2021, 11, 134 11 of 14
approximately 25% of the Fe(II) present under reducing conditions (Figure 2). Whenoxidizing conditions are established, the abiotic precipitation of Fe as Fe(III) nano-oxidesinvolves the coprecipitation of DOM as Fe-OM aggregates, but also promotes the lysisof reducing bacterial cells as small nonaromatic molecules, as indicated by the evolutionof the BIX and FI indexes. This lysis is supported by the release of 13C-enriched DOMunder oxidizing conditions. Therefore, it is fundamental to take into account the lysis of thebacterial cells involved by considering the alternating reducing and oxidizing conditionsin temporarily waterlogged soils. As microorganisms grow at the expense of SOM, thecell lysis represents a second way of SOM degradation. Moreover, these results show thatthe newly formed Fe-OM aggregates are not stable with regard to the stirring constraints.As a result, the Fe(III)-OM aggregates produced under the oxidation period may be moreunstable than expected. When there are enough physical constraints, e.g., in response tothe water flux, to involve their disaggregation, smaller and more mobile Fe-OM aggregatesare produced, involving the removal of DOM and all of the associated elements.
5. Conclusions
With the context of climate change likely being responsible for the increase in thefrequency of soil flooding or drying, it is crucial to understand how nano- and microscaleenvironmental conditions affect organomineral interactions and hence the stability ofSOM [55]. It has long been considered that the binding of DOM with ferric species pre-serves DOM from degradation by microorganisms. Soils that are temporarily waterloggedare perfect targets to study these processes since Fe is alternatively soluble and insolubleunder high water level periods (reducing conditions) and low water level periods (oxi-dizing conditions), respectively. In this study, we tested the impact of a redox cycle onthe solubilization of OM. Under reducing conditions, DOM is released from both OMmineralization and desorption from soil minerals in response to the increase in pH. Theseprocesses involve changes in the DOM quality from an aromatic OM corresponding to soilterrestrial material to less-aromatic OM due to the production of metabolites in response tothe dissimilatory reductive dissolution of Fe-oxyhydroxides in the soil. When oxidizingconditions are re-established, the precipitation of aromatic OM with Fe and the lysis ofreducing bacterial cells involve a release of nonaromatic and very labile organic moleculesin the solution. This process is rapidly followed by the release of more aromatic OM inthe solution. This secondary solubilization occurs in response to the disaggregation of thenewly formed Fe-OM aggregates due to the physical constraints applied due to the stirringunder our experimental conditions, but which can be compared to the physical constraintsof the water flow under natural conditions. These results shed new light on the stabiliza-tion/preservation of OM by ferric phases; here, we demonstrate that bacterial cell lysis canbe a significant way to solubilize OM from soil during the redox cycle and that the freshFe-OM aggregates formed under oxidizing conditions relative to the physical constraintsto which they are submitted could release smaller entities that are rich in colloidal OM andable to disseminate in the environment.
Author Contributions: Formal analysis, J.K.; Funding acquisition, A.-C.P.-W.; Investigation, E.L.-K.;Methodology, J.K.; Software, C.C.; Supervision, A.-C.P.-W. and M.D.; Writing–original draft, A.-C.P.-W.; Writing–review & editing, A.-C.P.-W. and M.D. All authors have read and agreed to the publishedversion of the manuscript.
Funding: This research was funded by CNRS.-INSU, grant number PRODYNAMOS.
Acknowledgments: We thank J.N. Thibault from PEGASE INRA unit for his assistance with Cisotopic analyses. This research was partly funded by the CNRS-INSU Program EC2CO via the “PRO-DYNAMOS” project allocated to AC Pierson-Wickmann. Sara Mullin post-edited the English style.
Conflicts of Interest: The authors declare no conflict of interest.
Geosciences 2021, 11, 134 12 of 14
Appendix A
Geosciences 2021, 11, x FOR PEER REVIEW 12 of 14
Author Contributions: Formal analysis, J.K.; Funding acquisition, A.-C.P.-W.; Investigation, E.L.-
K.; Methodology, J.K.; Software, C.C.; Supervision, A.-C.P.-W. and M.D.; Writing–original draft, A.-
C.P.-W.; Writing–review & editing, A.-C.P.-W. and M.D. All authors have read and agreed to the
published version of the manuscript.
Funding: This research was funded by CNRS.-INSU, grant number PRODYNAMOS”.
Acknowledgments: We thank J.N. Thibault from PEGASE INRA unit for his assistance with C iso-
topic analyses. This research was partly funded by the CNRS-INSU Program EC2CO via the “PRO-
DYNAMOS” project allocated to AC Pierson-Wickmann. Sara Mullin post-edited the English style.
Conflicts of Interest: The authors declare no conflict of interest.
Appendix A
Figure A1. Experimental setup for the soil experiment.
Appendix B
Table A1. Chemical composition of soil sample.
SiO2
(wt. %)
Al2O3
(wt. %)
Fe2O3
(wt. %)
MnO
(wt. %)
MgO
(wt. %)
CaO
(wt. %)
Na2O
(wt. %)
K2O
(wt. %)
TiO2
(wt. %)
P2O5
(wt. %)
PF
(wt. %)
To-
tal
Organic Carbon
(%)
58.39 11.51 2.85 0.01 0.44 0.25 0.37 1.98 0.71 0.12 22.56 99.19 6.64
As
(ppm)
Cd
(ppm)
Co
(ppm)
Cr
(ppm)
Cu
(ppm)
Ni
(ppm)
Pb
(ppm)
Zn
(ppm)
U
(ppm) - - - -
7.64 7.65 4.80 74.88 10.51 21.26 25.13 40.96 2.34 - - - -
References
1. Torn, M.S.; Trumbore, S.E.; Chadwick, O.A.; Vitousek, P.M.; Hendricks, D.M. Mineral control of soil organic carbon storage
and turnover. Nature 1997, 389, 170–173, doi:10.1038/38260.
2. Masiello, C.A.; Chadwick, O.A.; Southon, J.; Torn, M.S.; Harden, J.W. Weathering controls on mechanisms of carbon storage
in grassland soils. Glob. Biogeochem. Cycles 2004, 18, 1–9, doi:10.1029/2004GB002219.
3. Kramer, M.G.; Chadwick, O.A. Climate-driven thresholds in reactive mineral retention of soil carbon at the global scale.
Nat. Clim. Chang. 2018, 8, 1104–1108, doi:10.1038/s41558-018-0341-4.
4. Guénet, H.; Davranche, M.; Vantelon, D.; Pédrot, M.; Al-Sid-Cheikh, M.; Dia, A.; Jestin, J. Evidence of organic matter control
on As oxidation by iron oxides in riparian wetlands. Chem. Geol. 2016, 439, 161–172, doi:10.1016/j.chemgeo.2016.06.023.
Figure A1. Experimental setup for the soil experiment.
Appendix B
Table A1. Chemical composition of soil sample.
SiO2(wt.%)
Al2O3(wt.%)
Fe2O3(wt.%)
MnO(wt.%)
MgO(wt.%)
CaO(wt.%)
Na2O(wt.%)
K2O(wt.%)
TiO2(wt.%)
P2O5(wt.%)
PF(wt.%)
Total
OrganicCar-bon(%)
58.39 11.51 2.85 0.01 0.44 0.25 0.37 1.98 0.71 0.12 22.56 99.19 6.64
As(ppm)
Cd(ppm)
Co(ppm)
Cr(ppm)
Cu(ppm)
Ni(ppm)
Pb(ppm)
Zn(ppm)
U(ppm) - - - -
7.64 7.65 4.80 74.88 10.51 21.26 25.13 40.96 2.34 - - - -
References1. Torn, M.S.; Trumbore, S.E.; Chadwick, O.A.; Vitousek, P.M.; Hendricks, D.M. Mineral control of soil organic carbon storage and
turnover. Nature 1997, 389, 170–173. [CrossRef]2. Masiello, C.A.; Chadwick, O.A.; Southon, J.; Torn, M.S.; Harden, J.W. Weathering controls on mechanisms of carbon storage in
grassland soils. Glob. Biogeochem. Cycles 2004, 18, 1–9. [CrossRef]3. Kramer, M.G.; Chadwick, O.A. Climate-driven thresholds in reactive mineral retention of soil carbon at the global scale.
Nat. Clim. Chang. 2018, 8, 1104–1108. [CrossRef]4. Guénet, H.; Davranche, M.; Vantelon, D.; Pédrot, M.; Al-Sid-Cheikh, M.; Dia, A.; Jestin, J. Evidence of organic matter control on
As oxidation by iron oxides in riparian wetlands. Chem. Geol. 2016, 439, 161–172. [CrossRef]5. Herndon, E.; Al Bashaireh, A.; Singer, D.; Chowdhury, T.R.; Gu, B.; Graham, D. Influence of iron redox cycling on organo-mineral
associations in Arctic tundra soil. Geochim. Cosmochim. Acta 2017, 207, 210–231. [CrossRef]6. Hall, S.J.; Berhe, A.A.; Thompson, A. Order from disorder: Do soil organic matter composition and turnover co-vary with iron
phase crystallinity? Biogeochemistry 2018, 140, 93–110. [CrossRef]7. Chen, C.; Hall, S.J.; Coward, E.; Thompson, A. Iron-mediated organic matter decomposition in humid soils can counteract
protection. Nat. Commun. 2020, 11. [CrossRef]8. Henneberry, Y.K.; Kraus, T.E.C.; Nico, P.S.; Horwath, W.R. Structural stability of coprecipitated natural organic matter and ferric
iron under reducing conditions. Org. Geochem. 2012, 48, 81–89. [CrossRef]9. Lambert, T.; Pierson-Wickmann, A.C.; Gruau, G.; Jaffrezic, A.; Petitjean, P.; Thibault, J.N.; Jeanneau, L. DOC sources and DOC
transport pathways in a small headwater catchment as revealed by carbon isotope fluctuation during storm events. Biogeosciences2014, 11, 3043–3056. [CrossRef]

Geosciences 2021, 11, 134 13 of 14
10. Riedel, T.; Zak, D.; Biester, H.; Dittmar, T. Iron traps terrestrially derived dissolved organic matter at redox interfaces. Proc. Natl.Acad. Sci. USA 2013, 110, 10101–10105. [CrossRef]
11. Curmi, P.; Durand, P.; Gascuel-Odoux, C.; Merot, P.; Walter, C.; Taha, A. Hydromorphic soils, hydrology and water quality:Spatial distribution and functional modelling at different scales. Nutr. Cycl. Agroecosys. 1998, 50, 127–142. [CrossRef]
12. Grybos, M.; Davranche, M.; Gruau, G.; Petitjean, P. Is trace metal release in wetland soils controlled by organic matter mobility orFe-oxyhydroxides reduction? J. Colloid Interface Sci. 2007, 314, 490–501. [CrossRef] [PubMed]
13. Lambert, T.; Pierson-Wickmann, A.C.; Gruau, G.; Jaffrezic, A.; Petitjean, P.; Thibault, J.N.; Jeanneau, L. Hydrologically drivenseasonal changes in the sources and production mechanisms of dissolved organic carbon in a small lowland catchment.Water Resour. Res. 2013, 49, 5792–5803. [CrossRef]
14. Merot, P.; Durand, P.; Morisson, C. Four-component hydrograph separation using isotopic and chemical determinations in anagricultural catchment in western France. Phys. Chem. Earth 1995, 20, 415–425. [CrossRef]
15. Al-Sid-Cheikh, M.; Pédrot, M.; Dia, A.; Guenet, H.; Vantelon, D.; Davranche, M.; Gruau, G.; Delhaye, T. Interactions betweennatural organic matter, sulfur, arsenic and iron oxides in re-oxidation compounds within riparian wetlands: NanoSIMS and X-rayadsorption spectroscopy evidences. Sci. Total Environ. 2015, 515–516, 118–128. [CrossRef]
16. Dia, A.; Gruau, G.; Olivié-Lauquet, G.; Riou, C.; Molénat, J.; Curmi, P. The distribution of rare earth elements in groundwaters:Assessing the role of source-rock composition, redox changes and colloidal particles. Geochim. Cosmochim. Acta 2000, 64, 4131–4148.[CrossRef]
17. Gruau, G.; Dia, A.; Olivié-Lauquet, G.; Davranche, M.; Pinay, G. Controls on the distribution of rare earth elements in shallowgroundwaters. Water Res. 2004, 38, 3576–3586. [CrossRef]
18. Pauwels, H.; Kloppmann, W.; Foucher, J.C.; Martelat, A.; Fritsche, V. Field tracer test for denitrification in a pyrite-bearing schistaquifer. Appl. Geochem. 1998, 13, 767–778. [CrossRef]
19. AFNOR. Evaluation De La Qualité des Sols. Méthodes D’analyse Chimique; AFNOR: La Plaine Saint Denis, France, 2004; Volume 1.(In French)
20. Weishaar, J.L.; Aiken, G.R.; Bergamaschi, B.A.; Fram, M.S.; Fujii, R.; Mopper, K. Evaluation of specific ultraviolet absorbance asan indicator of the chemical composition and reactivity of dissolved organic carbon. Environ. Sci. Technol. 2003, 37, 4702–4708.[CrossRef] [PubMed]
21. Chin, Y.-P.; Aiken, G.; O’Loughlin, E. Molecular weight, polydispersity, and spectroscopic properties of aquatic humic substances.Environ. Sci. Technol. 1994, 28, 1853–1858. [CrossRef] [PubMed]
22. Leenheer, J.A.; Croué, J.-P. Peer Reviewed: Characterizing aquatic dissolved organic matter. Environ. Sci. Technol. 2003,37, 18A–26A. [CrossRef]
23. Ohno, T. Fluorescence inner-filtering correction for determining the humification index of dissolved organic matter.Environ. Sci. Technol. 2002, 36, 742–746. [CrossRef]
24. Lawaetz, A.J.; Stedmon, C.A. Fluorescence intensity calibration using the Raman scatter peak of water. Appl. Spectrosc. 2009,63, 936–940. [CrossRef]
25. Marsac, R.; Davranche, M.; Gruau, G.; Bouhnik-Le Coz, M.; Dia, A. An improved description of the interactions between rareearth elements and humic acids by modeling: PHREEQC-Model VI coupling. Geochim. Cosmochim. Acta 2011, 75, 5625–5637.[CrossRef]
26. Rickard, D.; Luther, G.W. Chemistry of iron sulfides. Chem. Rev. 2007, 107, 514–562. [CrossRef] [PubMed]27. Tipping, E. Humic ion-binding model VI: An improved description of the interactions of protons and metal ions with humic
substances. Aquat. Geochem. 1998, 4, 3–48. [CrossRef]28. Marsac, R.; Davranche, M.; Gruau, G.; Dia, A.; Bouhnik-Le Coz, M. Aluminium competitive effect on rare earth elements binding
to humic acid. Geochim. Cosmochim. Acta 2012, 89, 1–9. [CrossRef]29. Catrouillet, C.; Davranche, M.; Dia, A.; Bouhnik-Le Coz, M.; Marsac, R.; Pourret, O.; Gruau, G. Geochemical modeling of Fe(II)
binding to humic and fulvic acids. Chem. Geol. 2014, 372, 109–118. [CrossRef]30. Ponnamperuma, F.N. The Chemistry of submerged soils. Adv. Agron. 1972, 24, 29–96. [CrossRef]31. Thompson, A.; Chadwick, O.A.; Boman, S.; Chorover, J. Colloid mobilization during soil iron redox oscillations. Environ. Sci. Technol.
2006, 40, 5743–5749. [CrossRef] [PubMed]32. Lotfi-Kalahroodi, E.; Pierson-Wickmann, A.-C.A.-C.; Guénet, H.; Rouxel, O.; Ponzevera, E.; Bouhnik-Le Coz, M.; Vantelon, D.;
Dia, A.; Davranche, M.; LeCoz-Bouhnik, M.; et al. Iron isotope fractionation in iron-organic matter associations: Experimentalevidence using filtration and ultrafiltration. Geochim. Cosmochim. Acta 2019, 250, 98–116. [CrossRef]
33. Wood, P.M. Pathways for production of Fenton’s reagent by wood-rotting fungi. FEMS Microbiol. Rev. 1994, 13, 313–320.[CrossRef]
34. Hammel, K.E.; Kapich, A.N.; Jensen, K.A.; Ryan, Z.C. Reactive oxygen species as agents of wood decay by fungi.Enzyme Microb. Technol. 2002, 30, 445–453. [CrossRef]
35. Hall, S.J.; Silver, W.L. Iron oxidation stimulates organic matter decomposition in humid tropical forest soils. Glob. Chang. Biol.2013, 19, 2804–2813. [CrossRef]
36. Cismasu, A.C.; Michel, F.M.; Tcaciuc, A.P.; Tyliszczak, T.; Brown, G.E. Composition et propriétés structurales des ferrihydritesnaturelles. Comptes Rendus Geosci. 2011, 343, 210–218. [CrossRef]
Geosciences 2021, 11, 134 14 of 14
37. Guénet, H.; Davranche, M.; Vantelon, D.; Bouhnik-Le Coz, M.; Jardé, E.; Pierson-Wickmann, A.C.; Dorcet, V.; Demangeat, E.;Jestin, J. Highlighting the wide variability in arsenic speciation in wetlands: A new insight into the control of the behavior ofarsenic. Geochim. Cosmochim. Acta 2017, 203, 284–302. [CrossRef]
38. Keiluweit, M.; Bougoure, J.J.; Nico, P.S.; Pett-Ridge, J.; Weber, P.K.; Kleber, M. Mineral protection of soil carbon counteracted byroot exudates. Nat. Clim. Chang. 2015, 5, 588–595. [CrossRef]
39. Gabor, R.S.; McKnight, D.M.; Miller, M.P. Fluorescence indices and their interpretation. In Aquatic Organic Matter Fluorescence;Cambridge University Press: Cambridge, UK, 2014; pp. 303–338.
40. Lambert, T.; Pierson-Wickmann, A.C.; Gruau, G.; Thibault, J.N.; Jaffrezic, A. Carbon isotopes as tracers of dissolved organiccarbon sources and water pathways in headwater catchments. J. Hydrol. 2011, 402, 228–238. [CrossRef]
41. Lipson, D.A.; Jha, M.; Raab, T.K.; Oechel, W.C. Reduction of iron (III) and humic substances plays a major role in anaerobicrespiration in an Arctic peat soil. J. Geophys. Res. Biogeosci. 2010, 115. [CrossRef]
42. Lovley, D.R.; Phillips, E.J.P. Availability of ferric iron for microbial reduction in bottom sediments of the freshwater tidal PotomacRiver. Appl. Environ. Microbiol. 1986, 52, 751–757. [CrossRef]
43. Roden, E.E.; Wetzel, R.G. Kinetics of microbial Fe(III) oxide reduction in freshwater wetland sediments. Limnol. Oceanogr. 2002,47, 198–211. [CrossRef]
44. Davranche, M.; Dia, A.; Fakih, M.; Nowack, B.; Gruau, G.; Ona-nguema, G.; Petitjean, P.; Martin, S.; Hochreutener, R. Organicmatter control on the reactivity of Fe(III)-oxyhydroxides and associated As in wetland soils: A kinetic modeling study. Chem. Geol.2013, 335, 24–35. [CrossRef]
45. Dia, A.; Lauga, B.; Davranche, M.; Fahy, A.; Duran, R.; Nowack, B.; Petitjean, P.; Henin, O.; Martin, S.; Marsac, R.; et al.Bacteria-mediated reduction of As(V)-doped lepidocrocite in a flooded soil sample. Chem. Geol. 2015, 406, 34–44. [CrossRef]
46. Beauvois, A.; Vantelon, D.; Jestin, J.; Rivard, C.; Bouhnik-Le Coz, M.; Dupont, A.; Briois, V.; Bizien, T.; Sorrentino, A.;Wu, B.; et al. How does calcium drive the structural organization of iron-organic matter aggregates? A multiscale investigation.Environ. Sci. Nano 2020, 7, 2833–2849. [CrossRef]
47. Macko, S.A.; Fogel, M.L.; Hare, P.E.; Hoering, T.C. Isotopic fractionation of nitrogen and carbon in the synthesis of amino acids bymicroorganisms. Chem. Geol. Isot. Geosci. Sect. 1987, 65, 79–92. [CrossRef]
48. Lehmann, M.F.; Bernasconi, S.M.; Barbieri, A.; McKenzie, J.A. Preservation of organic matter and alteration of its carbon andnitrogen isotope composition during simulated and in situ early sedimentary diagenesis. Geochim. Cosmochim. Acta 2002,66, 3573–3584. [CrossRef]
49. Kohzu, A.; Imai, A.; Miyajima, T.; Fukushima, T.; Matsushige, K.; Komatsu, K.; Kawasaki, N.; Miura, S.; Sato, T. Direct evidencefor nitrogen isotope discrimination during sedimentation and early diagenesis in Lake Kasumigaura, Japan. Org. Geochem. 2011,42, 173–183. [CrossRef]
50. Guénet, H.; Davranche, M.; Vantelon, D.; Gigault, J.; Prévost, S.; Taché, O.; Jaksch, S.; Pédrot, M.; Dorcet, V.; Boutier, A.; et al.Characterization of iron-organic matter nano-aggregate networks through a combination of SAXS/SANS and XAS analyses:Impact on As binding. Environ. Sci. Nano 2017, 4, 938–954. [CrossRef]
51. Adhikari, D.; Yang, Y. Selective stabilization of aliphatic organic carbon by iron oxide. Sci. Rep. 2015, 5, 1–7. [CrossRef] [PubMed]52. Mikutta, R.; Kleber, M.; Torn, M.S.; Jahn, R. Stabilization of soil organic matter: Association with minerals or chemical recalcitrance?
Biogeochemistry 2006, 77, 25–56. [CrossRef]53. Kögel-Knabner, I.; Guggenberger, G.; Kleber, M.; Kandeler, E.; Kalbitz, K.; Scheu, S.; Eusterhues, K.; Leinweber, P. Organo-mineral
associations in temperate soils: Integrating biology, mineralogy, and organic matter chemistry. J. Plant Nutr. Soil Sci. 2008,171, 61–82. [CrossRef]
54. Eusterhues, K.; Neidhardt, J.; Hädrich, A.; Küsel, K.; Totsche, K.U. Biodegradation of ferrihydrite-associated organic matter.Biogeochemistry 2014, 119, 45–50. [CrossRef]
55. Newcomb, C.J.; Qafoku, N.P.; Grate, J.W.; Bailey, V.L.; De Yoreo, J.J. Developing a molecular picture of soil organic matter–mineralinteractions by quantifying organo–mineral binding. Nat. Commun. 2017, 8, 396. [CrossRef] [PubMed]