monitoring social media for communicable disease ... · 19 april 2013 monitoring social media for...
TRANSCRIPT

19 April 2013
Monitoring social media for communicable disease surveillance: An Australian study Matthew HAMLETa, Guido ZUCCONa,b, Sankalp KHANNAa,b, Anthony NGUYENa,b,
Justin BOYLEa,b , Mark CAMERONb a The Australian e-Health Research Centre, CSIRO, Australia b CSIRO ICT Centre, Australia
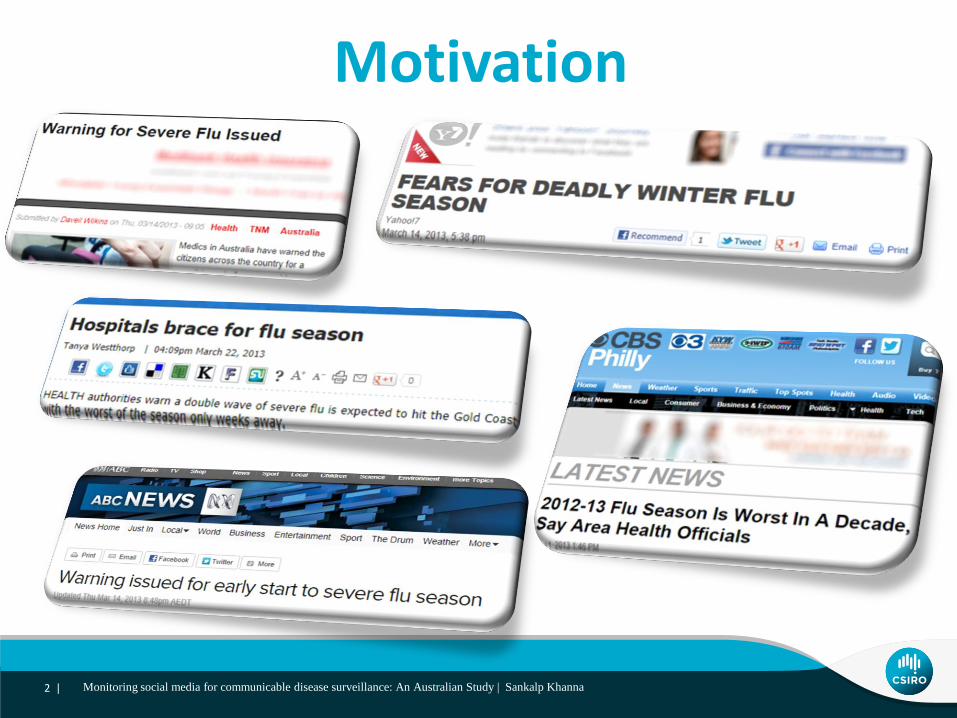
Motivation
2 | Monitoring social media for communicable disease surveillance: An Australian Study | Sankalp Khanna

Big Data to the Rescue
3 | Monitoring social media for communicable disease surveillance: An Australian Study | Sankalp Khanna
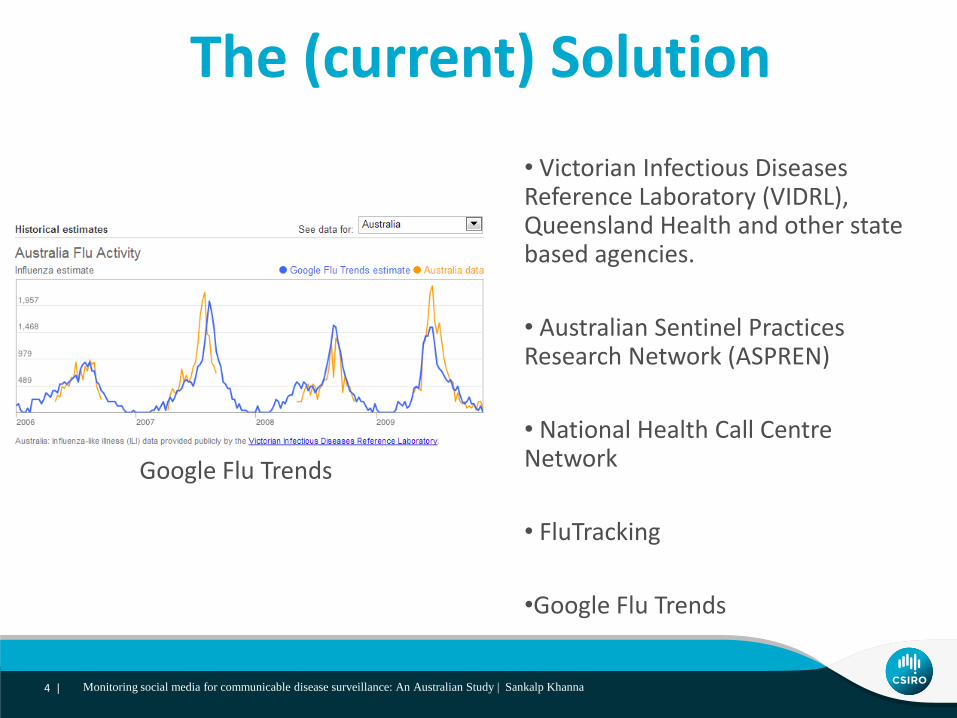
The (current) Solution
• Victorian Infectious Diseases Reference Laboratory (VIDRL), Queensland Health and other state based agencies.
• Australian Sentinel Practices Research Network (ASPREN)
• National Health Call Centre Network
• FluTracking
•Google Flu Trends
4 | Monitoring social media for communicable disease surveillance: An Australian Study | Sankalp Khanna
Google Flu Trends
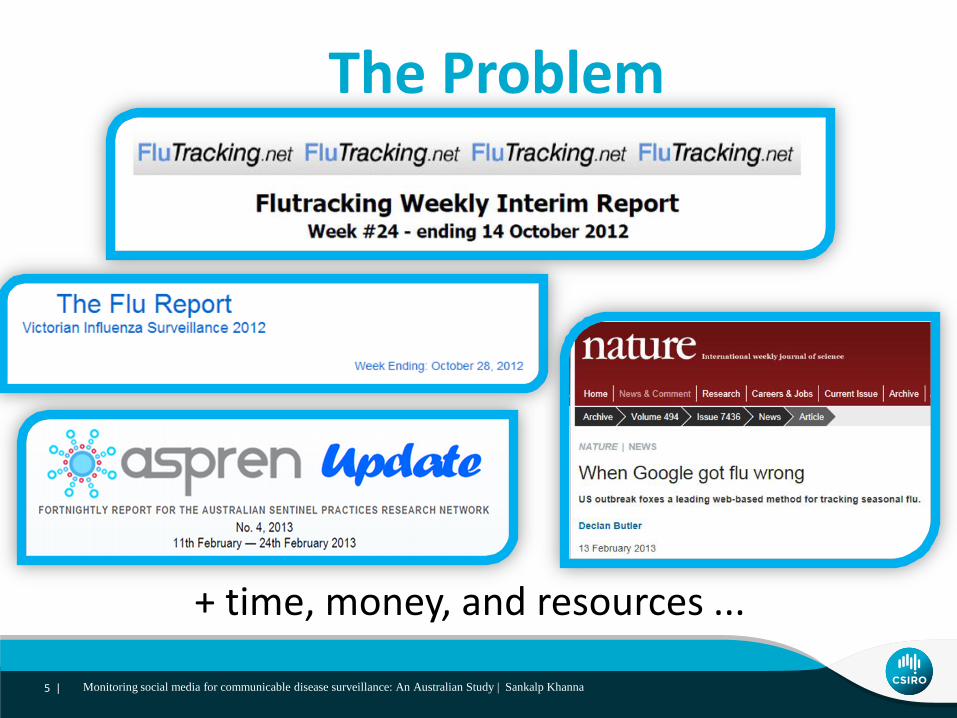
The Problem
+ time, money, and resources ...
5 | Monitoring social media for communicable disease surveillance: An Australian Study | Sankalp Khanna

Why Twitter?
There are 200 million active users on Twitter! And those users post an average of 400 million Tweets every day1
6 | Monitoring social media for communicable disease surveillance: An Australian Study | Sankalp Khanna
1 https://business.twitter.com/audiences-twitter 2 http://www.website-monitoring.com/blog/2012/11/07/twitter-2012-facts-and-figures-infographic/ 3 http://www.adcorp.com.au/news-blog/social-media-statistics-july-2012,-australia-new-z
Top 10 Countries by tweet volume (July 2012)2
Top 15 Social Media Sites in Australia (July 2012) 3

• 3.5 months ... May to August 2011
• Victorian Tweets – using CSIRO’s ESA-AWTM architecture1
• 13.5+ million tweets
• Filtered on Keywords (see table)2,3
• Retweets were removed
• 100,000 potentially influenza related
tweets remaining
Data
7 | Monitoring social media for communicable disease surveillance: An Australian Study | Sankalp Khanna
1 Jie Yin, et al., “ESA: Emergency Situation Awareness via Microbloggers”, CIKM 2012 (2012). 2 Sadilek A, Kautz H, Silenzio V. Predicting disease transmission from geo-tagged micro-blog data. Conf Proc 26th AAAI Conference on
Artificial Intelligence 2012, 136-42 3 Signorini A, Segre AM, Polgreen PM. The use of Twitter to track levels of disease activity and public concern in the U.S. during the influenza
A H1N1 pandemic. PLoS One. 2011 May 4;6(5):e19467
Flu Sick Headache Fever
Ache Cough Throat Cold
Stomach Runny Sneeze Pneumonia
Influenza Stuffy Tylenol Diarrhea
Snot Tissues Antibiotics Shivering
Unwell Chills Doctor Fatigued
Down With Vomit Nausea Vicks
Not:doctor who Not:jab Not:shot Not:pandemic
Not:fully sick Not:sick of Not:vaccine Not:Bieber
Not:weather
Table: List of keywords used for filtering
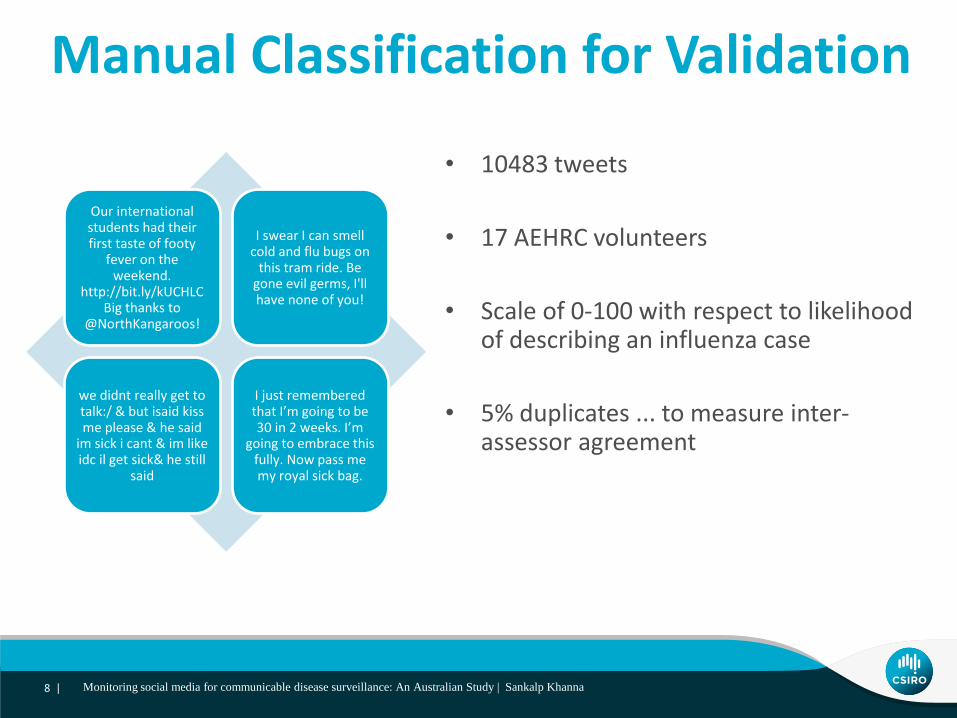
Manual Classification for Validation
• 10483 tweets
• 17 AEHRC volunteers
• Scale of 0-100 with respect to likelihood of describing an influenza case
• 5% duplicates ... to measure inter-assessor agreement
8 | Monitoring social media for communicable disease surveillance: An Australian Study | Sankalp Khanna
Our international students had their first taste of footy
fever on the weekend.
http://bit.ly/kUCHLC Big thanks to
@NorthKangaroos!
I swear I can smell cold and flu bugs on
this tram ride. Be gone evil germs, I'll have none of you!
we didnt really get to talk:/ & but isaid kiss me please & he said
im sick i cant & im like idc il get sick& he still
said
I just remembered that I’m going to be 30 in 2 weeks. I’m
going to embrace this fully. Now pass me my royal sick bag.

Manual Classification for Validation
• Standard deviation between duplicate tweet rating was 4.89
• Shorter tweets had higher standard deviation on average.
• Average score used for duplicate tweets
9 | Monitoring social media for communicable disease surveillance: An Australian Study | Sankalp Khanna
0
2000
4000
6000
8000
0 1-25 26-50 51-75 76-99 100
Nu
mb
er o
f Tw
eets
Score
Figure. Manually classified tweets (bucketed by ‘likelihood of flu’ score).
A Model for Automatic Flu Classification
10 | Monitoring social media for communicable disease surveillance: An Australian Study | Sankalp Khanna
.
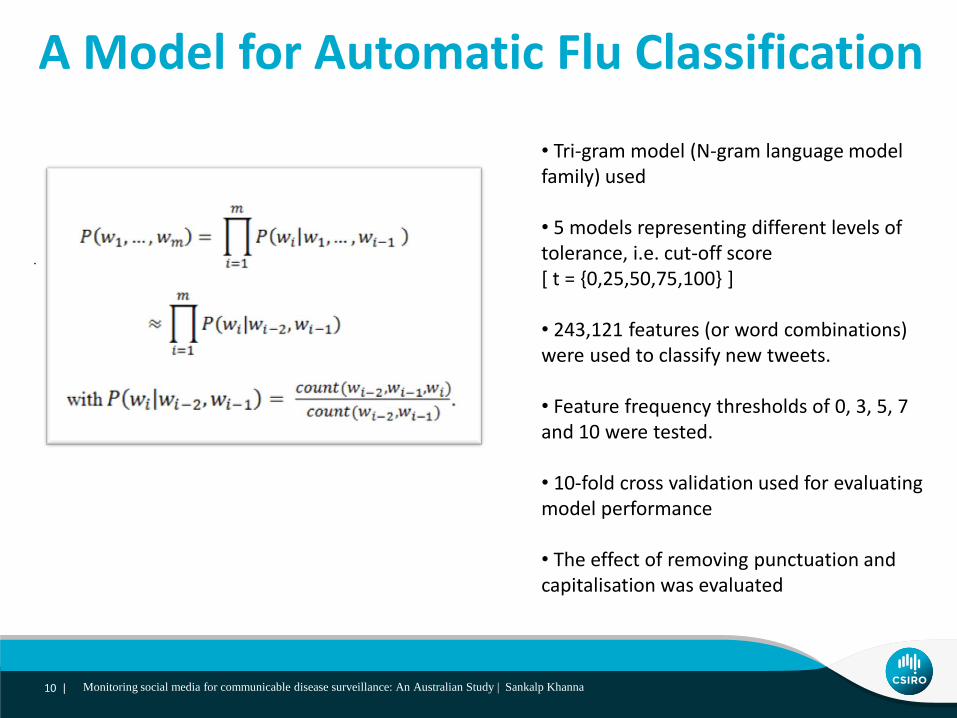
• Tri-gram model (N-gram language model family) used • 5 models representing different levels of tolerance, i.e. cut-off score [ t = {0,25,50,75,100} ] • 243,121 features (or word combinations) were used to classify new tweets. • Feature frequency thresholds of 0, 3, 5, 7 and 10 were tested. • 10-fold cross validation used for evaluating model performance • The effect of removing punctuation and capitalisation was evaluated
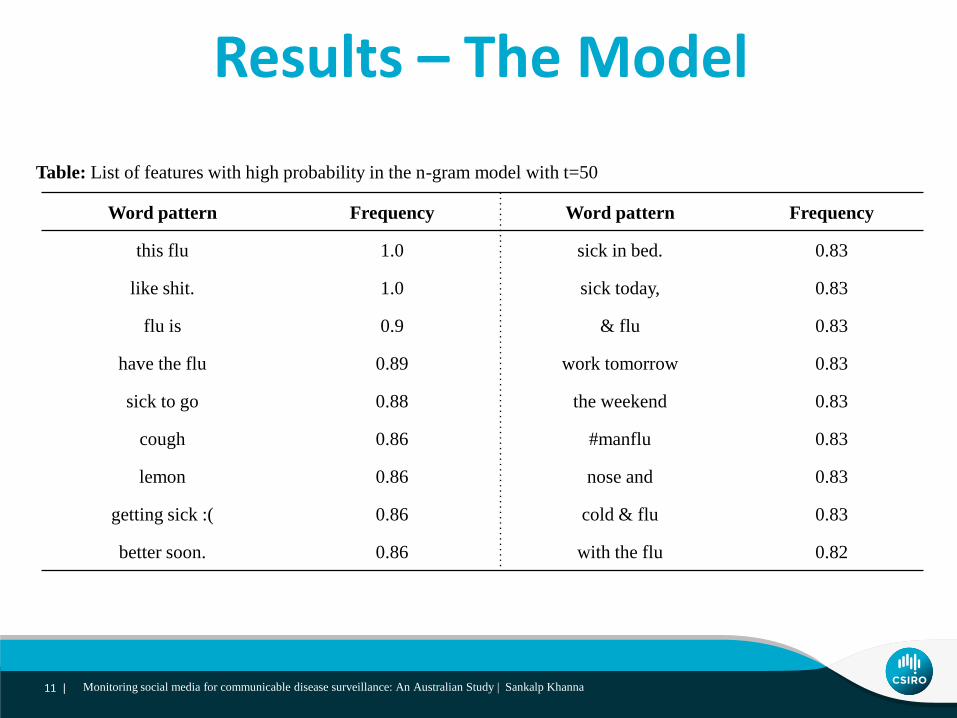
Word pattern Frequency Word pattern Frequency
this flu 1.0 sick in bed. 0.83
like shit. 1.0 sick today, 0.83
flu is 0.9 & flu 0.83
have the flu 0.89 work tomorrow 0.83
sick to go 0.88 the weekend 0.83
cough 0.86 #manflu 0.83
lemon 0.86 nose and 0.83
getting sick :( 0.86 cold & flu 0.83
better soon. 0.86 with the flu 0.82
Table: List of features with high probability in the n-gram model with t=50
Results – The Model
11 | Monitoring social media for communicable disease surveillance: An Australian Study | Sankalp Khanna
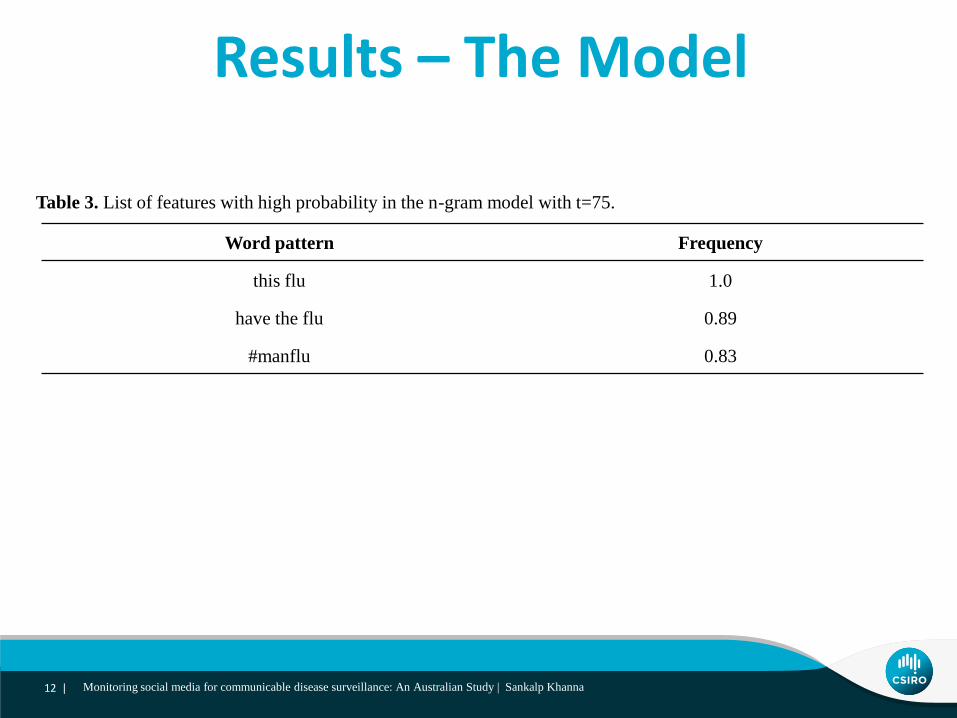
Word pattern Frequency
this flu 1.0
have the flu 0.89
#manflu 0.83
Table 3. List of features with high probability in the n-gram model with t=75.
Results – The Model
12 | Monitoring social media for communicable disease surveillance: An Australian Study | Sankalp Khanna

Results – The Model
13 | Monitoring social media for communicable disease surveillance: An Australian Study | Sankalp Khanna
50
60
70
80
90
100
0 25 50 75 100
Co
rrec
tly
Iden
tifi
ed (
%)
Threshold t
50
60
70
80
90
100
0 3 5 7 10
Co
rrec
tly
Iden
tifi
ed (
%)
Feature Frequency Threshold
50
60
70
80
90
100
0 25 50 75 100
Co
rrec
tly
Iden
tifi
ed (
%)
Threshold t
(a) different certainty scores (b) different feature frequency (c) different certainty scores cutoffs (t=100) punctuation and capitalisation removed

• Improve automatic flu classification model
• Investigate correlation with VIDRL confirmed influenza cases.
• Incorporate other data sources (social media, weather data, etc)
The Future
14 | Monitoring social media for communicable disease surveillance: An Australian Study | Sankalp Khanna

CSIRO Australian e-Health Research Centre Sankalp Khanna Postdoctoral Research Fellow
t +61 7 3253 3629 e [email protected] w www.aehrc.com
THE AUSTRALIAN E-HEALTH RESEARCH CENTRE
Productivity isn’t everything, but in the long run it is almost everything.
Paul Krugman, 1991 Professor Princeton University, Nobel Prize in Economics 2008