monitoring restoration success: assessing marine-freshwater food web linkages using stable isotopes...
TRANSCRIPT

Monitoring restoration success: Assessing Marine-Freshwater
Food Web Linkages Using Stable Isotopes
Dr. Karen Wilson, University of Southern MaineDr. Graham Sherwood, Gulf of Maine Research
InstituteDr. Jonathan Grabowski, Gulf of Maine Research
InstituteDr. Theodore Willis, University of Southern Maine –
Aquatic Systems Group

Juven
ile lamp
rey m
igrate to
sea
sea lamprey larvae
Sp
awn
ing
sea lam
prey
April May June July Aug Sept Oct Nove
stu
ary
tid
al
bra
ck
ish
tid
al
fre
sh
Ma
ins
tem
o
r tr
ibu
tary
po
nd
s/l
ak
es
Elvers m
ove u
pstream
Matu
re adu
lt eels leave freshw
ater
Ad
ult alew
ife
Spawning ALE
AL
E Y
OY
exit lakes
AL
E Y
OY
exit lakes
ALE YOY
Sh
ad
Spawning shadS
had
YO
Y exit river
shad YOY
Salmon parr
Ad
ult salm
on
Spawningsalmon
Salm
on
smo
lt exit river
Ad
ult b
lueb
acks
Blu
eback
YO
Y
Sp
awn
ing
b
lueb
acks
Blu
eback Y
OY
exit river
Sm
elt Y
OY
exit river
Sm
elt ad
smelt YOY
Sp
awn
ing
Sm
elt
Also in the lower river:Shortnose sturgeonAtlantic sturgeonTomcodStriped Bass

Penobscot River Restoration Project

Food Web Restoration Indicators
Indicator Rationale & desired outcomes
Trophic levels
More trophic levels = •more diverse predator-prey interactions•greater prey availability•greater ecosystem complexity (i.e., more pathways for food web interactions)
Connectivity Greater reliance on prey from non-focal habitats (i.e., marine vs. freshwater) indicating increased marine-freshwater linkages
See http://www.umaine.edu/searunfish/penobscotexchange/PRFramework_final.pdf
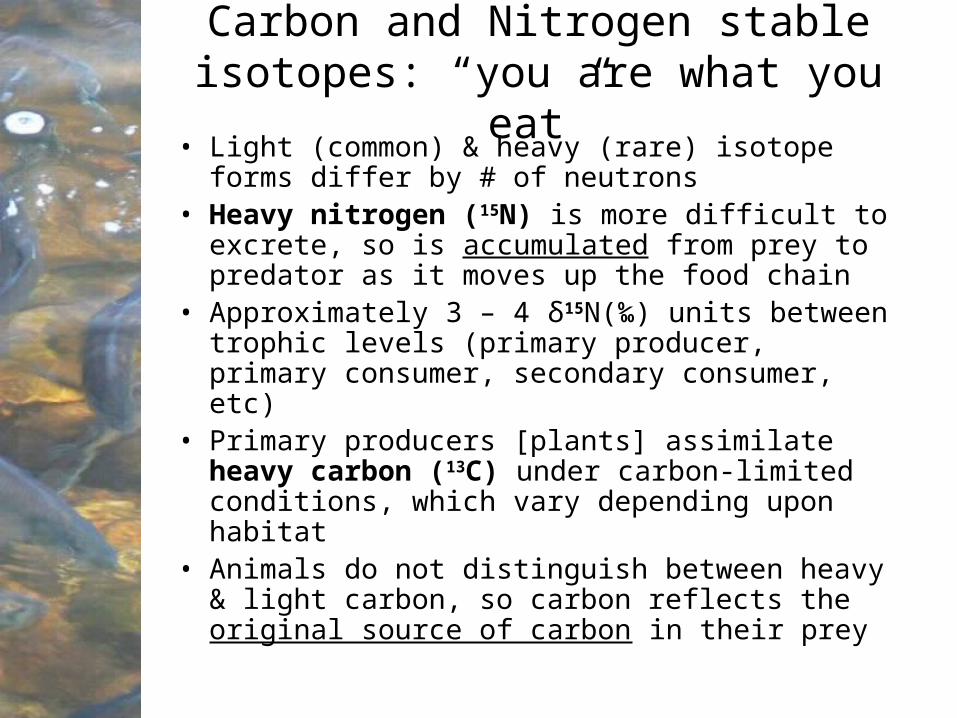
Carbon and Nitrogen stable isotopes: “you are what you eat”• Light (common) & heavy (rare) isotope
forms differ by # of neutrons• Heavy nitrogen (15N) is more difficult to
excrete, so is accumulated from prey to predator as it moves up the food chain
• Approximately 3 – 4 δ15N(‰) units between trophic levels (primary producer, primary consumer, secondary consumer, etc)
• Primary producers [plants] assimilate heavy carbon (13C) under carbon-limited conditions, which vary depending upon habitat
• Animals do not distinguish between heavy & light carbon, so carbon reflects the original source of carbon in their prey

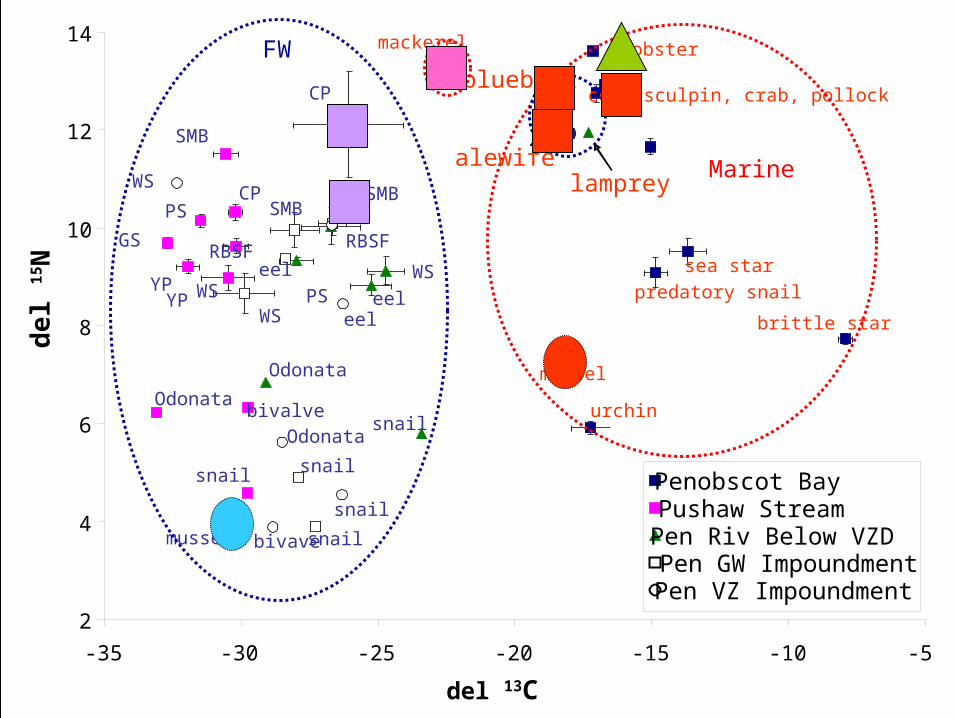
You are what you eat:
• 15N indicates trophic position• 13C indicates habitat- in this
case:– freshwater (lighter) – marine (heavier)
• Other critical advantage: stable isotope signatures of slow turn-over tissues integrate feeding relationships over many months

With increases in anadromous fish, particularly alewife, it is
expected that: • Spawning alewife add marine-derived
nutrients through spawning, excretion & mortality, shifting freshwater 15N signatures higher and enriching freshwater 13C towards heavier (marine) values.
• YOY or juvenile alewife may become important forage for larger predators, increasing trophic position of some species (SMB, CP, cod, mackerel).
• Nearshore marine predators may consume out-migrating YOY alewife in greater numbers, shifting marine 13C signatures towards lighter (freshwater) values.

Expectations: carbon
river mouth
13C
(‰)
Marine carbon signature
Freshwater carbon signature
Before Restoration
After Restoration
freshwater marine
Distance from river mouth
- 26
-16

Field collections
• Muscle tissue samples from common fish & top predators (bass, chain pickerel, cod, mackerel)– freshwater fish collected in collaboration
with U. Maine Fish Index Surveys– marine fish collected in part in
collaboration with MeDMR
• Tissue samples from food web base– primary consumers including snails
(benthic algae) & mussels (phytoplankton)
– secondary consumers (crayfish, crabs, insects)

Freshwater sites: Penobscot River and Tributaries

Penobscot River
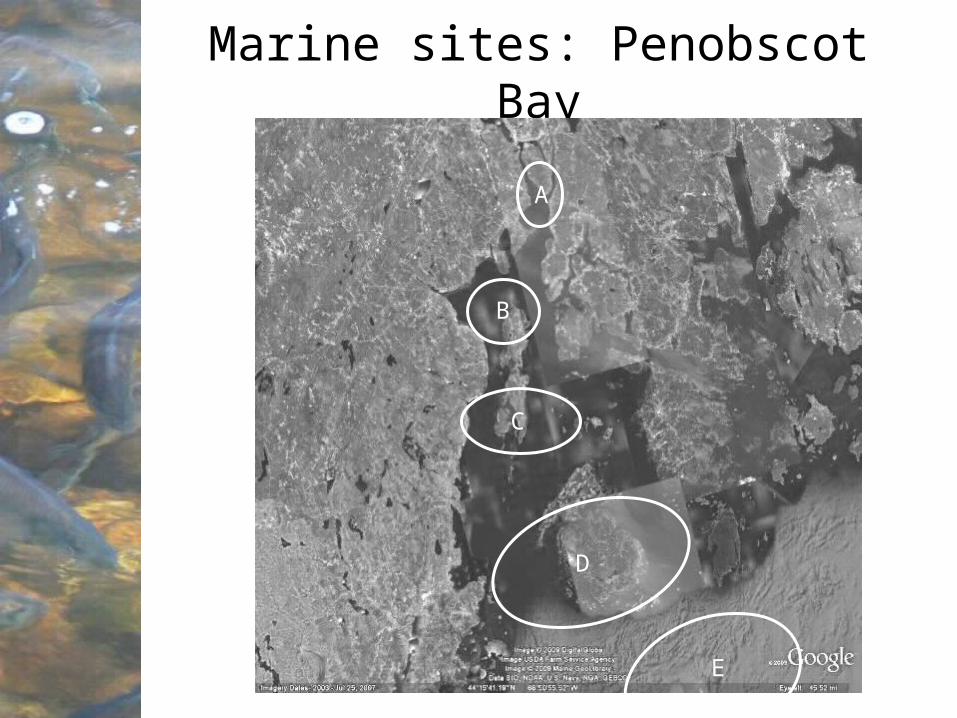
Marine sites: Penobscot Bay
A
B
C
D
E

RV ‘Gadid’ - GMRI
September 2009
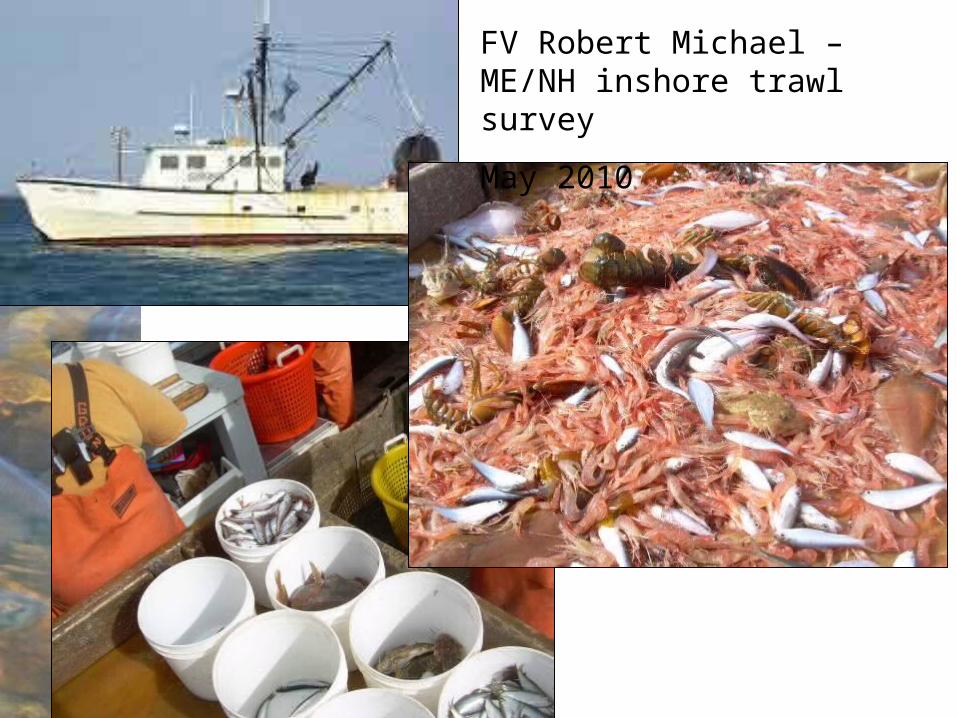
FV Robert Michael – ME/NH inshore trawl survey
May 2010
2
4
6
8
10
12
14
-35 -30 -25 -20 -15 -10 -5
del 13C
de
l 15 N
Penobscot BayPushaw StreamPen Riv Below VZDPen GW ImpoundmentPen VZ Impoundment
SMB
snail
CP
CP
mussels
snail
Odonata
SMB
snail
snail
urchin
brittle star
mussel
predatory snail
sea star
lobster
cod, sculpin, crab, pollock
WS
WS
WS
eel
bivalveOdonata
Odonata
bivavesnail
eel
SMB
RBSF
WSYP
RBSF
YP
GS
PS
PS
eel
FW
Marinelamprey
alewife
blueback
mackerel

-0.2
0
0.2
0.4
0.6
0.8
1
Chain pickerel SMB Mackerel Alewife Blueback
CodPer
cent
FW
influ
ence
Influenced by adult alewife?
Influenced by juvenile alewife?

Connectivity
-35
-30
-25
-20
-15
-10
Pusha
w
GW
IVZDI
Below
VZD A B C D E
RiverMouth
Del
13
C
Inverts_RiverFish_River
Fish_BayInverts_Bay
What’s next?
• Analyze new samples (more fish and inverts from Pen bay and additional tributaries)
• Comparison to Kennebec River system (2010)
• Re-sampling post dam removal


Mechanisms: high abundances of river herring
Spring
Fall
Freshwater
Marine
Summer