monitoring plant diversity: simpson’s index and species richness assessment · monitoring plant...
TRANSCRIPT

MONITORING PLANT DIVERSITY: SIMPSON’S INDEX AND SPECIES
RICHNESS ASSESSMENT
Prepared for:
Canadian Forest Products Ltd. Administration Center
5162 Northwood Pulpmill Road Prince George, B.C. V2L 4W2
Prepared by:
Timberline Forest Inventory Consultants Ltd. 1579 9th Ave
Prince George, B.C. V2L 3R8
March 2003
MONITORING PLANT DIVERSITY: SIMPSON’S INDEX AND SPECIES RICHNESS ASSESSMENT
i
TABLE OF CONTENTS
1.0 INTRODUCTION ...................................................................................................................1 2.0 INDEX CALCULATIONS......................................................................................................2
2.1 Data Sources and Assembly .................................................................................................2 2.2 MSAccess-based Calculation Tool........................................................................................3 2.3 Plant Diversity Calculation Results .......................................................................................3 2.4 Expanded Plant Diversity Targets for Managed Stands...........................................................7
3.0 DISCUSSION..........................................................................................................................8 3.1 Target Review.....................................................................................................................8 3.2 Comparison of Indices .........................................................................................................9
4.0 REFERENCES......................................................................................................................11
LIST OF TABLES Table 1 Number of NIVMA TRENDS and Natural Regeneration Plots By Grouped Site Association for
the PG TSA ........................................................................................................................3 Table 2 Plant Diversity Index Values for all NIVMA TRENDS Plots Monitored in the PG TSA ..........4 Table 3 Plant Diversity Index Values for Natural Regeneration Plots in the PG TSA ...........................7 Table 4 Plant Diversity Index Means, by Grouped Site Associations of Most Recent NIVMA TRENDS
Plot Measurements in the PG TSA .......................................................................................7 Table 5 Diversity Targets for Managed Stands ..................................................................................8 Table 6 Comparison of Mean Index Values With Tentative Targets ...................................................8
LIST OF FIGURES
Figure 1 Shannon-Wiener Index Values Post-Harvest for Three Grouped Site Association Plots ...........9 Figure 2 Simpson’s Index Values Post-Harvest for Three Grouped Site Association Plots .................. 10 Figure 3 Species Richness Values Post-Harvest for Three Grouped Site Association Plots .................. 10
LIST OF APPENDICES
Appendix 1 Grouped Site Association Key Appendix 2 User Manual for Plant Diversity Index Calculation Tool Appendix 3 Plant Diversity Index Calculation Tool (under separate cover)

MONITORING PLANT DIVERSITY: SIMPSON’S INDEX AND SPECIES RICHNESS ASSESSMENT
1
1.0 INTRODUCTION There appears to be increasing public perception that forest management practices, such as clearcut harvesting, negatively impact ecosystems as compared to natural disturbance events (i.e. fire). Use of diversity indices allow objective assessment of whether ecosystems are adversely affected by various management practices such as herbicide use, thinning, season of harvest, etc. Forest management practices may indeed impact site and the use of diversity indices can help identify negative and positive trends for plant diversity. Canfor currently uses the Shannon-Weiner plant diversity index as an indicator of plant diversity for their Sustainable Forest Management Plan (SFMP) (Wade, 2002). The Shannon-Wiener Index was selected as the first of several diversity indices to assess vascular plant diversity across the Prince George Timber Supply Area (PG TSA). The index provides objective data to assess various forest management practices in the PG TSA. The Shannon-Wiener index for a plant community is derived using the following equation:
S
H = - ∑ (pi)(ln pi) i=1
where: H = index of species diversity S = number of species pi = proportion of total sample belonging to the ith species ln = natural log1 Due to its logarithmic nature, the Shannon-Wiener Index is sensitive to uncommon plant species and less sensitive to very common species (Krebs, 1989). More value is given to the presence of each species than is given to the abundance of each species. In operational trials, it is more effective and scientifically accepted to use a combination of indices or measures to assess plant diversity (Reich et al, 2001; Sullivan et al, 1998). Each index is used to identify particular trends in plant diversity that the Shannon-Wiener index may not reveal. Simpson’s index and species richness are commonly used to evaluate different trends in plant diversity (Reich et al, 2001). Simpson’s index is not logarithmic in nature and therefore is more sensitive to shifts in dominant plant species. In essence, equal value is given to the presence of any species, allowing the abundance of those species to increase the diversity value for a given plant community.
1 Any base of logarithms can be used for this index, as they are convertible to one another by a constant multiplier (Krebs, 1989).

MONITORING PLANT DIVERSITY: SIMPSON’S INDEX AND SPECIES RICHNESS ASSESSMENT
2
Simpson’s index is calculated as follows:
S
SI = ∑ pi2
i=1 where: SI = Simpson’s index of species diversity S = number of species pi = proportion of total sample belonging to the ith species The Simpson’s index values range between 0 and 1. The closer to 0 the value is, the more diverse the plot is. A plot with only one species would have a Simpson’s index value of 1.0. Trends are opposite to those found for Shannon-Wiener values since Simpson’s Index values decrease with increased diversity. Species richness (S) is simply a count of the number of plant species present in a sample plot. When used in combination with diversity indices, a species richness assessment can reveal other trends in plant diversity that the more complex indices may not reveal. At certain points in seral development, it is possible for the Simpson’s and Shannon-Wiener indices to decrease while the species richness increases i.e. plant communities transitional between seral stages can result in a more diverse assemblage of species, captured only by the richness measure (Reich et al, 2001). The objectives of this project are:
• to evaluate the effects of forest harvesting on vascular plant diversity in the PG TSA, using the Simpson’s Index and species richness counts;
• to compare the results with existing Shannon-Wiener index calculations; and • to develop and document a standard protocol for yearly assessments of plant diversity using the
Simpson’s index, species richness counts, and the Shannon-Wiener index. 2.0 INDEX CALCULATIONS 2.1 Data Sources and Assembly There were two main database sources for this project. The NIVMA TRENDS 2002 SNAPSHOT ALL 20030224 database provided the vegetation data for managed stands. The BC Ministry of Forests ecosystem databases provided vegetation data for naturally regenerating stands. A previous Timberline report Monitoring Plant Diversity for Certification Initiatives (Bernier and Smyth, 2002) described the selection of ten grouped site associations for monitoring across the PG TSA, identified NIVMA TRENDS plots to provide managed stand data and identified natural stands plot data that were adequate for providing baseline data. The reader is encouraged to read this previous report for effective interpretation of this current document. Appendix 1 provides the Biogeoclimatic unit to grouped site association key. A comparison was made between the 2001 TRENDS database used in Timberline’s report and the new TRENDS 2002 database to ensure all original plots were available and to add any new NIVMA plots
MONITORING PLANT DIVERSITY: SIMPSON’S INDEX AND SPECIES RICHNESS ASSESSMENT
3
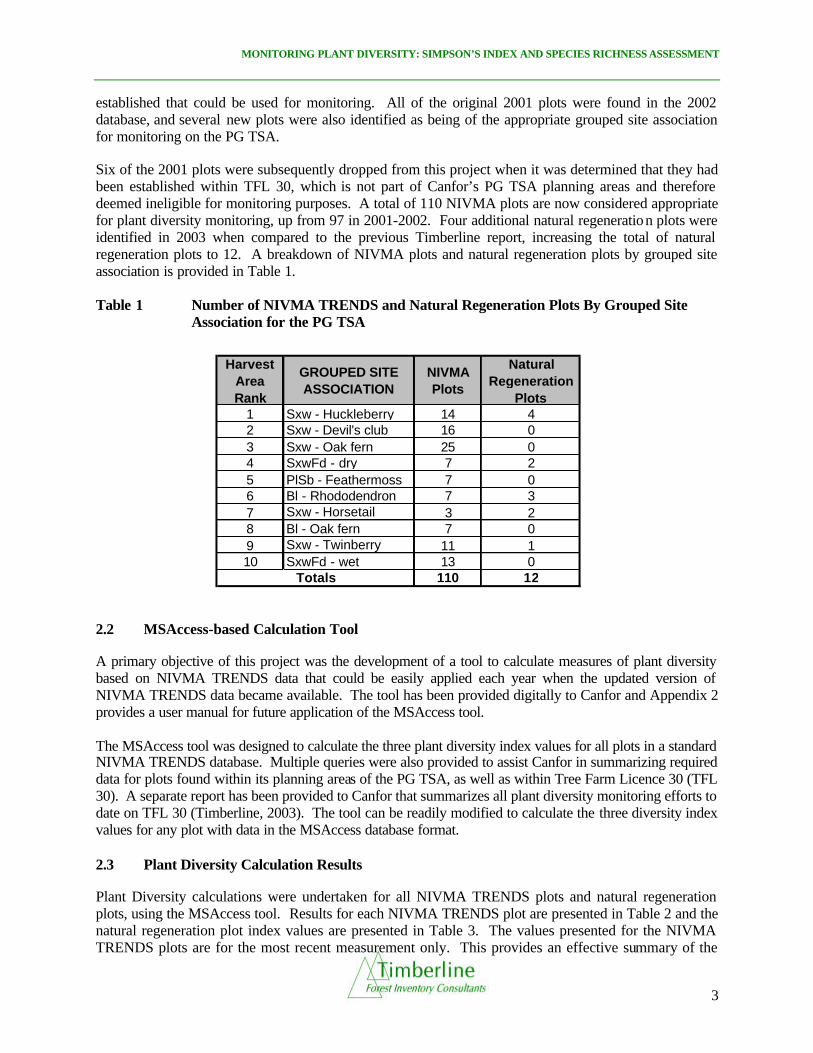
established that could be used for monitoring. All of the original 2001 plots were found in the 2002 database, and several new plots were also identified as being of the appropriate grouped site association for monitoring on the PG TSA. Six of the 2001 plots were subsequently dropped from this project when it was determined that they had been established within TFL 30, which is not part of Canfor’s PG TSA planning areas and therefore deemed ineligible for monitoring purposes. A total of 110 NIVMA plots are now considered appropriate for plant diversity monitoring, up from 97 in 2001-2002. Four additional natural regeneration plots were identified in 2003 when compared to the previous Timberline report, increasing the total of natural regeneration plots to 12. A breakdown of NIVMA plots and natural regeneration plots by grouped site association is provided in Table 1. Table 1 Number of NIVMA TRENDS and Natural Regeneration Plots By Grouped Site
Association for the PG TSA
2.2 MSAccess-based Calculation Tool A primary objective of this project was the development of a tool to calculate measures of plant diversity based on NIVMA TRENDS data that could be easily applied each year when the updated version of NIVMA TRENDS data became available. The tool has been provided digitally to Canfor and Appendix 2 provides a user manual for future application of the MSAccess tool. The MSAccess tool was designed to calculate the three plant diversity index values for all plots in a standard NIVMA TRENDS database. Multiple queries were also provided to assist Canfor in summarizing required data for plots found within its planning areas of the PG TSA, as well as within Tree Farm Licence 30 (TFL 30). A separate report has been provided to Canfor that summarizes all plant diversity monitoring efforts to date on TFL 30 (Timberline, 2003). The tool can be readily modified to calculate the three diversity index values for any plot with data in the MSAccess database format. 2.3 Plant Diversity Calculation Results Plant Diversity calculations were undertaken for all NIVMA TRENDS plots and natural regeneration plots, using the MSAccess tool. Results for each NIVMA TRENDS plot are presented in Table 2 and the natural regeneration plot index values are presented in Table 3. The values presented for the NIVMA TRENDS plots are for the most recent measurement only. This provides an effective summary of the
Harvest Area Rank
GROUPED SITE ASSOCIATION
NIVMA Plots
Natural Regeneration
Plots1 Sxw - Huckleberry 14 42 Sxw - Devil's club 16 03 Sxw - Oak fern 25 04 SxwFd - dry 7 25 PlSb - Feathermoss 7 06 Bl - Rhododendron 7 37 Sxw - Horsetail 3 28 Bl - Oak fern 7 09 Sxw - Twinberry 11 110 SxwFd - wet 13 0
110 12Totals

MONITORING PLANT DIVERSITY: SIMPSON’S INDEX AND SPECIES RICHNESS ASSESSMENT
4
existing plant diversity status on the landbase. Previous methods (per Bernier and Smyth, 2002; Wade, 2002) used an average of all measurements over time for each plot. While the averaging method reduces uncertainty about individual plot measurements, it does not provide an effective means of monitoring the existing condition. Table 4 provides the mean diversity index values for the most recent measurements of all NIVMA TRENDS plots in a grouped site association. Table 2 Plant Diversity Index Values for all NIVMA TRENDS Plots Monitored in the PG
TSA
GROUPED SITE ASSOCIATION TM CP BLK INS
Harvest Year
Year Measured
Shannon-Wiener Index
Simpson's Index
Species Richness
Bl - Oak fern FJ3745 745 155 1 2002 2002 3.219 0.056 37Bl - Oak fern FJ3745 745 125 1 1999 2002 3.052 0.077 44Bl - Oak fern EJ4207 207 1 1 1997 2002 2.604 0.156 32Bl - Oak fern FJ3655 655 61 1 1997 2002 2.985 0.091 44Bl - Oak fern EJ3704 704 1 1 1999 2001 2.695 0.132 29Bl - Oak fern EJ3136 136 6 1 - 1999 - - - Bl - Oak fern EJ4208 208 1 1 - 1997 - - - Bl - Rhododendron EJ3953 953 11 1 - 2002 - - - Bl - Rhododendron FJ3433 433 1 1 2001 2002 3.366 0.052 41Bl - Rhododendron FJ3130 130 146 1 2000 2002 3.045 0.060 27Bl - Rhododendron FJ3488 488 94 1 1998 2002 2.440 0.203 30Bl - Rhododendron EJ4931 931 1 1 1997 2002 2.561 0.155 35Bl - Rhododendron FH3528 528 2 1 - 2001 - - - Bl - Rhododendron FJ3097 97 39 1 - 1999 - - - PlSb - Feathermoss FJ3U14 U14 31 2 - 2002 - - - PlSb - Feathermoss FJ3328 328 3 1 1999 2002 3.383 0.074 59PlSb - Feathermoss EJ3975 975 5 1 1997 2002 2.342 0.184 34PlSb - Feathermoss FJ3577 577 2 1 1999 2001 3.748 0.034 56PlSb - Feathermoss EJ4406 406 1 1 1996 2001 2.633 0.171 38PlSb - Feathermoss EJ4910 910 1 1 1996 2001 2.923 0.107 46PlSb - Feathermoss FJ3577 577 1 1 - 1997 - - - Sxw - Devil's club EJ370I 70I 1 1 - 2002 - - - Sxw - Devil's club EJ370L 70L 1 1 - 2002 - - - Sxw - Devil's club EJ3133 133 1 1 - 2002 - - - Sxw - Devil's club EJ370D 70D 1 1 - 2002 - - - Sxw - Devil's club EJ3942 942 1 1 - 2002 - - - Sxw - Devil's club FJ3731 731 3 1 2000 2002 3.285 0.055 50Sxw - Devil's club FJ3636 636 93 1 1997 2002 2.743 0.144 43Sxw - Devil's club FD7058 58 3 1 1994 2002 3.433 0.056 57Sxw - Devil's club FD7058 58 3 2 1994 2002 3.354 0.062 54Sxw - Devil's club FD7015 15 1 1 1993 2002 2.927 0.121 54Sxw - Devil's club EJ3701 701 1 1 1998 2001 3.116 0.079 45Sxw - Devil's club EJ3057 57 2 1 1997 2001 3.098 0.062 35Sxw - Devil's club EJ4707 707 4 1 1993 2001 2.891 0.087 42Sxw - Devil's club EJ4707 707 4 2 1993 2001 3.069 0.066 39Sxw - Devil's club EJ3099 99 4 1 - 2000 - - - Sxw - Devil's club EJ3105 105 1 1 1996 2000 3.296 0.063 47Sxw - Horsetail FJ3680 680 9 2 1999 2002 3.306 0.070 57Sxw - Horsetail FJ3319 319 6 1 1998 2002 2.588 0.186 54Sxw - Horsetail FD7015 15 1 2 1993 2002 2.366 0.194 37

MONITORING PLANT DIVERSITY: SIMPSON’S INDEX AND SPECIES RICHNESS ASSESSMENT
5
GROUPED SITE ASSOCIATION TM CP BLK INS
Harvest Year
Year Measured
Shannon-Wiener Index
Simpson's Index
Species Richness
Sxw - Huckleberry EJ3918 918 4 1 - 2002 - - - Sxw - Huckleberry FJ3338 338 237 1 2001 2002 3.607 0.028 40Sxw - Huckleberry EJ3844 844 1 1 2000 2002 3.478 0.045 56Sxw - Huckleberry FJ3467 467 310 1 2000 2002 3.132 0.046 25Sxw - Huckleberry FJ3681 681 265 1 2000 2002 3.390 0.063 55Sxw - Huckleberry EJ3800 800 1 1 1999 2002 3.285 0.068 57Sxw - Huckleberry FJ3662 662 147A 1 1999 2002 3.208 0.070 53Sxw - Huckleberry FJ3300 300 84 1 1999 2002 3.200 0.060 46Sxw - Huckleberry FJ3306 306 65 1 1997 2002 3.719 0.044 63Sxw - Huckleberry EJ4621 621 1 1 1996 2002 3.534 0.041 59Sxw - Huckleberry FJ3C16 C16 503 1 - 2001 - - - Sxw - Huckleberry FJ3029 29 55 1 - 1999 - - - Sxw - Huckleberry FJ3124 124 285A 1 1999 1999 2.422 0.167 27Sxw - Huckleberry FJ3029 29 36 1 - 1998 - - - Sxw - Oak fern EJ3975 975 6 1 - 2002 2.907 0.085 28Sxw - Oak fern EJ3942 942 1 3 - 2002 - - - Sxw - Oak fern EJ3942 942 1 2 - 2002 - - - Sxw - Oak fern FJ3C20 C20 515 1 - 2002 - - - Sxw - Oak fern FJ3U15 U15 27 1 - 2002 - - - Sxw - Oak fern FJ3X08 X08 117 1 - 2002 - - - Sxw - Oak fern EJ3984 984 1 1 1999 2002 2.804 0.106 34Sxw - Oak fern FJ3439 439 267 1 1999 2002 2.890 0.100 42Sxw - Oak fern FJ3333 333 8 1 1998 2002 3.102 0.093 51Sxw - Oak fern FJ3654 654 24 1 1998 2002 2.821 0.107 34Sxw - Oak fern EJ4628 628 1 1 1997 2002 3.367 0.053 54Sxw - Oak fern EJ4811 811 2 1 1997 2002 2.861 0.091 29Sxw - Oak fern FJ3750 750 127 1 1996 2002 3.671 0.034 52Sxw - Oak fern FH3525 525 3 1 1996 2002 2.351 0.206 42Sxw - Oak fern FD7060 60 10 1 1994 2002 3.599 0.047 56Sxw - Oak fern FD7060 60 8 1 1993 2002 2.896 0.125 50Sxw - Oak fern FD7060 60 8 2 1993 2002 3.012 0.146 51Sxw - Oak fern EJ3B03 B03 5 1 - 2001 - - - Sxw - Oak fern EJ3048 48 1 1 1996 2001 3.277 0.063 56Sxw - Oak fern EJ4707 707 1 2 1993 2001 3.033 0.089 45Sxw - Oak fern EJ3040 40 1 1 1994 2000 3.640 0.036 52Sxw - Oak fern EJ3952 952 2 1 1995 1999 2.726 0.126 44Sxw - Oak fern FJ3257 257 105 1 - 1997 - - - Sxw - Oak fern EJ370B 70B 1 1 2001 1997 - - - Sxw - Oak fern EJ3947 947 1 1 - 1996 - - -

MONITORING PLANT DIVERSITY: SIMPSON’S INDEX AND SPECIES RICHNESS ASSESSMENT
6
GROUPED SITE ASSOCIATION TM CP BLK INS
Harvest Year
Year Measured
Shannon-Wiener Index
Simpson's Index
Species Richness
Sxw - Twinberry EJ3941 941 5 1 - 2002 - - - Sxw - Twinberry FJ3680 680 9 1 1999 2002 3.702 0.036 61Sxw - Twinberry EJ4922 922 2 1 1997 2002 2.645 0.143 41Sxw - Twinberry FJ3091 91 53 1 1997 2002 3.294 0.074 63Sxw - Twinberry FD7057 57 2 3 1994 2002 2.999 0.086 56Sxw - Twinberry FD7057 57 2 4 1994 2002 2.986 0.091 55Sxw - Twinberry FD7060 60 10 2 1994 2002 3.214 0.072 51Sxw - Twinberry FD7060 60 11 2 1993 2002 2.882 0.135 53Sxw - Twinberry FD7060 60 11 1 1993 2002 3.231 0.086 50Sxw - Twinberry EJ3B03 B03 4 1 - 2001 - - - Sxw - Twinberry EJ4939 939 1 1 - 1997 - - - SxwFd - dry EJ4528 528 1 1 2000 2002 3.550 0.039 47SxwFd - dry EJ3039 39 2 1 2000 2002 3.177 0.089 60SxwFd - dry FJ3094 94 54 1 1999 2002 3.725 0.036 63SxwFd - dry FJ3307 307 81 1 1998 2002 3.105 0.106 57SxwFd - dry EJ4554 554 1 1 1996 2002 2.903 0.142 48SxwFd - dry FJ3566 566 2 1 1997 2001 2.971 0.114 43SxwFd - dry EJ4551 551 1 1 - 1999 - - - SxwFd - wet FJ3628 628 4 1 1999 2002 1.788 0.315 23SxwFd - wet FJ3044 44 43 1 1999 2002 2.473 0.218 44SxwFd - wet EJ4809 809 3 1 1998 2002 2.559 0.141 33SxwFd - wet FJ3015 15 41 1 1998 2002 3.154 0.122 74SxwFd - wet EJ3975 975 3 1 1997 2002 2.440 0.128 29SxwFd - wet EJ3960 960 5 1 1996 2002 3.216 0.049 30SxwFd - wet EJ3047 47 1 1 1996 2002 3.403 0.060 60SxwFd - wet EJ3981 981 1 1 1996 2002 2.617 0.102 22SxwFd - wet EJ3940 940 2 1 1998 2001 2.415 0.259 37SxwFd - wet FH3534 534 1 1 1997 2001 2.156 0.200 21SxwFd - wet FJ3442 442 181 1 1996 2001 3.544 0.039 45SxwFd - wet EJ3952 952 2 2 1995 1999 2.719 0.099 37SxwFd - wet EJ3930 930 3 1 - 1996 - - -

MONITORING PLANT DIVERSITY: SIMPSON’S INDEX AND SPECIES RICHNESS ASSESSMENT
7
Table 3 Plant Diversity Index Values for Natural Regeneration Plots in the PG TSA
Table 4 Plant Diversity Index Means, by Grouped Site Associations of Most Recent NIVMA
TRENDS Plot Measurements in the PG TSA
2.4 Expanded Plant Diversity Targets for Managed Stands Canfor’s 2002 PG TSA SFMP presented tentative targets for plant diversity on managed stands, based solely on the Shannon-Wiener index. The new diversity index values calculated for natural regeneration stands were used to set some additional tentative targets for managed stands in order to compare the effectiveness of each index. Table 5 presents tentative targets for all three diversity measures for the ten grouped site associations being monitored by Canfor in the PG TSA. Targets are listed as To Be Determined (TBD) if there are less than two natural regeneration plots available, or if the quality of the data in the natural regeneration plots is suspect.
PlotNumberGrouped Site Association
Shannon-Wiener SIMPSONS RICHNESS
9629701 Bl - Rhododendron 1.523 0.303 259801837 Bl - Rhododendron 2.192 0.143 289801841 Bl - Rhododendron 1.763 0.247 169624792 Sxw - Horsetail 1.663 0.308 32MOGR30 Sxw - Horsetail 2.014 0.176 11MOJD19 Sxw - Huckleberry 2.007 0.153 9Mor9412 Sxw - Huckleberry 2.247 0.121 41Mor9419 Sxw - Huckleberry 2.079 0.164 35Mor942 Sxw - Huckleberry 2.451 0.113 48Mor9418 Sxw - Twinberry 2.467 0.111 459625424 SxwFd - Dry 2.062 0.200 279626611 SxwFd - Dry 2.458 0.128 41
Grouped Site Association
Mean Shannon-Wiener Index
Mean Simpson's
Index
Mean Species
RichnessBl - Oak fern 2.911 0.102 37Bl - Rhododendron 2.853 0.118 33PlSb - Feathermoss 3.006 0.114 47Sxw - Devil's club 3.121 0.080 47Sxw - Horsetail 2.753 0.150 49Sxw - Huckleberry 3.297 0.063 48Sxw - Oak fern 3.060 0.094 45Sxw - Twinberry 3.119 0.090 54SxwFd - dry 3.238 0.088 53SxwFd - wet 2.707 0.144 38

MONITORING PLANT DIVERSITY: SIMPSON’S INDEX AND SPECIES RICHNESS ASSESSMENT
8
Table 5 Diversity Targets for Managed Stands
3.0 DISCUSSION 3.1 Target Review A review of stand plot data from the NIVMA TRENDS database suggests that with one exception, all stands are within their currently known Ranges Of Natural Variation (RONV) for plant diversity. Similar to the Shannon-Wiener index results from previous studies, One Sxw – Huckleberry plot (FJ3124-124-285A-1) is slightly less diverse than the target diversity value for the Simpson’s Index. However the plot is within the RONV using Shannon-Wiener and species richness criteria. When all managed stand plots are grouped by site associations, the mean index values for all plant diversity measures are well above existing targets. Table 6 compares mean index values for managed stands with their corresponding tentative targets. While many of the targets have yet to be established, the mean values for each grouped site association appear to be within expected diversity ranges. Table 6 Comparison of Mean Index Values With Tentative Targets
Grouped Site Association
Shannon-Wiener Mean
Shannon-Wiener Range
Tentative Shannon-
Wiener Target
Simpson's Mean
Simpson's Range
Tentative Simpson's
Target
Richness Mean
Richness Range
Tentative Richness
Target
Sxw - Huckleberry 2.196 2.007 - 2.451 > 2.007 0.138 0.164 - 0.113 < 0.164 33.25 9 - 48 TBDSxw - Devil's club - - TBD - - TBD - - TBDSxw - Oak fern - - TBD - - TBD - - TBDSxwFd - dry 2.26005 2.062 - 2.458 > 2.062 0.16425 0.200 - 0.128 < 0.200 34 27-41 > 27PlSb - Feathermoss - - TBD - - TBD - - TBDBl - Rhododendron 1.826 1.523 - 2.192 > 1.523 0.231 0.303 - 0.143 < 0.303 23 16 - 28 > 16Sxw - Horsetail 1.839 1.663 - 2.014 > 1.663 0.242 0.308 - 0.176 < 0.308 21.5 11 - 32 TBDBl - Oak fern - - TBD - - TBD - - TBDSxw - Twinberry 2.467 - TBD 0.111 - TBD 45 - TBDSxwFd - wet - - TBD - - TBD - - TBD
Grouped Site Association
Mean Shannon-
Wiener Index
Range Shannon-
Wiener Index
Tentative Shannon-
Wiener Target
Mean Simpson's
Index
Range Simpson's
Index
Tentative Simpson's
Target
Mean Species
Richness
Range Species
Richness
Tentative Richness
Target
Bl - Oak fern 2.911 2.604 - 3.219 TBD 0.102 0.156 - 0.056 TBD 37 29 - 44 TBDBl - Rhododendron 2.853 2.440 - 3.366 > 1.523 0.118 0.203 - 0.052 < 0.303 33 27 - 41 > 16PlSb - Feathermoss 3.006 2.342 - 3.748 TBD 0.114 0.184 - 0.034 TBD 47 34 - 59 TBDSxw - Devil's club 3.121 2.743 - 3.433 TBD 0.080 0.144 - 0.055 TBD 47 35 - 57 TBDSxw - Horsetail 2.753 2.366 - 3.306 > 1.663 0.150 0.194 - 0.070 < 0.308 49 37 - 57 TBDSxw - Huckleberry 3.297 2.422 - 3.719 > 2.007 0.063 0.167 - 0.028 < 0.164 48 25 - 63 TBDSxw - Oak fern 3.060 2.351 - 3.671 TBD 0.094 0.125 - 0.034 TBD 45 28 - 56 TBDSxw - Twinberry 3.119 2.645 - 3.702 TBD 0.090 0.143 - 0.036 TBD 54 41 - 63 TBDSxwFd - dry 3.238 2.903 - 3.725 > 2.062 0.088 0.142 - 0.036 < 0.200 53 43 - 63 > 27SxwFd - wet 2.707 1.788 - 3.544 TBD 0.144 0.315 - 0.039 TBD 38 21 - 74 TBD

MONITORING PLANT DIVERSITY: SIMPSON’S INDEX AND SPECIES RICHNESS ASSESSMENT
9
3.2 Comparison of Indices Some interesting trends emerge when all three indices are calculated for individual managed stand plots. Three representative plots were selected to demonstrate how the different indices can be used to evaluate plant diversity in managed stands. The values for the three indices were plotted over time since harvesting occurred, and these values are presented in Figures 1, 2 and 3. Comparison of the trends reveals that the Shannon-Wiener and the Simpson’s Index show similar trends over time, while the species richness trend is somewhat different. While the diversity indices fluctuate substantially over the first few years post-harvest, the species richness trends consistently increase.
Figure 1 Shannon-Wiener Index Values Post-Harvest for Three Grouped Site Association Plots
Shannon-Wiener Index Values Post-harvest for Three Grouped Site Association Plots
2.40
2.60
2.80
3.00
3.20
3.40
3.60
3.80
1 2 3 4 5
Years Since Harvest
Inde
x Va
lue
Sxw - Huckleberry
Sxw - Devil's club
Sxw - Oak fern

MONITORING PLANT DIVERSITY: SIMPSON’S INDEX AND SPECIES RICHNESS ASSESSMENT
10
Figure 2 Simpson’s Index Values Post-Harvest for Three Grouped Site Association Plots
Figure 3 Species Richness Values Post-Harvest for Three Grouped Site Association Plots
Species Richness Post-Harvest for Three Grouped Site Association Plots
15.00
20.00
25.00
30.00
35.00
40.00
45.00
50.00
55.00
60.00
1 2 3 4 5
Years Since Harvest
Spec
ies
Coun
t
Sxw - Huckleberry
Sxw - Devil's club
Sxw - Oak fern
Simpson's Index Vaues Post-Harvest for Three Grouped Site Asssociation Plots
0.00
0.02
0.04
0.06
0.08
0.10
0.12
0.14
0.16
1 2 3 4 5
Years Since Harvest
Inde
x Va
lue
Sxw - Huckleberry
Sxw - Devil's club
Sxw - Oak fern

MONITORING PLANT DIVERSITY: SIMPSON’S INDEX AND SPECIES RICHNESS ASSESSMENT
11
It is likely that during the early successional pathways in these stands, certain species are slowly beginning to dominate the vegetation, decreasing the overall diversity as measured by the Shannon-Wiener and the Simpson’s index. The species richness values demonstrate that the less competitive species are not being eliminated and additional species are being recruited over time. Making comparisons between indices for any given year can also provide insight into the plant diversity of managed stands. For example, in the Sxw – Oak fern grouped site association, the change between year one and year two is quite different for each index. The Shannon-Wiener index increases, the Simpson’s index decreases (in diversity; value increases), and the species richness almost doubles. If only one index is used, there is a very strong possibility that diversity trends for particular grouped site associations could be misinterpreted. It is recommended that Canfor continue to use more than one diversity index to monitor plant diversity in managed stands. Although all stands monitored appear to be within the plant diversity RONV, the three indices will assist Canfor to evaluate the effect on plant diversity of various silviculture activities as they are completed over time on the stand. If the plant diversity of a particular managed stand is determined to be outside itsRONV for its site association, analysis of the individual diversity indices may provide an explanation. If natural successional pathways do not provide insight into the deviation, the management strategies employed on the stand should be reviewed to determine if they are directly responsible for any detrimental effects on plant diversity. However, without statistically valid natural early successional pathway data, the RONV for plant diversity will be difficult to determine and managed stands will remain difficult to monitor. It is recommended that Canfor’s program of field verifying the RONV for grouped site associations continue, thus allowing for meaningful interpretation of trends in managed stand plant diversity indices. 4.0 REFERENCES Bernier, D. and C. Smyth. 2002. Monitoring Plant Diversity for Certification Initiatives. Technical report
for Canadian Forest Products Ltd., Prince George Division, B.C. Prepared by Timberline Forest Inventory Consultants.
Krebs, C.J. 1989. Ecological Methodology. HarperCollins College Publishers, New York, NY USA. Reich, P.B., P Bakken, D. Carlson, L. Frelich, S.K. Friedman, and D. Grigal. 2001. Influence of logging,
fire and forest type on biodiversity and productivity in southern boreal forests. Ecology, 82(10): pp. 2731-2748.
Sullivan, T.P., R.G. Wagner, D.G. Pitt, R.A. Lautenschlager, and D.G. Chen. 1998. Changes in diversity
of plant and small mammal communities after herbicide application in sub-boreal spruce forest. Can. J. For. Res. 28: pp. 168-177.
Timberline Forest Inventory Consultants, 2003. Monitoring Plant Diversity in TFL 30: 2002 – 2003.
Technical report for Canadian Forest Products Ltd., Prince George Division, B.C. Wade, B. 2002. Sustainable Forest Management Plan. Canadian Forest Products Ltd. Fort St. James and
Prince George Operations Weldon, K.L.1986. Statistics: A Conceptual Approach. Prentice-Hall Inc., New Jersey, USA.

MONITORING PLANT DIVERSITY: SIMPSON’S INDEX AND SPECIES RICHNESS ASSESSMENT
APPENDICES

MONITORING PLANT DIVERSITY: SIMPSON’S INDEX AND SPECIES RICHNESS ASSESSMENT
APPENDIX I
GROUPED SITE ASSOCIATION KEY

MONITORING PLANT DIVERSITY: SIMPSON’S INDEX AND SPECIES RICHNESS ASSESSMENT
Grouped Site Association SITE_ASSOCIATION Correlated BEC Unit(s)
Act - Dogwood - Prickly roseAct - Dogwood - Prickly rose SBSdk/08 Alder - Lady fern Alder - Lady fern ESSFwk1 SBSvk/11 Bl - Devil's club Bl - Devil's club - Lady fern ESSFwk1/05 Bl - Devil's club - Rhododendron ESSFmv3/05 ESSFwk2/04 Bl - Horsetail Bl - Globeflower - Horsetail ESSFwc3/03 Bl - Horsetail - Feathermoss ESSFmv2/07 ESSFmv3/07 Bl - Horsetail - Glow moss ESSFmv1/05 Bl - Horsetail - Sphagnum ESSFwk1/06 ESSFwk2/06 Bl - Lady fern - Horsetail ESSFwk1/07 Bl - Huckleberry Bl - Huckleberry - Feathermoss ESSFmv1/03 ESSFwk1/02 Bl - Huckleberry - Gooseberry ESSFmv1/04 Bl - Oak fern Bl - Oak fern - Bluebells ESSFwk2/03 Bl - Oak fern - Brachythecium ESSFwk1/01 Bl - Oak fern - Knight's plume ESSFmv3/04 ESSFwk1/03 ESSFwk2/01 Bl - Oak fern - Sarsaparilla ESSFwk2/02 Bl - Twinberry - Lady fern ESSFwk1/04 Bl - Rhododendron Bl - Rhododendron - Feathermoss ESSFmv1/01 ESSFmv3/01 Bl - Rhododendron - Lady fern ESSFwk2/05 Bl - Rhododendron - Oak fern ESSFwc3/01 BlPl - Crowberry - Cladina BlPl - Crowberry - Cladina ESSFmv3/02 BlSb - Labrador tea BlSb - Labrador tea ESSFmv3/03 Cw - Mesic to Hygric Cw - Devil's club - Ostrich fern ICHvk2/05 CwHw - Devil's club - Lady fern ICHvk2/01 CwHw - Oak fern ICHvk2/04 CwSxw - Skunk cabbage ICHvk2/06 Fd - Xeric to Subxeric Fd - Pinegrass - Alder SBSdw2/04 FdPl - Cladonia SBSdw2/02 SBSdw3/02 HwCw - Xeric to Subxeric HwCw - Cladonia ICHvk2/02 HwCw - Step moss ICHvk2/03 Pl - Cladina Pl - Cladina - Step moss SBSmk1/02 Pl - Feathermoss - Cladina SBSdk/03 SBSdw3/03 SBSmc3/03

MONITORING PLANT DIVERSITY: SIMPSON’S INDEX AND SPECIES RICHNESS ASSESSMENT
Grouped Site Association SITE_ASSOCIATION Correlated BEC Unit(s)
SBSmk1/03 Pl - Huckleberry Pl - Huckleberry - Cladina SBSvk/09 SBSwk1/02 SBSwk3/09 Pl - Huckleberry - Cladonia ESSFmv1/02 SBSmc2/02
Pl - Huckleberry - Velvet-leaved blueberry SBSvk/02
SBSwk1/03 Pl - Pinegrass Pl - Juniper - Dwarf blueberry SBSmc3/02 Pl - Juniper - Feathermoss SBPSdc/01 Pl - Juniper - Ricegrass SBSdk/02 Pl - Kinnikinnick - Cladonia SBPSdc/02 Pl - Kinnikinnick - Feathermoss SBPSdc/03 Pl - Kinnikinnick - Wavy-leaved moss SBSdw2/03 Pl - Pinegrass - Feathermoss SBSdw2/06 PlSb - Feathermoss PlSb - Feathermoss SBPSdc/04 SBSdw2/07 SBSdw3/05 Sb - Huckleberry - Spirea SBSmc3/05 SBSmk1/06 Sb - Labrador tea SBSwk3/4.1 SbPl - Feathermoss SBSmc2/03 SBSmc3/06 SBSwk1/12 Sb - wetlands Sb - Scrub birch - Sedge SBSmk1/10 Sb - Soft-leaved sedge - Sphagnum SBSdk/10 SBSdw2/11 SBSdw3/10 Sb - Sphagnum ICHvk2/07 SbPl - Bog-laurel - Sphagnum SBSvk/08 SbSxw - Scrub birch - Sedge SBSmc2/12 SBSmc3/09 SBSwk1/11 Scrub birch - Sedge - Sphagnum ESSFwk1/08 Sxw - Devil's club Sxw - Devil's club SBSmc2/09 SBSmk1/08 SBSvk/01 SBSwk1/08 SBSwk3/6.1 SBSwk3/6.2 SBSwk3/07 Sxw - Devil's club - Knight's plume SBSdw2/09

MONITORING PLANT DIVERSITY: SIMPSON’S INDEX AND SPECIES RICHNESS ASSESSMENT
Grouped Site Association SITE_ASSOCIATION Correlated BEC Unit(s)
Sxw - Devil's club - Lady fern SBSwk1/10 Sxw - Devil's club - Ostrich fern SBSvk/07 Sxw - Devil's club - Spiny wood fern SBSvk/05 Sxw - Horsetail Sxw - Horsetail SBSdk/07 SBSdw2/10 SBSmc2/10 SBSmc3/08 SBSmk1/09 SBSvk/06 SBSwk1/09 SBSwk3/7.1 SBSwk3/7.2 SBSwk3/08 Sxw - Horsetail - Glow moss SBSdw3/09 SBSmc2/11 Sxw - Horsetail - Meadowrue SBPSdc/06 Sxw - Horsetail: Fluvial phase SBSmk1/09a Sxw - Horsetail: Organic phase SBSmk1/09b Sxw - Skunk cabbage SBSvk/10 Sxw - Huckleberry Sxw - Huckleberry SBSmc2/01 SBSmc3/01 Sxw - Huckleberry - Dwarf blueberry SBSmc2/04
Sxw - Huckleberry - Highbush-cranberry ESSFmv3/06
SBSmk1/01 SBSwk1/05 SBSwk3/03 SBSwk3/04 Sxw - Huckleberry - Soopolallie SBSmc3/04 Sxw - Oak fern Sxw - Oak fern SBSdw3/08 SBSmc2/06 SBSmk1/07 SBSvk/04 SBSwk1/01 SBSwk3/01 Sxw - Pink spirea Sxw - Pink spirea - Oak fern SBSwk1/06 Sxw - Pink spirea - Prickly rose SBSdw3/06 Sxw - Scrub birch - Feathermoss SBPSdc/05 SBSmc2/07 Sxw - Spirea Sxw - Spirea - Feathermoss SBSdk/05 Sxw - Spirea - Purple-peavine SBSdk/01 Sxw - Twinberry Sxw - Twinberry SBSdw2/08 SBSdw3/07

MONITORING PLANT DIVERSITY: SIMPSON’S INDEX AND SPECIES RICHNESS ASSESSMENT
Grouped Site Association SITE_ASSOCIATION Correlated BEC Unit(s)
SBSmc3/07 Sxw - Twinberry - Coltsfoot SBSdk/06 SBSmc2/05 SBSwk3/05 SBSwk3/06 Sxw - Twinberry - Oak fern SBSmc2/08 SBSwk1/07 SxwFd - dry SxwFd - Cat's-tail moss SBSdw2/05 SxwFd - Pinegrass SBSdw1/01 SBSdw3/01 SBSwk3/02 SxwFd - Ricegrass SBSdw3/04 SxwFd - wet SxwFd - Knight's plume SBSmk1/04 SBSwk1/04 SxwFd - Purple peavine SBSwk3/02 SxwFd - Thimbleberry SBSvk/03 SxwFd - Toad-flax SBSmk1/05

MONITORING PLANT DIVERSITY: SIMPSON’S INDEX AND SPECIES RICHNESS ASSESSMENT
APPENDIX II
USER MANUAL FOR PLANT DIVERSITY INDEX CALCULATION TOOL

MONITORING PLANT DIVERSITY: SIMPSON’S INDEX AND SPECIES RICHNESS ASSESSMENT
Plant Diversity Index Tools (PDItools - Version 1.1)
User Manual Introduction: PDItools (version 1.1) is an Access database that will connect to a NIVMA TRENDS database and calculate and summarize plant diversity index (PDI) values for selected NIVMA vegetation plots. The purpose of this tool is to facilitate periodic monitoring of plant diversity and support certification monitoring initiatives. This user manual provides direction on generating PDI values from a NIVMA TRENDS database and summarizing the results using the queries that have been provided. This manual accompanies the report,”Monitoring Diversity: Simpson’s Index and Species Richness Assessment” (March 2003) by Timberline Forest Inventory Consultants Ltd. The assumptions described in this report were incorporated into the PDI calculations within PDItools. Step 1: Open PDItools1.1.mdb Database File Open the Access database PDItools1.1.mdb. The form [SelectNIVMAdbase] will open automatically.
Figure 1 Open PDItools

MONITORING PLANT DIVERSITY: SIMPSON’S INDEX AND SPECIES RICHNESS ASSESSMENT
Step 2: Select the NIVMA Database Press the [open NIVMA database] button and select the NIVMA database you wish to use to calculate plant diversity index values. Select the appropriate Access database file and hit the [Save] button.
Figure 2 Select Nivma Database

MONITORING PLANT DIVERSITY: SIMPSON’S INDEX AND SPECIES RICHNESS ASSESSMENT
Step 3: Run PDItools The name and path of the selected database file will appear in the text boxes. Double check that this is the appropriate database and hit the [GO!] button to begin the calculations.
Figure 3 Run PDItools This process should take between 3 and 5 minutes. Once the process has completed (a message will appear) you can begin running the queries to summarize the data for reporting. This utility connects to the selected NIVMA database to retrieve the required information. It stores all of the data generated in the PDItools database and does not store any data within the NIVMA database. Indexes are built within the NIVMA database to expedite the process. This may present problems if the NIVMA database is read-only. If this becomes a problem the code can be altered to remove this. This process calculates plant diversity index values for all of the plots in the NIVMA database selected. The queries, which summarize the data, have been designed to only display relevant plots from the Prince George Timber Supply Area (as defined by the timber mark in the NIVMA database). These queries can be adjusted to display any of the plots within the NIVMA database and can be formatted to meet changing reporting requirements. The data from each run is stored in a table called [nivmaPDIdata] within the PDItools database. This table will be overwritten each time the process is run (when you hit the [GO!] button. So, if you wish to save the results of a previous run you must rename or export the table or save another copy of the PDItools database.

MONITORING PLANT DIVERSITY: SIMPSON’S INDEX AND SPECIES RICHNESS ASSESSMENT
Standard queries have been provided to summarize the results in the [nivmaPDIdata] table to meet the current reporting requirements of Canfor’s Sustainable Forest Management Plan – Fort St. James and Prince George Operations – September 5th, 2002. Step 4: Run Queries as required Once the PDI values have been calculated the queries contained within the PDItools database can be run to summarize the data. Separate queries have been designed for the TSA as well as TFL 30 (based on timber mark). The queries display average Shannon-Weiner Index, Simpson’s Index and Richness for each plot and grouped site association pre and post harvest. The results of these queries will be based on the last version of the NIVMA database for which PDI values were calculated.
Figure 4 PDItools Queries

MONITORING PLANT DIVERSITY: SIMPSON’S INDEX AND SPECIES RICHNESS ASSESSMENT
APPENDIX III
PLANT DIVERSITY INDEX CALCULATION TOOL (under separate cover)