monitoring neck and shoulder dumbbell exercises using the sport … · marker was placed on the...
TRANSCRIPT
Monitoring neck and shoulder dumbbell
exercises using the Sport-sensor
Anders Nørkær Jørgensen, Tina Dalager; Anders Bøgild; Tue Skallgård;
Stine Gissing Madsen; Stefan Madsen Sjødahl; Anders Stengaard Sørensen;
Gisela Sjøgaard
University of Southern Denmark, Odense, Denmark

2
Monitoring neck and shoulder dumbbell exercises using the Sport-sensor
Anders Nørkær Jørgensen, Tina Dalager; Anders Bøgild; Tue Skallgård; Stine Gissing Madsen; Stefan Madsen Sjødahl; Anders Stengaard Sørensen; Gisela Sjøgaard
The report is part of the project GameLab4Health. The project is co-funded by:
3
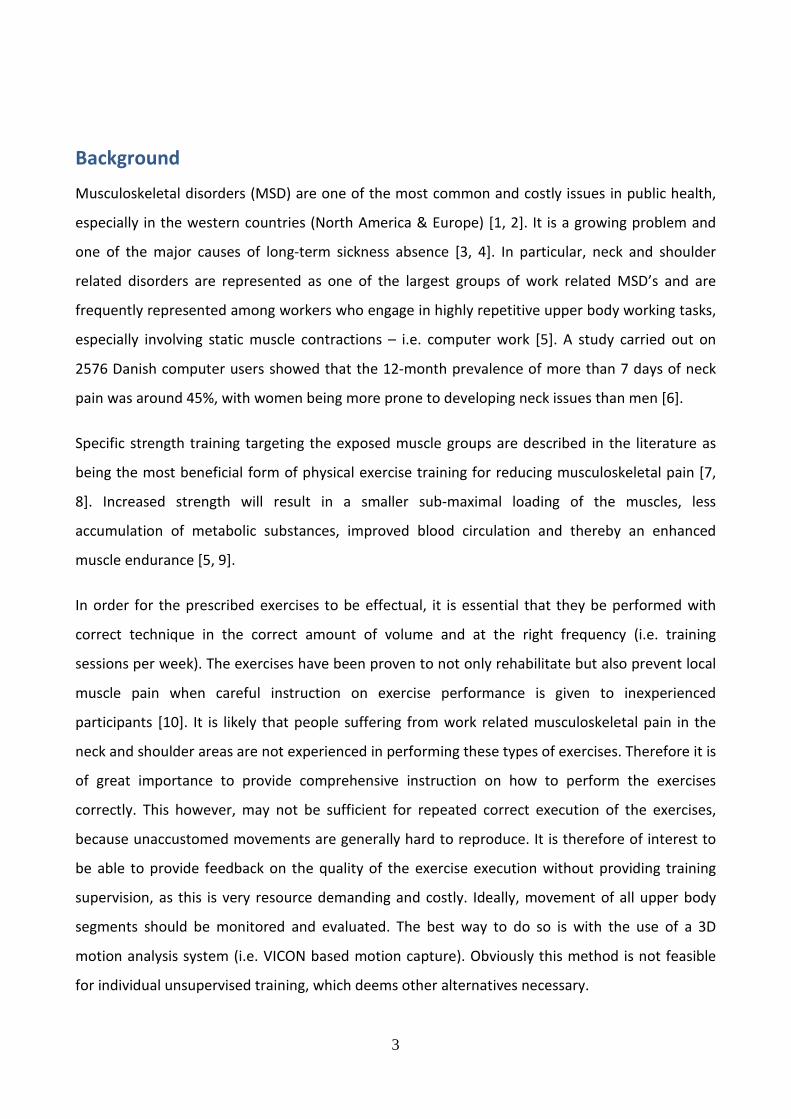
Background
Musculoskeletal disorders (MSD) are one of the most common and costly issues in public health,
especially in the western countries (North America & Europe) [1, 2]. It is a growing problem and
one of the major causes of long-term sickness absence [3, 4]. In particular, neck and shoulder
related disorders are represented as one of the largest groups of work related MSD’s and are
frequently represented among workers who engage in highly repetitive upper body working tasks,
especially involving static muscle contractions – i.e. computer work [5]. A study carried out on
2576 Danish computer users showed that the 12-month prevalence of more than 7 days of neck
pain was around 45%, with women being more prone to developing neck issues than men [6].
Specific strength training targeting the exposed muscle groups are described in the literature as
being the most beneficial form of physical exercise training for reducing musculoskeletal pain [7,
8]. Increased strength will result in a smaller sub-maximal loading of the muscles, less
accumulation of metabolic substances, improved blood circulation and thereby an enhanced
muscle endurance [5, 9].
In order for the prescribed exercises to be effectual, it is essential that they be performed with
correct technique in the correct amount of volume and at the right frequency (i.e. training
sessions per week). The exercises have been proven to not only rehabilitate but also prevent local
muscle pain when careful instruction on exercise performance is given to inexperienced
participants [10]. It is likely that people suffering from work related musculoskeletal pain in the
neck and shoulder areas are not experienced in performing these types of exercises. Therefore it is
of great importance to provide comprehensive instruction on how to perform the exercises
correctly. This however, may not be sufficient for repeated correct execution of the exercises,
because unaccustomed movements are generally hard to reproduce. It is therefore of interest to
be able to provide feedback on the quality of the exercise execution without providing training
supervision, as this is very resource demanding and costly. Ideally, movement of all upper body
segments should be monitored and evaluated. The best way to do so is with the use of a 3D
motion analysis system (i.e. VICON based motion capture). Obviously this method is not feasible
for individual unsupervised training, which deems other alternatives necessary.

4
Another important issue in rehabilitating training is compliance. Several studies have already
highlighted the fact that compliance to physical exercise interventions are challenging and report
highly different levels of compliance ranging from as low as 35%[11] and up to 85%[12]. Adding
motivating factors like gamification or competitive aspects to the training may be a way to
improve compliance.
Purpose
The purpose of this study is to investigate if a newly developed sensor (Sport-sensor) is applicable
for quantifying human upper body movement during various dumbbell exercises and hereby
provide sufficient information to be able to present useful feedback regarding the quality and
quantity of an exercise execution. The long-term prospect is to develop a user-friendly system,
where a single sensor can be mounted in a wristband or a glove and provide feedback on a
smartphone or a tablet. Furthermore the idea is to add the “fun” aspect and use the sensor for
interaction with games and other apps where the user i.e. can compete with themselves or other
people, which might help improve user compliance in the training.
This study validates the Sport-sensor, where four main areas will be investigated.
1. Is the Sport-sensor output valid during different upper body movements when compared
to 3D motion analyses (16 camera VICON system), which is considered the ‘gold standard’
of human motion capture?
2. Is the Sport-sensor output reproducible between consecutive repetitions performed by an
individual in a given exercise?
3. Is the Sport-sensor output sensitive to discriminate between exercises carried out with
different loads?
4. Is the Sport-sensor output specific for different exercises performed?
5
Research Protocol
Subjects
Twelve subjects volunteered to participate in the study (6 men and 6 women; age 25±3 years;
height 1.70±0.05m; weight 67.5±11.1kg). Only two of the subjects (1 man and 1 woman)
performed regular dumbbell training for the neck and shoulder muscles.
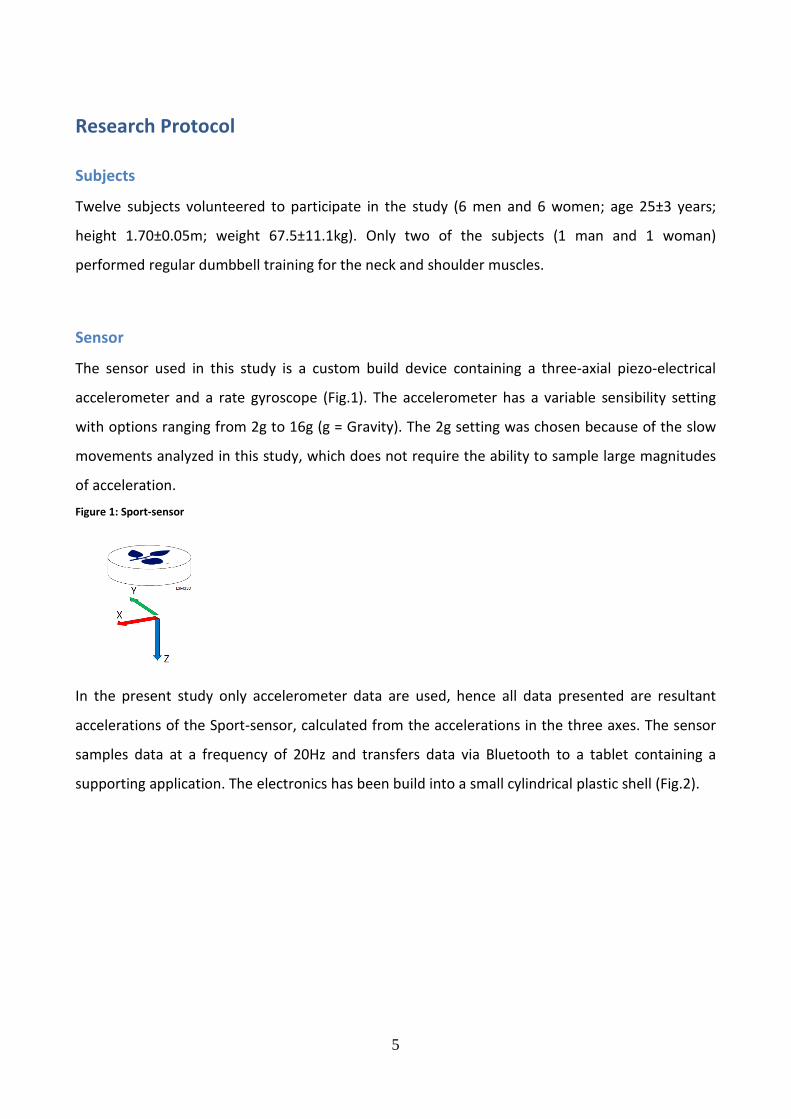
Sensor
The sensor used in this study is a custom build device containing a three-axial piezo-electrical
accelerometer and a rate gyroscope (Fig.1). The accelerometer has a variable sensibility setting
with options ranging from 2g to 16g (g = Gravity). The 2g setting was chosen because of the slow
movements analyzed in this study, which does not require the ability to sample large magnitudes
of acceleration.
Figure 1: Sport-sensor
In the present study only accelerometer data are used, hence all data presented are resultant
accelerations of the Sport-sensor, calculated from the accelerations in the three axes. The sensor
samples data at a frequency of 20Hz and transfers data via Bluetooth to a tablet containing a
supporting application. The electronics has been build into a small cylindrical plastic shell (Fig.2).

6
Figure 2: Sport-sensor and VICON markers
VICON System
The VICON system (VICON Motion Systems, Oxford, UK) is a marker based 3D motion detection
system, which contains 16 infrared cameras (MX-T20s/MX-T40s) (Fig.3). The cameras emit infrared
light, which is reflected by circular reflex markers (Fig.4) and captured by the cameras. The
cameras are placed around the room so they cover the entire volume used for motion analysis.
Data from the 16 cameras are used to triangulate the position and thereby calculate the velocity
and acceleration of each marker. Furthermore an accelerometer (MYON 320 accelerometer
sensor, MYON AG, Schwarzenberg, Switzerland) synchronized with the VICON system was
mounted next to the Sport-sensor in order to register the tap used to synchronize VICON and
Sport-sensor data. It was later discovered that the tap was sufficiently distinct from the reflex
markers hence the MYON accelerometer data was not necessary and are not presented in this
report.
Sport-sensor
VICON reflex markers
MYON accelerometer

7
Figure 3: VICON camera (MX-T40s)
Test procedure
The subjects were tested individually in the movement laboratory at the Department of Sports
Science and Clinical Biomechanics at the University of Southern Denmark. After a short warm-up
period a 1 repetition maximum (1RM) test was performed for each of the five different exercises
(Tab.1): This was done to establish the maximal load that could be lifted in each of the exercises
with acceptable technique and for calculating 80% and 60% of 1RM, which was later used in the
analysis.

8
Table 1: Exercise description1
Lateral raise (LAT)
Subject stands in an upright position
and lifts her arms to a 90 degree
shoulder abduction in the frontal
plane
Front raise (FRO)
Subject stands in an upright position
and lifts her arm to a 90 degree
shoulder flexion
Shrugs (SHR)
Subject stands in an upright position
and elevate her shoulders as high as
possible
Row (ROW)
Subject is stooped with one arm and
leg rested on a training bench and
the other arm hanging freely next to
the bench. The subject lifts her arm
until the dumbbell touches her
chest.
Prone Abduction (PRON)
Subject is rested on a training bench
facing down with the shoulders free
from the bench. The subject
performs a 90 degree abduction
with simultaneous supination in the
wrists, resulting in the thumbs
pointing upward.
1 Introductory videoes can be found in the website:
http://www.sdu.dk/Om_SDU/Institutter_centre/Iob_Idraet_og_biomekanik/Forskning/Forskningsenheder/FysiskAktivitetSundhed/Forskningsprojekter/GameLab4Health

9
After the 1RM load was established the subject was prepped for testing. The Sport-sensor was
mounted on the back of the dominant hand with a marker placed right next to it. Additionally a
marker was placed on the opposite hand along with wrist markers (Fig.4).
Figure 4: Sensor and marker placement
The five dumbbell exercises were carried out in a randomized order. Each exercise involved
performing 80% and 60% of 1RM until exhaustion or until the test leader no longer regarded the
technique as acceptable. Within each exercise, the tests were carried out in the mentioned order
to minimize the influence of fatigue development. Before the initiation of each test the test-leader
gave a light tap on the forearm of the hand on which the Sport-sensor was mounted. This gave a
very distinct signal from both markers and the Sport-sensor's accelerometer (Fig.5), which was
later used to synchronize data from the two recording systems. Test subjects were instructed to
perform the exercises controlled with no rapid movements and not to lift the weight above
horizontal line through the shoulders (LAT, FRO, PRON).
During each test session data was sampled from the Sport-sensor at 20Hz and later linear
interpolated to 200Hz to fit the VICON signal. At the same time the wrist and hand markers were
tracked at 200Hz. Immediately after each test session the test subject was asked to rate their
experienced exertion in the affected muscles on an RPE scale (0-10, 0 = nothing at all, 10 = very
very hard) [13].

10
Figure 5: Signal output from a light tap on the forearm
Tap
Tap
Sportssensor
VICON

11
Data analysis
Two subjects were excluded from the data analysis. One subject due to shoulder problems
preventing him from completing all the exercises and one subject (the first test subject) due to an
unsuitable orientation in the room causing the VICON system to miss a lot of data from the
markers resulting in too poor data quality for valid analysis.
All data obtained from the VICON system was filtered with a 2th order Butterworth filter with a
high frequency cut-off at 1-2Hz (LAT 1Hz, FRO 1.5Hz, SHR 1.5Hz, ROW 1.5Hz, PRON 2Hz), removing
noise at the highest frequencies (Fig. 6). Data from the Sport-sensor was filtered with the same
Butterworth filter, with a cut-off frequency corresponding to the frequency used at the VICON
signal.
Figure 6: Butterworth filtering
From the Sport-sensor the accelerations in the three axis (x,y,z) were used to calculate the
resultant acceleration of the sensor (Fig.7). The VICON system provides accelerations of the
markers in the x, y and z plane in the room in which the experiments was carried out. These were
likewise used to calculate the resultant acceleration of the marker placed next to the Sport-sensor.
Because the sensor is influenced by gravity the output is not an acceleration of zero when it is held
steady, but the output is an acceleration equaling one times gravity (9.81 m•sec-2) perpendicular to
the center of the Earth. To make the sensor output a signal that is comparable with the VICON
signal, which is not affected by gravity, the gravity is simply subtracted from the resultant
acceleration measured with the Sport-sensor.
2th order Butterworth

12
Figure 7: Resultant acceleration of the Sport-sensor calculated from accelerations in the x, y and z-axes
Before analysis was carried out, all data were checked for normality (Shapiro-Wilk test) and
homoscedasticity (Barlett’s test). Correlation coefficients and Peak-to-peak and time comparison
(Fig.8) were used to analyze the validity of the Sport-sensor when compared with the VICON
system. Not all data sets presented a Gaussian distribution hence Mann Whitney U test was used
to analyze differences in maximum acceleration (Max), minimum acceleration (Min) and duration
(Time) between Sportsensor and VICON data, between training loads and between different
exercises. Friedman’s test was used to analyze differences between consecutive repetitions.
Statistical significance was set at P=0.05.
All data processing and analysis were carried out in MatLab and all examples presented in the
figures are for LAT carried out by the same test subject.
Figure 8: Peak-to-peak and time analysis
Max
Min
Time
Resultant acceleration

13
Results and discussion
In the following section the four hypotheses will be investigated and discussed in the same order
as they are presented in the purpose of this report.
1. Is the Sport-sensor output valid during different upper body movements when compared
to 3D motion analyses (16 camera VICON system), which is considered the ‘gold standard’
of human motion capture?
2. Is the Sport-sensor output reproducible between consecutive repetitions performed by an
individual in a given exercise?
3. Is the Sport-sensor output sensitive to discriminate between exercises carried out with
different loads?
4. Is the Sport-sensor output specific for different exercises performed?
Validity of the Sport-sensor versus a gold standard
Data from three consecutive repetitions (repetition 2, 3, and 4) from each test subject were used
from all the exercises. Data from the three repetitions were pooled to provide higher statistical
power.
In all exercises output from the Sport-sensor correlated well with the output from the VICON
system with a correlation coefficient of >0.85 except for prone abduction at 60% of 1RM (Tab.2).
The correlations indicate that the shape of the acceleration curves from the Sport-sensor is rather
similar to the ones from the VICON system. Fig.9 shows a comparison of a filtered signal from the
VICON system (1Hz cut-off) and the Sport-sensor (1Hz cut-off). It can be seen from the figure that
there are some differences in the two signals especially around zero and at the minimum
acceleration. It is possible that the subject lifted the weights a little bit above the horizontal line
causing gravity to impact differently on the signal from the Sport-sensor and thereby explaining
the differences in the shape of the two curves. Comparison of Max, Min and Time of all exercises
revealed that Max and Min for most exercises were significantly different when sampled with the
Sport-sensor compared with VICON. Only in one case exercise time was different between the two
sampling methods (Tab.3).

14
Table 2: Correlation - Sport-sensor vs. VICON
R= ±SD
LAT60% 0.95±0.02
LAT80% 0.94±0.04
FRO 60% 0.92±0.06
FRO 80% 0.93±0.05
SHR 60% 0.85±0.12
SHR 80% 0.85±0.16
ROW 60% 0.89±0.13
ROW80% 0.87±0.15
PRON 60% 0.76±0.20
PRON 80% 0.86±0.04
R-values are mean±SD of all subjects.

15
Figure 9: Sensor output VICON (VI) vs. Sport-sensor (BA) from lateral raise at 80%1RM

16
Table 3: Min, Max and Time for Sport-sensor and VICON
Min (m•sec-2
) Max (m•sec-2
) Time (sec)
Sport-sensor VICON Sport-sensor VICON Sport-sensor VICON
LAT60% -2.96±0.59 *-2.50±0.61 2.02±0.46 *2.41±0.47 3.21±0.31 3.25±0.36
LAT80% -2.83±0.70 *-2.41±0.65 1.91±0.51 *2.31±0.48 3.24±0.33 3.33±0.39
FRO 60% -3.22±0.60 *-2.73±0.51 2.54±0.66 *2.83±0.63 3.08±0.26 3.09±0.28
FRO 80% -3.05±0.65 *-2.46±0.59 2.40±0.75 2.65±0.68 3.09±0.29 3.18±0.33
SHR 60% -0.85±0.31 -0.72±0.33 0.81±0.38 *0.63±0.38 2.12±0.44 1.97±0.76
SHR 80% -0.78±0.31 *-0.61±0.29 0.79±0.49 *0.64±0.47 2.16±0.26 1.96±0.72
ROW 60% -2.79±0.83 *-2.01±1.04 2.06±0.65 *1.29±0.87 2.49±0.29 2.51±0.35
ROW 80% -2.61±1.19 *-1.99±1.44 2.02±1.08 *1.31±1.09 2.94±0.56 2.95±0.62
PRON 60% -3.50±0.89 *-2.83±0.66 2.28±0.88 *3.20±1.18 3.13±0.41 3.18±0.37
PRON 80% -2.92±0.71 *-2.53±0.56 2.03±0.91 *2.94±1.15 3.14±0.33 *3.34±0.39
Reproducibility of the Sport-sensor output during sampling of consecutive repetitions
In comparison of consecutive repetitions, three repetitions were chosen (No. 2, 3 and 4). There
were no differences in Max, Min and Time in the three repetitions in any of the exercises at any
training loads. This is expected during the initial repetitions where onset of fatigue is not yet an
issue. When fatigue starts to set in it could alter the movement patterns to a degree where the
sensor signals are no longer similar. This is however not investigated in this study.
* Indicates significantly different from Sportssensor.

17
Sensitivity of the Sport-sensor to detect exercise load
In most exercises the load did not influence the execution of the exercise. However in Row there
was a significant difference between duration of the repetitions and in prone abduction there was
a significant difference in Min acceleration (Tab.4).
Table 4: Influence of training load
Max (m•sec-2
) Min (m•sec-2
) Time (sec)
60%1RM 80%1RM 60%1RM 80%1RM 60%1RM 80%1RM
Lateral raise -2.96±0.59 -2.83±0.70 2.02±0.46 1.91±0.51 3.21±0.31 3.24±0.33
Front raise -3.22±0.60 -3.05±0.65 2.54±0.66 2.40±0.75 3.08±0.26 3.09±0.29
Shrugs -0.85±0.31 -0.78±0.31 0.81±0.38 0.79±0.49 2.12±0.44 2.16±0.26
Row -2.79±0.83 -2.61±1.19 2.06±0.65 2.02±1.08 2.49±0.29 *2.94±0.56
Prone abduction -3.50±0.89 *-2.92±0.71 2.28±0.88 2.03±0.91 3.13±0.41 3.14±0.33
The lack of systematic differences between loads (i.e. 60%RM vs. 80%RM) could be due to the
method of analysis. In this study we just compared maximal acceleration, minimum acceleration
and exercise duration. It is likely that the load has greater influence on the initial acceleration at
the onset of the movement, and in the turnover phase where acceleration approaches zero, than
it has on the Max and Min values. These phases are more difficult to analyze and may also require
a higher sample rate in order to reveal differences.
Specificity of the sport sensor to distinguishing between different exercise types
All five exercises were compared pairwise, resulting in ten combinations. Exercises were compared
in each of the three parameters - minimum acceleration (Min), maximal acceleration (Max) and
duration of the exercise (Time) (Tab.5). In four of the ten combinations there were significant
difference between exercises within all three parameters (LAT vs. SHR, FRO vs. SHR, SHR vs. ROW
* Indicates significantly different from 60%1RM.
18
and SHR vs. PRON), in one combination there was significant difference in two of the three
parameters (FRO vs. ROW), in three combinations there were significant difference in one
parameter (LAT vs. FRO, LAT vs. ROW and ROW vs. PRON) and in two combinations (LAT vs. PRON
and FRO vs. PRON) there were no significant difference between any of the investigated
parameters.

19
Table 5: Comparison of exercises
Max
FRO SHR ROW PRON
LAT 0.008 <0.0001 0.243 0.971
FRO <0.0001 0.019 0.067
SHR <0.0001 <0.0001
ROW 0.859
Min
FRO SHR ROW PRON
LAT 0.240 <0.0001 0.044 0.717
FRO <0.0001 0.002 0.329
SHR <0.0001 <0.0001
ROW 0.007
Time
FRO SHR ROW PRON
LAT 0.059 <0.0001 0.012 0.252
FRO <0.0001 0.308 0.554
SHR <0.0001 <0.0001
ROW 0.176
The presented values in the matrix are p-values of each of the ten combinations in each of the three investigated parameters Min, Max and Time. Bold values indicate significant difference between exercises.

20
It is not surprising that the exercise shrugs (SHR) is included in all of the four combinations that
revealed significant differences in all three parameters. The movement pattern in shrugs is very
different and with a lot smaller range of motion than the rest of the exercises investigated in this
study. Neither is it surprising that it is lateral raise (LAT), front raise (FRO) and prone abduction
(PRON) that revealed no significant difference in the investigated parameters. The movements are
very similar in all three exercises only distinguished by the plane in which the arm is moving. It is
possible that gyroscope data is needed to distinguish these three exercises in order to quantify the
rotation of the arm and hand and not only the linear displacement.
However the data presented in this study reveals that it is possible to some degree to distinguish
exercises on some simple analyzed parameters only by the use of accelerometry.
Conclusions
The purpose of this study was to validate a custom build sensor (Sport-sensor) containing an
accelerometer and a gyroscope for the purpose of tracking hand movement during various
dumbbell exercises and to investigate whether different training loads and different exercises
would impact on the signal output from the sensor.
We found the accelerometer data from the Sport-sensor to correlate well with data sampled from
a VICON system during the same exercise execution demonstrating high validity regarding the
measure for quality of exercise. However, we found systematic differences in magnitude of the
signal output from the sensor and the VICON system regarding maximum and minimum
accelerations. Whether these differences are due to different sampling rates of the two systems or
due to how the signal from the Sport-sensor was processed remains unknown. The reproducibility
of the Sport-sensor output was high when tested during repeated exercises.
Further, it was found that training load could not be discriminated by the Sport-sensor output,
which means that accelerometer data alone cannot be used to distinguish different training loads
with the analyses performed in this study.
21
However, there were differences between some exercises (the ones that were most unlike) in the
parameters analyzed in this study, which indicates that an accelerometer-based system could be
used to distinguish between certain groups of exercises.
Perspective
The above results demonstrate a potential for the Sport-sensor to be used as a feasible feedback
tool, when simple dumbbell exercises are performed for the neck and shoulders. However, more
sensor data, i.e. gyroscope data might be needed to provide sufficient information on the quality
of the exercise execution. As this study is in the initial phase of the development of a feedback
system for dumbbell training, we still need to develop a feedback application to be used outside of
the laboratory. Furthermore, no study on compliance was conducted in the present study, and
future studies should investigate whether or not the Sport-sensor is effective in enhancing
compliance, when feedback is provided for the subject. This is vital, as personal training
supervision is not always an available resource. Furthermore, unsupervised training or no
feedback may have contrary consequences, as incorrect technique can have a deteriorating effect
on musculoskeletal pain.

22
References [1] Punnett L, Wegman DH. Work-related musculoskeletal disorders: the epidemiologic
evidence and the debate. J Electromyogr Kinesiol 2004;14:13-23. [2] Baldwin ML. Reducing the costs of work-related musculoskeletal disorders: targeting
strategies to chronic disability cases. J Electromyogr Kinesiol 2004;14:33-41. [3] Zebis MK, Andersen LL, Pedersen MT, et al. Implementation of neck/shoulder exercises for
pain relief among industrial workers: a randomized controlled trial. BMC musculoskeletal disorders 2011;12:205.
[4] Andersen LL, Zebis MK, Pedersen MT, et al. Protocol for work place adjusted intelligent physical exercise reducing musculoskeletal pain in shoulder and neck (VIMS): a cluster randomized controlled trial. BMC musculoskeletal disorders 2010;11:173.
[5] Larsson B, Sogaard K, Rosendal L. Work related neck-shoulder pain: a review on magnitude, risk factors, biochemical characteristics, clinical picture and preventive interventions. Best Pract Res Clin Rheumatol 2007;21:447-63.
[6] Jensen C. Development of neck and hand-wrist symptoms in relation to duration of computer use at work. Scand J Work Environ Health 2003;29:197-205.
[7] Sogaard K, Blangsted AK, Nielsen PK, et al. Changed activation, oxygenation, and pain response of chronically painful muscles to repetitive work after training interventions: a randomized controlled trial. Eur J Appl Physiol 2012;112:173-81.
[8] Andersen LL, Andersen JL, Suetta C, Kjaer M, Søgaard K, Sjøgaard G. Effect of contrasting physical exercise interventions on rapid force capacity of chronically painful muscles. J App Physiol 2009;107:1413-9.
[9] Garber CE, Blissmer B, Deschenes MR, et al. American College of Sports Medicine position stand. Quantity and quality of exercise for developing and maintaining cardiorespiratory, musculoskeletal, and neuromotor fitness in apparently healthy adults: guidance for prescribing exercise. Med Sci Sports Exerc 2011;43:1334-59.
[10] Andersen LL, Jorgensen MB, Blangsted AK, Pedersen MT, Hansen EA, Sjogaard G. A randomized controlled intervention trial to relieve and prevent neck/shoulder pain. Med Sci Sports Exerc 2008;40:983-90.
[11] Blangsted AK, Sogaard K, Hansen EA, Hannerz H, Sjogaard G. One-year randomized controlled trial with different physical-activity programs to reduce musculoskeletal symptoms in the neck and shoulders among office workers. Scand J Work Environ Health 2008;34:55-65.
[12] Andersen LL, Kjaer M, Sogaard K, Hansen L, Kryger AI, Sjogaard G. Effect of two contrasting types of physical exercise on chronic neck muscle pain. Arthritis Rheum 2008;59:84-91.
[13] Borg GA. Psychophysical bases of perceived exertion. Med Sci Sports Exerc 1982;14:377-81.