monitoring greater christchurch regeneration · pdf filemonitoring greater christchurch...
TRANSCRIPT
MONITORING GREATER CHRISTCHURCH
REGENERATION June 2017
Christchurch as an attractive city to visit
Wellbeing of greater
Christchurch communities
and individuals Diverse and sustainable
local economy Infastructure
and transportation
in greater Christchurch
Housing in greater
Christchurch
Changing demographics
in greater Christchurch
Greater Christchurch Group Monitoring Team

i
TABLE OF CONTENTS
List of Figures .......................................................................................................................................................... ii
List of Tables ........................................................................................................................................................... ii
Overview ................................................................................................................................................................. 1
Section 1: Changing demographics in greater Christchurch .................................................................................. 4
1.1. Population ............................................................................................................................................. 4
1.2. Looking ahead ....................................................................................................................................... 5
Section 2: Diverse and sustainable local economy................................................................................................. 7
2.1. Economy ................................................................................................................................................ 7
2.2. Work and Income .................................................................................................................................. 8
2.3. Diversity of the labour market ............................................................................................................ 10
2.4. Looking ahead ..................................................................................................................................... 11
Section 3: Christchurch as an attractive city to visit............................................................................................. 13
3.1. Tourism ............................................................................................................................................... 13
3.2. Looking ahead ..................................................................................................................................... 16
Section 4: Housing in greater Christchurch .......................................................................................................... 18
4.1. House prices and rental costs ............................................................................................................. 18
4.2. Housing affordability measure ............................................................................................................ 20
4.3. Insurance ............................................................................................................................................. 22
4.4. Looking ahead ..................................................................................................................................... 23
Section 5: The wellbeing of greater christchurch communities and individuals .................................................. 25
5.1. Canterbury Wellbeing Index 2016 ...................................................................................................... 25
5.2. Canterbury Wellbeing Survey September 2016 .................................................................................. 28
5.3. Looking ahead ..................................................................................................................................... 28
Section 6: Infrastructure and transportation in greater Christchurch ................................................................. 30
6.1. Construction ........................................................................................................................................ 30
6.2. Rebuild activity .................................................................................................................................... 31
6.3. Transport ............................................................................................................................................. 33
6.4. Looking ahead ..................................................................................................................................... 34

ii
LIST OF FIGURES
Figure 1-1: Net migration to greater Christchurch, 12 months to March .............................................................. 4
Figure 2-1: Real GDP in greater Christchurch and Canterbury (2010 prices, calendar year).................................. 7
Figure 2-2: Annual growth in real GDP (2010 prices, calendar year) ..................................................................... 8
Figure 2-3: Unemployment rate (actual quarterly rate) ......................................................................................... 9
Figure 2-4: Average weekly earnings (March quarter) ......................................................................................... 10
Figure 3-1: International visitor arrivals to Christchurch Airport (12 months to 30 April) ................................... 13
Figure 3-2: Christchurch – number of stay units by accommodation type (March 2010 = 100%) ....................... 14
Figure 3-3: Christchurch central city guest nights (12 months to 31 March) ....................................................... 15
Figure 3-4: Greater Christchurch Regional Tourism Estimates (12 months to 30 April) ...................................... 16
Figure 4-1: Cumulative growth in average property value (base month August 2010) ....................................... 18
Figure 4-2: Year on year growth in average prices ............................................................................................... 19
Figure 4-3: Average weekly rent from new bonds lodged.................................................................................... 19
Figure 4-4: Number of active bonds in greater Christchurch ............................................................................... 20
Figure 4-5: HAM for national and Canterbury (higher numbers indicate less-affordable housing) ..................... 21
Figure 4-6: Housing cost in Christchurch – Quality of Life survey ........................................................................ 22
Figure 5-1: Those more likely to say their quality of life has decreased over the past 12 months ...................... 26
Figure 5-2: Theft, burglary, and robbery and extortion victimisations (Canterbury metro area) ........................ 27
Figure 5-3: Median weekly household income ..................................................................................................... 27
Figure 6-1: Number of rebuild - related work visa arrivals ................................................................................... 30
Figure 6-2: Major projects of the public sector rebuild construction timeframes (As at 31 Dec 2016) ............... 31
Figure 6-3: Frequency of use of public transport (2016) ...................................................................................... 34
LIST OF TABLES
Table 1-1: Population estimates – year-on-year growth ........................................................................................ 4
Table 2-1: Total employment and annual growth (12 months to 31 March) ....................................................... 10
Table 4-1: Current status of unsettled over-cap dwelling claims (As at 31 March 2017) ..................................... 23
Table 6-1: Proportion indicating that an infrastructure issue continues to have a moderate or major negative impact on their everyday lives, over time ............................................................................................................ 33
1
ABOUT THE REPORT
1. The Department of the Prime Minister and Cabinet (DPMC) is charged with leading and coordinating central government’s role, and provide advice to Ministers and the Government on the regeneration of greaterChristchurch. As such, DPMC plays a key role in monitoring and reporting on the overall progress of theregeneration of greater Christchurch.
2. The report provides a summary of regeneration progress, drawing on numerous sources of informationcollected and published by other agencies. The report is intended to provide the public with an easilyaccessible account of progress in greater Christchurch, based on data available as at 31 May 2017.
3. The six areas of focus for reporting have been adapted from the priority areas identified in the plan GreaterChristchurch Earthquake Recovery: Transition to Regeneration (October 2015).
OVERVIEW
4. More than six years since the devastating impacts of the Canterbury earthquakes, greater Christchurch1 hasentered a new and exciting phase as the region transitions from recovery to regeneration. The regeneration of greater Christchurch remains a priority for the government, and the monitoring of regeneration highlights the progress greater Christchurch is making in its journey and ensures that all critical issues are noted andaddressed by the relevant agencies in a timely manner.
Changing demographics in greater Christchurch
5. The population of greater Christchurch dropped sharply in the first two years following the initial 2010earthquake. Widespread damage across Christchurch prompted some residents to move to areas outsideof the city, with the Waimakariri and Selwyn districts experiencing the largest population movements. By2016, the population in greater Christchurch had fully recovered and exceeded the 2010 population by 5.2per cent (24,100 additional residents). In the central city, however, there are still 32.3 per cent fewerresidents (2,670). Age and gender distribution in Canterbury has also changed since the earthquakes. Theinflux of construction workers may have contributed to the demographic changes. Similar to the rest of New Zealand, greater Christchurch has become more culturally diverse.
Diverse and sustainable local economy
6. Economic activity in greater Christchurch (measured through real GDP) remains high. Constructioncontinues to play an important role in the local economy, although the total level of activity is decliningslowly with the reduction of residential construction activity. Both construction and non-constructionindustries are crucial to the future sustainability of the local economy. In the labour market, theunemployment rate in Canterbury remains favourable and is below the national average, while the earninggap between Canterbury and the national average has reduced between 2014 and 2016. It’s anticipatedthat the gradual slowdown in construction will free up workers to pursue job opportunities in other sectors,assisting the diversification of the local economy. Alternatively, they may move to other parts of the country where there is greater demand for their skills.
Christchurch as an attractive city to visit
7. Tourism numbers in greater Christchurch have improved since the initial decline following the earthquakes.Visitor accommodation capacity and guest nights in greater Christchurch have both increased to over 80
1 In this report greater Christchurch consists of Christchurch City, Selwyn and Waimakariri districts. This does not directly correspond to the definition of greater Christchurch in the Greater Christchurch Regeneration Act 2016.

2
per cent of the pre-quake level. Since 2014, occupancy rates in greater Christchurch have exceeded their pre-earthquake levels (March 2010). Progress with central city projects such as the Performing Arts Precinct and the nearby Terraces along the Avon River are increasing the appeal of Christchurch, although a significant amount of construction work is still underway. Greater Christchurch has made very good progress in terms of tourism recovery, however there is potential for further growth.
Housing in greater Christchurch
8. Housing affordability in greater Christchurch has been improving since 2014. In particular, the averageweekly rent has continued to fall and the proportion of private bonds lodged for lower cost rentals (i.e.rentals with a weekly rent below $400) has been increasing. Christchurch experienced the lowest houseprice growth among 15 selected main areas in New Zealand between April 2014 and April 2017. SinceDecember 2012 quarter, housing has been more affordable in Canterbury when compared with NewZealand as a whole.
9. The earthquakes of 2010 and 2011 damaged about three quarters of Canterbury’s housing stock. TheEarthquake Commission (EQC) reported that, as at the end of March 2017, all under-cap first time claimsthat are under their operational control (e.g. those not under litigation) have completed their first-timeclaim settlement procedure, and that their focus is on dealing with call-back (re-opened) claims. In total,there are 3,318 first time dwelling claims outstanding (2.0 per cent of the total household claims), all ofwhich are over-cap and being managed by private insurers.
The wellbeing of greater Christchurch communities and individuals
10. The overall wellbeing of greater Christchurch residents has improved since the initial impact of theearthquakes, according to the latest Wellbeing Survey data. However, residents are more likely to have alower quality of life score if they rent, are on a low income, have a health condition or disability, or if theyhave unresolved insurance claims. The Canterbury Wellbeing Index shows the majority of indicators aresimilar to, or better than, national averages. As the rebuild activity declines some of the indicators willgradually change, some positively and some negatively (e.g. increased unemployment and youth Not inEmployment, Education or Training (NEET)).
Infrastructure and transportation in greater Christchurch
11. The commercial rebuild activity continues to pick up momentum (while residential activity declines), and itis forecast to peak during mid-2017 and mid-2018. The public sector rebuild has taken longer than originallyanticipated. This was driven by a number of factors, including construction market capacity constraints andthe timeframe required for demolition, planning, financing and construction. However, this delay hashelped some projects receive more competitive pricing, and will result in a more gradual decline inconstruction activity.
12. The Stronger Christchurch Infrastructure Rebuild Team programme is more than 99 per cent complete as atApril 2017, and 87 per cent of projects have been handed over to the Christchurch City Council.
13. The public transport network was severely disrupted after the earthquakes and the use of public transporthas yet to return to pre-earthquake level. In the 12 months to April 2017, 13.4 million trips were reported,this is 22.1 per cent lower than the number of trips pre earthquake.

Population
Greater Christchurch’s population exceeded its pre‐quake (2010) level in 2014 and has continued to grow. However, growth has been variedwithin the region. For example, the resident population in Christchurch’s central city has not yet reached pre‐quake levels, while between 2010 and 2016, the Selwyn District experienced the highest percentage increase in population among all territorial authorities (including Auckland).
The gender split in greater Christchurch has changed between 2010 and 2016, with males now out numbering females in the overallpopulation. This change is most noticeable in the 15‐39 age group where the number of males increased 2.4 percentage points to make up 52.7per cent of the age group. It is likely that the demand for construction workers during the rebuild has contributed to the change.
Changing demographics in greater Christchurch
Change in resident population 2010 ‐ 2016
Cultural diversity1
Source: Subnational population estimates, Statistics New Zealand
Age distribution in greater Christchurch 2010‐2016
Greater Christchurch New Zealand
% of population Change between 2006 ‐2013
Change between 2006 ‐2013
88.2% 74.6%European/Other ethnicity7.6% 15.6%Maori
+98,800 (+3%)
2.5% 7.8%Pacific Peoples+67,900 (+11%)
7.1% 12.2%Asian
+42,700 (+14%)
0.8% 1.2%Middle Eastern/
Latin American/African
136,900 (+34%)
+14,600 (+38%)
Source: Estimated resident population, Statistics New Zealand
1. Ethnic groups are not mutually exclusive. People who identify with more than one ethnicity have been included in each ethnic group.2. Estimated resident population at 30 June, based on the census usually resident population counts with demographic adjustments.
Between 2006 and 2013, greater Christchurch has become more culturally diverse. Proportionally fewer people identified themselves as belonging to the European ethnic group, while the number of Maori and Pacific peoples in greater Christchurch has been growing at a faster rate than the national average.
Changes in ethnicity 2006 ‐ 20132
National
Gender distribution in greater Christchurch 2010 ‐ 2016
Age
2010
2016
2010
2016
0‐14
51.2%
51.1%
‐0.0
48.8%
48.9%
‐0.0
15‐39
50.3%
52.7%
+2.4
49.7%
47.3%
‐2.4
40‐64
49.0%
49.4%
+0.3
51.0%
50.6%
‐0.3
65+
44.4%
45.7%
+1.2
55.6%
54.3%
‐1.2
19.6%
33.7%
31.7%
14.9%
2016
2013
86.9%
8.6%
2.8%
8.4%
0.9%
2006 20132006
76.8%
14.9%
7.2%
9.7%
0.9%
% of population
+7,300 (+2%)
+5,800 (+17%)
+1,600 (+15%)
+7,000 (+22%)
+900 (+25%)
Change(Percentage Point)
Change(Percentage Point)
19.2% 19.1% 18.8% 18.7% 18.4% 18.1% 17.9%
34.1% 33.7% 33.3% 33.1% 33.5% 34.2% 34.9%
33.2% 33.5% 33.7% 33.8% 33.5% 33.1% 32.5%
13.5% 13.7% 14.1% 14.4% 14.6% 14.6% 14.7%
2010 2011 2012 2013 2014 2015 2016
0‐14 years 15‐39 years 40‐64 years 65 years and over
4
SECTION 1: CHANGING DEMOGRAPHICS IN GREATER CHRISTCHURCH
1.1. POPULATION
14. The population of greater Christchurch dropped sharply in the first two years following the first major earthquake in 2010. However, by 2016 the population had fully recovered and exceeded the 2010 population by 5.2 per cent (2016 population was 488,900). This is slightly lower than the national growth of 7.9 per cent over the same period. Christchurch city’s population has increased over the same period, but remains 0.3 per cent below its 2010 level in 2016. In the central city, recovery has been slower, resulting in the population being 32.3 per cent below its 2010 level2.
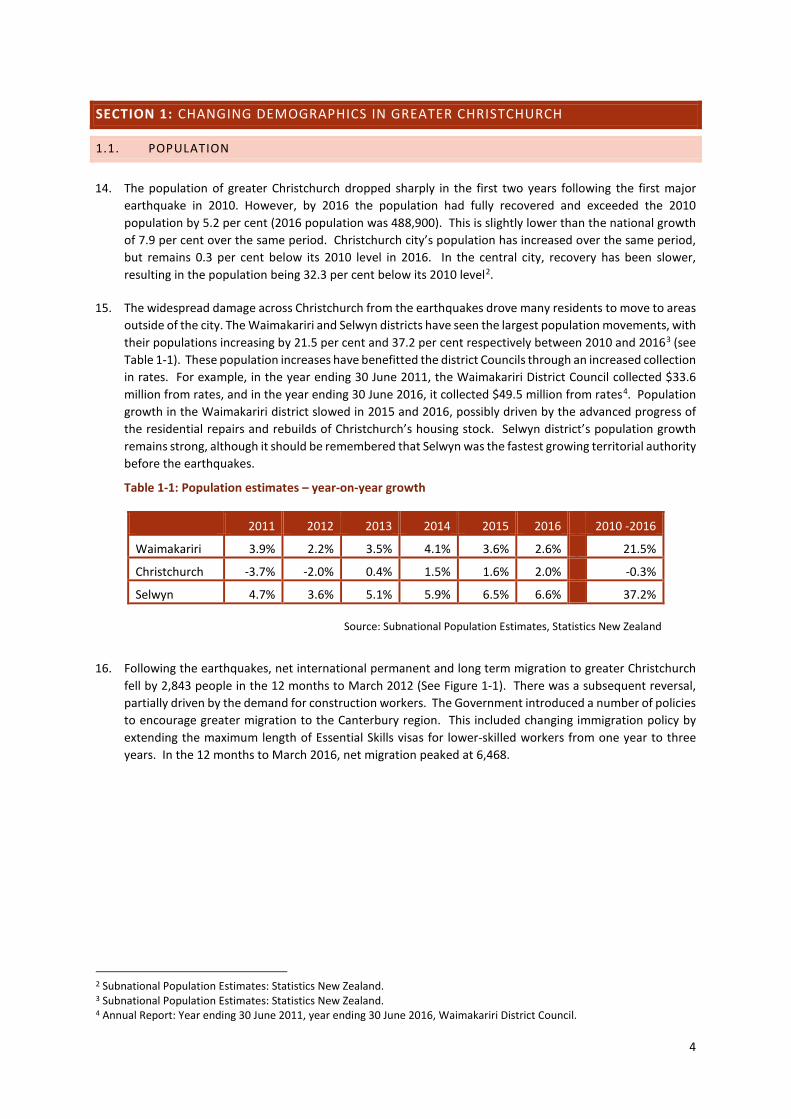
15. The widespread damage across Christchurch from the earthquakes drove many residents to move to areas outside of the city. The Waimakariri and Selwyn districts have seen the largest population movements, with their populations increasing by 21.5 per cent and 37.2 per cent respectively between 2010 and 20163 (see Table 1-1). These population increases have benefitted the district Councils through an increased collection in rates. For example, in the year ending 30 June 2011, the Waimakariri District Council collected $33.6 million from rates, and in the year ending 30 June 2016, it collected $49.5 million from rates4. Population growth in the Waimakariri district slowed in 2015 and 2016, possibly driven by the advanced progress of the residential repairs and rebuilds of Christchurch’s housing stock. Selwyn district’s population growth remains strong, although it should be remembered that Selwyn was the fastest growing territorial authority before the earthquakes.
Table 1-1: Population estimates – year-on-year growth
2011 2012 2013 2014 2015 2016 2010 -2016
Waimakariri 3.9% 2.2% 3.5% 4.1% 3.6% 2.6% 21.5%
Christchurch -3.7% -2.0% 0.4% 1.5% 1.6% 2.0% -0.3%
Selwyn 4.7% 3.6% 5.1% 5.9% 6.5% 6.6% 37.2%
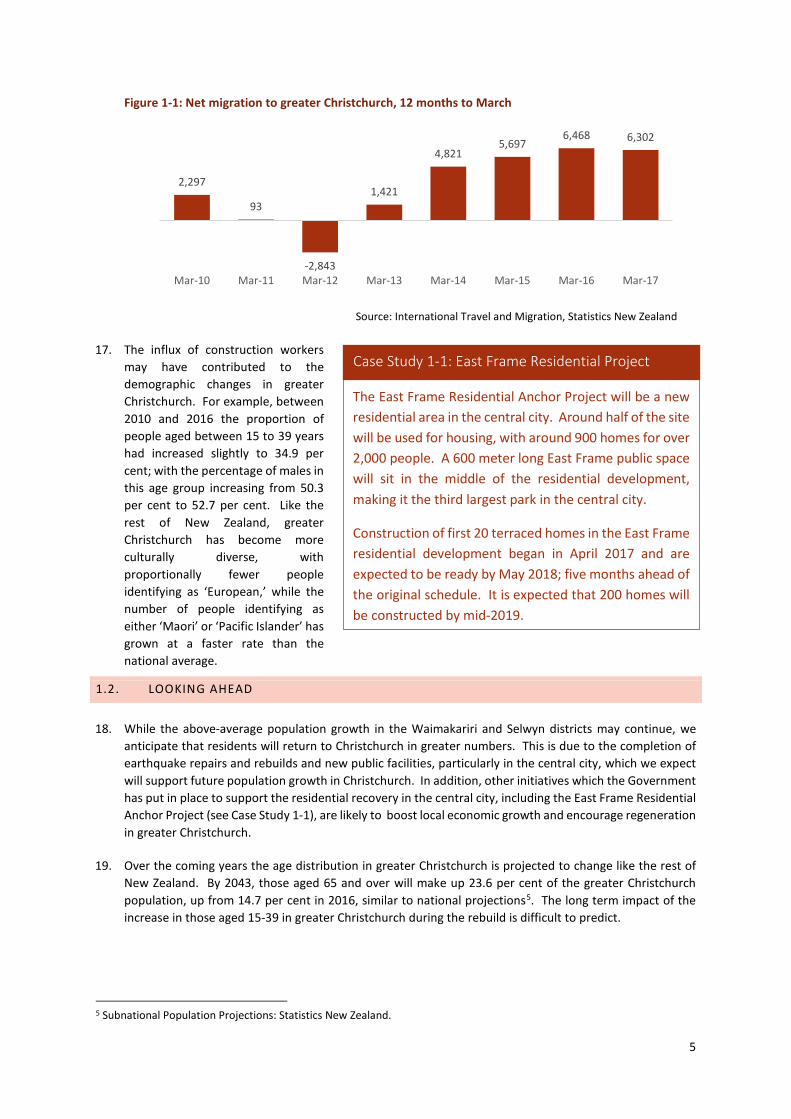
16. Following the earthquakes, net international permanent and long term migration to greater Christchurch fell by 2,843 people in the 12 months to March 2012 (See Figure 1-1). There was a subsequent reversal, partially driven by the demand for construction workers. The Government introduced a number of policies to encourage greater migration to the Canterbury region. This included changing immigration policy by extending the maximum length of Essential Skills visas for lower-skilled workers from one year to three years. In the 12 months to March 2016, net migration peaked at 6,468.
2 Subnational Population Estimates: Statistics New Zealand. 3 Subnational Population Estimates: Statistics New Zealand. 4 Annual Report: Year ending 30 June 2011, year ending 30 June 2016, Waimakariri District Council.
Source: Subnational Population Estimates, Statistics New Zealand
5
Figure 1-1: Net migration to greater Christchurch, 12 months to March
17. The influx of construction workers may have contributed to the demographic changes in greater Christchurch. For example, between 2010 and 2016 the proportion of people aged between 15 to 39 years had increased slightly to 34.9 per cent; with the percentage of males in this age group increasing from 50.3 per cent to 52.7 per cent. Like the rest of New Zealand, greater Christchurch has become more culturally diverse, with proportionally fewer people identifying as ‘European,’ while the number of people identifying as either ‘Maori’ or ‘Pacific Islander’ has grown at a faster rate than the national average.
1.2. LOOKING AHEAD
18. While the above-average population growth in the Waimakariri and Selwyn districts may continue, we anticipate that residents will return to Christchurch in greater numbers. This is due to the completion of earthquake repairs and rebuilds and new public facilities, particularly in the central city, which we expect will support future population growth in Christchurch. In addition, other initiatives which the Government has put in place to support the residential recovery in the central city, including the East Frame Residential Anchor Project (see Case Study 1-1), are likely to boost local economic growth and encourage regeneration in greater Christchurch.
19. Over the coming years the age distribution in greater Christchurch is projected to change like the rest of New Zealand. By 2043, those aged 65 and over will make up 23.6 per cent of the greater Christchurch population, up from 14.7 per cent in 2016, similar to national projections5. The long term impact of the increase in those aged 15-39 in greater Christchurch during the rebuild is difficult to predict.
5 Subnational Population Projections: Statistics New Zealand.
Case Study 1-1: East Frame Residential Project
The East Frame Residential Anchor Project will be a new residential area in the central city. Around half of the site will be used for housing, with around 900 homes for over 2,000 people. A 600 meter long East Frame public space will sit in the middle of the residential development, making it the third largest park in the central city.
Construction of first 20 terraced homes in the East Frame residential development began in April 2017 and are expected to be ready by May 2018; five months ahead of the original schedule. It is expected that 200 homes will be constructed by mid-2019.
2,297
93
-2,843
1,421
4,8215,697
6,468 6,302
Mar-10 Mar-11 Mar-12 Mar-13 Mar-14 Mar-15 Mar-16 Mar-17
Source: International Travel and Migration, Statistics New Zealand

Work and income$
Employment growth (Mar quarter 2010 ‐ Mar quarter 2017)
Unemployment rate (Actuals, Mar quarter)
The unemployment rate in Canterbury has been consistently lower than the rate for the rest of New Zealand since 2010. Since the March quarter 2010, total employment in the region has increased by 14.2%, while employment in the rest of New Zealand increased by 19.2%.
Between 2010 and 2017, the growth in average weekly earnings in Canterbury (+28.7%) was higher than the national average (+22.1%). However the actual earnings is still 4.2% less than the national average.
In 2016, economic activity in greater Christchurch remains high in 2016, but grew slower than the national average. The growth rate is forecast to grow at a similar rate to the national average, between 2017 and 2021.
Real GDP per person in greater Christchurch has converged to the national average since 2010, but there was a slight reversal of the trend in 2016.
Economy
Real GDP per person
Diverse and sustainable local economy
Between 2010 and 2017, the construction industry in Canterbury experienced the highest growth, with 88.3% growth in employment. However construction employment fell by 5,100 (‐11.7%) between 2016 and 2017.
Between 2010 and 2017, the information media and telecommunication industry experienced the largest drop (‐19.3%) in employment, followed by public administration and safety (‐5.2%) and transport, postal and warehousing (‐4.4%).
Diversity of the workforce
Employment by industry grouping in Canterbury (Mar quarter)
Greater ChchRest of CanterburyRest of NZ
‐0.9% 1.8%‐0.2%
2010
4.8%4.2%3.2%
2015 2016
2.2%1.6%2.5%
2017
3.6% 2.0%3.5%
Real GDP growth (2010 Price)Forecast
2021
2.4%1.7%2.1%Ea
rthquakes
Average weekly earnings in Canterbury (Mar quarter)
Earnings ($)% of national
Annual change
(%change)2010‐ 2017 Ranked by changes in industry employment 2010‐2017
Change in employment
Number2016‐2017
Number (%change)
Source: Infometrics. Estimates have been developed from Statistics New Zealand and other data sources Source: Labour Market Statistics, Statistics New Zealand
Source: Labour market statistics, Statistics New Zealand
1. Construction………………………………………………………………………..2. Professional, Scientific and Technical Services…………………….3. Agriculture, Forestry, and Fishing & Mining……......................
4. Retail Trade & Accommodation..…………………………………………
5. Rental, Hiring & Real Estate Services…………………………………..6. Education and Training………………….……………………………………7. Wholesale Trade……….…………...…………………………………………..8. Health Care & Social Assistance.………………………………………...9. Arts, Recreation & Other Services……………………………………….10. Financial and Insurance Services…………………..…………………..11. Manufacturing & Electricity, Gas, Water, & Waste Services.12. Transport, Postal and Warehousing…..………………………………
13. Public Administration & Safety………..………………………………..14. Information Media & Telecommunications……….……………...
Total all industries…………………………………………………………………..
Employment Number
2010 2016 2017
23,100 31,300 19,000 49,600 5,500
25,500 16,700 29,200 17,200 6,500
41,700 14,000 13,100 5,100
298,100
48,500 37,100 24,200 54,100 6,000
21,200 13,600 30,300 20,700 6,900
39,500 13,600 14,000 3,100
334,500
43,500 37,700 25,000 53,300 7,200 27,100 17,900 30,500 18,300 7,500 41,600 13,400 12,400 4,100
340,500
20,400 6,500 6,100 3,700 1,700 1,600 1,300 1,300 1,100 1,000
‐100 ‐600 ‐700
‐1,000 42,400
(88.3%)
(20.8%)
(32.0%)
(7.5%)
(30.5%)
(6.3%)
(7.5%)
(4.3%)
(6.5%)
(14.8%)
(‐0.3%)(‐4.4%)(‐5.2%)(‐19.3%)(14.2%)
‐5,100 600 800
‐ 800 1,200 5,900 4,400
200 ‐2,400
600 2,100
‐200 ‐1,700 1,000 6,000
(‐11.7%)(1.6%)
(3.3%)
(‐1.4%)(16.9%)
(21.7%)
(24.4%)
(0.5%)
(‐13.3%)(7.9%)
(5.1%)
(‐1.8%)(‐13.4%)(23.6%)
(1.8%)
2010
72690.9% ‐1.4%
2011
77993.8% +7.3%
2012
80593.6% +3.3.%
2013
81592.2%+1.2%
2014
87195.4%+6.8%
2015
90496.5%+3.8%
2016
92496.7%+2.2%
2017
93595.8%+1.2%
14.2%
19.2%
‐10%
0%
10%
20%
Mar‐10 Mar‐11 Mar‐12 Mar‐13 Mar‐14 Mar‐15 Mar‐16 Mar‐17
Canterbury Rest of New Zealand
5.3% 4.9% 4.8%4.0%
3.2% 2.8% 2.7%4.0%
6.5% 6.6% 6.9%6.4% 6.2% 6.2% 5.9%
5.4%
2010 2011 2012 2013 2014 2015 2016 2017
Canterbury Rest of New Zealand
$46,262
$47,714
$48,542
$36,000
$38,000
$40,000
$42,000
$44,000
$46,000
$48,000
$50,000
2007 2008 2009 2010 2011 2012 2013 2014 2015 2016
Greater Christchurch
Rest of Canterbury
Rest of New Zealand

7
SECTION 2: DIVERSE AND SUSTAINABLE LOCAL ECONOMY
2.1. ECONOMY 6
20. Since the Canterbury earthquake sequence, the high level of economic growth in greater Christchurch andCanterbury has been largely driven by rebuild-related construction activity. Since 2012, the constructionindustry has been the largest contributor towards Canterbury Gross Domestic Product (GDP). This growthhas seen Canterbury close the gap with the Wellington region, the country’s second largest regionaleconomy, from 3.3 billion to 0.9 billion. In 2016, Canterbury’s share of national GDP was 13.2 per cent, upfrom 12.3 per cent in 20107.
21. In terms of contribution to regional gross domestic product (GDP)8, other important industries in Canterburyalongside construction (10 per cent) are Manufacturing (11 per cent), Professional, scientific and technicalservices (7 per cent), Health care and social assistance (6 per cent), and Agriculture (5 per cent).
22. Economic activity in greater Christchurch remains high, with real GDP reaching $22.9 billion (2010 prices) in2016, up 1.7 per cent from 20159 (Figure 2-1). Between 2011 and 2016 real GDP in greater Christchurchincreased by 19.3 per cent. This compares favourably to the 13.9 per cent increase in rest of New Zealand.Although, as expected during the regeneration phase, growth in 2016 has eased from the peak periodbetween 2013 and 2015 (Figure 2-2), and was lower than the growth in the rest of New Zealand in 2016 (3.4per cent). Real GDP growth in greater Christchurch is forecast to remain similar to the rest of New Zealandover the next two years and will continue to be supported by rebuild-related construction activity.
Figure 2-1: Real GDP in greater Christchurch and Canterbury (2010 prices, calendar year)
6 Within this section Gross Domestic Product figures are sourced from Statistics New Zealand and Infometrics Limited as each provides unique information relevant to this report. For example, Statistics New Zealand publish an industry breakdown, while Infometrics provides more timely estimates of real GDP. 7 Data in this paragraph is sourced from Statistics New Zealand’s Regional Gross Domestic Product. Estimates for 2016 are provisional. 8 Regional Gross Domestic Product by region and industry: Year ended March 2016, Statistics New Zealand. 9 Real gross domestic product statistics: Actuals year ended December and forecasts year ended March, Infometrics Ltd.
2016, $5.3b
2016, $22.9b
2021, $6.2b
2021, $25.7b
0
5
10
15
20
25
30
2000 2004 2008 2012 2016 2020
$ bi
llion
s
Rest of Canterbury Greater Christchurch
ForecastActual
Source: Infometrics Limited

8
Figure 2-2: Annual growth in real GDP (2010 prices, calendar year)
23. Since 2011 real GDP per person in greater Christchurch has been converging to the rest of New Zealandaverage10, increasing 9.0 per cent to reach $46,262, while the rest of New Zealand rate increased 5.8 percent to $48,542 over the same period (2011 to 2016). However, in 2016 there was a slight reversal of thetrend with real GDP per person decreasing $361 in greater Christchurch as the population grew at a greaterrate than real GDP, while in the rest of New Zealand it increased by $639.
2.2. WORK AND INCOME
24. The earthquakes’ impact on theeconomy and the subsequent rebuildwas reflected in Canterbury’s labourmarket conditions. In addition to theimmediate negative effect caused bythe widespread damage, there waswidespread damage and disruptionto businesses. An EarthquakeSupport Subsidy was launched tosupport small to medium businessesfacing financial pressures. A secondsubsidy for employees was alsolaunched, to provide support forthose whose employers were nolonger able to operate. Like economic growth, business conditions are showing signs of returning to a less extraordinary state.
10 DPMC derived from Infometrics and Statistics New Zealand data.
Case Study 2-1: Canterbury Skills & Employment Hub
The Skills and Employment Hub is a joint initiative between the Ministry of Business, Innovation and Employment and the Ministry of Social Development. The business-friendly one stop shop was established to manage the anticipated high demand for labour as the rebuild gained momentum.
First opened in 2012, the Hub provides job matching, and information-sharing services for employers and job seekers in Canterbury and from across the country. Where there are no suitable or trainable New Zealanders available, the Hub’s immigration facilitation services work with employers to help them access migrant labour through a faster and more efficient immigration process.
The Canterbury Skills and Employment Hub has been extended through to June 2018.
-3%
-2%
-1%
0%
1%
2%
3%
4%
5%
6%
2007 2008 2009 2010 2011 2012 2013 2014 2015 2016
Chan
ge in
GDP
Greater Christchurch Rest of New Zealand
Source: Infometrics Limited
9
CANTERBURY UNEMPLOYMENT 11
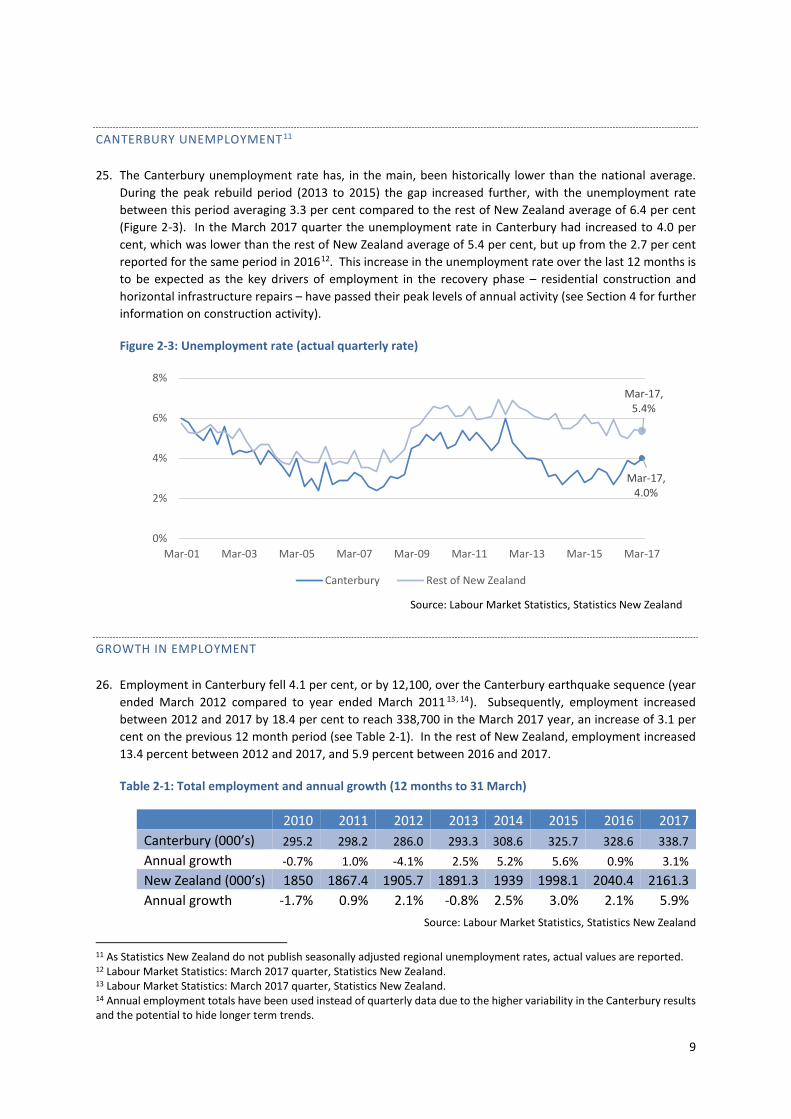
25. The Canterbury unemployment rate has, in the main, been historically lower than the national average.During the peak rebuild period (2013 to 2015) the gap increased further, with the unemployment ratebetween this period averaging 3.3 per cent compared to the rest of New Zealand average of 6.4 per cent(Figure 2-3). In the March 2017 quarter the unemployment rate in Canterbury had increased to 4.0 percent, which was lower than the rest of New Zealand average of 5.4 per cent, but up from the 2.7 per centreported for the same period in 201612. This increase in the unemployment rate over the last 12 months isto be expected as the key drivers of employment in the recovery phase – residential construction andhorizontal infrastructure repairs – have passed their peak levels of annual activity (see Section 4 for furtherinformation on construction activity).
Figure 2-3: Unemployment rate (actual quarterly rate)
GROWTH IN EMPLOYMENT
26. Employment in Canterbury fell 4.1 per cent, or by 12,100, over the Canterbury earthquake sequence (yearended March 2012 compared to year ended March 2011 13, 14). Subsequently, employment increasedbetween 2012 and 2017 by 18.4 per cent to reach 338,700 in the March 2017 year, an increase of 3.1 percent on the previous 12 month period (see Table 2-1). In the rest of New Zealand, employment increased13.4 percent between 2012 and 2017, and 5.9 percent between 2016 and 2017.
Table 2-1: Total employment and annual growth (12 months to 31 March)
2010 2011 2012 2013 2014 2015 2016 2017 Canterbury (000’s) 295.2 298.2 286.0 293.3 308.6 325.7 328.6 338.7 Annual growth -0.7% 1.0% -4.1% 2.5% 5.2% 5.6% 0.9% 3.1% New Zealand (000’s) 1850 1867.4 1905.7 1891.3 1939 1998.1 2040.4 2161.3 Annual growth -1.7% 0.9% 2.1% -0.8% 2.5% 3.0% 2.1% 5.9%
11 As Statistics New Zealand do not publish seasonally adjusted regional unemployment rates, actual values are reported. 12 Labour Market Statistics: March 2017 quarter, Statistics New Zealand. 13 Labour Market Statistics: March 2017 quarter, Statistics New Zealand. 14 Annual employment totals have been used instead of quarterly data due to the higher variability in the Canterbury results and the potential to hide longer term trends.
Mar-17, 4.0%
Mar-17, 5.4%
0%
2%
4%
6%
8%
Mar-01 Mar-03 Mar-05 Mar-07 Mar-09 Mar-11 Mar-13 Mar-15 Mar-17
Canterbury Rest of New Zealand
Source: Labour Market Statistics, Statistics New Zealand
Source: Labour Market Statistics, Statistics New Zealand

10
AVERAGE WEEKLY EARNINGS
27. Reflecting the economic conditions, the gap between average earnings in Canterbury and the nationalaverage reduced from $73 (9.1 per cent) to $41 (4.2 per cent), between the September 2010 quarter andthe March 2017 quarter (see Figure 2-4). Over this period the average earnings in Canterbury increased by$196 (26.5 per cent) to $935, compared to the national increase of $170 (21.1 per cent) to $97615. However,as seen in other indicators, growth in Canterbury is easing, resulting in national growth between the March2017 quarter and the March 2016 quarter being 2.1 per cent compared to an increase of 1.2 per cent inCanterbury.
Figure 2-4: Average weekly earnings (March quarter)
2.3. DIVERSITY OF THE LABOUR MARKET
28. In the March 2017 quarter, thediversity, or make up, of theCanterbury economy closelymatches New Zealand’s (asmeasured through employment byindustry type). The notableexception is the construction sectorwhich has the second largest shareof employment at 12.8 per cent,whereas in the rest of New Zealandit is the fifth largest with 9.2 percent 16 . Since the March 2010quarter, the construction sector hasincreased by 88.3 per cent or 20,400employees, although it fell 11.7 percent between 2016 and 2017(March quarters).
29. The future sustainability of thelocal economy relies, in a big part,on expansion in other non-construction sectors. Since the
15 Labour Market Statistics: March 2017 quarter, Statistics New Zealand. 16 Labour Market Statistics: March 2017 quarter, Statistics New Zealand.
Case Study 2-2: Christchurch Innovation Precinct
The Christchurch Innovation Precinct is a central city hub of entrepreneurs and idea generators. The core of the Precinct makes up three city blocks within Manchester, St Asaph, Madras and Lichfield Streets. It creates a vibrant new heart of Christchurch by bringing together businesses and innovators alongside residential, retail, hospitality and cultural institutions.
Supported by two tertiary institutions in close proximity (i.e. SIGNAL ICT Grad School is within the Precinct and Ara Institute of Technology is adjacent) the innovation hub has not only attracted innovative corporates such as Vodafone and Kathmandu, it has also become a focal point and prime location for fast growing knowledge-rich and creative businesses in Christchurch. Current tenants include Vodafone, Kathmandu and Signal ICT graduate school.
$924 $935
$956 $976
$0
$200
$400
$600
$800
$1,000
$1,200
2010 2011 2012 2013 2014 2015 2016 2017Canterbury New Zealand
Source: Labour Market Statistics, Statistics New Zealand
11
March 2010 quarter, the total number of employees has increased by 42,400, with almost half this growth occurring in the Construction sector (48.1 per cent). Results in the other sectors are mixed. Behind Construction, the second largest increase in employees is the Professional, Scientific, Technical, Administrative and Support Services, which now employs 37,700 people, 6,500 (20.8 per cent) more than in the March 2010 quarter. The Retail Trade and Accommodation sector now employs 3,700 (7.5 per cent) more employees over the same period. While the second largest employer group in 2010, Manufacturing and Electricity, Gas, Water, and Waste Services has only returned to the same size (41,700 in 2010 compared to 41,600 in 2017) and is now the third largest. The Information Media and Telecommunications sector has 1,000 fewer people (-19.3 per cent).
30. Diversity can also be measured through the distribution of GDP attributable to each of the sectors. Similar to employment, in 2010 the Canterbury construction sector was of a similar relative size to the national construction sector, accounting for 5.8 per cent and 5.3 per cent of their respective GDP17. In 2015 the construction sector has increased to 10.3 per cent in Canterbury, an increase of $1.90 billion or 135.6 per cent, while in the rest of New Zealand it had decreased its share to 5.1 per cent, although the overall did increase $1.69 billion or 18.6 per cent.
2.4. LOOKING AHEAD
31. With building activity expected to return to business-as-usual levels by 2021, attention should turn to how the Canterbury economy will transition to this new phase. The declining building activity will also impact on employment in related sectors, increasing the potential of higher unemployment in the region. However, this also provides an opportunity for surplus employees to move into the wider economy, both local and national. The transition is likely to be gradual with construction activity forecast to decline slowly18.
17 Regional Gross Domestic Product: Year ended March 2016, Statistics New Zealand. 18 The Canterbury Rebuild by the Numbers, Ministry of Business, Innovation and Employment.
Christchurch as an attractive city to visit
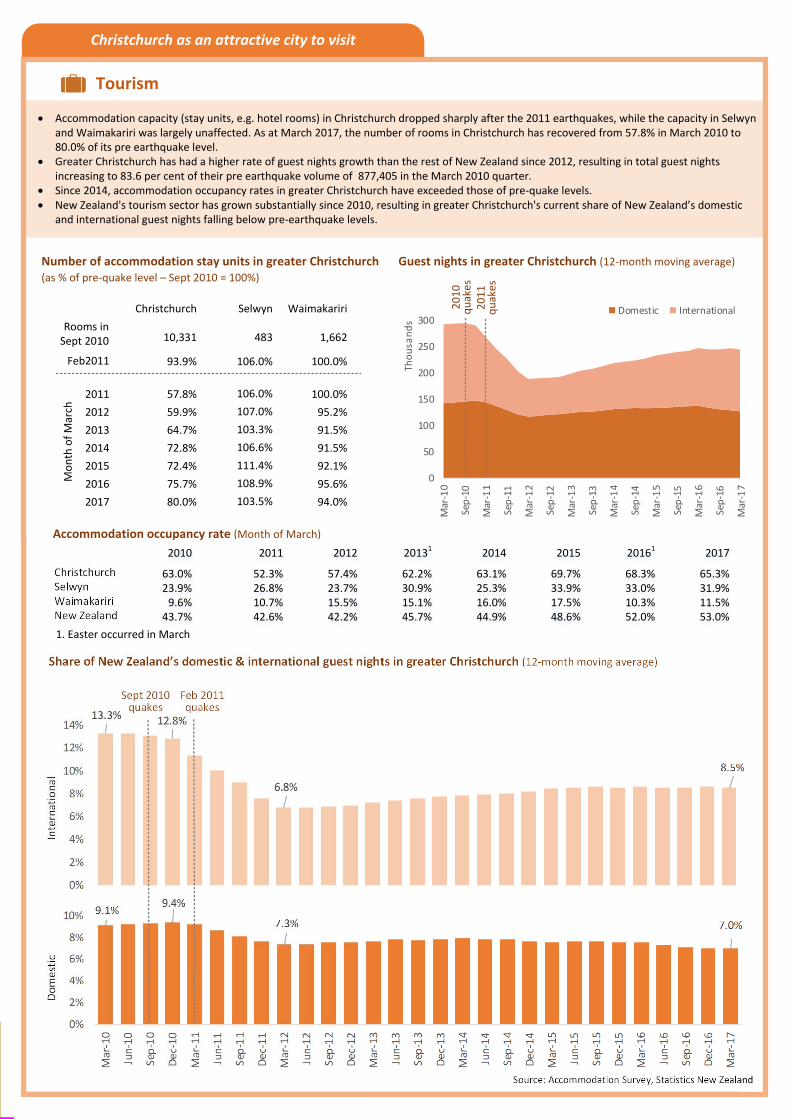
Accommodation capacity (stay units, e.g. hotel rooms) in Christchurch dropped sharply after the 2011 earthquakes, while the capacity in Selwyn and Waimakariri was largely unaffected. As at March 2017, the number of rooms in Christchurch has recovered from 57.8% in March 2010 to 80.0% of its pre earthquake level.
Greater Christchurch has had a higher rate of guest nights growth than the rest of New Zealand since 2012, resulting in total guest nights increasing to 83.6 per cent of their pre earthquake volume of 877,405 in the March 2010 quarter.
Since 2014, accommodation occupancy rates in greater Christchurch have exceeded those of pre‐quake levels. New Zealand's tourism sector has grown substantially since 2010, resulting in greater Christchurch's current share of New Zealand’s domestic
and international guest nights falling below pre‐earthquake levels.
Tourism
Source: Accommodation Survey, Statistics New Zealand
0
50
100
150
200
250
300
Mar‐10
Sep‐10
Mar‐11
Sep‐11
Mar‐12
Sep‐12
Mar‐13
Sep‐13
Mar‐14
Sep‐14
Mar‐15
Sep‐15
Mar‐16
Sep‐16
Mar‐17
Thousands
Domestic International
Guest nights in greater Christchurch (12‐month moving average)
2011
quakes
2010
quakes
Number of accommodation stay units in greater Christchurch (as % of pre‐quake level – Sept 2010 = 100%)
Waimakariri
1,662
100.0%
100.0%
95.2%
91.5%
91.5%
92.1%
95.6%
94.0%
Selwyn
483
106.0%
106.0%
107.0%
103.3%
106.6%
111.4%
108.9%
103.5%
Christchurch
10,331
93.9%
57.8%
59.9%
64.7%
72.8%
72.4%
75.7%
80.0%
2011
2012
2013
2014
2015
2016
2017
Rooms in Sept 2010
Feb2011
Month of M
arch
13.3% 12.8%
6.8%
8.5%
0%
2%
4%
6%
8%
10%
12%
14%
9.1%9.4%
7.3% 7.0%
0%
2%
4%
6%
8%
10%
Mar‐10
Jun‐10
Sep
‐10
Dec‐10
Mar‐11
Jun‐11
Sep
‐11
Dec‐11
Mar‐12
Jun‐12
Sep
‐12
Dec‐12
Mar‐13
Jun‐13
Sep
‐13
Dec‐13
Mar‐14
Jun‐14
Sep
‐14
Dec‐14
Mar‐15
Jun‐15
Sep
‐15
Dec‐15
Mar‐16
Jun‐16
Sep
‐16
Dec‐16
Mar‐17
Share of New Zealand’s domestic & international guest nights in greater Christchurch (12‐month moving average)
Domestic
International
Sept 2010quakes
Feb 2011 quakes
ChristchurchSelwynWaimakaririNew Zealand
Accommodation occupancy rate (Month of March)
2017
65.3%31.9%11.5%53.0%
20161
68.3%33.0%10.3%52.0%
2015
69.7%33.9%17.5%48.6%
2014
63.1%25.3%16.0%44.9%
62.2%30.9%15.1%45.7%
20131 2012
57.4%23.7%15.5%42.2%
52.3%26.8%10.7%42.6%
20112010
63.0%23.9%9.6%43.7%
1. Easter occurred in March

13
SECTION 3: CHRISTCHURCH AS AN ATTRACTIVE CITY TO VISIT
3.1. TOURISM
32. The Canterbury earthquake sequence had a significant impact on tourism-related industries across greater Christchurch. Multiple tourist accommodation facilities and attractions were damaged, some beyond repair. Out of the 309 scheduled heritage buildings in Christchurch’s central city, for example, 48 per cent did not survive the earthquake and some that did were found to be in a poor state of repair19. The Christ Church Cathedral is an example of one of the city’s heritage landmarks that was badly damaged in the earthquakes and remains closed to this day.
33. The many heritage buildings that survived, and are open to the public, include the Christchurch Arts Centre (undergoing a staged opening), the Canterbury Museum and the Isaac Theatre Royal. Other central city tourist attractions such as the Christchurch Art Gallery and the Christchurch Tramway were repaired and are also now operating.
34. Recognising the importance of the central city’s recovery, the Christchurch Central Recovery Plan was developed. The plan included a spatial framework, known as the Blueprint, identifying locations of precincts and ‘anchor’ projects for the city. For example, the Blueprint identified a convention centre and a performing arts precinct for the central city.
INTERNATIONAL VISITORS
35. International visitor arrivals through Christchurch Airport fell following the earthquakes. In the 12 months to April 2013, international visitor arrivals to Christchurch Airport reached a post-earthquake low of 396,672 (72.0 per cent of the number recorded in the 12 months to April 2010). Visitor arrivals have since shown signs of improvement (see Figure 3-1). In the 12 months to April 2017, 504,928 international visitors entered New Zealand through Christchurch Airport, 91.6 per cent of the arrivals recorded before the earthquakes (in the 12 months to April 2010) 20. This is an increase of 7.2 per cent from the previous 12 month period (compared with a 9.6 per cent national growth in international visitor arrivals).
Figure 3-1: International visitor arrivals to Christchurch Airport (12 months to 30 April)
19 “Heritage Buildings and Places Recovery Programme for greater Christchurch”: 2014, Ministry for Culture and Heritage. 20 International Travel and Migration: Statistics New Zealand.
551,315476,346
416,476 396,672 407,792 438,192 470,960 504,928
2010 2011 2012 2013 2014 2015 2016 2017
-13.6%-12.6%
-4.8% +2.8% +7.5%+7.5%
+7.2%
Source: International Travel and Migration, Statistics New Zealand

14
36. Prior to the earthquakes (in the 12 months to April 2010), 57.6 per cent of international visitor arrivals to Christchurch Airport were Australian residents. Australian arrivals remain the primary visitors, however in the 12 months to April 2017 their share of total non-resident visitor arrivals has fallen to 47.3 per cent. Conversely, residents from the People’s Republic of China represented 8.5 per cent of visitor arrivals in the 12 months to April 2017, up from 1.3 per cent share before the earthquakes21.
COMMERCIAL ACCOMMODATION
37. Visitor accommodation also faced falling guest numbers after the earthquakes, however the number of guest nights stayed across greater Christchurch has since risen from 2.26 million over the 12 months to March 2012 to 2.93 million in 2017, reaching 83.6 per cent of the guest nights in the 12 months to March 2010 (3.51 million)22.
38. In the 12 months to March 2017, the total guest nights in Christchurch experienced a 1.1 per cent decline from the previous 12-month period, driven by an 8.0 per cent decrease in domestic guest nights 23 (international guest nights increased 7.6 per cent). It is possible that this shorter term trend may be related to a reduction in rebuild activity and a corresponding decline in both government and private sector workers staying overnight in Christchurch.
Figure 3-2: Christchurch – number of stay units by accommodation type (March 2010 = 100%)
39. Accommodation capacity in Christchurch dropped sharply after the 2011 earthquakes, while the capacity in Selwyn and Waimakariri was largely unaffected. As at March 2017, the number of stay units24 (i.e.
21 International Travel and Migration: Statistics New Zealand. 22 Accommodation Survey: Statistics New Zealand. The Accommodation Survey covers most short-term commercial accommodation in New Zealand. A few notable exceptions are hosted accommodation (such as ‘bed & breakfast’ establishments), marine vessels (such as cruise ships), private dwellings etc. 23 Accommodation Survey: Statistics New Zealand. 24 Units are defined as units of accommodation that are available to be charged out to guests such as a room in a motel or hotel, a bed in a backpacker establishment, or a site in a caravan park.
56.5%
93.3%
76.2%
97.7%
20%
40%
60%
80%
100%
120%
2010 2011 2012 2013 2014 2015 2016 2017
Hotels Motels Backpackers Holiday Parks
Case Study 3-1: The Christchurch Arts Centre The Arts Centre encompasses 23 separate buildings, of which 21 are listed by Heritage New Zealand as Historic Place Category 1. The buildings date from 1877 and were significantly damaged in the 2010 and 2011 Canterbury earthquake sequence. The Arts Centre settled the bulk of their insurance claims in 2012 and commenced its restoration programme in 2013. Currently in 2017, restoration is well underway, with more than half the site reopened to the public, including the Great Hall and Rutherford’s Den which reopened in 2016. The remaining buildings are due to re-open in the next few years.
Source: Accommodation Survey, Statistics New Zealand

15
rooms) in Christchurch has recovered from 54.6% in March 2011 to 75.6% of its pre quake level. The number of motel units in Christchurch has returned to 93.3 per cent of the pre-earthquake level. Hotel accommodation has faced a slower recovery, with the number of total units at 56.5 per cent of the pre-earthquake25. This is largely due to the higher concentration of these establishments being in the central city, as well as the rebuilds being generally more complex and taking longer to progress (see Figure 3-2).
40. Prior to the earthquakes, the number of commercial accommodation units available in the central city was 5,279 (March 2010), and two years later this fell by 88.2 per cent to 621 (March 2012). The number of guest nights similarly fell from 178,626 to 16,611 over the same period26. The central city has seen some recovery in guest night numbers, albeit at a slower pace compared to greater Christchurch as a whole. In part, this is due to the final central city cordon only being lifted in mid-2013 and the intense horizontal infrastructure and other construction activity taking place. In the central city there were 2,042 units in commercial accommodation reported in March 2017, however this is still under half the number of units available in March 2010 (5,279). Similarly, the number of guest nights for the central city over the 12 months to March 2017 (see Figure 3-3) has only reached 44.5 per cent of the level reported in 201027.
Figure 3-3: Christchurch central city guest nights (12 months to 31 March)
41. It is anticipated that the number of units available in the central city will continue to improve, as more hotels and other accommodation types complete construction. For example, repairs are underway on the 200 room Crown Plaza hotel in the Performing Arts Precinct and the former 180 room Millennium Hotel in Cathedral Square that is to be repaired and reopened under a new brand (Distinction)28.
TOURISM EXPENDITURE
42. Visitors to the Christchurch area play an important role in the local economy. Total tourism expenditure in the greater Christchurch area was estimated at $2.3 billion in in the 12 months to April 2017, approximately 8.8 per cent of total tourism expenditure in New Zealand (see Figure 3-4). In the 12 months to April 2017,
25 Accommodation Survey: Statistics New Zealand. 26 Accommodation Survey: Statistics New Zealand. 27 Accommodation Survey: Statistics New Zealand. 28 Ministry of Business, Innovation and Employment.
Case study 3-2: Holiday Inn Express Hotel
The Holiday Inn Express hotel planned for Gloucester Street in the Central City will be one of the first new high-rise hotels for Christchurch since the 2010-2011 earthquakes. Indications are it will be a 14-storey, 120-room hotel, estimated to cost between $25 million and $30 million, and is scheduled to open in 2019.
The building will be located between Press House and the Rendezvous Hotel in the Cathedral Junction.
1,693,350
1,429,993
214,905 261,581 437,617
608,099 765,598 753,713
Mar-10 Mar-11 Mar-12 Mar-13 Mar-14 Mar-15 Mar-16 Mar-17
Source: Accommodation Survey, Statistics New Zealand

16
tourism expenditure in greater Christchurch grew by 2.3 per cent compared with the 12 months to April 2016. Nationally, tourism expenditure outpaced Christchurch, growing by 5.0 per cent over the same period29.
Figure 3-4: Greater Christchurch Regional Tourism Estimates (12 months to 30 April)
3.2. LOOKING AHEAD
43. Although greater Christchurch has yet to regain its pre-quake share of New Zealand’s domestic and international guest nights, the overall outlook for the region is positive. It is expected that tourists will return to greater Christchurch at a higher rate, with the completion of accommodation and major facilities. A number of hotels are under repair or construction in the central city, and there are many new developments in the retail precinct and other new projects that will bring tourist revenue into Christchurch (for example, the convention centre precinct). It is also encouraging to see that China Southern Airlines has begun services direct to Christchurch. Christchurch should continue to leverage opportunities to rebuild its reputation as one of main tourist destinations in New Zealand.
29 Regional Tourism Estimates: To 31 March 2017, Ministry of Business, Innovation and Employment.
$2,129m $2,119m$1,913m
$1,640m $1,755m $1,893m$2,050m
$2,280m $2,333m
2009 2010 2011 2012 2013 2014 2015 2016 2017
Source: Regional Tourism Estimates, Ministry of Business, Innovation and Employment

Housing in greater Christchurch
Private bonds lodged in greater Christchurch (3 months to April)
In April 2017, Christchurch experienced the lowest annual house price growth (1.4 per cent) among 15 main areas reported on in New Zealand.
Since February 2015, the average rent for newly tenanted properties in greater Christchurch has generally decreased, and the rent level as percentage of the national average has returned to a similar level as pre‐quake ($386 per week in April 2017).
During the 3 months to April 2017, the total number of private bonds lodged in greater Christchurch was 93.4 per of the level during the same period in 2010. However, lower‐cost rental (less than $400 per week) are still well below pre‐quake levels.
Housing
Average weekly rent from newly tenanted properties in greater Christchurch (monthly, as % of national average)
Residential Insurance
As at 31 March 2017, the Earthquake Commission reported that all 141,005 first time under‐cap dwelling claims have completed their first time claim settlement procedure. They are now dealing only with call‐back claims.
There are an estimated 6,578 call‐back claims with the Earthquake Commission, of which 600 to 1,500 are anticipated to go over‐cap (31 Mar 2017 estimates).
As at 31 March 2017, private insurers have settled a total of 23,354 (87.6%) of all over‐cap claims.
Cash settlement does not mean that the property has been repaired or rebuilt, and there is limited visibility of when, or if home owners repair or rebuild their properties.
Total household
claims
=
First timeUnder‐cap
(EQC) claims
Over‐cap claims
+ 3,3181
Nil
3,318
164,359
141,0052
Settled claims
Unsettled claims
167,677
141,005
26,672 23,354
= +
= +
51.8% cash settled
70.3% cash settled 90.2% in progress
Settlement progress (as at 31 Mar 2017)
1. Call‐back claims with the Earthquake Commission are not included.2. This figure is likely to be slightly lower as it includes claims outside of the
Earthquake Commission’s control (e.g. under litigation).
Average house value growth (Apr 2016 ‐ Apr 2017)
Highest
Lowest
Ordered
by average house value
Source: Quotable Value NZ and Ministry of Business, Innovation and Employment
Source: Insurance Council NZ and Ministry of Business, Innovation and Employment10.0%
14.9%
17.0%
27.8%
22.8%
8.8%
17.2%
20.1%
1.4%
16.9%
14.4%
21.2%
17.5%
23.7%
10.7%
11.1%
Invercargill
Palmerston NorthDunedin
Rotorua
Hastings
New Plymouth
Napier
Whangarei
Christchurch
Nelson
Hamilton
Wellington RegionTauranga
Queenstown LakesAuckland
National average
Aug‐10, 93.6%May‐12, 101.4%
Jul‐14, 117.2%
Sep‐15, 99.5%
Apr‐17, 90.3%90%
95%
100%
105%
110%
115%
120%
Jun‐10 Jun‐16
88.0% 82.9% 78.5% 65.8% 52.7% 50.0% 55.8% 61.0%
12.0%17.1%
21.5%
34.2% 47.3% 50.0%44.2%
39.0%
0
1,000
2,000
3,000
4,000
5,000
6,000
2010 2011 2012 2013 2014 2015 2016 2017
less than $400 per week $400+ per week

18
SECTION 4: HOUSING IN GREATER CHRISTCHURCH
4.1. HOUSE PRICES AND RENTAL COSTS
44. Market indicators suggest that the balance between supply and demand for residential housing has been improving since the housing shortage after the earthquakes, which contributed to a sharp increase in residential property prices and rents. The average weekly rent for newly tenanted dwellings30 in greater Christchurch continues to fall, while Christchurch city experienced the lowest property value growth of the 15 selected main areas in New Zealand between April 2016 and April 201731. Both indicators suggest that the undersupply of property is no longer a major concern in greater Christchurch.
45. Property values in Christchurch city have continued to stabilise, with an average value in April 2017 of $495,855, up 1.4 per cent from April 2016 (compared to the national average value of $631,147 and growth rate of 11.1 per cent). The second lowest growth of the 15 selected main areas in New Zealand was 8.8 per cent for New Plymouth.
46. Between August 2010 and April 2017, the average property value in Christchurch city increased by 36.6 per cent, while nationally the increase was 59.8 per cent (see Figure 4-1). Property values in Selwyn and Waimakariri followed a similar pattern of growth to Christchurch city, but at a higher rate. The majority of the value growth in Christchurch city occurred in 2012, 2013 and 2014, when year on year growth was the highest.
Figure 4-1: Cumulative growth in average property value (base month August 2010)
30 Rental bond data, Ministry of Business, Innovation and Employment. 31 Residential House Values are obtained from the QV website, the 15 areas are those reported in the monthly QV House Price Index.
36.6%
44.5%49.9%
59.8%
-5%
5%
15%
25%
35%
45%
55%
65%
Apr-11 Apr-12 Apr-13 Apr-14 Apr-15 Apr-16 Apr-17
Christchurch Waimakariri Selwyn New Zealand
(to $631,147 Apr-17)
(to $495,855 Apr-17)
(to $441,938 Apr-17)
(to $545,261 Apr-17)
Source: Residential House Values, Quotable Value
19
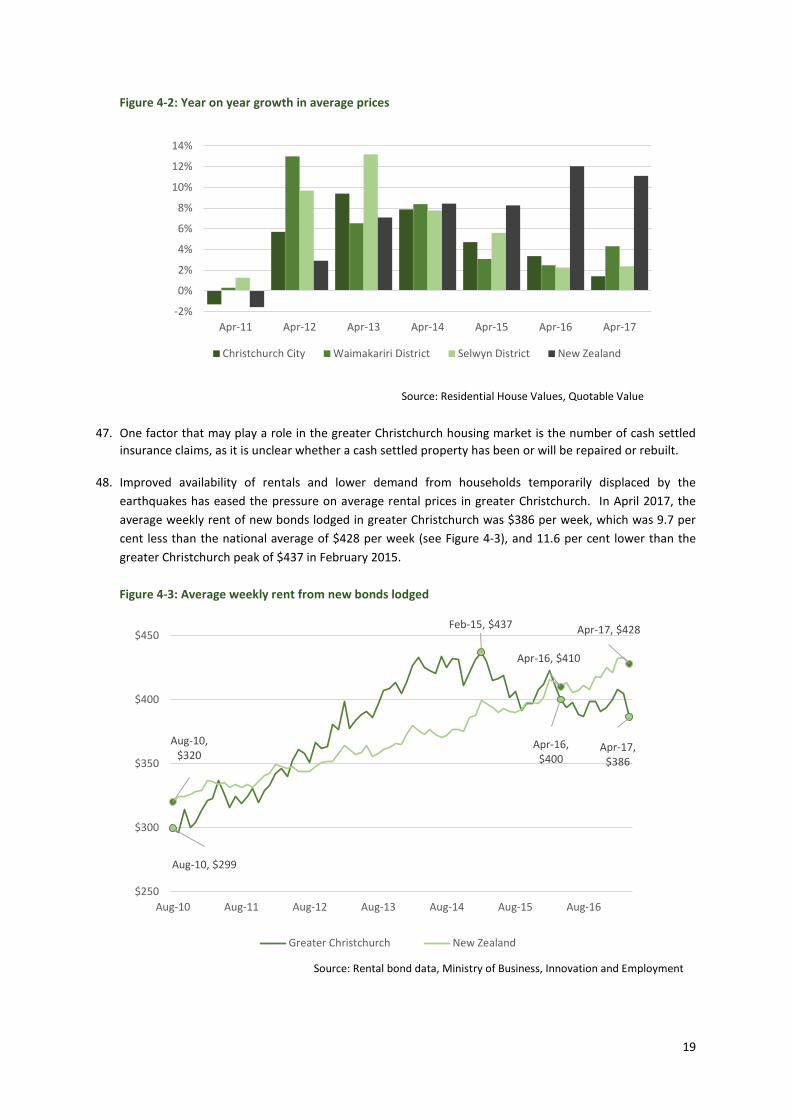
Figure 4-2: Year on year growth in average prices
47. One factor that may play a role in the greater Christchurch housing market is the number of cash settled insurance claims, as it is unclear whether a cash settled property has been or will be repaired or rebuilt.
48. Improved availability of rentals and lower demand from households temporarily displaced by the earthquakes has eased the pressure on average rental prices in greater Christchurch. In April 2017, the average weekly rent of new bonds lodged in greater Christchurch was $386 per week, which was 9.7 per cent less than the national average of $428 per week (see Figure 4-3), and 11.6 per cent lower than the greater Christchurch peak of $437 in February 2015.
Figure 4-3: Average weekly rent from new bonds lodged
-2%
0%
2%
4%
6%
8%
10%
12%
14%
Apr-11 Apr-12 Apr-13 Apr-14 Apr-15 Apr-16 Apr-17
Christchurch City Waimakariri District Selwyn District New Zealand
Aug-10, $299
Feb-15, $437
Apr-16, $400
Apr-17, $386
Aug-10, $320
Apr-16, $410
Apr-17, $428
$250
$300
$350
$400
$450
Aug-10 Aug-11 Aug-12 Aug-13 Aug-14 Aug-15 Aug-16
Greater Christchurch New Zealand
Source: Residential House Values, Quotable Value
Source: Rental bond data, Ministry of Business, Innovation and Employment
20
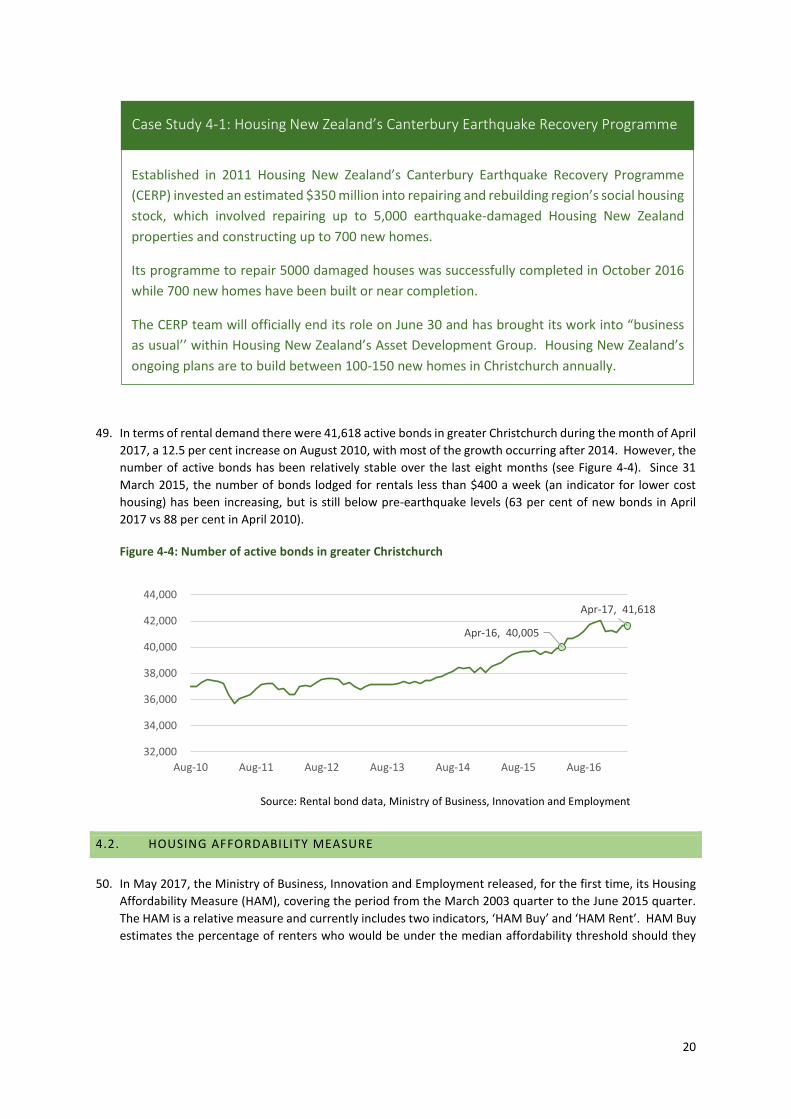
49. In terms of rental demand there were 41,618 active bonds in greater Christchurch during the month of April 2017, a 12.5 per cent increase on August 2010, with most of the growth occurring after 2014. However, the number of active bonds has been relatively stable over the last eight months (see Figure 4-4). Since 31 March 2015, the number of bonds lodged for rentals less than $400 a week (an indicator for lower cost housing) has been increasing, but is still below pre-earthquake levels (63 per cent of new bonds in April 2017 vs 88 per cent in April 2010).
Figure 4-4: Number of active bonds in greater Christchurch
4.2. HOUSING AFFORDABILITY MEASURE
50. In May 2017, the Ministry of Business, Innovation and Employment released, for the first time, its Housing Affordability Measure (HAM), covering the period from the March 2003 quarter to the June 2015 quarter. The HAM is a relative measure and currently includes two indicators, ‘HAM Buy’ and ‘HAM Rent’. HAM Buy estimates the percentage of renters who would be under the median affordability threshold should they
Apr-16, 40,005
Apr-17, 41,618
32,000
34,000
36,000
38,000
40,000
42,000
44,000
Aug-10 Aug-11 Aug-12 Aug-13 Aug-14 Aug-15 Aug-16
Case Study 4-1: Housing New Zealand’s Canterbury Earthquake Recovery Programme
Established in 2011 Housing New Zealand’s Canterbury Earthquake Recovery Programme (CERP) invested an estimated $350 million into repairing and rebuilding region’s social housing stock, which involved repairing up to 5,000 earthquake-damaged Housing New Zealand properties and constructing up to 700 new homes.
Its programme to repair 5000 damaged houses was successfully completed in October 2016 while 700 new homes have been built or near completion.
The CERP team will officially end its role on June 30 and has brought its work into “business as usual’’ within Housing New Zealand’s Asset Development Group. Housing New Zealand’s ongoing plans are to build between 100-150 new homes in Christchurch annually.
Source: Rental bond data, Ministry of Business, Innovation and Employment

21
purchase a lower quartile house in their geographic area. While, HAM rent estimates the percentage of renters who would be below the median affordability threshold in their geographic area32.
51. Both HAM indicators for Canterbury show that housing has become more affordable since 2011 and that affordability in Canterbury has been improving at a greater rate than in New Zealand as a whole (see Figure 4-5). In 2012, housing became more affordable in Canterbury than in New Zealand (June 2012 quarter for HAM buy and September 2012 quarter for HAM rent).
Figure 4-5: HAM for national and Canterbury (higher numbers indicate less-affordable housing)
52. The HAM Buy indicator shows that for 77.8 per cent of renting households in Canterbury, buying is unaffordable in the June 2015 quarter (nationally the rate is 81.4 per cent), down from 84.3 per cent in the September 2010 quarter. The increasing affordability for first home buyers in Canterbury between 2011 and 2015 was due to average household incomes in Canterbury growing faster than housing cost after 2010 and 2011 earthquakes33. Similarly, HAM Rent shows renting conditions in Canterbury are more affordable than it is nationally and that renting in Canterbury is more affordable than buying (consistent with nationwide trends). In the June 2015 quarter, renting is reported to be unaffordable for 60.9 percent of households (nationally the rate is 66.6 per cent), down from 72.7 per cent in the September 2010 quarter. The improvement in affordability for renting households in Canterbury after the Christchurch earthquakes is related to median household incomes growing faster than average rents34.
PERCEPTIONS ON HOUSING AFFORDABILITY – QUALITY OF LIFE SURVEY
53. The Quality of Life Survey measures the perceptions of residents in nine councils around New Zealand. One focus of the Quality of Life Survey is housing affordability, where respondents are asked their level of agreement with the statement: Your housing costs are affordable (by housing costs we mean things like rent or mortgage, rates, house insurance and house maintenance), Figure 4-6 presents the 2014 and 2016 results for this question.
32 A household with a residual income (income less housing costs) that is less than the national affordability benchmark is classified as not being able to afford to buy or rent in their geographic area. A decreasing HAM Buy or HAM Rent indicates that the proportion of households with a residual income below the national affordability benchmark is decreasing and therefore housing affordability is improving in the geographic area. 33 Housing Affordability in New Zealand: Results (May 2017); Ministry of Business, Innovation and Employment; p. 9. 34 Housing Affordability in New Zealand: Results (May 2017); Ministry of Business, Innovation and Employment; p. 9.
60%
65%
70%
75%
80%
85%
Sep-
10
Jun-
11
Mar
-12
Dec-
12
Sep-
13
Jun-
14
Mar
-15
National (Rent) Canterbury (Rent)
60%
65%
70%
75%
80%
85%
Sep-
10
Jun-
11
Mar
-12
Dec-
12
Sep-
13
Jun-
14
Mar
-15
National (Buy) Canterbury (Buy)
Source: Housing Affordability Measurement, Ministry of Business, Innovation and Employment

22
Figure 4-6: Housing cost in Christchurch – Quality of Life survey35
54. Although the HAM indicators and the survey results are produced very differently and represent affordability for different groups of people (HAM renting households, Quality of Life survey all residents), they both show housing affordability in Christchurch/Canterbury has improved since 2014.
4.3. INSURANCE
55. Nearly 170,000 properties were damaged in the earthquakes, about three quarters of Canterbury’s housing stock36, resulting in 167,677 first-time residential claims. As at 31 March 2017, approximately 84 per cent of these claims (141,005) were under-cap and managed by the Earthquake Commission and the remaining 16 per cent (26,672) were over-cap and managed by private insurers. The Ministry of Business, Innovation and Employment estimate that the total value of residential earthquake-related construction is approximately $13 billion (in 2012 dollars).
56. In 2017, dwelling insurance settlement in greater Christchurch focuses on complex claims and those call-back (reopened) claims. As at 31 March 2017, there are 3,318 first time dwelling claims outstanding (2.0 per cent of the total first time household claims), all of which are over-cap and being managed by insurers.
57. As at 31 March 2017, the Earthquake Commission reports that of the 141,005 first time under-cap claims, they have completed all that are within their operational control, i.e. excluding those under litigation. The Earthquake Commission is focusing on dealing with an estimated 6,578 call-back claims37 (4.7 per cent of the Earthquake Commission’s total claims). Of these, an estimated 600 to 1,500 could transfer to insurers as the value of the claim moves past the $100,000 settlement cap threshold. However, the number of call-
35 Quality of Life Survey, 2014 and 2016. Combined cities includes Auckland Council, Christchurch City Council, Wellington City Council, Dunedin City Council, Porirua City Council, Hutt City Council and Hamilton City Council (2016 only). 36 The Canterbury rebuild five years on from the Christchurch earthquake, Reserve Bank of New Zealand. 37 Under-cap call-back claims include remediation of first-time repairs; work identified through the Earthquake Repairs to Canterbury Homes – Home Inspection Survey Report and the subfloor review programme; and claims where customers are in dispute with the Earthquake Commission following initial settlement.
Case Study 4-2: Residential Advisory Services
The Residential Advisory Service was launched in May 2013 to provide free, independent advice to residential property owners facing challenges in getting their home repaired or rebuilt following the Canterbury earthquake sequence. The service has offered Earthquake Commission and insurance support to over 4,600 homeowners.
In December 2016 the service transitioned to a brokering model to respond to the increasing complexity of the cases remaining. Funding for the service has been extended to at least December 2017 at which point the service would continue to be funded by the Ministry of Business, Innovation and Employment, subject to need.
Source: Quality of Life Survey

23
back claims may further rise as any claim lodged with the Earthquake Commission can be re-opened, at any time, as new information becomes available.
58. The delay in overall settlement (the long tail of unsettled claims) has been in part due to the number of repairs in the over-cap claims to be cash settled (repairs can take longer to determine and agree strategy, scope and price than rebuilds) and multi-unit dwelling claims (due to the complexity of the claim).
59. Of the 3,318 unsettled over-cap claims, 814 or 25 per cent are in construction and have a clear pathway to settlement (see Table 4-1). Claims transferring to over-cap from the Earthquake Commission are reflected in the ‘new claims assessment’ category, with 277 or 8 per cent of unsettled claims. Insurers report that with 182 or 5 per cent of the unsettled claims, the homeowner is undecided. The balance of unsettled claims (2,045 or 62 per cent) are progressing through work with both insurers and homeowners.
Table 4-1: Current status of unsettled over-cap dwelling claims (As at 31 March 2017)
Number of claims % of unsettled
New claims assessment 277 8%
Design and/or pricing 1,064 32%
Cash settling, not finalised 981 30%
Customer undecided 182 5%
In construction 814 25%
Total unsettled 3,318 100%
60. It should be noted that a cash settlement does not mean that the property has been repaired or rebuilt, and there is limited visibility of when, or if home owners repair or rebuild their properties. Unrepaired properties could pose a number of risks. Among these are the quality of local housing stock, and health and safety issues for the occupiers.
4.4. LOOKING AHEAD
61. Unresolved dwelling claims, both first time claims and call-back claims, can have an ongoing negative impact on wellbeing for dwelling owner/occupiers. Continued support through the Residential Advisory Service and a focus on these claims from the Earthquake Commission and insurers is advisable to ensure the tail end of claims does not continue to extend.
62. Housing affordability, although improving, should continue to be monitored in greater Christchurch. Some of the inputs into the HAM will assist in improving housing affordability in greater Christchurch (such as low house price growth and decreasing average weekly rents), while others will have the opposite affect (such as increasing interest rates and lower earnings growth).
Source: Residential Insurance Progress, Ministry of Business, Innovation and Employment
The wellbeing of greater Christchurch communities and individuals +
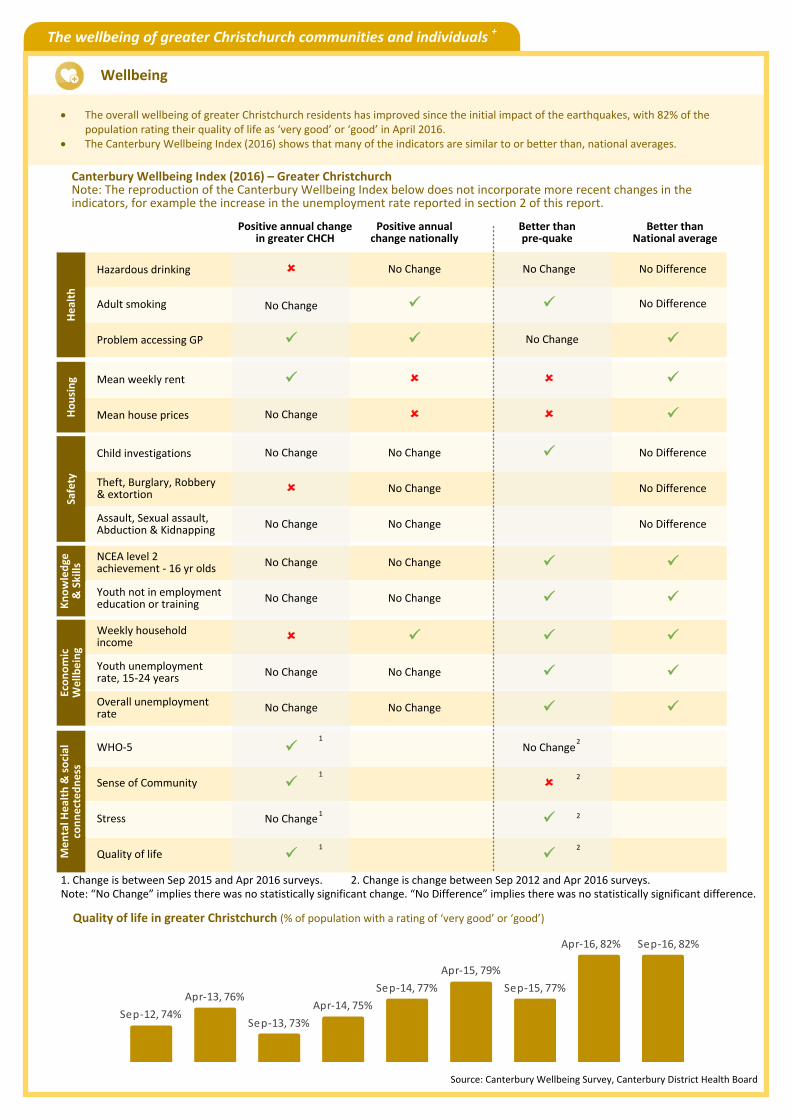
The overall wellbeing of greater Christchurch residents has improved since the initial impact of the earthquakes, with 82% of the population rating their quality of life as ‘very good’ or ‘good’ in April 2016.
The Canterbury Wellbeing Index (2016) shows that many of the indicators are similar to or better than, national averages.
Wellbeing
Quality of life in greater Christchurch (% of population with a rating of ‘very good’ or ‘good’)
Source: Canterbury Wellbeing Survey, Canterbury District Health Board
Canterbury Wellbeing Index (2016) – Greater ChristchurchNote: The reproduction of the Canterbury Wellbeing Index below does not incorporate more recent changes in the indicators, for example the increase in the unemployment rate reported in section 2 of this report.
Positive annual change in greater CHCH
Health
Housing
Safety
Knowledge
& Skills
Economic
Wellbeing
Mental H
ealth & social
connectedness
Hazardous drinking
Adult smoking
Problem accessing GP
Mean weekly rent
Mean house prices
Child investigations
Theft, Burglary, Robbery & extortion
Assault, Sexual assault, Abduction & Kidnapping
NCEA level 2 achievement ‐ 16 yr olds
Youth not in employment education or training
Weekly household income
Youth unemployment rate, 15‐24 years
Overall unemployment rate
WHO‐5
Sense of Community
Stress
Quality of life
No Change
No Change
No Change
No Change
No Change
No Change
No Change
No Change
No Change
Better than National average
No Difference
No Difference
No Difference
No Difference
No Difference
Positive annual change nationally
Better than pre‐quake
No Change
No Change
No Change
No Change
No Change
No Change
No Change
No Change
No Change
No Change
No Change
1. Change is between Sep 2015 and Apr 2016 surveys. 2. Change is change between Sep 2012 and Apr 2016 surveys. Note: “No Change” implies there was no statistically significant change. “No Difference” implies there was no statistically significant difference.
1
1
1
1
2
2
2
2
Sep‐12, 74%Apr‐13, 76%
Sep‐13, 73%Apr‐14, 75%
Sep‐14, 77%Apr‐15, 79%
Sep‐15, 77%
Apr‐16, 82% Sep‐16, 82%

25
SECTION 5: THE WELLBEING OF GREATER CHRISTCHURCH COMMUNITIES AND INDIVIDUALS
63. The overall wellbeing of greater Christchurch residents has improved since the initial impact of the earthquakes and many of the indicators are similar to, or better than, national measures. As rebuild-related construction activity declines, some of the indicators in the Canterbury Wellbeing Index could move or have moved, in a negative direction, for example, increased unemployment.
5.1. CANTERBURY WELLBEING INDEX 2016
64. The Canterbury Wellbeing Index38 tracks the progress of the social recovery, using indicators to provide information on the impacts of the earthquakes on wellbeing and to identify emerging social trends and issues. The Canterbury Wellbeing Index consists of a range of indicators structured around health, knowledge and skills, economic wellbeing, social connectedness, civil participation, housing, safety and people39.
65. Of the 11 indicators that provide a comparison to pre-earthquake environment, seven show conditions are better than they were prior to the earthquakes, and two are at a similar level. The two indicators that show conditions have deteriorated (higher mean weekly rent and mean house prices need to be considered within the context of increasing median weekly household income (see Figure 5-3)).
66. Improvement in wellbeing has slowed between 2015 and 2016, with only five of the 17 primary indicators showing a positive change, although one of these indicators is the self-reported quality of life result from the wellbeing survey, which had a statistically significant positive increase. Nine indicators showed no change (either there was no change or the significance of the change was unknown), while three showed a negative change (Hazardous drinking, Weekly household income, and Theft, burglary, robbery and extortion).
67. Where national comparisons are available (13 of the 17 indicators), eight of the indicators show that conditions in greater Christchurch are more favourable than the national result, five show conditions are similar, while none show conditions are worse.
68. Although the index paints an overall positive picture for wellbeing and social recovery in greater Christchurch, population level results should not be read in isolation to results about particular vulnerable communities (see Figure 5-1).
38 The Canterbury Wellbeing Index is based on administrative and survey data from a variety of sources, as a result not all data is directly comparable, for example, geographic areas are not consistent across data sets nor are the reporting periods. 39 Sourced from: https://www.cph.co.nz/your-health/canterbury-wellbeing-index/.
Case Study 5-1: The Canterbury Wellbeing Survey
The Survey was developed by the Canterbury Earthquake Recovery Authority to collect self-reported data on the wellbeing of greater Christchurch residents and their perceptions of the recovery. The first survey was conducted in September 2012 and has run twice a year since. The results of the September 2016 survey were released on 6 June 2017.
The survey results have been used to supplement other data sources in the Canterbury Wellbeing Index.
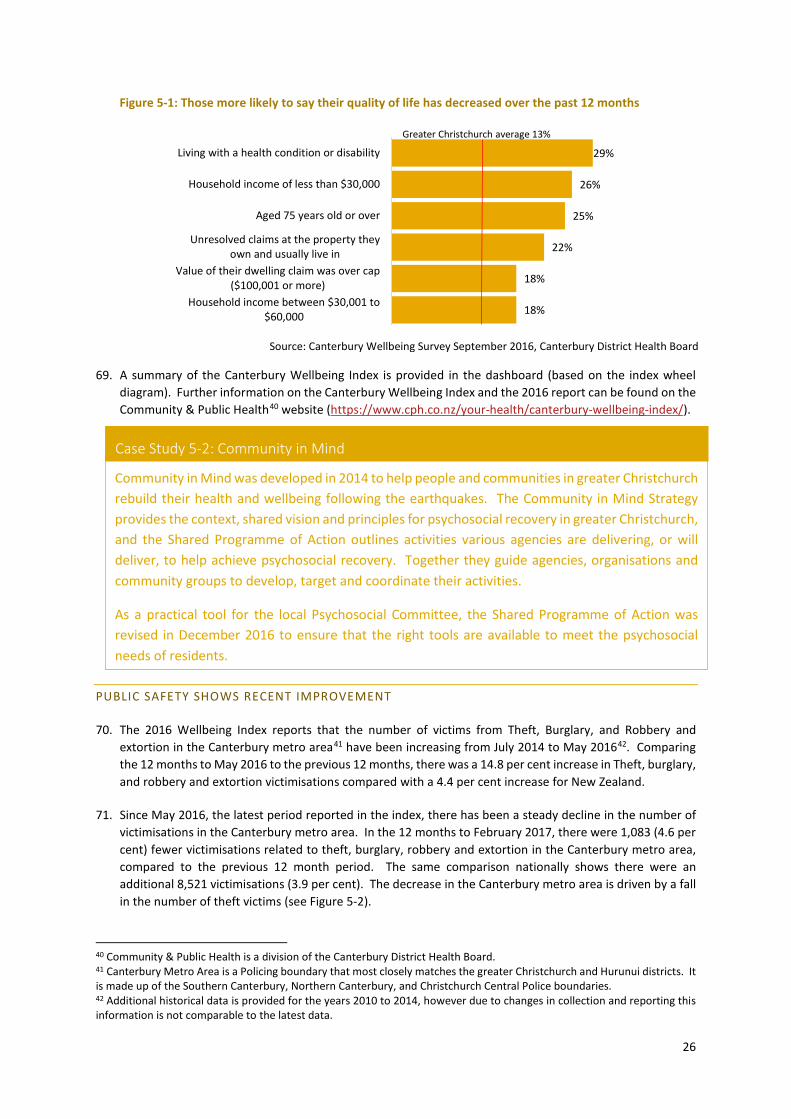
26
Figure 5-1: Those more likely to say their quality of life has decreased over the past 12 months
69. A summary of the Canterbury Wellbeing Index is provided in the dashboard (based on the index wheel diagram). Further information on the Canterbury Wellbeing Index and the 2016 report can be found on the Community & Public Health40 website (https://www.cph.co.nz/your-health/canterbury-wellbeing-index/).
PUBLIC SAFETY SHOWS RECENT IMPROVEMENT
70. The 2016 Wellbeing Index reports that the number of victims from Theft, Burglary, and Robbery and extortion in the Canterbury metro area41 have been increasing from July 2014 to May 201642. Comparing the 12 months to May 2016 to the previous 12 months, there was a 14.8 per cent increase in Theft, burglary, and robbery and extortion victimisations compared with a 4.4 per cent increase for New Zealand.
71. Since May 2016, the latest period reported in the index, there has been a steady decline in the number of victimisations in the Canterbury metro area. In the 12 months to February 2017, there were 1,083 (4.6 per cent) fewer victimisations related to theft, burglary, robbery and extortion in the Canterbury metro area, compared to the previous 12 month period. The same comparison nationally shows there were an additional 8,521 victimisations (3.9 per cent). The decrease in the Canterbury metro area is driven by a fall in the number of theft victims (see Figure 5-2).
40 Community & Public Health is a division of the Canterbury District Health Board. 41 Canterbury Metro Area is a Policing boundary that most closely matches the greater Christchurch and Hurunui districts. It is made up of the Southern Canterbury, Northern Canterbury, and Christchurch Central Police boundaries. 42 Additional historical data is provided for the years 2010 to 2014, however due to changes in collection and reporting this information is not comparable to the latest data.
29%
26%
25%
22%
18%
18%
Living with a health condition or disability
Household income of less than $30,000
Aged 75 years old or over
Unresolved claims at the property theyown and usually live in
Value of their dwelling claim was over cap($100,001 or more)
Household income between $30,001 to$60,000
Greater Christchurch average 13%
Community in Mind was developed in 2014 to help people and communities in greater Christchurch rebuild their health and wellbeing following the earthquakes. The Community in Mind Strategy provides the context, shared vision and principles for psychosocial recovery in greater Christchurch, and the Shared Programme of Action outlines activities various agencies are delivering, or will deliver, to help achieve psychosocial recovery. Together they guide agencies, organisations and community groups to develop, target and coordinate their activities.
As a practical tool for the local Psychosocial Committee, the Shared Programme of Action was revised in December 2016 to ensure that the right tools are available to meet the psychosocial needs of residents.
Case Study 5-2: Community in Mind
Source: Canterbury Wellbeing Survey September 2016, Canterbury District Health Board
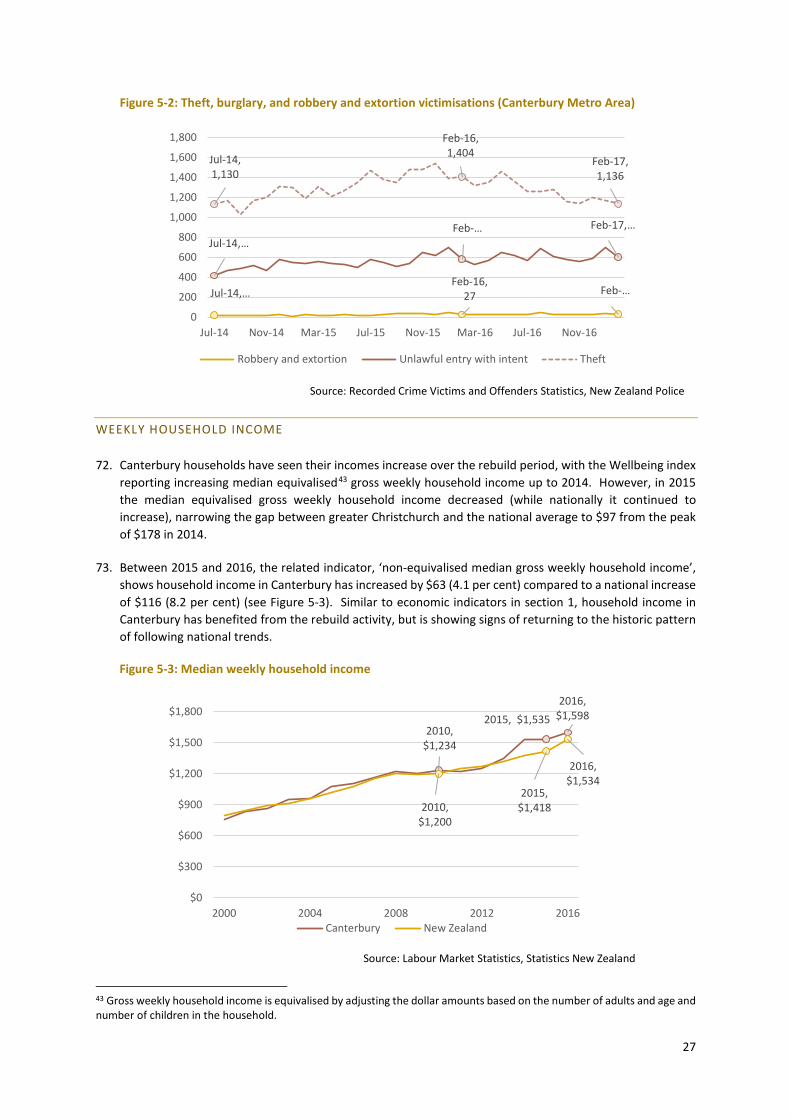
27
Figure 5-2: Theft, burglary, and robbery and extortion victimisations (Canterbury Metro Area)
WEEKLY HOUSEHOLD INCOME
72. Canterbury households have seen their incomes increase over the rebuild period, with the Wellbeing index reporting increasing median equivalised43 gross weekly household income up to 2014. However, in 2015 the median equivalised gross weekly household income decreased (while nationally it continued to increase), narrowing the gap between greater Christchurch and the national average to $97 from the peak of $178 in 2014.
73. Between 2015 and 2016, the related indicator, ‘non-equivalised median gross weekly household income’, shows household income in Canterbury has increased by $63 (4.1 per cent) compared to a national increase of $116 (8.2 per cent) (see Figure 5-3). Similar to economic indicators in section 1, household income in Canterbury has benefited from the rebuild activity, but is showing signs of returning to the historic pattern of following national trends.
Figure 5-3: Median weekly household income
43 Gross weekly household income is equivalised by adjusting the dollar amounts based on the number of adults and age and number of children in the household.
Jul-14, …Feb-16,
27 Feb-…
Jul-14, …Feb-… Feb-17, …
Jul-14, 1,130
Feb-16, 1,404
Feb-17, 1,136
0
200
400
600
800
1,000
1,200
1,400
1,600
1,800
Jul-14 Nov-14 Mar-15 Jul-15 Nov-15 Mar-16 Jul-16 Nov-16
Robbery and extortion Unlawful entry with intent Theft
Source: Recorded Crime Victims and Offenders Statistics, New Zealand Police
2010, $1,234
2015, $1,535 2016,
$1,598
2010, $1,200
2015, $1,418
2016, $1,534
$0
$300
$600
$900
$1,200
$1,500
$1,800
2000 2004 2008 2012 2016Canterbury New Zealand
Source: Labour Market Statistics, Statistics New Zealand

28
5.2. CANTERBURY WELLBEING SURVEY SEPTEMBER 2016
74. The results of the September 2016 Canterbury Wellbeing Survey show that the wellbeing of greater Christchurch residents is largely unchanged from April 2016. Just over eight in ten (82 per cent) greater Christchurch residents rate their quality of life positively (while five per cent rate it negatively). This is the same response as in April 2016 and is up from 77 per cent in September 2015. These results are supported by the Quality of Life Survey (2016) which reports that 78 per cent of Christchurch city residents rate their overall quality of life positively, while four per cent have a negative rating (the corresponding seven city44 averages are 81 per cent positive and four per cent negative).
75. In addition to the quality of life measure, the index also reports the following from the survey:
• WHO-5 Wellbeing Index – like quality of life, the September 2016 result is unchanged from April 2016, with an average score of 14.4. Over time there has been small but significant improvement in this measure.
• Sense of community – this positive outcome from the Canterbury earthquake sequence continues to decrease over time. A heightened sense of community as a result of the earthquakes continues to have a moderate or major positive impact on the everyday lives of 14 per cent of residents. This is down from 16 per cent in April 2016 and 34 per cent in September 2012.
• Stress – the proportion of residents who experienced stress at least sometimes in the past 12 months that has had a negative effect on them remains stable at around 72 per cent, having first reached this level in September 2014. In September 2012, when the survey was first conducted, the response was 80 per cent.
5.3. LOOKING AHEAD
76. The overall wellbeing of greater Christchurch residents is expected to continue to improve as the remaining physical environment, facilities, and regeneration plans progress. However, investigating results for specific vulnerable population groups is important, as they will often need ongoing support. These groups include owner-occupiers who still have outstanding insurance claims, those with a health condition or disability, living in temporary housing, or with household incomes less than $30,000. There is a particular focus on monitoring these groups.
77. The results of the September 2016 Canterbury Wellbeing Survey will provide further information on how residents are progressing and where additional assistance may is required.
44 Auckland, Hamilton, Hutt, Porirua, Wellington, Christchurch and Dunedin.

Public sector/horizontal infrastructure rebuild
As at 31 December 2016, 10 public sector rebuild projects have completed construction and 27 are underway. Of the total planned expenditure, 41% has been spent.
As at 30 April 2017, 99% of the SCIRT rebuild programme had been completed. In the same period, 87.0% of all SCIRT projects (valued at $1,241m) have been completed and handed over to the Christchurch City Council.
As a result of the Canterbury earthquake sequence, roads were badly damaged and public transport was severely disrupted. While in 2015 the number of individual bus trips grew to 82.2% of pre‐quake level (2010), there has been a slight decrease in the past two years, to 78.3% of pre‐quake level.
Residents’ satisfaction with the condition of Christchurch roads has improved between the 2014/2015 financial year and 2015/2016, however the majority of residents remain dissatisfied.
Construction Activity
The total construction cost for the rebuild of Christchurch is currently estimated at around $31.5b (in 2012 prices), with 65% of total expenditure spent at the end of 2016. Heavy commercial construction started later than other sectors, but commercial quarterly expenditure may soon supersede residential.
The consenting patterns within greater Christchurch reflect the higher proportion of commercial buildings in the central city. The proportion of residential consents issued is likely to increase as residential development in the central city gains momentum.
Between October 2010 and December 2016, $19.7b of construction work has been carried out in Canterbury, of which 57.6% was for residential buildings.
Infrastructure and transportation in greater Christchurch.
Transport
Canterbury Public Sector Rebuild progress (as at 31 Dec 2016)
Annual bus passenger numbers (Thousands individual trips, year end April)
Annualchange ‐3.0%‐17.0% ‐25.1% +23.3% +5.7% +1.4% ‐1.8%
17,166 14,253
10,679 13,168 13,913 14,110 13,686 13,434
2010 2011 2012 2013 2014 2015 2016 2017
In planning13 Projects
In construction27 Projects
Completed10 Projects
$2,545 miliion spent41% of total budget
59%remaining
No. of ProjectsValue of Projects($)
Completed(% of total)
Completed projects handed over to CCCConstruction complete
643 $1,065m
74.7%
735 $1,412m
99.0%
SCIRT Progress by construction expenditure
Source: Ministry of Business, Innovation and Employment and SCIRT
Source: Environment Canterbury
Apr 2017
698 $1,251m
87.8%
Dec 2016 Apr 2017Dec 2016
696 $1,241m
87.0%
Satisfaction with condition of Christchurch roads(Excluding the residential red zone)
Source: Christchurch City Council, General Service Satisfaction Survey
Total cost of rebuild (construction activity only) (2012 price, end of 31 Dec 2016)
Heavy Commercial
Light Commercial Civil
Residential
$billion
7.5
5.0
6.2
12.8
Completed Remaining
Total 31.565%
77.5%
69.9%
63.1%
41.6%
22.5%
30.1%
36.9%
58.4%
65.2% 34.8%
Source: Ministry of Business, Innovation and Employment and SCIRT
0
200
400
600
800
1,000
1,200
Dec‐10
Jun‐11
Dec‐11
Jun‐12
Dec‐12
Jun‐13
Dec‐13
Jun‐14
Dec‐14
Jun‐15
Dec‐15
Jun‐16
Dec‐16
Millions Residential buildings
Non‐residential buildings
Total value of $19.7b
Quarterly value of building work put in place – Canterbury
(Oct 2010 – Dec 2016)
42.4%
57.6%
Source: Building Activity Survey, Statistics New Zealand
Central City
Christchurch
Greater Christchurch
Canterbury
Building consents (Oct 2010 – Apr 2017)
Value of consents
% Residential
% Non‐residential
$2.5b
$12.9b
$18.1b
$20.5b
11.8%
52.7%
59.9%
60.4%
88.2%
47.3%
40.1%
39.6%
Source: Building Consents, Statistics New Zealand
30%
18%
52%
37%
13%
50%
Satisfied Neither satisfied,nor dissatisfied
Dissatisfied
2015 2016
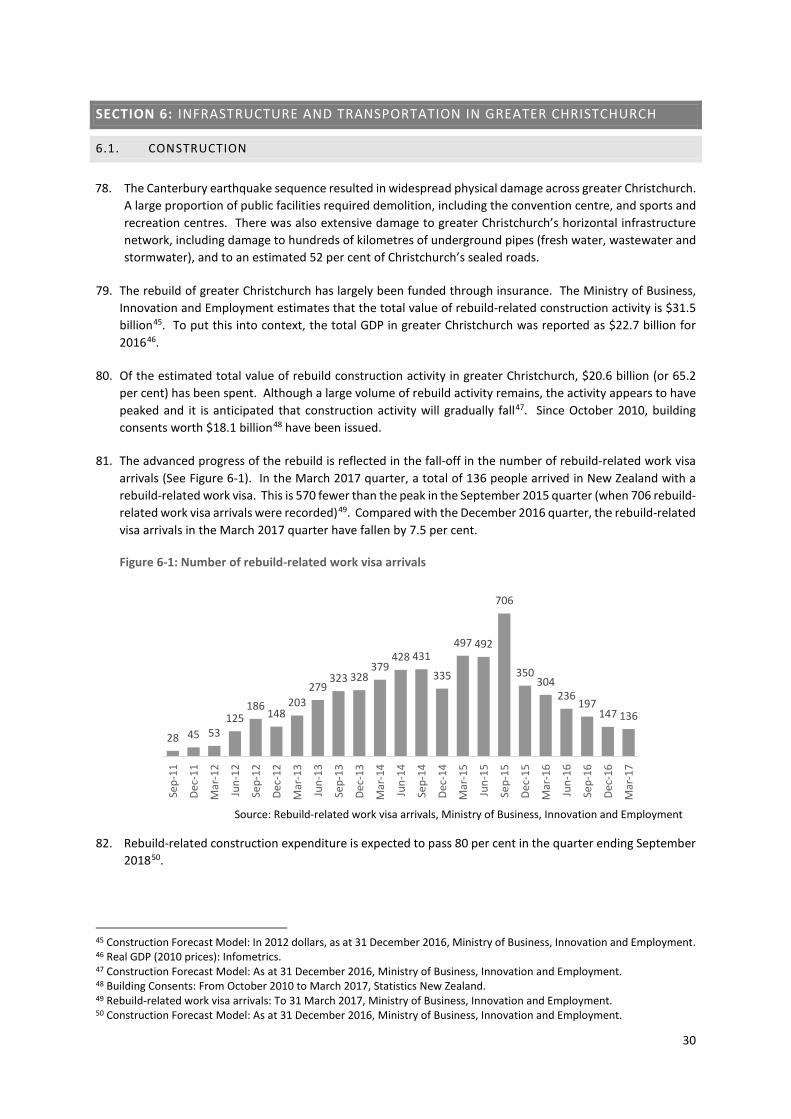
30
SECTION 6: INFRASTRUCTURE AND TRANSPORTATION IN GREATER CHRISTCHURCH
6.1. CONSTRUCTION
78. The Canterbury earthquake sequence resulted in widespread physical damage across greater Christchurch. A large proportion of public facilities required demolition, including the convention centre, and sports and recreation centres. There was also extensive damage to greater Christchurch’s horizontal infrastructure network, including damage to hundreds of kilometres of underground pipes (fresh water, wastewater and stormwater), and to an estimated 52 per cent of Christchurch’s sealed roads.
79. The rebuild of greater Christchurch has largely been funded through insurance. The Ministry of Business, Innovation and Employment estimates that the total value of rebuild-related construction activity is $31.5 billion45. To put this into context, the total GDP in greater Christchurch was reported as $22.7 billion for 201646.
80. Of the estimated total value of rebuild construction activity in greater Christchurch, $20.6 billion (or 65.2 per cent) has been spent. Although a large volume of rebuild activity remains, the activity appears to have peaked and it is anticipated that construction activity will gradually fall47. Since October 2010, building consents worth $18.1 billion48 have been issued.
81. The advanced progress of the rebuild is reflected in the fall-off in the number of rebuild-related work visa arrivals (See Figure 6-1). In the March 2017 quarter, a total of 136 people arrived in New Zealand with a rebuild-related work visa. This is 570 fewer than the peak in the September 2015 quarter (when 706 rebuild-related work visa arrivals were recorded)49. Compared with the December 2016 quarter, the rebuild-related visa arrivals in the March 2017 quarter have fallen by 7.5 per cent.
Figure 6-1: Number of rebuild-related work visa arrivals
82. Rebuild-related construction expenditure is expected to pass 80 per cent in the quarter ending September 201850.
45 Construction Forecast Model: In 2012 dollars, as at 31 December 2016, Ministry of Business, Innovation and Employment. 46 Real GDP (2010 prices): Infometrics. 47 Construction Forecast Model: As at 31 December 2016, Ministry of Business, Innovation and Employment. 48 Building Consents: From October 2010 to March 2017, Statistics New Zealand. 49 Rebuild-related work visa arrivals: To 31 March 2017, Ministry of Business, Innovation and Employment. 50 Construction Forecast Model: As at 31 December 2016, Ministry of Business, Innovation and Employment.
28 45 53125
186148
203279
323 328379
428 431
335
497 492
706
350304
236197
147 136
Sep-
11
Dec-
11
Mar
-12
Jun-
12
Sep-
12
Dec-
12
Mar
-13
Jun-
13
Sep-
13
Dec-
13
Mar
-14
Jun-
14
Sep-
14
Dec-
14
Mar
-15
Jun-
15
Sep-
15
Dec-
15
Mar
-16
Jun-
16
Sep-
16
Dec-
16
Mar
-17
Source: Rebuild-related work visa arrivals, Ministry of Business, Innovation and Employment
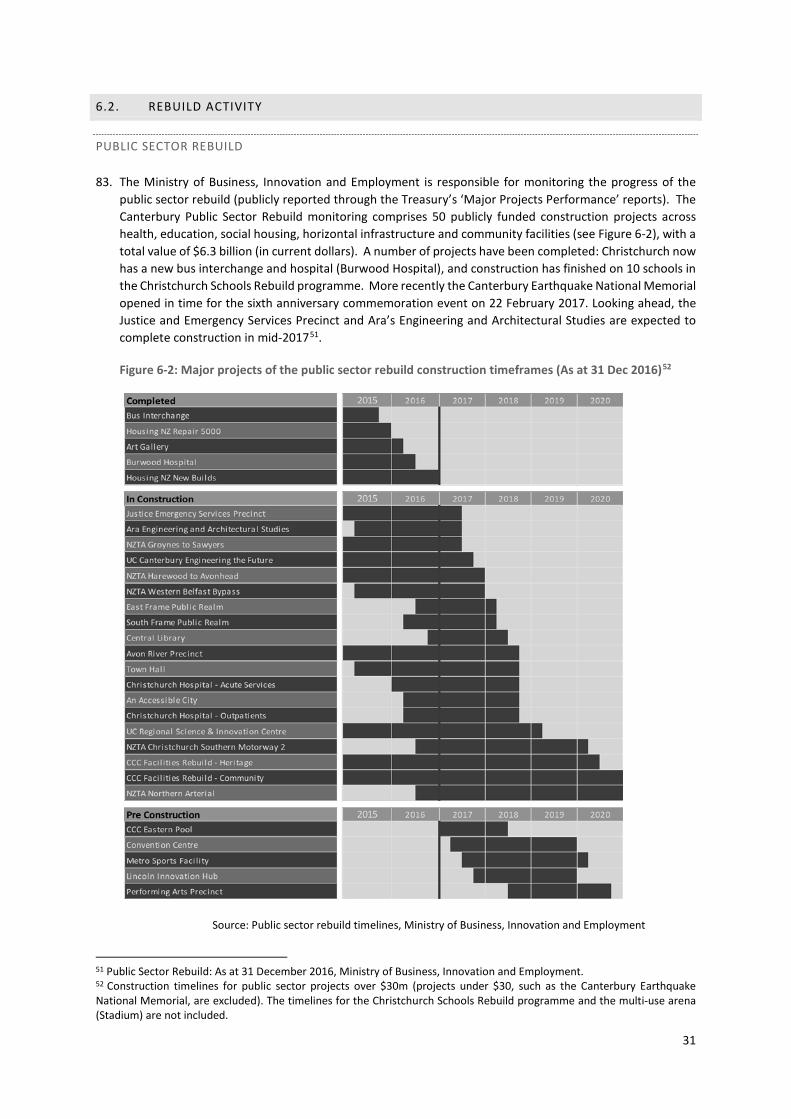
31
6.2. REBUILD ACTIVITY
PUBLIC SECTOR REBUILD
83. The Ministry of Business, Innovation and Employment is responsible for monitoring the progress of the public sector rebuild (publicly reported through the Treasury’s ‘Major Projects Performance’ reports). The Canterbury Public Sector Rebuild monitoring comprises 50 publicly funded construction projects across health, education, social housing, horizontal infrastructure and community facilities (see Figure 6-2), with a total value of $6.3 billion (in current dollars). A number of projects have been completed: Christchurch now has a new bus interchange and hospital (Burwood Hospital), and construction has finished on 10 schools in the Christchurch Schools Rebuild programme. More recently the Canterbury Earthquake National Memorial opened in time for the sixth anniversary commemoration event on 22 February 2017. Looking ahead, the Justice and Emergency Services Precinct and Ara’s Engineering and Architectural Studies are expected to complete construction in mid-201751.
Figure 6-2: Major projects of the public sector rebuild construction timeframes (As at 31 Dec 2016)52
51 Public Sector Rebuild: As at 31 December 2016, Ministry of Business, Innovation and Employment. 52 Construction timelines for public sector projects over $30m (projects under $30, such as the Canterbury Earthquake National Memorial, are excluded). The timelines for the Christchurch Schools Rebuild programme and the multi-use arena (Stadium) are not included.
Source: Public sector rebuild timelines, Ministry of Business, Innovation and Employment

32
84. The public sector rebuild has taken longer than originally anticipated (for example, compared to the pre-business case timeframe estimates published in the Christchurch Central Recovery Plan). This was driven by a number of factors, including construction market capacity constraints and the timeframe required for demolition, planning, financing and construction. However the delay has delivered benefits for some of the public sector rebuild projects. The recent easing in residential and light commercial construction appears to have freed up market capacity for the public-sector projects, resulting in stronger competition and attractive pricing for those projects that rely on smaller construction companies53.
85. As at 31 December 2016, $2.5 billion has been spent on the public sector rebuild (or approximately 40.5 per cent of the $6.3 billion
total value)54. The remaining public sector rebuild activity is expected to cushion the decline in construction activity.
HORIZONTAL INFRASTRUCTURE
86. In September 2011, an unincorporated joint venture was formed (called the ‘Stronger Christchurch Infrastructure Rebuild Team’) to undertake the repair and rebuild of earthquake damaged horizontal infrastructure. The programme is nearing its completion and 696 completed projects, with a total construction value of $1.2 billion (approximately 87.0 per cent of total planned expenditure), have been handed over to the Christchurch City Council (the asset owner), as at 30 April 201755. It is expected that the remaining projects will be handed over by the end of June 201756.
87. The advanced progress of the programme may have contributed to the positive movements reported in the September 2016 Canterbury Wellbeing Survey (see Table 6-1). In September 2012, 30 per cent of respondents indicated that “being in a damaged environment and/or surrounded by construction work” was having a moderate or major negative impact on their everyday lives. This has fallen to 10 per cent in September 2016. Those reporting “transport related pressures” as having a negative impact has also fallen from 20 per cent to 10 per cent over the same periods57.
53 Public Sector Rebuild: As at 31 December 2016, Ministry of Business, Innovation and Employment. 54 Public Sector Rebuild: As at 31 December 2016, Ministry of Business, Innovation and Employment. 55 Horizontal Infrastructure Progress: As at 30 April 2017, Stronger Christchurch Infrastructure Rebuild Team. 56 Following the handover of each project, there is a 12 month defects liability period and during this time the construction contractor has a contractual obligation to remedy any defects in the construction work it has performed. 57 September 2016 Canterbury Wellbeing Survey: Canterbury District Health Board.
Case Study 6-1: Canterbury Earthquake National Memorial
The Canterbury Earthquake National Memorial is built on the banks of the Ōtākaro/Avon River and was officially dedicated in a ceremony held on 22 February 2017, the sixth anniversary of the February 2011 earthquake. It provides a place of local, national and international significance, paying respect to the 185 people who lost their lives, and those who were seriously injured on 22 February 2011. It also acknowledges the shared trauma and experience of the 2010 and 2011 Canterbury earthquake sequence. The park space on the north side of the river is an area where people can reflect and view the memorial wall area on the opposite bank. The 111 metre long wall on the south side of the river is a place of remembrance, inscribed with the names of those who lost their lives.
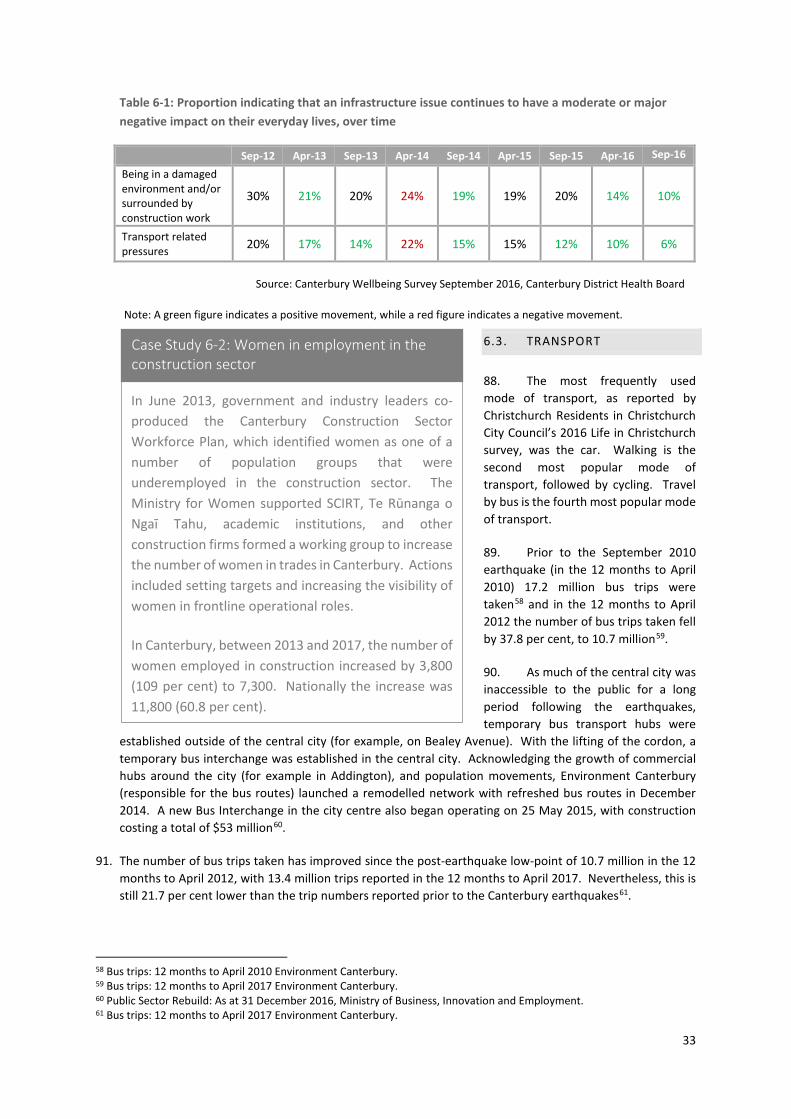
33
Table 6-1: Proportion indicating that an infrastructure issue continues to have a moderate or major negative impact on their everyday lives, over time
Sep-12 Apr-13 Sep-13 Apr-14 Sep-14 Apr-15 Sep-15 Apr-16 Sep-16
Being in a damaged environment and/or surrounded by construction work
30% 21% 20% 24% 19% 19% 20% 14% 10%
Transport related pressures 20% 17% 14% 22% 15% 15% 12% 10% 6%
Note: A green figure indicates a positive movement, while a red figure indicates a negative movement.
6.3. TRANSPORT
88. The most frequently used mode of transport, as reported by Christchurch Residents in Christchurch City Council’s 2016 Life in Christchurch survey, was the car. Walking is the second most popular mode of transport, followed by cycling. Travel by bus is the fourth most popular mode of transport.
89. Prior to the September 2010 earthquake (in the 12 months to April 2010) 17.2 million bus trips were taken58 and in the 12 months to April 2012 the number of bus trips taken fell by 37.8 per cent, to 10.7 million59.
90. As much of the central city was inaccessible to the public for a long period following the earthquakes, temporary bus transport hubs were
established outside of the central city (for example, on Bealey Avenue). With the lifting of the cordon, a temporary bus interchange was established in the central city. Acknowledging the growth of commercial hubs around the city (for example in Addington), and population movements, Environment Canterbury (responsible for the bus routes) launched a remodelled network with refreshed bus routes in December 2014. A new Bus Interchange in the city centre also began operating on 25 May 2015, with construction costing a total of $53 million60.
91. The number of bus trips taken has improved since the post-earthquake low-point of 10.7 million in the 12 months to April 2012, with 13.4 million trips reported in the 12 months to April 2017. Nevertheless, this is still 21.7 per cent lower than the trip numbers reported prior to the Canterbury earthquakes61.
58 Bus trips: 12 months to April 2010 Environment Canterbury. 59 Bus trips: 12 months to April 2017 Environment Canterbury. 60 Public Sector Rebuild: As at 31 December 2016, Ministry of Business, Innovation and Employment. 61 Bus trips: 12 months to April 2017 Environment Canterbury.
Case Study 6-2: Women in employment in the construction sector
In June 2013, government and industry leaders co-produced the Canterbury Construction Sector Workforce Plan, which identified women as one of a number of population groups that were underemployed in the construction sector. The Ministry for Women supported SCIRT, Te Rūnanga o Ngaī Tahu, academic institutions, and other construction firms formed a working group to increase the number of women in trades in Canterbury. Actions included setting targets and increasing the visibility of women in frontline operational roles.
In Canterbury, between 2013 and 2017, the number of women employed in construction increased by 3,800 (109 per cent) to 7,300. Nationally the increase was 11,800 (60.8 per cent).
Source: Canterbury Wellbeing Survey September 2016, Canterbury District Health Board

34
Figure 6-3: Frequency of use of public transport (2016)
‘Over the past 12 months, how often did you use public transport? If your usage changes on a weekly basis, please provide an average’- Quality of Life survey 2016 * Auckland, Hamilton, Hutt, Porirua, Wellington, Christchurch, Dunedin
92. In 2010, the Quality of Life survey reported that 20 per cent of respondents used public transport on average at least once a week in the previous 12 months 62, compared with 11 per cent reported in the 2016 survey (see Figure 6-3). In comparison, the aggregated total of the seven councils included in the 2016 survey reported 25 per cent of respondents using public transport on average at least once a week.
93. The majority of those surveyed responded that they agree or strongly agree that public transport in Christchurch is easy to get to (73 per cent) and is safe (67 per cent)63.
6.4. LOOKING AHEAD
94. The public sector rebuild has taken longer than initially anticipated and this has proved advantageous in some respects. For example, the reduced overall rebuild activity is resulting in some projects receiving competitive pricing, and the large projects yet to start construction may provide the market with a softer landing. We expect that the public sector rebuild will continue to gain momentum, with major projects such as the convention centre soon starting construction.
95. While the road network performance has greatly improved through the horizontal infrastructure programme, public transport has yet to fully recover to pre-earthquake trip numbers. We expect to see public transport usage increase, as the central city regeneration continues and more businesses move in.
62 Quality of Life Survey: 2010. 63 Quality of Life Survey: 2016.
25
11
35
32
37
56
3
1
0 20 40 60 80 100
7 City Total*
Christchurch
Once a week or more Less than once a week Not at all Not Applicable
Case Study 6-3: An Accessible City
An Accessible City is a programme of improvements to the travel network in the central city. The programme includes new designs of the streets, providing a travel network that will meet the current and future needs of all inner city travellers. Streets are being prioritised for different forms of transport, providing safer and more efficient access for all. This includes slower speed zones in some parts of the city, and better public spaces. The Crown company Ōtākaro Limited and the Christchurch City Council are currently working together to refine the Accessible City Plan.
Source: Quality of Life Survey