monitoring and identification of nsw critical habitat ... · monitoring and identification of nsw...
TRANSCRIPT
Monitoring and identification of NSW Critical Habitat Sitesfor conservation of Grey Nurse Sharks
N.M. Otway, A.L. Burke, N.S. Morrison, and P.C. Parker
NSW Fisheries Office of ConservationPort Stephens Fisheries Centre
Private Bag 1, Nelson Bay, NSW 2315Australia
EA Project No. 22499June 2003
NSW Fisheries Final Report SeriesNo. 47
ISSN 1440-3544
Research and the collation of information presented in this report was undertaken with fundingprovided by NSW Fisheries and Environment Australia. The project – Critical Habitat sites forProtection of Grey Nurse Sharks - was undertaken for the Marine Species Protection Program.
Copyright in this report is vested in NSW Fisheries.
The views and opinions expressed in this report are those of the authors and do not reflect those ofthe Commonwealth Government, the Minister for the Environment, or Environment Australia.
The report may be cited as ‘Monitoring and identification of NSW Critical Habitat sites forconservation of Grey Nurse Sharks’.
Copies of the report may be borrowed from the library:Environment AustraliaCANBERRA ACT 2601 AUSTRALIA
Contents i
EA Project No. 22499 Grey Nurse Sharks, Otway and Morrison
TABLE OF CONTENTS
TABLE OF CONTENTS ................................................................................................................................ I
LIST OF FIGURES...................................................................................................................................... III
LIST OF TABLES........................................................................................................................................ IV
ACKNOWLEDGMENTS ..............................................................................................................................V
EXECUTIVE SUMMARY .......................................................................................................................... VI1. INTRODUCTION AND PROJECT OBJECTIVES ........................................................................................... 1
1.1. Background.................................................................................................................................. 11.2. Project objectives......................................................................................................................... 1
2. THE BIOLOGY AND ECOLOGY OF GREY NURSE SHARKS ....................................................................... 32.1. Names........................................................................................................................................... 32.2. Systematics................................................................................................................................... 32.3. Description................................................................................................................................... 32.4. Distribution.................................................................................................................................. 42.5. Habitat ......................................................................................................................................... 42.6. Abundance ................................................................................................................................... 42.7. Diet............................................................................................................................................... 52.8. Population demography............................................................................................................... 5
2.8.1. Reproductive biology ..............................................................................................................................52.8.2. Age, growth and longevity ......................................................................................................................62.8.3. Rates of mortality ....................................................................................................................................7
2.9. Movements ................................................................................................................................... 72.10. Natural predators......................................................................................................................... 72.11. Conservation status...................................................................................................................... 8
2.11.1. Worldwide.............................................................................................................................................82.11.2. Australia ................................................................................................................................................8
3. GREY NURSE SHARK HABITAT MAPPING .............................................................................................. 93.1. Introduction ................................................................................................................................. 9
3.1.1. Batemans Shelf and Twofold Shelf Bioregions.......................................................................................93.1.1.1. Shellharbour.................................................................................................................................103.1.1.2. Jervis Bay.....................................................................................................................................103.1.1.3. Ulladulla ......................................................................................................................................103.1.1.4. Batemans Bay ..............................................................................................................................113.1.1.5. Narooma ......................................................................................................................................113.1.1.6. Eden.............................................................................................................................................11
4. THE DISTRIBUTION AND ABUNDANCE OF GREY NURSE SHARKS........................................................ 184.1. Introduction ............................................................................................................................... 184.2. Materials and methods............................................................................................................... 18
4.2.1. Sampling sites and protocol...................................................................................................................184.2.2. Statistical analyses.................................................................................................................................20
4.2.2.1. Spatial and temporal variation in abundance ...............................................................................204.2.2.2. Population size-structure and segregation by size and sex...........................................................204.2.2.3. Incidence of hooking ...................................................................................................................204.2.2.4. Identification of key sites (Critical Habitat).................................................................................21
4.3. Results ........................................................................................................................................ 214.3.1. Patterns of abundance............................................................................................................................214.3.2. Population size-structure .......................................................................................................................25
4.3.2.1. General observations....................................................................................................................254.3.2.2. Segregation by sex and size along the NSW and southern Queensland coasts ............................254.3.2.3. Along the entire NSW and southern Queensland coasts ..............................................................254.3.2.4. Comparisons between sections of the coast .................................................................................304.3.2.5. Comparisons within each coastal section.....................................................................................30
ii Contents
EA Project No. 22499 Grey Nurse Sharks, Otway and Morrison
4.3.3. Identification of key sites (Critical Habitat).......................................................................................... 344.3.4. Incidence of hooking ............................................................................................................................ 35
4.4. Discussion.................................................................................................................................. 374.4.1. Spatial and temporal variation in abundance ........................................................................................ 374.4.2. Population size-structure, reproduction and recruitment....................................................................... 384.4.3. Identification of key sites (Critical Habitat).......................................................................................... 414.4.4. Incidence of hooking ............................................................................................................................ 42
5. DEVELOPMENT OF A VOLUNTARY CODE OF CONDUCT FOR SCUBA DIVING WITH GREY NURSE SHARKS............................................................................................................................................................. 43
5.1. Introduction ............................................................................................................................... 435.2. Materials and methods .............................................................................................................. 435.3. Results........................................................................................................................................ 455.4. Discussion.................................................................................................................................. 47
6. SUMMARY AND CONCLUSIONS............................................................................................................ 497. REFERENCES ....................................................................................................................................... 50
Contents iii
EA Project No. 22499 Grey Nurse Sharks, Otway and Morrison
LIST OF FIGURES
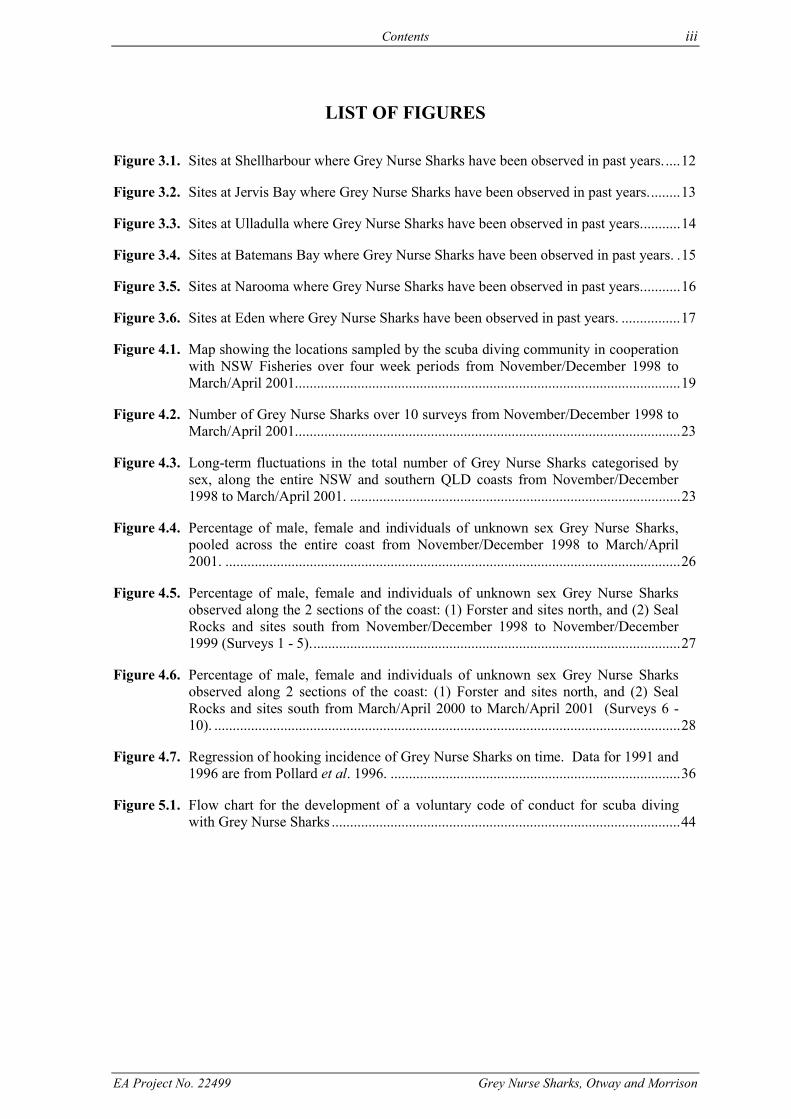
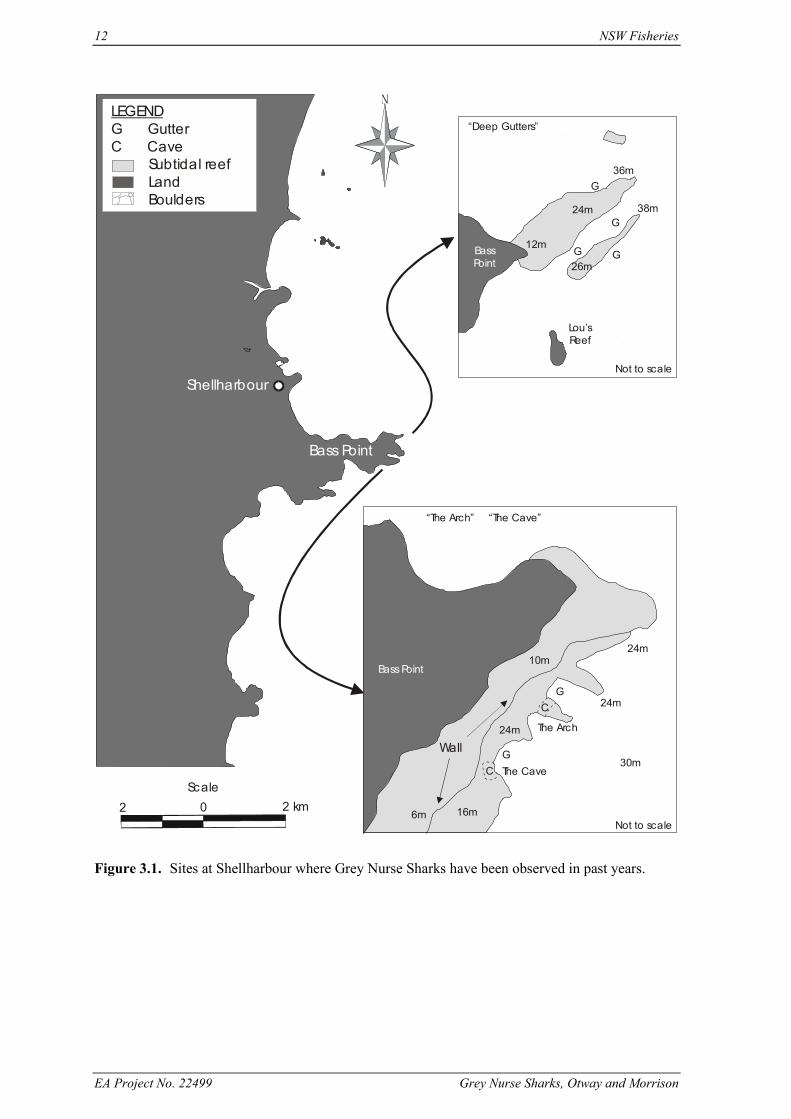
Figure 3.1. Sites at Shellharbour where Grey Nurse Sharks have been observed in past years. ....12
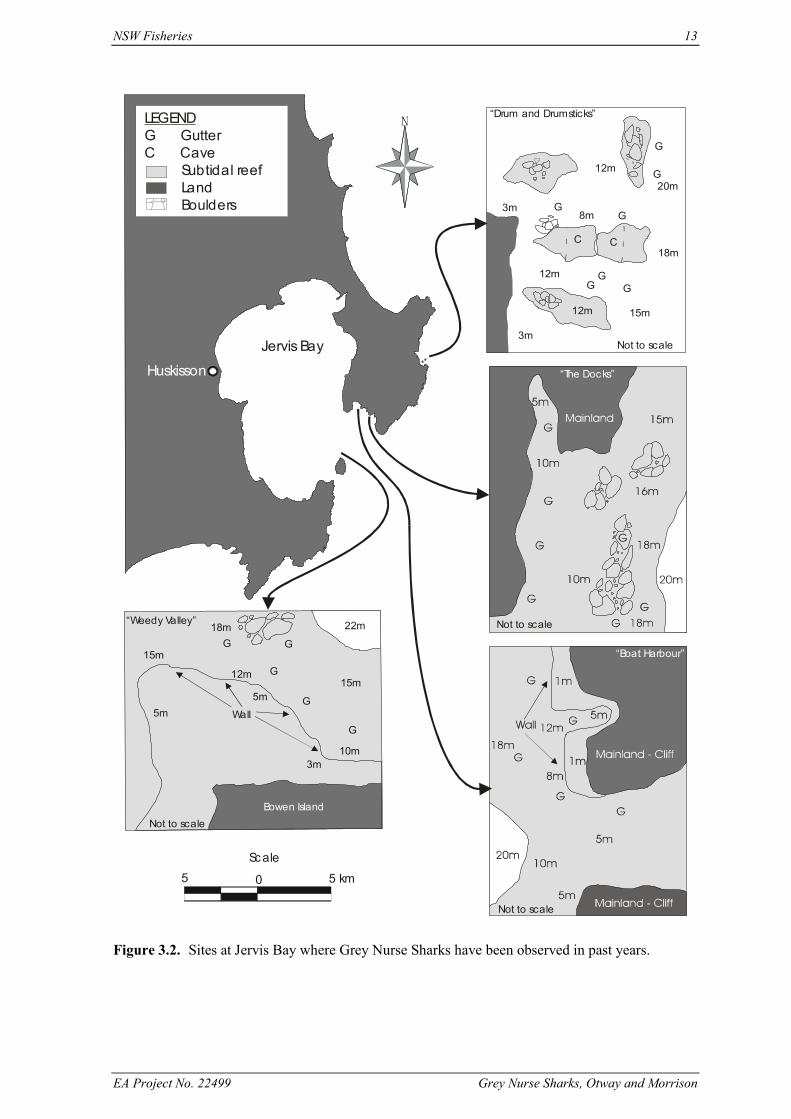
Figure 3.2. Sites at Jervis Bay where Grey Nurse Sharks have been observed in past years.........13
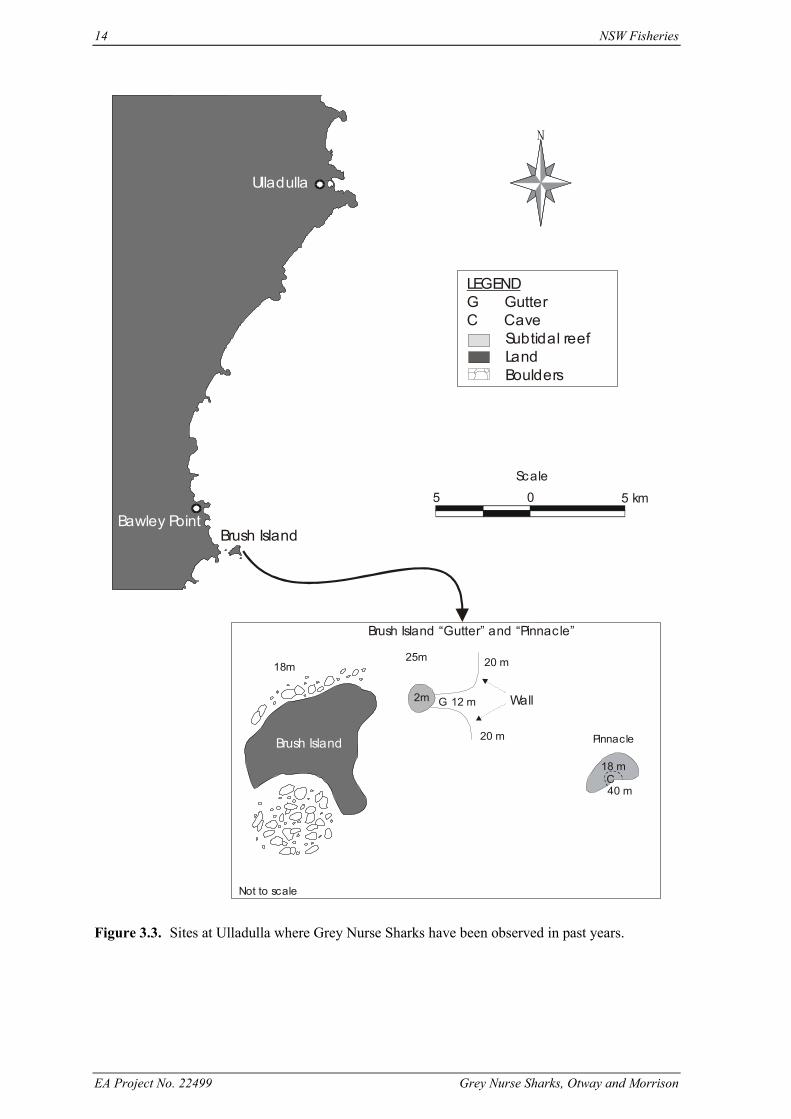
Figure 3.3. Sites at Ulladulla where Grey Nurse Sharks have been observed in past years...........14
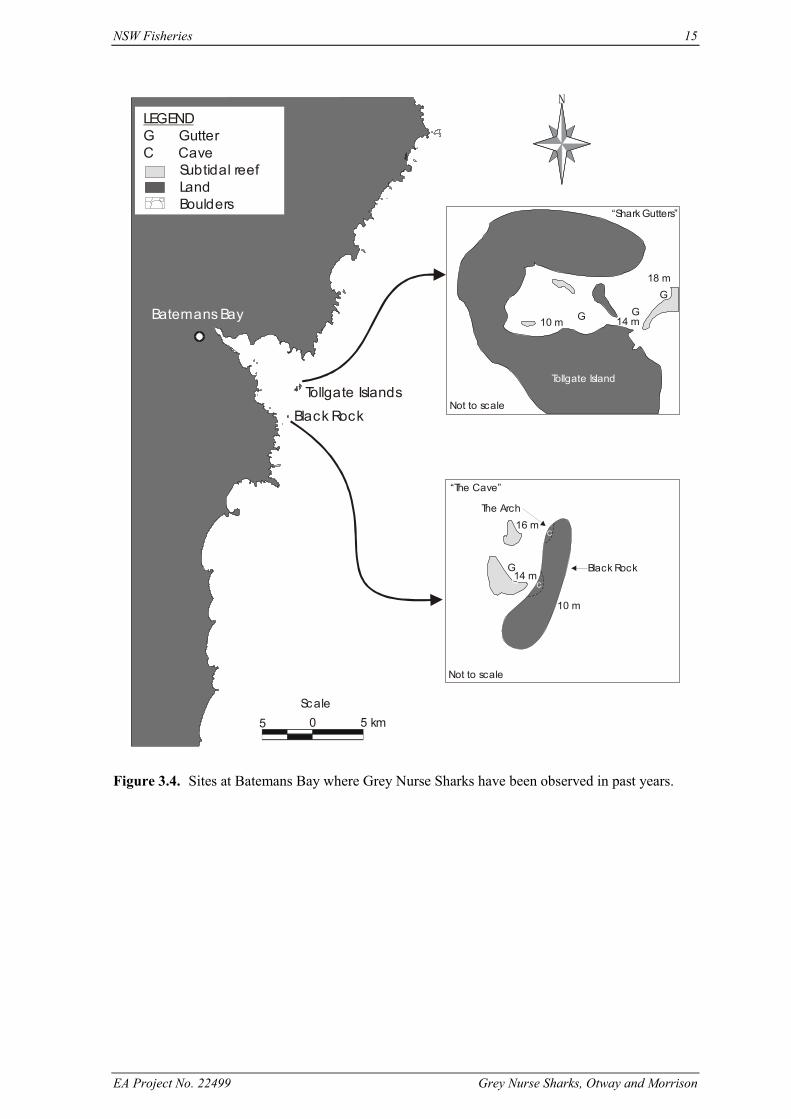
Figure 3.4. Sites at Batemans Bay where Grey Nurse Sharks have been observed in past years. .15
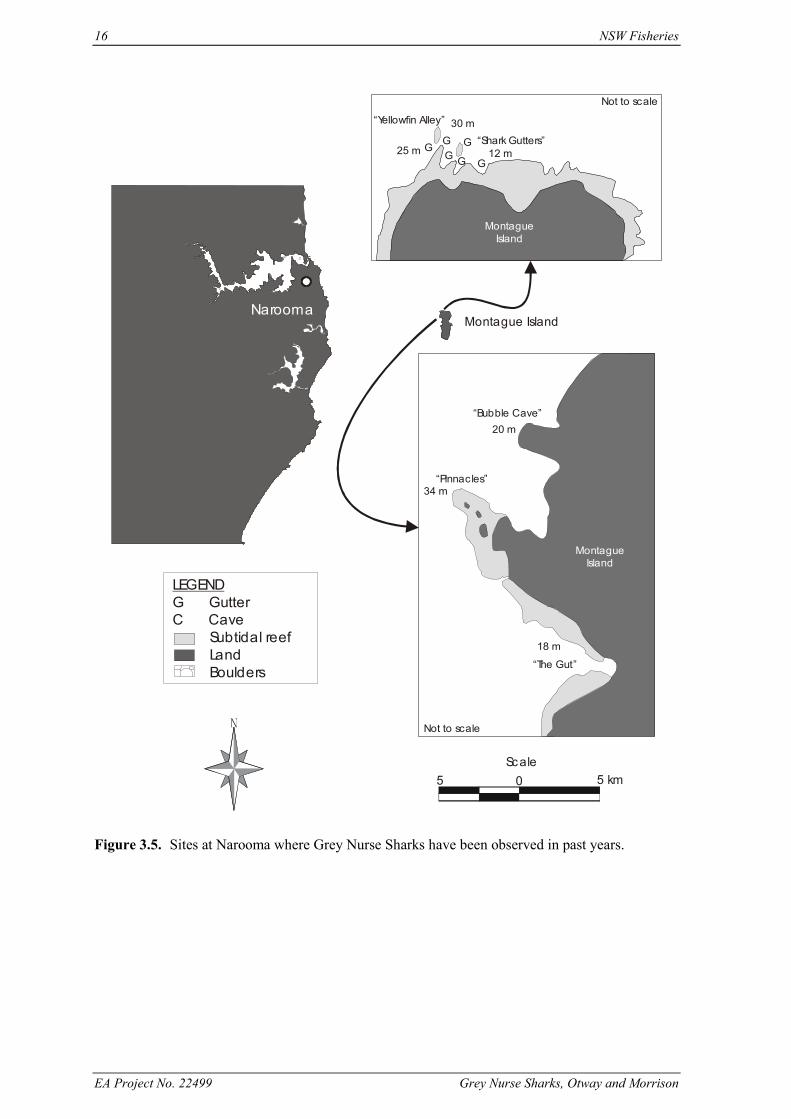
Figure 3.5. Sites at Narooma where Grey Nurse Sharks have been observed in past years...........16
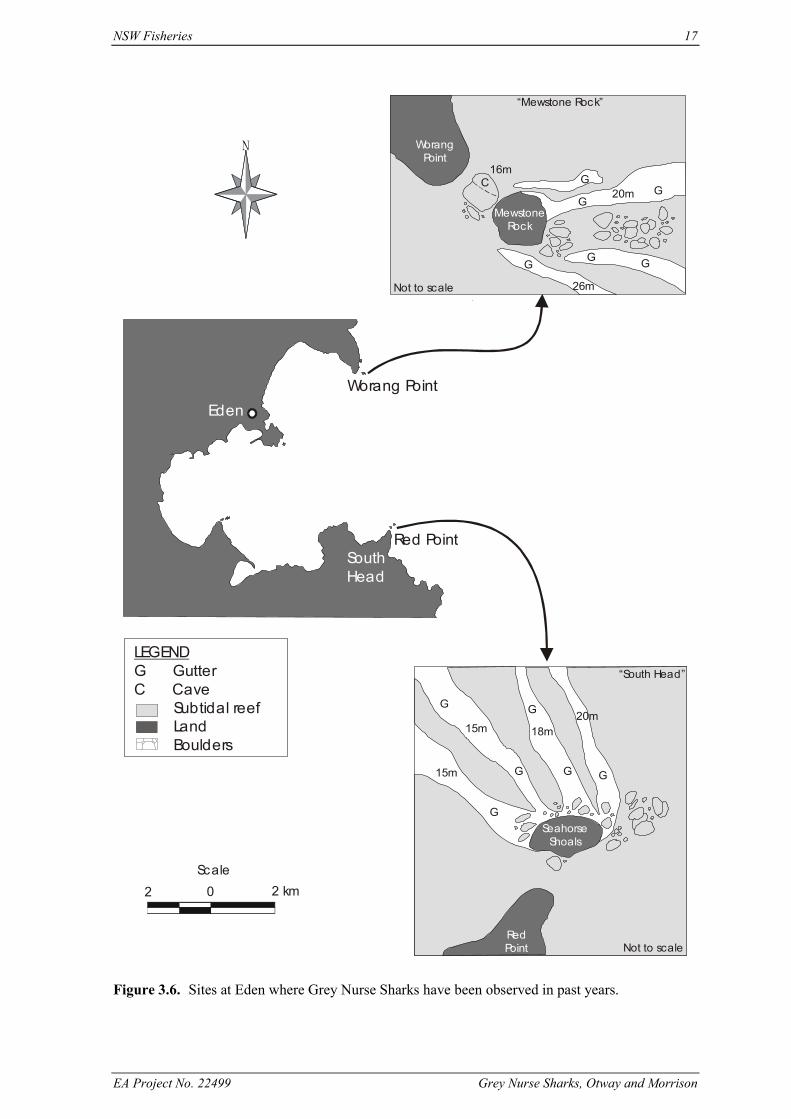
Figure 3.6. Sites at Eden where Grey Nurse Sharks have been observed in past years. ................17
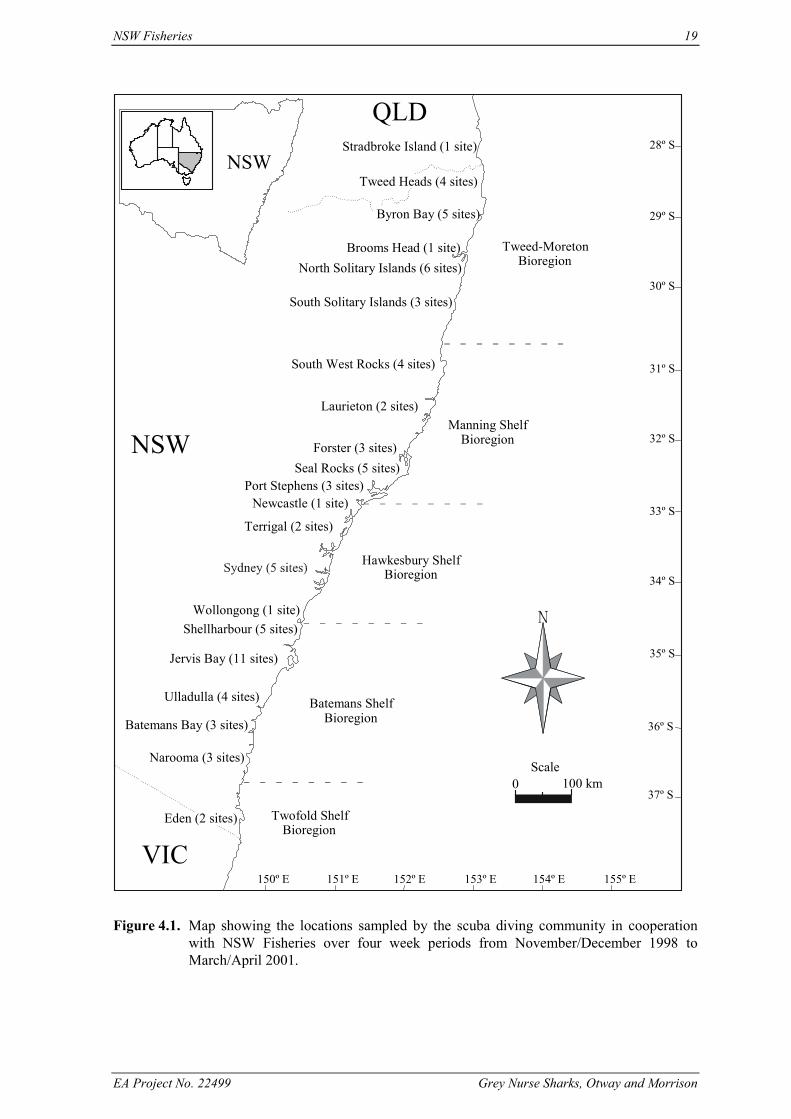
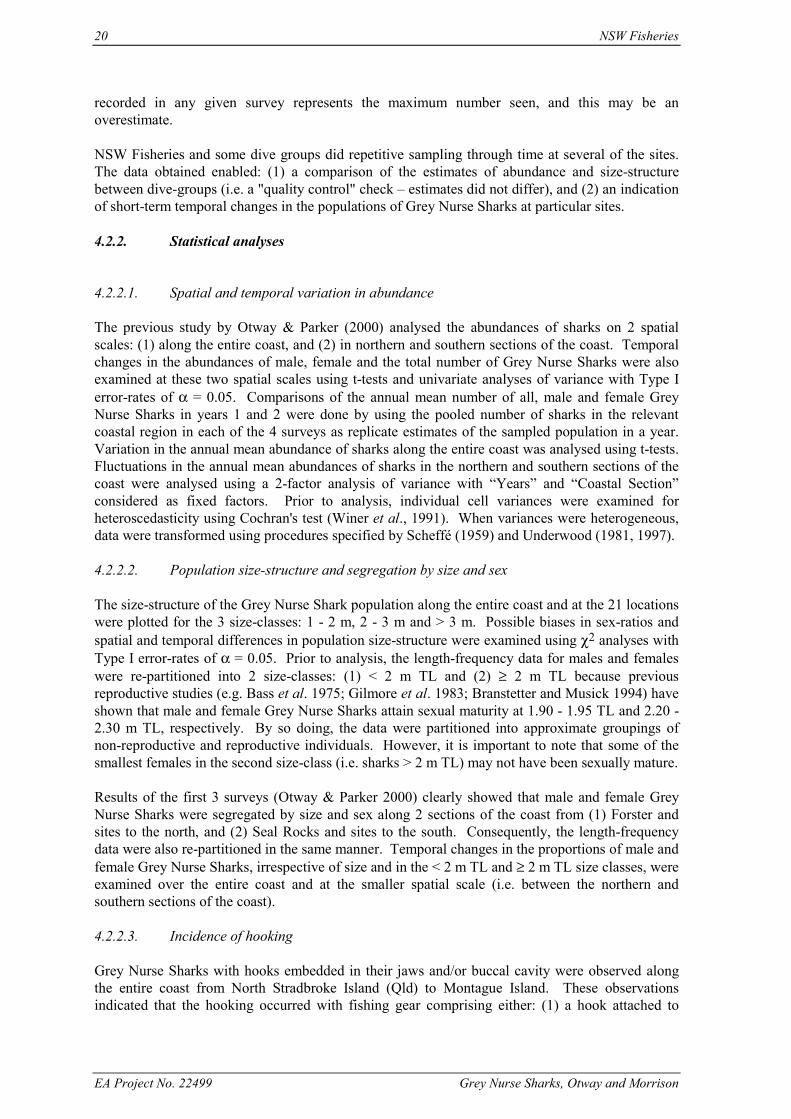
Figure 4.1. Map showing the locations sampled by the scuba diving community in cooperationwith NSW Fisheries over four week periods from November/December 1998 toMarch/April 2001.........................................................................................................19
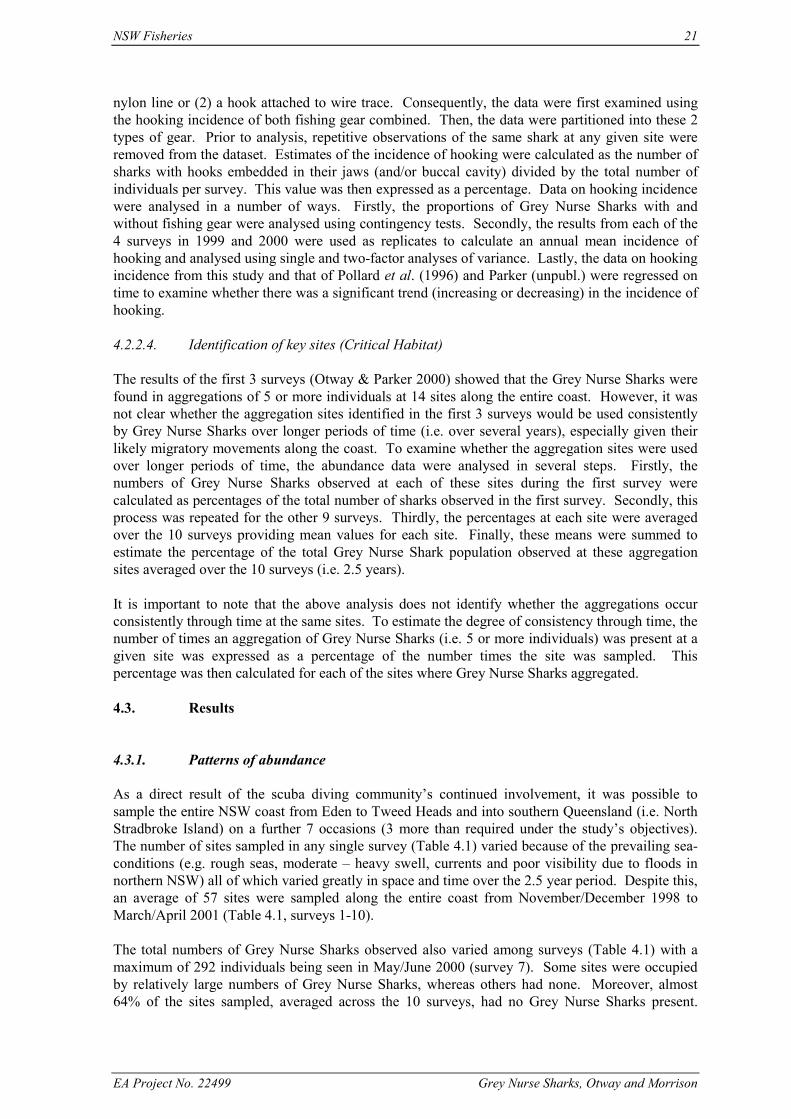
Figure 4.2. Number of Grey Nurse Sharks over 10 surveys from November/December 1998 toMarch/April 2001.........................................................................................................23
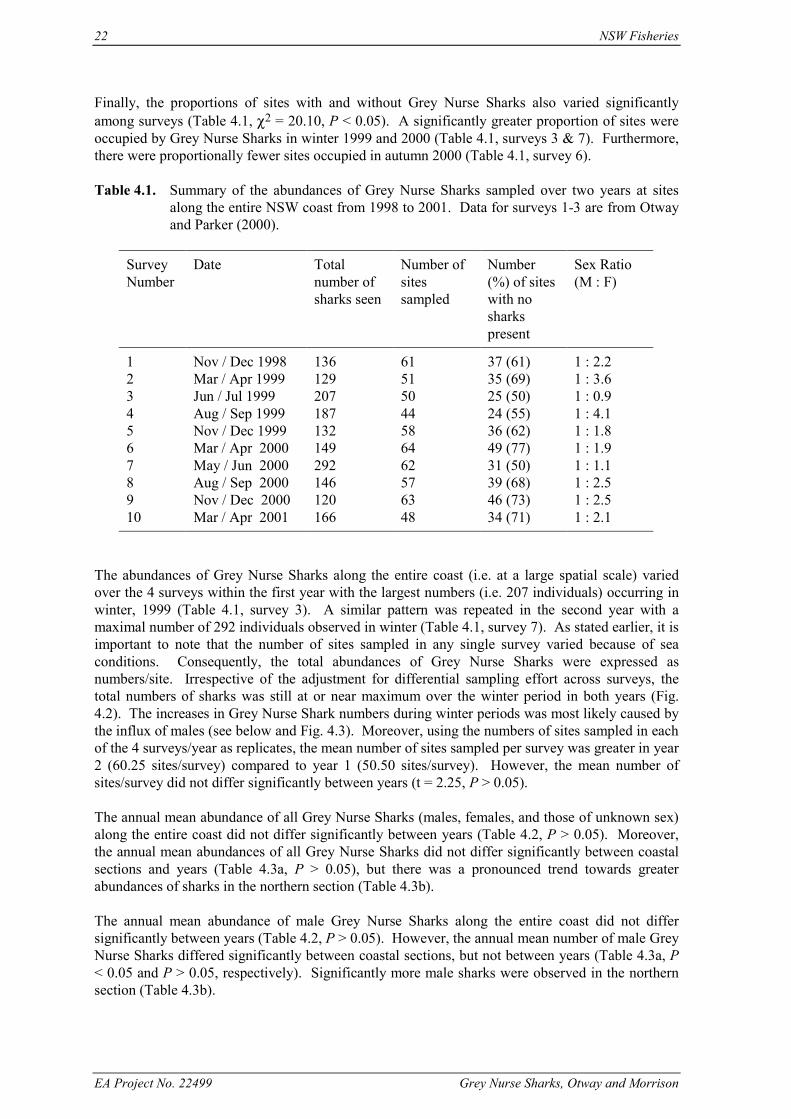
Figure 4.3. Long-term fluctuations in the total number of Grey Nurse Sharks categorised bysex, along the entire NSW and southern QLD coasts from November/December1998 to March/April 2001. ..........................................................................................23
Figure 4.4. Percentage of male, female and individuals of unknown sex Grey Nurse Sharks,pooled across the entire coast from November/December 1998 to March/April2001. ............................................................................................................................26
Figure 4.5. Percentage of male, female and individuals of unknown sex Grey Nurse Sharksobserved along the 2 sections of the coast: (1) Forster and sites north, and (2) SealRocks and sites south from November/December 1998 to November/December1999 (Surveys 1 - 5).....................................................................................................27
Figure 4.6. Percentage of male, female and individuals of unknown sex Grey Nurse Sharksobserved along 2 sections of the coast: (1) Forster and sites north, and (2) SealRocks and sites south from March/April 2000 to March/April 2001 (Surveys 6 -10). ...............................................................................................................................28
Figure 4.7. Regression of hooking incidence of Grey Nurse Sharks on time. Data for 1991 and1996 are from Pollard et al. 1996. ...............................................................................36
Figure 5.1. Flow chart for the development of a voluntary code of conduct for scuba divingwith Grey Nurse Sharks ...............................................................................................44
iv Contents
EA Project No. 22499 Grey Nurse Sharks, Otway and Morrison
LIST OF TABLES
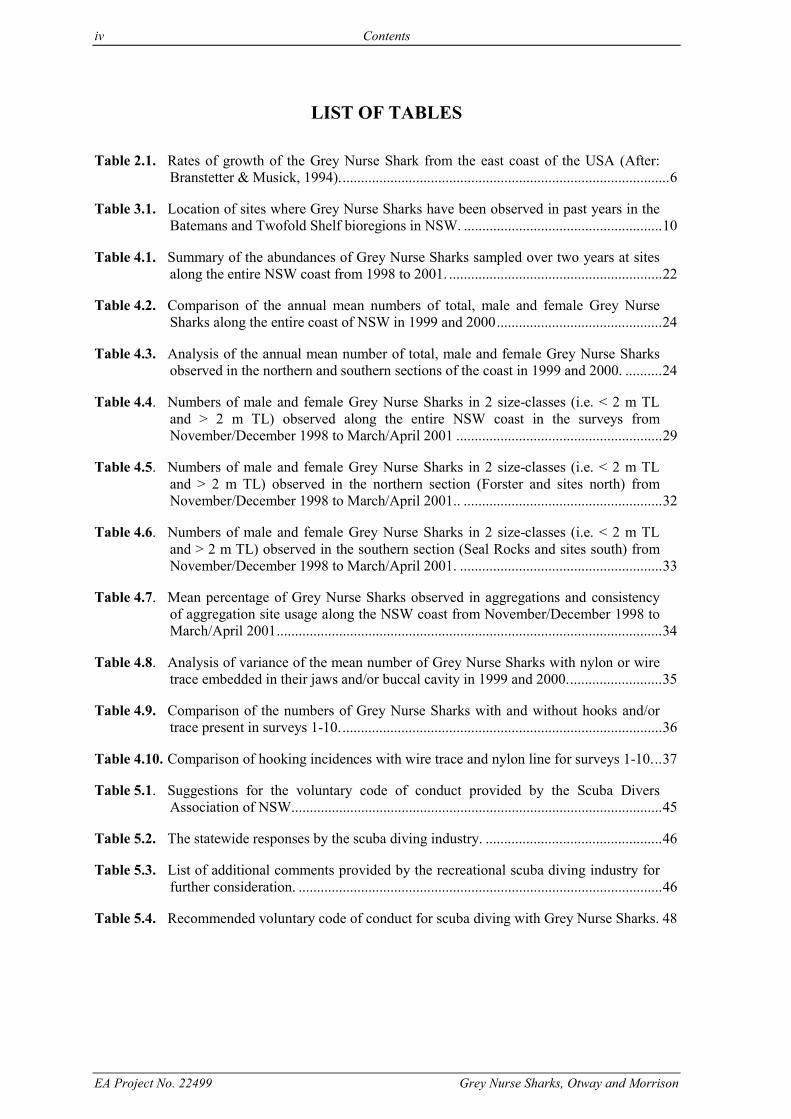
Table 2.1. Rates of growth of the Grey Nurse Shark from the east coast of the USA (After:Branstetter & Musick, 1994)..........................................................................................6
Table 3.1. Location of sites where Grey Nurse Sharks have been observed in past years in theBatemans and Twofold Shelf bioregions in NSW. ......................................................10
Table 4.1. Summary of the abundances of Grey Nurse Sharks sampled over two years at sitesalong the entire NSW coast from 1998 to 2001. ..........................................................22
Table 4.2. Comparison of the annual mean numbers of total, male and female Grey NurseSharks along the entire coast of NSW in 1999 and 2000.............................................24
Table 4.3. Analysis of the annual mean number of total, male and female Grey Nurse Sharksobserved in the northern and southern sections of the coast in 1999 and 2000. ..........24
Table 4.4. Numbers of male and female Grey Nurse Sharks in 2 size-classes (i.e. < 2 m TLand > 2 m TL) observed along the entire NSW coast in the surveys fromNovember/December 1998 to March/April 2001 ........................................................29
Table 4.5. Numbers of male and female Grey Nurse Sharks in 2 size-classes (i.e. < 2 m TLand > 2 m TL) observed in the northern section (Forster and sites north) fromNovember/December 1998 to March/April 2001.. ......................................................32
Table 4.6. Numbers of male and female Grey Nurse Sharks in 2 size-classes (i.e. < 2 m TLand > 2 m TL) observed in the southern section (Seal Rocks and sites south) fromNovember/December 1998 to March/April 2001. .......................................................33
Table 4.7. Mean percentage of Grey Nurse Sharks observed in aggregations and consistencyof aggregation site usage along the NSW coast from November/December 1998 toMarch/April 2001.........................................................................................................34
Table 4.8. Analysis of variance of the mean number of Grey Nurse Sharks with nylon or wiretrace embedded in their jaws and/or buccal cavity in 1999 and 2000..........................35
Table 4.9. Comparison of the numbers of Grey Nurse Sharks with and without hooks and/ortrace present in surveys 1-10........................................................................................36
Table 4.10. Comparison of hooking incidences with wire trace and nylon line for surveys 1-10...37
Table 5.1. Suggestions for the voluntary code of conduct provided by the Scuba DiversAssociation of NSW.....................................................................................................45
Table 5.2. The statewide responses by the scuba diving industry. ................................................46
Table 5.3. List of additional comments provided by the recreational scuba diving industry forfurther consideration. ...................................................................................................46
Table 5.4. Recommended voluntary code of conduct for scuba diving with Grey Nurse Sharks. 48
Contents v
EA Project No. 22499 Grey Nurse Sharks, Otway and Morrison
ACKNOWLEDGMENTS
We thank Carolyn Bland and Kathy Bown of the NSW Fisheries library for their unrelentingefforts in accessing some very obscure literature on the Grey Nurse Shark. We are grateful to SaraWilliams (Environment Australia) and Lachie Whetham (Coastcare) for their contributions to thisstudy. We also thank David Harasti (Environment Australia, now NSW Fisheries) for hisassistance and the cover photograph. We thank Geoff Gordon for his thought provokingdiscussions. Steve Kennelly and Bob Creese are thanked for their constructive reviews of thisreport.
The coastwide surveys would not have been possible without the assistance of Seaworld,Stradbroke Island Scuba Centre, Palm Beach Dive Centre, Stephanie Lemm of Queensland ParksService, Byron Bay Dive Centre, Simon Hartley of Southern Cross University, Darrin White,Wooli Dive Centre, Dive Quest, Solitary Islands Marine Park (NSW MPA), Pacific Blue DiveCentre, the Pet Porpoise Pool, the Solitary Islands Underwater Research Group, Jetty Dive Centre,South West Rocks Dive Centre, Port Macquarie Dive Centre, Peter Huettner, Phil Bowman,Fishermans Wharf Dive Centre, Action Divers Tuncurry, Pro Dive Nelson Bay, Dive Nelson Bay,Dr Ken Zimmerman of Newcastle University, Pro Dive The Entrance, Terrigal Dive Centre,Southern Cross Divers, Sydney Aquarium, Michael McFadyen, David Pearson, SydneyUnderwater Research Group, Max Western Dive Charters, Adam Smith, Leisure Coast Dive,Warren Jones, Jervis Bay Dive Club, Canberra University Dive Club, Malua Bay Dive, NationalDiving Academy, Ocean Hut Fishing and Dive Centre, and Merimbula Divers Lodge. To allinvolved, we are indebted for your efforts for without them we would not have gained a betterunderstanding of the numbers of Grey Nurse Sharks along the NSW coast. Hopefully, the resultsof this study will provide a stepping-stone for the recovery and long-term conservation of thespecies.
vi Executive Summary
EA Project No. 22499 Grey Nurse Sharks, Otway and Morrison
EXECUTIVE SUMMARY
• The Grey Nurse Shark, Carcharias taurus, belongs to the Family Odontaspididae and occurs incoastal waters off NSW and southern Qld and south-west WA. The shark is also found offSouth Africa and North America where it is respectively known as the “spotted ragged-toothshark” and the “sand tiger shark,” respectively. The sharks are often found in, or near, guttersand caverns around inshore rocky reefs and islands.
• The Grey Nurse Shark is a large bodied, strong-swimming shark attaining a maximum lengthof 320 cm. Little is known about the biology and ecology of the species in Australian watersand what is known has been inferred from studies in South Africa and the USA.
• Male Grey Nurse Sharks mature at approximately 190 cm and females mature at approximately220 cm. The Grey Nurse Shark exhibits an ovoviviparous reproductive strategy where there isno placental connection between the mother and the embryo. Instead, the two mostdevelopmentally-advanced embryos eat the remaining embryos and then unfertilized, ovulated,pea-sized eggs (phenomena known as intra-uterine cannibalism and oviphagy). The gestationperiod is approximately 9 to 12 months with two pups (occasionally one) born per litter. Thisis followed by a resting period of 1 year. The net result is a biennial reproductive cycle withonly one pup born per female per year on average.
• Very little is known about the precise timing of mating and pupping of Grey Nurse Sharkpopulations in Australian waters. However, scuba divers have observed recently-born pups inwinter and early spring which is consistent with observations from the USA and South Africa.
• The Grey Nurse Shark was afforded protected status in New South Wales waters in 1984 as aresult of: (1) reduced numbers observed by recreational scuba divers, (2) declining catches byspear fishers, (3) reduced catches in beach meshing programs, and (4) the realisation that theshark was not a “man-eater”. Scuba diving and commercial/recreational fishing are the mainhuman activities that occur in the habitats utilised by Grey Nurse Sharks. More recently, GreyNurse Sharks have been inadvertently caught on demersal setlines and by recreational fishers.
• The Threatened Species status of the Grey Nurse Shark was upgraded from “Vulnerable” to“Endangered” in August 2000 under the Threatened Species provisions of the NSW FisheriesManagement Act 1994.
• The current project was established: (1) to further quantify the distribution and abundance ofGrey Nurse Sharks along the entire NSW coast; (2) to identify and map sites important to theshark in the Batemans Shelf and Twofold Shelf Bioregions; (3) to identify key aggregationsites (critical habitat); (4) to analyse statistically data from all surveys done to date; and (5) toidentify the issues that need to be addressed in developing recovery plans for the species.
• The abundances of Grey Nurse Sharks were quantified in month-long surveys usingunderwater visual counts of sharks over a 15 minute period at sites along the NSW andsouthern Qld coastlines. Volunteer scuba divers along the NSW and southern Qld coast alsoparticipated in these surveys. At each site, divers recorded the number, sex and size of anyGrey Nurse sharks present. They also recorded the presence of hooks, mating scars, etc.
• Sites used by Grey Nurse Sharks in the Batemans and Twofold Shelf bioregions were mapped.
• A voluntary code of conduct for scuba diving with Grey Nurse Sharks was developed with theco-operation and input of numerous recreational scuba divers from various urban centres in thestate. The recommended code of conduct has the following guidelines:
1. Do not block entrances to caves or gutters2. Do not interrupt the swimming pattern of the sharks3. Do not feed or touch the sharks
Executive Summary vii
EA Project No. 22499 Grey Nurse Sharks, Otway and Morrison
4. Do not chase or harass the sharks (i.e. no mechanical apparatus such as scooters,horns and anti-shark devices are to be used)
5. Dive groups must not have more than 10 divers6. A dive brief is to be given by the dive leader before each dive7. All commercial operators are to be signatories to the Code of Conduct8. Code of Conduct is to be displayed in the shop and on the dive boat9. Dive operators are to participate in scientific research
• Ten surveys were done from November/December 1998 to March/April 2001. An average of57 sites were sampled in each of the 10 surveys. A maximum of 292 sharks was observed inthe winter 2000 survey. The vast majority of Grey Nurse Sharks (almost 90% of the observedpopulation) occupied 14 sites along the entire coast. No sharks were sighted at 63% of thesites, on average. Between 1 and 4 sharks were seen at the remaining 7 sites, on average.
• The 14 aggregation sites were utilised by Grey Nurse Sharks for substantial periods of timeover the 2.5 years of observation. The occurrence of mating and pupping was also evident atthese sites. Consideration should be given to declaring these sites as “critical habitat” toenhance the recovery and long-term conservation of the species. In December 2002, the NSWGovernment declared 10 of the aggregation sites as Critical Habitat.
• Analyses of the size-frequency distributions from the 10 surveys showed that the Grey NurseShark population exhibited segregation by size and sex. Proportionally more juvenile and adultmale Grey Nurse Sharks occurred at Forster and sites to the north, and proportionally morejuvenile and adult females occurred at Seal Rocks and sites to the south. The sex ratios of GreyNurse Sharks were significantly biased towards females in all except the winter surveys(surveys 3 and 7) and this is most likely due to segregation of the sexes.
• On subdividing the coastline into a northern section (i.e. Forster and sites north) and a southernsection (i.e. Seal Rocks and sites south), proportionally more males occurred in the northernsection. In contrast proportionally more females were observed in the southern section, but insurveys 3 and 7 there were more females in the north than the south.
• The segregation of male and female Grey Nurse Sharks suggested a pattern of movementcomprising: (1) movement of sexually mature males into shallower water in early autumnpresumably to mate, (2) further movement northwards to sites in southern Queensland inJuly/August, (3) the movement of sexually mature females and immature sharks of both sexesto the south in spring and early summer, and (4) the return movement of the latter sharks tosites north of Forster in the autumn and winter months. These hypothesised movements arebeing tested in a tagging program.
• The recorded incidence of accidental hooking of Grey Nurse Sharks on all types of fishing gearhas increased from approximately 2% to 12% over the past decade. The incidental capture ofGrey Nurse Sharks was approximately seven times greater on hooks with nylon fishing linecompared to hooks with wire trace.
• It is recommended that the survey results, research and management issues contained in thisreport are used in the preparation of the State and National Recovery Plans for the species.

NSW Fisheries 1
EA Project No. 22499 Grey Nurse Sharks, Otway and Morrison
1. INTRODUCTION AND PROJECT OBJECTIVES
1.1. Background
The Grey Nurse Shark, Carcharias taurus occurs in coastal waters off the NSW and southern Qldand south-west WA. A recent study (Otway & Parker 2000) examined the biology, ecology,distribution, and abundance of Grey Nurse Sharks in south eastern Australian waters. Numeroussites in the Tweed-Moreton Shelf, Manning Shelf and Hawkesbury Shelf bioregions were mappedand in doing so, it became apparent that caves, sandy-bottomed and boulder-filled gutters and largeoverhangs were crucial habitats utilised by Grey Nurse Sharks. This previous study involvedvolunteer recreational scuba divers along the NSW and southern Qld coast participating in threesurveys, in November/December 1998, March/April and June/July 1999. On subdividing thecoastline into northern (i.e. Forster - North Stradbroke Island) and southern (i.e. Seal Rocks - Eden)sections, proportionally more males occurred in the northern section in surveys 1-3. In contrast,proportionally more females were observed in the southern section in surveys 1 and 2, but insurvey 3 there were more females in the north than the south. The size and sexual segregation ofmale and female Grey Nurse Sharks evident during the three surveys suggests a hypothesisedpattern of movement comprising: (1) a movement of sexually mature males into shallower water inearly autumn (April) - presumably to mate. They then move northwards and appear at thenortherly most sites in southern Queensland in July/August; (2) the movement of sexually maturefemales and immature sharks of both sexes to the south in spring and early summer, followed by areturn to sites north of Forster in the autumn and winter months.
The results of the surveys (Otway & Parker 2000) also showed that the total numbers of sharkswere very low suggesting that the Grey Nurse Shark population in NSW waters has not recoveredsince it was made a protected species in 1984. These results supported the initial declaration of theshark as a threatened species.
This report builds upon and extends the work of Otway and Parker (2000). In so doing, this reportuses Otway and Parker (2000) as a pilot study and tests some of the previously generatedhypotheses through the collection of data over 2.5 years. This study also provides a more in-depthreview of the ecological and management issues associated with Grey Nurse Sharks.Consequently, this report should become a key source document and provide a basis for the Stateand Commonwealth recovery planning processes to ensure the long-term conservation of the GreyNurse Shark.
1.2. Project objectives
The project had 6 main objectives:
1. To conduct further surveys of numerous sites along the NSW and southern Queensland coasts,and to record the distribution and abundance of Grey Nurse Sharks and other data includingsite occupation (timing and duration), movements, population size structure and sex ratios;
2. To map sites utilised by Grey Nurse Sharks in the Batemans Shelf and Twofold Shelfbioregions;
3. To prepare a report on a voluntary code of conduct for scuba diving with Grey Nurse Sharks;
4. To prepare a report, which identifies key aggregation sites in the Tweed-Moreton, HawkesburyShelf, Batemans Shelf and Twofold Shelf Bioregions;
2 NSW Fisheries
EA Project No. 22499 Grey Nurse Sharks, Otway and Morrison
5. To conduct statistical analyses of the data from all surveys by NSW Fisheries and provide adetailed interpretation of the distribution and abundance of Grey Nurse Sharks in coastal watersof NSW and southern Queensland; and
6. To consider other issues that need to be addressed in a future research program, and therecovery plans for the long-term conservation of the Grey Nurse Shark.
This report presents the findings associated with each of these objectives. Chapter two documentsthe biology and ecology of Grey Nurse Sharks. Chapter three presents maps of the sites utilised byGrey Nurse Sharks in the Batemans Shelf and Twofold Shelf bioregions. Chapter four presents theresults and analyses of the data collected in 10 surveys from November/December 1998 toMarch/April 2001. Chapter five discusses the development of a Code of Conduct for scuba divingwith Grey Nurse Sharks. Chapter six provides a summary and final conclusions.
NSW Fisheries 3
EA Project No. 22499 Grey Nurse Sharks, Otway and Morrison
2. THE BIOLOGY AND ECOLOGY OF GREY NURSE
SHARKS
2.1. Names
Common: Grey Nurse Shark.Other names: Ragged-tooth shark (South Africa),
Sand-tiger shark (USA).Scientific: Carcharias taurus (Rafinesque, 1810)
2.2. Systematics
The nomenclature surrounding the Odontaspididae family can be quite confusing and severalinvalid scientific names for the Grey Nurse Shark have been used in the past, including: Triglochis(Muller & Henle, 1837), Odontaspis (Agassiz, 1838) and Eugomphodus (Gill, 1862). In 1965 thegenera Carcharias and synonyms of Carcharias were placed on the Official Index of Rejected andInvalid Generic Names in Zoology by the International Commission of Zoological Nomenclature(Paxton et al. 1989). These genera were suppressed in favour of Eugomphodus as it was thoughtthat Carcharias and Odontaspis, the other genera in the family Odontaspididae, were congeneric(Compagno, 1984). Later it was determined that the two type species were not congeneric so, in1987, the commission reinstated the genus Carcharias (Paxton et al. 1989). Moreover, as thespecies was originally distributed widely across the Indian, Pacific and Atlantic oceans, this led tothe use of several specific names including: taurus (Rafinesque 1810), americanus (Mitchell 1815,Abbott 1861), cinerea (Macleay 1880) and arenarias (Ogilby 1911). It is now generally acceptedthat they all refer to the same species. The correct scientific name for the species is thereforeCarcharias taurus (Rafinesque, 1810).
2.3. Description
The Grey Nurse Shark, Carcharias taurus (Rafinesque, 1810) is one of four species belonging tothe family Odontaspididae (Compagno 1984). The shark has a large, stout, fusiform body withsimilarly-sized first and second dorsal fins and an asymmetrical caudal fin with a strong ventrallobe. The second dorsal fin is closer to the pelvic fins than it is to the pectoral fins. The head has aflattened-conical snout, small eyes without a nictitating membrane and a long mouth extendingbehind the eyes. Teeth on the upper and lower jaws are awl-like, having long, narrow cusps withsingle lateral cusplets. Individuals vary in colour from grey to grey-brown dorsally, with a paleroff white under belly. Reddish or brownish spots may also occur on the caudal fin and posteriorhalf of the body, particularly in (Compagno 1984, Last & Stevens 1994, Pollard et al. 1996, Otway& Parker 2000).
Grey Nurse Sharks grow to over 300 cm total length with the largest specimens reported fromSouth Africa - 320 cm (Torres 1991), the east coast of the USA - 318 cm (Bigelow & Schroeder1948, Compagno 1984) and Brazil - 282 cm (Sadowsky 1970). In SE Australia, Grey NurseSharks grow to at least 320 cm total length (Last and Stevens 1994, Otway unpubl. data).
4 NSW Fisheries
EA Project No. 22499 Grey Nurse Sharks, Otway and Morrison
2.4. Distribution
Grey Nurse Sharks initially had a broad inshore distribution, primarily in sub-tropical to cooltemperate waters on continental shelves (Compagno 1984). Whilst the Grey Nurse Shark has beenrecorded from the Mediterranean Sea, Atlantic, Indian and Pacific oceans, it has only been sightedin recent times off the coasts of eastern USA (Springer 1948, Bigelow & Schroeder 1948), Brazil(Sadowski 1970, Sadowski et al. 1989, Amorim et al. 1998), Uruguay (Marin et al. 1998),Argentina (Chiaramonte 1998), South Africa (Bass et al. 1975, Compagno 1984) and Australia(Last & Stevens 1994).
In Australia, Grey Nurse Sharks have been recorded from Mooloolaba in Southern Queensland,around the greater part of the southern half of the continent and northwards to Shark Bay inWestern Australia (Last and Stevens, 1994). The species does not occur in Tasmanian waters, buthas been caught on one occasion in the Arafura sea (off the Northern Territory) by Taiwaneselongliners (Read & Ward 1986). More recently, the distribution of the grey nurse has beenconfined to the coastal waters off southern Queensland and along the NSW coast, and to the coastalwaters off West Australia.
2.5. Habitat
The Grey Nurse Shark is a coastal species found on the continental shelf from the surf zone downto 190 m (Compagno 1984, Klippel 1992, Last & Stevens 1994). The shark is a slow, strong-swimming species that is often seen hovering motionless near the bottom in or near deep sandy-bottomed gutters or in rocky caves around inshore rocky reefs and islands at depths between 15 and40 meters (Goadby 1968, Grant 1982, Pollard et al. 1996, Cliff unpubl. ms., Otway & Parker2000). These sites may play an important role in pupping and/or mating activities as Grey NurseSharks often form aggregations at these sites (Compagno 1984, Pollard et al. 1996, Cliff unpubl.ms., Smale pers. comm., and see Section 2.6). Occasionally, they are also found throughout thewater column (Compagno 1984). The shark is thought to be more active at night (Compagno 1984,Pollard et al. 1996), but this needs to verified using acoustic telemetry (Otway & Parker 2000).
2.6. Abundance
Prior to 1998, the spatial and temporal patterns of abundance of the Grey Nurse Shark in SouthEast Australia were poorly understood. In the past, what was known had been derived from: catchrecords from the NSW beach protective shark meshing programs (Reid & Krogh 1992, Krogh1994); catch records from the log books of gamefishers (Pepperell 1992); and three limited surveysdone on small spatial and temporal scales (Pollard et al. 1996, Parker & Bucher 2000, Pickering &Wilkinson unpubl. data).
The present study is a continuation of 3 underwater surveys done to quantify the abundances ofGrey Nurse Sharks at quarterly intervals at approximately 60 sites along the entire NSW coast(Otway & Parker 2000). The 3 previous surveys showed that 88.2% of the Grey Nurse Sharksobserved were found in aggregations of 5 or more sharks at 12 sites along the NSW coast.Moreover, two of these sites: Pimpernel Rock and the Cod Grounds occurred in Commonwealthwaters (i.e. the sites are located more than 3 nautical miles from the NSW coast). The same GreyNurse Sharks (as evidenced by the presence of hooks, wounds and/or the absence of fins) wereoften seen by scuba divers at these aggregating sites. These observations were consistent withthose of researchers in South Africa (Smale pers. comm.) and suggested that the shark exhibits ahigh degree of site fidelity once a site (gutter or cave) is occupied. This tendency to aggregate at afew key sites is a biological characteristic that makes the species vulnerable to localised pressures(Environment Australia 1997).
NSW Fisheries 5
EA Project No. 22499 Grey Nurse Sharks, Otway and Morrison
2.7. Diet
In South Africa, Grey Nurse Sharks feed on a wide range of bony fish including: herrings (FamilyClupeidae), croakers (Family Sciaenidae), bluefishes (Family Pomatomidae), mackerels (FamilyScombridae), butterfishes (Family Odacidae), snappers (Family Lutjanidae), eels (FamilyMuraenidae), wrasses (Family Labridae), mullets (Family Mugilidae), sea basses (FamilySerranidae), flatfishes (Families Platycephalidae & Bothidae), jacks (Family Carangidae), andlikely many others, as well as small and juvenile sharks (especially those of the FamiliesCarcharhinidae and Triakidae), eagle rays (Family Myliobatidae), squid and, on rare occasions,crabs and lobsters (Bigelow & Schroeder 1948, Bass et al. 1975, Compagno 1984, Schmid et al.1990).
In NSW, it is reasonable to assume that the shark would consume fish from the same families (seeabove) given that the Australian and South African ichthyofauna exhibit many similarities. Hence,it is likely that the diet consists of pilchards, jewfish, tailor, bonito, morays, blue groper, sea mullet,flatheads, yellowtail kingfish, small and juvenile sharks, squid and possibly some crustaceans.However, this will need to be verified by gut content analysis of incidentally caught and killedGrey Nurse Sharks. It is important to note that many of the species that comprise the sharks’ dietare also harvested by commercial (e.g. Gray & Otway 1994, Otway et al. 1996) and recreational(spear - Lincoln Smith et al. 1989 and line - Otway et al. 1996, Steffe et al. 1999) fishers.
2.8. Population demography
There is limited information available on the life-history of the Grey Nurse Shark in Australianwaters. However, some life-history characteristics (detailed below) have been quantified for thisspecies off South Africa (Bass et al. 1975, Govender et al. 1991, Cliff unpubl. ms.) and the eastcoast of the USA (Bigelow & Schroeder 1948, Springer 1948, Stead 1963, Gilmore et al. 1983,Schmid et al. 1990, Branstetter & Musick, 1994). The results of this research has led these, andother workers (e.g. Compagno 1984, 1990, Branstetter 1990, Hoenig & Gruber 1990, Chiaramonte1998, Smith et al. 1998), to conclude that the life-history traits of Grey Nurse Sharks make themextremely vulnerable to over-exploitation.
2.8.1. Reproductive biology
Reproduction of the Grey Nurse Shark has been well documented for populations in the coastalwaters off the USA (Springer 1948, Gilmore et al. 1983, Branstetter & Musick 1994) and SouthAfrica (Bass et al. 1975, Cliff unpubl. ms.) and is regarded as one of the most unusual reproductivestrategies used by sharks (Gilbert, 1981). They reach sexual maturity at total lengths of 190 - 195cm and 220 - 230 cm for males and females, respectively (Gilmore et al. 1983). These lengthsequate to ages of 4 - 6 years and 6 - 8 years for males and females, respectively (Gilmore et al.1983, Branstetter & Musick 1994).
The reproductive studies (op. cit.) have shown that the Grey Nurse Shark is ovoviviparous withonly two pups (occasionally one) born per litter. Female Grey Nurse Sharks have no placentalconnection with their young as do the carcharhinids (whalers). Instead, the two most advancedembryos (one in each uterus) eat the remaining developing embryos. Having consumed theirsiblings, the developing embryos then consume unfertilised eggs ovulated by the mother. Thesephenomena are known as intra-uterine cannibalism and oviphagy, respectively (Stead 1963, Bass etal. 1975, Gilmore et al. 1983, Compagno 1984). The gestation period of C. taurus is about 9 - 12months, with pupping occurring in late winter to early spring when the pups are approximately 100cm in length (Bass et al. 1975, Gilmore et al. 1983). Pregnant females avoid giving birth inembayments and areas of low salinity and prefer coastal, rocky reefs (Bass et al. 1975, Branstetter1990). The females then enter a resting stage lasting about one year (Branstetter & Musick 1994,
6 NSW Fisheries
EA Project No. 22499 Grey Nurse Sharks, Otway and Morrison
Cliff unpubl. ms.) resulting in a biennial reproductive cycle. Consequently, Grey Nurse Sharksonly produce one pup per annum, on average, which makes the species one of the least fecund ofall sharks and extremely vulnerable to human-induced pressures.
The timing of mating and pupping of Grey Nurse Sharks in Australian waters is unknown. Whilesome preliminary observations of pre-copulatory behaviour have been made in aquaria (Gordon1992), very little has been documented with individuals in the wild. However, many Grey NurseSharks have been observed at Pimpernel Rock (SIMP - Commonwealth section) during the monthsof March and April with mating scars (i.e. bite marks around the head, pectoral and pelvic fins) (D.White pers. comm. in Otway & Parker 2000). Observations made during this study suggest thatfemale grey nurses most likely give birth to their pups during winter at the sites where theyaggregate. The timing of pupping, mating, and the duration of gestation will need to be verified bymore intense diver surveys in winter and the examination of incidentally caught and killed GreyNurse Sharks. Autopsies of such sharks will also enable the size/age of reproductive maturity to bedocumented for the Grey Nurse Shark in NSW waters.
2.8.2. Age, growth and longevity
Estimates of age and growth of Grey Nurse Shark along the east coast of the USA have beenobtained from captive sharks held in aquaria in Florida (Schmid et al. 1990) and wild specimenscaptured from the NW Atlantic Ocean (Branstetter & Musick, 1994). Male and female Grey NurseSharks (n = 16) were measured and weighed over a period of 16 months (Schmid et al. 1990). Incontrast, Branstetter and Musick (1994) counted the number of growth bands in sagittally-sectioned, vertebral centra to determine age, but this technique was not validated using oxy-tetracycline (or other) marking methods.
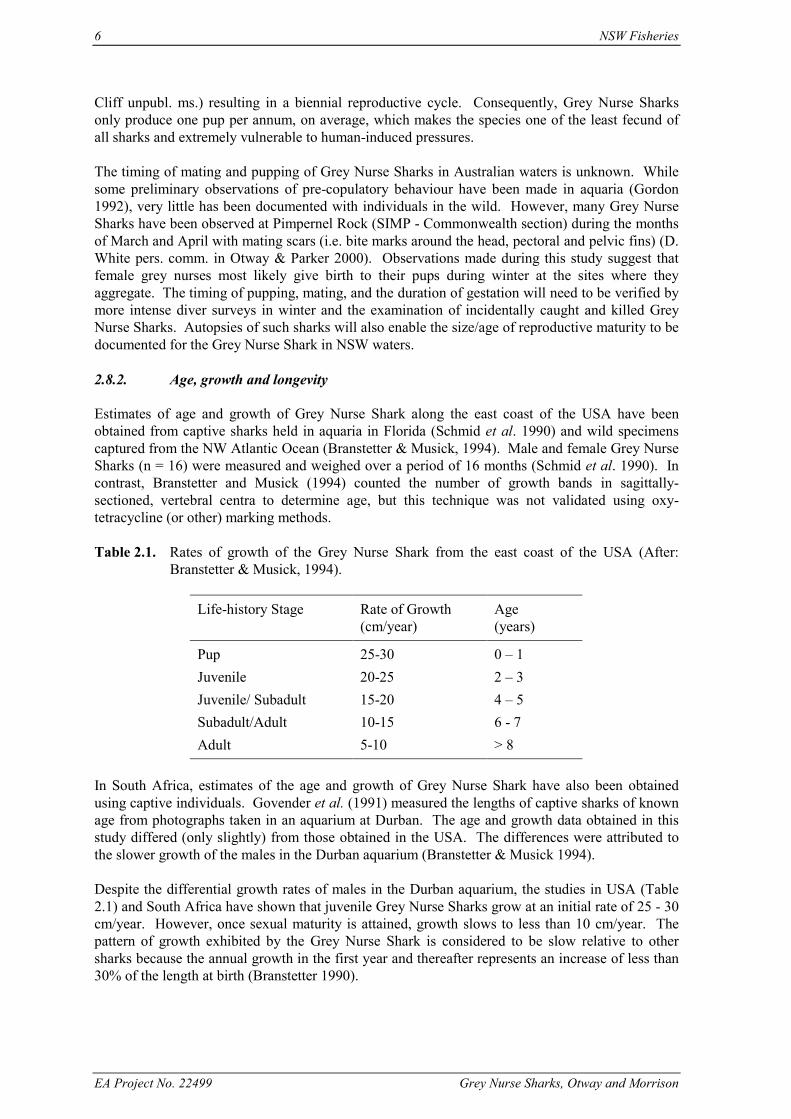
Table 2.1. Rates of growth of the Grey Nurse Shark from the east coast of the USA (After:Branstetter & Musick, 1994).
Life-history Stage Rate of Growth(cm/year)
Age(years)
Pup 25-30 0 – 1Juvenile 20-25 2 – 3Juvenile/ Subadult 15-20 4 – 5Subadult/Adult 10-15 6 - 7Adult 5-10 > 8
In South Africa, estimates of the age and growth of Grey Nurse Shark have also been obtainedusing captive individuals. Govender et al. (1991) measured the lengths of captive sharks of knownage from photographs taken in an aquarium at Durban. The age and growth data obtained in thisstudy differed (only slightly) from those obtained in the USA. The differences were attributed tothe slower growth of the males in the Durban aquarium (Branstetter & Musick 1994).
Despite the differential growth rates of males in the Durban aquarium, the studies in USA (Table2.1) and South Africa have shown that juvenile Grey Nurse Sharks grow at an initial rate of 25 - 30cm/year. However, once sexual maturity is attained, growth slows to less than 10 cm/year. Thepattern of growth exhibited by the Grey Nurse Shark is considered to be slow relative to othersharks because the annual growth in the first year and thereafter represents an increase of less than30% of the length at birth (Branstetter 1990).
NSW Fisheries 7
EA Project No. 22499 Grey Nurse Sharks, Otway and Morrison
The longevity of the species in the wild is unknown, but a Grey Nurse Shark lived for over 16 yearsin captivity in South Africa (Govender et al. 1991). In the absence of other information,Branstetter and Musick (1994) estimated the longevity of Grey Nurse Sharks to be 30 and 35 yearsfor males and females, respectively. More recently, Cortes (2000) and Mollet (2001) suggestedthat longevities of 20 and 25 years for males and females, respectively may be more realistic.
There is no information on the age and growth of Grey Nurse Sharks in the coastal waters of NSWalthough there may be some limited data for the captive individuals held in aquaria. Clearly, theabsence of age and growth data for Grey Nurse Sharks in NSW coastal waters needs to beaddressed as a matter of urgency.
2.8.3. Rates of mortality
While rates of natural mortality of the Grey Nurse Sharks have been estimated by several authors(e.g. 12.9% p.a. - Smith et al. 1998, 15.43% p.a. - Mollet 2001) using the equations of Pauly (1980)or Hoenig (1983), there are no empirically-derived estimates of natural mortality. Furthermore,there are no published estimates of the instantaneous rates of fishing mortality for any Grey NurseShark populations. The need for age-structured estimates of the rates of mortality (natural andfishing-related) is important because these rates will identify which age class(es) have the greatestmortality. This information can, in turn, identify whether the observed mortality is causing thepopulation to decline (Caughley 1977). This information can then focus management actions onthe identified threats that have the greatest effect on populations.
2.9. Movements
Relatively little is known about the migratory habits of Grey Nurse Sharks in SE Australian waters.At certain times of the year, Grey Nurse Sharks aggregate according to sex. Males are predominantin southern Queensland during July to October, whereas females are more prevalent in centralNSW (Otway & Parker 2000). These observations are also supported by data from the NSWFisheries protective beach-meshing program (Reid & Krogh 1992, Krogh 1994). Otway andParker (2000) suggested that female Grey Nurse Sharks migrate to the south coast of NSW in latespring and aggregate at two sites; the first at the Tollgate Islands off Batemans Bay and the secondat Montague Island off Narooma. They also suggested that they occupy these sites until midautumn, at which time they migrate northwards to sites off the mid-North coast of NSW (i.e.Forster to Coffs Harbour). More information is required to test hypotheses concerning themovements of Grey Nurse Sharks in NSW waters and this will require that a tagging program isinitiated.
2.10. Natural predators
Past research in South Africa (e.g. Bass et al. 1973, Bass et al. 1975, Cliff et al. 1989 1990, Cliff &Dudley 1991) has shown that the great white shark (Carcharodon carcharias), short-finned mako(Isurus oxyrinchus), tiger shark (Galeocerdo cuvier) and bull shark (Carcharhinus leucas),consume a range of small sharks (< 1 m precaudal length) and the juveniles of larger sharksincluding the Grey Nurse Shark. Analyses of the gut contents of these 4 species caught in SEAustralian waters (Stevens 1984, Last & Stevens 1994) has shown that small sharks and thejuveniles of larger sharks are also prevalent in their diets. However, the degree of digestionprevented identification of the species consumed. Moreover, the distributions of great white, short-finned mako, tiger and bull shark (Stevens 1984, Pepperell 1992, Reid & Krogh 1992, Krogh 1994,Last & Stevens 1994, Otway unpubl. data) overlap the present distribution of the Grey Nurse inNSW waters (Last & Stevens 1994, Otway & Parker 2000). Consequently, it would be reasonableto hypothesise that these 4 species are the most likely natural predators of the Grey Nurse Shark.This prediction will need to be tested via the analyses of gut contents of the great white, short-
8 NSW Fisheries
EA Project No. 22499 Grey Nurse Sharks, Otway and Morrison
finned mako, tiger and bull shark. DNA “fingerprints” of Grey Nurse Sharks would clearly beadvantageous in such work.
2.11. Conservation status
2.11.1. Worldwide
The Grey Nurse Shark is currently listed on the IUCN Red List of Threatened Animals asvulnerable worldwide and endangered on the east coast of Australia (Red List Number: VUA1ab+2d, Shark Specialist Group: World Conservation Monitoring Centre). Despite this, thedegree of protection afforded the Grey Nurse Shark around the world is limited.
In South Africa, the species is currently being de-commercialised. It may be caught and kept, butmay not be sold for financial gain (Cliff, pers. comm.), and the Natal Sharks Board hopes thatfishers who catch these sharks will return them to the water.
In the USA, the Grey Nurse Shark is being managed under a shark management plan prepared bythe National Marine Fisheries Service of NOAA. The plan was aimed at reducing catches ofsharks by sport and commercial fishers. The Grey Nurse Shark or “sand tiger” as it is known in theUSA, is one of five large coastal species that have been protected from directed fishing by a rulingin April 1997 (Smullen, 1997).
In Brazil, Uruguay and Argentina, the Grey Nurse Shark is harvested by commercial fishers as partof multi-species shark fisheries. However, it is only caught when the fishers work the inshorewaters. Catches are generally very low despite an ever-increasing effort (Chiaramonte 1998).Recreational fishers also target the species and there is now concern over the viability of thepopulation (Chiaramonte 1998).
In Japan, the shark was harvested extensively for its flesh which was utilised fresh, frozen, smoked,and dried (Compagno 1984). The population has now declined to a point where it is rarely caughtby commercial fishers.
2.11.2. Australia
The Grey Nurse Shark was afforded protected status in New South Wales when legislation wasgazetted in November 1984. Prior to protection, anecdotal accounts suggested that the abundanceof the species had been severely reduced in SE Australian waters. Three main factors argued asevidence of the decline of the Grey Nurse Shark population in NSW waters were: (1) decliningcatches by spearfishers, (2) declining catches in beach meshing programs and (3) the realisationthat the species was not responsible for attacks on humans (Pollard, 1990; Pollard et al., 1996). Asa result, requests were made to NSW Fisheries to protect the species.
Protection of the species in State waters is managed under the Threatened Species provisions (Part7A) of the NSW Fisheries Management Act 1994 where it is listed as ‘endangered’. The protectionof the species in Commonwealth waters, including the Australian Fishing Zone and waters abovethe continental shelf, is carried out under the Environment Protection and BiodiversityConservation Act 1999 in which the species is listed as ‘critically endangered’ on the east coast and‘vulnerable’ on the west coast of Australia.
NSW Fisheries 9
EA Project No. 22499 Grey Nurse Sharks, Otway and Morrison
3. GREY NURSE SHARK HABITAT MAPPING
3.1. Introduction
The aim of habitat mapping is to provide detailed information on the sites where Grey NurseSharks have been sighted. Anecdotal and quantitative information on the occupation of these sitesby Grey Nurse Sharks can then be related to the key habitat features at each site. The sites utilisedby Grey Nurse Sharks in the Batemans Shelf and Twofold Shelf Bioregions were mapped in thisstudy. The habitat maps contain the location of the site in relation to the coast, the nature andcharacteristics of the habitat where the sharks are generally observed (usually a gutter or cave), theapproximate distance of the site from the coast and any other unique features of each site.
The maps were generated from drawings and computer images provided by divers. Each map wasscanned and enhanced using digital technology. Additional information such as depths andlocation of gutters and caves were then added to aid in interpretation. The information in the textaccompanying each map provides details concerning: (1) the temporal occupancy of the site byGrey Nurse Sharks, (2) the approximate depths at which the sharks were observed, (3) thepopularity of the site with recreational scuba divers, and (4) any other relevant informationpertinent to each site, such as the extent and location of Marine Parks, fishing closures and AquaticReserves. Maps for all sites in the two bioregions are presented in latitudinal order from north tosouth.
The sites utilised by Grey Nurse Sharks in the Tweed Moreton Shelf, Manning Shelf andHawkesbury Shelf Bioregions were previously mapped in Otway and Parker (2000). These are notpresented in this report and in this respect, Otway and Parker (2000) must be viewed as acompanion document.
3.1.1. Batemans Shelf and Twofold Shelf Bioregions
The Batemans Shelf Bioregion extends from Shellharbour (34o35’S), southwards to Tathra(36o48’S) on the south coast of NSW. The Twofold Shelf Bioregion extends from Tathra,southwards into Victoria. Thirteen sites in the Batemans Shelf and Twofold Shelf Bioregions weresampled as part of the distribution and abundance surveys (Table 3.1). Individual maps have beenprovided for all 13 sites.
10 NSW Fisheries
EA Project No. 22499 Grey Nurse Sharks, Otway and Morrison
Table 3.1. Location of sites where Grey Nurse Sharks have been observed in past decades in theBatemans and Twofold Shelf bioregions in NSW.
Bioregion Location Sites
Batemans Shelf Shellharbour Bass Point GuttersBass Point Arch/Cave
Jervis Bay The Drum and DrumsticksThe DocksBoat HarbourWeedy Valley
Ulladulla Brush Island GutterBrush Island Pinnacle
Batemans Bay Tollgate Island GutterBlack Rock Arch
Narooma Montague Island Shark GutterMontague Island The GutMontague Island The PinnaclesMontague Island Bubble Cave
Twofold Shelf Eden Mewstone RockSouth Head
3.1.1.1. Shellharbour
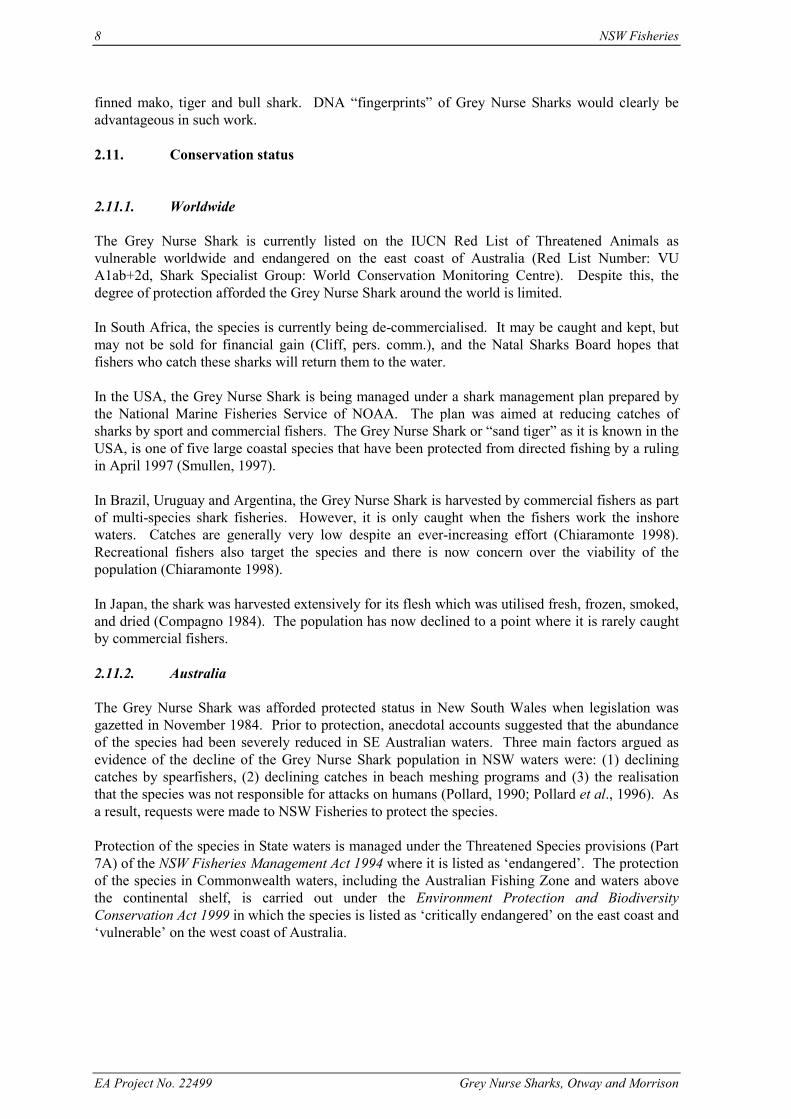
Grey Nurse Sharks have been observed at two sites at Shellharbour. Both sites: “The Gutter” and“The Arch/Cave” are located at Bass Point (Fig. 3.1). The Gutter is a reef system extending off thenorthern most tip of Bass Point near Lou’s Reef with a deep sand-filled gutter that reaches a depthof 38 metres. The Arch/Cave is located on the southern side of Bass Point and is a reef system thatreaches a depth of 30 metres. Grey Nurse Sharks are observed swimming or hovering inside ornear the Cave or Arch. The sharks have been observed at these sites from December to June.
3.1.1.2. Jervis Bay
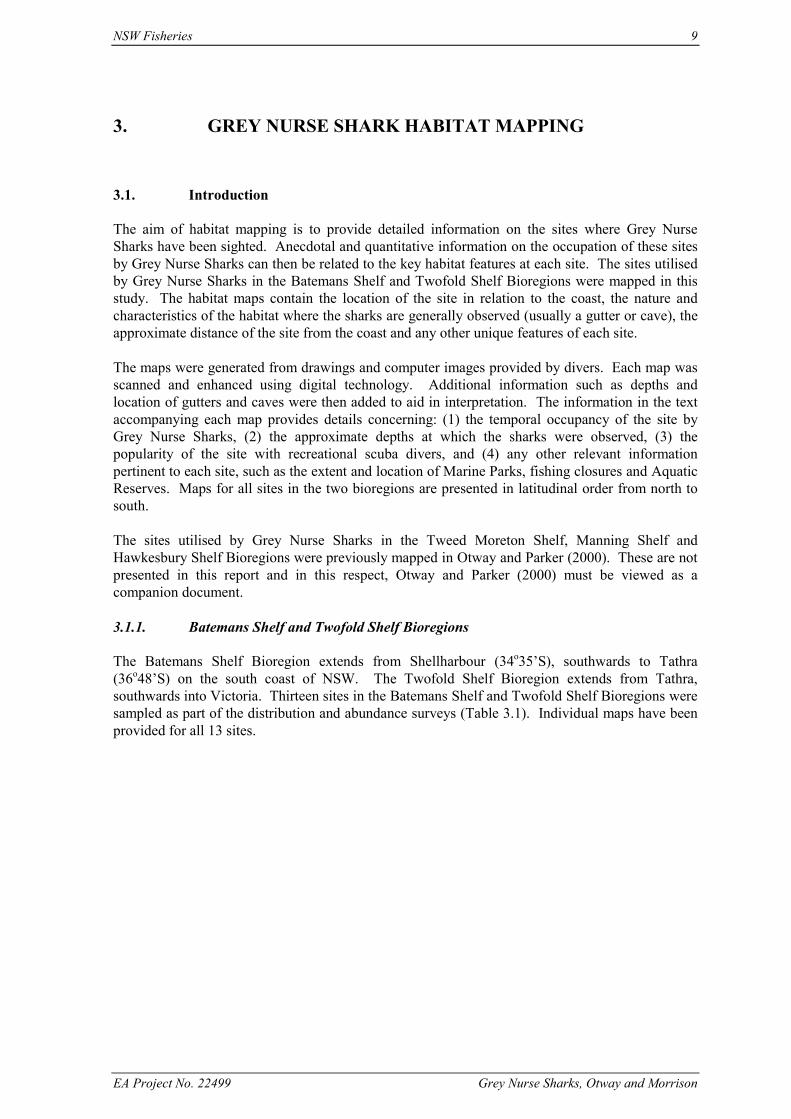
There are numerous dive sites within the Jervis Bay Marine Park. Grey Nurse Sharks are observedat four main sites, “The Drum and Drumsticks”, “The Docks”, “Boat Harbour” and “WeedyValley” (Fig. 3.2). “The Drum and Drumsticks” are located outside of the Bay on the eastern sideof Beecroft Peninsula. This site consists of a series of sand-filled gutters and a cave in watersreaching a maximum depth of 20 m. “The Docks” is located in a cove on the northern head of theentrance to the Bay. This site is also a series of gutters on rocky reef reaching a maximum depth of20 m. “Boat Harbour” is next (west) to “The Docks” and is a rocky reef. Grey Nurse Sharks areusually observed along the wall and in a small shallow gutter. “Weedy Valley” is located on thenorthern tip of Bowen Island at the entrance to the Bay. This site is a rocky reef, and Grey NurseSharks are observed along a 7 m high wall that descends into 22 m of water. Grey Nurse Sharksare usually observed in the summer-autumn months.
3.1.1.3. Ulladulla
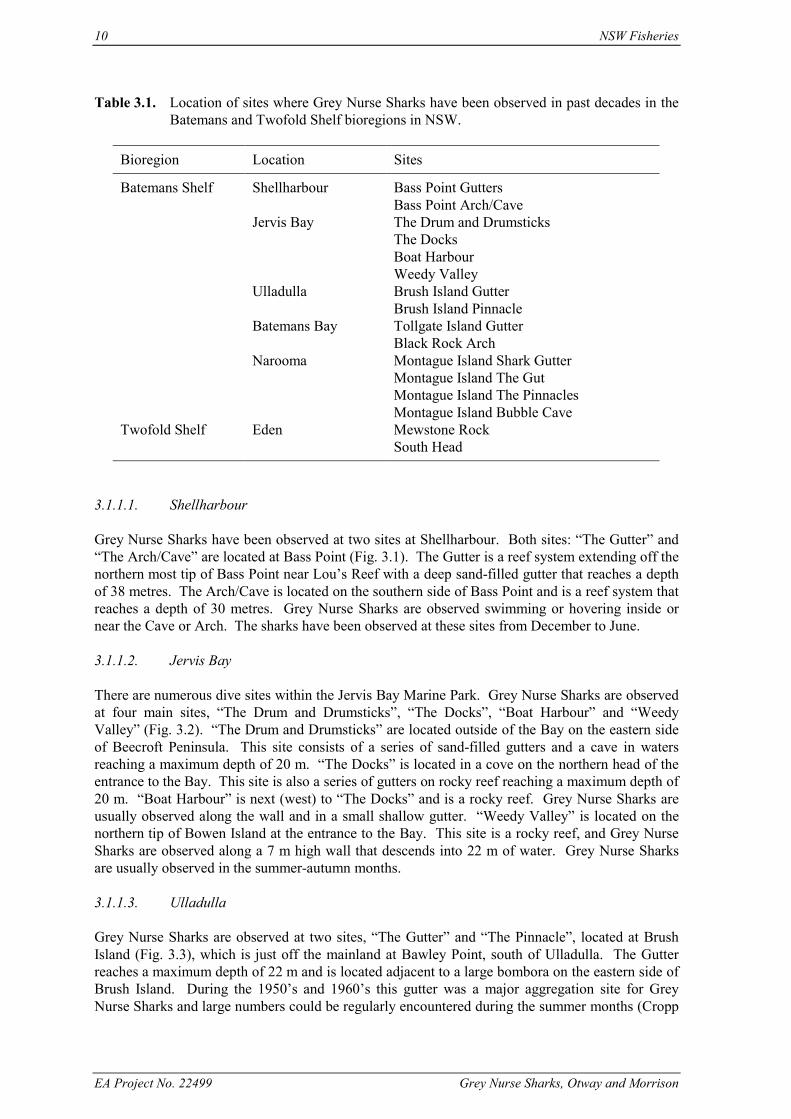
Grey Nurse Sharks are observed at two sites, “The Gutter” and “The Pinnacle”, located at BrushIsland (Fig. 3.3), which is just off the mainland at Bawley Point, south of Ulladulla. The Gutterreaches a maximum depth of 22 m and is located adjacent to a large bombora on the eastern side ofBrush Island. During the 1950’s and 1960’s this gutter was a major aggregation site for GreyNurse Sharks and large numbers could be regularly encountered during the summer months (Cropp
NSW Fisheries 11
EA Project No. 22499 Grey Nurse Sharks, Otway and Morrison
1964). The second site, “the Pinnacle” is located approximately 1.5 km east of Brush Island. ThePinnacle is a large, rocky structure rising from the bottom in 42 m of water to about 18 m from thesea surface. There is a small cave at the bottom of the Pinnacle in 40 m and Grey Nurse Sharkshave been observed there in the past. To date, only one Grey Nurse Shark has been observed atBrush Island.
3.1.1.4. Batemans Bay
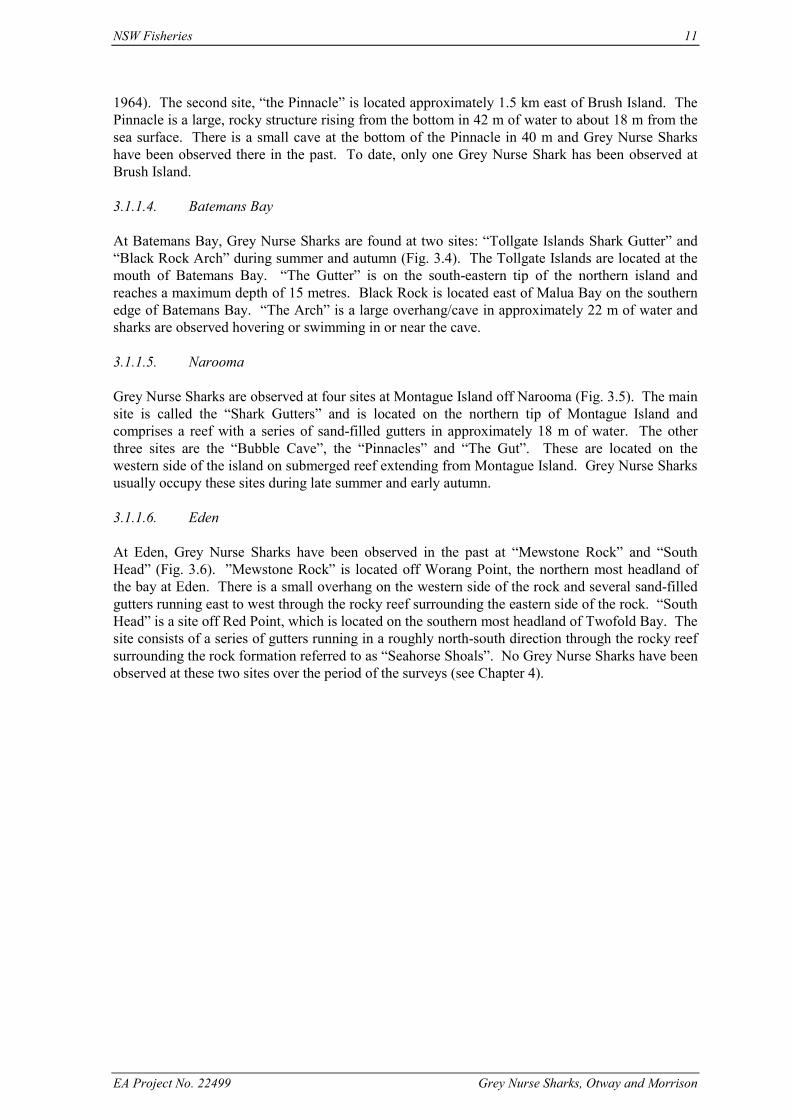
At Batemans Bay, Grey Nurse Sharks are found at two sites: “Tollgate Islands Shark Gutter” and“Black Rock Arch” during summer and autumn (Fig. 3.4). The Tollgate Islands are located at themouth of Batemans Bay. “The Gutter” is on the south-eastern tip of the northern island andreaches a maximum depth of 15 metres. Black Rock is located east of Malua Bay on the southernedge of Batemans Bay. “The Arch” is a large overhang/cave in approximately 22 m of water andsharks are observed hovering or swimming in or near the cave.
3.1.1.5. Narooma
Grey Nurse Sharks are observed at four sites at Montague Island off Narooma (Fig. 3.5). The mainsite is called the “Shark Gutters” and is located on the northern tip of Montague Island andcomprises a reef with a series of sand-filled gutters in approximately 18 m of water. The otherthree sites are the “Bubble Cave”, the “Pinnacles” and “The Gut”. These are located on thewestern side of the island on submerged reef extending from Montague Island. Grey Nurse Sharksusually occupy these sites during late summer and early autumn.
3.1.1.6. Eden
At Eden, Grey Nurse Sharks have been observed in the past at “Mewstone Rock” and “SouthHead” (Fig. 3.6). ”Mewstone Rock” is located off Worang Point, the northern most headland ofthe bay at Eden. There is a small overhang on the western side of the rock and several sand-filledgutters running east to west through the rocky reef surrounding the eastern side of the rock. “SouthHead” is a site off Red Point, which is located on the southern most headland of Twofold Bay. Thesite consists of a series of gutters running in a roughly north-south direction through the rocky reefsurrounding the rock formation referred to as “Seahorse Shoals”. No Grey Nurse Sharks have beenobserved at these two sites over the period of the surveys (see Chapter 4).
12 NSW Fisheries
EA Project No. 22499 Grey Nurse Sharks, Otway and Morrison
Shellharbour
Bass Point
2 0 2 kmScale
“Deep Gutters”
“The Arch” “The Cave”
G
G G
G
BassPoint
12m
36m
24m
26m
38m
Lou’sReef
LEGENDG GutterC Cave Subtidal reef Land Boulders
Bass Point
C
GC
GWall24m
24m10m
6m
24m
30m
16m
The Arch
The Cave
Not to scale
Not to scale
Figure 3.1. Sites at Shellharbour where Grey Nurse Sharks have been observed in past years.
NSW Fisheries 13
EA Project No. 22499 Grey Nurse Sharks, Otway and Morrison
5 0 5 kmScale
CC
G
G
G20m
18m
12m
Bowen Island
G
GG
G
G15m
Wall
12m
10m
5m
3m
18m
15m5m
22m
“Drum and Drumsticks”
Jervis Bay
LEGENDG GutterC Cave Subtidal reef Land Boulders
Huskisson
“Weedy Valley”
“Boat Harbour”
3m
12m
8m
15m12m
3m
GG
GG
“The Docks”
Not to scale
Not to scale
Not to scale
Not to scale
Figure 3.2. Sites at Jervis Bay where Grey Nurse Sharks have been observed in past years.
14 NSW Fisheries
EA Project No. 22499 Grey Nurse Sharks, Otway and Morrison
Ulladulla
Bawley PointBrush Island
PinnacleBrush Island
18m25m
2m
Not to scale
Brush Island “Gutter” and “Pinnacle”
5 0 5 kmScale
LEGENDG GutterC Cave Subtidal reef Land Boulders
G
20 m
20 m
12 m
C40 m
18 m
Wall
Figure 3.3. Sites at Ulladulla where Grey Nurse Sharks have been observed in past years.
NSW Fisheries 15
EA Project No. 22499 Grey Nurse Sharks, Otway and Morrison
Batemans Bay
Tollgate Islands
5 0 5 kmScale
G GG
Tollgate Island
Black Rock
GCBlack Rock
LEGENDG GutterC Cave Subtidal reef Land Boulders “Shark Gutters”
Not to scale
“The Cave”
Not to scale
14 m10 m
18 m
Black Rock
C
C
The Arch
14 m
16 m
10 m
Figure 3.4. Sites at Batemans Bay where Grey Nurse Sharks have been observed in past years.
16 NSW Fisheries
EA Project No. 22499 Grey Nurse Sharks, Otway and Morrison
NaroomaMontague Island
5 0 5 kmScale
LEGENDG GutterC Cave Subtidal reef Land Boulders
“Pinnacles”
“The Gut”
“Bubble Cave”
MontagueIsland
MontagueIsland
“Shark Gutters”G G
G
GG G
“Yellowfin Alley”
Not to scale
Not to scale
30 m
12 m25 m
34 m
18 m
20 m
Figure 3.5. Sites at Narooma where Grey Nurse Sharks have been observed in past years.
NSW Fisheries 17
EA Project No. 22499 Grey Nurse Sharks, Otway and Morrison
LEGENDG GutterC Cave Subtidal reef Land Boulders
MewstoneRock
WorangPoint
“Mewstone Rock”
Not to scale
GG
G
GG G
C16m
20m
26m
SeahorseShoals
RedPoint
“South Head”
Not to scale
G
G
G
15m20m
15m G G
G
18m
EdenWorang Point
SouthHead
Red Point
2 0 2 kmScale
Figure 3.6. Sites at Eden where Grey Nurse Sharks have been observed in past years.
18 NSW Fisheries
EA Project No. 22499 Grey Nurse Sharks, Otway and Morrison
4. THE DISTRIBUTION AND ABUNDANCE OF GREY
NURSE SHARKS
4.1. Introduction
Results of the previous coastwide surveys (Otway & Parker 2000) showed that the abundances ofGrey Nurse Sharks along the NSW coast varied spatially and temporally with evidence ofsegregation by size and sex. However, it was not clear whether these preliminary patterns wouldbe consistent over time. Consequently, there was a need to document the spatial and temporalpatterns of abundances of Grey Nurse Sharks along the NSW coast over longer periods of time.Moreover, Otway & Parker (2000) recognised that further estimates of abundance would be neededto guard against errors in the interpretation of the data given the low numbers of sharks observedand the limited number of surveys.
4.2. Materials and methods
4.2.1. Sampling sites and protocol
The sites sampled in this study were the same as documented in Otway and Parker (2000) to ensurecontinuity of the data. They were originally chosen by Otway and Parker (2000) by reviewing thescientific and “grey” literature (i.e. popular books, diving magazines, newspaper articles, etc.) todocument where Grey Nurse Sharks had been observed over the past 50 years. Approximately 75sites (Fig. 4.1) were identified along the New South Wales and southern Queensland coasts: adistance of ≈ 2,000 km. These sites were grouped into clusters radiating from 21 coastal centres ofurbanisation (hereafter called locations) along the coast. The number of sites within any givenlocation varied from 1 – 8.
Scuba divers from universities, dive clubs, scuba diving schools, commercial aquaria wereapproached to continue their voluntary participation in the surveys. Together with scuba diversfrom NSW Fisheries, the distribution and abundance, size-structure and sex-ratios of Grey NurseSharks were quantified at intervals of 3 months. The visual surveys were done over a 4 weekperiod to allow for inclement sea conditions (i.e. rough seas, moderate swell, strong currents, etc.)that occur at varying times along different stretches of the south-east Australian coast (Trenamenand Short 1987). At each site, scuba divers swam for a 15 minute period in or around habitats (e.g.gutters, caves and overhangs – Pollard et al. 1996; Otway and Parker 1999, 2000) known in thepast to have been occupied by Grey Nurse Sharks. Within each 15 minute period, the diversrecorded the total number of sharks present, estimated the total lengths (TL) of the sharks in 3 size-classes: 1 - 2 m, 2 - 3 m and > 3 m, and identified the sex of each individual. When sex could notbe determined, the individual shark was simply recorded as “sex unknown”. In addition, scubadivers noted the presence of mating scars, fishing gear (hooks, wire traces, line, etc.), and recordedthe bottom water temperature to the nearest 1° C.
Some sites were relatively close to each other (i.e. < 2 km apart) and this raised the possibility thatsome movement between sites might have occurred during the survey period (i.e. 4 weeks).Unfortunately, as there is little information on the localised or coastwide patterns of movement ofGrey Nurse Sharks along the east coast (Otway and Parker 1999, 2000), we assumed that there wasno movement among sites within each 4-week survey. This means that some sharks may havebeen counted twice within any given survey. Consequently, the total number of Grey Nurse Sharks
NSW Fisheries 19
EA Project No. 22499 Grey Nurse Sharks, Otway and Morrison
NSW
150º E 151º E 152º E 153º E 154º E 155º E
29º S
30º S
31º S
32º S
33º S
34º S
35º S
36º S
37º S
28º S
VIC
QLD
NSW
0 100 kmScale
Tweed-MoretonBioregion
Manning ShelfBioregion
Hawkesbury ShelfBioregion
Batemans ShelfBioregion
Twofold ShelfBioregion
Stradbroke Island (1 site)
Tweed Heads (4 sites)
Byron Bay (5 sites)
Brooms Head (1 site)North Solitary Islands (6 sites)
South Solitary Islands (3 sites)
South West Rocks (4 sites)
Laurieton (2 sites)
Forster (3 sites)Seal Rocks (5 sites)
Port Stephens (3 sites)Newcastle (1 site)
Terrigal (2 sites)
Wollongong (1 site)Shellharbour (5 sites)
Jervis Bay (11 sites)
Ulladulla (4 sites)
Batemans Bay (3 sites)
Narooma (3 sites)
Eden (2 sites)
Figure 4.1. Map showing the locations sampled by the scuba diving community in cooperationwith NSW Fisheries over four week periods from November/December 1998 toMarch/April 2001.
20 NSW Fisheries
EA Project No. 22499 Grey Nurse Sharks, Otway and Morrison
recorded in any given survey represents the maximum number seen, and this may be anoverestimate.
NSW Fisheries and some dive groups did repetitive sampling through time at several of the sites.The data obtained enabled: (1) a comparison of the estimates of abundance and size-structurebetween dive-groups (i.e. a "quality control" check – estimates did not differ), and (2) an indicationof short-term temporal changes in the populations of Grey Nurse Sharks at particular sites.
4.2.2. Statistical analyses
4.2.2.1. Spatial and temporal variation in abundance
The previous study by Otway & Parker (2000) analysed the abundances of sharks on 2 spatialscales: (1) along the entire coast, and (2) in northern and southern sections of the coast. Temporalchanges in the abundances of male, female and the total number of Grey Nurse Sharks were alsoexamined at these two spatial scales using t-tests and univariate analyses of variance with Type Ierror-rates of α = 0.05. Comparisons of the annual mean number of all, male and female GreyNurse Sharks in years 1 and 2 were done by using the pooled number of sharks in the relevantcoastal region in each of the 4 surveys as replicate estimates of the sampled population in a year.Variation in the annual mean abundance of sharks along the entire coast was analysed using t-tests.Fluctuations in the annual mean abundances of sharks in the northern and southern sections of thecoast were analysed using a 2-factor analysis of variance with “Years” and “Coastal Section”considered as fixed factors. Prior to analysis, individual cell variances were examined forheteroscedasticity using Cochran's test (Winer et al., 1991). When variances were heterogeneous,data were transformed using procedures specified by Scheffé (1959) and Underwood (1981, 1997).
4.2.2.2. Population size-structure and segregation by size and sex
The size-structure of the Grey Nurse Shark population along the entire coast and at the 21 locationswere plotted for the 3 size-classes: 1 - 2 m, 2 - 3 m and > 3 m. Possible biases in sex-ratios andspatial and temporal differences in population size-structure were examined using χ2 analyses withType I error-rates of α = 0.05. Prior to analysis, the length-frequency data for males and femaleswere re-partitioned into 2 size-classes: (1) < 2 m TL and (2) ≥ 2 m TL because previousreproductive studies (e.g. Bass et al. 1975; Gilmore et al. 1983; Branstetter and Musick 1994) haveshown that male and female Grey Nurse Sharks attain sexual maturity at 1.90 - 1.95 TL and 2.20 -2.30 m TL, respectively. By so doing, the data were partitioned into approximate groupings ofnon-reproductive and reproductive individuals. However, it is important to note that some of thesmallest females in the second size-class (i.e. sharks > 2 m TL) may not have been sexually mature.
Results of the first 3 surveys (Otway & Parker 2000) clearly showed that male and female GreyNurse Sharks were segregated by size and sex along 2 sections of the coast from (1) Forster andsites to the north, and (2) Seal Rocks and sites to the south. Consequently, the length-frequencydata were also re-partitioned in the same manner. Temporal changes in the proportions of male andfemale Grey Nurse Sharks, irrespective of size and in the < 2 m TL and ≥ 2 m TL size classes, wereexamined over the entire coast and at the smaller spatial scale (i.e. between the northern andsouthern sections of the coast).
4.2.2.3. Incidence of hooking
Grey Nurse Sharks with hooks embedded in their jaws and/or buccal cavity were observed alongthe entire coast from North Stradbroke Island (Qld) to Montague Island. These observationsindicated that the hooking occurred with fishing gear comprising either: (1) a hook attached to
NSW Fisheries 21
EA Project No. 22499 Grey Nurse Sharks, Otway and Morrison
nylon line or (2) a hook attached to wire trace. Consequently, the data were first examined usingthe hooking incidence of both fishing gear combined. Then, the data were partitioned into these 2types of gear. Prior to analysis, repetitive observations of the same shark at any given site wereremoved from the dataset. Estimates of the incidence of hooking were calculated as the number ofsharks with hooks embedded in their jaws (and/or buccal cavity) divided by the total number ofindividuals per survey. This value was then expressed as a percentage. Data on hooking incidencewere analysed in a number of ways. Firstly, the proportions of Grey Nurse Sharks with andwithout fishing gear were analysed using contingency tests. Secondly, the results from each of the4 surveys in 1999 and 2000 were used as replicates to calculate an annual mean incidence ofhooking and analysed using single and two-factor analyses of variance. Lastly, the data on hookingincidence from this study and that of Pollard et al. (1996) and Parker (unpubl.) were regressed ontime to examine whether there was a significant trend (increasing or decreasing) in the incidence ofhooking.
4.2.2.4. Identification of key sites (Critical Habitat)
The results of the first 3 surveys (Otway & Parker 2000) showed that the Grey Nurse Sharks werefound in aggregations of 5 or more individuals at 14 sites along the entire coast. However, it wasnot clear whether the aggregation sites identified in the first 3 surveys would be used consistentlyby Grey Nurse Sharks over longer periods of time (i.e. over several years), especially given theirlikely migratory movements along the coast. To examine whether the aggregation sites were usedover longer periods of time, the abundance data were analysed in several steps. Firstly, thenumbers of Grey Nurse Sharks observed at each of these sites during the first survey werecalculated as percentages of the total number of sharks observed in the first survey. Secondly, thisprocess was repeated for the other 9 surveys. Thirdly, the percentages at each site were averagedover the 10 surveys providing mean values for each site. Finally, these means were summed toestimate the percentage of the total Grey Nurse Shark population observed at these aggregationsites averaged over the 10 surveys (i.e. 2.5 years).
It is important to note that the above analysis does not identify whether the aggregations occurconsistently through time at the same sites. To estimate the degree of consistency through time, thenumber of times an aggregation of Grey Nurse Sharks (i.e. 5 or more individuals) was present at agiven site was expressed as a percentage of the number times the site was sampled. Thispercentage was then calculated for each of the sites where Grey Nurse Sharks aggregated.
4.3. Results
4.3.1. Patterns of abundance
As a direct result of the scuba diving community’s continued involvement, it was possible tosample the entire NSW coast from Eden to Tweed Heads and into southern Queensland (i.e. NorthStradbroke Island) on a further 7 occasions (3 more than required under the study’s objectives).The number of sites sampled in any single survey (Table 4.1) varied because of the prevailing sea-conditions (e.g. rough seas, moderate – heavy swell, currents and poor visibility due to floods innorthern NSW) all of which varied greatly in space and time over the 2.5 year period. Despite this,an average of 57 sites were sampled along the entire coast from November/December 1998 toMarch/April 2001 (Table 4.1, surveys 1-10).
The total numbers of Grey Nurse Sharks observed also varied among surveys (Table 4.1) with amaximum of 292 individuals being seen in May/June 2000 (survey 7). Some sites were occupiedby relatively large numbers of Grey Nurse Sharks, whereas others had none. Moreover, almost64% of the sites sampled, averaged across the 10 surveys, had no Grey Nurse Sharks present.
22 NSW Fisheries
EA Project No. 22499 Grey Nurse Sharks, Otway and Morrison
Finally, the proportions of sites with and without Grey Nurse Sharks also varied significantlyamong surveys (Table 4.1, χ2 = 20.10, P < 0.05). A significantly greater proportion of sites wereoccupied by Grey Nurse Sharks in winter 1999 and 2000 (Table 4.1, surveys 3 & 7). Furthermore,there were proportionally fewer sites occupied in autumn 2000 (Table 4.1, survey 6).
Table 4.1. Summary of the abundances of Grey Nurse Sharks sampled over two years at sitesalong the entire NSW coast from 1998 to 2001. Data for surveys 1-3 are from Otwayand Parker (2000).
SurveyNumber
Date Totalnumber ofsharks seen
Number ofsitessampled
Number(%) of siteswith nosharkspresent
Sex Ratio(M : F)
1 Nov / Dec 1998 136 61 37 (61) 1 : 2.22 Mar / Apr 1999 129 51 35 (69) 1 : 3.63 Jun / Jul 1999 207 50 25 (50) 1 : 0.94 Aug / Sep 1999 187 44 24 (55) 1 : 4.15 Nov / Dec 1999 132 58 36 (62) 1 : 1.86 Mar / Apr 2000 149 64 49 (77) 1 : 1.97 May / Jun 2000 292 62 31 (50) 1 : 1.18 Aug / Sep 2000 146 57 39 (68) 1 : 2.59 Nov / Dec 2000 120 63 46 (73) 1 : 2.510 Mar / Apr 2001 166 48 34 (71) 1 : 2.1
The abundances of Grey Nurse Sharks along the entire coast (i.e. at a large spatial scale) variedover the 4 surveys within the first year with the largest numbers (i.e. 207 individuals) occurring inwinter, 1999 (Table 4.1, survey 3). A similar pattern was repeated in the second year with amaximal number of 292 individuals observed in winter (Table 4.1, survey 7). As stated earlier, it isimportant to note that the number of sites sampled in any single survey varied because of seaconditions. Consequently, the total abundances of Grey Nurse Sharks were expressed asnumbers/site. Irrespective of the adjustment for differential sampling effort across surveys, thetotal numbers of sharks was still at or near maximum over the winter period in both years (Fig.4.2). The increases in Grey Nurse Shark numbers during winter periods was most likely caused bythe influx of males (see below and Fig. 4.3). Moreover, using the numbers of sites sampled in eachof the 4 surveys/year as replicates, the mean number of sites sampled per survey was greater in year2 (60.25 sites/survey) compared to year 1 (50.50 sites/survey). However, the mean number ofsites/survey did not differ significantly between years (t = 2.25, P > 0.05).
The annual mean abundance of all Grey Nurse Sharks (males, females, and those of unknown sex)along the entire coast did not differ significantly between years (Table 4.2, P > 0.05). Moreover,the annual mean abundances of all Grey Nurse Sharks did not differ significantly between coastalsections and years (Table 4.3a, P > 0.05), but there was a pronounced trend towards greaterabundances of sharks in the northern section (Table 4.3b).
The annual mean abundance of male Grey Nurse Sharks along the entire coast did not differsignificantly between years (Table 4.2, P > 0.05). However, the annual mean number of male GreyNurse Sharks differed significantly between coastal sections, but not between years (Table 4.3a, P< 0.05 and P > 0.05, respectively). Significantly more male sharks were observed in the northernsection (Table 4.3b).
NSW Fisheries 23
EA Project No. 22499 Grey Nurse Sharks, Otway and Morrison
The annual mean abundance of female Grey Nurse Sharks along the entire coast did not differsignificantly between years (Table 4.2, P > 0.05). The annual mean abundances of female GreyNurse Sharks did not differ significantly between coastal sections or years (Table 4.3, P > 0.05).
0
1
2
3
4
5
D-99 M-99 J-99 S-99 D-99 M-00 J-00 S-00 D-00 M-01
Time
Num
ber o
f Sha
rks
per S
ite
Figure 4.2. Number of Grey Nurse Sharks over 10 surveys from November/December 1998 toMarch/April 2001.
0
20
40
60
80
100
120
140
D-98 M-99 J-99 S-99 D-99 M-00 J-00 S-00 D-00 M-01
MaleFemaleUnknown Sex
Figure 4.3. Long-term fluctuations in the total number of Grey Nurse Sharks categorised by sex,along the entire NSW and southern QLD coasts from November/December 1998 toMarch/April 2001.
Tota
l Num
ber
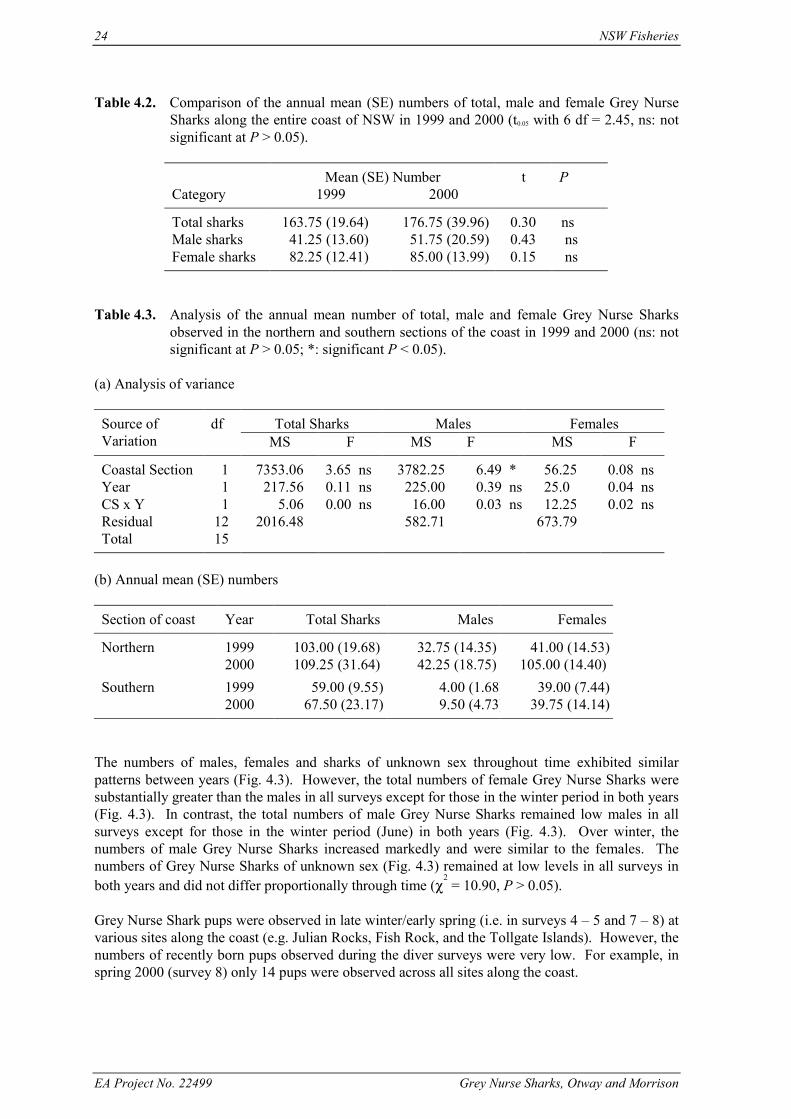
24 NSW Fisheries
EA Project No. 22499 Grey Nurse Sharks, Otway and Morrison
Table 4.2. Comparison of the annual mean (SE) numbers of total, male and female Grey NurseSharks along the entire coast of NSW in 1999 and 2000 (t0.05 with 6 df = 2.45, ns: notsignificant at P > 0.05).
Mean (SE) Number t PCategory 1999 2000
Total sharks 163.75 (19.64) 176.75 (39.96) 0.30 nsMale sharks 41.25 (13.60) 51.75 (20.59) 0.43 nsFemale sharks 82.25 (12.41) 85.00 (13.99) 0.15 ns
Table 4.3. Analysis of the annual mean number of total, male and female Grey Nurse Sharksobserved in the northern and southern sections of the coast in 1999 and 2000 (ns: notsignificant at P > 0.05; *: significant P < 0.05).
(a) Analysis of variance
Total Sharks Males FemalesSource ofVariation
dfMS F MS F MS F
Coastal Section 1 7353.06 3.65 ns 3782.25 6.49 * 56.25 0.08 nsYear 1 217.56 0.11 ns 225.00 0.39 ns 25.0 0.04 nsCS x Y 1 5.06 0.00 ns 16.00 0.03 ns 12.25 0.02 nsResidual 12 2016.48 582.71 673.79Total 15
(b) Annual mean (SE) numbers
Section of coast Year Total Sharks Males Females
Northern 1999 103.00 (19.68) 32.75 (14.35) 41.00 (14.53)2000 109.25 (31.64) 42.25 (18.75) 105.00 (14.40)
Southern 1999 59.00 (9.55) 4.00 (1.68) 39.00 (7.44)2000 67.50 (23.17) 9.50 (4.73) 39.75 (14.14)
The numbers of males, females and sharks of unknown sex throughout time exhibited similarpatterns between years (Fig. 4.3). However, the total numbers of female Grey Nurse Sharks weresubstantially greater than the males in all surveys except for those in the winter period in both years(Fig. 4.3). In contrast, the total numbers of male Grey Nurse Sharks remained low males in allsurveys except for those in the winter period (June) in both years (Fig. 4.3). Over winter, thenumbers of male Grey Nurse Sharks increased markedly and were similar to the females. Thenumbers of Grey Nurse Sharks of unknown sex (Fig. 4.3) remained at low levels in all surveys inboth years and did not differ proportionally through time (χ
2 = 10.90, P > 0.05).
Grey Nurse Shark pups were observed in late winter/early spring (i.e. in surveys 4 – 5 and 7 – 8) atvarious sites along the coast (e.g. Julian Rocks, Fish Rock, and the Tollgate Islands). However, thenumbers of recently born pups observed during the diver surveys were very low. For example, inspring 2000 (survey 8) only 14 pups were observed across all sites along the coast.
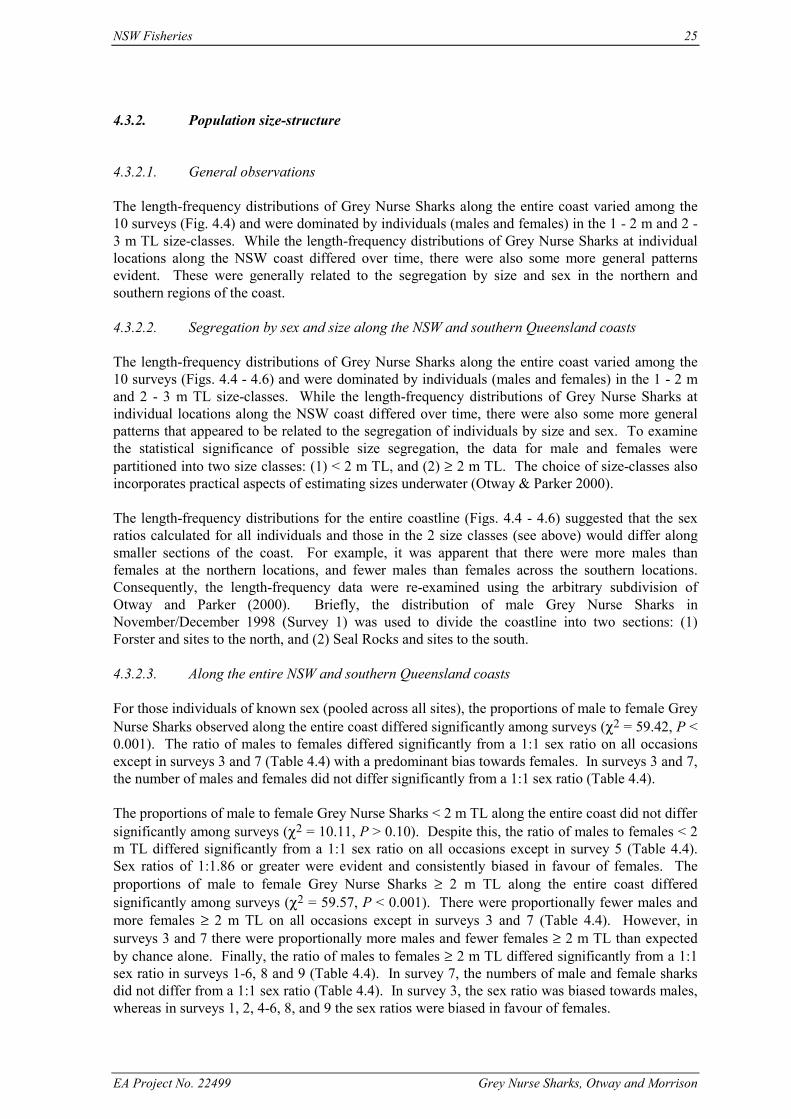
NSW Fisheries 25
EA Project No. 22499 Grey Nurse Sharks, Otway and Morrison
4.3.2. Population size-structure
4.3.2.1. General observations
The length-frequency distributions of Grey Nurse Sharks along the entire coast varied among the10 surveys (Fig. 4.4) and were dominated by individuals (males and females) in the 1 - 2 m and 2 -3 m TL size-classes. While the length-frequency distributions of Grey Nurse Sharks at individuallocations along the NSW coast differed over time, there were also some more general patternsevident. These were generally related to the segregation by size and sex in the northern andsouthern regions of the coast.
4.3.2.2. Segregation by sex and size along the NSW and southern Queensland coasts
The length-frequency distributions of Grey Nurse Sharks along the entire coast varied among the10 surveys (Figs. 4.4 - 4.6) and were dominated by individuals (males and females) in the 1 - 2 mand 2 - 3 m TL size-classes. While the length-frequency distributions of Grey Nurse Sharks atindividual locations along the NSW coast differed over time, there were also some more generalpatterns that appeared to be related to the segregation of individuals by size and sex. To examinethe statistical significance of possible size segregation, the data for male and females werepartitioned into two size classes: (1) < 2 m TL, and (2) ≥ 2 m TL. The choice of size-classes alsoincorporates practical aspects of estimating sizes underwater (Otway & Parker 2000).
The length-frequency distributions for the entire coastline (Figs. 4.4 - 4.6) suggested that the sexratios calculated for all individuals and those in the 2 size classes (see above) would differ alongsmaller sections of the coast. For example, it was apparent that there were more males thanfemales at the northern locations, and fewer males than females across the southern locations.Consequently, the length-frequency data were re-examined using the arbitrary subdivision ofOtway and Parker (2000). Briefly, the distribution of male Grey Nurse Sharks inNovember/December 1998 (Survey 1) was used to divide the coastline into two sections: (1)Forster and sites to the north, and (2) Seal Rocks and sites to the south.
4.3.2.3. Along the entire NSW and southern Queensland coasts
For those individuals of known sex (pooled across all sites), the proportions of male to female GreyNurse Sharks observed along the entire coast differed significantly among surveys (χ2 = 59.42, P <0.001). The ratio of males to females differed significantly from a 1:1 sex ratio on all occasionsexcept in surveys 3 and 7 (Table 4.4) with a predominant bias towards females. In surveys 3 and 7,the number of males and females did not differ significantly from a 1:1 sex ratio (Table 4.4).
The proportions of male to female Grey Nurse Sharks < 2 m TL along the entire coast did not differsignificantly among surveys (χ2 = 10.11, P > 0.10). Despite this, the ratio of males to females < 2m TL differed significantly from a 1:1 sex ratio on all occasions except in survey 5 (Table 4.4).Sex ratios of 1:1.86 or greater were evident and consistently biased in favour of females. Theproportions of male to female Grey Nurse Sharks ≥ 2 m TL along the entire coast differedsignificantly among surveys (χ2 = 59.57, P < 0.001). There were proportionally fewer males andmore females ≥ 2 m TL on all occasions except in surveys 3 and 7 (Table 4.4). However, insurveys 3 and 7 there were proportionally more males and fewer females ≥ 2 m TL than expectedby chance alone. Finally, the ratio of males to females ≥ 2 m TL differed significantly from a 1:1sex ratio in surveys 1-6, 8 and 9 (Table 4.4). In survey 7, the numbers of male and female sharksdid not differ from a 1:1 sex ratio (Table 4.4). In survey 3, the sex ratio was biased towards males,whereas in surveys 1, 2, 4-6, 8, and 9 the sex ratios were biased in favour of females.
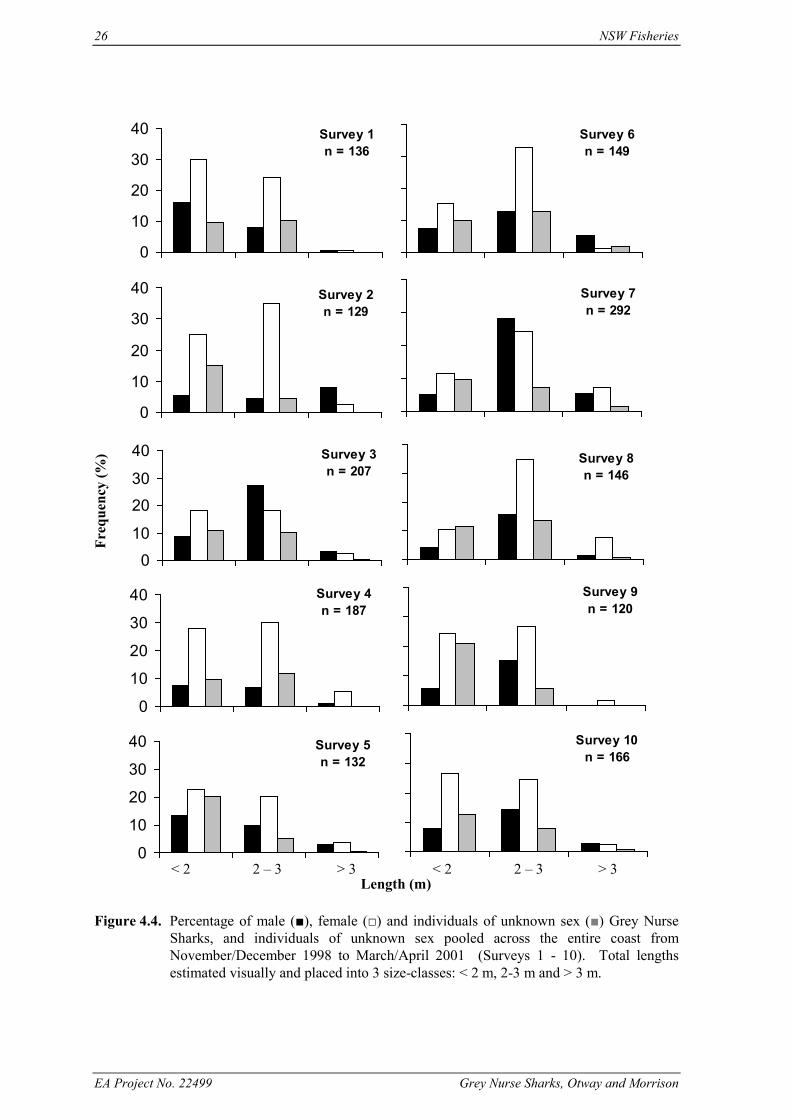
26 NSW Fisheries
EA Project No. 22499 Grey Nurse Sharks, Otway and Morrison
Survey 1n = 136
0
10
20
30
40 Survey 6n = 149
Survey 2n = 129
0
10
20
30
40 Survey 7n = 292
Survey 3n = 207
010
2030
40 Survey 8n = 146
Survey 4n = 187
0
10
20
30
40 Survey 9n = 120
Survey 5n = 132
0
10
20
30
40 Survey 10n = 166
Figure 4.4. Percentage of male (■), female (□) and individuals of unknown sex (■) Grey NurseSharks, and individuals of unknown sex pooled across the entire coast fromNovember/December 1998 to March/April 2001 (Surveys 1 - 10). Total lengthsestimated visually and placed into 3 size-classes: < 2 m, 2-3 m and > 3 m.
< 2 2 – 3 > 3 < 2 2 – 3 > 3Length (m)
Freq
uenc
y (%
)
NSW Fisheries 27
EA Project No. 22499 Grey Nurse Sharks, Otway and Morrison
Survey 1 Northn = 72
0
20
40
60
80 Survey 1 Southn = 64
Survey 2 Northn = 48
0
20
40
60
80 Survey 2 Southn = 64
Survey 3 Northn = 134
0
20
40
60
80 Survey 3 Southn = 70
Survey 4 Northn = 134
0
20
40
60
80 Survey 4 Southn = 53
Survey 5 Northn = 78
0
20
40
60
80 Survey 5 Southn = 54
Figure 4.5. Percentage of male (■), female (□) and individuals of unknown sex (■) Grey NurseSharks observed along the 2 sections of the coast: (1) Forster and sites north, and (2)Seal Rocks and sites south from November/December 1998 to November/December1999 (Surveys 1 - 5).
< 2 2 – 3 > 3 < 2 2 – 3 > 3
Freq
uenc
y (%
)
Length (m)
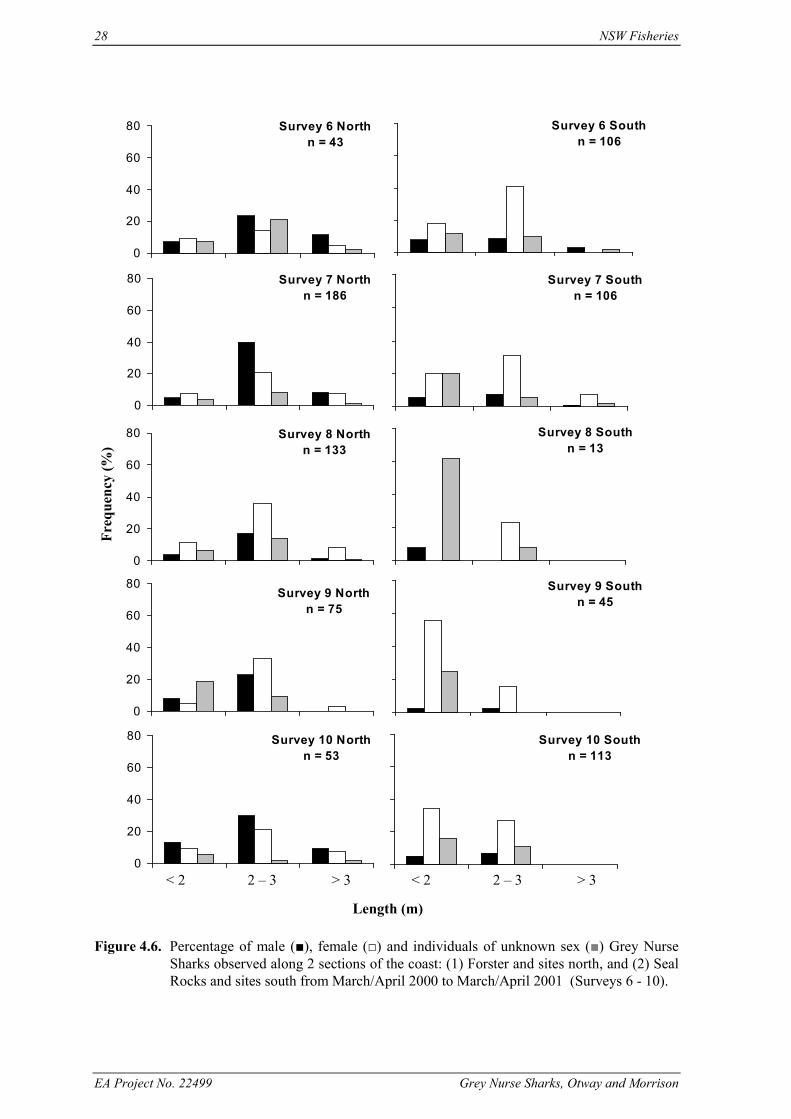
28 NSW Fisheries
EA Project No. 22499 Grey Nurse Sharks, Otway and Morrison
Survey 6 Northn = 43
0
20
40
60
80 Survey 6 Southn = 106
Survey 7 Northn = 186
0
20
40
60
80 Survey 7 Southn = 106
Survey 8 Northn = 133
0
20
40
60
80 Survey 8 Southn = 13
Survey 9 Northn = 75
0
20
40
60
80 Survey 9 Southn = 45
Survey 10 Northn = 53
0
20
40
60
80 Survey 10 Southn = 113
Figure 4.6. Percentage of male (■), female (□) and individuals of unknown sex (■) Grey NurseSharks observed along 2 sections of the coast: (1) Forster and sites north, and (2) SealRocks and sites south from March/April 2000 to March/April 2001 (Surveys 6 - 10).
< 2 2 – 3 > 3 < 2 2 – 3 > 3
Freq
uenc
y (%
)
Length (m)
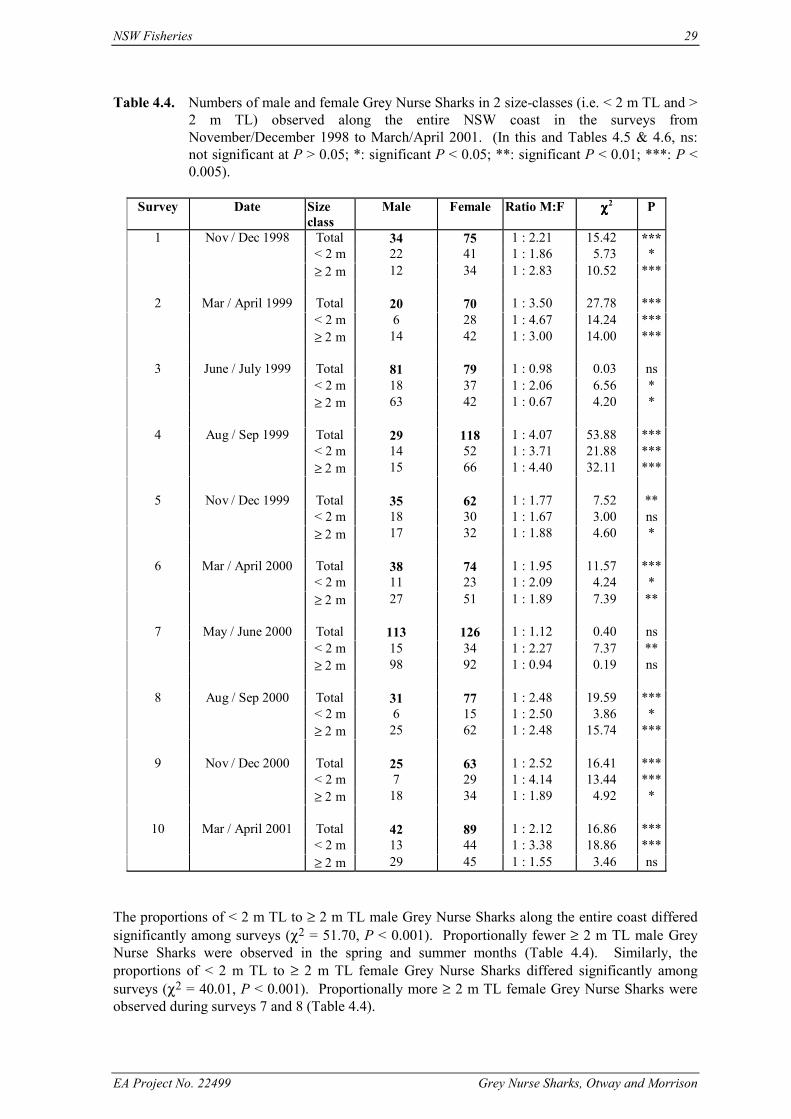
NSW Fisheries 29
EA Project No. 22499 Grey Nurse Sharks, Otway and Morrison
Table 4.4. Numbers of male and female Grey Nurse Sharks in 2 size-classes (i.e. < 2 m TL and >2 m TL) observed along the entire NSW coast in the surveys fromNovember/December 1998 to March/April 2001. (In this and Tables 4.5 & 4.6, ns:not significant at P > 0.05; *: significant P < 0.05; **: significant P < 0.01; ***: P <0.005).
Survey Date Sizeclass
Male Female Ratio M:F χχχχ2 P
1 Nov / Dec 1998 Total 34 75 1 : 2.21 15.42 ***< 2 m 22 41 1 : 1.86 5.73 *≥ 2 m 12 34 1 : 2.83 10.52 ***
2 Mar / April 1999 Total 20 70 1 : 3.50 27.78 ***< 2 m 6 28 1 : 4.67 14.24 ***≥ 2 m 14 42 1 : 3.00 14.00 ***
3 June / July 1999 Total 81 79 1 : 0.98 0.03 ns< 2 m 18 37 1 : 2.06 6.56 *≥ 2 m 63 42 1 : 0.67 4.20 *
4 Aug / Sep 1999 Total 29 118 1 : 4.07 53.88 ***< 2 m 14 52 1 : 3.71 21.88 ***≥ 2 m 15 66 1 : 4.40 32.11 ***
5 Nov / Dec 1999 Total 35 62 1 : 1.77 7.52 **< 2 m 18 30 1 : 1.67 3.00 ns≥ 2 m 17 32 1 : 1.88 4.60 *
6 Mar / April 2000 Total 38 74 1 : 1.95 11.57 ***< 2 m 11 23 1 : 2.09 4.24 *≥ 2 m 27 51 1 : 1.89 7.39 **
7 May / June 2000 Total 113 126 1 : 1.12 0.40 ns< 2 m 15 34 1 : 2.27 7.37 **≥ 2 m 98 92 1 : 0.94 0.19 ns
8 Aug / Sep 2000 Total 31 77 1 : 2.48 19.59 ***< 2 m 6 15 1 : 2.50 3.86 *≥ 2 m 25 62 1 : 2.48 15.74 ***
9 Nov / Dec 2000 Total 25 63 1 : 2.52 16.41 ***< 2 m 7 29 1 : 4.14 13.44 ***≥ 2 m 18 34 1 : 1.89 4.92 *
10 Mar / April 2001 Total 42 89 1 : 2.12 16.86 ***< 2 m 13 44 1 : 3.38 18.86 ***≥ 2 m 29 45 1 : 1.55 3.46 ns
The proportions of < 2 m TL to ≥ 2 m TL male Grey Nurse Sharks along the entire coast differedsignificantly among surveys (χ2 = 51.70, P < 0.001). Proportionally fewer ≥ 2 m TL male GreyNurse Sharks were observed in the spring and summer months (Table 4.4). Similarly, theproportions of < 2 m TL to ≥ 2 m TL female Grey Nurse Sharks differed significantly amongsurveys (χ2 = 40.01, P < 0.001). Proportionally more ≥ 2 m TL female Grey Nurse Sharks wereobserved during surveys 7 and 8 (Table 4.4).
30 NSW Fisheries
EA Project No. 22499 Grey Nurse Sharks, Otway and Morrison
4.3.2.4. Comparisons between sections of the coast
The proportions of all male Grey Nurse Sharks present at sites in the 2 coastal sections (i.e. atForster and sites to the north versus Seal Rocks and sites to the south) differed significantly amongsurveys (χ2 = 65.94, P < 0.001). There were proportionally fewer males in the southern coastalsection than would be expected by chance alone on all occasions except in surveys 2, 5 and 7(Tables 4.5 & 4.6). The proportions of all female Grey Nurse Sharks in the 2 coastal sections alsodiffered significantly among surveys (Tables 4.2 - 4.3 and χ2 = 65.94, P < 0.001). There wereproportionally more females in the northern coastal section in the late winter and spring months(Table 4.5, surveys 4 & 8). In contrast, there were proportionally more females in the southerncoastal section in the summer and autumn months (Table 4.6, surveys 1, 2, 5, 6 & 10).
The proportions of male Grey Nurse Sharks < 2 m TL in the 2 coastal sections differedsignificantly among surveys (χ2 = 27.11, P < 0.001). There were proportionally more < 2 m TLmales in the northern coastal section than would be expected by chance alone in surveys 1 and 4(Table 4.5). Similarly, the proportions of female Grey Nurse Sharks < 2 m TL present at Forsterand sites to the north compared to Seal Rocks and sites to the south differed significantly amongsurveys (χ2 = 75.07, P < 0.001). There were proportionally more females in the southern coastalsection than would be expected by chance alone in 7 of the 10 surveys (Table 4.6, surveys 2, 3, 5, 6& 8 - 10).
The proportions of male Grey Nurse Sharks ≥ 2 m TL along the 2 sections of the coast differedsignificantly among surveys (χ2 = 49.45, P < 0.001). Proportionally fewer males ≥ 2 m TLoccurred in the northern coastal section in surveys 6 and 10 (Table 4.5). In contrast, proportionallymore males ≥ 2 m TL occurred in the southern coastal section in surveys 6 and 10 (Table 4.6). Theproportions of female ≥ 2 m TL Grey Nurse Sharks present in the 2 coastal sections also differedsignificantly among surveys (Table 4.6 and χ2 = 127.18, P < 0.001). There were proportionallyfewer females ≥ 2 m TL in the northern coastal section in the autumn months (Table 4.6, surveys 2,6 & 10). In contrast, there were proportionally more females ≥ 2 m TL in the southern coastalsection in the spring/summer months (Table 4.6, surveys 4, 8 & 9).
4.3.2.5. Comparisons within each coastal section
(1) Forster and sites to the northThe proportions of male to female Grey Nurse Sharks differed significantly among surveys (χ2 =65.45, P < 0.001). There were proportionally more males in the winter periods (Table 4.5, surveys3 & 7) and proportionally more females in the late winter/early spring months (Table 4.5, surveys 4& 8). The ratio of males to females also differed significantly from a 1:1 sex ratio among surveys(Table 4.5). However, these differences were restricted to 4 of the 10 surveys. There was asignificant bias towards males in the winter periods (Table 4.5, surveys 3 & 7) and a contrastingbias towards females in the late winter/spring months (Table 4.5, surveys 4 & 8).
The proportions of male to female Grey Nurse Sharks < 2 m TL did not differ significantly amongsurveys (χ2 = 11.56, P > 0.10). In contrast, the proportions of male to female Grey Nurse Sharks ≥2 m TL differed significantly among surveys (χ2 = 72.89, P < 0.001). There were proportionallymore males ≥ 2 m TL observed in the winter periods (Table 4.5, surveys 3 & 7) and proportionallymore females in the late winter/early spring months (Table 4.5, surveys 4 & 8). Moreover, theseresults were also reflected in sex ratios. However, the ratios of males to females < 2 m TL onlydiffered significantly from a 1:1 sex ratio in survey 8 when there was there was a strong biastowards females (Table 4.5). The ratio of males to females ≥ 2 m TL also differed significantlyfrom a 1:1 sex ratio among surveys (Table 4.5). There was a significant bias towards males in thelate autumn/ early winter months (Table 4.5, surveys 3 & 7) and a contrasting bias towards femalesin the late winter/early spring months (Table 4.5, surveys 4 & 8).
NSW Fisheries 31
EA Project No. 22499 Grey Nurse Sharks, Otway and Morrison
The proportions of male Grey Nurse Sharks < 2 m TL to ≥ 2 m TL differed significantly among the10 surveys (χ2 = 56.41, P < 0.001). There were proportionally more < 2 m TL and fewer ≥ 2 m TLmales over the spring/summer months in 1998 and 1999 (Table 4.5). There were alsoproportionally fewer < 2 m TL and more ≥ 2 m TL males in the winter months in 1999 and 2000(Table 4.5). The proportions of female Grey Nurse Sharks < 2 m TL to ≥ 2 m TL also differedsignificantly among the 10 surveys (χ2 = 35.51, P < 0.001). There were proportionally more < 2 mTL and fewer ≥ 2 m TL females in surveys 1, 3 and 5 (Table 4.5). In contrast, there wereproportionally fewer < 2 m TL and more ≥ 2 m TL females in surveys 7 - 9 (Table 4.5).
(2) Seal Rocks and sites to the southThe proportions of male to female Grey Nurse Sharks differed significantly among surveys (χ2 =31.20, P < 0.001). There were no males observed in survey 4 and proportionally fewer males andmore females in surveys 1, 2 and 9 (Table 4.3). Furthermore, there were proportionally more malesand fewer females in surveys 5 – 7 (Table 4.6). The ratio of males to females also differedsignificantly from a 1:1 sex ratio on all occasions except survey 8 (Table 4.6). Sex ratios of 1:3.00or greater were evident and consistently biased in favour of females.
The proportions of male to female Grey Nurse Sharks < 2 m TL differed significantly amongsurveys (χ2 = 31.86, P < 0.001). There were proportionally fewer males and more females < 2 mTL in surveys 1, 4 and 9 (Table 4.6). Furthermore, there were proportionally more males andfewer females < 2 m TL in surveys 5 – 7 (Table 4.6). In contrast, the proportions of males tofemales ≥ 2 m TL did not differ significantly among the 10 surveys (χ2 = 14.65, P > 0.10). The sexratios of Grey Nurse Sharks also exhibited marked differences from a 1:1 sex ratio. The ratio ofmales to females < 2 m TL was significantly biased in favour of females on all occasions exceptsurveys 5 and 8 (Table 4.6). This bias was even more pronounced for the female sharks ≥ 2 m TL.Their sex ratios were significantly biased in favour of females in all 10 surveys (Table 4.3).
The proportions of male Grey Nurse Sharks < 2 m TL to > 2 m TL did not differ significantlyamong the 10 surveys (χ2 = 8.08, P > 0.10). However, the proportions of female Grey NurseSharks < 2 m TL to > 2 m TL differed significantly among the 10 surveys (χ2 = 39.75, P < 0.001).There were proportionally more < 2 m TL and fewer ≥ 2 m TL females in surveys 4 and 9 (Table4.6). Moreover, there were proportionally fewer < 2 m TL and more ≥ 2 m TL females in surveys6 - 8 (Table 4.6).
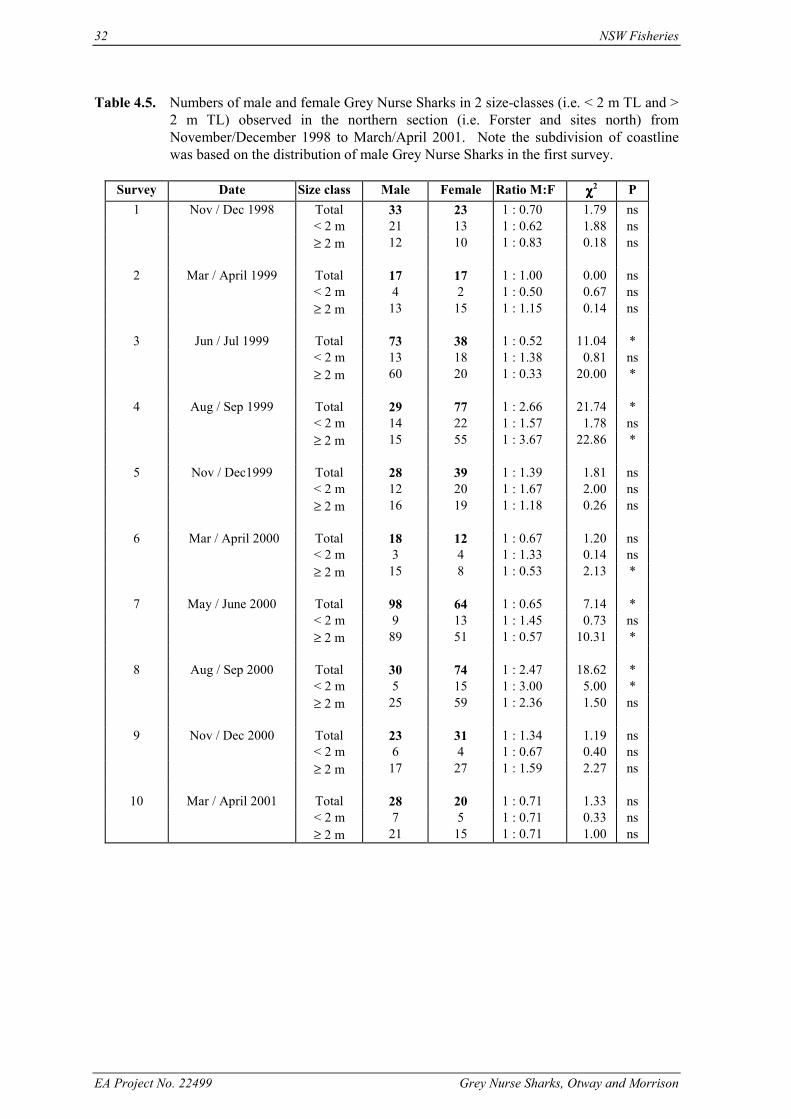
32 NSW Fisheries
EA Project No. 22499 Grey Nurse Sharks, Otway and Morrison
Table 4.5. Numbers of male and female Grey Nurse Sharks in 2 size-classes (i.e. < 2 m TL and >2 m TL) observed in the northern section (i.e. Forster and sites north) fromNovember/December 1998 to March/April 2001. Note the subdivision of coastlinewas based on the distribution of male Grey Nurse Sharks in the first survey.
Survey Date Size class Male Female Ratio M:F χχχχ2 P1 Nov / Dec 1998 Total 33 23 1 : 0.70 1.79 ns
< 2 m 21 13 1 : 0.62 1.88 ns≥ 2 m 12 10 1 : 0.83 0.18 ns
2 Mar / April 1999 Total 17 17 1 : 1.00 0.00 ns< 2 m 4 2 1 : 0.50 0.67 ns≥ 2 m 13 15 1 : 1.15 0.14 ns
3 Jun / Jul 1999 Total 73 38 1 : 0.52 11.04 *< 2 m 13 18 1 : 1.38 0.81 ns≥ 2 m 60 20 1 : 0.33 20.00 *
4 Aug / Sep 1999 Total 29 77 1 : 2.66 21.74 *< 2 m 14 22 1 : 1.57 1.78 ns≥ 2 m 15 55 1 : 3.67 22.86 *
5 Nov / Dec1999 Total 28 39 1 : 1.39 1.81 ns< 2 m 12 20 1 : 1.67 2.00 ns≥ 2 m 16 19 1 : 1.18 0.26 ns
6 Mar / April 2000 Total 18 12 1 : 0.67 1.20 ns< 2 m 3 4 1 : 1.33 0.14 ns≥ 2 m 15 8 1 : 0.53 2.13 *
7 May / June 2000 Total 98 64 1 : 0.65 7.14 *< 2 m 9 13 1 : 1.45 0.73 ns≥ 2 m 89 51 1 : 0.57 10.31 *
8 Aug / Sep 2000 Total 30 74 1 : 2.47 18.62 *< 2 m 5 15 1 : 3.00 5.00 *≥ 2 m 25 59 1 : 2.36 1.50 ns
9 Nov / Dec 2000 Total 23 31 1 : 1.34 1.19 ns< 2 m 6 4 1 : 0.67 0.40 ns≥ 2 m 17 27 1 : 1.59 2.27 ns
10 Mar / April 2001 Total 28 20 1 : 0.71 1.33 ns< 2 m 7 5 1 : 0.71 0.33 ns≥ 2 m 21 15 1 : 0.71 1.00 ns
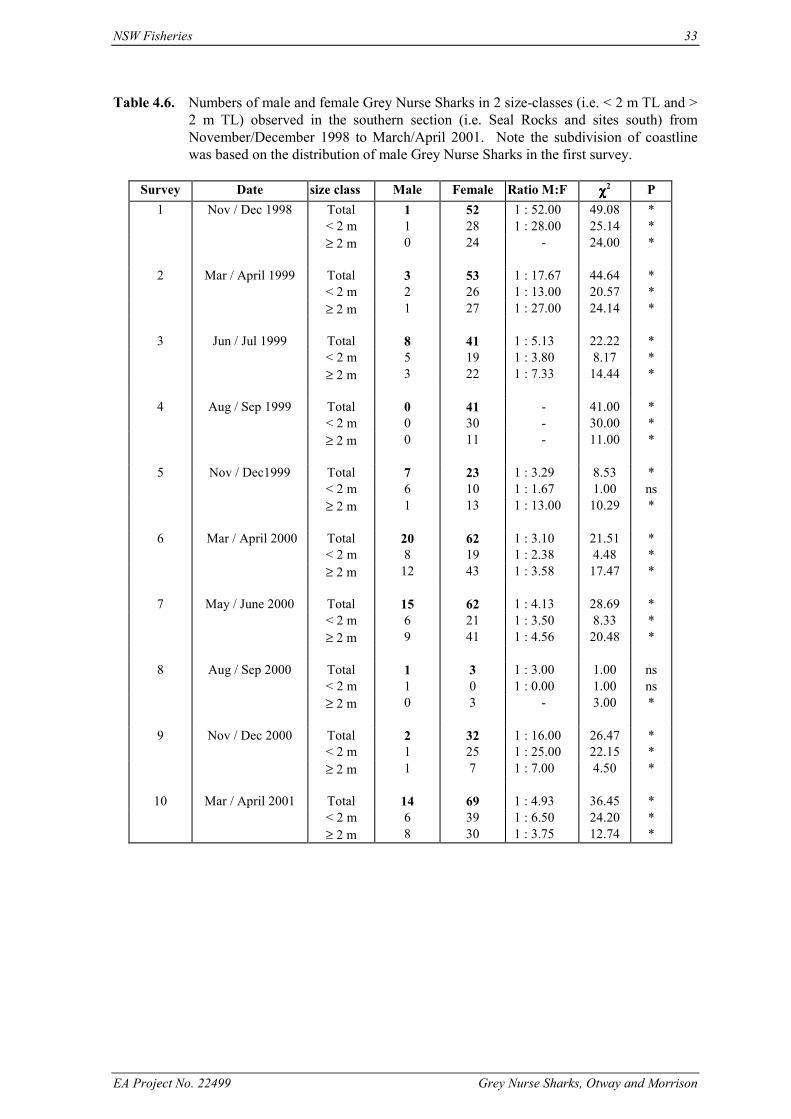
NSW Fisheries 33
EA Project No. 22499 Grey Nurse Sharks, Otway and Morrison
Table 4.6. Numbers of male and female Grey Nurse Sharks in 2 size-classes (i.e. < 2 m TL and >2 m TL) observed in the southern section (i.e. Seal Rocks and sites south) fromNovember/December 1998 to March/April 2001. Note the subdivision of coastlinewas based on the distribution of male Grey Nurse Sharks in the first survey.
Survey Date size class Male Female Ratio M:F χχχχ2 P1 Nov / Dec 1998 Total 1 52 1 : 52.00 49.08 *
< 2 m 1 28 1 : 28.00 25.14 *≥ 2 m 0 24 - 24.00 *
2 Mar / April 1999 Total 3 53 1 : 17.67 44.64 *< 2 m 2 26 1 : 13.00 20.57 *≥ 2 m 1 27 1 : 27.00 24.14 *
3 Jun / Jul 1999 Total 8 41 1 : 5.13 22.22 *< 2 m 5 19 1 : 3.80 8.17 *≥ 2 m 3 22 1 : 7.33 14.44 *
4 Aug / Sep 1999 Total 0 41 - 41.00 *< 2 m 0 30 - 30.00 *≥ 2 m 0 11 - 11.00 *
5 Nov / Dec1999 Total 7 23 1 : 3.29 8.53 *< 2 m 6 10 1 : 1.67 1.00 ns≥ 2 m 1 13 1 : 13.00 10.29 *
6 Mar / April 2000 Total 20 62 1 : 3.10 21.51 *< 2 m 8 19 1 : 2.38 4.48 *≥ 2 m 12 43 1 : 3.58 17.47 *
7 May / June 2000 Total 15 62 1 : 4.13 28.69 *< 2 m 6 21 1 : 3.50 8.33 *≥ 2 m 9 41 1 : 4.56 20.48 *
8 Aug / Sep 2000 Total 1 3 1 : 3.00 1.00 ns< 2 m 1 0 1 : 0.00 1.00 ns≥ 2 m 0 3 - 3.00 *
9 Nov / Dec 2000 Total 2 32 1 : 16.00 26.47 *< 2 m 1 25 1 : 25.00 22.15 *≥ 2 m 1 7 1 : 7.00 4.50 *
10 Mar / April 2001 Total 14 69 1 : 4.93 36.45 *< 2 m 6 39 1 : 6.50 24.20 *≥ 2 m 8 30 1 : 3.75 12.74 *
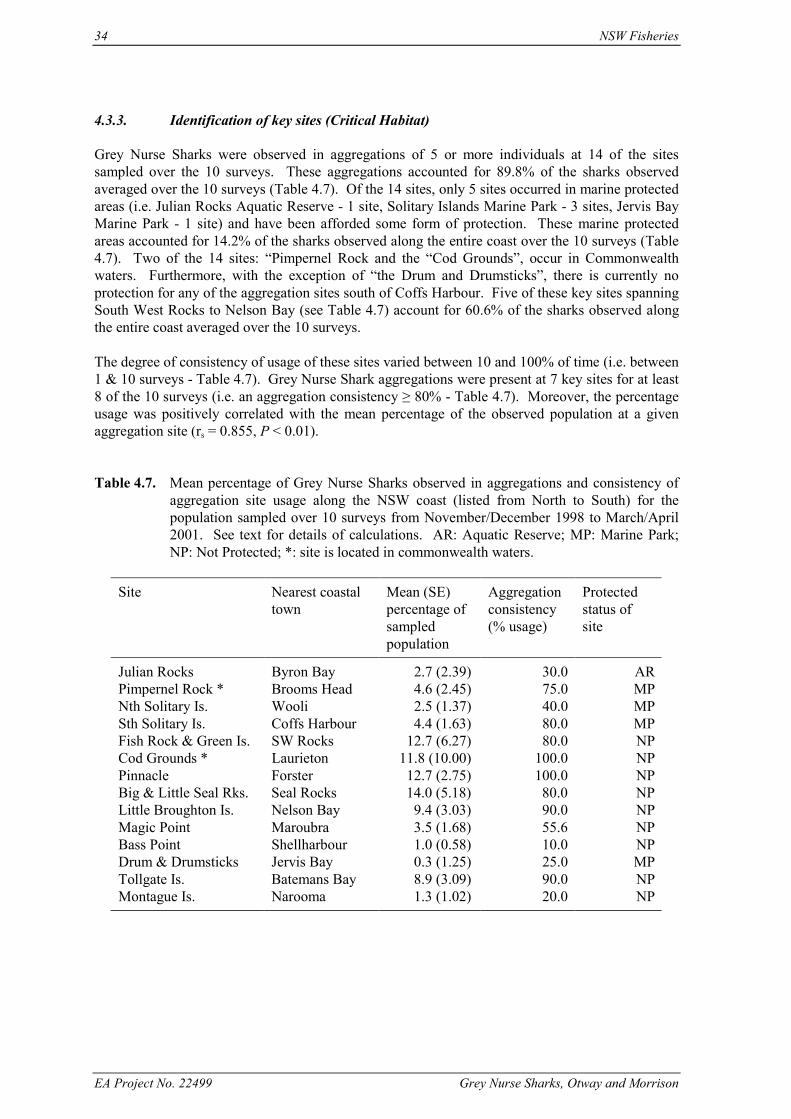
34 NSW Fisheries
EA Project No. 22499 Grey Nurse Sharks, Otway and Morrison
4.3.3. Identification of key sites (Critical Habitat)
Grey Nurse Sharks were observed in aggregations of 5 or more individuals at 14 of the sitessampled over the 10 surveys. These aggregations accounted for 89.8% of the sharks observedaveraged over the 10 surveys (Table 4.7). Of the 14 sites, only 5 sites occurred in marine protectedareas (i.e. Julian Rocks Aquatic Reserve - 1 site, Solitary Islands Marine Park - 3 sites, Jervis BayMarine Park - 1 site) and have been afforded some form of protection. These marine protectedareas accounted for 14.2% of the sharks observed along the entire coast over the 10 surveys (Table4.7). Two of the 14 sites: “Pimpernel Rock and the “Cod Grounds”, occur in Commonwealthwaters. Furthermore, with the exception of “the Drum and Drumsticks”, there is currently noprotection for any of the aggregation sites south of Coffs Harbour. Five of these key sites spanningSouth West Rocks to Nelson Bay (see Table 4.7) account for 60.6% of the sharks observed alongthe entire coast averaged over the 10 surveys.
The degree of consistency of usage of these sites varied between 10 and 100% of time (i.e. between1 & 10 surveys - Table 4.7). Grey Nurse Shark aggregations were present at 7 key sites for at least8 of the 10 surveys (i.e. an aggregation consistency ≥ 80% - Table 4.7). Moreover, the percentageusage was positively correlated with the mean percentage of the observed population at a givenaggregation site (rs = 0.855, P < 0.01).
Table 4.7. Mean percentage of Grey Nurse Sharks observed in aggregations and consistency ofaggregation site usage along the NSW coast (listed from North to South) for thepopulation sampled over 10 surveys from November/December 1998 to March/April2001. See text for details of calculations. AR: Aquatic Reserve; MP: Marine Park;NP: Not Protected; *: site is located in commonwealth waters.
Site Nearest coastaltown
Mean (SE)percentage ofsampledpopulation
Aggregationconsistency(% usage)
Protectedstatus ofsite
Julian Rocks Byron Bay 2.7 (2.39) 30.0 ARPimpernel Rock * Brooms Head 4.6 (2.45) 75.0 MPNth Solitary Is. Wooli 2.5 (1.37) 40.0 MPSth Solitary Is. Coffs Harbour 4.4 (1.63) 80.0 MPFish Rock & Green Is. SW Rocks 12.7 (6.27) 80.0 NPCod Grounds * Laurieton 11.8 (10.00) 100.0 NPPinnacle Forster 12.7 (2.75) 100.0 NPBig & Little Seal Rks. Seal Rocks 14.0 (5.18) 80.0 NPLittle Broughton Is. Nelson Bay 9.4 (3.03) 90.0 NPMagic Point Maroubra 3.5 (1.68) 55.6 NPBass Point Shellharbour 1.0 (0.58) 10.0 NPDrum & Drumsticks Jervis Bay 0.3 (1.25) 25.0 MPTollgate Is. Batemans Bay 8.9 (3.09) 90.0 NPMontague Is. Narooma 1.3 (1.02) 20.0 NP
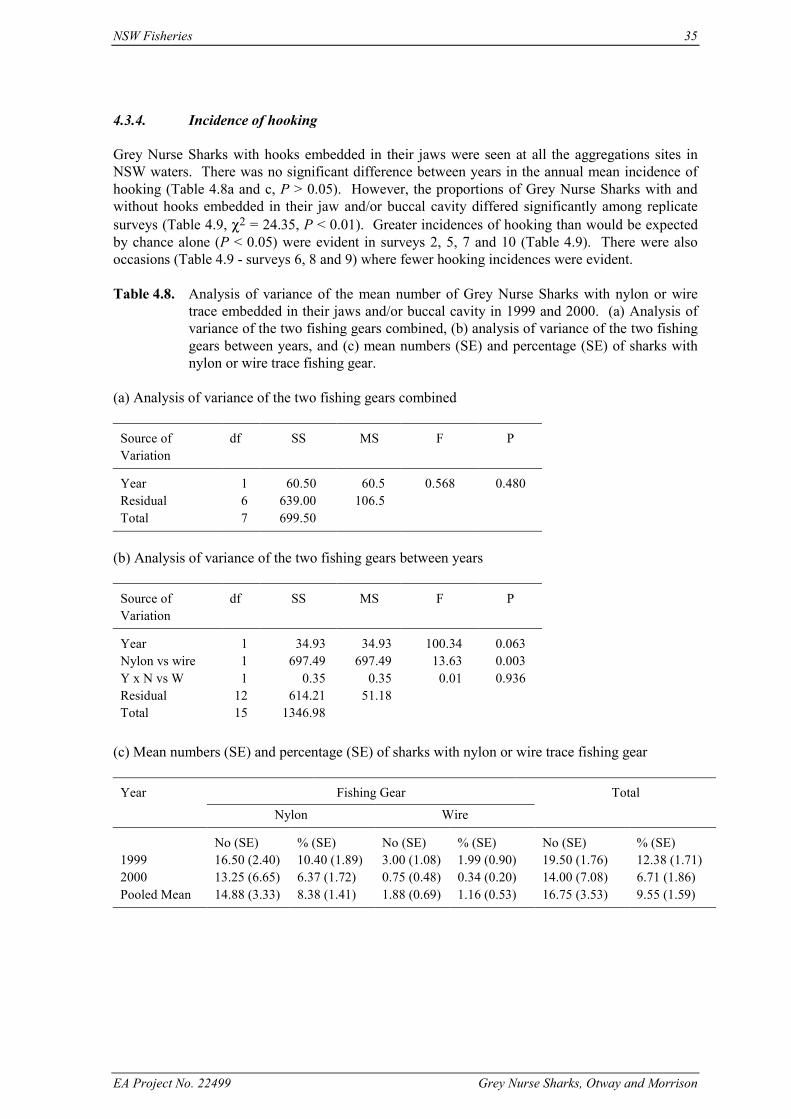
NSW Fisheries 35
EA Project No. 22499 Grey Nurse Sharks, Otway and Morrison
4.3.4. Incidence of hooking
Grey Nurse Sharks with hooks embedded in their jaws were seen at all the aggregations sites inNSW waters. There was no significant difference between years in the annual mean incidence ofhooking (Table 4.8a and c, P > 0.05). However, the proportions of Grey Nurse Sharks with andwithout hooks embedded in their jaw and/or buccal cavity differed significantly among replicatesurveys (Table 4.9, χ2 = 24.35, P < 0.01). Greater incidences of hooking than would be expectedby chance alone (P < 0.05) were evident in surveys 2, 5, 7 and 10 (Table 4.9). There were alsooccasions (Table 4.9 - surveys 6, 8 and 9) where fewer hooking incidences were evident.
Table 4.8. Analysis of variance of the mean number of Grey Nurse Sharks with nylon or wiretrace embedded in their jaws and/or buccal cavity in 1999 and 2000. (a) Analysis ofvariance of the two fishing gears combined, (b) analysis of variance of the two fishinggears between years, and (c) mean numbers (SE) and percentage (SE) of sharks withnylon or wire trace fishing gear.
(a) Analysis of variance of the two fishing gears combined
Source ofVariation
df SS MS F P
Year 1 60.50 60.5 0.568 0.480Residual 6 639.00 106.5Total 7 699.50
(b) Analysis of variance of the two fishing gears between years
Source ofVariation
df SS MS F P
Year 1 34.93 34.93 100.34 0.063Nylon vs wire 1 697.49 697.49 13.63 0.003Y x N vs W 1 0.35 0.35 0.01 0.936Residual 12 614.21 51.18Total 15 1346.98
(c) Mean numbers (SE) and percentage (SE) of sharks with nylon or wire trace fishing gear
Year Fishing Gear Total
Nylon Wire
No (SE) % (SE) No (SE) % (SE) No (SE) % (SE)1999 16.50 (2.40) 10.40 (1.89) 3.00 (1.08) 1.99 (0.90) 19.50 (1.76) 12.38 (1.71)2000 13.25 (6.65) 6.37 (1.72) 0.75 (0.48) 0.34 (0.20) 14.00 (7.08) 6.71 (1.86)Pooled Mean 14.88 (3.33) 8.38 (1.41) 1.88 (0.69) 1.16 (0.53) 16.75 (3.53) 9.55 (1.59)
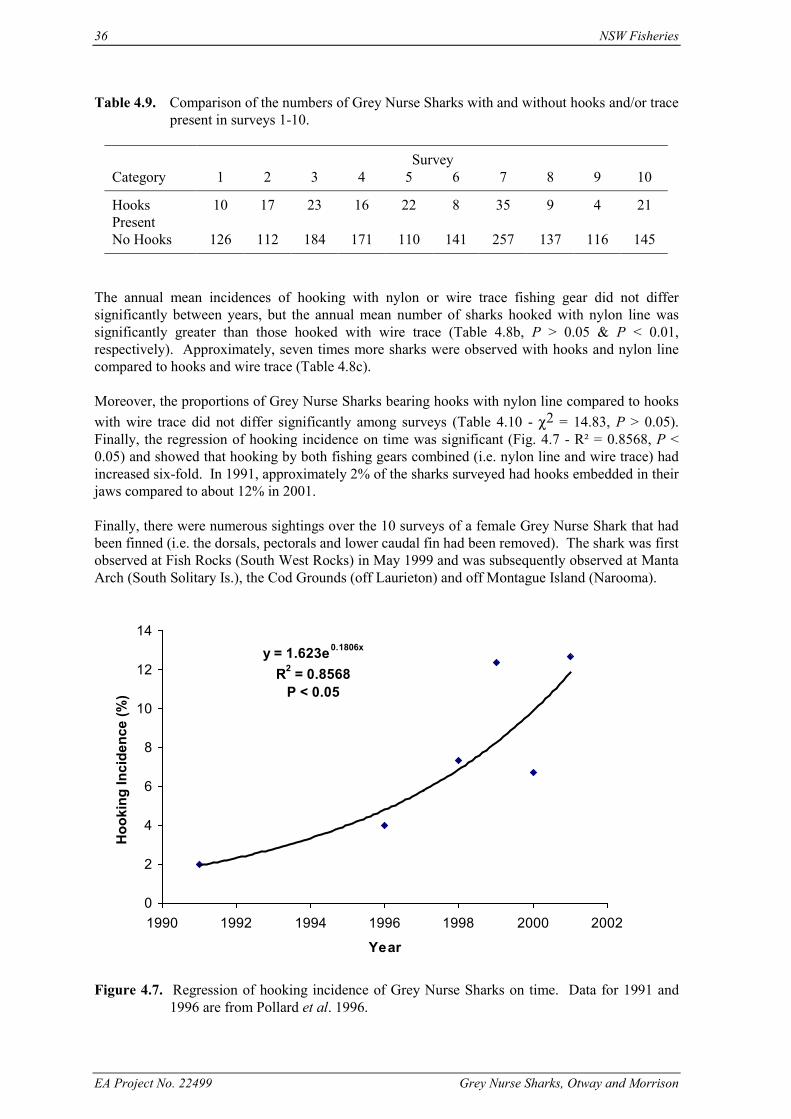
36 NSW Fisheries
EA Project No. 22499 Grey Nurse Sharks, Otway and Morrison
Table 4.9. Comparison of the numbers of Grey Nurse Sharks with and without hooks and/or tracepresent in surveys 1-10.
SurveyCategory 1 2 3 4 5 6 7 8 9 10
HooksPresent
10 17 23 16 22 8 35 9 4 21
No Hooks 126 112 184 171 110 141 257 137 116 145
The annual mean incidences of hooking with nylon or wire trace fishing gear did not differsignificantly between years, but the annual mean number of sharks hooked with nylon line wassignificantly greater than those hooked with wire trace (Table 4.8b, P > 0.05 & P < 0.01,respectively). Approximately, seven times more sharks were observed with hooks and nylon linecompared to hooks and wire trace (Table 4.8c).
Moreover, the proportions of Grey Nurse Sharks bearing hooks with nylon line compared to hookswith wire trace did not differ significantly among surveys (Table 4.10 - χ2 = 14.83, P > 0.05).Finally, the regression of hooking incidence on time was significant (Fig. 4.7 - R² = 0.8568, P <0.05) and showed that hooking by both fishing gears combined (i.e. nylon line and wire trace) hadincreased six-fold. In 1991, approximately 2% of the sharks surveyed had hooks embedded in theirjaws compared to about 12% in 2001.
Finally, there were numerous sightings over the 10 surveys of a female Grey Nurse Shark that hadbeen finned (i.e. the dorsals, pectorals and lower caudal fin had been removed). The shark was firstobserved at Fish Rocks (South West Rocks) in May 1999 and was subsequently observed at MantaArch (South Solitary Is.), the Cod Grounds (off Laurieton) and off Montague Island (Narooma).
Figure 4.7. Regression of hooking incidence of Grey Nurse Sharks on time. Data for 1991 and1996 are from Pollard et al. 1996.
y = 1.623e0.1806x
R2 = 0.8568P < 0.05
0
2
4
6
8
10
12
14
1990 1992 1994 1996 1998 2000 2002
Year
Hoo
king
Inci
denc
e (%
)
NSW Fisheries 37
EA Project No. 22499 Grey Nurse Sharks, Otway and Morrison
Table 4.10. Comparison of hooking incidences with wire trace and nylon line for surveys 1-10.
Fishing Gear % of sharksHook and Nylon
Monofilament lineHook and Wire TraceSurvey Date
M F U Total M F U Total
with hooksin survey
1 Nov/Dec 98 1 8 0 9 1 0 0 1 7.352 Mar/Apr 99 0 3 8 11 2 3 1 6 13.183 May/Jun 99 2 7 11 20 1 1 1 3 11.114 Sep/Oct 99 0 8 6 14 1 1 0 2 8.565 Nov/Dec 99 8 8 5 21 0 1 0 1 16.676 Mar/Apr 00 2 2 4 8 0 0 0 0 5.377 May/Jun 00 11 10 12 33 0 1 1 2 11.998 Aug/Sep 00 3 3 2 8 0 1 0 1 6.169 Nov/Dec 00 3 1 0 4 0 0 0 0 3.3310 Mar/Apr 01 4 10 2 16 1 4 0 5 12.65
4.4. Discussion
4.4.1. Spatial and temporal variation in abundance
The abundances of Grey Nurse Sharks exhibited substantial spatial and temporal variation alongthe entire NSW coast. Despite this, there were obvious patterns that were consistent between years.Fourteen sites had fairly consistent aggregations of 5 or more Grey Nurse Sharks present over the10 surveys. Observations of new-born pups at these sites indicate that these sites play an importantrole in reproduction. Why these particular sites are chosen over others is unclear at this stage,especially given that the physical habitats were very similar at all the sites sampled. However, it islikely that there are, as yet unknown, physical and/or biological attributes which attract the sharksto these particular sites.
The maximum number of sharks observed (i.e. 292 individuals over 57 sites, on average) along theentire coast was very low given that Grey Nurse Sharks have been protected since 1984. It ispossible that large numbers of sharks were not sighted because they were moving between sites atthe time of the survey. However, the likelihood of such a scenario is probably small because of: (1)the large number of sites sampled, (2) the absence of widely disparate results over the 10 surveys,and (3) the distribution of sites along the entire coast. The absence of Grey Nurse Sharks at 63% ofthe sites sampled is a statistic that is cause for concern, especially given that the sites were chosenbecause of their previous occupation by Grey Nurse Sharks (i.e. in the 1960’s). Given theextremely low numbers, it is important that these surveys are repeated on a regular basis overseveral years to provide estimates of the inter-annual variation in abundance. Moreover, thedocumentation of the mean annual abundances would enable trends in population abundance (i.e.towards recovery or extinction) to be examined over longer time periods.
The need for a tagging program to document: (1) the total number of Grey Nurse Sharks in theNSW population, (2) localised and migrational movements, (3) estimates of the timing andduration of occupancy of a site, and (4) estimates of the rates of inadvertent capture (i.e. as by-catch) by commercial fishers (i.e. on setlines) or recreational fishers (i.e. on various gear) has beenrecommended previously (see Otway & Parker, 2000). To this end, a tagging program using“cattle ear tags” has commenced. This work should provide preliminary information addressing allfour questions raised above.
38 NSW Fisheries
EA Project No. 22499 Grey Nurse Sharks, Otway and Morrison
The coastwide surveys of Grey Nurse Sharks have also been limited by the maximum depth towhich recreational scuba divers can dive (i.e. ≈ 40 metres). However, it is likely that the sharks,and especially the males, could utilise appropriate habitats (i.e. gutters, overhangs and caves) inwaters 10 – 20 m deeper than the diving surveys permit (i.e. to an overall depth of 60 m). If deepersites are utilised, it is likely that some or many of these sites would be located in commonwealthwaters. The absence of surveys in deeper waters has been a point of contention at meetings withfishing groups including commercial fishers, gamefishers, charterboat fishers, spearfishers andrecreational line fishers. It is desirable, therefore, to ascertain whether Grey Nurse Sharks utilisesites in waters deeper than 40 metres. If present in deeper waters, it will be necessary to quantifythe spatial and temporal patterns of abundance at intervals of time similar to the diver surveys toenable more robust interpretations of the resulting data.
Documenting whether Grey Nurse Sharks do actually utilise sites in deeper water will require four,contemporaneous, lines of investigation. First, it will be necessary to review the data concerningthe capture of Grey Nurse Sharks by gamefishers. These data would identify whether Grey NurseSharks were caught at sites in deeper water and these could be highlighted for further investigation.Second, consultation with representatives from the commercial and recreational (e.g. linefishers,gamefishers & charterboat fishers) fishing sectors would also be used to identify other potentialsites in deeper waters. Third, it may be necessary to use underwater video census techniques tosample sites in deeper water. Last, it would also be important to use archival, acoustic ("smart")tags fitted with depth sensors to record the depth of water in which individual Grey Nurse Sharksswim.
The first two lines of investigation provide preliminary information on possible sites in deeperwater. The subsequent two lines of investigation would provide rigorous, quantitative data. Allfour lines of investigation have an associated cost, and while the use of acoustic tags is initiallyhigh, they maximise the amount of information gained and simultaneously minimise the effortrequired within a restricted time-period. Moreover, it is unlikely that the necessary informationcould be obtained by any other means or for an equivalent cost because the sea-time required forvideo census work would require even greater funds for the chartering of vessels and thesubmersible video equipment.
Ideally, a combination of all 4 lines of investigation will be needed to overcome the shortfall in thediver surveys because, singularly, they would not provide a complete picture.
4.4.2. Population size-structure, reproduction and recruitment
The results from the 10 surveys along the entire coast showed that the Grey Nurse Shark populationexhibited a sex-ratio biased in favour of females except in winter when there was a 1: 1 sex ratio.A previous survey at Seal Rocks in spring 1991 showed that 86% of the Grey Nurse Sharksobserved were female (Ecology Lab, 1991; Pollard et al., 1996). This bias towards females is alsoconsistent with the predominance of females in the overall catch of Grey Nurse Sharks (i.e. 77.4% -Reid and Krogh, 1992 and 77.8% - Krogh, 1994) in the protective beach nets in NSW (i.e. offNewcastle, Sydney and Wollongong). A similar pattern has been reported off Natal (South Africa),where sex-ratios have reached 2.3: 1 biased in favour of females (Bass et al., 1975; Cliff, unpub.),and off the east coast of the USA (Springer, 1963; Clark and Von Schmidt, 1965; Gilmore et al.,1983). These same authors concluded that sexual segregation of male and female Grey NurseSharks was responsible for the biased sex-ratios. Consequently, the biased sex-ratios in: (1) thisstudy, (2) the 1991 survey, and (3) the protective beach nets were most likely due to segregation ofthe sexes rather than an actual difference in the abundances of males and females.
NSW Fisheries 39
EA Project No. 22499 Grey Nurse Sharks, Otway and Morrison
On subdividing the coastline into northern (i.e. Forster - N. Stradbroke Is) and southern (i.e. SealRocks - Eden) sections based on the distribution of the male Grey Nurse Sharks, the biases in thesex-ratios changed markedly. The differences in the sex-ratios in northern and southern sectionsare most likely due to a combination of sexual segregation, reproductive activities (pupping andmating), and sex-related differences in migratory movements. Previous research in South Africa(e.g. Bass et al., 1975; Cliff unpub.) and on the east coast of the USA (e.g. Bigelow and Schroeder,1953; Gilmore et al., 1983) has shown that female Grey Nurse Sharks undergo regular migratorymovements for mating, gestation and parturition. Unfortunately, less is known about the migratorymovements of males in these regions. Nevertheless, research in South Africa (Cliff unpub.) hasshown that male Grey Nurse Sharks tend to commence their migratory movements several weeksafter the females. If we assume that the Grey Nurse Sharks on the east coast of Australia alsoundergo migratory movements similar to that documented on the east coast of the USA, it is likelythat the greater number of males in the northern section of the coast and their near absence fromSeal Rocks to Eden is the result of differential migratory movements. While these observationsprovide support for a "migration hypothesis" (see Otway & Parker, 2000) they could also be theresult of localised (small-scale) movements. It will be important to gain further informationconcerning localised and migrational movements. Fluctuations in abundance at any particular sitewill likely be the result of short-term, localised movements. The range over which thesemovements occur is, as yet, unknown and needs to be quantified.
Documenting the short-term, localised movements would be best achieved by using acoustic("smart") tags as they maximise the amount of information gained whilst simultaneouslyminimising the effort required within a restricted time period. The only drawback is their initialcost. However, it is unlikely that the necessary information could be obtained by any other meansor for an equivalent level of funding. In spite of this, some preliminary information concerningshort-term, localised movements should be forthcoming via the tagging program discussed earlier.
The results of the 10 surveys also have substantial implications for the fecundity, reproduction andrecruitment of Grey Nurse Sharks along the east coast of Australia (NSW and southernQueensland). Previous research in South Africa and along the east coast of the USA (e.g. Bass etal., 1975; Gilmore et al., 1983; Branstetter, 1990; Branstetter and Musick, 1994) has shown thatfemale Grey Nurse Sharks attain sexual maturity on reaching 2.20 - 2.30 m TL and give birth to 2pups (0.90 - 1.20 m TL) every 2 years. This gives a mean fecundity of 1 pup per annum.Furthermore, as pupping in South Africa and on the east coast of the USA occurs in Winter(Gilmore et al., 1983; Branstetter and Musick, 1994; Cliff, Unpub. MS) it is likely to occur at asimilar time off the east coast of Australia. Moreover, female Grey Nurse Sharks in theUnderwater World aquarium (Mooloolaba, Qld.) have given birth to 2 healthy pups on severaloccasions in August/September (A. Scrivyer, pers. comm.). These observations suggest that thefecundity and timing of parturition in Australia should be similar to that in South Africa and alongthe east coast of the USA. Observations of near-term pregnant females followed by new-born pupsduring the winter surveys at several of the aggregation sites supports the interpretation that puppingdoes indeed occur during winter and possibly into early spring.
With this in mind, it is likely that pups born in 1999 and 2000 would have been readily observed inthe winter or spring surveys (i.e. surveys 3-4 and 7-8, respectively). Any pups observed wouldhave been approximately 1.00 - 1.20 m TL and easily discernible from other individuals in thepopulation. However, very few pups were observed over these periods or indeed the entire 10surveys. This is cause for concern for at least 3 reasons related to: (1) sampling error, (2)reproductive failure, and (3) mortality.
First, it may be that the pups were not observed using the existing sampling techniques possiblybecause they moved away from the pupping sites and were therefore not seen. However, given thatGrey Nurse Shark pups (male and female) remain with the reproductively mature females for many
40 NSW Fisheries
EA Project No. 22499 Grey Nurse Sharks, Otway and Morrison
months after birth (Branstetter and Musick, 1994; Cliff, Unpub. MS) and the fact that diversobserved a few pups swimming with aggregations of reproductively mature sharks (i.e. > 2 m TL),it is unlikely that large numbers of pups would have moved away. This suggests that the samplingtechniques used were appropriate and detected any pups that were present. It is also possible thatseveral important pupping sites may not have been identified and sampled despite the intensesampling effort over the 10 surveys (i.e. 57 sites on average).
Second, if there were indeed fewer pups than expected, then a reproductive failure may haveoccurred. This may have been triggered by continuously declining numbers of Grey Nurse Sharks.Consider the following example based on the direct relationship between the numbers ofreproductively mature females and pups. If we assume that all the female Grey Nurse Sharks > 2m TL were reproductively mature in winter 2000 (i.e. 92 females in survey 7 given a 50:50 sexratio – see Table 4.4), then there should have been 92 pups evident in winter 2000. Given that pupswould have been recorded in the 1 - 2 m TL size-class which comprised 49 individuals, there werefewer pups than the expected. However, as previous research has shown that female Grey NurseSharks do not attain reproductive maturity until at least 6 years of age (e.g. Gilmore et al., 1983;Branstetter and Musick, 1994), the 1 - 2 m TL size-class will contain a mix of individuals aged 0+to 5+ years (i.e. 6 age-classes). If individuals in the 1 - 2 m TL size-class divided into 6numerically equal size-classes, each size-class would only comprise approximately 8 individuals,on average. Clearly, 8 pups is well below the expected number of 92. If a reproductive failure hasoccurred, it is likely that it occurred over several years, given the numbers of individuals in theprojected 6 age-classes contained within the 1 - 2 m TL size-class (see discussion above). Moreimportantly, if a reproductive failure has occurred, the average fecundity of the shark falls to below1 pup per annum: a rate that is clearly insufficient to sustain a population yet alone enable it torecover.
Third, the large difference between the numbers of pups observed and expected may be due to anextremely high rate of mortality of pups. If we assume that the 14 pups observed in spring 2000(see section 4.3.1) were the only survivors of the recruitment pulse for that year, this would give amortality rate of about 85% based on the expected 92 pups. This is a dramatic contrast to estimatesof natural mortality over the life-span of Grey Nurse Sharks which range from 12.90% (Smith et al.1998), 15.43% (Mollet 2001) to 18.42% (Mollet & Cailliet, 2002). While the evolutionary role ofreduced fecundity and live birth at a relatively large size is to reduce the rate of mortality to a levelthat will ensure long-term survival of the species, the natural rate of mortality of shark pups (i.e. 0+years) may be higher than the older individuals (e.g. Holden 1977, Cailliet 1992). However, theabove calculated rate of mortality is clearly extreme to say the least. This rate, even ifoverestimated by a factor of 4, clearly suggests that sources other than those associated with naturalmortality are occurring. Given the significantly increased incidence of hooks embedded in the jawsof Grey Nurse Sharks (see Section 4.3.4), it is likely that pups and/or juvenile sharks have beenexposed to fishing-related mortality. Numerous authors (e.g. Olsen 1954, Cailliet 1992, Smith etal. 1998) have indicated that high rates of fishing mortality on juvenile sharks can result in seriousdecreases in the overall population size. More recently, Mollet and Cailliet (2002) have shown thatfishing the juvenile age classes has the same effect on the growth of the entire population as fishingall adult age classes. Moreover, a 10% increase in the fishing mortality of juveniles or adultswould require an approximate 50% increase in the sharks fecundity to return the population to itsoriginal growth rate (Mollet & Cailliet, 2002). This is clearly not possible for Grey Nurse Sharksbecause of their inter-uterine cannibalistic phase that prevents an increase in fecundity beyond the 2pups every 2 years.
Clearly, the rates of fishing mortality will need to be quantified in the future (see comments inChapter 6). Preliminary estimates could arise through the tagging study discussed earlier. Theability to estimate rates of mortality from a range of sources will depend greatly on the degree ofreporting of tagged individuals.
NSW Fisheries 41
EA Project No. 22499 Grey Nurse Sharks, Otway and Morrison
4.4.3. Identification of key sites (Critical Habitat)
Twelve sites accounted for 88.5% of the Grey Nurse Sharks observed over the 10 surveys. Ofthese, only Julian Rocks Aquatic Reserve (i.e. 1 site) and Solitary Islands Marine Park (3 sitesincluding “Pimpernel Rock” in Commonwealth waters had been afforded some form of protectionat the completion of the surveys (i.e. in autumn 2001). The aggregation site within the JulianRocks Aquatic Reserve (i.e. an area of radius 500 m from the rocks) accounted for 2.7% of theGrey Nurse Shark population (Table 4.7). Commercial fishing has been banned in the aquaticreserve, but recreational fishing is still allowed. Whilst the aquatic reserve protects the shark fromcommercial fishing, it is likely that accidental hooking via recreational fishing will continue (seeTable 4.7). The area around Pimpernel Rock (i.e. a 500 m radius from the rock) was declared asanctuary zone by the Commonwealth government (see Commonwealth of Australia 2001) and allforms of fishing (i.e. spearfishing, recreational, charterboat and commercial fishing) are banned.Other non-destructive activities are still allowed, but require permits. It is likely that the 4.6% ofthe Grey Nurse Shark population observed over the surveys (Table 4.7) will receive greaterprotection at this site. The key aggregation sites and North and South Solitary Islands accountedfor 2.5% and 4.4% of the Grey Nurse Shark population, respectively (Table 4.7). Unfortunately,these key aggregation sites are not located in the sanctuary zones around both islands. However,the use of wire traces for bottom fishing has been banned within 500 m of both islands (MarineParks Authority, 2002). Given the incidence of hooking of Grey Nurse Sharks by hooks attachedto nylon line (see Table 4.10), it is likely that the sharks will still be vulnerable to hooking byrecreational fishers at these sites. With this in mind, it is recommended that critical habitats bedeclared at the aggregation sites at North and South Solitary Islands.
The four marine protected areas discussed above all occur in the northern NSW coastal waters andcombined, account for 14.2% of the sharks observed along the entire coast. Given that the GreyNurse Shark population is segregated by sex with more males occurring in the northern NSWwaters, these four sites will protect proportionally more males than females. The remaining 8 sites,including the “Cod Grounds” in Commonwealth waters, had no management arrangements in placeat the end of the surveys (i.e. in autumn 2001). These sites were occupied by 74.3%, on average, ofthe observed Grey Nurse Shark population documented during the surveys. From a biologicalperspective, observations of pups and females with mating scars at these key (aggregation) sitesindicate that these places play an important role in reproduction (see Section 4.3.1). Why theseparticular sites have fairly consistent aggregations is unclear at present given that the physicalhabitats (i.e. gutters, caverns and/or caves) were very similar at all the sites sampled. However, itis likely that there are, as yet unknown, biological attributes that attract the sharks to theseparticular sites. However, given that the degree of consistency of usage of these sites was alsopositively correlated with the percentage of the population present, it is clear that these sites areimportant for various stages of the life-cycle of Grey Nurse Sharks.
In December 2002, NSW Fisheries declared Critical Habitats at Julian Rocks (Byron Bay), FishRock and Green Island (South West Rocks), The Pinnacle (Forster), Big and Little Seal Rocks(Seal Rocks), Little Broughton Island (Port Stephens), Magic Point (Sydney), Bass Point(Shellharbour), the Tollgate Islands (Batemans Bay), and Montague Island (Narooma) underSection 220Q of the Fisheries Management Act 1994 (and Amendments). Moreover, EnvironmentAustralia is currently engaged in a consultation process aimed at providing protection for the “CodGrounds.” Consideration should also be given to declaring “Pimpernel Rock” and the “CodGrounds” as critical habitat under the EPBC Act (1999).
42 NSW Fisheries
EA Project No. 22499 Grey Nurse Sharks, Otway and Morrison
4.4.4. Incidence of hooking
The coastwide surveys showed that there has been a significant increase in the incidence ofhooking over the past decade. The tagging program now underway will also enable independentestimates of the incidence of hooking. These estimates should be substantially more accurate asthey will be based on individually identifiable sharks. This will enable the apparent levels ofaccidental hooking evident in 2001 to be verified. The incidental capture on hooks with nylonfishing line was greater than that on hooks with wire trace. Accidental capture (and subsequentrelease) can cause a number of pathological and physiological changes in sharks (see section 6.1.1for a summary) and these may have long-lasting effects. Consequently, these effects will need tobe assessed rigorously in the near future as a matter of priority. In the meantime, the accidentalhooking of Grey Nurse Sharks is potentially an important process that may threaten the recovery ofthe species. With this in mind, a precautionary approach should be adopted. The need for aprecautionary approach is also heightened by the limited scientific evidence on the effects ofaccidental hooking of Grey Nurse Sharks in the waters off the east coast of Australia. However,the effects of hooking on other species of shark have been documented (see De Roos & De Roos1978, Holeton & Heisler 1978, Gruber & Keyes 1981, Cliff & Thurman 1984, Moss 1984,Dingerkus 1989, Smith 1992). Consequently, appropriate mitigative measures should be taken,where possible, to reduce the incidence of accidental hooking. Furthermore, the incidence ofhooking could also be quantified during tagging operations. This could be achieved by using ametal detector to document whether the particular Grey Nurse Shark has any hooks embedded in itsbuccal cavity or digestive tract. Thus, the use and application of a metal detector should be furtherinvestigated.
NSW Fisheries 43
EA Project No. 22499 Grey Nurse Sharks, Otway and Morrison
5. DEVELOPMENT OF A VOLUNTARY CODE OF
CONDUCT FOR SCUBA DIVING WITH GREY NURSE
SHARKS
5.1. Introduction
The Grey Nurse Shark is a unique predator because scuba divers can approach the species withoutfear of an attack, due to the shark’s placid nature. Diving with Grey Nurse Sharks in NSW is apopular recreational activity amongst scuba divers. Some of the key sites where Grey NurseSharks aggregate have become popular dive sites. It has been suggested that these “ shark dives”may have an impact on the shark and its behaviour. However, Otway and Parker (2000) consideredthat the effects of the actions of scuba divers on the sharks were likely to be negligible compared toother activities such as commercial and recreational fishing.
In spite of this, there is little scientific evidence documenting whether a diver’s behaviour whilstobserving Grey Nurse Sharks has an impact on the species (i.e. its biology and/or behaviour). TheScuba Divers Association of NSW felt that any impact that scuba divers may have on the sharkwould be mitigated by divers adopting a responsible attitude and ensuring appropriate behaviour.With this in mind, the Scuba Divers Association of NSW suggested that a voluntary code ofconduct be developed for scuba diving with Grey Nurse Sharks and provided NSW Fisheries with arange of suggestions for inclusion in a draft code.
5.2. Materials and methods
NSW Fisheries facilitated a united effort with the recreational scuba diving industry to develop apractical, voluntary code of conduct for diving with Grey Nurse Sharks. The steps involved in thedevelopment of the code are outlined in a flow-chart (Fig. 5.1). A 4-page document was preparedand included: (1) background information about Grey Nurse Sharks, (2) an outline of theconsultation process, and (3) the suggestions provided by the Scuba Divers Association of NSW(Table 5.1). This document was sent to numerous scuba diving groups along the entire NSW coast.These scuba diving groups were asked to indicate their agreement or disagreement with thesuggestions. They were also invited to make further suggestions for inclusion in the draft code ofconduct. The various scuba diving groups were also asked to provide relevant contact details sothat the statewide results could be forwarded to them. This was done to enable them to comparetheir own views with those of other divers from around the state.
The information provided by the scuba diving groups was entered into a computer database. Thenumber (and percentage) of responses that agreed or disagreed with each of the suggestionsprovided by the Scuba Divers Association of NSW was quantified. These data were thensummarised and tabulated.
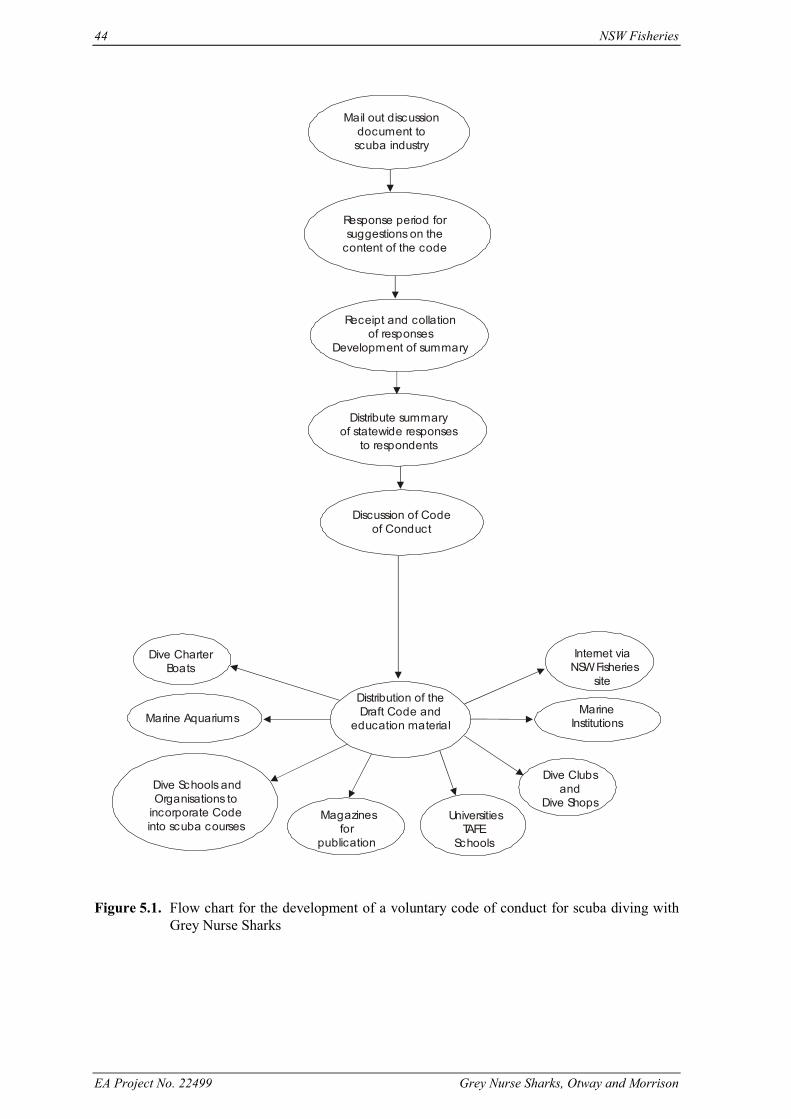
44 NSW Fisheries
EA Project No. 22499 Grey Nurse Sharks, Otway and Morrison
Mail out discussiondocument to scuba industry
Response period forsuggestions on the
content of the code
Receipt and collationof responses
Development of summary
Discussion of Code of Conduct
Distribution of the Draft Code and
education material
Dive CharterBoats
Marine Aquariums
Dive Schools andOrganisations to
incorporate Codeinto scuba courses
Magazines for
publication
UniversitiesTAFE
Schools
Dive Clubsand
Dive Shops
Marine Institutions
Internet via NSW Fisheries
site
Distribute summary of statewide responses
to respondents
Figure 5.1. Flow chart for the development of a voluntary code of conduct for scuba diving withGrey Nurse Sharks
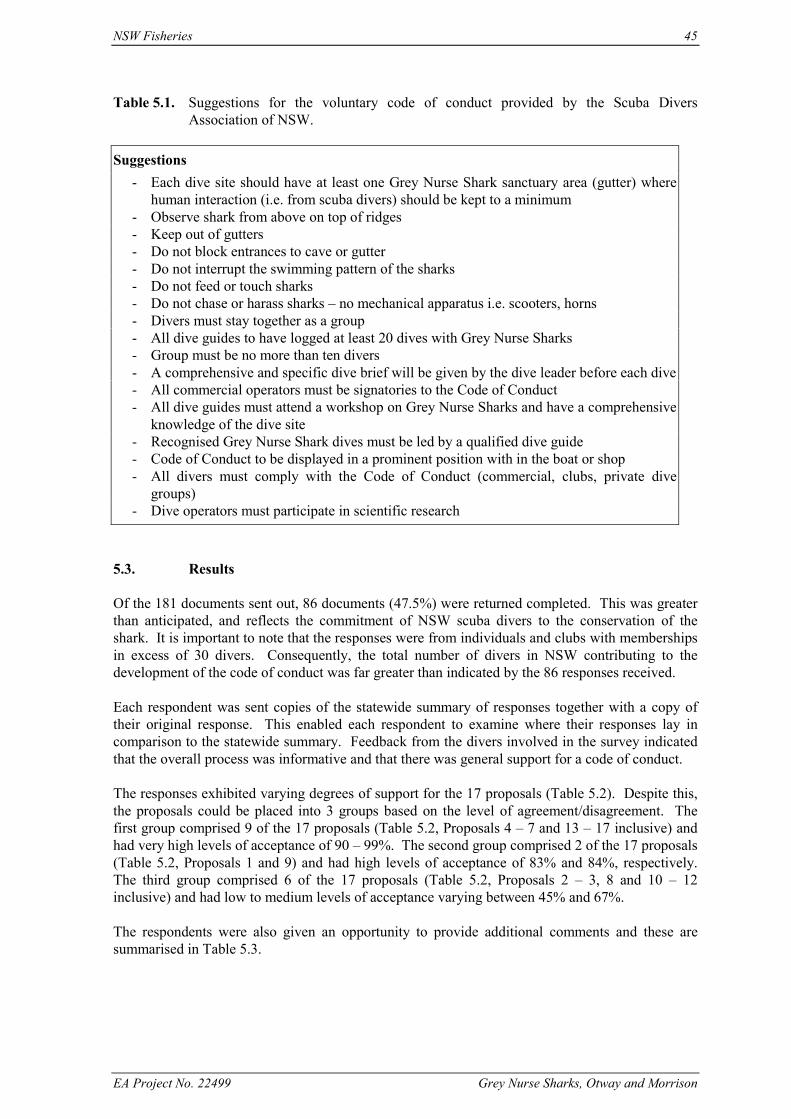
NSW Fisheries 45
EA Project No. 22499 Grey Nurse Sharks, Otway and Morrison
Table 5.1. Suggestions for the voluntary code of conduct provided by the Scuba DiversAssociation of NSW.
Suggestions- Each dive site should have at least one Grey Nurse Shark sanctuary area (gutter) where
human interaction (i.e. from scuba divers) should be kept to a minimum- Observe shark from above on top of ridges- Keep out of gutters- Do not block entrances to cave or gutter- Do not interrupt the swimming pattern of the sharks- Do not feed or touch sharks- Do not chase or harass sharks – no mechanical apparatus i.e. scooters, horns- Divers must stay together as a group- All dive guides to have logged at least 20 dives with Grey Nurse Sharks- Group must be no more than ten divers- A comprehensive and specific dive brief will be given by the dive leader before each dive- All commercial operators must be signatories to the Code of Conduct- All dive guides must attend a workshop on Grey Nurse Sharks and have a comprehensive
knowledge of the dive site- Recognised Grey Nurse Shark dives must be led by a qualified dive guide- Code of Conduct to be displayed in a prominent position with in the boat or shop- All divers must comply with the Code of Conduct (commercial, clubs, private dive
groups)- Dive operators must participate in scientific research
5.3. Results
Of the 181 documents sent out, 86 documents (47.5%) were returned completed. This was greaterthan anticipated, and reflects the commitment of NSW scuba divers to the conservation of theshark. It is important to note that the responses were from individuals and clubs with membershipsin excess of 30 divers. Consequently, the total number of divers in NSW contributing to thedevelopment of the code of conduct was far greater than indicated by the 86 responses received.
Each respondent was sent copies of the statewide summary of responses together with a copy oftheir original response. This enabled each respondent to examine where their responses lay incomparison to the statewide summary. Feedback from the divers involved in the survey indicatedthat the overall process was informative and that there was general support for a code of conduct.
The responses exhibited varying degrees of support for the 17 proposals (Table 5.2). Despite this,the proposals could be placed into 3 groups based on the level of agreement/disagreement. Thefirst group comprised 9 of the 17 proposals (Table 5.2, Proposals 4 – 7 and 13 – 17 inclusive) andhad very high levels of acceptance of 90 – 99%. The second group comprised 2 of the 17 proposals(Table 5.2, Proposals 1 and 9) and had high levels of acceptance of 83% and 84%, respectively.The third group comprised 6 of the 17 proposals (Table 5.2, Proposals 2 – 3, 8 and 10 – 12inclusive) and had low to medium levels of acceptance varying between 45% and 67%.
The respondents were also given an opportunity to provide additional comments and these aresummarised in Table 5.3.
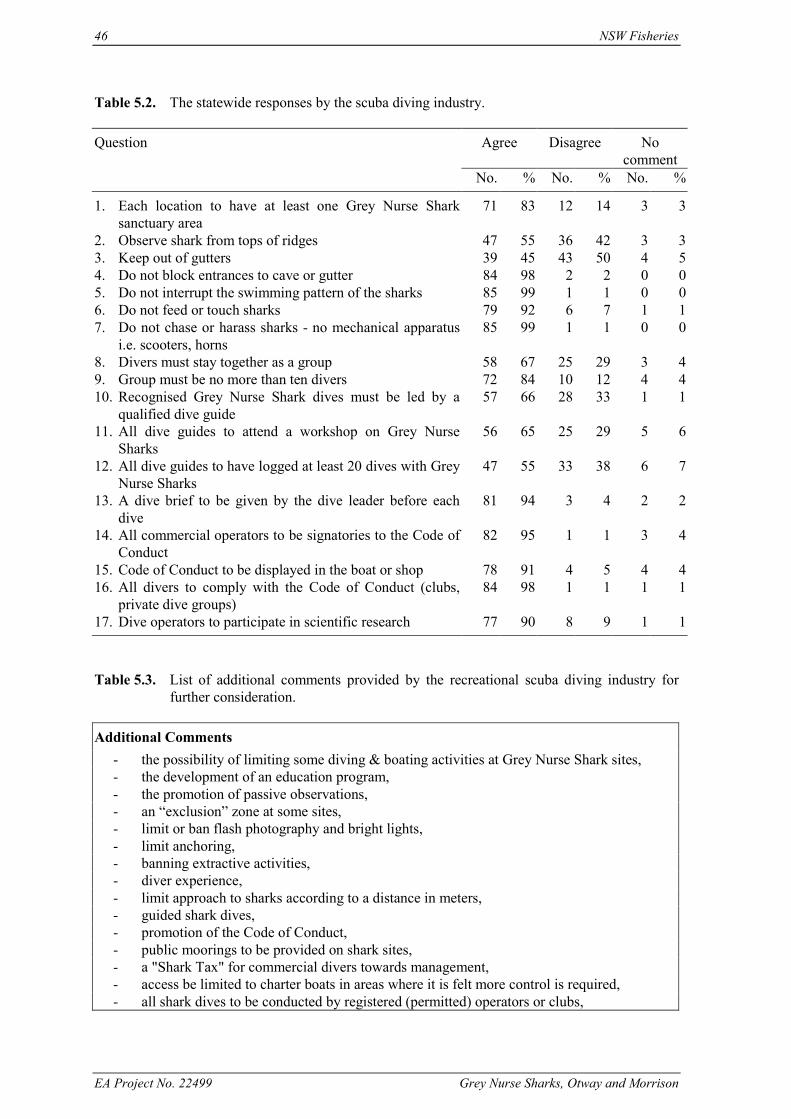
46 NSW Fisheries
EA Project No. 22499 Grey Nurse Sharks, Otway and Morrison
Table 5.2. The statewide responses by the scuba diving industry.
Question Agree Disagree Nocomment
No. % No. % No. %
1. Each location to have at least one Grey Nurse Sharksanctuary area
71 83 12 14 3 3
2. Observe shark from tops of ridges 47 55 36 42 3 33. Keep out of gutters 39 45 43 50 4 54. Do not block entrances to cave or gutter 84 98 2 2 0 05. Do not interrupt the swimming pattern of the sharks 85 99 1 1 0 06. Do not feed or touch sharks 79 92 6 7 1 17. Do not chase or harass sharks - no mechanical apparatus
i.e. scooters, horns85 99 1 1 0 0
8. Divers must stay together as a group 58 67 25 29 3 49. Group must be no more than ten divers 72 84 10 12 4 410. Recognised Grey Nurse Shark dives must be led by a
qualified dive guide57 66 28 33 1 1
11. All dive guides to attend a workshop on Grey NurseSharks
56 65 25 29 5 6
12. All dive guides to have logged at least 20 dives with GreyNurse Sharks
47 55 33 38 6 7
13. A dive brief to be given by the dive leader before eachdive
81 94 3 4 2 2
14. All commercial operators to be signatories to the Code ofConduct
82 95 1 1 3 4
15. Code of Conduct to be displayed in the boat or shop 78 91 4 5 4 416. All divers to comply with the Code of Conduct (clubs,
private dive groups)84 98 1 1 1 1
17. Dive operators to participate in scientific research 77 90 8 9 1 1
Table 5.3. List of additional comments provided by the recreational scuba diving industry forfurther consideration.
Additional Comments- the possibility of limiting some diving & boating activities at Grey Nurse Shark sites,- the development of an education program,- the promotion of passive observations,- an “exclusion” zone at some sites,- limit or ban flash photography and bright lights,- limit anchoring,- banning extractive activities,- diver experience,- limit approach to sharks according to a distance in meters,- guided shark dives,- promotion of the Code of Conduct,- public moorings to be provided on shark sites,- a "Shark Tax" for commercial divers towards management,- access be limited to charter boats in areas where it is felt more control is required,- all shark dives to be conducted by registered (permitted) operators or clubs,
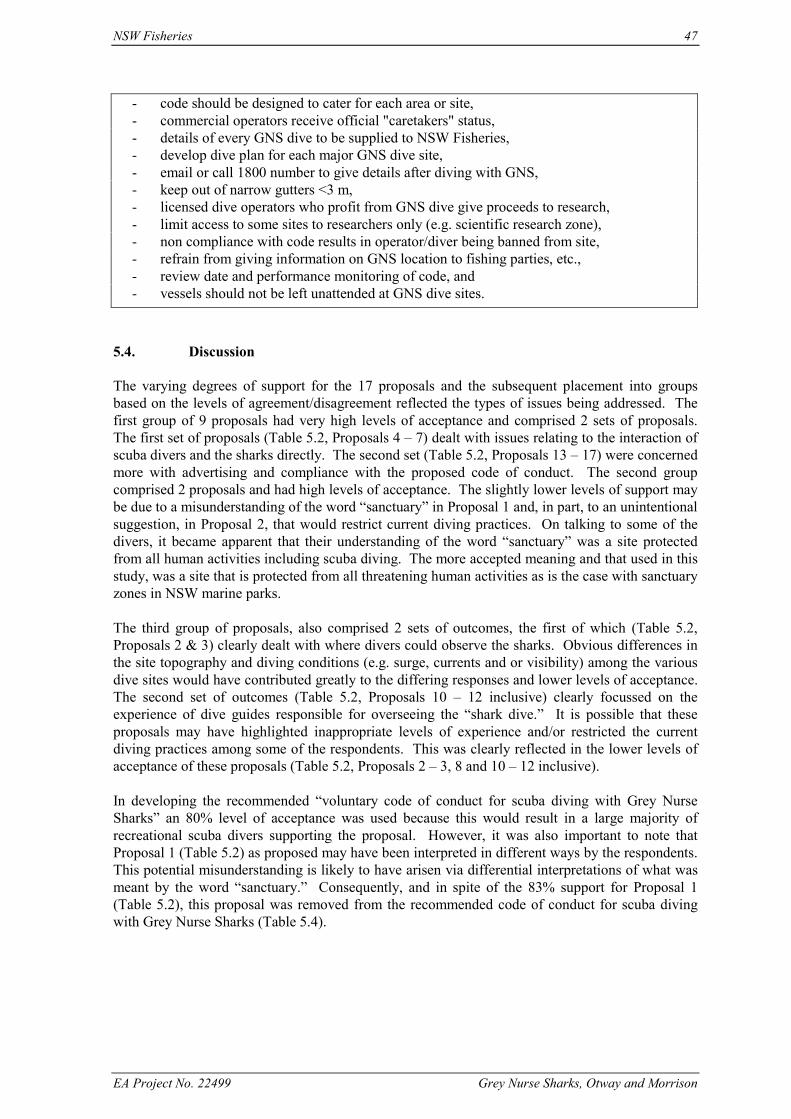
NSW Fisheries 47
EA Project No. 22499 Grey Nurse Sharks, Otway and Morrison
- code should be designed to cater for each area or site,- commercial operators receive official "caretakers" status,- details of every GNS dive to be supplied to NSW Fisheries,- develop dive plan for each major GNS dive site,- email or call 1800 number to give details after diving with GNS,- keep out of narrow gutters <3 m,- licensed dive operators who profit from GNS dive give proceeds to research,- limit access to some sites to researchers only (e.g. scientific research zone),- non compliance with code results in operator/diver being banned from site,- refrain from giving information on GNS location to fishing parties, etc.,- review date and performance monitoring of code, and- vessels should not be left unattended at GNS dive sites.
5.4. Discussion
The varying degrees of support for the 17 proposals and the subsequent placement into groupsbased on the levels of agreement/disagreement reflected the types of issues being addressed. Thefirst group of 9 proposals had very high levels of acceptance and comprised 2 sets of proposals.The first set of proposals (Table 5.2, Proposals 4 – 7) dealt with issues relating to the interaction ofscuba divers and the sharks directly. The second set (Table 5.2, Proposals 13 – 17) were concernedmore with advertising and compliance with the proposed code of conduct. The second groupcomprised 2 proposals and had high levels of acceptance. The slightly lower levels of support maybe due to a misunderstanding of the word “sanctuary” in Proposal 1 and, in part, to an unintentionalsuggestion, in Proposal 2, that would restrict current diving practices. On talking to some of thedivers, it became apparent that their understanding of the word “sanctuary” was a site protectedfrom all human activities including scuba diving. The more accepted meaning and that used in thisstudy, was a site that is protected from all threatening human activities as is the case with sanctuaryzones in NSW marine parks.
The third group of proposals, also comprised 2 sets of outcomes, the first of which (Table 5.2,Proposals 2 & 3) clearly dealt with where divers could observe the sharks. Obvious differences inthe site topography and diving conditions (e.g. surge, currents and or visibility) among the variousdive sites would have contributed greatly to the differing responses and lower levels of acceptance.The second set of outcomes (Table 5.2, Proposals 10 – 12 inclusive) clearly focussed on theexperience of dive guides responsible for overseeing the “shark dive.” It is possible that theseproposals may have highlighted inappropriate levels of experience and/or restricted the currentdiving practices among some of the respondents. This was clearly reflected in the lower levels ofacceptance of these proposals (Table 5.2, Proposals 2 – 3, 8 and 10 – 12 inclusive).
In developing the recommended “voluntary code of conduct for scuba diving with Grey NurseSharks” an 80% level of acceptance was used because this would result in a large majority ofrecreational scuba divers supporting the proposal. However, it was also important to note thatProposal 1 (Table 5.2) as proposed may have been interpreted in different ways by the respondents.This potential misunderstanding is likely to have arisen via differential interpretations of what wasmeant by the word “sanctuary.” Consequently, and in spite of the 83% support for Proposal 1(Table 5.2), this proposal was removed from the recommended code of conduct for scuba divingwith Grey Nurse Sharks (Table 5.4).
48 NSW Fisheries
EA Project No. 22499 Grey Nurse Sharks, Otway and Morrison
Table 5.4. Recommended voluntary code of conduct for scuba diving with Grey Nurse Sharks.
Code of conduct1. Do not block entrances to caves or gutters2. Do not interrupt the swimming pattern of the sharks3. Do not feed or touch the sharks4. Do not chase or harass the sharks (i.e. no mechanical apparatus such as scooters, horns and
anti-shark devices are to be used)5. Dive groups must not have more than 10 divers6. A dive brief is to be given by the dive leader before each dive7. All commercial operators are to be signatories to the Code of Conduct8. Code of Conduct is to be displayed in the shop and on the dive boat9. Dive operators are to participate in scientific research
There is an obvious need to engage in further discussion with the recreational diving industry overother proposals not currently part of the recommended code. Furthermore, it will be necessary toexamine ways of distributing this recommended code of conduct for scuba diving with Grey NurseSharks to a wider audience within the commercial and recreation diving community. This willnecessitate the publication of the code of conduct in popular dive magazines, and its incorporationwithin lectures as part of basic and higher scuba diving courses. Finally, consideration should begiven to incorporating the recommended code of conduct into the State and National recovery plansfor the Grey Nurse Shark.
NSW Fisheries 49
EA Project No. 22499 Grey Nurse Sharks, Otway and Morrison
6. SUMMARY AND CONCLUSIONS
The current project further quantified the distribution and abundance of Grey Nurse Sharks alongthe entire NSW coast. The maximum of 292 sharks, observed in the winter 2000 survey, supportsthe declaration of the Grey Nurse Shark as an endangered species under NSW FisheriesManagement Act 1994 & Amendments. Similarly, the data also support the declaration of thespecies as critically endangered under Commonwealth’s Environment Protection and BiodiversityConservation Act 1999.
The numbers of Grey Nurse Sharks exhibited substantial spatial and temporal variation along theentire NSW coast. Despite this, there were obvious patterns that were consistent between years andthis included the segregation by size and sex. However, it is important to note that the patternsobserved over these surveys may simply reflect the behaviour of a population in serious decline.Whether these or different patterns would have been evident 50 years ago is difficult to addressgiven the lack of biological information from that period of history.
The current project also identified and mapped sites important to the shark in the Batemans Shelfand Twofold Shelf Bioregions. Several of these sites proved to be key aggregation sites. Over the10 surveys, 12 aggregation sites accounted for 88.5% of the Grey Nurse Sharks observed.Newborn pups were also observed at these sites and this indicates that they also play an importantrole in reproduction.
This project developed a voluntary code of conduct for scuba diving with Grey Nurse Sharks withthe co-operation and input of numerous recreational scuba divers from various urban centres alongthe NSW coast. This Code of Conduct should be distributed widely and all scuba divers and thescuba diving industry should be encouraged to adopt it.
Information on reproduction, age, growth and mortality is generally regarded as a minimumrequirement for the ecologically sustainable management of a marine animal. The absence of thisinformation for the Grey Nurse Shark will make prioritising actions to recover the speciesextremely difficult. Consequently, it would be prudent to ensure that the actions needed to securethis information are given particular emphasis. To this end, this report has provided a detailedaccount of the information required and the many interlocking components of research andmanagement that will need to be done to ensure the recovery of the species.
Recovery plans (State and/or Commonwealth) for the Grey Nurse shark will need to redress thisfundamental lack of information. Moreover, it will be necessary for the recovery plans to developa range of criteria to measure the success (or otherwise) of the species. This report provides theresults of ongoing research together with the most recent synthesis of information concerning theGrey Nurse Shark. Consequently, it is recommended that information contained in this report beincorporated in the New South Wales, Queensland and National Recovery Plans for the Grey NurseShark.
50 NSW Fisheries
EA Project No. 22499 Grey Nurse Sharks, Otway and Morrison
7. REFERENCES
Agassiz, L. (1838). Recherches sur les poissons fossiles. Vol. 3. Contenant l’histoire de l’Ordredes Placoides (Text), vii, 1-390, 1-32. Vol. 3. Atlas, 83 plates (“Contenant 83 planchesde l’Ordre des Placoides”). Neuchâtel.
Amorin, A.F., Arfelli, C.A. and Fagundes, L. (1998). Pelagic elasmobranchs caught by longlinersoff southern Brazil during 1974-97: an overview. Marine and Freshwater Research 49:621-632.
Bailey, N.T.J. (1951). On estimating the size of mobile populations from recapture data.Biometrika 38: 293-306.
Bailey, N.T.J. (1952). Improvements in the interpretation of recapture data. Journal of AnimalEcology 21: 120-127.
Bass, A.J., D’Aubrey, J.D. and Kistnasamy, N. (1973). Sharks of the east coast of southern Africa.I. The genus Carcharhinus (Carcharhinidae). Oceanographic Research InstituteInvestigational Report 33: 1-168.
Bass, A.J., D’Aubrey, J.D. and Kistnasamy, N. (1975). Sharks of the east coast of SouthernAfrica. IV. The families, Odontaspididae, Scaponorhynichidae, Isuridae, Cetorhinidae,Alopiidae, Orectolobidae and Rhiniodontidae. Oceanographic Research InstituteInvestigational Report 39: 6-16.
Beamish, R.J. and McFarlane, G.A. (1983). The forgotten requirement for age validation infisheries biology. Trans. Am. Fish. Soc. 112(6): 735-743.
Beamish, R.J. and McFarlane, G.A. (1985). Annulus development in the second dorsal spine ofthe spiny dogfish (Squalus acanthias) and its validity for age determination. CanadianJournal of Fisheries and Aquatic Sciences 42:1799-805.
Bigelow, H.B. and Schroeder, W.C. (1948). Fishes of the western north Atlantic. Part 1.Lancelets, Cyclostomes and Sharks. Mem. Sears Fdn. Mar. Res. 1-576.
Branstetter, S. (1990). Early life-history implications of selected carcharhinoid and lamnoidsharks of the northwest Atlantic. In: Elasmobranchs as living resources: advances in thebiology, ecology, systematics, and the status of the fisheries. H.L. Pratt, Jr., S.H. Gruber& T. Taniuchi, eds. U.S. Dept. Commerce, NOAA Tech. Rep. NMFS 90, pp. 17-28.
Branstetter, S. and Musick, J.A. (1994). Age and growth estimates for the sand tiger shark in theNorthwestern Atlantic Ocean. Trans. Am. Fish. Soc. 123: 242-254.
Brown, T.W. (1973). Sharks – A Search For a Repellent. Angus and Robertson, Sydney.
Bruce, B.D. (1995). The protection of white shark. A research perspective. Southern Fisheries, 3(2): 10-15. Department of Primary Industries and Fisheries, Adelaide, SA.
Bureau of Resource Sciences (1996). Public nomination of Grey Nurse Shark, Carcharius taurus,to the Endangered Species Protection Act 1992. Fisheries Advice Note No. 446 FisheriesResources Branch, Canberra.
Cailliet, G.M., Martin, L.K., Harvey, J.T., Kusher, D. and Welden, B.A. (1983). Preliminarystudies on the age and growth of the blue, Prionace glauca, common thresher, Alopias
NSW Fisheries 51
EA Project No. 22499 Grey Nurse Sharks, Otway and Morrison
vulpinus, and shortfin mako, Isurus oxyrinchus, sharks from California waters. U.S. Dep.Commerce, NOAA Technical Report NMFS 8: 179-188.
Cailliet, G.M. (1992). Demography of the central California population of the leopard shark(Triakis semifasciata). Australian Journal of Marine and Freshwater Research 43: 183-193.
Cailliet, G.M., Mollet, H.F., Pittinger, G.G., Bedford, D. and Natanson, L.J. (1992). Growth anddemography of the Pacific angel shark (Squatina californica), based upon tag returns offCalifornia. Australian Journal of Marine and Freshwater Research 43: 1313-1330.
Caughley, G. (1977). Analysis of vertebrate populations. John Wiley & Sons, New York.
Caswell, H. (1989). Matrix Population Models: Construction, Analysis, and Interpretation.Sinauer Associates, Sunderland, Massachusetts.
Chiaramonte, G.E. (1998). Shark fisheries in Argentina. Marine and Freshwater Research 49:601-9.
Clark, E. and von Schmidt, K. (1965). Sharks of the central Gulf coast of Florida. Bull. Mar. Sci.15: 13-83.
Cliff, G. (Unpublished). The breeding migration of the sand tiger shark, Carcharias taurus, insouthern African waters. 12 pp.
Cliff, G., Dudley, S.F.J. and Davies, B. (1989). Sharks caught in the protective nets off Natal,South Africa. 2. The great white shark Carcharodon carcharias (Linnaeus). SouthAfrican Journal of Marine Science 8: 131-144.
Cliff, G. and Dudley, S.F.J. (1991). Sharks caught in the protective gill nets off Natal, SouthAfrica. 4. The bull shark Carcharhinus leucas (Valenciennes). South African Journal ofMarine Science 10: 253-270.
Cliff, G., Dudley, S.F.J. and Davis, B. (1990). Sharks caught in the protective gill nets off Natal,South Africa. 3. The shortfin mako shark Isurus oxyrinchus (Rafinesque). South AfricanJournal of Marine Science 9:115-126.
Cliff, G. and Thurman, G.D. (1984). Pathological and physiological effects of stress duringcapture and transport in the juvenile dusky shark, Carcharinus obscurus. ComparativeBiochemistry and Physiology 78A: 167-73.
Compagno, L.J.V. (1984). FAO Species Catalogue, Vol. 5. Sharks of the World. An annotatedand illustrated catalogue of shark species known to date. Part 1 Hexanchiformes toLamniformes. FAO Fisheries Synopsis 125(4) 249 pp.
Compagno, L.J.V. (1990). Shark exploitation and conservation. In: Elasmobranchs as livingresources: advances in the biology, ecology, systematics, and the status of the fisheries.H.L. Pratt, Jr., S.H. Gruber & T. Taniuchi, eds. U.S. Dept. Commerce, NOAA Tech.Rep. NMFS 90, pp. 391-414.
Coppelson, V.M. (1962). Shark Attack. 2nd edn. Angus and Robertson, Sydney.
Cortes, E. (1995). Demographic analysis of the Atlantic sharpnose shark, Rhizoprionodonterraenovae, in the Gulf of Mexico. Fisheries Bulletin 93: 57-66.
52 NSW Fisheries
EA Project No. 22499 Grey Nurse Sharks, Otway and Morrison
Cortes, E. and Parsons, G.R. (1996). Comparative demography of two populations of thebonnethead shark (Sphyrna tiburo). Canadian Journal of Fisheries and Aquatic Sciences53: 709-718.
Cortes, E. (2000). Life History Patterns and Correlations in Sharks. Reviews in Fisheries Science8(4): 299-344.
Cropp, B. (1964). Shark Hunters. Rigby, Adelaide. 192 pp.
Davies, D.H. and Joubert, L.S. (1966). Tag evaluation and shark tagging in South African waters.Investigational Report of the Oceanographic Research Institute. 12: 1-36.
Demography of the Sandtiger Shark Carcharias taurus (Rafinesque, 1810).[http://homepage.mac.com/mollet/Ct/DemographyCT.html].
De Roos, R. and De Roos, C. (1978). Elevation of plasma glucose levels by catecholamines inelasmobranch fish. General and Comparative Endocrinology 34: 447-452.
Dingerkus, G. (1989). Studying sharks in the Bahamas. Tropical Fish Hobbyist. February 1989,54-67.
Dudley, S.F.J. (1997). A comparison of the shark control programs of New South Wales andQueensland (Australia) and KwaZulu-Natal (South Africa). Ocean and CoastalManagement 34:1-27.
Eckersley, Y. (1996). Shark meshing is the net result justifiable? GEO Australia 18(5): 17-26.
Ecology Lab (1991). A preliminary survey of Grey Nurse Sharks (Carcharias taurus) andwobbegong sharks (Orectolobus spp.) at Seal Rocks, NSW. The Ecology Lab Pty. Ltd.,Balgowlah, NSW, Australia. 27 pp.
Edwards, H. (1997). Shark: the Shadow Below. Harper Collins Publishers, Sydney.
Environment Australia (1997). Report to the Minister – Public nomination to the EnvironmentProtection and Biodiversity Conservation Act 1999: Great white shark and Grey NurseShark – recommended by the Endangered Species Scientific Subcommittee in theThreatened Species and Communities Section.
Frankham, R. (1995). Effective size/adult population size ratios in wildlife: a review. GeneticsResearch 66: 95-107.
Frankham, R., Manning, H., Margan, S.H. and Briscoe, D.A. (2000). Does equalisation of familysizes reduce genetic adaptation to captivity? Animal Conservation 4: 357-363.
Frisk, M.G., Miller, T.J. and Fogarty, M.J. (2001). Estimation and analyses of biologicalparameters in elasmobranch fishes: a comparative life history study. Canadian Journal ofFisheries and Aquatic Sciences 58: 969-981.
Garbutt, R. (1995). Sharks under attack. Grey nurse numbers take a dive in fishing conflict. GEOAustralasia 17(4): 26-38.
Gardner, M.G. and Ward, R.D. (1998). Population structure of the Australian gummy shark(Mustelus antarcticus Gunther) inferred from allozymes, mitochondrial DNA andvertebrae counts. Marine and Freshwater Research 49: 733-745.
Gilbert, P.W. (1981). Patterns of shark reproduction. Oceanus 24: 30-39.
NSW Fisheries 53
EA Project No. 22499 Grey Nurse Sharks, Otway and Morrison
Gill, T. (1862). Analytical synopsis of the Order of Squali and revision of the nomenclature of thegenera: Squalorum Generum Novorum Descriptiones Diagnosticae. Annals of LyceumNatural History N. Y. 7(32): 367-413.
Gillanders, B.M., Ferrell, D.J. and Andrew, N.L. (2001). Estimates of movement and life-historyparameters of yellowtail kingfish (Seriola lalandi): how useful are data from acooperative tagging programme? Marine and Freshwater Research 52: 1-14.
Gilmore, R.G., Dodrill, J.W. and Linley, P.A. (1983). Reproduction and embryonic developmentof the sand tiger shark, Odontaspis taurus (Rafinesque). Fisheries Bulletin 81(2): 201-225.
Goadby, P. (1968). Sharks and Other Predatory Fish of Australia. Jacaranda Press Pty. Ltd,Brisbane.
Gordon, I. (1992). A new record extending the southerly distribution of shark ray (Rhinaancylostomus), and notes on the behaviour of the specimen in captivity. AustralianJournal of Marine and Freshwater Research 43: 319-323.
Govender, A., Kistnasamy, N. and Van Der Elst, R.P. (1991). Growth of spotted ragged-toothsharks Carcharias taurus (Rafinesque) in captivity. South African Journal of MarineScience 11: 15-19.
Grant, E.M. (1982). Guide to Fishes. Department of Harbours and Marine, Brisbane, QLD.
Gray, C.A. and Otway, N.M. (1994). Spatial and temporal differences in assemblages of demersalfishes on the inner continental shelf off Sydney, south-eastern Australia. AustralianJournal of Marine and Freshwater Research 45: 665-676.
Gruber, S.H. (1984). Bioenergetics of the captive and free-ranging lemon shark, pp.340-373. In:AAZPA 1984 Annual Conference Proceedings, September 9-13, Miami, Florida.
Gruber, S.H. and Keyes, R.S. (1981). Keeping sharks for research. In: Aquarium Systems. A.D.Hawkins ed. Academic Press/Harcourt Brace Jovanovich, London, pp. 373-402.
Hoenig, J.M. (1983). Empirical use of longevity data to estimate mortality rates. FisheriesBulletin 82: 898-903.
Hoenig, J.M. and Gruber, S.H. (1990). Life-history patterns in the elasmobranchs: implicationsfor fisheries management. In: Elasmobranchs as living resources: advances in thebiology, ecology, systematics, and the status of the fisheries. H.L. Pratt, Jr., S.H. Gruber& T. Taniuchi, eds. U.S. Dept. Commerce, NOAA Technical Report NMFS 90, pp. 1-16.
Hoenig, J.M., Barrowman, N.J., Hearn, W.S. and Pollock, K.H. (1998). Multiyear tagging studiesincorporating fishing effort data. Canadian Journal of Fisheries and Aquatic Sciences55:1466-76.
Holden, M.J. (1977). Elasmobranchs. In: Fish Population Dynamics. Gulland, J.A. (Ed.). JohnWiley & Sons, New York. pp. 187-215.
Holeton, G. and Heisler, N. (1978). Acid-base regulation by bicarbonate exchange in the gillsafter exhausting activity in the larger spotted dogfish Scyliorhinus stellaris. Physiologist21: 56.
IMCRA (1998). Interim Marine and Coastal Regionalisation for Australia: an ecosystem-basedclassification for marine and coastal environments. Version 3.3. Environment Australia,Commonwealth Department of the Environment. Canberra.
54 NSW Fisheries
EA Project No. 22499 Grey Nurse Sharks, Otway and Morrison
Ireland, D. (1984). The Grey Nurse Shark. Underwater 11: 10-13.
IUCN (1994). Guidelines for Protected Area Management Categories. IUCN Commission onNational Parks and Protected Areas, with the assistance of the World ConservationMonitoring Centre. Gland, Switzerland.
Klimley, A.P. (1987). The determinants of sexual segregation in the scalloped hammerhead shark,Sphyrna lewini. Environmental Biology of Fishes 18: 27-40.
Klimley, A.P. (1993). Highly directional swimming by scalloped hammerhead sharks, Sphyrnalewini, and subsurface irradiance, temperature, bathymetry, and geomagnetic field.Marine Biology 117: 1-22.
Klimley, A.P. and Brown, S.T. (1983). Stereophotography for the field biologist: measurement oflengths and three-dimensional positions of free-swimming sharks. Marine Biology 74:175-185.
Klippel, K. (1992). Wildlife Data Search: Threatened Animal Species of New South Wales. TotalEnvironment Centre Inc., Sydney, NSW, Australia
Krogh, M. (1994). Spatial, Seasonal and Biological Analysis of Sharks Caught in the NSWProtective Beach Meshing Programme. Australian Journal of Marine and FreshwaterResearch 45: 1087-1106.
Last, P.R. and Stevens, J.D. (1994). Sharks and Rays of Australia. CSIRO Division of Fisheries,Australia.
Lavery, S. (1992). Electrophoretic analysis of phylogenetic relationships among Australiancarcharhinid sharks. Australian Journal of Marine and Freshwater Research 43: 97-108.
Lavery, S. and Shaklee, J.B. (1991). Genetic evidence of separation of two sharks, Carcharhinuslimbatus and C. tilstoni, from northern Australia. Marine Biology (Berlin) 108: 1-4.
Lavery, S. and Shaklee, J.B. (1989). Population genetics of two tropical sharks, Carcharhinustilstoni and C. sorrah, in northern Australia. Australian Journal of Marine andFreshwater Research 40: 541-57.
Lenanton, R., Millington, P. and Smyth, C. (1989). Sharks and chips. Research and managementin southern WA’s edible shark fishery. Western Fisheries Management 1(3): 17-23.
Leslie, P.H. (1945). On the use of matrices in certain population mathematics. Biometrika 33:183-212.
Leslie, P.H. (1948). Some further notes on the use of matrices in certain population mathematics.Biometrika 35: 213-245.
Lincoln-Smith, M.P., Bell, J.D., Pollard, D.A. and Russell, B.C. (1989). Catch and effort ofcompetition spearfisherman in south-eastern Australia. Fisheries Research 8: 45-61.
Marin, Y.H., Brum, F., Barea, L.C. and Chocca, J.F. (1998). Incidental catch associated withswordfish longline fisheries in the south-west Atlantic Ocean. Marine and FreshwaterResearch 49: 633-640.
Marine Parks Authority (2002). Overview of the zoning plan, Solitary Islands Marine Park, April2002. Marine Parks Authority, Coffs Harbour, NSW. 21 pp.
Marsh, N. (1995). A Grey Future for the Grey Nurse Shark. Underwater Geographic 39: 39-42.
NSW Fisheries 55
EA Project No. 22499 Grey Nurse Sharks, Otway and Morrison
Martin, A.P. (1992). Mitochondrial DNA in sharks: molecular evolution and evolutionaryinferences. Ph.D. diss., Univ. of Hawaii, Honolulu, HI, 216 pp.
Martin, A.P. (1993). Application of mitochondrial DNA sequence analysis to the problem ofspecies identification of sharks. In: Conservation Biology of Elasmobranchs, pp. 53-59.U.S. Dep. Commerce, NOAA Technical Report NMFS 115.
Martin, A.P., Naylor, G.J.P. and Palumbi, S.R. (1992). The rate of nucleotide substitution insharks is slow compared to mammals. Nature 3-57: 153-155.
Mollet, H.F. and Cailliet, G.M. (2002). Comparative population demography of elasmobranchsusing life history tables, Leslie matrices and stage-based matrix models. Marine andFreshwater Research 53: 503-516.
Moss, S.A. (1984). Sharks: An Introduction for the Amateur Naturalist. Prentice-Hall, NewJersey.
Moritz, C., Dowling, T. and Brown, W. (1987). Evolution of animal mitochondrial DNA:relevance for population biology and systematics. Annual Review of Ecology andSystematics 18: 269-292.
Müller, J. and Henle, F.G.J. (1837). Gattugen der Haifische und Rochen, nach iher Arbeit: Ueberdie Naturgeschichte der Knorpelfische. Ber. K. Preuss. Akad. Wiss. Berl. 2: 111-118.
Naylor, G.J.P. (1989). The phylogenetic relationships of Carcharhiniform sharks inferred fromelectrophoretic data. Ph.D. diss., Univ.Maryland, 131 pp.
Nelson, D.R. (1990). Telemetry studies of sharks: a review, with applications in resourcemanagement. pp. 239-256. In: H.L. Pratt, S.H. Gruber & T. Taniuchi (ed.)Elasmobranchs as Living Resources: Advances in the Biology, Ecology, Systematics, andthe status of the Fisheries, U.S. Dept. Commerce, NOAA Technical Report NMFS 90.
Ogilby, J.D. (1911). Descriptions of new or insufficiently described fishes from Queenslandwaters. Annals of the Queensland Museum 10: 36-58.
Olsen, A.M. (1954). The biology, migration, and growth rate of the school shark, Galeorhinusaustralis (MacLeay) (Carcharhinidae) in southeastern Australian waters. AustralianJournal of Marine and Freshwater Research 5: 353-410.
Otway, N.M. (2001). Grey Nurse Shark. Nature Australia 26(12): 20-21.
Otway, N.M., Sullings, D.J. and Lenehan, N.W. (1996). Tropically-based assessment of theimpacts of deepwater sewage disposal on a demersal fish community. EnvironmentalBiology of Fishes 46: 167-183.
Otway, N.M. and Parker, P.C. (1999). A review of the biology and ecology of the Grey NurseShark (Carcharias taurus) Rafinesque 1810. Fisheries Report Series No. 1, NSWFisheries, 36 pp.
Otway, N.M. and Parker, P.C. (2000). The biology, ecology, distribution and abundance, andidentification of marine protected areas for the conservation of threatened Grey NurseSharks in south east Australian waters. NSW Fisheries Final Report Series No. 19. NSWFisheries, Sydney, NSW, Australia. 132 pp.
Parker, P.C. and Bucher, D.J. (2000). Seasonal variation in abundance and sex ratio of Grey Nurse(Sand Tiger) Sharks Carcharias taurus in northern New South Wales, Australia: a survey
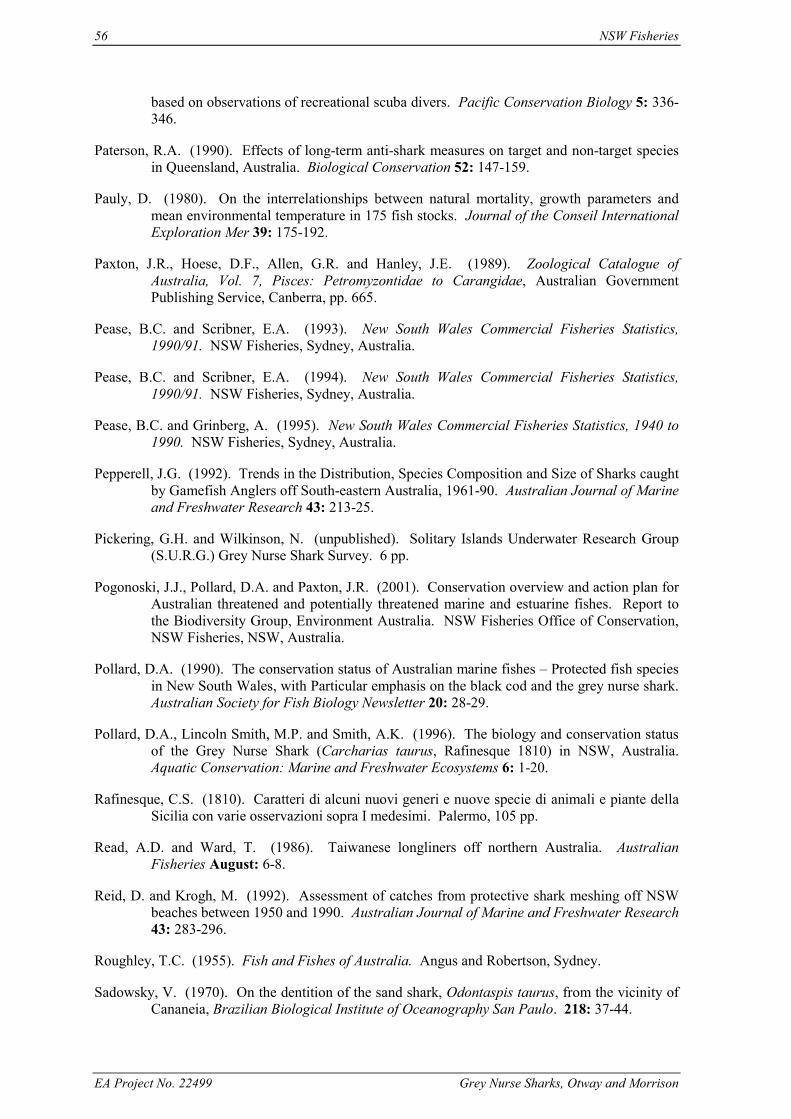
56 NSW Fisheries
EA Project No. 22499 Grey Nurse Sharks, Otway and Morrison
based on observations of recreational scuba divers. Pacific Conservation Biology 5: 336-346.
Paterson, R.A. (1990). Effects of long-term anti-shark measures on target and non-target speciesin Queensland, Australia. Biological Conservation 52: 147-159.
Pauly, D. (1980). On the interrelationships between natural mortality, growth parameters andmean environmental temperature in 175 fish stocks. Journal of the Conseil InternationalExploration Mer 39: 175-192.
Paxton, J.R., Hoese, D.F., Allen, G.R. and Hanley, J.E. (1989). Zoological Catalogue ofAustralia, Vol. 7, Pisces: Petromyzontidae to Carangidae, Australian GovernmentPublishing Service, Canberra, pp. 665.
Pease, B.C. and Scribner, E.A. (1993). New South Wales Commercial Fisheries Statistics,1990/91. NSW Fisheries, Sydney, Australia.
Pease, B.C. and Scribner, E.A. (1994). New South Wales Commercial Fisheries Statistics,1990/91. NSW Fisheries, Sydney, Australia.
Pease, B.C. and Grinberg, A. (1995). New South Wales Commercial Fisheries Statistics, 1940 to1990. NSW Fisheries, Sydney, Australia.
Pepperell, J.G. (1992). Trends in the Distribution, Species Composition and Size of Sharks caughtby Gamefish Anglers off South-eastern Australia, 1961-90. Australian Journal of Marineand Freshwater Research 43: 213-25.
Pickering, G.H. and Wilkinson, N. (unpublished). Solitary Islands Underwater Research Group(S.U.R.G.) Grey Nurse Shark Survey. 6 pp.
Pogonoski, J.J., Pollard, D.A. and Paxton, J.R. (2001). Conservation overview and action plan forAustralian threatened and potentially threatened marine and estuarine fishes. Report tothe Biodiversity Group, Environment Australia. NSW Fisheries Office of Conservation,NSW Fisheries, NSW, Australia.
Pollard, D.A. (1990). The conservation status of Australian marine fishes – Protected fish speciesin New South Wales, with Particular emphasis on the black cod and the grey nurse shark.Australian Society for Fish Biology Newsletter 20: 28-29.
Pollard, D.A., Lincoln Smith, M.P. and Smith, A.K. (1996). The biology and conservation statusof the Grey Nurse Shark (Carcharias taurus, Rafinesque 1810) in NSW, Australia.Aquatic Conservation: Marine and Freshwater Ecosystems 6: 1-20.
Rafinesque, C.S. (1810). Caratteri di alcuni nuovi generi e nuove specie di animali e piante dellaSicilia con varie osservazioni sopra I medesimi. Palermo, 105 pp.
Read, A.D. and Ward, T. (1986). Taiwanese longliners off northern Australia. AustralianFisheries August: 6-8.
Reid, D. and Krogh, M. (1992). Assessment of catches from protective shark meshing off NSWbeaches between 1950 and 1990. Australian Journal of Marine and Freshwater Research43: 283-296.
Roughley, T.C. (1955). Fish and Fishes of Australia. Angus and Robertson, Sydney.
Sadowsky, V. (1970). On the dentition of the sand shark, Odontaspis taurus, from the vicinity ofCananeia, Brazilian Biological Institute of Oceanography San Paulo. 218: 37-44.
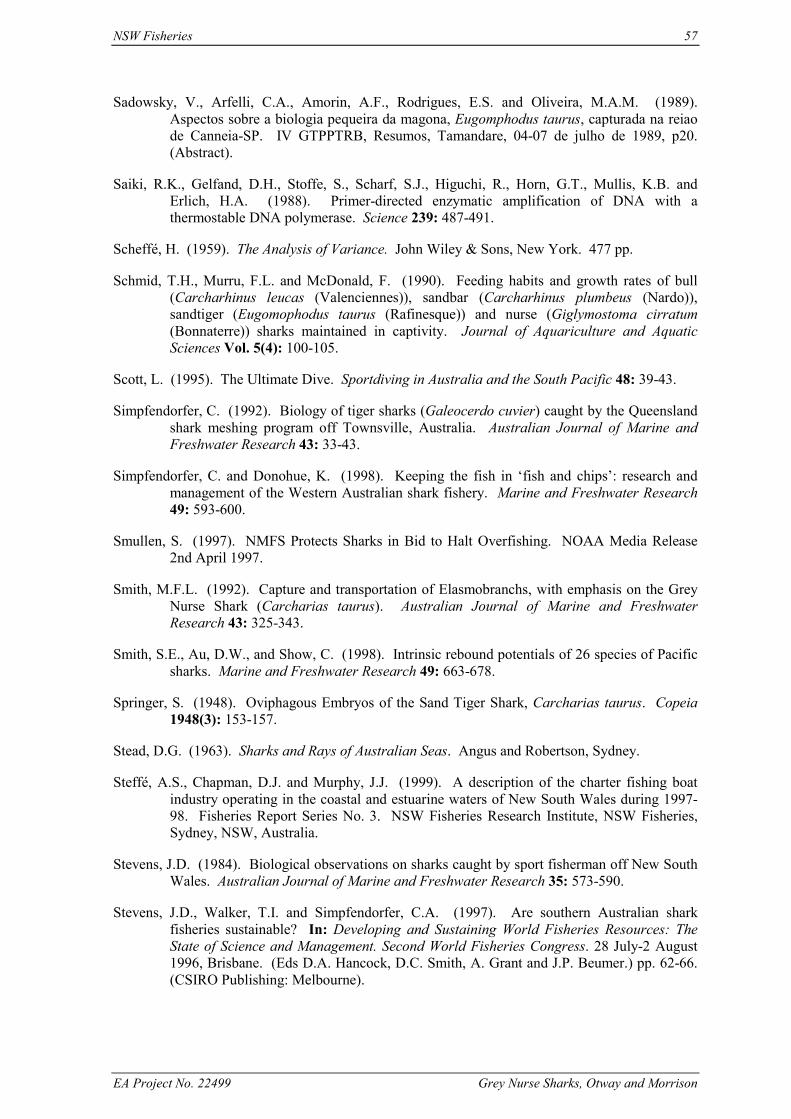
NSW Fisheries 57
EA Project No. 22499 Grey Nurse Sharks, Otway and Morrison
Sadowsky, V., Arfelli, C.A., Amorin, A.F., Rodrigues, E.S. and Oliveira, M.A.M. (1989).Aspectos sobre a biologia pequeira da magona, Eugomphodus taurus, capturada na reiaode Canneia-SP. IV GTPPTRB, Resumos, Tamandare, 04-07 de julho de 1989, p20.(Abstract).
Saiki, R.K., Gelfand, D.H., Stoffe, S., Scharf, S.J., Higuchi, R., Horn, G.T., Mullis, K.B. andErlich, H.A. (1988). Primer-directed enzymatic amplification of DNA with athermostable DNA polymerase. Science 239: 487-491.
Scheffé, H. (1959). The Analysis of Variance. John Wiley & Sons, New York. 477 pp.
Schmid, T.H., Murru, F.L. and McDonald, F. (1990). Feeding habits and growth rates of bull(Carcharhinus leucas (Valenciennes)), sandbar (Carcharhinus plumbeus (Nardo)),sandtiger (Eugomophodus taurus (Rafinesque)) and nurse (Giglymostoma cirratum(Bonnaterre)) sharks maintained in captivity. Journal of Aquariculture and AquaticSciences Vol. 5(4): 100-105.
Scott, L. (1995). The Ultimate Dive. Sportdiving in Australia and the South Pacific 48: 39-43.
Simpfendorfer, C. (1992). Biology of tiger sharks (Galeocerdo cuvier) caught by the Queenslandshark meshing program off Townsville, Australia. Australian Journal of Marine andFreshwater Research 43: 33-43.
Simpfendorfer, C. and Donohue, K. (1998). Keeping the fish in ‘fish and chips’: research andmanagement of the Western Australian shark fishery. Marine and Freshwater Research49: 593-600.
Smullen, S. (1997). NMFS Protects Sharks in Bid to Halt Overfishing. NOAA Media Release2nd April 1997.
Smith, M.F.L. (1992). Capture and transportation of Elasmobranchs, with emphasis on the GreyNurse Shark (Carcharias taurus). Australian Journal of Marine and FreshwaterResearch 43: 325-343.
Smith, S.E., Au, D.W., and Show, C. (1998). Intrinsic rebound potentials of 26 species of Pacificsharks. Marine and Freshwater Research 49: 663-678.
Springer, S. (1948). Oviphagous Embryos of the Sand Tiger Shark, Carcharias taurus. Copeia1948(3): 153-157.
Stead, D.G. (1963). Sharks and Rays of Australian Seas. Angus and Robertson, Sydney.
Steffé, A.S., Chapman, D.J. and Murphy, J.J. (1999). A description of the charter fishing boatindustry operating in the coastal and estuarine waters of New South Wales during 1997-98. Fisheries Report Series No. 3. NSW Fisheries Research Institute, NSW Fisheries,Sydney, NSW, Australia.
Stevens, J.D. (1984). Biological observations on sharks caught by sport fisherman off New SouthWales. Australian Journal of Marine and Freshwater Research 35: 573-590.
Stevens, J.D., Walker, T.I. and Simpfendorfer, C.A. (1997). Are southern Australian sharkfisheries sustainable? In: Developing and Sustaining World Fisheries Resources: TheState of Science and Management. Second World Fisheries Congress. 28 July-2 August1996, Brisbane. (Eds D.A. Hancock, D.C. Smith, A. Grant and J.P. Beumer.) pp. 62-66.(CSIRO Publishing: Melbourne).
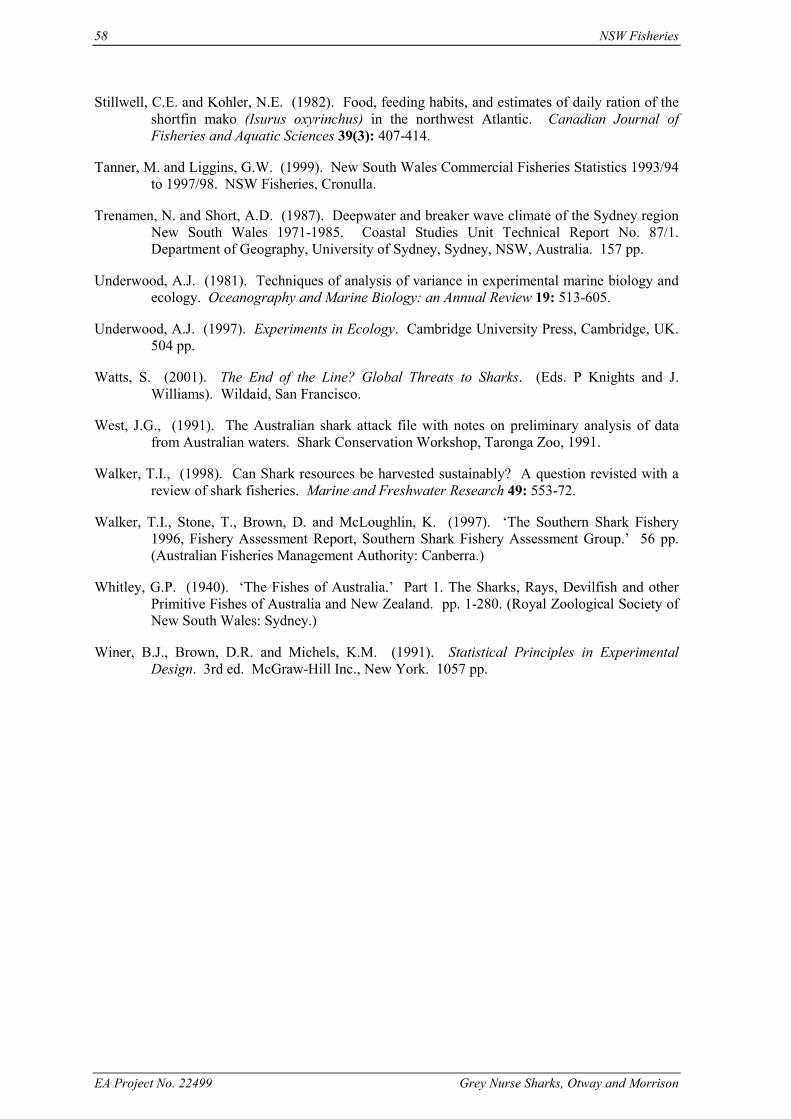
58 NSW Fisheries
EA Project No. 22499 Grey Nurse Sharks, Otway and Morrison
Stillwell, C.E. and Kohler, N.E. (1982). Food, feeding habits, and estimates of daily ration of theshortfin mako (Isurus oxyrinchus) in the northwest Atlantic. Canadian Journal ofFisheries and Aquatic Sciences 39(3): 407-414.
Tanner, M. and Liggins, G.W. (1999). New South Wales Commercial Fisheries Statistics 1993/94to 1997/98. NSW Fisheries, Cronulla.
Trenamen, N. and Short, A.D. (1987). Deepwater and breaker wave climate of the Sydney regionNew South Wales 1971-1985. Coastal Studies Unit Technical Report No. 87/1.Department of Geography, University of Sydney, Sydney, NSW, Australia. 157 pp.
Underwood, A.J. (1981). Techniques of analysis of variance in experimental marine biology andecology. Oceanography and Marine Biology: an Annual Review 19: 513-605.
Underwood, A.J. (1997). Experiments in Ecology. Cambridge University Press, Cambridge, UK.504 pp.
Watts, S. (2001). The End of the Line? Global Threats to Sharks. (Eds. P Knights and J.Williams). Wildaid, San Francisco.
West, J.G., (1991). The Australian shark attack file with notes on preliminary analysis of datafrom Australian waters. Shark Conservation Workshop, Taronga Zoo, 1991.
Walker, T.I., (1998). Can Shark resources be harvested sustainably? A question revisted with areview of shark fisheries. Marine and Freshwater Research 49: 553-72.
Walker, T.I., Stone, T., Brown, D. and McLoughlin, K. (1997). ‘The Southern Shark Fishery1996, Fishery Assessment Report, Southern Shark Fishery Assessment Group.’ 56 pp.(Australian Fisheries Management Authority: Canberra.)
Whitley, G.P. (1940). ‘The Fishes of Australia.’ Part 1. The Sharks, Rays, Devilfish and otherPrimitive Fishes of Australia and New Zealand. pp. 1-280. (Royal Zoological Society ofNew South Wales: Sydney.)
Winer, B.J., Brown, D.R. and Michels, K.M. (1991). Statistical Principles in ExperimentalDesign. 3rd ed. McGraw-Hill Inc., New York. 1057 pp.
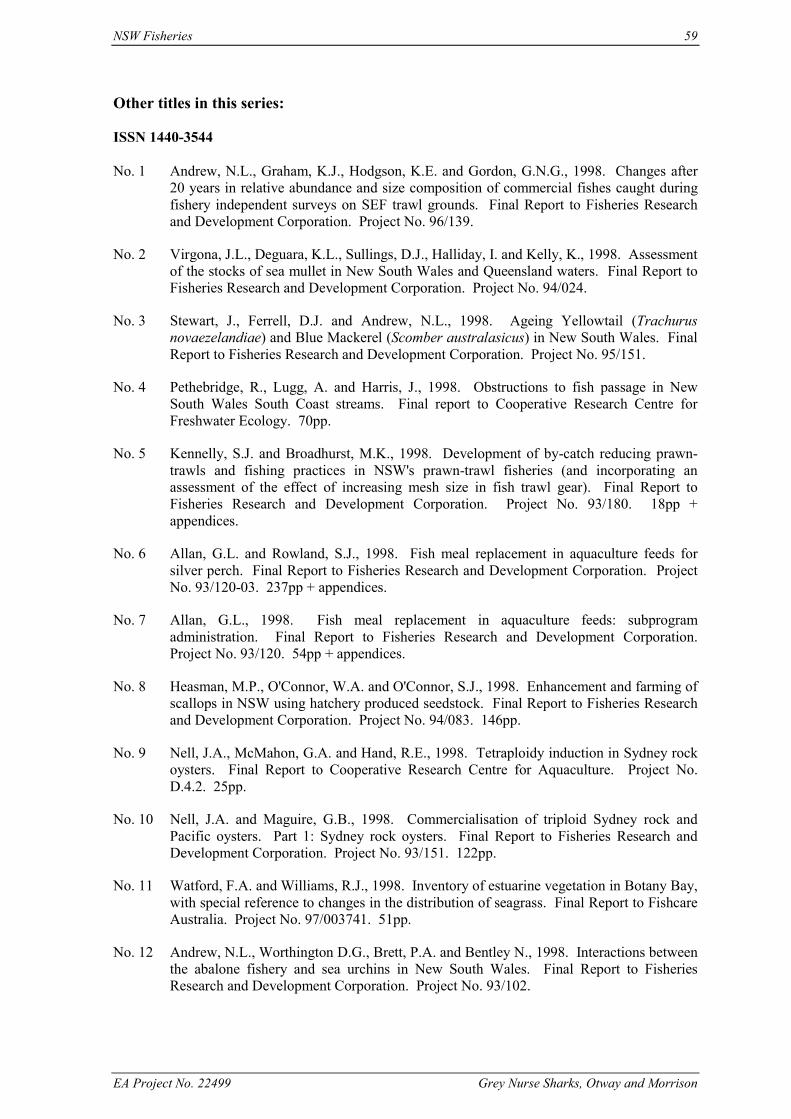
NSW Fisheries 59
EA Project No. 22499 Grey Nurse Sharks, Otway and Morrison
Other titles in this series:
ISSN 1440-3544
No. 1 Andrew, N.L., Graham, K.J., Hodgson, K.E. and Gordon, G.N.G., 1998. Changes after20 years in relative abundance and size composition of commercial fishes caught duringfishery independent surveys on SEF trawl grounds. Final Report to Fisheries Researchand Development Corporation. Project No. 96/139.
No. 2 Virgona, J.L., Deguara, K.L., Sullings, D.J., Halliday, I. and Kelly, K., 1998. Assessmentof the stocks of sea mullet in New South Wales and Queensland waters. Final Report toFisheries Research and Development Corporation. Project No. 94/024.
No. 3 Stewart, J., Ferrell, D.J. and Andrew, N.L., 1998. Ageing Yellowtail (Trachurusnovaezelandiae) and Blue Mackerel (Scomber australasicus) in New South Wales. FinalReport to Fisheries Research and Development Corporation. Project No. 95/151.
No. 4 Pethebridge, R., Lugg, A. and Harris, J., 1998. Obstructions to fish passage in NewSouth Wales South Coast streams. Final report to Cooperative Research Centre forFreshwater Ecology. 70pp.
No. 5 Kennelly, S.J. and Broadhurst, M.K., 1998. Development of by-catch reducing prawn-trawls and fishing practices in NSW's prawn-trawl fisheries (and incorporating anassessment of the effect of increasing mesh size in fish trawl gear). Final Report toFisheries Research and Development Corporation. Project No. 93/180. 18pp +appendices.
No. 6 Allan, G.L. and Rowland, S.J., 1998. Fish meal replacement in aquaculture feeds forsilver perch. Final Report to Fisheries Research and Development Corporation. ProjectNo. 93/120-03. 237pp + appendices.
No. 7 Allan, G.L., 1998. Fish meal replacement in aquaculture feeds: subprogramadministration. Final Report to Fisheries Research and Development Corporation.Project No. 93/120. 54pp + appendices.
No. 8 Heasman, M.P., O'Connor, W.A. and O'Connor, S.J., 1998. Enhancement and farming ofscallops in NSW using hatchery produced seedstock. Final Report to Fisheries Researchand Development Corporation. Project No. 94/083. 146pp.
No. 9 Nell, J.A., McMahon, G.A. and Hand, R.E., 1998. Tetraploidy induction in Sydney rockoysters. Final Report to Cooperative Research Centre for Aquaculture. Project No.D.4.2. 25pp.
No. 10 Nell, J.A. and Maguire, G.B., 1998. Commercialisation of triploid Sydney rock andPacific oysters. Part 1: Sydney rock oysters. Final Report to Fisheries Research andDevelopment Corporation. Project No. 93/151. 122pp.
No. 11 Watford, F.A. and Williams, R.J., 1998. Inventory of estuarine vegetation in Botany Bay,with special reference to changes in the distribution of seagrass. Final Report to FishcareAustralia. Project No. 97/003741. 51pp.
No. 12 Andrew, N.L., Worthington D.G., Brett, P.A. and Bentley N., 1998. Interactions betweenthe abalone fishery and sea urchins in New South Wales. Final Report to FisheriesResearch and Development Corporation. Project No. 93/102.
60 NSW Fisheries
EA Project No. 22499 Grey Nurse Sharks, Otway and Morrison
No. 13 Jackson, K.L. and Ogburn, D.M., 1999. Review of depuration and its role in shellfishquality assurance. Final Report to Fisheries Research and Development Corporation.Project No. 96/355. 77pp.
No. 14 Fielder, D.S., Bardsley, W.J. and Allan, G.L., 1999. Enhancement of Mulloway(Argyrosomus japonicus) in intermittently opening lagoons. Final Report to FisheriesResearch and Development Corporation. Project No. 95/148. 50pp + appendices.
No. 15 Otway, N.M. and Macbeth, W.G., 1999. The physical effects of hauling on seagrassbeds. Final Report to Fisheries Research and Development Corporation. Project No.95/149 and 96/286. 86pp.
No. 16 Gibbs, P., McVea, T. and Louden, B., 1999. Utilisation of restored wetlands by fish andinvertebrates. Final Report to Fisheries Research and Development Corporation. ProjectNo. 95/150. 142pp.
No. 17 Ogburn, D. and Ruello, N., 1999. Waterproof labelling and identification systemssuitable for shellfish and other seafood and aquaculture products. Whose oyster is that?Final Report to Fisheries Research and Development Corporation. Project No. 95/360.50pp.
No. 18 Gray, C.A., Pease, B.C., Stringfellow, S.L., Raines, L.P. and Walford, T.R., 2000.Sampling estuarine fish species for stock assessment. Includes appendices by D.J.Ferrell, B.C. Pease, T.R. Walford, G.N.G. Gordon, C.A. Gray and G.W. Liggins. FinalReport to Fisheries Research and Development Corporation. Project No. 94/042. 194pp.
No. 19 Otway, N.M. and Parker, P.C., 2000. The biology, ecology, distribution, abundance andidentification of marine protected areas for the conservation of threatened Grey NurseSharks in south east Australian waters. Final Report to Environment Australia. 101pp.
No. 20 Allan, G.L. and Rowland, S.J., 2000. Consumer sensory evaluation of silver perchcultured in ponds on meat meal based diets. Final Report to Meat & Livestock Australia.Project No. PRCOP.009. 21pp + appendices.
No. 21 Kennelly, S.J. and Scandol, J. P., 2000. Relative abundances of spanner crabs and thedevelopment of a population model for managing the NSW spanner crab fishery. FinalReport to Fisheries Research and Development Corporation. Project No. 96/135. 43pp +appendices.
No. 22 Williams, R.J., Watford, F.A. and Balashov, V., 2000. Kooragang WetlandRehabilitation Project: History of changes to estuarine wetlands of the lower HunterRiver. Final Report to Kooragang Wetland Rehabilitation Project Steering Committee.82pp.
No. 23 Survey Development Working Group, 2000. Development of the National Recreationaland Indigenous Fishing Survey. Final Report to Fisheries Research and DevelopmentCorporation. Project No. 98/169. (Volume 1 – 36pp + Volume 2 – attachments).
No.24 Rowling, K.R and Raines, L.P., 2000. Description of the biology and an assessment ofthe fishery of Silver Trevally Pseudocaranx dentex off New South Wales. Final Reportto Fisheries Research and Development Corporation. Project No. 97/125. 69pp.
No. 25 Allan, G.L., Jantrarotai, W., Rowland, S., Kosuturak, P. and Booth, M., 2000. Replacingfishmeal in aquaculture diets. Final Report to the Australian Centre for InternationalAgricultural Research. Project No. 9207. 13pp.
NSW Fisheries 61
EA Project No. 22499 Grey Nurse Sharks, Otway and Morrison
No. 26 Gehrke, P.C., Gilligan, D.M. and Barwick, M., 2001. Fish communities and migration inthe Shoalhaven River – Before construction of a fishway. Final Report to SydneyCatchment Authority. 126pp.
No. 27 Rowling, K.R. and Makin, D.L., 2001. Monitoring of the fishery for Gemfish Rexeasolandri, 1996 to 2000. Final Report to the Australian Fisheries Management Authority.44pp.
No. 28 Otway, N.M., 1999. Identification of candidate sites for declaration of aquatic reservesfor the conservation of rocky intertidal communities in the Hawkesbury Shelf andBatemans Shelf Bioregions. Final report to Environment Australia for the MarineProtected Areas Program. Project No. OR22. 88pp.
No. 29 Heasman, M.P., Goard, L., Diemar, J. and Callinan, R., 2000. Improved Early Survivalof Molluscs: Sydney Rock Oyster (Saccostrea glomerata). Final Report to theAquaculture Cooperative Research Centre. Project No. A.2.1. 63pp.
No. 30 Allan, G.L., Dignam, A and Fielder, S., 2001. Developing Commercial Inland SalineAquaculture in Australia: Part 1. R&D Plan. Final Report to Fisheries Research andDevelopment Corporation. Project No. 1998/335.
No. 31 Allan, G.L., Banens, B. and Fielder, S., 2001. Developing Commercial Inland SalineAquaculture in Australia: Part 2. Resource Inventory and Assessment. Final report toFisheries Research and Development Corporation. Project No. 1998/335. 33pp.
No. 32 Bruce, A., Growns, I. and Gehrke, P., 2001. Woronora River Macquarie Perch Survey.Final report to Sydney Catchment Authority, April 2001. 116pp.
No. 33 Morris, S.A., Pollard, D.A., Gehrke, P.C. and Pogonoski, J.J., 2001. Threatened andPotentially Threatened Freshwater Fishes of Coastal New South Wales and the Murray-Darling Basin. Report to Fisheries Action Program and World Wide Fund for Nature.Project No. AA 0959.98. 177pp.
No. 34 Heasman, M.P., Sushames, T.M., Diemar, J.A., O’Connor, W.A. and Foulkes, L.A.,2001. Production of Micro-algal Concentrates for Aquaculture Part 2: Development andEvaluation of Harvesting, Preservation, Storage and Feeding Technology. Final Reportto Fisheries Research and Development Corporation. Project No. 1993/123 and1996/342. 150pp + appendices.
No. 35 Stewart, J. and Ferrell, D.J., 2001. Mesh selectivity in the NSW demersal trap fishery.Final Report to Fisheries Research and Development Corporation. Project No. 1998/138.86pp.
No. 36 Stewart, J., Ferrell, D.J., van der Walt, B., Johnson, D. and Lowry, M., 2001. Assessmentof length and age composition of commercial kingfish landings. Final Report to FisheriesResearch and Development Corporation. Project No. 1997/126. 49pp.
No. 37 Gray, C.A. and Kennelly, S.J., 2001. Development of discard-reducing gears andpractices in the estuarine prawn and fish haul fisheries of NSW. Final Report to FisheriesResearch and Development Corporation. Project No. 1997/207. 151pp.
No. 38 Murphy, J.J., Lowry, M.B., Henry, G.W. and Chapman, D., 2002. The GamefishTournament Monitoring Program – 1993 to 2000. Final Report to Australian FisheriesManagement Authority. 93pp.
62 NSW Fisheries
EA Project No. 22499 Grey Nurse Sharks, Otway and Morrison
No. 39 Kennelly, S.J. and McVea, T.A. (Ed), 2002. Scientific reports on the recovery of theRichmond and Macleay Rivers following fish kills in February and March 2001. 325pp.
No. 40 Pollard, D.A. and Pethebridge, R.L., 2002. Report on Port of Botany Bay IntroducedMarine Pest Species Survey. Final Report to Sydney Ports Corporation. 69pp.
No. 41 Pollard, D.A. and Pethebridge, R.L., 2002. Report on Port Kembla Introduced MarinePest Species Survey. Final Report to Port Kembla Port Corporation. 72pp.
No. 42 O’Connor, W.A, Lawler, N.F. and Heasman, M.P., 2003. Trial farming the akoya pearloyster, Pinctada imbricata, in Port Stephens, NSW. Final Report to Australian RadiataPty. Ltd. 170pp.
No. 43 Fielder, D.S. and Allan, G.L., 2003. Improving fingerling production and evaluatinginland saline water culture of snapper, Pagrus auratus. Final Report to the AquacultureCooperative Research Centre. Project No. C4.2. 62pp.
No. 44 Astles, K.L., Winstanley, R.K., Harris, J.H. and Gehrke, P.C., 2003. Experimental studyof the effects of cold water pollution on native fish. A final report for the RegulatedRivers and Fisheries Restoration Project. 55pp.
No. 45 Gilligan, D.M., Harris, J.H. and Mallen-Cooper, M., 2003. Monitoring changes in theCrawford River fish community following replacement of an effective fishway with avertical-slot fishway design: Results of an eight year monitoring program. Final Reportto the Cooperative Research Centre for Freshwater Ecology. 80pp.
No. 46 Pollard, D.A. and Rankin, B.K., 2003. Port of Eden Introduced Marine Pest SpeciesSurvey. Final Report to Coasts & Clean Seas Program. 67pp.
No. 47 Otway, N.M., Burke, A.L., Morrison, NS. and Parker, P.C., 2003. Monitoring andidentification of NSW Critical Habitat Sites for conservation of Grey Nurse Sharks. FinalReport to Environment Australia. Project No. 22499. 62pp.