monitoring and enforcement of environmental regulations - … · 2012-02-09 · monitoring and...
TRANSCRIPT

Discussion Papers
Statistics NorwayResearch department
No. 680 •February 2012
Kjetil Telle
Monitoring and enforcement of environmental regulationsLessons from a natural fi eld experiment in Norway
Discussion Papers No. 680, February 2012 Statistics Norway, Research Department
Kjetil Telle
Monitoring and enforcement of environmental regulations Lessons from a natural field experiment in Norway
Abstract: Relying on a small natural field experiment with random assignment of treatments, I estimate effects of three core elements of most monitoring and enforcement practices: self-reporting, audit frequency and specific deterrence. I find evidence of evasive reporting of violations in self-audits, as more violations are detected in on-site audits than in self-audits. Announcing the increased audit frequency has no effect on compliance, but an audit raises the firm’s subsequent compliance substantially.
Keywords: environmental regulation, enforcement, EPA, natural field experiment, random assignment
JEL classification: K42, C93, Q58, D21, H41
Acknowledgements: I would like to thank Karine Nyborg, Sandra Rousseau and Jay Shimshack, as well as participants at several seminars, for encouraging and helpful comments. I am grateful to the Norwegian Environmental Protection Agency (Klima- og forurensningsdirektoratet) for outstanding cooperation on this project, and I would particularly like to thank Inger Marie Haaland, Line Telje Høydal, Gro Hagen, Einar Knutsen, Cecilie Kristiansen, Ragnhild Orvik and Anne Marie Mo Ravik. The usual disclaimer applies.
Address: Kjetil Telle, Statistics Norway, Research Department. E-mail: [email protected]

Discussion Papers comprise research papers intended for international journals or books. A preprint of a Discussion Paper may be longer and more elaborate than a standard journal article, as it may include intermediate calculations and background material etc.
© Statistics Norway Abstracts with downloadable Discussion Papers in PDF are available on the Internet: http://www.ssb.no http://ideas.repec.org/s/ssb/dispap.html For printed Discussion Papers contact: Statistics Norway Telephone: +47 62 88 55 00 E-mail: [email protected] ISSN 0809-733X Print: Statistics Norway

3
Sammendrag
Klima- og forurensningsdirektoratet (Klif) driver tilsyn med bedrifters overholdelse av ulike typer
miljøreguleringer. Tilsynet med deler av disse reguleringene er utført på en måte som gjør det mulig å
teste effekter av tilsynsvirksomheten. Ved å benytte dette lille, naturlig felteksperimentet med tilfeldig
trekking av tilsynstyper beregner jeg effekten av tre trekk ved de fleste tilsynsvirksomheter: selv-
rapportering, kontrollhyppighet og individualavskrekking. Jeg finner klare tegn til unndragende
rapportering av avvik i egenkontroller, da flere avvik avdekkes i besøkskontroller enn i egenkontroller.
Å annonsere økt kontrollhyppighet har ingen effekt på overholdelsen av regelverket, men en kontroll
øker bedriftens etterfølgende overholdelse betydelig.
4
1. Introduction Environmental protection agencies (EPAs) suffer from the recent cutting of public expenses in most
Western countries. In April 2011, the budget of the U.S. EPA was cut by 16 percent for the fiscal year,
and further cuts have been advocated. This accentuates the need to identify and implement cost
effective monitoring and enforcement policies that do in fact reduce violations of environmental
regulations.
Audits and self-reporting are core elements of agencies’ monitoring and enforcement practices, and
the theoretical foundation of these practices is persuasive (Becker 1968, Stigler 1970, Russell et al.
1986, Heyes 2000, Polinsky and Shavell 2007). The empirical literature of the effectiveness and
efficiency of monitoring and enforcement of environmental regulations is also growing, but it lacks
evidence from field experiments (Gray and Shimshack 2010, 2011).1
The current paper presents results from the first natural field experiment2 on effects of monitoring and
enforcement activities of EPAs. Three core elements of most monitoring and enforcement practices
are investigated using random assignment of treatments; the extent of evasive reporting in self-audits,
the effect of increased audit frequency and the effect of specific deterrence (i.e. post-audit compliance
behavior). The main finding of the current experiment is that violations are evaded in self-audits
compared with on-site audits. Moreover, while I find evidence of substantial reductions in violations
after an audit, the results indicate that effects of higher audit frequency are negligible in the
investigated regulatory setting. I argue that the lack of effect of higher audit frequency is related to the
extensive use of warnings, which is typical for the monitoring and enforcement policy of EPAs of
many Western countries (Russell 1990, Nyborg and Telle 2004, 2006, Rousseau 2009). It thus seems
important for an agency with declining budgets that wants to restrain violations of environmental
regulations, to make threats of monitoring and enforcement actions bite. Overall, the study raises
serious concerns that a shift toward reliance on cheaper and softer monitoring and enforcement
practices, like self-reporting and voluntary disclosure programs, could undermine compliance with
environmental regulations.
1 A few natural field experiments on monitoring and enforcement exist in the tax literature; see e.g. Kleven et al. (2011), Pomeranz (2010) and Slemrod et al. (2001). 2 The treatments of this experiment were embedded in the typical monitoring and enforcement activities of the Norwegian EPA, and the firms did not know that they were part of an experiment. Following the terminology of Harrison and List (2004), the current paper thus reports results from a “natural field experiment”.

5
The paper is laid out as follows. The next section starts by underlining potential endogeneity biases
discussed in previous empirical studies, and points at the ability of natural field experiments to provide
estimates with a straightforward causal interpretation. Then theoretical and empirical support for the
reliability of information from self-audits, as well as for the impact of increased audit frequency and
specific deterrence, is discussed. Section 3 describes the Norwegian institutional setting within which
the current experiment is conducted, and outlines the experimental design. Data and estimation
methods are also outlined in Section 3. Section 4 presents the results, and Section 5 concludes.
2. Empirical studies and theoretical background Scholars and policymakers seem to agree that regulatory compliance hinges on the implemented
monitoring and enforcement policies. Still, it remains difficult to empirically establish effects of
various types of such policies. The fundamental problem – which is well recognized and discussed in
the literature - is that enforcement efforts are not exogenous but typically an endogenous response by
the enforcement agency to the perceived compliance behavior of the firms (Gray and Shimshack 2010,
2011, Harrington 1988, Helland 1998, Kleven et al. 2011).3
The virtue of a controlled experiment with random assignment is that the source of variation in
monitoring and enforcement activities is exogenous. Relying on random assignment, the enforcement
activity directed at a firm is independent of strategic behavior by the firm or by the agency. Thus,
random assignment of enforcement activities handles the selection problem that complicates
interpretations of results from studies using comparison groups that are not randomly assigned.4
Andreoni et al. (1998) survey the literature on tax compliance (see also Slemrod and Yitzhaki 2002,
Slemrod 2007 and Kleven et al. 2010 for surveys of the tax literature), and point out that traditional
policy instruments, like (threats of) audits and punishment, are believed to work. However, their sober
review of the empirical support for these believes indicate that even core theoretical predictions, such
3 Within the literature on environmental regulations, scholars have applied several strategies to address such endogeneity issues. Examples of more sophisticated strategies include using variation in rules across states and time (both in reduced form models and in more structural models) and reliance on instrumental variable approaches (e.g. Alberini and Austin 2002, Stafford 2003, Shimshack and Ward 2005, Sigman 2010). Within the tax literature there are also some studies addressing such endogeneity issues by relying on instrumental variables, but valid instruments are scarce (List 2006), and Andreoni et al. (1998) and Slemrod and Yitzhaki (2002) review tax studies and claim that none of the available instruments are likely to be valid. 4 Ensuring exogenous variation, lab experiments have provided renewed insight into a number of issues related to monitoring and enforcement theory. However, the main problem is that lab environments are intrinsically artificial, and therefore not unlikely to miss important aspects of the real-world environment (Slemrod et al. 2001, Kleven et al. 2011, List 2006, Harrison and List 2004).
6
as threats of audit and specific deterrence, are not well-documented empirically. Though the natural
field experiment by Kleven et al. (2011) stands out as an exception, empirical documentation in the tax
literature of effects of monitoring and enforcement policies remains scant. In their recent review of
enforcement of environmental regulations, Gray and Shimshack (2010, 2011) discuss the fundamental
problems using observational data in estimating effects of monitoring and enforcement activities, and
they conclude by calling for field experiments to “transparently reveal the impacts of different
enforcement activities” (2010, p. 34). This is in line with previous reviews of the role of regulatory
actions by EPAs in enforcing environmental regulations, pointing at the pervasive concern that results
from studies using observational data are potentially biased (Cohen 2000, Heyes 2002, Glicksman and
Earnhart 2007).
The present paper presents results from the first natural field experiment on effects of monitoring and
enforcement policies in the domain of environmental regulations. This enables us to address three
fundamental elements of most enforcement policies: the reliability of information from self-audits, the
effect of specific deterrence and the effect of increased audit frequency.
The reliability of information in self-audits is undermined by the fact that firms will have incentives to
mis-report. In a simple Becker (1968) framework,5 self-reporting is accurate only to the extent that it
serves the firm (in expectation terms). Since punishment for deliberate mis-reporting is typically
considered fraud and punished severely, EPAs seem to believe that information obtained in self-
reports is useful for their monitoring and enforcement activities (Pfaff and Sanchirico 2004). In the
literature, however, there is an ongoing debate about the effectiveness of policies relying on self-
reporting; including theoretical studies, empirical analyses and lab experiments (e.g. Kambhu 1989,
Malik 1993, Heyes 1994, Livernois and McKenna 1999, Stafford 2008, Lin 2010, Innes 1999, 2001,
Brehm and Hamilton 1996, Langpap 2008, Murphy and Stranlund 2007).6
5 Important contributions also include Stigler (1970), and Russell et al. (1986) who adjusted these theories to an environmental setting. The general literature is surveyed by Polinsky and Shavell (2007), and Heyes (2000) provide an overview of applications of the rational crime model within the field of environmental economics. 6 While studies in the tax literature indicate that underreporting of tax liabilities is common (possibly close to 20 percent; see Andreoni et al. 1998, Bloomquist et al. 2005, Slemrod 2007, Internal Revenue Service 2008, Kleven et al. 2011), there are some important differences between the institutional setting of individuals’ reporting tax liabilities and the setting of firms reporting compliance with environmental regulations. An audit by the tax authorities typically include looking for inconsistency within tax returns, collecting information from third-parties and requiring additional documentation. An audit in the domain of environmental regulations, however, typically includes on-site audits lasting from a few hours to several weeks. Importantly, the likelihood of detection by others than the enforcement authority can be substantial for pollution of the environment, and the audit frequency is typically much higher for firms subject to environmental regulations than for individuals’ tax returns. Maybe for such reasons, information in self-audits are generally believed adequately reliable by EPAs (Pfaff and Sanchirico 2004, Nyborg and Telle 2006).
7
In any case, the empirical documentation of the correctness of such beliefs is scant, and an important
contribution of the present paper is to provide the first experimental field evidence on the presence and
extent of evasive reporting in self-audits in the domain of environmental regulations.
Specific deterrence can be defined as the extent to which regulatory actions deter subsequent
violations at the audited or sanctioned unit (Gray and Shimshack 2011). Starting with the Becker
theory, there are several reasons why being audited today can improve future compliance. First, being
audited today can increase expected future punishment of non-compliance. To the extent that EPAs
target previously observed violators, a bad-performing firm will expect future audit and detection
probability to increases. There is some empirical indication of this (e.g. Harrington 1988, Nyborg and
Telle 2006, Rousseau 2007), as well as some indication that EPAs provide violators with warnings,
thus only sanctioning offenders that fail to comply upon detection (e.g. Russell 1990, Nyborg and
Telle 2004, 2006, Eckert 2004, Rousseau 2009). In these cases, being audited increases the perceived
probability of future audit and sanctions and thereby raises the incentives for compliance in the
future.7
Second, being audited today can reduce (expected) future costs of compliance. Thorough audits
require the firm to spend time on understanding the regulation and on how to adopt to be able to meet
the requirements. Indeed, during audits, EPAs typically try to convey knowledge to the firm on
production processes and technical solutions that are environmentally friendly. Thus, an audit may
have an “education effect” on the firm, which lowers future compliance costs and thereby raises future
incentives to comply.8
In their survey of the literature, Gray and Shimshack (2011, p. 20) conclude that “environmental
monitoring and enforcement activities generate substantial specific deterrence, reducing future
violations at the targeted firm”. They note, however, that the scope for strategic behavior, both by the
7 From a methodological point of view, it is worth noting that if audits have substantial spill-over effects on non-audited firms, then an audit will also reduce the non-compliance of non-audited firms (e.g. Shimshack and Ward 2005, Gray and Shadbegian 2007). This will result in a downward bias in the estimate of the specific deterrence effect (since the control group has been partly treated). Moreover, if firms postpone complying till they receive a warning, we may observe a big specific deterrence effect. The practice of issuing warnings, which is common among many EPAs, is discussed by Nyborg and Telle (2006). They conclude, however, that warnings are used for non-serious violations, and, in any case, that warnings do represent a de facto cost on violators. 8 Some lab experiments from the tax literature support the existence of such specific deterrence effects, but “studies based on actual audit data conflict with the experimental findings” (Andreoni et al. 1998, p. 843). Kleven et al. (2011) points at methodological problems in previous studies on the effect of audits on subsequent reporting of tax liabilities, and argue that the few previous studies have not been able to identify a significant relationship. Using improved methods, Kleven et al. (2011) find that reported taxable income increases somewhat if the person was audited in the previous period, but the effect is very modest, corresponding to only about 1% of income (p. 25).
8
firms and by the EPA, introduces concerns that results from studies using observational data could be
biased. Feinstein (1989), for example, fails to detect any specific deterrence effect of safety audits of
the U.S. Nuclear Regulatory Commission, and Telle (2009) concludes that the relationship between
previous audits and future emissions is not clear. In any case, there exists no previous experimental
field study on the effect of audits on firms’ subsequent compliance with environmental regulations.
Increased audit frequency raises the detection probability and thus the expected penalty, thereby
enhancing incentives to comply with the regulation, in a Becker framework.9 Kleven et al. (2011)
conducts a natural field experiment in Denmark, and consider a treatment that increases the audit
probability (for a subsample of taxpayers) from traditionally low levels to the very high levels of 50
and 100 percent. They do find positive effects of letters informing taxpayers of these excessive audit
probabilities, but the magnitudes of the effects are surprisingly small (p. 28). There are several studies
in the environmental economics literature where the firms’ perceived audit frequency is estimated and
used to explore impacts on subsequent compliance behavior (Alberini and Austin 2002, Telle 2009),
but I am not aware of any studies in this field that look at effects on regulatory compliance of a general
increase in the EPA’s audit frequency. Given the prominent role of the detection probability in the
Becker framework, it is a concern that there is little or no empirical field evidence10 of appreciable
effects of general audit frequencies on regulatory compliance. An important contribution of the present
paper is to provide the first experimental field evidence on the effect of announcing increased actual
audit probability on subsequent compliance with environmental regulations.
9 This reasoning relies on the assumption that detected violators do in fact face higher (expected) penalties, see footnote 7. The term “general deterrence” is sometimes used to describe deterrence actions that are not directed at a specific unit (like the general audit frequency), but it is also used to describe the extent to which regulatory actions aimed at one unit generate spill-over effects that impact the regulatory performance of other units (Gray and Shimshack 2011). Such spill-over effects have been investigated in previous studies (e.g. Shimshack and Ward 2005, Gray and Shadbegian 2007), but here I restrict attention to impacts of announcement of an actual increase in the general audit frequency. 10 Lab experiments in the tax literature do find that higher probability of audit reduces violations, but the deterrence effect is quite small (Alm, Jackson and McKee 1992). Andreoni et al. (1998, p. 842) point at the caveats that observational studies come with, and recent studies in the tax literature find very small or even negative effects of increased probability of audit (Johnson, Masclet and Montmarquette 2010, Slemrod et al. 2001, Blumenthal et al. 2001, Coleman 1996). Slemrod et al. (2001) use a field experiment to analyze effects on reported liabilities of a letter from the tax authority announcing increased probability of audit. They find that the treatment effects are heterogeneous with respect to income level, and, surprisingly, they conclude that “the reported tax liability of the high income treatment group fell sharply relative to the control group.” (p. 455).
9
3. Setting, design, data and method
Institutional Setting
Reliance on audits and specific deterrence is pivotal to regulatory agencies in nearly every industrialized
nation, and economists and policymakers typically believe that effective regulation requires frequent
audits and sanctions. Monitoring and enforcement agencies across various domains (EPAs, Tax
Authorities, Food and Drug Administrations, Occupational Safety and Health Administrations, etc.) and
nations, rely heavily on audits to detect and punish violations, as well as to obtain information about how
to spend future monitoring and enforcement resources. Indeed, the fundamental characteristics of EPAs
are very similar in countries across the industrialized world (Russell 1990, Nordisk Ministerråd 1991,
Rousseau 2007, Nyborg and Telle 2006, Earnhart 1997, 2000, Uhlmann 2009, Gray and Shimshack
2011),11 and it is widely maintained that improved monitoring and enforcement of environmental
regulations is a dominant factor behind the dramatic improvement in the environmental conditions of
developed countries over the last decades (Gray and Shimshack 2011).
Though self-audits, audit frequency and specific deterrence are fundamental across regulatory domains
and nations, details vary. There are notable differences in things like contents and frequency of audits,
targeting policies, sanctioning policies and maximum penalties, legal context and procedures. To be
able to better interpret the findings from the current natural field experiment from Norway, it may
therefore be useful to provide some background on the regulatory setting. In doing so, I will
particularly try to relate the Norwegian setting to the one in the U.S. (Gray and Shimshack 2011,
Russell 1990, Nyborg and Telle 2006).
The Norwegian environmental protection agency (NEPA)12 is responsible for monitoring and enforcing
most environmentally related regulations in Norway. Some of the activities are decentralized to local
administrative authorities (counties), but auditing activities are performed and recorded by the NEPA.
Polluting manufacturing facilities are required to obtain an emission permit from the NEPA and to file
annual self-monitoring reports. For firms in other domains, such as trade with manufactured goods or
handling of waste, compliance data are obtained from self- or on-site audits. For small firms in such
domains, audit probabilities could be virtually zero, while bigger facilities could be audited several times
a year. The firm has to cover the costs of NEPA of conducting the audit, and self-reported information,
11 Indeed, Gray and Shimshack (2011, p. 2) state that the regulatory setting in the U.S. “is broadly similar to those in many other developed countries.” 12 Klima- og forurensningsdirektoratet (Klif), previously Statens forurensningstilsyn (SFT).
10
adequacy and maintenance of firm’s surveillance equipment and procedures are important aspects of
audits. Overall, this is very similar to how Gray and Shimshack (2011) describe the situation in the U.S.
Also like in the U.S., enforcement actions for violations range from warning telephone calls, letters,
administrative fines and more frequent audits, to withdrawal of emission permits and criminal
prosecution. NEPA can initiate prosecution by filing a formal accusation, and the prosecuting
authority (decides and) takes the case to court. The maximum criminal penalty for violations of
environmental regulations is 15 years of imprisonment. In a criminal trial, fines may be imposed upon
persons or corporations. In addition, profits gained through non-compliance can be confiscated. When
a violation is detected (or suspected) the NEPA normally starts by sending the firm a warning letter,
stating in what ways the firm is believed to be out of compliance, indicating the seriousness of the
violations, requesting documentation that the firm is in compliance within a given deadline, and
pointing out the firm’s legal duty to comply with the instructions. Only violators failing to respond
adequately to the warning face more formal and direct sanctions. Criminal referrals are infrequent, and
reserved for cases of deliberate operation outside the regulatory environment, deliberately deceiving
behavior like record falsification, or cases with exceptional harm to human health (Nyborg and Telle
2006). This seems to be similar to the practices of the U.S. EPA (Russell 1990, Gray and Shimshack
2011, Uhlmann 2009). 13
The field experiment reported here was initiated in 2007 within one domain of the activities of the
NEPA, namely regulations to secure the environment and human health from manufactured goods
containing hazardous substances. Before 2007 the NEPA did not devote significant resources to
monitoring and enforcing this regulation, and audits and sanctioning were only considered if NEPA
received external tips. However, it was becoming evident that manufactured goods was an important
contributor to Norwegian emissions of e.g. heavy metals, halogenated and non-halogenated organic
compounds, which are considered a potentially serious threats to the natural environment and human
health (Norwegian ministry of the environment 2006, SFT 2010). Thus, in 2007 the NEPA started a
program to systematically enforce these regulations for a group of firms known to import products
likely to contain serious amounts of these hazardous substances. The population of firms to be
monitored contained those importing solid and manufactured goods from Asian countries to Norway.
This included goods like electronics, toys, and construction products.
13 Russell (1990, p. 252) writes: “Many states claim to pursue a so-called voluntary compliance policy, by which they mean that no penalties are ordinarily levied for violations initially. Rather, if penalties are used, it is to punish sources that refuse to correct violations or otherwise prove notably uncooperative.”
11
Based on records from the Norwegian Directorate of Customs and Excise,14 the full universe of these
firms was known to amount to about 2,000. From 2007 NEPA devoted resources to perform between
one and two hundred self-audits and about 50 on-site audits annually toward these firms. As the
resources for auditing activities were limited compared to the population of firms, and as the NEPA
had limited knowledge about the regulatory performance of these firms, it was decided to assign
enforcement activities randomly.15
Experimental design
In 2007 the NEPA started a program to systematically enforce regulations meant to secure the environ-
ment and human health from hazardous substances in manufactured goods.16 Equipped with a list of the
complete universe of firms, the NEPA stratified the population according to type of firm (Consumer
products, Electronics and Manufacturing products) and judgments of size and potential harm (three
groups). To facilitate targeting of the potentially more harmful firms, some strata were oversampled.
After the first year, a large proportion of firms inspected in the previous year were also randomly drawn
for re-audit in the next year, enabling collection of data on post-audit compliance behavior. Within these
strata, monitoring actions (and non-actions) were randomly assigned to firms.17 This procedure provided
a control group (of firms not receiving treatment) for each group of firms receiving treatment, and this
random assignment procedure should ensure that the treatment and control groups are identical up to a
random component. We can thus obtain estimates of effects of treatment (obtaining the average
treatment effect) without much concern for the potential selection bias of most previous studies that rely
on observational data. The following three variations of treatment were assigned.
First, effects of the general audit frequency were explored. At the introduction of the monitoring and
enforcement activities under the regulation, the NEPA randomly selected firms to receive a letter
announcing the renewed monitoring and enforcement activities. In the letter, the treated firms were
informed that the audit frequency would increase substantially, and they were made aware of the legal
14 This implies that firms smuggling such goods into Norway are not included in the sample. 15 In 2007 I was asked to assist the NEPA in conducting this experiment, and since then I have participated in setting up the experiment and advising the NEPA as they conducted it. 16 As noted above, before 2007 the NEPA had hardly devoted any resources to monitoring and enforcing this regulation. Since monitoring actions are randomly assigned to firms from 2007/8 on, there is no correlation between monitoring actions (from 2007 on) and firms’ pre-2007-performance or receipt of monitoring and enforcement actions. The latter ensures that even if there were some monitoring and enforcement actions toward firms pre-2007, the error we may make by assuming that firms had not received monitoring and enforcement actions before 2007, is to introduce a downward bias in our effect estimates (since some firms in the control group might be audited in, say, 2006). 17 In practice the random assignment was done by simply ordering the firms randomly (using MS Excel) and starting to audit firms from the top of the (randomly ordered) list until the acquired (and pre-determined) inspection frequencies were reached.

12
obligations and punishment facing them.18 As announced in the letter, within a few months, the NEPA
randomly selected firms (including firms that had not received a letter) for audits. Based on the
outcome of the audits, we are able to compare the regulatory performance of firms that did and did not
receive the announcement letter. Since the announcement letter did in fact convey new information
about the higher audit probability, we would expect those receiving the letter to face higher expected
costs of violating.19 The experimental design therefore enables us to test effects on violations of
announcing an actual increase in the audit frequency.
Second, the extent of evasive reporting of violations in self-audits was investigated. In each year from
200820 to 2010, the NEPA randomly selected firms to receive an on-site audit or a self-audit (and the
remaining firms received no audit). Since audit type was randomly assigned, we would expect latent
violations to be the same among firms receiving on-site audits and self-audits. Thus, any systematic
differences between the detection of violations in the two audit types should reflect the ability of the
audit type to expose violations to the NEPA.
Both types of audits were based on the identical audit form, but for the self-audit the firms filled in the
form themselves and mailed it to the NEPA, while for the on-site audit, the form was filled in by a
NEPA civil servant while visiting the firm. The form contained information about the firm’s
knowledge and compliance with the regulation, about contents of hazardous substances in the products
imported by the firm and about recycling and handling of hazardous waste. Not all firms got the exact
same form, as forms were adapted to the regulatory context of the firms, but all firms in the same
stratum got the identical form. These forms where then collected at the NEPA office, and all forms
were evaluated by a NEPA official. The regulatory performance indicated by the form was captured
for each firm, and the official registered whether the firm was in violation or not. Though a violation is
defined in legal terms and as a breach of any regulation, and though the forms were constructed to
18 The letter was between one and two pages, and starts with four lines on potential harm on health and environment of illegal substances, and then reminds the firms of their “responsibility to ensure that the products they import and sell are in accordance with the Norwegian regulations” (my translation). Then it is stated that NEPA will “increase the focus on monitoring these products and audit more importing firms” (my translation). Then the firm is reminded that the NEPA may report serious violations to the police, and the rest of the letter contains information about the most relevant regulations and the firm’s legal obligation to cover NEPA’s costs in association with an audit. 19 As always there are some caveats; see footnote 9. Say, for example, that those firms receiving the announcement letter circulated it to firms in the control group, then our effect estimate would be downward biased. I am not aware that this did happen, and I find it unlikely, but it cannot be ruled out entirely. Moreover, the firms may erroneously believe that the audit frequency would in fact not go up, or they may think that the expected costs of non-compliance were unaffected by the higher audit frequency. Unfortunately, we do not have data that can help in discriminating between such explanations. 20 Audits of some firms were conducted in 2007, but the audits of 2007 and 2008 were treated as one cohort of audits by the NEPA (i.e. with no firms drawn to be audited in both years). Thus, in the following, I will refer to audits conducted in 2007 and 2008 as conducted in 2008. See Telle (2011) for details.

13
ease the identification of violations, it was not always easy to infer from a form whether a violation
was present or not.21 Moreover, NEPA did not register how serious the violation was, which disables
us from analyzing possible heterogeneous effects of the treatments on the seriousness of the violations.
The outcome measure on which we rely in this paper is based on this registration of each firm’s
violation.
Third, specific deterrence effects were investigated. To be able to measure compliance behavior of
firms after an audit, a large fraction of firms that were audited in the previous year were randomly
selected for a new audit.22 By repeatedly inspecting the same firms over more than one year, we can
test the effects of an audit, as well as audit type, on subsequent compliance behavior.
Data and estimation methods
Data are available from all audits conducted in 2008, 2009 and 2010. There were 1,975 different firms
in the overall population, and over the period NEPA conducted a total number of 534 audits. The
number of audits in 2008, 2009 and 2010 was 202, 165 and 167, respectively; and the overall number
of audits comprised 114 on-site audits and 420 self-audits. At least one violation was detected in 35
percent of the audits.
Since firms are legally obliged to conduct audits as instructed by the NEPA, sample attrition (which is
common in surveys), should not occur. However, a number of firms that were in the population lists
(which the NEPA received from the Norwegian Directorate of Customs and Excise) were no longer in
operation or had stopped importing relevant goods (NEPA took various actions to verify this
information, including drawing on information in other administrative registries). There were also a
few cases where firms simply did not submit the self-audit as instructed by the NEPA. According to
standard procedures at NEPA, these firms were followed up in different ways, including
considerations to impose coercive fines. Such procedures can take time, which implies that results for
these firms may not be in the dataset. However, some of these firms were audited in the following
year, which enables us to test whether the performance of these firms in the subsequent year differs
from the performance of firms that were not selected to be audited in the previous year. There were 31
21 The NEPA took some effort to “blind” the servant who evaluated the forms: the forms were identical across audit type and there was no indication in the forms of previous enforcement activities directed toward the firm. Still, the staff at NEPA working on this comprises only a handful of servants, so the evaluator may her/himself have been handling the form or firm before evaluating the form. Nevertheless, since the form was about 8 pages and there were a couple of hundred forms each year, it does not seem very likely that evaluation practices correlated with the treatment is a serous concern. 22 As the ratio of violations detected can differ across audit types, results may depend on the audit type used to measure subsequent regulatory behavior. In addition to the random assignment, I also check that results are robust to controlling for the type of audit from which the output measure is collected; see Tables 4 and 5.

14
firms that did not submit the audit in year t-1, but that did so in year t. Formal tests reveal that their
likelihood of violation in t is similar to the likelihood of violation for firms that were not (selected to
be) audited in t-1, and the difference is not statistically significant at any conventional level. This
indicates that there is not much reason for concerns that attrition seriously biases the main results.
Whether the firm is in violation or not, as indicated by the NEPA when the audit form is evaluated,
serves as the outcome variable (se previous sub-section for details). I use several estimation methods
to evaluate whether the outcome of the firms in the treatment group differs from the outcome of the
firms in the control group. Results from non-parametric Wilcoxon-Mann-Whitney tests are reported in
the note of subsequent results tables, and the tables include estimation results from ordinary least
squares (OLS) and logistic (logit) regression models. Unless otherwise indicated, control variables are
not included in the estimation models, and standard errors account for the fact that residuals for the
same firm are not independent over time. If effects are very heterogeneous across subsamples,
estimates of the mean average treatment effect will depend on the number of observations in the
various sampling strata. To explore the relevance of this, tables also include the effect estimates with
non-parametric control for the stratification variables (i.e. dummies for year and strata).23
To verify that the assignment of treatments was in fact random, we would like to confirm that pre-
treatment variables are not systematically different across the treatment and control groups. A measure
of the overall sales (in value and weight) of the firms at the outset was available in our dataset from
NPCA, and additional baseline characteristics of the firms (2007) are merged onto our dataset from a
database maintained by Statistics Norway (FD-trygd), relying on unique firm identifiers available in
all public registries in Norway.24 In line with the stratification strategy of NPCA (over-sampling from
some strata), we see from Table 1 that firms in the treatment group differ from firms in the control
group - they are for example bigger (value and weight of goods; number of employees) in 2007. The
random sampling within the strata does, however, ensure that once we control for the stratification
variables (dummies for strata and years), none of the differences across the treatment and control
group remain statistically significant at the 5 percent level. Overall, this suggests that the assignment
of the treatments was performed in a way unlikely to introduce selection bias.
23 We will see that controlling for the stratification variables hardly affects the effect estimates. In line with the literature, we thus rely on traditional (i.e. unweighted) estimation methods (DuMouchel and Duncan 1983, Dickens 1990, Lee and Solon 2011). 24 However, the quality of the firm identifier is of little interest to the NPCA, and the firm identifier in the dataset from NPCA is thus missing or incorrect for some firms.
15
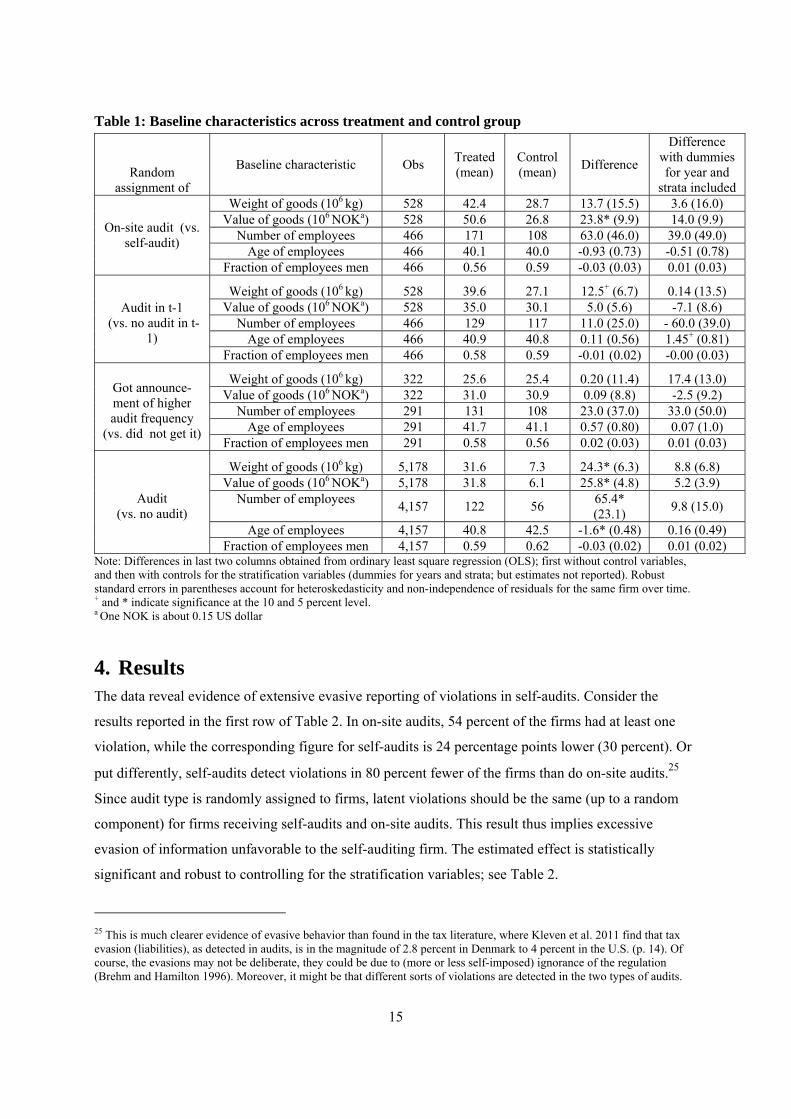
Table 1: Baseline characteristics across treatment and control group
Random assignment of
Baseline characteristic Obs Treated (mean)
Control (mean)
Difference
Difference with dummies for year and
strata included Weight of goods (106 kg) 528 42.4 28.7 13.7 (15.5) 3.6 (16.0)
Value of goods (106 NOKa) 528 50.6 26.8 23.8* (9.9) 14.0 (9.9) Number of employees 466 171 108 63.0 (46.0) 39.0 (49.0)
Age of employees 466 40.1 40.0 -0.93 (0.73) -0.51 (0.78)
On-site audit (vs. self-audit)
Fraction of employees men 466 0.56 0.59 -0.03 (0.03) 0.01 (0.03)
Weight of goods (106 kg) 528 39.6 27.1 12.5+ (6.7) 0.14 (13.5) Value of goods (106 NOKa) 528 35.0 30.1 5.0 (5.6) -7.1 (8.6)
Number of employees 466 129 117 11.0 (25.0) - 60.0 (39.0) Age of employees 466 40.9 40.8 0.11 (0.56) 1.45+ (0.81)
Audit in t-1 (vs. no audit in t-
1) Fraction of employees men 466 0.58 0.59 -0.01 (0.02) -0.00 (0.03)
Weight of goods (106 kg) 322 25.6 25.4 0.20 (11.4) 17.4 (13.0) Value of goods (106 NOKa) 322 31.0 30.9 0.09 (8.8) -2.5 (9.2)
Number of employees 291 131 108 23.0 (37.0) 33.0 (50.0) Age of employees 291 41.7 41.1 0.57 (0.80) 0.07 (1.0)
Got announce-ment of higher audit frequency
(vs. did not get it) Fraction of employees men 291 0.58 0.56 0.02 (0.03) 0.01 (0.03)
Weight of goods (106 kg) 5,178 31.6 7.3 24.3* (6.3) 8.8 (6.8) Value of goods (106 NOKa) 5,178 31.8 6.1 25.8* (4.8) 5.2 (3.9)
Number of employees 4,157 122 56
65.4* (23.1)
9.8 (15.0)
Age of employees 4,157 40.8 42.5 -1.6* (0.48) 0.16 (0.49)
Audit (vs. no audit)
Fraction of employees men 4,157 0.59 0.62 -0.03 (0.02) 0.01 (0.02) Note: Differences in last two columns obtained from ordinary least square regression (OLS); first without control variables, and then with controls for the stratification variables (dummies for years and strata; but estimates not reported). Robust standard errors in parentheses account for heteroskedasticity and non-independence of residuals for the same firm over time. + and * indicate significance at the 10 and 5 percent level. a One NOK is about 0.15 US dollar
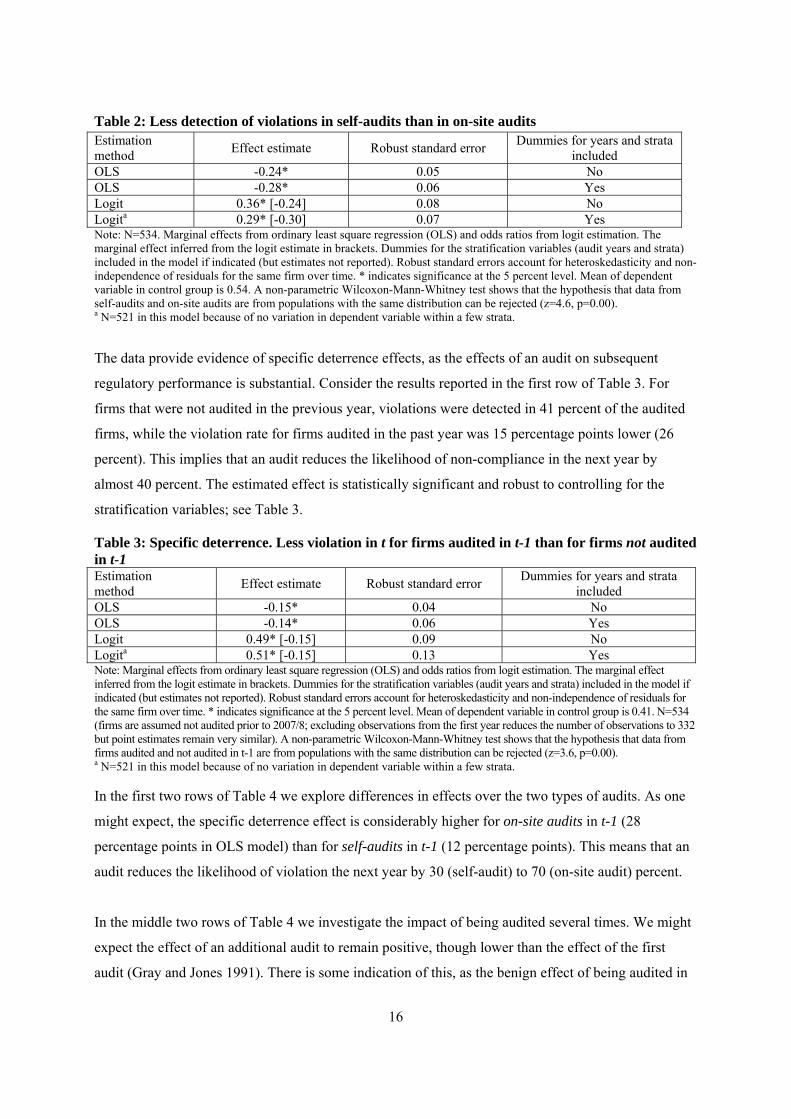
4. Results The data reveal evidence of extensive evasive reporting of violations in self-audits. Consider the
results reported in the first row of Table 2. In on-site audits, 54 percent of the firms had at least one
violation, while the corresponding figure for self-audits is 24 percentage points lower (30 percent). Or
put differently, self-audits detect violations in 80 percent fewer of the firms than do on-site audits.25
Since audit type is randomly assigned to firms, latent violations should be the same (up to a random
component) for firms receiving self-audits and on-site audits. This result thus implies excessive
evasion of information unfavorable to the self-auditing firm. The estimated effect is statistically
significant and robust to controlling for the stratification variables; see Table 2.
25 This is much clearer evidence of evasive behavior than found in the tax literature, where Kleven et al. 2011 find that tax evasion (liabilities), as detected in audits, is in the magnitude of 2.8 percent in Denmark to 4 percent in the U.S. (p. 14). Of course, the evasions may not be deliberate, they could be due to (more or less self-imposed) ignorance of the regulation (Brehm and Hamilton 1996). Moreover, it might be that different sorts of violations are detected in the two types of audits.
16
Table 2: Less detection of violations in self-audits than in on-site audits Estimation method
Effect estimate Robust standard error Dummies for years and strata
included OLS -0.24* 0.05 No OLS -0.28* 0.06 Yes Logit 0.36* [-0.24] 0.08 No Logita 0.29* [-0.30] 0.07 Yes Note: N=534. Marginal effects from ordinary least square regression (OLS) and odds ratios from logit estimation. The marginal effect inferred from the logit estimate in brackets. Dummies for the stratification variables (audit years and strata) included in the model if indicated (but estimates not reported). Robust standard errors account for heteroskedasticity and non-independence of residuals for the same firm over time. * indicates significance at the 5 percent level. Mean of dependent variable in control group is 0.54. A non-parametric Wilcoxon-Mann-Whitney test shows that the hypothesis that data from self-audits and on-site audits are from populations with the same distribution can be rejected (z=4.6, p=0.00). a N=521 in this model because of no variation in dependent variable within a few strata.
The data provide evidence of specific deterrence effects, as the effects of an audit on subsequent
regulatory performance is substantial. Consider the results reported in the first row of Table 3. For
firms that were not audited in the previous year, violations were detected in 41 percent of the audited
firms, while the violation rate for firms audited in the past year was 15 percentage points lower (26
percent). This implies that an audit reduces the likelihood of non-compliance in the next year by
almost 40 percent. The estimated effect is statistically significant and robust to controlling for the
stratification variables; see Table 3.
Table 3: Specific deterrence. Less violation in t for firms audited in t-1 than for firms not audited in t-1 Estimation method
Effect estimate Robust standard error Dummies for years and strata
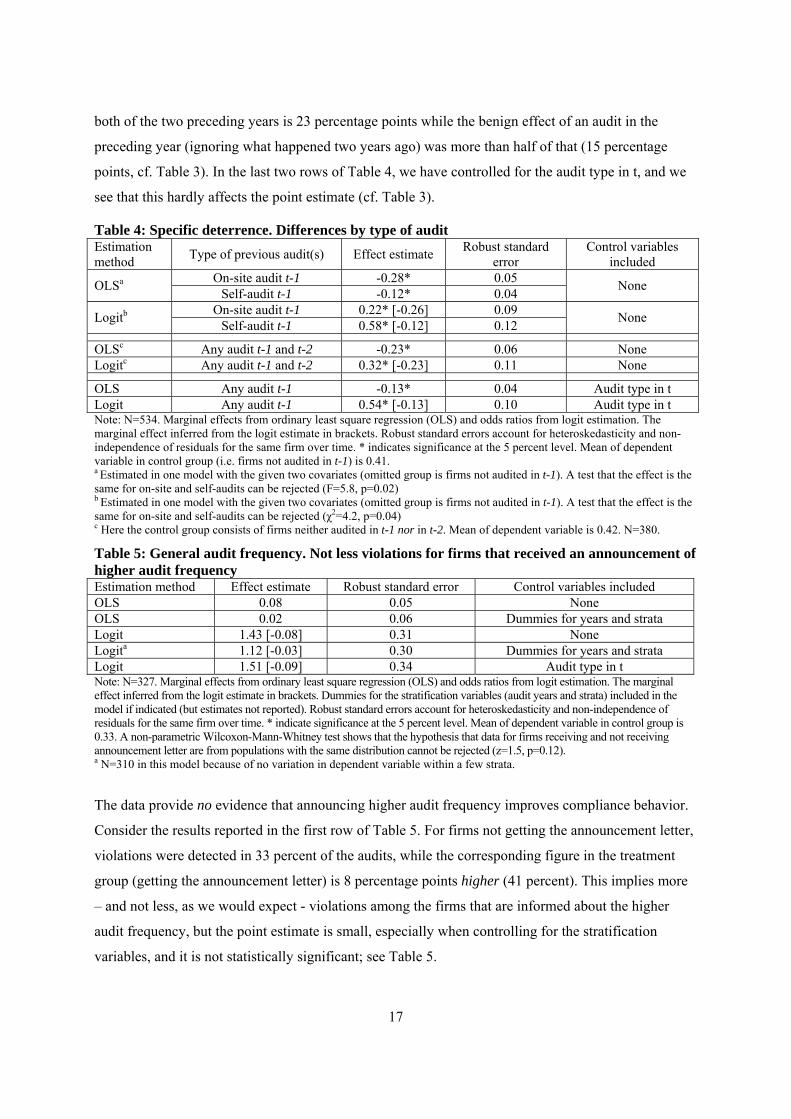
included OLS -0.15* 0.04 No OLS -0.14* 0.06 Yes Logit 0.49* [-0.15] 0.09 No Logita 0.51* [-0.15] 0.13 Yes Note: Marginal effects from ordinary least square regression (OLS) and odds ratios from logit estimation. The marginal effect inferred from the logit estimate in brackets. Dummies for the stratification variables (audit years and strata) included in the model if indicated (but estimates not reported). Robust standard errors account for heteroskedasticity and non-independence of residuals for the same firm over time. * indicates significance at the 5 percent level. Mean of dependent variable in control group is 0.41. N=534 (firms are assumed not audited prior to 2007/8; excluding observations from the first year reduces the number of observations to 332 but point estimates remain very similar). A non-parametric Wilcoxon-Mann-Whitney test shows that the hypothesis that data from firms audited and not audited in t-1 are from populations with the same distribution can be rejected (z=3.6, p=0.00). a N=521 in this model because of no variation in dependent variable within a few strata. In the first two rows of Table 4 we explore differences in effects over the two types of audits. As one
might expect, the specific deterrence effect is considerably higher for on-site audits in t-1 (28
percentage points in OLS model) than for self-audits in t-1 (12 percentage points). This means that an
audit reduces the likelihood of violation the next year by 30 (self-audit) to 70 (on-site audit) percent.
In the middle two rows of Table 4 we investigate the impact of being audited several times. We might
expect the effect of an additional audit to remain positive, though lower than the effect of the first
audit (Gray and Jones 1991). There is some indication of this, as the benign effect of being audited in
17
both of the two preceding years is 23 percentage points while the benign effect of an audit in the
preceding year (ignoring what happened two years ago) was more than half of that (15 percentage
points, cf. Table 3). In the last two rows of Table 4, we have controlled for the audit type in t, and we
see that this hardly affects the point estimate (cf. Table 3).
Table 4: Specific deterrence. Differences by type of audit Estimation method
Type of previous audit(s) Effect estimate Robust standard
error Control variables
included On-site audit t-1 -0.28* 0.05
OLSa Self-audit t-1 -0.12* 0.04
None
On-site audit t-1 0.22* [-0.26] 0.09 Logitb
Self-audit t-1 0.58* [-0.12] 0.12 None
OLSc Any audit t-1 and t-2 -0.23* 0.06 None Logitc Any audit t-1 and t-2 0.32* [-0.23] 0.11 None
OLS Any audit t-1 -0.13* 0.04 Audit type in t Logit Any audit t-1 0.54* [-0.13] 0.10 Audit type in t Note: N=534. Marginal effects from ordinary least square regression (OLS) and odds ratios from logit estimation. The marginal effect inferred from the logit estimate in brackets. Robust standard errors account for heteroskedasticity and non-independence of residuals for the same firm over time. * indicates significance at the 5 percent level. Mean of dependent variable in control group (i.e. firms not audited in t-1) is 0.41. a Estimated in one model with the given two covariates (omitted group is firms not audited in t-1). A test that the effect is the same for on-site and self-audits can be rejected (F=5.8, p=0.02) b Estimated in one model with the given two covariates (omitted group is firms not audited in t-1). A test that the effect is the same for on-site and self-audits can be rejected (χ2=4.2, p=0.04) c Here the control group consists of firms neither audited in t-1 nor in t-2. Mean of dependent variable is 0.42. N=380.
Table 5: General audit frequency. Not less violations for firms that received an announcement of higher audit frequency Estimation method Effect estimate Robust standard error Control variables included OLS 0.08 0.05 None OLS 0.02 0.06 Dummies for years and strata Logit 1.43 [-0.08] 0.31 None Logita 1.12 [-0.03] 0.30 Dummies for years and strata Logit 1.51 [-0.09] 0.34 Audit type in t Note: N=327. Marginal effects from ordinary least square regression (OLS) and odds ratios from logit estimation. The marginal effect inferred from the logit estimate in brackets. Dummies for the stratification variables (audit years and strata) included in the model if indicated (but estimates not reported). Robust standard errors account for heteroskedasticity and non-independence of residuals for the same firm over time. * indicate significance at the 5 percent level. Mean of dependent variable in control group is 0.33. A non-parametric Wilcoxon-Mann-Whitney test shows that the hypothesis that data for firms receiving and not receiving announcement letter are from populations with the same distribution cannot be rejected (z=1.5, p=0.12). a N=310 in this model because of no variation in dependent variable within a few strata.
The data provide no evidence that announcing higher audit frequency improves compliance behavior.
Consider the results reported in the first row of Table 5. For firms not getting the announcement letter,
violations were detected in 33 percent of the audits, while the corresponding figure in the treatment
group (getting the announcement letter) is 8 percentage points higher (41 percent). This implies more
– and not less, as we would expect - violations among the firms that are informed about the higher
audit frequency, but the point estimate is small, especially when controlling for the stratification
variables, and it is not statistically significant; see Table 5.

18
5. Concluding discussion The current paper presents results from the first natural field experiment on effects of monitoring and
enforcement activities of Environmental Protection Agencies (EPAs). The random assignment of
monitoring actions to firms handles the selection issues that have concerned scholars conducting
studies on observational data. Gray and Shimshack (2011) survey the monitoring and enforcement
literature from North America, and conclude that previous studies have tended to find strong effects of
general and specific deterrence. The results of the current paper confirm large specific deterrence
effects. There is little indication, however, of appreciable effects from announcement of increased
audit frequency. Moreover, and maybe contrary to prevailing beliefs, I provide evidence of excessive
evasive reporting in self-audits. This raises serious concerns that a shift toward reliance on self-
reporting could be devastating for the compliance with environmental regulations.
Despite the clear methodological contributions of the present study, interpreting the current results in
terms of policy implications remains difficult. One caveat relates to the external validity of the
findings from a small experiment in one domain of the responsibilities of the Norwegian EPA. Though
I have argued that the core elements of regulatory practices are very similar across EPAs in Western
countries, there is an obvious need to confirm this by conducting natural field experiments in more
countries and regulatory domains.
Other caveats relate to the actions typically undertaken by EPAs once a violation is detected. It
appears clear that the mere detection of a violation in an audit is not sufficient to ensure the substantial
specific deterrence effects we observe. It seems plausible that a threat of sanctioning or actual
sanctioning by the EPA is necessary for a detection of a violation to improve future performance. The
higher specific deterrence effect in on-site audits compared with self-audits may therefore result from
differences in the subsequent enforcement activities of the EPA across the two types of audits.
Similarly, the lack of any effect of audit frequency in the current study may be related to how the
content of the announcement letter was perceived,26 or a result of the enforcement practice of many
EPAs. It is well known that EPAs in several countries issue warnings when violations are detected,
only escalating to harsher sanctions if the firm fails to cooperate upon detection (Russell 1990, Nyborg
and Telle 2004, 2006, Rousseau 2009). If firms expect to get a second chance upon detection of a
26 If the firms did not read the letter, or if they erroneously believed that the audit frequency would in fact not go up, then we would not expect any effect of the announcement letter. Moreover, and though it appears unlikely, we would tend to underestimate the effect if the firms that received the announcement letter circulated it to firms in the control group. Similar downward bias might also arise if audits have substantial spill-over effects on non-audited firms (e.g. Shimshack and Ward 2005, Gray and Shadbegian 2007). Future studies should improve upon the current design by trying to collect information that may help discriminating between such explanations.

19
violation, then they lack incentives to comply before violations are detected. If so, it is not surprising
that we find no effects of the letters announcing higher audit frequency. Indeed, under such a regime,
firms will have incentives to i) stay uninformed about the regulation, and ii) cooperate with the EPA to
end the violation only after it becomes detected. What we would then observe in the data would be no
effect of the higher audit frequency and substantial specific deterrence effects. Though such a regime
has its proponents (Braithwaite 2002), it is incapable of deterring violations that are not detected. This
makes it fundamentally at odds with theories of optimal enforcement, where the agency can minimize
overall violations (i.e. the overall violations of audited and non-audited firms) by allocating resources
from expensive monitoring activities toward severe sanctioning of detected violators (Becker 1968,
Heyes 2000, Polinsky and Shavell 2007).
The results from the current experiment, along with surveys documenting that firms rate the activities of
EPAs as a crucial source of environmental pressure (e.g. Khanna and Antons 2002, May 2005, Short and
Toffel 2010), may suggest that rigorous monitoring and enforcement is a more effective tool to detect
and combat evasive behavior than self-audits and voluntary disclosure programs (see e.g. Khanna 2001,
Foulon et al. 2002). But self-audits and voluntary disclosure programs are typically cheaper than on-site
audits and other traditional enforcement activities. To balance the inexpensiveness of self-audits and the
reliability of the on-site audits, EPAs may follow the suggestion of Kleven et al. (2011) and rely more
heavily on requiring a third-party to approve of the self-audit. This could be done by requiring the firms
to hire consultants to conduct or approve of the self-audit, or require the information therein to be
verified by the firm’s accountant. As a complement, EPAs could try to also make other firms in the
sales-chain act similar to third-parties or whistle-blowers by collecting comparable information from
them. As demonstrated by Pomeranz (2010), paper trails, which make similar information regarding
compliance behavior available from different parties or sources, could facilitate monitoring and
enforcement. Attempts to raise the expected penalty - in particular the likelihood of detection and harsh
subsequent formal sanctioning - of evasive self-reporting of violations, may also provide an additional
complement worthy of further exploration by EPAs.

20
References
Alberini, A. and D. Austin (2002). Accidents waiting to happen: Liability policy and toxic pollution releases. Review of Economics and Statistics 84 (4), 729-741. Alm, J., B. Jackson and M. McKee (2009). Getting the word out: Enforcement information dissemination and compliance behavior. Journal of Public Economics 93, 392-402. Andreoni, J., B. Erard and J. Feinstein (1998). Tax compliance. Journal of Economic Literature XXXVI, 818-860. Becker, G. (1968). Crime and punishment: and economic approach. Journal of Political Economy 76 (2), 169-217. Bloomquist, K., A. Plumley and E. Toder (2005). Tax noncompliance in the United States: Measurement and recent enforcement initiatives. In C. Bajada and F. Schneider (eds.): Size, causes and consequences of the underground economy, Ashgate Publishing Ltd. Blumenthal, M., Christian, C. and Slemrod, J. (2001). Do normative appeals affect tax compliance? Evidence from a controlled experiment in Minnesota. National Tax Journal 54 (1), 125-138. Braithwaite, J. (2002): Restorative justice and responsive regulation. Oxford University Press. Brehm, J. and J. Hamilton (1996): Noncompliance in environmental reporting: Are violators ignorant, or evasive, of the law? American Journal of Political Science 40 (2), 444-77. Cohen, M. (2000): ‘Monitoring and Enforcement of Environmental Policy’, in H. Folmer and T. Tietenberg (eds.), The International Yearbook of Environmental and Resource Economics 1999/2000, Edward Elgar. Coleman, S. (1996): The Minnesota income tax compliance experiment: State tax results. Minnesota department of revenue. MPRA Paper No. 4827. Dickens, W. (1990): Error components in grouped data: Is it ever worth weighting? Review of Economics and Statistics 72(2), 328-333. DuMouchel, W. and G. Duncan (1983): Using sample survey weights in multiple regression analyses of stratified samples. Journal of the American Statistical Association 78 (383), 535-543. Earnhart, D. (1997): Enforcement of Environmental Protection Laws under Communism and Democracy. Journal of Law and Economics 40 (2), 377-402. Earnhart, D. (2000). Environmental Crime and Punishment in the Czech Republic: Penalties Against Firms and Employees. Journal of Comparative Economics 28, 379-399. Eckert, H. (2004): Inspections, warnings, and compliance: the case of petroleum storage regulation. Journal of Environmental Economics and Management 47 (2), 232-259. Feinstein, J. (1989). The safety regulation of U.S. nuclear power plants: Violations, inspections, and abnormal occurrences. Journal of Political Economy 97, 115-154.

21
Foulon M., P. Lanoie and B. Laplante (2002): Incentives for pollution control: Regulation or information? Journal of Environmental Economics and Management 44 (1), 169-187. Glicksman, R. L. and D. H. Earnhart (2007): The comparative effectiveness of government interventions on environmental performance in the chemical industry. Stanford Environmental Law Journal 26. Gray, W. and C. Jones (1991). Are OSHA health inspections effective? A longitudinal study in the manufacturing sector. Review of Economics and Statistics 73(3), 504-508. Gray, W. and J. Shimshack (2010). The effectiveness of environmental monitoring and enforcement: A review of the empirical evidence. Working paper, Dept. of Economics, Tulane University, March 2010. Gray, W. and J. Shimshack (2011). The effectiveness of environmental monitoring and enforcement: A review of the empirical evidence. Review of Environmental Economics and Policy, online first (doi: 10.1093/reep/req017). Gray, W. and R. Shadbegian (2007). The environmental performance of polluting plants: A spatial analysis. Journal of Regional Science 47(1), 63-84. Harrington, W. (1988): Enforcement Leverage when Penalties are Restricted. Journal Public Economics 37, 29-53. Harrison, G. and J. List (2004): Field Experiments. Journal of Economic Literature 42, 1009-1055. Helland, E. (1998): The enforcement of pollution control laws: Inspections, violations, and self-reporting, Review of Economics and Statistics 80 (1), 141-153. Heyes, A. (1994): ‘Environmental Enforcement when ‘Inspectability’ is Endogenous: A Modell with Overshooting Properties’. Environmental and Resource Economics 4, 479–494. Heyes, A. (2000): Implementing environmental regulation: Enforcement and compliance. Journal of Regulatory Economics 17 (2), 107-129. Heyes, A. (2002): Eight things about enforcement that seem obvious but may not be, in: T. Swanson (ed.), An introduction to the law and economics of environmental policy: Issues in institutional design, Vol. 20, Elsevier Science Ltd. Innes, R. (1999) Remediation and self-reporting in optimal law enforcement. Journal of Public Economics 72:379–393. Innes, R. (2001): Self-enforcement of environmental law. In: A. Heyes (ed.): The Law and Economics of the Environment. Edward Elgar Publishing. Internal Revenue Service (2008). Congressional Justification. Washington, DC. U.S. Department of Treasury. Kambhu, J. (1989): Regulatory standards, non-compliance and enforcement. Journal of Regulatory Economics 1 (2), 103-114.

22
Johnson, C., D. Masclet and C. Montmarquette (2010). The effect of perfect monitoring of matched income on sales tax compliance: An experimental investigation. National Tax Journal 63(1), 121-148. Khanna, M. (2001): Non-mandatory approaches to environmental protection. Journal of Economic Surveys 15 (3), 291-324. Khanna, M. and W. R. Anton (2002). Corporate Environmental Management: Regulatory and Market-Based Incentives. Land Economics 78(4), 539-558. Kleven, H. J., Knudsen, M., Kreiner, C. T., Pedersen, S. and Saez, E. (2011). Unwilling or Unable to Cheat? Evidence from a Tax Audit Experiment in Denmark. Econometrica 79(3), 651-692. Kleven, H. J., Knudsen, M., Kreiner, C. T., Pedersen, S. and Saez, E. (2010). Unwilling or Unable to Cheat? Evidence From a Randomized Tax Audit Experiment in Denmark, NBER Working Papers 15769. Langpap C. (2008). Self-reporting and private enforcement in environmental regulation Environmental & Resource Economics 40 (4), 489-506. Lee, J. Y. and G. Solon (2011): The fragility of estimated effects of unilateral divorce laws on divorce rates. NBER Working Papers 16773. Lin S.W. (2010). Self-reporting mechanism for risk regulation. Journal of Business Research 63 (5), 528-534 List, J. (2006): Field experiments: A bridge between lab and naturally occurring data. Advances in Economic Analysis and Policy, 6(2), Article 8. Livernois, J. and C. J. McKenna (1999): Truth or Consequences. Enforcing Pollution Standards with Self-Reporting. Journal of Public Economics 71, 415–440. Malik, A. (1993). Self-reporting and the design of policies for regulating stochastic pollution. Journal of Environmental Economics and Management 24(3), 241-57. May, P. (2005). Regulation and compliance motivation: Examining different approaches. Public Administration Review 65, 31-44. Murphy, J. J. and J. K. Stranlund (2007): An Investigation of Voluntary Discovery and Disclosure of Environmental Violations Using Laboratory Experiments, in T. Cherry, S. Kroll and J. Shogren: Environmental Economics, Experimental Methods, Routledge. Nordisk Ministerråd (1991): Forurensning og Straff – et nordisk stadium (Pollution and Punishment – a Nordic study). Nord 1991:2. Nordisk Ministerråd: København. Norwegian ministry of the environment (2006). Working together toward a non-toxic environment and a safer future. Report No. 14 to the Storting (St. meld 14 2006-2007). The Norwegian Government. Nyborg, K. and K. Telle (2004): The Role of Warnings in Regulation: Keeping Control with Less Punishment. Journal of Public Economics 88 (12), 2801-2816.

23
Nyborg, K. and K. Telle (2006): Firms' compliance to environmental regulation: Is there really a paradox? Environmental and Resource Economics 35 (1), 1-18. Pfaff, Alexander S. P. and Chris William Sanchirico (2004). Big field, small potatoes: An empirical assessment of EPA's self-audit policy. Journal of Policy Analysis and Management 23 (2002): 415. Polinsky, M. and S. Shavell (2007): The theory of public enforcement of law, in: M. Polinsky and S. Shavell (eds.), Handbook of Law and Economics, Vol. 1, North-Holland. Pomeranz, Dina (2011). To taxation without information. Deterrence and Self-Enforcement in the Value Added Tax. Memo. Dept. of Economics, Harvard University. Rousseau, S. (2007): Timing of environmental inspections: Survival of the compliant. Journal of Regulatory Economics 32(1), 17-36 Rousseau, S. (2009). The use of warnings in the presence of errors. International Review of Law and Economics, 29, 191-201 Russell, C. (1990). ‘Monitoring and Enforcement’, in P. Portney (ed.), Public Policies for Environmental Protection, Washington D.C.: Resources for the Future. Russell, C., W. Harrington and W. J. Vaughan (1986). Economic models of monitoring and enforcement: Enforcing pollution control laws. Resources for the Future, Washington, DC. SFT (2010). Prioriterte miljøgifter i prudukter – data for 2008. Prioriterte miljøgifter årsrapport. Rapport SFT-TA-2743. Shimshack, J. and Ward (2005). Regulator reputation, enforcement, and environmental compliance. Journal of Environmental Economics and Management 50, 519-540. Short, J. and M. Toffel (2010). Making Self-Regulation More Than Merely Symbolic: The Critical Role of the Legal Environment. Administrative Science Quarterly 55(3), 361-369. Sigman, H. (2010). Environmental liability and redevelopment of old industrial land. Journal of Law and Economics 53 (2), 289-306. Slemrod, J., M. Blumenthal and C. Christian (2001). Taxpayer response to and increased probability of audit: evidence from a controlled experiment in Minnesota. Journal of Public Economics 79, 455-483. Slemrod, Joel (2007). Cheating Ourselves: The Economics of Tax Evasion. Journal of Economic Perspectives 21(1), 25–48. Slemrod, Joel and Shlomo Yitzhaki (2002). Tax avoidance, evasion and administration, in A.J. Auerbach and M. Feldstein (eds.), Handbook of Public Economics, Vol. 3, Elsevier: Amsterdam. Stafford S.L. (2008). Self-policing in a targeted enforcement regime. Southern Economic Journal 74 (4), 934-951.
24
Stafford S. L. (2003). Assessing the effectiveness of state regulation and enforcement of hazardous waste. Journal of Regulatory Economics 23 (1), 27-41. Stigler, G. (1970): The optimum enforcement of laws. Journal of Political Economy 78: 526–36. Telle, K. (2009). The Threat of Regulatory Environmental Inspection: Impact on Plant Performance. Journal of Regulatory Economics 35(2), 154-178. Telle, K. (2011). Effekter av Klifs tilsyn. Resultater fra produktkontrollen 2007-2010. [Effects of the monitoring and enforcement activities of NEPA. Results for 2007-2010]. Rapporter 16, Statistics Norway: Oslo. Tietenberg, T. (1998): Disclosure strategies for pollution control. Environmental and Resource Economics 11 (3-4), 587-602. Uhlmann, D. (2009). Environmental Crime Comes of Age: The Evolution of Criminal Enforcement in the Environmental Regulatory Scheme. Utah Law Review 4, 1223-52.
Statistics Norway
Oslo:PO Box 8131 DeptNO-0033 OsloTelephone: + 47 21 09 00 00Telefax: + 47 21 09 00 40
Kongsvinger:NO-2225 KongsvingerTelephone: + 47 62 88 50 00Telefax: + 47 62 88 50 30
E-mail: [email protected]: www.ssb.no
ISSN 0809-733X
Returadresse:Statistisk sentralbyråNO-2225 KongsvingerB