monitoring and assessment framework for the european...
TRANSCRIPT

Report EUR 26825 EN
2014
Fabienne Abadie Maria Lluch Ramon Sabes-Figuera Bernarda Zamora
First update of the process indicators
Monitoring and Assessment Framework for the
European Innovation Partnership on Active and
Healthy Ageing (MAFEIP)
European Commission
Joint Research Centre
Institute for Prospective Technological Studies
Contact information
Address: Edificio Expo. c/ Inca Garcilaso, 3. E-41092 Seville (Spain)
E-mail: [email protected]
Tel.: +34 954488318
Fax: +34 954488300
https://ec.europa.eu/jrc
https://ec.europa.eu/jrc/en/institutes/ipts
Legal Notice
This publication is a Science and Policy Report by the Joint Research Centre, the European Commission’s in-house science
service. It aims to provide evidence-based scientific support to the European policy-making process. The scientific output
expressed does not imply a policy position of the European Commission. Neither the European Commission nor any person
acting on behalf of the Commission is responsible for the use which might be made of this publication.
All images © European Union 2014
JRC91172
EUR 26825 EN
ISBN 978-92-79-40154-1 (PDF)
ISSN 1831-9424 (online)
doi:10.2791/122
Luxembourg: Publications Office of the European Union, 2014
© European Union, 2014
Reproduction is authorised provided the source is acknowledged.
Abstract
This report aims to provide information on the evolution of the Commitments that joined the EIP on AHA in the First
Invitation for Commitment (June 2012) during the first months of the partnership by analysing the variation for the
defined process indicators between the start of the project (June 2012) and spring 2013, the latter corresponding to the
time when data was collected through a Monitoring Survey. The survey questions mirrored in general the information
submitted by participants through the First Invitation for Commitment, although not all questions were phrased and/or
formatted in the same way, which complicates somewhat the comparison of the two data sets.

1
Table of Contents
1. Introduction..................................................................................................................................................................................... 4
1.1 Background .......................................................................................................................................................................... 4
1.2 Objective of this report ................................................................................................................................................. 4
2. Monitoring Survey Data: Analysis of Evolution .......................................................................................................... 5
2.1 Limitations and issues related to the sources of information ............................................................... 5
2.2 Involvement in the commitments: regions/ countries, stakeholders ................................................... 5
2.2.1 Countries ..................................................................................................................................................................... 5
2.2.2 Lead stakeholders ................................................................................................................................................. 6
2.2.3 Involved stakeholders ......................................................................................................................................... 7
2.3 Target groups and their coverage with quantitative information ........................................................ 8
2.4 End-user involvement ................................................................................................................................................. 10
2.5 Added value of the EIP on AHA ............................................................................................................................. 11
2.5.1 Added-value ........................................................................................................................................................... 11
2.5.2 Barriers ..................................................................................................................................................................... 12
2.6 Mobilisation of resources .......................................................................................................................................... 15
2.6.1 Type of funding.................................................................................................................................................... 15
2.6.2 Amount of funding required/committed ................................................................................................ 15
3. Annex – Process Indicators Tables (MS and BS for 93 commitments) ..................................................... 16

2
List of Figures
Figure 1 Country participation (% of commitments MS vs BS, 93 commitments) .................................. 5 Figure 2 Country participation evolution MS vs. BS (93 commitments) ......................................................... 6 Figure 3 Lead stakeholders by type (%), MS (93 commitments) ....................................................................... 7 Figure 4 Involved stakeholders by type (%), MS (93 commitments) ............................................................... 7 Figure 5 Stakeholder type (%), MS vs. BS (93 commitments) ............................................................................. 8 Figure 6 No of commitments providing data on target group and disease, per Action Group,
MS ....................................................................................................................................................................................... 8 Figure 7 Percentage of commitments specifying target group, MS ................................................................. 9 Figure 8 No of commitments specifying target health condition, MS vs. BS (93 commitments) .... 9 Figure 9 Percentage of commitments involving end-user by type, MS vs. BS
(93 commitments) .................................................................................................................................................. 10 Figure 10 Percentage of commitments involving end-users per stage of the process, BS vs MS
(93 commitments) .................................................................................................................................................. 11 Figure 11 Percentage of commitments reporting added value per type, MS (93 commitments) ... 11 Figure 12 Percentage of commitments reporting added value, per type and per Action Group, MS
(93 commitments) .................................................................................................................................................. 12 Figure 13 Percentage of commitments reporting added value, per type and per Action Group, MS
(cont'd) (93 commitments) ................................................................................................................................ 12 Figure 14 Percentage of commitments reporting barriers, by type, MS (93 commitments) .............. 13 Figure 15 Percentage of commitments reporting barriers, by type and by Action Group, MS
(93 commitments) .................................................................................................................................................. 13 Figure 16 Percentage of commitments reporting barriers, by type and by Action Group, MS
(93 commitments) .................................................................................................................................................. 14 Figure 17 Percentage of commitments reporting barriers by type, MS vs BS ............................................ 14 Figure 18 Type of funding ........................................................................................................................................................ 15
List of Tables
Table 1 Total Funding MS, BS, and difference for 27 Commitments with available information ................................................................................................................................. 15
Table 2 Country participation (All, EU, non-EU and other regions) (93 Commitments) .................... 16 Table 3 Country participation (All, EU, non-EU and other regions) (93 Commitments) .................... 17 Table 4 Total Stakeholder involvement (93 Commitments) ............................................................................ 18 Table 5 Type of Stakeholder involved, evolution (after aggregation) ......................................................... 20 Table 6 Type of Stakeholder involved, evolution (after aggregation), A1 ................................................ 21 Table 7 Type of Stakeholder involved, evolution (after aggregation), A2 ................................................ 21 Table 8 Type of Stakeholder involved, evolution (after aggregation), A3 ................................................ 21 Table 9 Type of Stakeholder involved, evolution (after aggregation), B3 ................................................ 21 Table 10 Type of Stakeholder involved, evolution (after aggregation), C2 ................................................ 22 Table 11 Type of Stakeholder involved, evolution (after aggregation), D4 ................................................ 22 Table 12 Total Stakeholder Involvement - Action Group A1 (11 commitments) .................................... 23 Table 13 Total Stakeholder Involvement - Action Group A2 (16 commitments) .................................... 24 Table 14 Total Stakeholder Involvement - Action Group A3 (16 commitments) .................................... 25 Table 15 Total Stakeholder Involvement - Action Group B3 (22 commitments) .................................... 26 Table 16 Total Stakeholder Involvement - Action Group C2 (16 commitments) .................................... 27 Table 17 Total Stakeholder Involvement - Action Group D4 (12 commitments) .................................... 28 Table 18 Industry Sector of Lead Stakeholder – Monitoring Survey .............................................................. 29 Table 19 Target group – Baseline (1stINVITATION)
(22 commitments with available information) ...................................................................................... 30 Table 20 Target group – Monitoring Survey (47 commitments with available information) ........... 31 Table 21 Target Group types – Monitoring Survey (93 commitments)......................................................... 32 Table 22 End-user group - Baseline (1stINVITATION) ............................................................................................ 33

3
Table 23 End-user group – Monitoring Survey............................................................................................................ 33 Table 24 End-user involvement: Stage of process - Baseline (1stINVITATION)....................................... 34 Table 25 End-user involvement: Stage of process – Monitoring Survey...................................................... 34 Table 26 Added-Value from the EIP on AHA – Monitoring Survey .................................................................. 35 Table 27 Type of Barrier the EIP on AHA may help to overcome - Baseline (1stINVITATION) ........ 35 Table 28 Type of Barrier the EIP on AHA may help to overcome – Monitoring Survey ....................... 36 Table 29 EU Funding (Commitments with information on EU Funding) ....................................................... 37

4
1. Introduction
1.1 Background
IPTS in cooperation with DG CNECT and DG SANCO is developing a monitoring framework to assess the evolution and impact of the EIP on Active and Healthy Ageing (EIP on AHA), through the "Monitoring and Assessment Framework for the EIP on Active and Healthy Ageing" (MAFEIP) project. The main objective of MAFEIP is to define a common monitoring framework, which should facilitate and harmonise the monitoring of the process of the EIP on AHA and of the outcome and output of the Action Groups (not the individual commitments to the six specific Action Groups). It will also seek to establish a link between the monitoring results and the EIP on AHA objectives, namely the triple win and the overall objective of two extra healthy life years.
The process for defining indicators and the conceptual framework proposed to develop the monitoring framework for the EIP on AHA are presented in a separate MAFEIP deliverable, D1.1. This deliverable also provides further background on the EIP on Active and Healthy Ageing as well as on the activities of the various EIP on AHA Action Groups.
Based on the conceptual framework presented in D1.1 as well as on the data collected through the EIP on AHA First Invitation for Commitment in June 2012 and the subsequent Monitoring Survey undertaken in spring 2013, it has been possible to identify the most relevant process indicators. These process indicators are intended to facilitate the monitoring of the EIP on AHA process. This exercise is presented in Deliverable 2.1, where the values of the selected process indicators are populated with data from the First Invitation for Commitment of June 2012, 234 commitments in total.
1.2 Objective of this report
This report aims to provide information on the evolution of the Commitments that joined the EIP on AHA in the First Invitation for Commitment (June 2012) during the first months of the partnership by analysing the variation for the defined process indicators between the start of the project (June 2012) and spring 2013, the latter corresponding to the time when data was collected through a Monitoring Survey. The survey questions mirrored in general the information submitted by participants through the First Invitation for Commitment, although not all questions were phrased and/or formatted in the same way, which complicates somewhat the comparison of the two data sets.
The analysis presented here aims to show the evolution of the EIP on AHA process’ indicators for the following dimensions:
Involvement in the commitments: regions/ countries, stakeholders,
Target groups and their coverage with quantitative information,
End-user involvement,
Added value of the EIP on AHA,
Mobilisation of resources. A total of 107 responses were received through the Monitoring Survey (MS) out of which 14 were from Reference Sites which participate in the Action Groups. As the latter did not send any commitment they were not included in the analysis. In other words, the information presented in this report deals with a total number of 93 commitments. When reference is made to the Baseline in this report, this means the Baseline for the subset of 93 commitments that responded to the Monitoring Survey.
5
2. Monitoring Survey Data: Analysis of Evolution
2.1 Limitations and issues related to the sources of information
The detailed exploration and comparison of the two sources of information, with on the one hand the data submitted through the First Invitation for Commitment (1stINVITATION) and on the other hand the monitoring survey (MS), leads us to highlight the difficulties associated with carrying out a meaningful analysis. The most important issue has to do with differences between the sources in terms of how the information about the same issues was obtained (i.e. categorical questions vs. free text ones) and how the categorical questions were structured (i.e. differences in the pre-defined categories available to answer and possible options for answering some of the questions). The specific issues and problems encountered for each process indicator category are explained in the corresponding subsections below.
2.2 Involvement in the commitments: regions/ countries, stakeholders
2.2.1 Countries
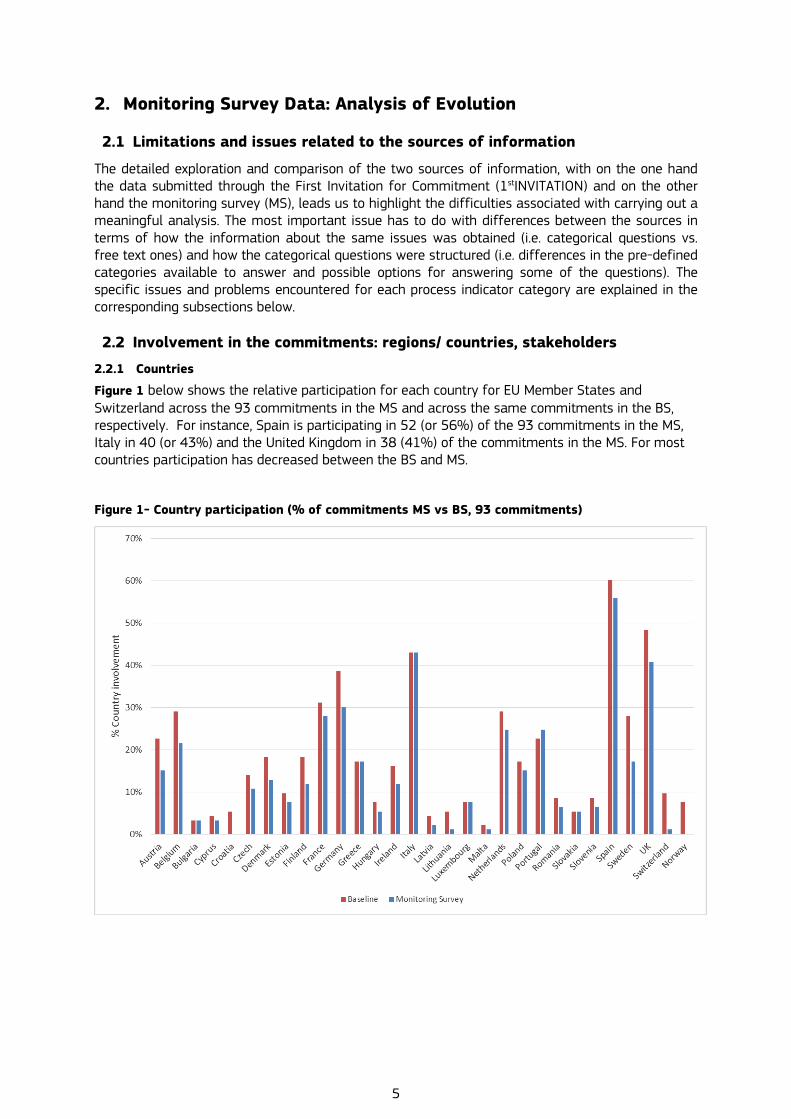
Figure 1 below shows the relative participation for each country for EU Member States and Switzerland across the 93 commitments in the MS and across the same commitments in the BS, respectively. For instance, Spain is participating in 52 (or 56%) of the 93 commitments in the MS, Italy in 40 (or 43%) and the United Kingdom in 38 (41%) of the commitments in the MS. For most countries participation has decreased between the BS and MS.
Figure 1- Country participation (% of commitments MS vs BS, 93 commitments)
6
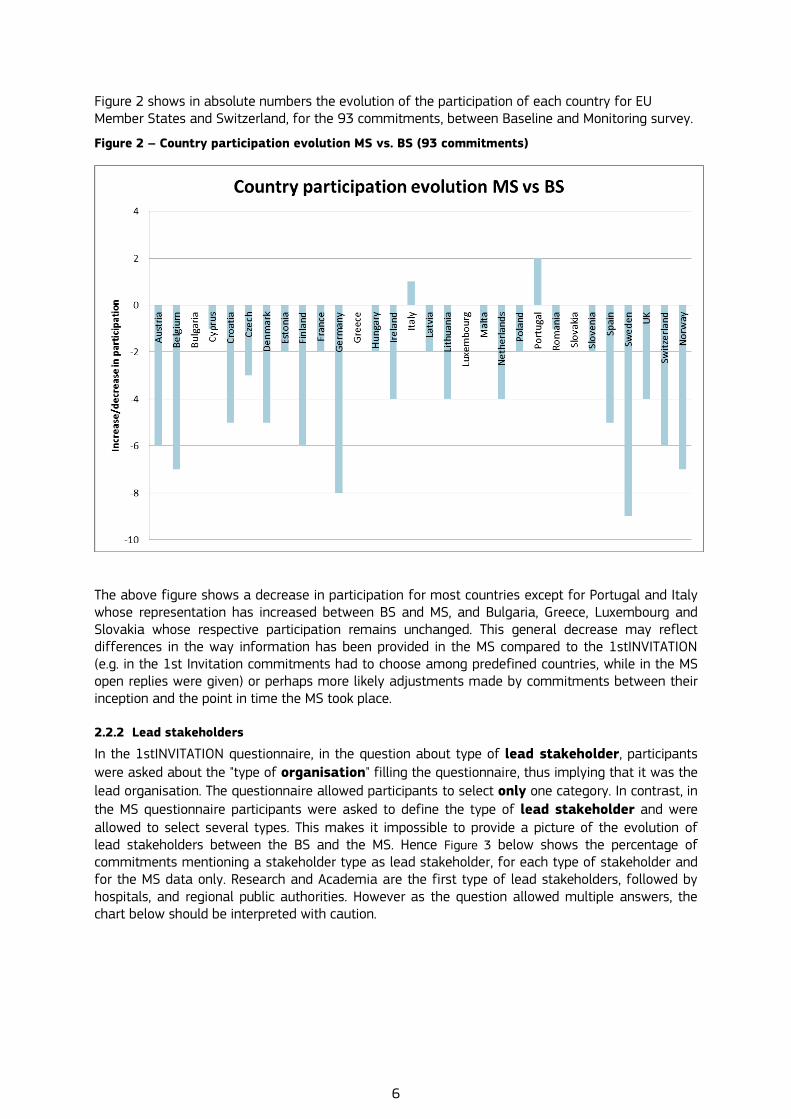
Figure 2 shows in absolute numbers the evolution of the participation of each country for EU Member States and Switzerland, for the 93 commitments, between Baseline and Monitoring survey.
Figure 2 – Country participation evolution MS vs. BS (93 commitments)
The above figure shows a decrease in participation for most countries except for Portugal and Italy whose representation has increased between BS and MS, and Bulgaria, Greece, Luxembourg and Slovakia whose respective participation remains unchanged. This general decrease may reflect differences in the way information has been provided in the MS compared to the 1stINVITATION (e.g. in the 1st Invitation commitments had to choose among predefined countries, while in the MS open replies were given) or perhaps more likely adjustments made by commitments between their inception and the point in time the MS took place. 2.2.2 Lead stakeholders
In the 1stINVITATION questionnaire, in the question about type of lead stakeholder, participants
were asked about the "type of organisation" filling the questionnaire, thus implying that it was the
lead organisation. The questionnaire allowed participants to select only one category. In contrast, in
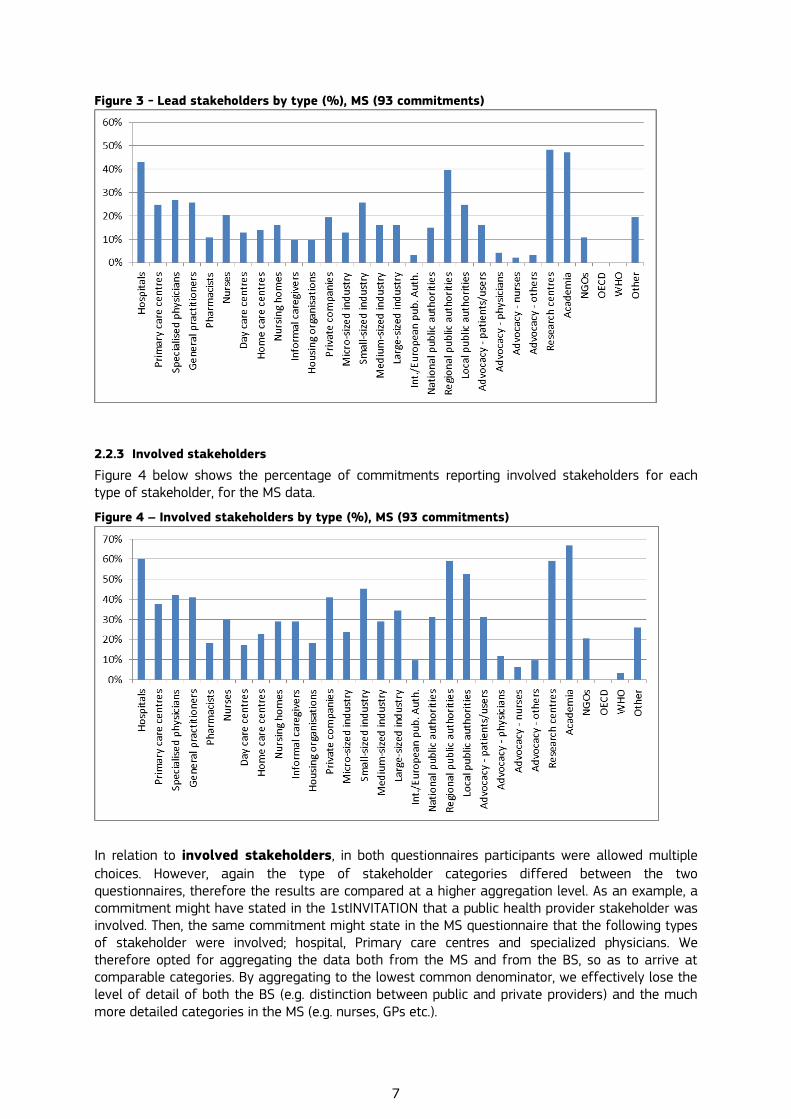
the MS questionnaire participants were asked to define the type of lead stakeholder and were allowed to select several types. This makes it impossible to provide a picture of the evolution of lead stakeholders between the BS and the MS. Hence Figure 3 below shows the percentage of commitments mentioning a stakeholder type as lead stakeholder, for each type of stakeholder and for the MS data only. Research and Academia are the first type of lead stakeholders, followed by hospitals, and regional public authorities. However as the question allowed multiple answers, the chart below should be interpreted with caution.
7
Figure 3 - Lead stakeholders by type (%), MS (93 commitments)
2.2.3 Involved stakeholders
Figure 4 below shows the percentage of commitments reporting involved stakeholders for each type of stakeholder, for the MS data.
Figure 4 – Involved stakeholders by type (%), MS (93 commitments)
In relation to involved stakeholders, in both questionnaires participants were allowed multiple
choices. However, again the type of stakeholder categories differed between the two questionnaires, therefore the results are compared at a higher aggregation level. As an example, a commitment might have stated in the 1stINVITATION that a public health provider stakeholder was involved. Then, the same commitment might state in the MS questionnaire that the following types of stakeholder were involved; hospital, Primary care centres and specialized physicians. We therefore opted for aggregating the data both from the MS and from the BS, so as to arrive at comparable categories. By aggregating to the lowest common denominator, we effectively lose the level of detail of both the BS (e.g. distinction between public and private providers) and the much more detailed categories in the MS (e.g. nurses, GPs etc.).
8
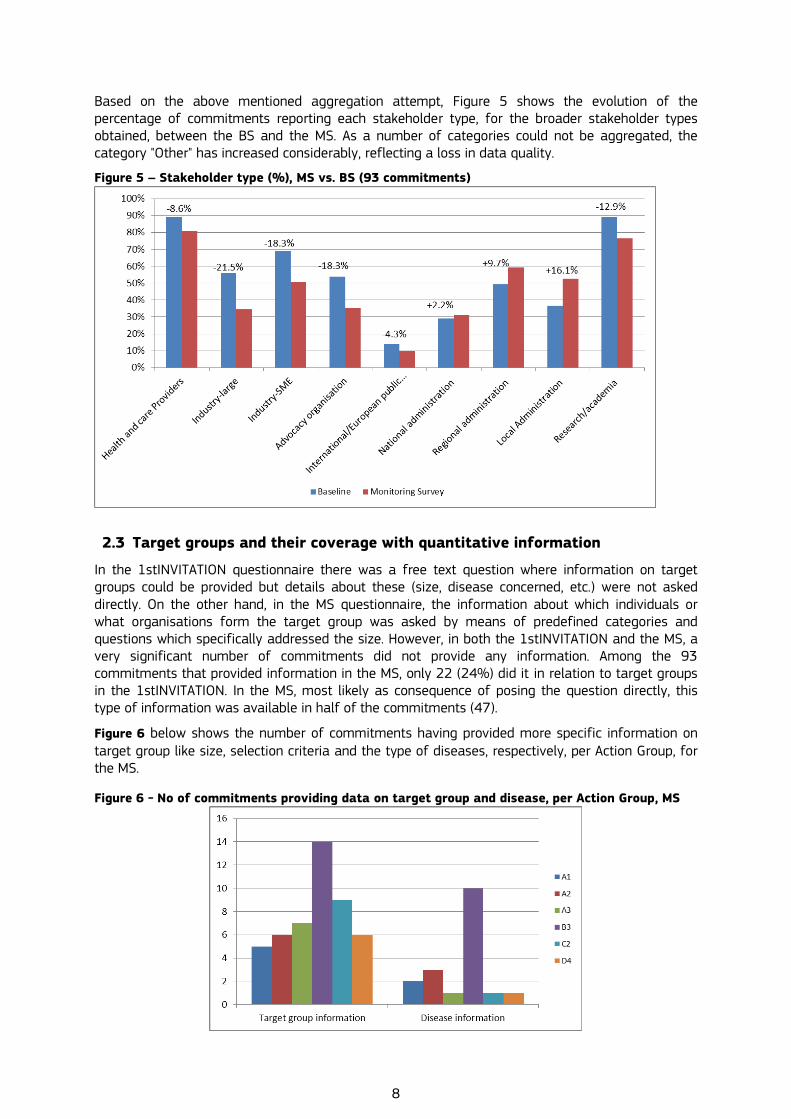
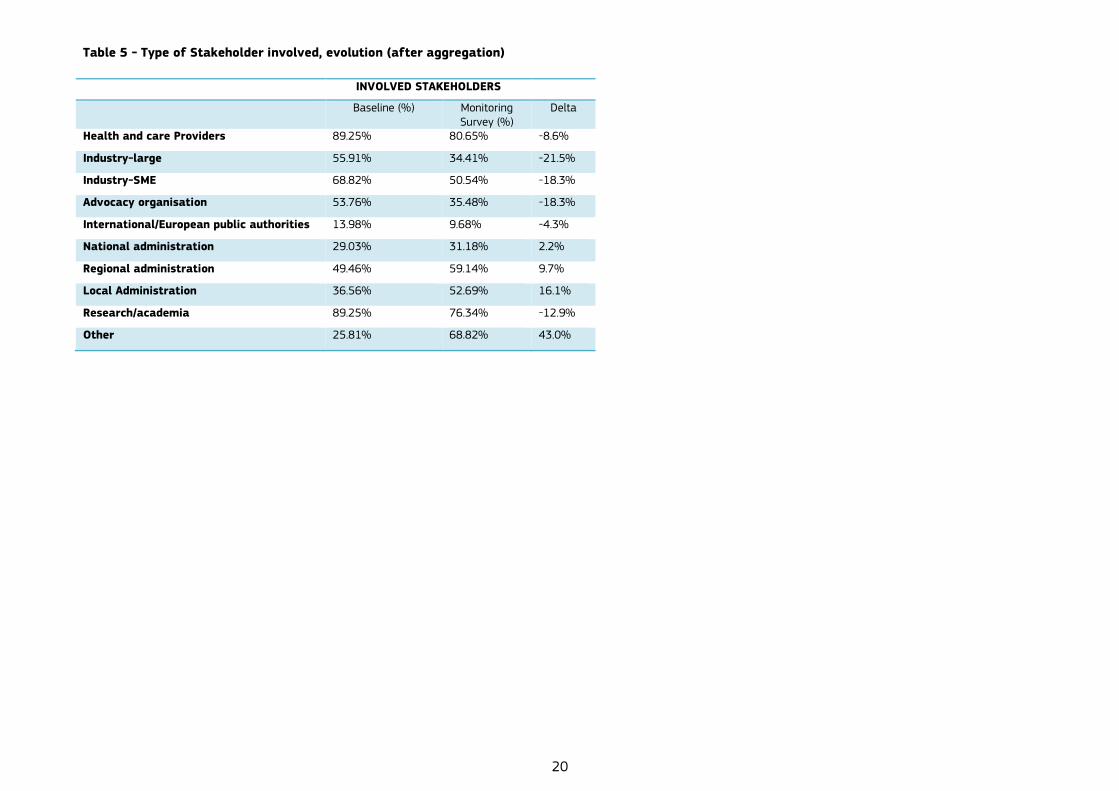
Based on the above mentioned aggregation attempt, Figure 5 shows the evolution of the percentage of commitments reporting each stakeholder type, for the broader stakeholder types obtained, between the BS and the MS. As a number of categories could not be aggregated, the category "Other" has increased considerably, reflecting a loss in data quality.
Figure 5 – Stakeholder type (%), MS vs. BS (93 commitments)
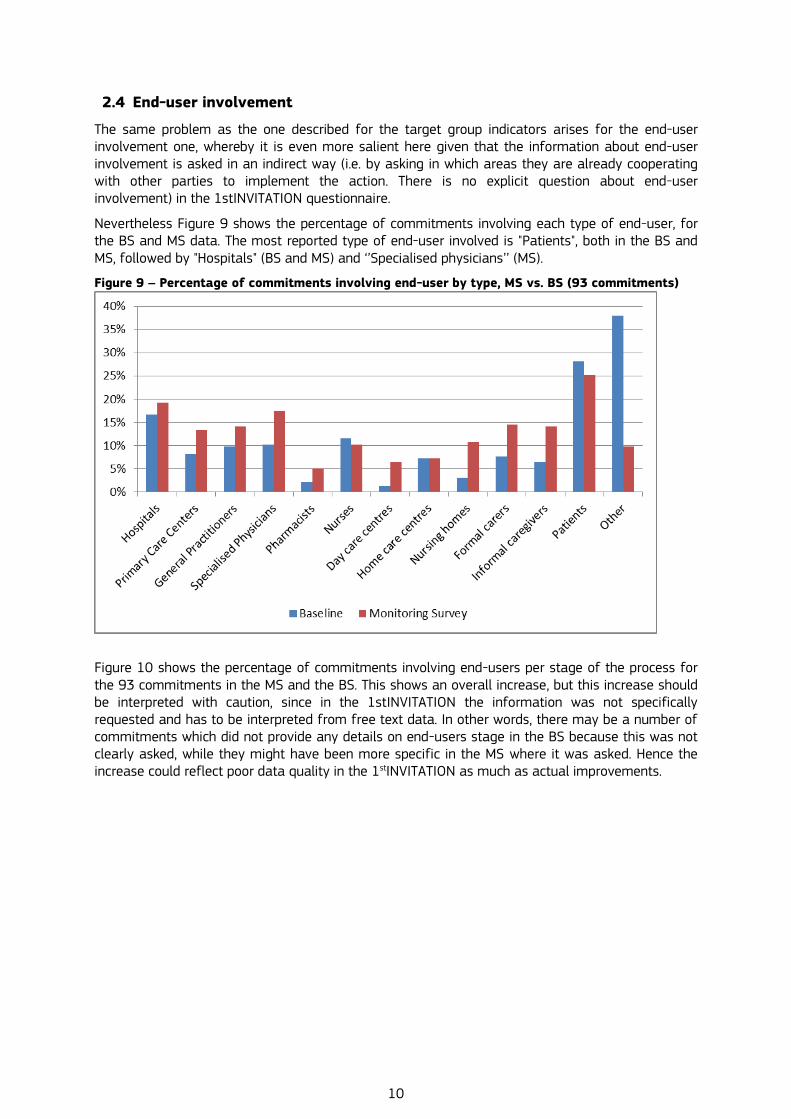
2.3 Target groups and their coverage with quantitative information
In the 1stINVITATION questionnaire there was a free text question where information on target groups could be provided but details about these (size, disease concerned, etc.) were not asked directly. On the other hand, in the MS questionnaire, the information about which individuals or what organisations form the target group was asked by means of predefined categories and questions which specifically addressed the size. However, in both the 1stINVITATION and the MS, a very significant number of commitments did not provide any information. Among the 93 commitments that provided information in the MS, only 22 (24%) did it in relation to target groups in the 1stINVITATION. In the MS, most likely as consequence of posing the question directly, this type of information was available in half of the commitments (47).
Figure 6 below shows the number of commitments having provided more specific information on target group like size, selection criteria and the type of diseases, respectively, per Action Group, for the MS.
Figure 6 - No of commitments providing data on target group and disease, per Action Group, MS

9
Out of the 47 commitments from the MS providing more specific information on target groups, only 2 commitments had also reported data in the Baseline, in both cases about patients: one commitment shows a decrease of 25,000 patients and another an increase of 6,076,000 between BS and MS.
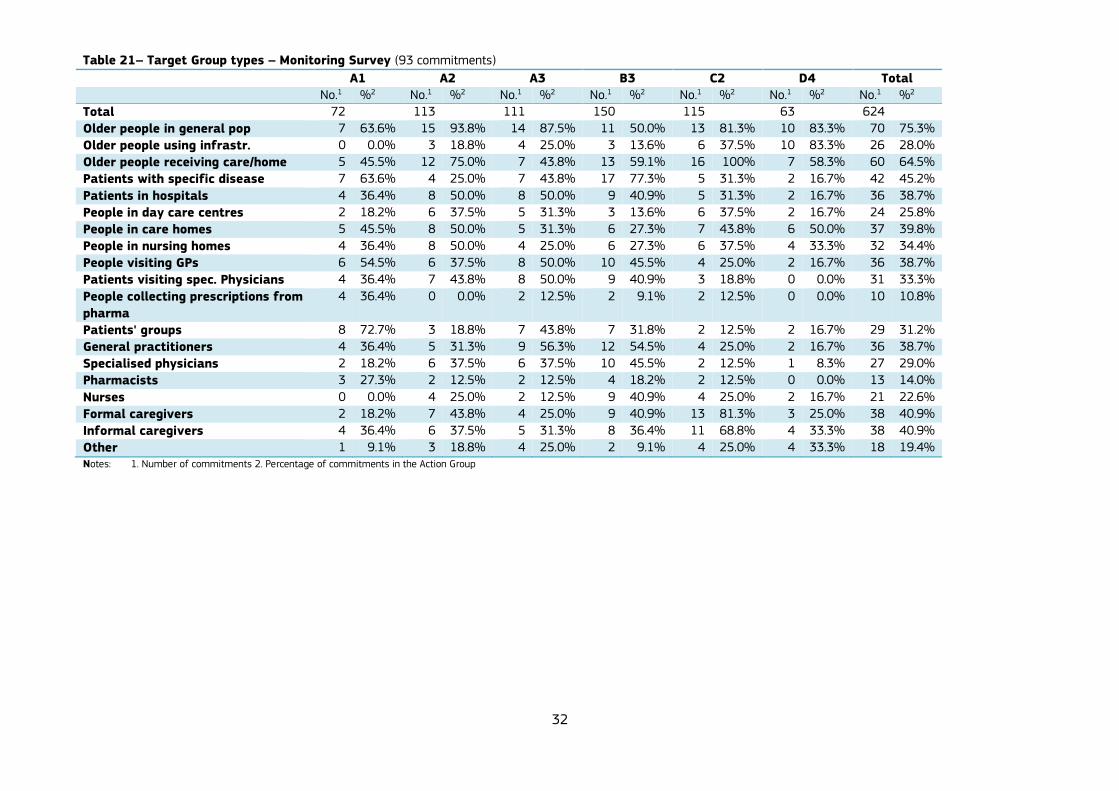
In addition to the above, there was a specific question in the MS on the type of target group with pre-defined answers. This question was answered by all 93 commitments. Figure 7 shows the percentage of commitments that specify each type of target group: 75% of commitments report targeting "Older people in general", 65% target "Older people receiving care at home", and 45% "Patients with specific diseases". Around 40% of commitments target "Formal care givers" and "Informal caregivers" respectively. The least addressed target group is "People collecting prescriptions from pharmacies" mentioned by 10% of the commitments.
Figure 7 – Percentage of commitments specifying target group, MS
Furthermore, out of the 47 commitments that provided some specific information on target groups in the MS, only 18 specified a type of disease as shown in Figure 8 below. Multiple diseases are the most mentioned conditions, followed by diabetes and rehabilitation. This figure also displays the number of commitments specifying a target health condition in the BS (information provided by 11 commitments only). In total, 8 commitments have provided information in both the BS and the MS.
Figure 8 – No of commitments specifying target health condition, MS vs. BS (93 commitments)
10
2.4 End-user involvement
The same problem as the one described for the target group indicators arises for the end-user involvement one, whereby it is even more salient here given that the information about end-user involvement is asked in an indirect way (i.e. by asking in which areas they are already cooperating with other parties to implement the action. There is no explicit question about end-user involvement) in the 1stINVITATION questionnaire.
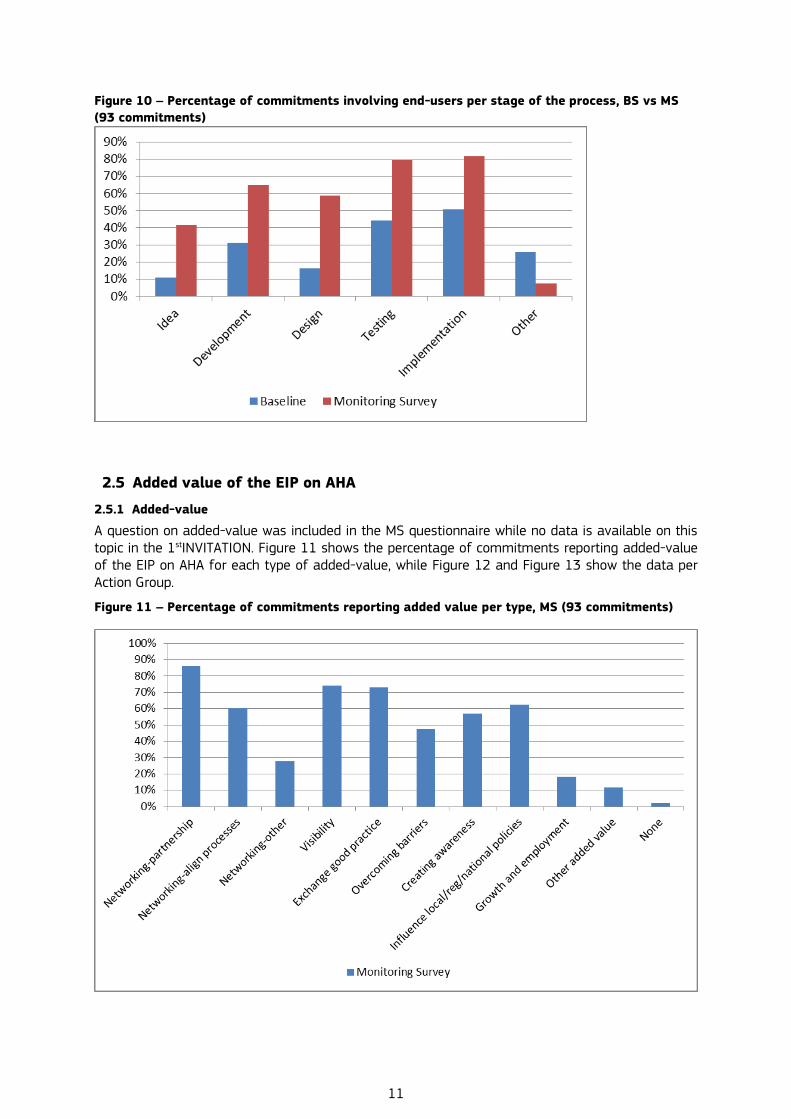
Nevertheless Figure 9 shows the percentage of commitments involving each type of end-user, for the BS and MS data. The most reported type of end-user involved is "Patients", both in the BS and MS, followed by "Hospitals" (BS and MS) and ‘’Specialised physicians’’ (MS).
Figure 9 – Percentage of commitments involving end-user by type, MS vs. BS (93 commitments)
Figure 10 shows the percentage of commitments involving end-users per stage of the process for the 93 commitments in the MS and the BS. This shows an overall increase, but this increase should be interpreted with caution, since in the 1stINVITATION the information was not specifically requested and has to be interpreted from free text data. In other words, there may be a number of commitments which did not provide any details on end-users stage in the BS because this was not clearly asked, while they might have been more specific in the MS where it was asked. Hence the increase could reflect poor data quality in the 1stINVITATION as much as actual improvements.
11
Figure 10 – Percentage of commitments involving end-users per stage of the process, BS vs MS
(93 commitments)
2.5 Added value of the EIP on AHA
2.5.1 Added-value
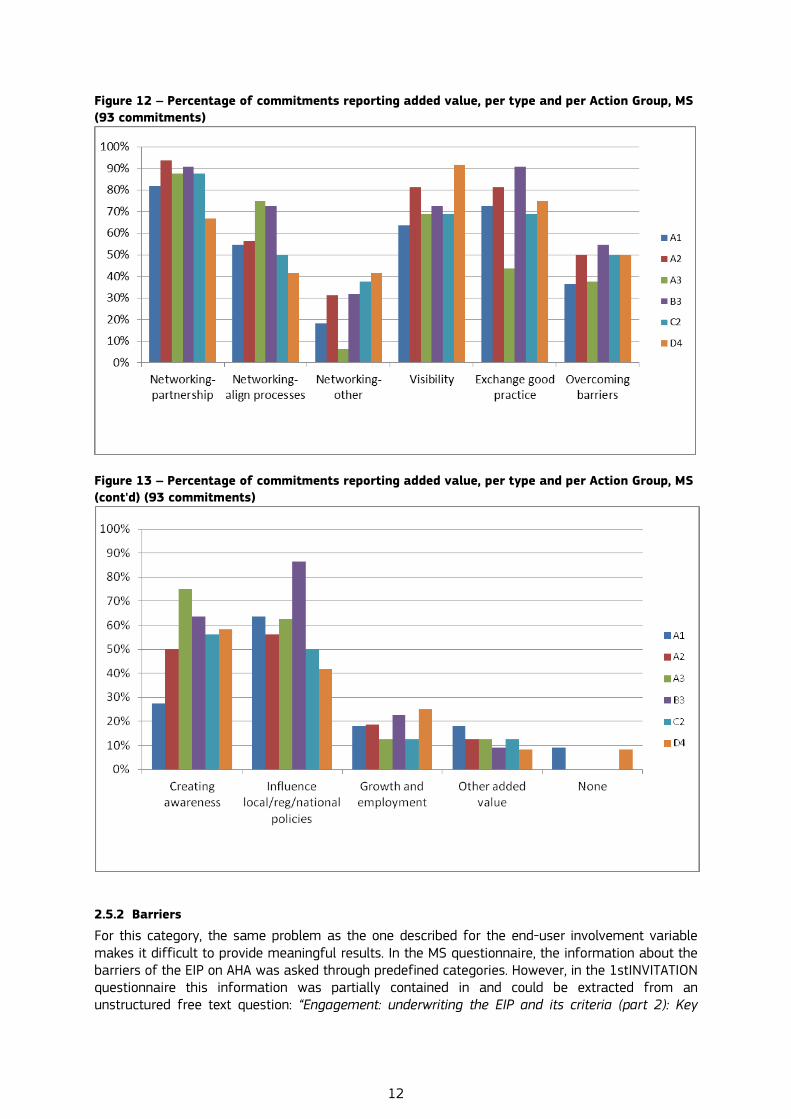
A question on added-value was included in the MS questionnaire while no data is available on this topic in the 1stINVITATION. Figure 11 shows the percentage of commitments reporting added-value of the EIP on AHA for each type of added-value, while Figure 12 and Figure 13 show the data per Action Group.
Figure 11 – Percentage of commitments reporting added value per type, MS (93 commitments)
12
Figure 12 – Percentage of commitments reporting added value, per type and per Action Group, MS
(93 commitments)
Figure 13 – Percentage of commitments reporting added value, per type and per Action Group, MS
(cont'd) (93 commitments)
2.5.2 Barriers
For this category, the same problem as the one described for the end-user involvement variable makes it difficult to provide meaningful results. In the MS questionnaire, the information about the barriers of the EIP on AHA was asked through predefined categories. However, in the 1stINVITATION questionnaire this information was partially contained in and could be extracted from an unstructured free text question: “Engagement: underwriting the EIP and its criteria (part 2): Key
13
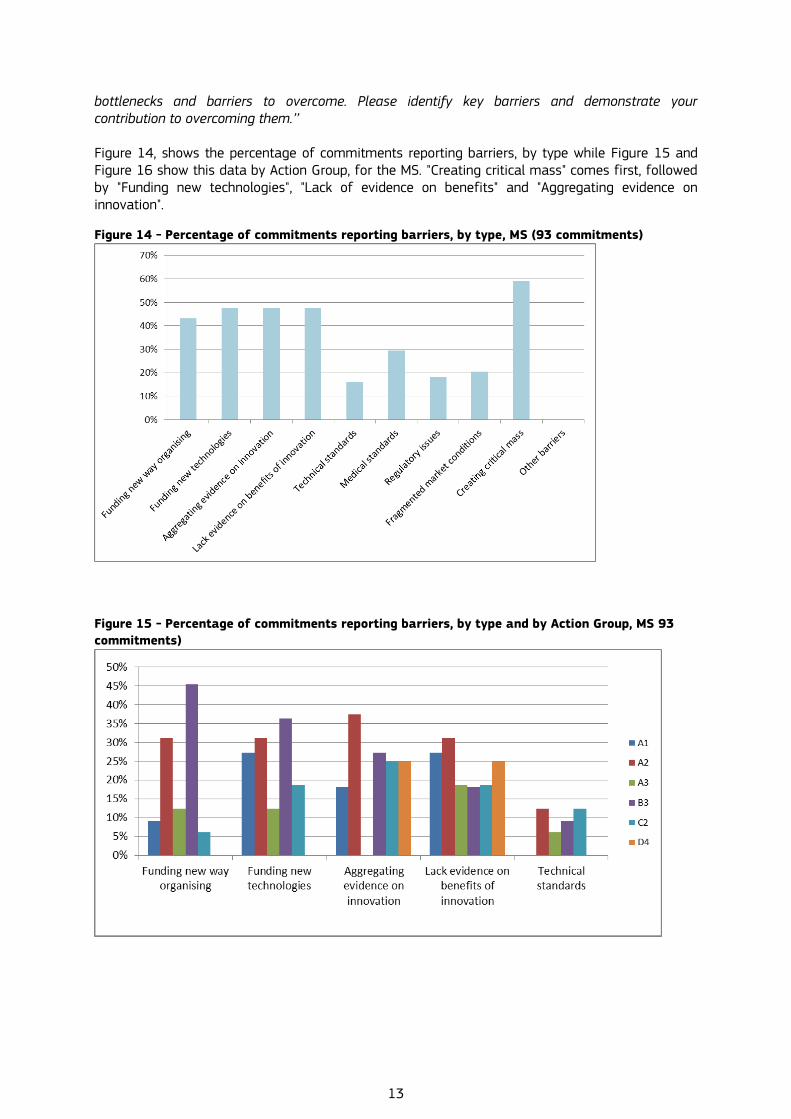
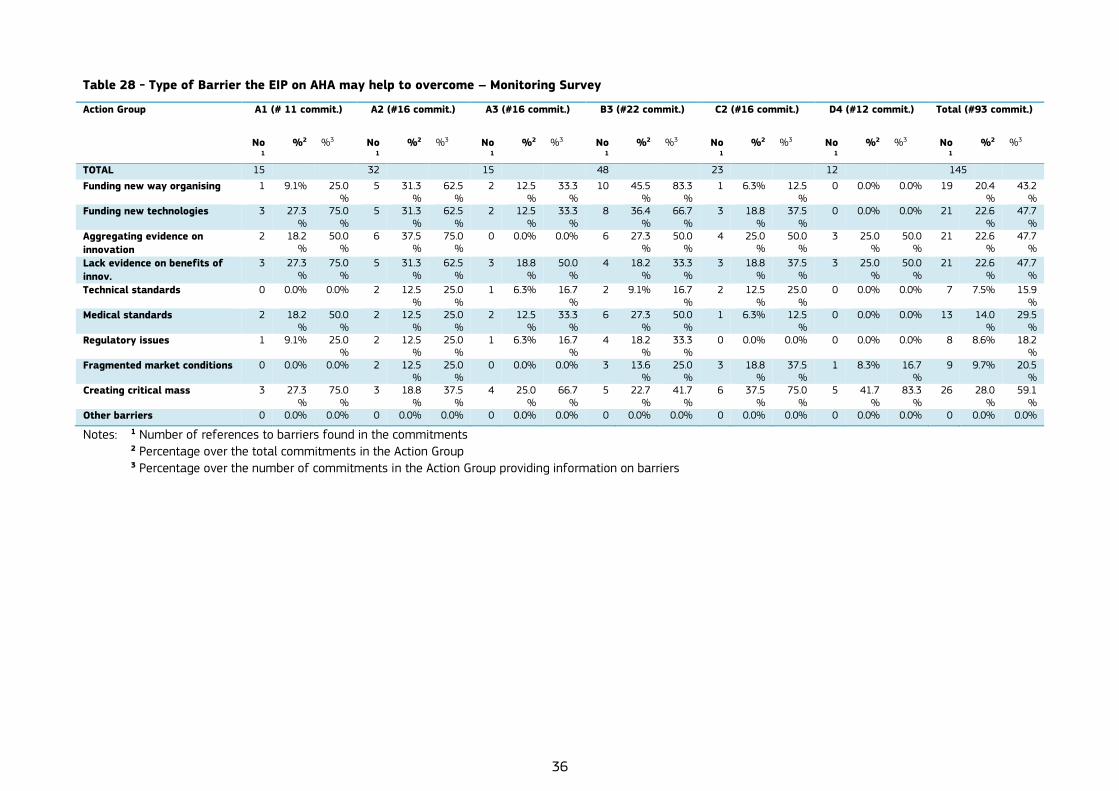
bottlenecks and barriers to overcome. Please identify key barriers and demonstrate your contribution to overcoming them.’’ Figure 14, shows the percentage of commitments reporting barriers, by type while Figure 15 and Figure 16 show this data by Action Group, for the MS. "Creating critical mass" comes first, followed by "Funding new technologies", "Lack of evidence on benefits" and "Aggregating evidence on innovation".
Figure 14 - Percentage of commitments reporting barriers, by type, MS (93 commitments)
Figure 15 - Percentage of commitments reporting barriers, by type and by Action Group, MS 93
commitments)
14
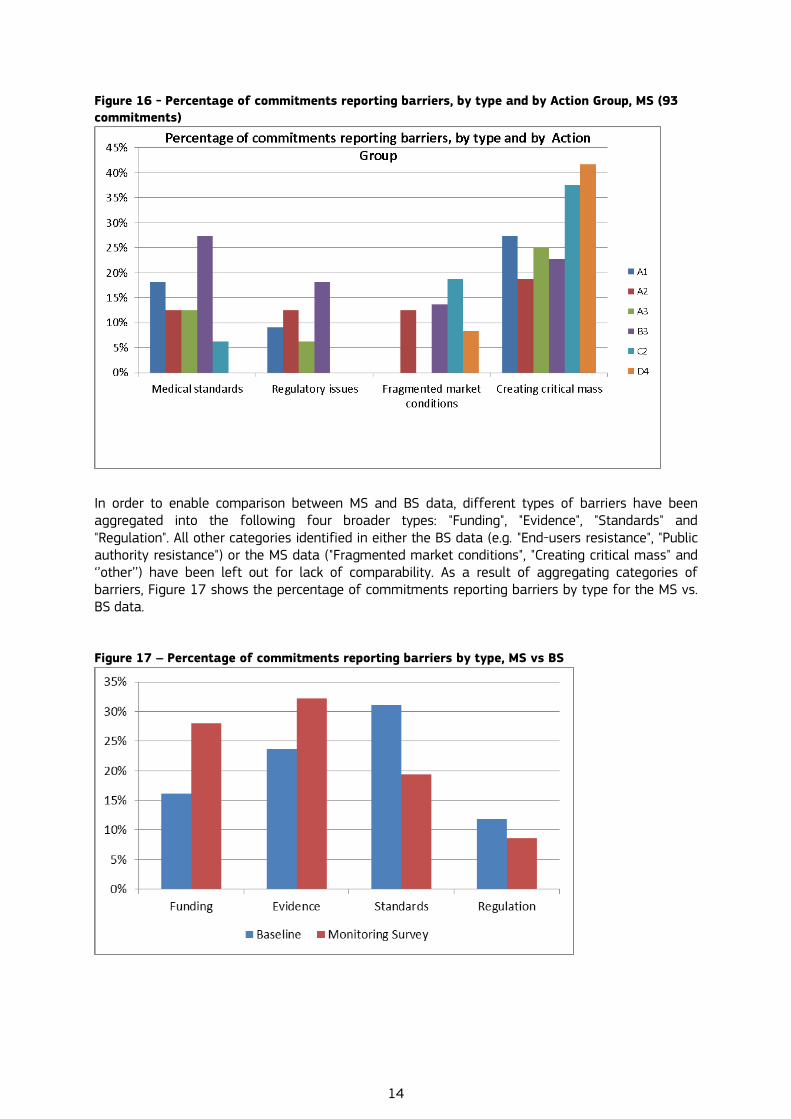
Figure 16 - Percentage of commitments reporting barriers, by type and by Action Group, MS (93
commitments)
In order to enable comparison between MS and BS data, different types of barriers have been aggregated into the following four broader types: "Funding", "Evidence", "Standards" and "Regulation". All other categories identified in either the BS data (e.g. "End-users resistance", "Public authority resistance") or the MS data ("Fragmented market conditions", "Creating critical mass" and ‘’other’’) have been left out for lack of comparability. As a result of aggregating categories of barriers, Figure 17 shows the percentage of commitments reporting barriers by type for the MS vs. BS data. Figure 17 – Percentage of commitments reporting barriers by type, MS vs BS

15
2.6 Mobilisation of resources
2.6.1 Type of funding
In the MS, most likely as consequence of posing the question directly, this type of information was available for approximately one third of the commitments (34). However, only 11 out of the 93 commitments from the MS had provided information on this topic in the BS.
It therefore does not make sense to compare BS and MS for this variable, which is why Figure 18 below only shows the number of commitments that provided information for each type of funding in the MS: 21 commitments reported using FP7 funding, 11 CIP and 10 Cohesion and Structural funds. A further 8 reported having AAL funding while only 5 reported having funding from Public Health Programmes and 2 from PROGRESS.
Once more, because of the inconsistencies in the wording and format of the question, it is difficult to extract useful information from the analysis about the evolution of this variable.
Figure 18 – Type of funding
2.6.2 Amount of funding required/committed
In both sources of information, the question about total funding required/committed is in free text format. As a consequence this information is scattered: among the 93 commitments, 50 provided some funding figure in the BS and 51 did so in the MS, out of which only 27 provided funding figures for both MS and BS. Furthermore, different commitments give different information. Most commitments provide a global/single funding figure for the overall period with only a few of these specifying the funding period and how this figure is split over specific years. The total funding calculated here therefore represents the sum of all global figures, independently of the duration of the commitment. As a result Table 1 below, which shows the evolution of the amount of funding should be interpreted with caution.
Table 1- Total Funding MS, BS, and difference for 27 Commitments with available information
Baseline (1stINVITATION) Monitoring Survey Difference in funding
Action
Group
No.
Commit.
Funding in
Million Euro
No.
Commit.
Funding in
Million Euro
No. Commit. Funding in
Million Euro
A1 6 81.88866 8 1,021.788 4 612.61
A2 13 2,092.936 6 394.983 5 -681.275
A3 9 6,425.591 12 409.770 7 -6,402.74
B3 10 3,132.072 11 1,788.308 7 -1,649.19
C2 7 17.308 9 346.816 3 6.587001
D4 5 6.59 5 6.611 1 4.65075
Total 50 11,756.39 51 3,968.277 27 -8,109.36
Note: The Region of Southern Denmark which provides information on an amount of funding of 2.8 billion euros for each one of
the Actions A2, B3 and C2, does not provide information on funding in the Monitoring Survey. This explains most of the decrease.
16
3. Annex – Process Indicators Tables (MS and BS for 93 commitments)
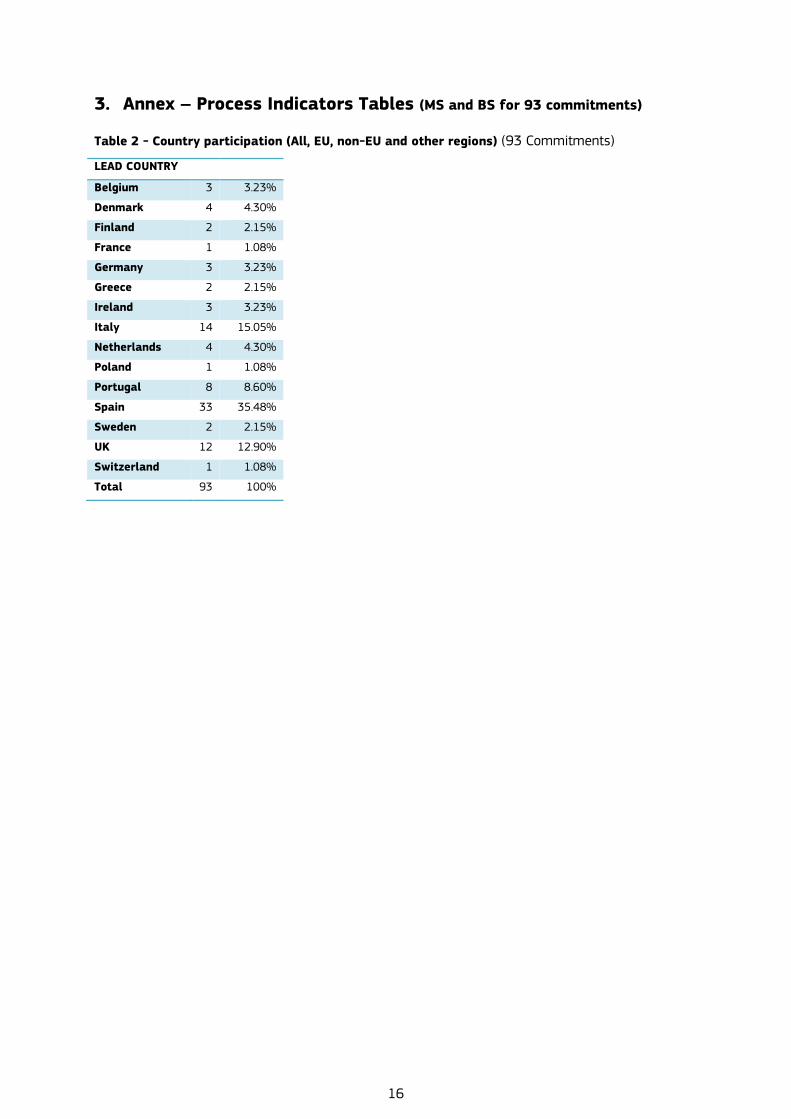
Table 2 - Country participation (All, EU, non-EU and other regions) (93 Commitments)
LEAD COUNTRY
Belgium 3 3.23%
Denmark 4 4.30%
Finland 2 2.15%
France 1 1.08%
Germany 3 3.23%
Greece 2 2.15%
Ireland 3 3.23%
Italy 14 15.05%
Netherlands 4 4.30%
Poland 1 1.08%
Portugal 8 8.60%
Spain 33 35.48%
Sweden 2 2.15%
UK 12 12.90%
Switzerland 1 1.08%
Total 93 100%

17
Table 3 - Country participation (All, EU, non-EU and other regions) (93 Commitments)
PARTICIPATING COUNTRY
Baseline (1stINVITATION)
Monitoring Survey
Austria 20 4.03% 14 3.49%
Belgium 27 5.44% 20 4.99%
Bulgaria 3 0.60% 3 0.75%
Cyprus 4 0.81% 3 0.75%
Croatia 5 1.01% 0 0.00%
Czech 13 2.62% 10 2.49%
Denmark 17 3.43% 12 2.99%
Estonia 9 1.81% 7 1.75%
Finland 17 3.43% 11 2.74%
France 28 5.65% 26 6.48%
Germany 36 7.26% 28 6.98%
Greece 16 3.23% 16 3.99%
Hungary 7 1.41% 5 1.25%
Ireland 15 3.02% 11 2.74%
Italy 39 7.86% 40 9.98%
Latvia 4 0.81% 2 0.50%
Lithuania 5 1.01% 1 0.25%
Luxembourg 7 1.41% 7 1.75%
Malta 2 0.40% 1 0.25%
Netherlands 27 5.44% 23 5.74%
Poland 16 3.23% 14 3.49%
Portugal 21 4.23% 23 5.74%
Romania 7 1.41% 6 1.50%
Slovakia 5 1.01% 5 1.25%
Slovenia 8 1.61% 6 1.50%
Spain 57 11.49% 52 12.97%
Sweden 25 5.04% 16 3.99%
UK 42 8.47% 38 9.48%
Switzerland 7 1.41% 1 0.25%
Norway 7 1.41% 0 0.00%
Total EU & non EU 496 100% 401 100%
Note: There are some commitments where the lead country is not included as participating country. In these cases and for the following number of commitments, the lead country has also been included as participating country: In the Baseline: Belgium 1, Finland 1, Germany 1, Ireland 2, Italy 7, Spain 1, UK 4, Switzerland 1. In the Monitoring Survey: Belgium 1, Germany 1, Greece 1, Portugal 1, Spain 3, Switzerland 1.
18
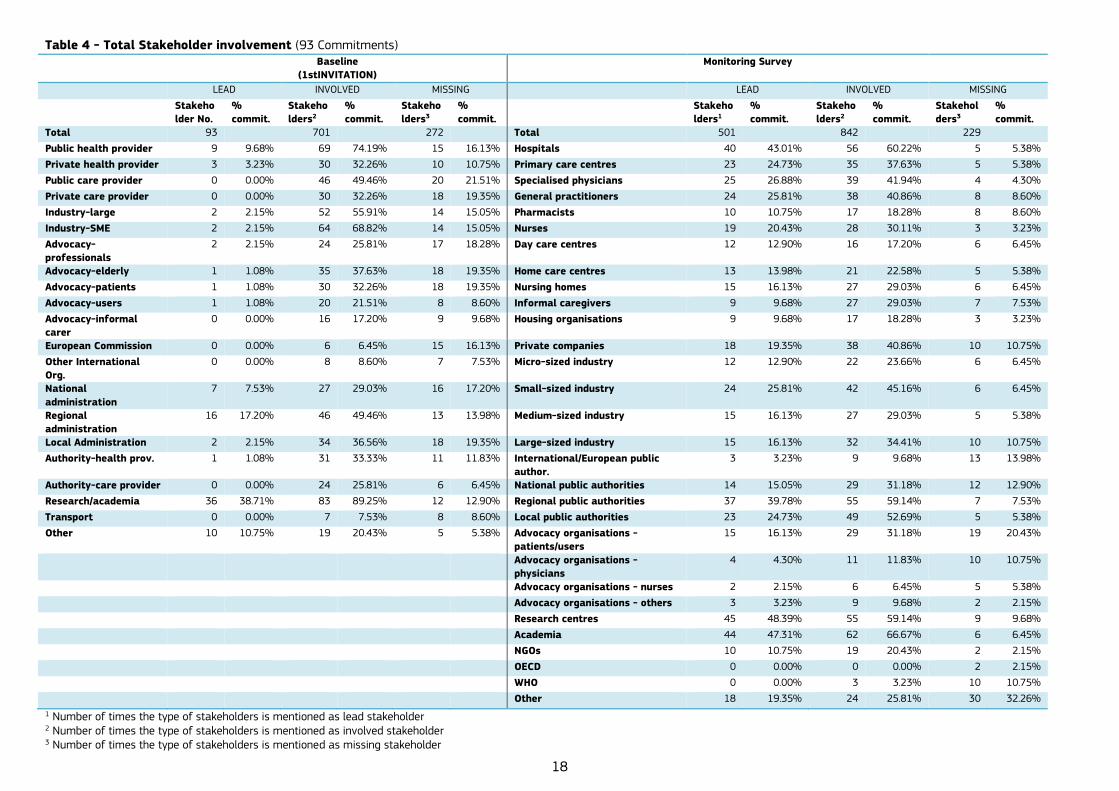
Table 4 - Total Stakeholder involvement (93 Commitments) Baseline
(1stINVITATION)
Monitoring Survey
LEAD INVOLVED MISSING LEAD INVOLVED MISSING
Stakeho
lder No.
%
commit.
Stakeho
lders2
%
commit.
Stakeho
lders3
%
commit. Stakeho
lders1
%
commit.
Stakeho
lders2
%
commit.
Stakehol
ders3
%
commit.
Total 93 701 272 Total 501 842 229
Public health provider 9 9.68% 69 74.19% 15 16.13% Hospitals 40 43.01% 56 60.22% 5 5.38%
Private health provider 3 3.23% 30 32.26% 10 10.75% Primary care centres 23 24.73% 35 37.63% 5 5.38%
Public care provider 0 0.00% 46 49.46% 20 21.51% Specialised physicians 25 26.88% 39 41.94% 4 4.30%
Private care provider 0 0.00% 30 32.26% 18 19.35% General practitioners 24 25.81% 38 40.86% 8 8.60%
Industry-large 2 2.15% 52 55.91% 14 15.05% Pharmacists 10 10.75% 17 18.28% 8 8.60%
Industry-SME 2 2.15% 64 68.82% 14 15.05% Nurses 19 20.43% 28 30.11% 3 3.23%
Advocacy-
professionals
2 2.15% 24 25.81% 17 18.28% Day care centres 12 12.90% 16 17.20% 6 6.45%
Advocacy-elderly 1 1.08% 35 37.63% 18 19.35% Home care centres 13 13.98% 21 22.58% 5 5.38%
Advocacy-patients 1 1.08% 30 32.26% 18 19.35% Nursing homes 15 16.13% 27 29.03% 6 6.45%
Advocacy-users 1 1.08% 20 21.51% 8 8.60% Informal caregivers 9 9.68% 27 29.03% 7 7.53%
Advocacy-informal
carer
0 0.00% 16 17.20% 9 9.68% Housing organisations 9 9.68% 17 18.28% 3 3.23%
European Commission 0 0.00% 6 6.45% 15 16.13% Private companies 18 19.35% 38 40.86% 10 10.75%
Other International
Org.
0 0.00% 8 8.60% 7 7.53% Micro-sized industry 12 12.90% 22 23.66% 6 6.45%
National
administration
7 7.53% 27 29.03% 16 17.20% Small-sized industry 24 25.81% 42 45.16% 6 6.45%
Regional
administration
16 17.20% 46 49.46% 13 13.98% Medium-sized industry 15 16.13% 27 29.03% 5 5.38%
Local Administration 2 2.15% 34 36.56% 18 19.35% Large-sized industry 15 16.13% 32 34.41% 10 10.75%
Authority-health prov. 1 1.08% 31 33.33% 11 11.83% International/European public
author.
3 3.23% 9 9.68% 13 13.98%
Authority-care provider 0 0.00% 24 25.81% 6 6.45% National public authorities 14 15.05% 29 31.18% 12 12.90%
Research/academia 36 38.71% 83 89.25% 12 12.90% Regional public authorities 37 39.78% 55 59.14% 7 7.53%
Transport 0 0.00% 7 7.53% 8 8.60% Local public authorities 23 24.73% 49 52.69% 5 5.38%
Other 10 10.75% 19 20.43% 5 5.38% Advocacy organisations -
patients/users
15 16.13% 29 31.18% 19 20.43%
Advocacy organisations -
physicians
4 4.30% 11 11.83% 10 10.75%
Advocacy organisations - nurses 2 2.15% 6 6.45% 5 5.38%
Advocacy organisations - others 3 3.23% 9 9.68% 2 2.15%
Research centres 45 48.39% 55 59.14% 9 9.68%
Academia 44 47.31% 62 66.67% 6 6.45%
NGOs 10 10.75% 19 20.43% 2 2.15%
OECD 0 0.00% 0 0.00% 2 2.15%
WHO 0 0.00% 3 3.23% 10 10.75%
Other 18 19.35% 24 25.81% 30 32.26%
1 Number of times the type of stakeholders is mentioned as lead stakeholder 2 Number of times the type of stakeholders is mentioned as involved stakeholder 3 Number of times the type of stakeholders is mentioned as missing stakeholder
19
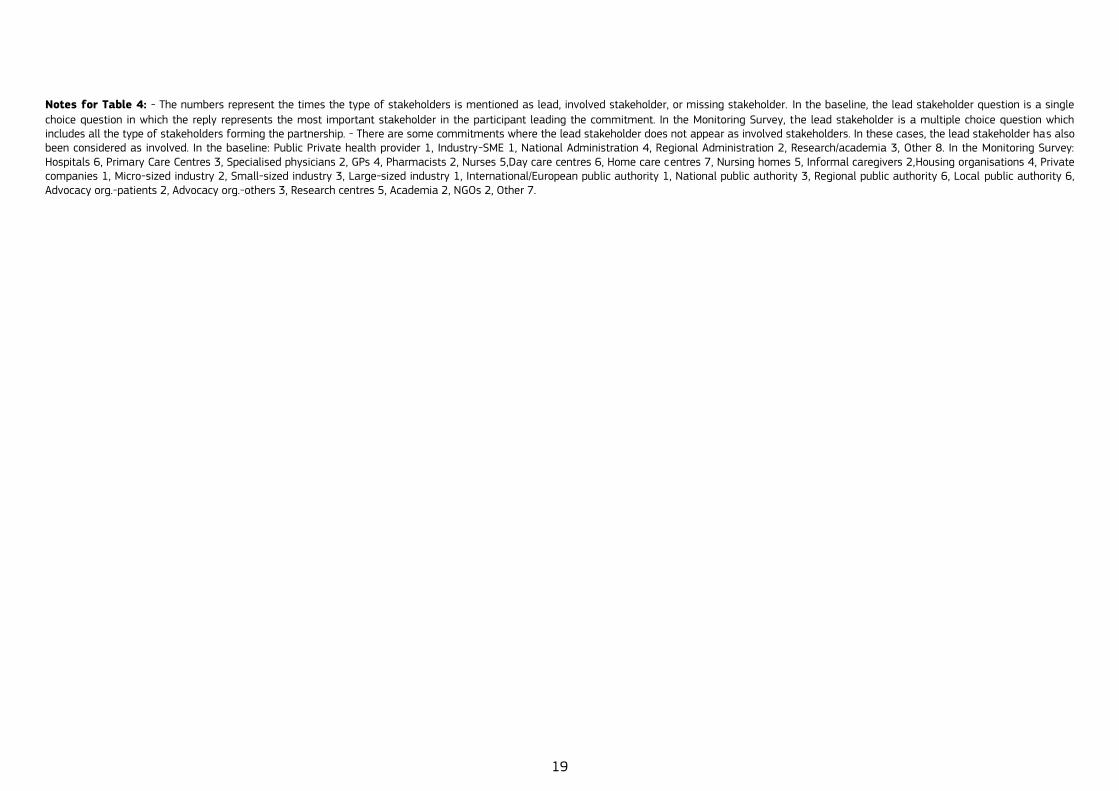
Notes for Table 4: - The numbers represent the times the type of stakeholders is mentioned as lead, involved stakeholder, or missing stakeholder. In the baseline, the lead stakeholder question is a single
choice question in which the reply represents the most important stakeholder in the participant leading the commitment. In the Monitoring Survey, the lead stakeholder is a multiple choice question which includes all the type of stakeholders forming the partnership. - There are some commitments where the lead stakeholder does not appear as involved stakeholders. In these cases, the lead stakeholder has also been considered as involved. In the baseline: Public Private health provider 1, Industry-SME 1, National Administration 4, Regional Administration 2, Research/academia 3, Other 8. In the Monitoring Survey: Hospitals 6, Primary Care Centres 3, Specialised physicians 2, GPs 4, Pharmacists 2, Nurses 5,Day care centres 6, Home care centres 7, Nursing homes 5, Informal caregivers 2,Housing organisations 4, Private companies 1, Micro-sized industry 2, Small-sized industry 3, Large-sized industry 1, International/European public authority 1, National public authority 3, Regional public authority 6, Local public authority 6, Advocacy org.-patients 2, Advocacy org.-others 3, Research centres 5, Academia 2, NGOs 2, Other 7.
20
Table 5 - Type of Stakeholder involved, evolution (after aggregation)
INVOLVED STAKEHOLDERS
Baseline (%) Monitoring Survey (%)
Delta
Health and care Providers 89.25% 80.65% -8.6%
Industry-large 55.91% 34.41% -21.5%
Industry-SME 68.82% 50.54% -18.3%
Advocacy organisation 53.76% 35.48% -18.3%
International/European public authorities 13.98% 9.68% -4.3%
National administration 29.03% 31.18% 2.2%
Regional administration 49.46% 59.14% 9.7%
Local Administration 36.56% 52.69% 16.1%
Research/academia 89.25% 76.34% -12.9%
Other 25.81% 68.82% 43.0%
21
Table 6 - Type of Stakeholder involved, evolution (after aggregation), A1 Table 7 - Type of Stakeholder involved, evolution (after aggregation), A2
Involved Stakeholders A1 (11 COMMITMENTS)
Baseline Monitoring Survey
DELTA
Health and care Providers 90.91% 72.73% -18.18%
Industry-large 45.45% 27.27% -18.18%
Industry-SME 45.45% 36.36% -9.09%
Advocacy organisation 54.55% 63.64% 9.09%
International/European public authorities
9.09% 9.09% 9.09%
National administration 27.27% 36.36% 9.09%
Regional administration 27.27% 72.73% 45.45%
Local Administration 9.09% 54.55% 45.45%
Research/academia 81.82% 90.91% 9.09%
Other 0.00% 63.64% 63.64%
Involved Stakeholders A2 (16 COMMITMENTS)
Baseline
Monitoring Survey
DELTA
Health and care Providers 100.00% 87.50% -12.50%
Industry-large 50.00% 18.75% -31.25%
Industry-SME 75.00% 50.00% -25.00%
Advocacy organisation 37.50% 31.25% -6.25%
International/European public authorities
0.00% 6.25% 6.25%
National administration 12.50% 25.00% 12.50%
Regional administration 50.00% 62.50% 12.50%
Local Administration 37.50% 50.00% 12.50%
Research/academia 87.50% 75.00% -12.50%
Other 37.50% 56.25% 18.75%
Table 8 - Type of Stakeholder involved, evolution (after aggregation), A3 Table 9 - Type of Stakeholder involved, evolution (after aggregation), B3
Involved Stakeholders A3 (16 COMMITMENTS)
Baseline Monitoring Survey
DELTA
Health and care Providers 75.00% 93.75% 31.25%
Industry-large 50.00% 37.50% 0.00%
Industry-SME 43.75% 37.50% -6.25%
Advocacy organisation 37.5% 31.25% 6.25%
International/European public authorities
12.50% 0.00% 0.00%
National administration 31.25% 18.75% -12.50%
Regional administration 25.00% 37.50% 12.50%
Local Administration 12.50% 25.00% 6.25%
Research/academia 100% 87.50% -6.25%
Other 6.25% 62.50% 56.25%
Involved Stakeholders B3 (22 COMMITMENTS)
Baseline
Monitoring Survey
DELTA
Health and care Providers 95.45% 90.91% -4.55%
Industry-large 63.64% 45.45% -13.64%
Industry-SME 86.36% 59.09% -22.73%
Advocacy organisation 63.64% 36.36% -27.27%
International/European public authorities
13.64% 9.09% 0.00%
National administration 31.82% 22.73% -9.09%
Regional administration 77.27% 72.73% -4.55%
Local Administration 40.91% 50.00% 9.09%
Research/academia 90.91% 59.09% -31.82%
Other 18.18% 68.18% 50.00%
22
Table 10 - Type of Stakeholder involved, evolution (after aggregation), C2 Table 11 - Type of Stakeholder involved, evolution (after aggregation), D4
Involved Stakeholders C2 (16 COMMITMENTS)
Baseline Monitoring Survey
DELTA
Health and care Providers 100% 62.50% -31.25%
Industry-large 81.25% 50.00% -31.25%
Industry-SME 93.75% 68.75% -25.00%
Advocacy organisation 87.50% 31.25% -56.25%
International/European public authorities
31.25% 25.00% 6.25%
National administration 37.50% 50.00% 12.50%
Regional administration 50.00% 62.50% 12.50%
Local Administration 50.00% 68.75% 18.75%
Research/academia 81.25% 75.00% -6.25%
Other 50.00% 87.50% 37.50%
Involved Stakeholders D4 (12 COMMITMENTS)
Baseline
Monitoring Survey
DELTA
Health and care Providers 66.67% 66.67% 0.00%
Industry-large 33.33% 16.67% -16.67%
Industry-SME 50.00% 41.67% -8.33%
Advocacy organisation 33.33% 25.00% -8.33%
International/European public authorities
16,67% 8,33% 16.67%
National administration 33.33% 41.67% 8.33%
Regional administration 50.00% 41.67% -8.33%
Local Administration 66.67% 75.00% 8.33%
Research/academia 91.67% 83.33% -8.33%
Other 41.67% 75.00% 33.33%
23
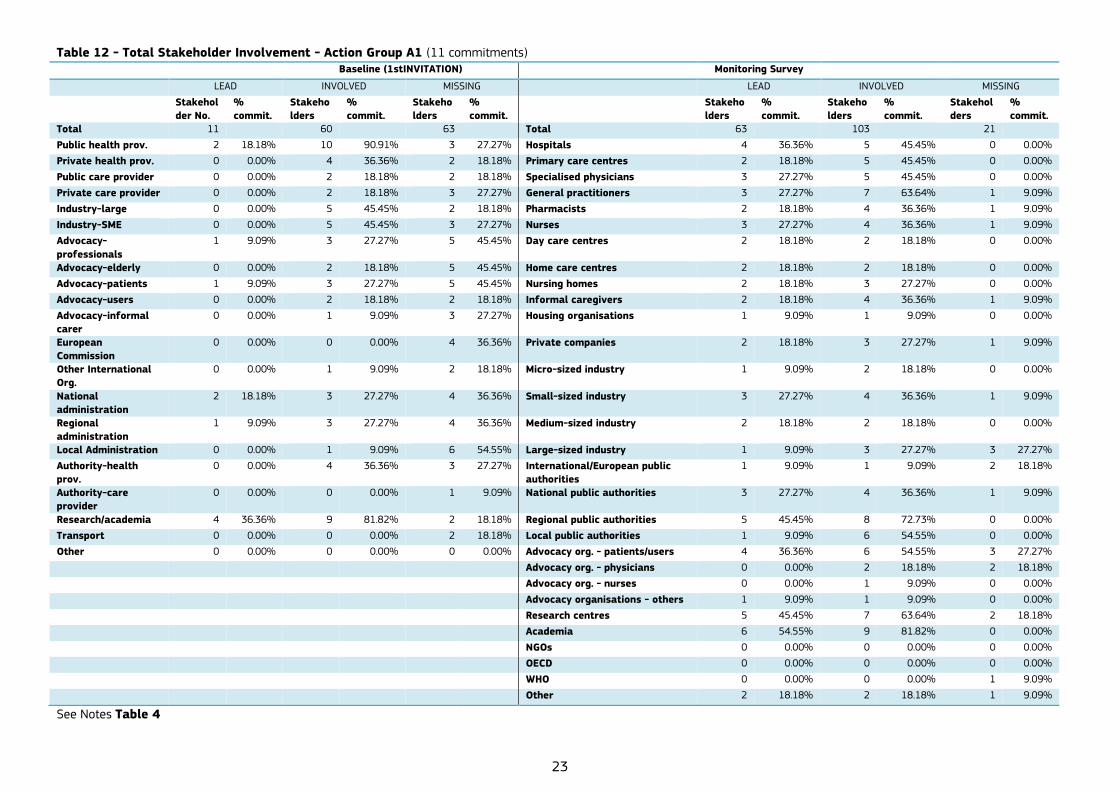
Table 12 - Total Stakeholder Involvement - Action Group A1 (11 commitments) Baseline (1stINVITATION) Monitoring Survey
LEAD INVOLVED MISSING LEAD INVOLVED MISSING
Stakehol
der No.
%
commit.
Stakeho
lders
%
commit.
Stakeho
lders
%
commit. Stakeho
lders
%
commit.
Stakeho
lders
%
commit.
Stakehol
ders
%
commit.
Total 11 60 63 Total 63 103 21
Public health prov. 2 18.18% 10 90.91% 3 27.27% Hospitals 4 36.36% 5 45.45% 0 0.00%
Private health prov. 0 0.00% 4 36.36% 2 18.18% Primary care centres 2 18.18% 5 45.45% 0 0.00%
Public care provider 0 0.00% 2 18.18% 2 18.18% Specialised physicians 3 27.27% 5 45.45% 0 0.00%
Private care provider 0 0.00% 2 18.18% 3 27.27% General practitioners 3 27.27% 7 63.64% 1 9.09%
Industry-large 0 0.00% 5 45.45% 2 18.18% Pharmacists 2 18.18% 4 36.36% 1 9.09%
Industry-SME 0 0.00% 5 45.45% 3 27.27% Nurses 3 27.27% 4 36.36% 1 9.09%
Advocacy-
professionals
1 9.09% 3 27.27% 5 45.45% Day care centres 2 18.18% 2 18.18% 0 0.00%
Advocacy-elderly 0 0.00% 2 18.18% 5 45.45% Home care centres 2 18.18% 2 18.18% 0 0.00%
Advocacy-patients 1 9.09% 3 27.27% 5 45.45% Nursing homes 2 18.18% 3 27.27% 0 0.00%
Advocacy-users 0 0.00% 2 18.18% 2 18.18% Informal caregivers 2 18.18% 4 36.36% 1 9.09%
Advocacy-informal
carer
0 0.00% 1 9.09% 3 27.27% Housing organisations 1 9.09% 1 9.09% 0 0.00%
European
Commission
0 0.00% 0 0.00% 4 36.36% Private companies 2 18.18% 3 27.27% 1 9.09%
Other International
Org.
0 0.00% 1 9.09% 2 18.18% Micro-sized industry 1 9.09% 2 18.18% 0 0.00%
National
administration
2 18.18% 3 27.27% 4 36.36% Small-sized industry 3 27.27% 4 36.36% 1 9.09%
Regional
administration
1 9.09% 3 27.27% 4 36.36% Medium-sized industry 2 18.18% 2 18.18% 0 0.00%
Local Administration 0 0.00% 1 9.09% 6 54.55% Large-sized industry 1 9.09% 3 27.27% 3 27.27%
Authority-health
prov.
0 0.00% 4 36.36% 3 27.27% International/European public
authorities
1 9.09% 1 9.09% 2 18.18%
Authority-care
provider
0 0.00% 0 0.00% 1 9.09% National public authorities 3 27.27% 4 36.36% 1 9.09%
Research/academia 4 36.36% 9 81.82% 2 18.18% Regional public authorities 5 45.45% 8 72.73% 0 0.00%
Transport 0 0.00% 0 0.00% 2 18.18% Local public authorities 1 9.09% 6 54.55% 0 0.00%
Other 0 0.00% 0 0.00% 0 0.00% Advocacy org. - patients/users 4 36.36% 6 54.55% 3 27.27%
Advocacy org. - physicians 0 0.00% 2 18.18% 2 18.18%
Advocacy org. - nurses 0 0.00% 1 9.09% 0 0.00%
Advocacy organisations - others 1 9.09% 1 9.09% 0 0.00%
Research centres 5 45.45% 7 63.64% 2 18.18%
Academia 6 54.55% 9 81.82% 0 0.00%
NGOs 0 0.00% 0 0.00% 0 0.00%
OECD 0 0.00% 0 0.00% 0 0.00%
WHO 0 0.00% 0 0.00% 1 9.09%
Other 2 18.18% 2 18.18% 1 9.09%
See Notes Table 4

24
Table 13 - Total Stakeholder Involvement - Action Group A2 (16 commitments)
Baseline (1stINVITATION) Monitoring Survey
LEAD INVOLVED MISSING LEAD INVOLVED MISSING
Stakehol
der No.
%
commit.
Stakeho
lders
% commit. Stakeho
lders
%
commit. Stakeho
lders
%
commit.
Stakehold
ers
%
commit.
Stakeho
lders
%
commit.
Total 16 122 47 Total 77 136 54
Public health prov. 2 12.50% 13 81.25% 4 25.00% Hospitals 9 56.25% 11 68.75% 1 6.25%
Private health prov. 1 6.25% 5 31.25% 2 12.50% Primary care centres 3 18.75% 5 31.25% 1 6.25%
Public care provider 0 0.00% 9 56.25% 3 18.75% Specialised physicians 5 31.25% 7 43.75% 1 6.25%
Private care provider 0 0.00% 7 43.75% 2 12.50% General practitioners 3 18.75% 6 37.50% 2 12.50%
Industry-large 0 0.00% 8 50.00% 2 12.50% Pharmacists 1 6.25% 2 12.50% 2 12.50%
Industry-SME 1 6.25% 12 75.00% 3 18.75% Nurses 3 18.75% 6 37.50% 0 0.00%
Advocacy-
professionals
0 0.00% 3 18.75% 3 18.75% Day care centres 2 12.50% 4 25.00% 2 12.50%
Advocacy-elderly 0 0.00% 5 31.25% 4 25.00% Home care centres 2 12.50% 6 37.50% 1 6.25%
Advocacy-patients 0 0.00% 4 25.00% 4 25.00% Nursing homes 2 12.50% 6 37.50% 3 18.75%
Advocacy-users 0 0.00% 3 18.75% 1 6.25% Informal caregivers 0 0.00% 3 18.75% 3 18.75%
Advocacy-informal
carer
0 0.00% 3 18.75% 2 12.50% Housing organisations 1 6.25% 2 12.50% 1 6.25%
European Commission 0 0.00% 0 0.00% 2 12.50% Private companies 4 25.00% 6 37.50% 2 12.50%
Other International
Org.
0 0.00% 0 0.00% 1 6.25% Micro-sized industry 2 12.50% 4 25.00% 1 6.25%
National
administration
1 6.25% 2 12.50% 3 18.75% Small-sized industry 4 25.00% 8 50.00% 1 6.25%
Regional
administration
3 18.75% 8 50.00% 1 6.25% Medium-sized industry 1 6.25% 3 18.75% 2 12.50%
Local Administration 0 0.00% 6 37.50% 1 6.25% Large-sized industry 1 6.25% 3 18.75% 4 25.00%
Authority-health prov. 0 0.00% 7 43.75% 2 12.50% International/European public
authorities
0 0.00% 1 6.25% 1 6.25%
Authority-care
provider
0 0.00% 6 37.50% 0 0.00% National public authorities 2 12.50% 4 25.00% 3 18.75%
Research/academia 8 50.00% 14 87.50% 2 12.50% Regional public authorities 7 43.75% 10 62.50% 1 6.25%
Transport 0 0.00% 3 18.75% 3 18.75% Local public authorities 4 25.00% 8 50.00% 1 6.25%
Other 0 0.00% 4 25.00% 2 12.50% Advocacy org. - patients/users 2 12.50% 5 31.25% 5 31.25%
Advocacy org. - physicians 0 0.00% 1 6.25% 2 12.50%
Advocacy org. - nurses 0 0.00% 0 0.00% 1 6.25%
Advocacy organisations - others 1 6.25% 2 12.50% 0 0.00%
Research centres 8 50.00% 9 56.25% 3 18.75%
Academia 6 37.50% 9 56.25% 2 12.50%
NGOs 0 0.00% 1 6.25% 0 0.00%
OECD 0 0.00% 0 0.00% 1 6.25%
WHO 0 0.00% 0 0.00% 3 18.75%
Other 4 25.00% 4 25.00% 4 25.00%
See Notes Table 4
25
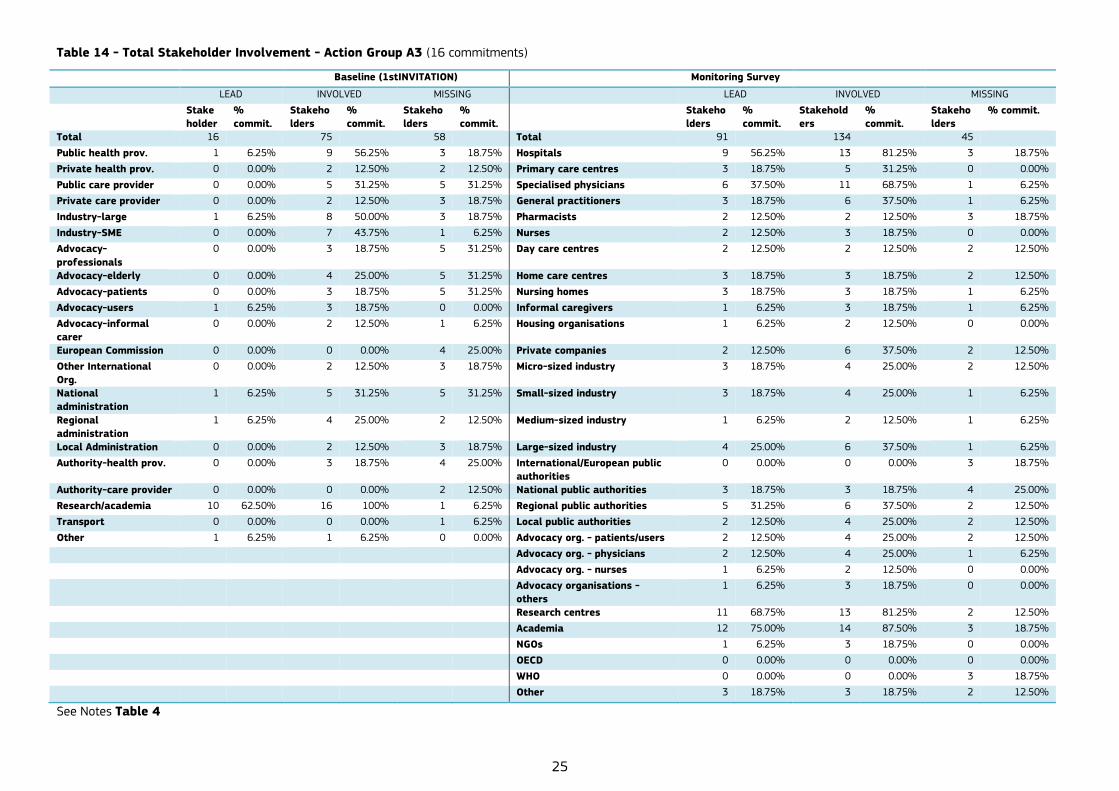
Table 14 - Total Stakeholder Involvement - Action Group A3 (16 commitments)
Baseline (1stINVITATION) Monitoring Survey
LEAD INVOLVED MISSING LEAD INVOLVED MISSING
Stake
holder
%
commit.
Stakeho
lders
%
commit.
Stakeho
lders
%
commit. Stakeho
lders
%
commit.
Stakehold
ers
%
commit.
Stakeho
lders
% commit.
Total 16 75 58 Total 91 134 45
Public health prov. 1 6.25% 9 56.25% 3 18.75% Hospitals 9 56.25% 13 81.25% 3 18.75%
Private health prov. 0 0.00% 2 12.50% 2 12.50% Primary care centres 3 18.75% 5 31.25% 0 0.00%
Public care provider 0 0.00% 5 31.25% 5 31.25% Specialised physicians 6 37.50% 11 68.75% 1 6.25%
Private care provider 0 0.00% 2 12.50% 3 18.75% General practitioners 3 18.75% 6 37.50% 1 6.25%
Industry-large 1 6.25% 8 50.00% 3 18.75% Pharmacists 2 12.50% 2 12.50% 3 18.75%
Industry-SME 0 0.00% 7 43.75% 1 6.25% Nurses 2 12.50% 3 18.75% 0 0.00%
Advocacy-
professionals
0 0.00% 3 18.75% 5 31.25% Day care centres 2 12.50% 2 12.50% 2 12.50%
Advocacy-elderly 0 0.00% 4 25.00% 5 31.25% Home care centres 3 18.75% 3 18.75% 2 12.50%
Advocacy-patients 0 0.00% 3 18.75% 5 31.25% Nursing homes 3 18.75% 3 18.75% 1 6.25%
Advocacy-users 1 6.25% 3 18.75% 0 0.00% Informal caregivers 1 6.25% 3 18.75% 1 6.25%
Advocacy-informal
carer
0 0.00% 2 12.50% 1 6.25% Housing organisations 1 6.25% 2 12.50% 0 0.00%
European Commission 0 0.00% 0 0.00% 4 25.00% Private companies 2 12.50% 6 37.50% 2 12.50%
Other International
Org.
0 0.00% 2 12.50% 3 18.75% Micro-sized industry 3 18.75% 4 25.00% 2 12.50%
National
administration
1 6.25% 5 31.25% 5 31.25% Small-sized industry 3 18.75% 4 25.00% 1 6.25%
Regional
administration
1 6.25% 4 25.00% 2 12.50% Medium-sized industry 1 6.25% 2 12.50% 1 6.25%
Local Administration 0 0.00% 2 12.50% 3 18.75% Large-sized industry 4 25.00% 6 37.50% 1 6.25%
Authority-health prov. 0 0.00% 3 18.75% 4 25.00% International/European public
authorities
0 0.00% 0 0.00% 3 18.75%
Authority-care provider 0 0.00% 0 0.00% 2 12.50% National public authorities 3 18.75% 3 18.75% 4 25.00%
Research/academia 10 62.50% 16 100% 1 6.25% Regional public authorities 5 31.25% 6 37.50% 2 12.50%
Transport 0 0.00% 0 0.00% 1 6.25% Local public authorities 2 12.50% 4 25.00% 2 12.50%
Other 1 6.25% 1 6.25% 0 0.00% Advocacy org. - patients/users 2 12.50% 4 25.00% 2 12.50%
Advocacy org. - physicians 2 12.50% 4 25.00% 1 6.25%
Advocacy org. - nurses 1 6.25% 2 12.50% 0 0.00%
Advocacy organisations -
others
1 6.25% 3 18.75% 0 0.00%
Research centres 11 68.75% 13 81.25% 2 12.50%
Academia 12 75.00% 14 87.50% 3 18.75%
NGOs 1 6.25% 3 18.75% 0 0.00%
OECD 0 0.00% 0 0.00% 0 0.00%
WHO 0 0.00% 0 0.00% 3 18.75%
Other 3 18.75% 3 18.75% 2 12.50%
See Notes Table 4
26
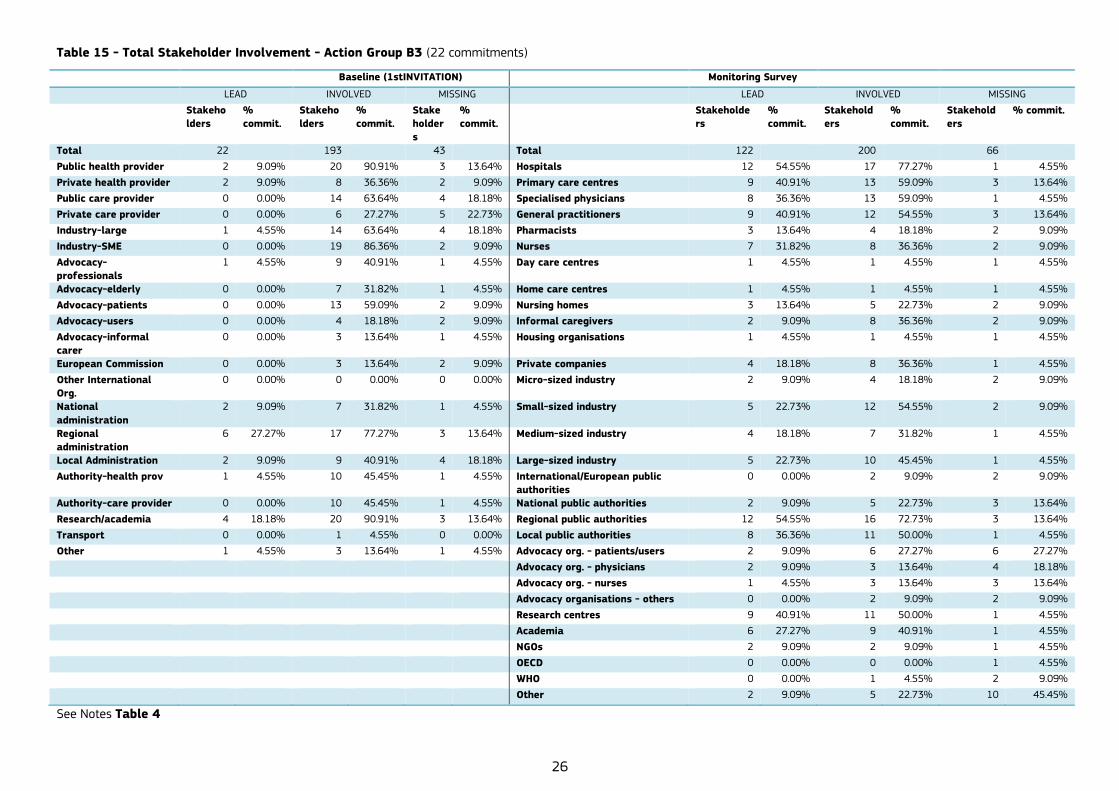
Table 15 - Total Stakeholder Involvement - Action Group B3 (22 commitments)
Baseline (1stINVITATION) Monitoring Survey
LEAD INVOLVED MISSING LEAD INVOLVED MISSING
Stakeho
lders
%
commit.
Stakeho
lders
%
commit.
Stake
holder
s
%
commit. Stakeholde
rs
%
commit.
Stakehold
ers
%
commit.
Stakehold
ers
% commit.
Total 22 193 43 Total 122 200 66
Public health provider 2 9.09% 20 90.91% 3 13.64% Hospitals 12 54.55% 17 77.27% 1 4.55%
Private health provider 2 9.09% 8 36.36% 2 9.09% Primary care centres 9 40.91% 13 59.09% 3 13.64%
Public care provider 0 0.00% 14 63.64% 4 18.18% Specialised physicians 8 36.36% 13 59.09% 1 4.55%
Private care provider 0 0.00% 6 27.27% 5 22.73% General practitioners 9 40.91% 12 54.55% 3 13.64%
Industry-large 1 4.55% 14 63.64% 4 18.18% Pharmacists 3 13.64% 4 18.18% 2 9.09%
Industry-SME 0 0.00% 19 86.36% 2 9.09% Nurses 7 31.82% 8 36.36% 2 9.09%
Advocacy-
professionals
1 4.55% 9 40.91% 1 4.55% Day care centres 1 4.55% 1 4.55% 1 4.55%
Advocacy-elderly 0 0.00% 7 31.82% 1 4.55% Home care centres 1 4.55% 1 4.55% 1 4.55%
Advocacy-patients 0 0.00% 13 59.09% 2 9.09% Nursing homes 3 13.64% 5 22.73% 2 9.09%
Advocacy-users 0 0.00% 4 18.18% 2 9.09% Informal caregivers 2 9.09% 8 36.36% 2 9.09%
Advocacy-informal
carer
0 0.00% 3 13.64% 1 4.55% Housing organisations 1 4.55% 1 4.55% 1 4.55%
European Commission 0 0.00% 3 13.64% 2 9.09% Private companies 4 18.18% 8 36.36% 1 4.55%
Other International
Org.
0 0.00% 0 0.00% 0 0.00% Micro-sized industry 2 9.09% 4 18.18% 2 9.09%
National
administration
2 9.09% 7 31.82% 1 4.55% Small-sized industry 5 22.73% 12 54.55% 2 9.09%
Regional
administration
6 27.27% 17 77.27% 3 13.64% Medium-sized industry 4 18.18% 7 31.82% 1 4.55%
Local Administration 2 9.09% 9 40.91% 4 18.18% Large-sized industry 5 22.73% 10 45.45% 1 4.55%
Authority-health prov 1 4.55% 10 45.45% 1 4.55% International/European public
authorities
0 0.00% 2 9.09% 2 9.09%
Authority-care provider 0 0.00% 10 45.45% 1 4.55% National public authorities 2 9.09% 5 22.73% 3 13.64%
Research/academia 4 18.18% 20 90.91% 3 13.64% Regional public authorities 12 54.55% 16 72.73% 3 13.64%
Transport 0 0.00% 1 4.55% 0 0.00% Local public authorities 8 36.36% 11 50.00% 1 4.55%
Other 1 4.55% 3 13.64% 1 4.55% Advocacy org. - patients/users 2 9.09% 6 27.27% 6 27.27%
Advocacy org. - physicians 2 9.09% 3 13.64% 4 18.18%
Advocacy org. - nurses 1 4.55% 3 13.64% 3 13.64%
Advocacy organisations - others 0 0.00% 2 9.09% 2 9.09%
Research centres 9 40.91% 11 50.00% 1 4.55%
Academia 6 27.27% 9 40.91% 1 4.55%
NGOs 2 9.09% 2 9.09% 1 4.55%
OECD 0 0.00% 0 0.00% 1 4.55%
WHO 0 0.00% 1 4.55% 2 9.09%
Other 2 9.09% 5 22.73% 10 45.45%
See Notes Table 4
27
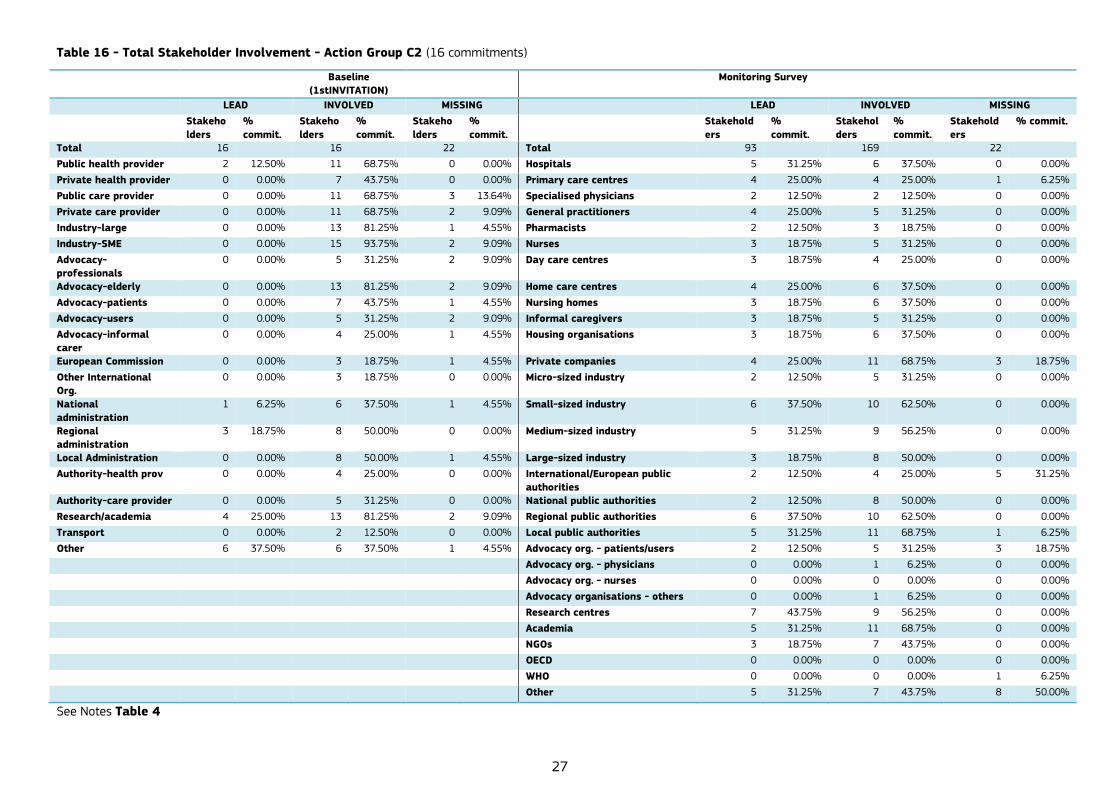
Table 16 - Total Stakeholder Involvement - Action Group C2 (16 commitments)
Baseline
(1stINVITATION)
Monitoring Survey
LEAD INVOLVED MISSING LEAD INVOLVED MISSING
Stakeho
lders
%
commit.
Stakeho
lders
%
commit.
Stakeho
lders
%
commit. Stakehold
ers
%
commit.
Stakehol
ders
%
commit.
Stakehold
ers
% commit.
Total 16 16 22 Total 93 169 22
Public health provider 2 12.50% 11 68.75% 0 0.00% Hospitals 5 31.25% 6 37.50% 0 0.00%
Private health provider 0 0.00% 7 43.75% 0 0.00% Primary care centres 4 25.00% 4 25.00% 1 6.25%
Public care provider 0 0.00% 11 68.75% 3 13.64% Specialised physicians 2 12.50% 2 12.50% 0 0.00%
Private care provider 0 0.00% 11 68.75% 2 9.09% General practitioners 4 25.00% 5 31.25% 0 0.00%
Industry-large 0 0.00% 13 81.25% 1 4.55% Pharmacists 2 12.50% 3 18.75% 0 0.00%
Industry-SME 0 0.00% 15 93.75% 2 9.09% Nurses 3 18.75% 5 31.25% 0 0.00%
Advocacy-
professionals
0 0.00% 5 31.25% 2 9.09% Day care centres 3 18.75% 4 25.00% 0 0.00%
Advocacy-elderly 0 0.00% 13 81.25% 2 9.09% Home care centres 4 25.00% 6 37.50% 0 0.00%
Advocacy-patients 0 0.00% 7 43.75% 1 4.55% Nursing homes 3 18.75% 6 37.50% 0 0.00%
Advocacy-users 0 0.00% 5 31.25% 2 9.09% Informal caregivers 3 18.75% 5 31.25% 0 0.00%
Advocacy-informal
carer
0 0.00% 4 25.00% 1 4.55% Housing organisations 3 18.75% 6 37.50% 0 0.00%
European Commission 0 0.00% 3 18.75% 1 4.55% Private companies 4 25.00% 11 68.75% 3 18.75%
Other International
Org.
0 0.00% 3 18.75% 0 0.00% Micro-sized industry 2 12.50% 5 31.25% 0 0.00%
National
administration
1 6.25% 6 37.50% 1 4.55% Small-sized industry 6 37.50% 10 62.50% 0 0.00%
Regional
administration
3 18.75% 8 50.00% 0 0.00% Medium-sized industry 5 31.25% 9 56.25% 0 0.00%
Local Administration 0 0.00% 8 50.00% 1 4.55% Large-sized industry 3 18.75% 8 50.00% 0 0.00%
Authority-health prov 0 0.00% 4 25.00% 0 0.00% International/European public
authorities
2 12.50% 4 25.00% 5 31.25%
Authority-care provider 0 0.00% 5 31.25% 0 0.00% National public authorities 2 12.50% 8 50.00% 0 0.00%
Research/academia 4 25.00% 13 81.25% 2 9.09% Regional public authorities 6 37.50% 10 62.50% 0 0.00%
Transport 0 0.00% 2 12.50% 0 0.00% Local public authorities 5 31.25% 11 68.75% 1 6.25%
Other 6 37.50% 6 37.50% 1 4.55% Advocacy org. - patients/users 2 12.50% 5 31.25% 3 18.75%
Advocacy org. - physicians 0 0.00% 1 6.25% 0 0.00%
Advocacy org. - nurses 0 0.00% 0 0.00% 0 0.00%
Advocacy organisations - others 0 0.00% 1 6.25% 0 0.00%
Research centres 7 43.75% 9 56.25% 0 0.00%
Academia 5 31.25% 11 68.75% 0 0.00%
NGOs 3 18.75% 7 43.75% 0 0.00%
OECD 0 0.00% 0 0.00% 0 0.00%
WHO 0 0.00% 0 0.00% 1 6.25%
Other 5 31.25% 7 43.75% 8 50.00%
See Notes Table 4

28
Table 17 - Total Stakeholder Involvement - Action Group D4 (12 commitments)
Baseline
(1stINVITATION)
Monitoring Survey
LEAD INVOLVED MISSING LEAD INVOLVED MISSING
Stakeho
lders
%
commit.
Stakeho
lders
%
commit.
Stakeho
lders
%
commit. Stakeho
lders
%
commit.
Stakeho
lders
%
commit.
Stakeho
lders
%
commit.
Total 12 81 39 Total 55 100 21
Public health provider 0 0.00% 6 50.00% 2 16.67% Hospitals 1 8.33% 4 33.33% 0 0.00%
Private health provider 0 0.00% 4 33.33% 2 16.67% Primary care centres 2 16.67% 3 25.00% 0 0.00%
Public care provider 0 0.00% 5 41.67% 3 25.00% Specialised physicians 1 8.33% 1 8.33% 1 8.33%
Private care provider 0 0.00% 2 16.67% 3 25.00% General practitioners 2 16.67% 2 16.67% 1 8.33%
Industry-large 0 0.00% 4 33.33% 2 16.67% Pharmacists 0 0.00% 2 16.67% 0 0.00%
Industry-SME 1 8.33% 6 50.00% 3 25.00% Nurses 1 8.33% 2 16.67% 0 0.00%
Advocacy-professionals 0 0.00% 1 8.33% 1 8.33% Day care centres 2 16.67% 3 25.00% 1 8.33%
Advocacy-elderly 1 8.33% 4 33.33% 1 8.33% Home care centres 1 8.33% 3 25.00% 1 8.33%
Advocacy-patients 0 0.00% 0 0.00% 1 8.33% Nursing homes 2 16.67% 4 33.33% 0 0.00%
Advocacy-users 0 0.00% 3 25.00% 1 8.33% Informal caregivers 1 8.33% 4 33.33% 0 0.00%
Advocacy-informal carer 0 0.00% 3 25.00% 1 8.33% Housing organisations 2 16.67% 5 41.67% 1 8.33%
European Commission 0 0.00% 0 0.00% 2 16.67% Private companies 2 16.67% 4 33.33% 1 8.33%
Other International Org. 0 0.00% 2 16.67% 1 8.33% Micro-sized industry 2 16.67% 3 25.00% 1 8.33%
National administration 0 0.00% 4 33.33% 2 16.67% Small-sized industry 3 25.00% 4 33.33% 1 8.33%
Regional administration 2 16.67% 6 50.00% 3 25.00% Medium-sized industry 2 16.67% 4 33.33% 1 8.33%
Local Administration 0 0.00% 8 66.67% 3 25.00% Large-sized industry 1 8.33% 2 16.67% 1 8.33%
Authority-health prov 0 0.00% 3 25.00% 1 8.33% International/European public
authorities
0 0.00% 1 8.33% 0 0.00%
Authority-care provider 0 0.00% 3 25.00% 2 16.67% National public authorities 2 16.67% 5 41.67% 1 8.33%
Research/academia 6 50.00% 11 91.67% 2 16.67% Regional public authorities 2 16.67% 5 41.67% 1 8.33%
Transport 0 0.00% 1 8.33% 2 16.67% Local public authorities 3 25.00% 9 75.00% 0 0.00%
Other 2 16.67% 5 41.67% 1 8.33% Advocacy org. - patients/users 3 25.00% 3 25.00% 0 0.00%
Advocacy org. - physicians 0 0.00% 0 0.00% 1 8.33%
Advocacy org. - nurses 0 0.00% 0 0.00% 1 8.33%
Advocacy organisations - others 0 0.00% 0 0.00% 0 0.00%
Research centres 5 41.67% 6 50.00% 1 8.33%
Academia 9 75.00% 10 83.33% 0 0.00%
NGOs 4 33.33% 6 50.00% 1 8.33%
OECD 0 0.00% 0 0.00% 0 0.00%
WHO 0 0.00% 2 16.67% 0 0.00%
Other 2 16.67% 3 25.00% 5 41.67%
See Notes Table 4
29
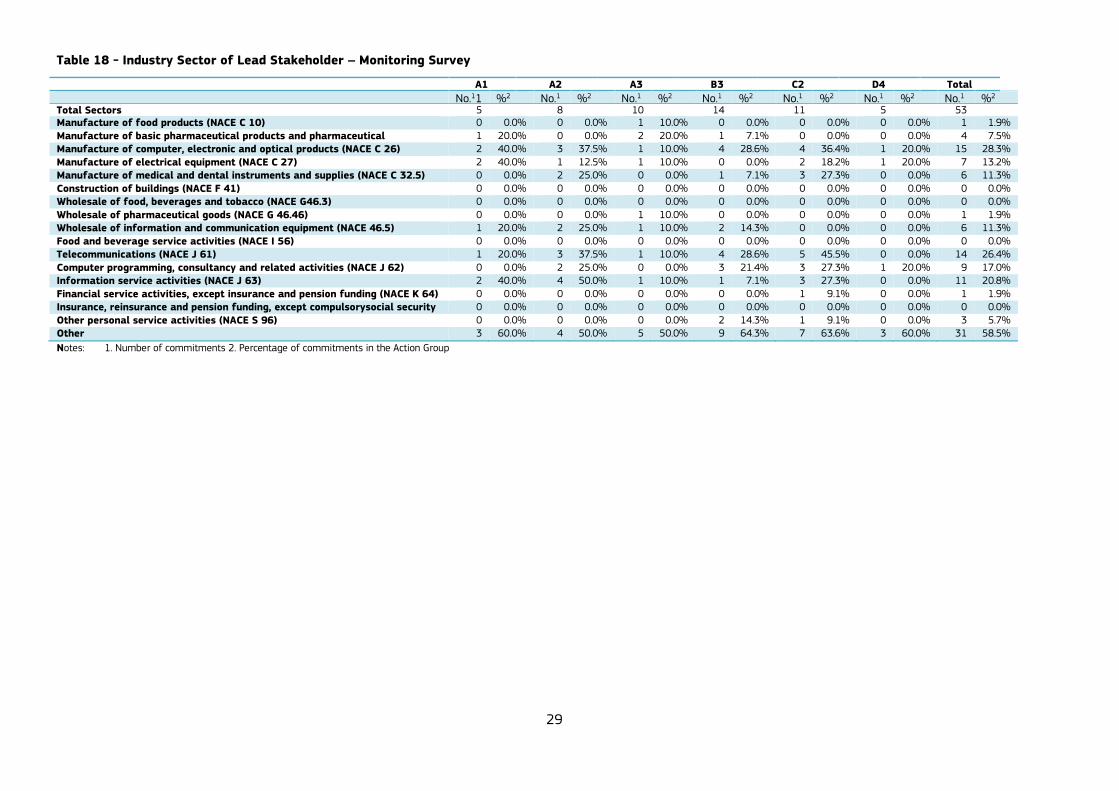
Table 18 - Industry Sector of Lead Stakeholder – Monitoring Survey
A1 A2 A3 B3 C2 D4 Total
No.11 %2 No.1 %2 No.1 %2 No.1 %2 No.1 %2 No.1 %2 No.1 %2 Total Sectors 5 8 10 14 11 5 53 Manufacture of food products (NACE C 10) 0 0.0% 0 0.0% 1 10.0% 0 0.0% 0 0.0% 0 0.0% 1 1.9%
Manufacture of basic pharmaceutical products and pharmaceutical
preparations (NACE C 21)
1 20.0% 0 0.0% 2 20.0% 1 7.1% 0 0.0% 0 0.0% 4 7.5% Manufacture of computer, electronic and optical products (NACE C 26) 2 40.0% 3 37.5% 1 10.0% 4 28.6% 4 36.4% 1 20.0% 15 28.3%
Manufacture of electrical equipment (NACE C 27) 2 40.0% 1 12.5% 1 10.0% 0 0.0% 2 18.2% 1 20.0% 7 13.2% Manufacture of medical and dental instruments and supplies (NACE C 32.5) 0 0.0% 2 25.0% 0 0.0% 1 7.1% 3 27.3% 0 0.0% 6 11.3%
Construction of buildings (NACE F 41) 0 0.0% 0 0.0% 0 0.0% 0 0.0% 0 0.0% 0 0.0% 0 0.0% Wholesale of food, beverages and tobacco (NACE G46.3) 0 0.0% 0 0.0% 0 0.0% 0 0.0% 0 0.0% 0 0.0% 0 0.0%
Wholesale of pharmaceutical goods (NACE G 46.46) 0 0.0% 0 0.0% 1 10.0% 0 0.0% 0 0.0% 0 0.0% 1 1.9% Wholesale of information and communication equipment (NACE 46.5) 1 20.0% 2 25.0% 1 10.0% 2 14.3% 0 0.0% 0 0.0% 6 11.3%
Food and beverage service activities (NACE I 56) 0 0.0% 0 0.0% 0 0.0% 0 0.0% 0 0.0% 0 0.0% 0 0.0% Telecommunications (NACE J 61) 1 20.0% 3 37.5% 1 10.0% 4 28.6% 5 45.5% 0 0.0% 14 26.4%
Computer programming, consultancy and related activities (NACE J 62) 0 0.0% 2 25.0% 0 0.0% 3 21.4% 3 27.3% 1 20.0% 9 17.0% Information service activities (NACE J 63) 2 40.0% 4 50.0% 1 10.0% 1 7.1% 3 27.3% 0 0.0% 11 20.8%
Financial service activities, except insurance and pension funding (NACE K 64) 0 0.0% 0 0.0% 0 0.0% 0 0.0% 1 9.1% 0 0.0% 1 1.9% Insurance, reinsurance and pension funding, except compulsorysocial security
(NACE K 65)
0 0.0% 0 0.0% 0 0.0% 0 0.0% 0 0.0% 0 0.0% 0 0.0%
Other personal service activities (NACE S 96) 0 0.0% 0 0.0% 0 0.0% 2 14.3% 1 9.1% 0 0.0% 3 5.7% Other 3 60.0% 4 50.0% 5 50.0% 9 64.3% 7 63.6% 3 60.0% 31 58.5%
Notes: 1. Number of commitments 2. Percentage of commitments in the Action Group

30
Table 19 - Target group – Baseline (1st INVITATION) (22 commitments with available information)
Action Country Size
target
older
Size
target
patients
Size target
professional
Size
target
carers
Disease
A1 Italy .. 300 .. .. ..
A1 Portugal .. 4000 .. .. ..
A1 Spain .. 186200 5000 .. Multiple
A2 Ireland .. 5665 .. .. Falls
A2 Italy .. 1614 .. .. Rehab
A2 Italy .. 30000 3134 .. Falls
A2 Portugal .. 4000 .. .. ..
A2 Spain .. 34000 .. .. Falls
A3 Italy .. 500000 310 .. ..
B3 France .. 150000 .. .. ..
B3 Germany .. 3000 .. .. ..
B3 Greece .. 800 1100 .. Diabetes
B3 Italy .. 260 .. .. Diabetes
B3 Italy .. 28255 .. .. CHD
B3 Spain .. 215000 .. .. Multiple
B3 Spain .. 12000 .. .. Multiple
B3 Spain .. 12000 .. .. ..
B3 UK .. 55000 .. .. ..
C2 Spain .. 1750 .. .. Multiple
C2 UK .. 50000 .. .. ..
C2 UK .. 50000 .. .. ..
D4 Ireland 77047 .. .. .. ..

31
Table 20 - Target group – Monitoring Survey (47 commitments with available information)
Action Country Size
target
older
Size
target
patients
Size target
professional
Size
target
carers
Disease
A1 Italy .. 21500 .. .. ..
A1 Italy 9000 .. .. .. ..
A1 Spain .. 180 30 .. Multiple
A1 Spain .. 52500 .. .. Diabetes
A1 UK 500 .. .. .. ..
A2 Ireland 491168 .. .. .. ..
A2 Italy .. 40000 .. .. Rehab
A2 Italy .. 30000 3134 .. Rehab
A2 Spain .. 700 .. .. Falls
A2 Spain 2000 .. .. .. ..
A2 UK 5000 .. .. .. ..
A3 Italy 100000 .. 310 .. ..
A3 Italy .. .. 6980 .. ..
A3 Portugal 1500 .. .. .. ..
A3 Spain 70000 .. .. .. ..
A3 Spain .. 2000 .. .. Frailty
A3 Spain 100 .. .. .. ..
A3 Switzerland .. .. 2000 .. ..
B3 Denmark .. 158500 .. .. Multiple
B3 Denmark .. .. 24000 .. Wounds
B3 Greece .. 500 .. 500 Diabetes
B3 Italy .. 2500 .. .. ..
B3 Italy .. 18600 .. .. Rehab
B3 Italy .. 260 .. .. Diabetes
B3 Italy 100000 .. .. .. ..
B3 Spain .. 12000 .. .. Multiple
B3 Spain .. 36500 .. .. ..
B3 Spain .. 50000 .. .. Multiple
B3 Spain .. 6080000 .. .. Multiple
B3 Spain .. 2000 .. .. Diabetes
B3 Spain .. 12000 .. .. Multiple
B3 UK 55000 .. .. .. ..
C2 Belgium 5000 .. .. .. ..
C2 Finland 3000 .. .. .. ..
C2 Germany 1800 .. .. .. ..
C2 Italy 150 .. .. .. ..
C2 Italy 47500 .. .. .. ..
C2 Portugal 1100 .. .. 760 ..
C2 Spain 24754 1750 .. .. Multiple
C2 Spain 1400 .. 300 .. ..
C2 Sweden 200000 .. .. .. ..
D4 Finland 200 .. .. .. ..
D4 Ireland 70000 .. .. .. ..
D4 Ireland .. 250 30 225 Dementia
D4 Portugal 5000 .. .. .. ..
D4 Spain 20000 .. .. .. ..
D4 Spain 1000 .. .. .. ..
32
Table 21– Target Group types – Monitoring Survey (93 commitments)
A1 A2 A3 B3 C2 D4 Total
No.1 %2 No.1 %2 No.1 %2 No.1 %2 No.1 %2 No.1 %2 No.1 %2
Total 72 113 111 150 115 63 624
Older people in general pop 7 63.6% 15 93.8% 14 87.5% 11 50.0% 13 81.3% 10 83.3% 70 75.3%
Older people using infrastr. 0 0.0% 3 18.8% 4 25.0% 3 13.6% 6 37.5% 10 83.3% 26 28.0%
Older people receiving care/home 5 45.5% 12 75.0% 7 43.8% 13 59.1% 16 100% 7 58.3% 60 64.5%
Patients with specific disease 7 63.6% 4 25.0% 7 43.8% 17 77.3% 5 31.3% 2 16.7% 42 45.2%
Patients in hospitals 4 36.4% 8 50.0% 8 50.0% 9 40.9% 5 31.3% 2 16.7% 36 38.7%
People in day care centres 2 18.2% 6 37.5% 5 31.3% 3 13.6% 6 37.5% 2 16.7% 24 25.8%
People in care homes 5 45.5% 8 50.0% 5 31.3% 6 27.3% 7 43.8% 6 50.0% 37 39.8%
People in nursing homes 4 36.4% 8 50.0% 4 25.0% 6 27.3% 6 37.5% 4 33.3% 32 34.4%
People visiting GPs 6 54.5% 6 37.5% 8 50.0% 10 45.5% 4 25.0% 2 16.7% 36 38.7%
Patients visiting spec. Physicians 4 36.4% 7 43.8% 8 50.0% 9 40.9% 3 18.8% 0 0.0% 31 33.3%
People collecting prescriptions from
pharma
4 36.4% 0 0.0% 2 12.5% 2 9.1% 2 12.5% 0 0.0% 10 10.8%
Patients' groups 8 72.7% 3 18.8% 7 43.8% 7 31.8% 2 12.5% 2 16.7% 29 31.2%
General practitioners 4 36.4% 5 31.3% 9 56.3% 12 54.5% 4 25.0% 2 16.7% 36 38.7%
Specialised physicians 2 18.2% 6 37.5% 6 37.5% 10 45.5% 2 12.5% 1 8.3% 27 29.0%
Pharmacists 3 27.3% 2 12.5% 2 12.5% 4 18.2% 2 12.5% 0 0.0% 13 14.0%
Nurses 0 0.0% 4 25.0% 2 12.5% 9 40.9% 4 25.0% 2 16.7% 21 22.6%
Formal caregivers 2 18.2% 7 43.8% 4 25.0% 9 40.9% 13 81.3% 3 25.0% 38 40.9%
Informal caregivers 4 36.4% 6 37.5% 5 31.3% 8 36.4% 11 68.8% 4 33.3% 38 40.9%
Other 1 9.1% 3 18.8% 4 25.0% 2 9.1% 4 25.0% 4 33.3% 18 19.4% Notes: 1. Number of commitments 2. Percentage of commitments in the Action Group

33
Table 22 - End-user group - Baseline (1stINVITATION)
Action Group A1 (# 11 commit.)
A2 (#16 commit.) A3 (#16 commit.)
B3 (#22 commit.) C2 (#16 commit.) D4 (#12 commit.) Total (#93 commit.)
No1 %2 No1 %2 No1 %2 No1 %2 No1 %2 No1 %2 No1 %2
Total 49 52 51 88 81 31 352
Hospitals 3 27.27% 5 31.25% 8 50.00% 14 63.64% 7 43.75% 2 16.67% 39 41.94%
Primary Care Centers 4 36.36% 0 0.00% 2 12.50% 9 40.91% 4 25.00% 0 0.00% 19 20.43%
General Practitioners 6 54.55% 2 12.50% 3 18.75% 6 27.27% 5 31.25% 1 8.33% 23 24.73%
Specialised Physicians 6 54.55% 4 25.00% 7 43.75% 5 22.73% 2 12.50% 0 0.00% 24 25.81%
Pharmacists 4 36.36% 0 0.00% 0 0.00% 1 4.55% 0 0.00% 0 0.00% 5 5.38%
Nurses 2 18.18% 5 31.25% 3 18.75% 7 31.82% 8 50.00% 2 16.67% 27 29.03%
Day care centres 0 0.00% 2 12.50% 0 0.00% 0 0.00% 1 6.25% 0 0.00% 3 3.23%
Home care centres 0 0.00% 6 37.50% 0 0.00% 1 4.55% 9 56.25% 1 8.33% 17 18.28%
Nursing homes 0 0.00% 3 18.75% 0 0.00% 1 4.55% 2 12.50% 1 8.33% 7 7.53%
Formal carers 5 45.45% 1 6.25% 0 0.00% 3 13.64% 6 37.50% 3 25.00% 18 19.35%
Informal caregivers 4 36.36% 1 6.25% 0 0.00% 3 13.64% 6 37.50% 1 8.33% 15 16.13%
Patients 5 45.45% 7 43.75% 15 93.75% 16 72.73% 15 93.75% 8 66.67% 66 70.97%
Other 10 90.91% 16 100.00% 13 81.25% 22 100.00% 16 100.00% 12 100.00% 89 95.70%
Notes: 1. Number of commitments; 2. Percentage of commitments in the Action Group
Table 23 - End-user group – Monitoring Survey
Action Group A1 (#10 commt.) A2 (# 14 commit.)
A3 (# 11 commit.)
B3 (# 21 commit.)
C2 (#14 commit.)
D4 (# 12 commit.)
Total (# 82 comm.)
No1 %2 No1 %2 No1 %2 No1 %2 No1 %2 No1 %2 No1 %2
Total 43 74 56 115 66 38 392
Hospitals 4 40.00% 10 71.43% 8 72.73% 17 80.95% 4 28.57% 2 16.67% 45 54.88%
Primary Care Centers 5 50.00% 5 35.71% 3 27.27% 16 76.19% 1 7.14% 1 8.33% 31 37.80%
General Practitioners 6 60.00% 4 28.57% 6 54.55% 14 66.67% 2 14.29% 1 8.33% 33 40.24%
Specialised Physicians 3 30.00% 10 71.43% 10 90.91% 13 61.90% 3 21.43% 2 16.67% 41 50.00%
Pharmacists 3 30.00% 2 14.29% 1 9.09% 5 23.81% 0 0.00% 1 8.33% 12 14.63%
Nurses 2 20.00% 5 35.71% 2 18.18% 9 42.86% 3 21.43% 3 25.00% 24 29.27%
Day care centres 0 0.00% 4 28.57% 2 18.18% 2 9.52% 4 28.57% 3 25.00% 15 18.29%
Home care centres 1 10.00% 4 28.57% 2 18.18% 3 14.29% 4 28.57% 3 25.00% 17 20.73%
Nursing homes 2 20.00% 6 42.86% 5 45.45% 3 14.29% 5 35.71% 4 33.33% 25 30.49%
Formal carers 3 30.00% 6 42.86% 4 36.36% 8 38.10% 11 78.57% 2 16.67% 34 41.46%
Informal caregivers 5 50.00% 4 28.57% 4 36.36% 7 33.33% 10 71.43% 3 25.00% 33 40.24%
Patients 9 90.00% 11 78.57% 9 81.82% 16 76.19% 10 71.43% 4 33.33% 59 71.95%
Other 0 0.00% 3 21.43% 0 0.00% 2 9.52% 9 64.29% 9 75.00% 23 28.05%
Notes: 1. Number of commitments ; 2. Percentage of commitments in the Action Group

34
Table 24 - End-user involvement: Stage of process - Baseline (1stINVITATION)
Action Group A1 (# 11
commit.)
A2 (#16
commit.)
A3 (#16
commit.)
B3 (#22
commit.)
C2 (#16
commit.)
D4 (#12
commit.)
Total (#93
commit.)
No1 %2 No1 %2 No1 %2 No1 %2 No1 %2 No1 %2 No1 %2
Total 19 21 23 47 29 27 166
Idea 1 9.09% 0 0.00% 8 50.00% 0 0.00% 0 0.00% 1 8.33% 10 10.75%
Development 3 27.27% 7 43.75% 2 12.50% 6 27.27% 2 12.50% 9 75.00% 29 31.18%
Design 3 27.27% 4 25.00% 3 18.75% 1 4.55% 0 0.00% 4 33.33% 15 16.13%
Testing 4 36.36% 2 12.50% 7 43.75% 10 45.45% 13 81.25% 5 41.67% 41 44.09%
Implementation 8 72.73% 8 50.00% 0 0.00% 20 90.91% 9 56.25% 2 16.67% 47 50.54%
Other 0 0.00% 0 0.00% 3 18.75% 10 45.45% 5 31.25% 6 50.00% 24 25.81% Notes: 1. Number of commitments ; 2. Percentage of commitments in the Action Group
Table 25 - End-user involvement: Stage of process – Monitoring Survey
Action Group A1 (# 10
commit.)
A2 (#14
commit.)
A3 (#11
commit.)
B3 (#21
commit.)
C2 (#14
commit.)
D4 (#12
commit.)
Total (#82
commit.)
No1 %2 No1 %2 No1 %2 No1 %2 No1 %2 No1 %2 No1 %2
Total 32 47 33 72 47 42 273
Idea 4 40.00% 8 57.14% 3 27.27% 8 38.10% 4 28.57% 7 58.33% 34 41.46%
Development 6 60.00% 8 57.14% 6 54.55% 14 66.67% 9 64.29% 10 83.33% 53 64.63%
Design 5 50.00% 10 71.43% 5 45.45% 11 52.38% 10 71.43% 7 58.33% 48 58.54%
Testing 9 90.00% 11 78.57% 10 90.91% 16 76.19% 12 85.71% 7 58.33% 65 79.27%
Implementation 8 80.00% 10 71.43% 9 81.82% 21 100.00% 12 85.71% 7 58.33% 67 81.71%
Other 0 0.00% 0 0.00% 0 0.00% 2 9.52% 0 0.00% 4 33.33% 6 7.32% Notes: 1. Number of commitments ; 2. Percentage of commitments in the Action Group

35
Table 26 – Added-Value from the EIP on AHA – Monitoring Survey
Action Group A1 (# 11
commit.)
A2 (#16
commit.)
A3 (#16
commit.)
B3 (#22
commit.)
C2 (#16
commit.)
D4 (#12
commit.)
Total (#93
commit.)
No1 %2 No1 %2 No1 %2 No1 %2 No1 %2 No1 %2 No1 %2
TOTAL 51 85 77 131 79 61 484
Networking-partnership 9 81.8% 15 93.8% 14 87.5% 20 90.9% 14 87.5% 8 66.7% 80 86.0%
Networking-align processes 6 54.5% 9 56.3% 12 75.0% 16 72.7% 8 50.0% 5 41.7% 56 60.2%
Networking-other 2 18.2% 5 31.3% 1 6.3% 7 31.8% 6 37.5% 5 41.7% 26 28.0%
Visibility 7 63.6% 13 81.3% 11 68.8% 16 72.7% 11 68.8% 11 91.7% 69 74.2%
Exchange good practice 8 72.7% 13 81.3% 7 43.8% 20 90.9% 11 68.8% 9 75.0% 68 73.1%
Overcoming barriers 4 36.4% 8 50.0% 6 37.5% 12 54.5% 8 50.0% 6 50.0% 44 47.3%
Creating awareness 3 27.3% 8 50.0% 12 75.0% 14 63.6% 9 56.3% 7 58.3% 53 57.0%
Influence local/reg/national policies 7 63.6% 9 56.3% 10 62.5% 19 86.4% 8 50.0% 5 41.7% 58 62.4%
Growth and employment 2 18.2% 3 18.8% 2 12.5% 5 22.7% 2 12.5% 3 25.0% 17 18.3%
Other added value 2 18.2% 2 12.5% 2 12.5% 2 9.1% 2 12.5% 1 8.3% 11 11.8%
None 1 9.1% 0 0.0% 0 0.0% 0 0.0% 0 0.0% 1 8.3% 2 2.2%
Notes: 1. Number of commitments 2. Percentage of commitments in the Action Group Table 27 - Type of Barrier the EIP on AHA may help to overcome - Baseline (1stINVITATION)
Action Group A1 (# 11
commit.)
A2 (#16
commit.)
A3 (#16
commit.)
B3 (#22
commit.)
C2 (#16
commit.)
D4 (#12
commit.)
Total (#93
commit.)
No1 %2 No1 %2 No1 %2 No1 %2 No1 %2 No1 %2 No1 %2
TOTAL
End-users not involved 1 9.09% 5 31.25% 2 12.50% 4 18.18% 7 43.75% 5 41.67% 24 25.81%
Funding: Lack 2 18.18% 2 12.50% 1 6.25% 0 0.00% 4 25.00% 1 8.33% 10 10.75%
Public authorities
resistance
0 0.00% 2 12.50% 1 6.25% 3 13.64% 2 12.50% 1 8.33% 9 9.68%
Funding: only partial 0 0.00% 0 0.00% 0 0.00% 1 4.55% 0 0.00% 0 0.00% 1 1.08%
Evidence: scattered 2 18.18% 0 0.00% 0 0.00% 1 4.55% 1 6.25% 0 0.00% 4 4.30%
Funding: not aligned 0 0.00% 1 6.25% 0 0.00% 2 9.09% 1 6.25% 0 0.00% 4 4.30%
Bad regulations 2 18.18% 0 0.00% 0 0.00% 6 27.27% 2 12.50% 1 8.33% 11 11.83%
Evidence: lack 0 0.00% 3 18.75% 4 25.00% 2 9.09% 4 25.00% 5 41.67% 18 19.35%
Other barriers 8 72.73% 13 81.25% 11 68.75% 17 77.27% 10 62.50% 6 50.00% 65 69.89%
End-users: not trained 6 54.55% 5 31.25% 2 12.50% 6 27.27% 4 25.00% 1 8.33% 24 25.81%
End-users: resistance 1 9.09% 1 6.25% 1 6.25% 0 0.00% 5 31.25% 1 8.33% 9 9.68%
Lack of standards 2 18.18% 5 31.25% 3 18.75% 10 45.45% 7 43.75% 2 16.67% 29 31.18%
Patent environment 0 0.00% 0 0.00% 0 0.00% 0 0.00% 0 0.00% 0 0.00% 0 0.00%
No barriers 0 0.00% 0 0.00% 0 0.00% 1 4.55% 0 0.00% 1 8.33% 2 2.15%
Notes: 1 Number of references to barriers found in the commitments, 2 Percentage over the total commitments in the Action Group.
Barriers classified according to the Consultation Report on the EIP on AHA http://ec.europa.eu/research/innovation-union/pdf/active-healthy-ageing/consultation/consultation_report.pdf
36
Table 28 - Type of Barrier the EIP on AHA may help to overcome – Monitoring Survey
Action Group A1 (# 11 commit.) A2 (#16 commit.) A3 (#16 commit.) B3 (#22 commit.) C2 (#16 commit.) D4 (#12 commit.) Total (#93 commit.)
No1
%2 %3 No1
%2 %3 No1
%2 %3 No1
%2 %3 No1
%2 %3 No1
%2 %3 No1
%2 %3
TOTAL 15 32 15 48 23 12 145
Funding new way organising 1 9.1% 25.0%
5 31.3%
62.5%
2 12.5%
33.3%
10 45.5%
83.3%
1 6.3% 12.5%
0 0.0% 0.0% 19 20.4%
43.2%
Funding new technologies 3 27.3%
75.0%
5 31.3%
62.5%
2 12.5%
33.3%
8 36.4%
66.7%
3 18.8%
37.5%
0 0.0% 0.0% 21 22.6%
47.7%
Aggregating evidence on
innovation
2 18.2%
50.0%
6 37.5%
75.0%
0 0.0% 0.0% 6 27.3%
50.0%
4 25.0%
50.0%
3 25.0%
50.0%
21 22.6%
47.7%
Lack evidence on benefits of
innov.
3 27.3%
75.0%
5 31.3%
62.5%
3 18.8%
50.0%
4 18.2%
33.3%
3 18.8%
37.5%
3 25.0%
50.0%
21 22.6%
47.7%
Technical standards 0 0.0% 0.0% 2 12.5%
25.0%
1 6.3% 16.7%
2 9.1% 16.7%
2 12.5%
25.0%
0 0.0% 0.0% 7 7.5% 15.9%
Medical standards 2 18.2%
50.0%
2 12.5%
25.0%
2 12.5%
33.3%
6 27.3%
50.0%
1 6.3% 12.5%
0 0.0% 0.0% 13 14.0%
29.5%
Regulatory issues 1 9.1% 25.0%
2 12.5%
25.0%
1 6.3% 16.7%
4 18.2%
33.3%
0 0.0% 0.0% 0 0.0% 0.0% 8 8.6% 18.2%
Fragmented market conditions 0 0.0% 0.0% 2 12.5%
25.0%
0 0.0% 0.0% 3 13.6%
25.0%
3 18.8%
37.5%
1 8.3% 16.7%
9 9.7% 20.5%
Creating critical mass 3 27.3%
75.0%
3 18.8%
37.5%
4 25.0%
66.7%
5 22.7%
41.7%
6 37.5%
75.0%
5 41.7%
83.3%
26 28.0%
59.1%
Other barriers 0 0.0% 0.0% 0 0.0% 0.0% 0 0.0% 0.0% 0 0.0% 0.0% 0 0.0% 0.0% 0 0.0% 0.0% 0 0.0% 0.0%
Notes: 1 Number of references to barriers found in the commitments
2 Percentage over the total commitments in the Action Group 3 Percentage over the number of commitments in the Action Group providing information on barriers

37
Table 29 - EU Funding (Commitments with information on EU Funding)
Baseline (1stINVITATION) Monitoring Survey
Action Group No. commitments
A1 #2
A2 #3
A3 #2
B3 #3
C2 #1
D4 #0
Total #11
A1 #3
A2 #4
A3 #5
B3 #1
2
C2 #7
D4 #3
Total
#34 7th Framework
Programme for R&I
1 3 2 2 1 0 9 3 4 3 7 3 1 21
Public Health
Programme
0 0 0 0 0 0 0 1 0 0 3 1 0 5
Competitiveness and
Innovation Programme
0 0 0 0 0 0 0 0 2 1 6 1 1 11
Cohesion and
Structural Funds
0 0 0 0 0 0 0 1 1 2 3 2 1 10
Ambient Assisted Living
Joint Programme
0 0 0 0 0 0 0 1 1 1 2 2 1 8
Joint Programme -
Neurodegenerative
Disease Research
0 0 0 0 0 0 0 0 0 0 0 0 0 0
PROGRESS 0 0 0 0 0 0 0 0 0 0 1 0 1 2
EIB loans 0 0 0 0 0 0 0 0 0 0 0 0 0 0
Other 1 1 0 1 0 0 3 0 0 1 0 1 1 3
Total 2 4 2 3 1 0 12 6 8 8 22 10 6 60

38
Europe Direct is a service to help you find answers to your questions about the European Union
Freephone number (*): 00 800 6 7 8 9 10 11
(*) Certain mobile telephone operators do not allow access to 00 800 numbers or these calls may be billed.
A great deal of additional information on the European Union is available on the Internet.
It can be accessed through the Europa server http://europa.eu.
How to obtain EU publications
Our publications are available from EU Bookshop (http://bookshop.europa.eu),
where you can place an order with the sales agent of your choice.
The Publications Office has a worldwide network of sales agents.
You can obtain their contact details by sending a fax to (352) 29 29-42758.
European Commission
EUR 26825 EN – Joint Research Centre – Institute for Prospective Technological Studies
Title: Monitoring and Assessment Framework for the European Innovation Partnership on Active and Healthy Ageing
(MAFEIP) First update of the process indicators
Authors: Fabienne Abadie, Maria Lluch, Ramon Sabes-Figuera, Bernarda Zamora
Luxembourg: Publications Office of the European Union
2014 – 37 pp. – 21.0 x 29.7 cm
EUR – Scientific and Technical Research series – ISSN 1831-9424 (online)
ISBN 978-92-79-40154-1 (PDF)
doi:10.2791/122

JRC Mission As the Commission’s in-house science service, the Joint Research Centre’s mission is to provide EU policies with independent, evidence-based scientific and technical support throughout the whole policy cycle. Working in close cooperation with policy Directorates-General, the JRC addresses key societal challenges while stimulating innovation through developing new methods, tools and standards, and sharing its know-how with the Member States, the scientific community and international partners.
Serving society Stimulating innovation Supporting legislation
doi:10.2791/122 ISBN 978-92-79-40154-1
LF-N
A-2
68
25
-EN
-N