mongolian meat exporters
TRANSCRIPT
Integrating Landlocked
Commodity Dependent Developing Countries
into Regional and Global Value Chains
U N I T E D N A T I O N S C O N F E R E N C E O N T R A D E A N D D E V E L O P M E N T
Analysis of Key Destination Markets for Mongolian Meat Exporters
ii
© 2021, United Nations Conference on Trade and Development
The findings, interpretations and conclusions expressed herein are those of the author and do not necessarily reflect the views of the United Nations or its officials or Member States. Any remaining errors are exclusively the responsibility of the author.
The designations employed and the presentation of material on any map in this work do not imply the expression of any opinion whatsoever on the part of the United Nations concerning the legal status of any country, territory, city or area or of its authorities, or concerning the delimitation of its frontiers or boundaries.
This report has been edited externally.
UNCTAD/DITC/COM/INF/2021/11
Analysis of Key Destination Markets for Mongolian Meat Exporters
iii
Acknowledgements This document was prepared by Munkhzul Boldbaatar, UNCTAD consultant. The author would like to thank Romain Perez, Rodrigo Carcamo, Justin Van de Ven and Janvier Nkurunziza from the UNCTAD Commodities Branch, Division on International Trade and Commodities, for their very valuable comments on earlier versions of this report.
The author also thanks Battogtokh Ish-ochir from the Mongolian Meat Association and Bolormaa Lkhagvasuren from the Ministry of Foreign Affairs of Mongolia for their assistance.
This report has been edited by David Einhorn.
Contact UNCTAD
Division on International Trade and Commodities
Commodities Branch
Geneva, Switzerland
Email: [email protected]
Tel: +41 22 917 6286
Website: https://unctad.org/topic/commodities
Analysis of Key Destination Markets for Mongolian Meat Exporters
iv
Abstract Meat exports play an important role in Mongolia’s economy. However, due to several constraints that hinder export growth, Mongolia cannot export its agricultural products to its full capacity. One of the main challenges for Mongolian meat exporters is to identify key destination markets for their products and know how to access them. Examining the conditions to access these markets of interest would thus help strengthen the export capacity of Mongolian meat exporters. From this perspective, this report analyses consumer preferences, trends, distribution channels, logistics and transportation options for the selected potential markets for Mongolia’s meat exports, namely China, Japan, Viet Nam, the Russian Federation, and Kazakhstan. Recommendations are provided to facilitate the access of Mongolian meat exporters to these countries.

Analysis of Key Destination Markets for Mongolian Meat Exporters
v
Table of contents 1 Project purpose ...................................................................................................... 1 2 Export Market Selection ........................................................................................ 1
2.1 Criteria............................................................................................................... 1
2.1.1 Meat trade flows ............................................................................................ 1
2.1.2 Meat consumption ......................................................................................... 2
2.1.3 Cost of shipping per ton ................................................................................ 2
2.1.4 Ranking system ............................................................................................. 2
2.2 Selected export markets ................................................................................... 2
2.2.1 China ............................................................................................................. 4
2.2.2 Japan ............................................................................................................. 4
2.2.3 Russian Federation ........................................................................................ 4
2.2.4 Viet Nam ........................................................................................................ 4
2.2.5 Kazakhstan .................................................................................................... 5
3 Market profiles ....................................................................................................... 5
3.1 Market profile – China ....................................................................................... 6
3.1.1 Market trends and consumer preferences ..................................................... 6
3.1.2 Meat imports .................................................................................................. 7
3.1.3 Trade channels and transportation ................................................................ 9
3.1.4 Establishing a commercial partnership in China .......................................... 10
3.2 Market profile – Japan .................................................................................... 13
3.2.1 Market trends and consumer preferences ................................................... 13
3.2.2 Meat imports ................................................................................................ 14
3.2.3 Trade channels and transportation .............................................................. 16
3.2.4 Establishing a commercial partnership in Japan ......................................... 17
3.3 Market profile – Russian Federation ............................................................... 18
3.3.1 Market trends and consumer preferences ................................................... 18
3.3.2 Meat imports ................................................................................................ 20
3.3.3 Trade channels and transportation ................................................................. 21
3.3.4 Establishing a commercial partnership in the Russian Federation .............. 22
3.4 Market profile – Viet Nam ................................................................................ 22
3.4.1 Market trends and consumer preferences ................................................... 22
3.4.2 Meat imports ................................................................................................ 23
3.4.3 Trade channels and transportation .............................................................. 25

Analysis of Key Destination Markets for Mongolian Meat Exporters
vi
3.4.4 Establishing a commercial partnership in Viet Nam .................................... 26
3.5 Market profile – Kazakhstan ............................................................................ 28
3.5.1 Market trends and consumer preferences ................................................... 28
3.5.2 Meat imports ................................................................................................ 29
3.5.3 Trade channels and distribution .................................................................. 30
3.5.4 Establishing a commercial partnership in Kazakhstan ................................ 31
4 Conclusions and recommendations ................................................................... 33
4.1 Summary: Market profiles .............................................................................. 33
4.1.1 Market trends and consumer preferences ................................................... 33
4.1.2 Meat imports ................................................................................................ 34
4.1.3 Trade channels and transportation .............................................................. 34
4.2 Recommendations .......................................................................................... 35
4.2.1 Promote Mongolia’s meat and meat products at trade shows and events . 35
4.2.2 Distribute exported meat and meat products through strategic local partners 36
4.2.3 Explore alternative distribution models in export markets ........................... 36
Figures Figure 1 China: Per capita meat consumption, by type, 2010–2019 .......................... 7
Figure 2 China: Total meat imports, by quantity, 2009–2019 (tons) ............................ 8
Figure 3 The distribution network in China ................................................................ 11
Figure 4 Japan: Per capita meat consumption, by type, 2010–2019 ........................ 14
Figure 5 Japan: Total meat imports, by quantity, 2010–2019 ................................... 15
Figure 6 The distribution network in Japan ............................................................... 18
Figure 7 Russian Federation: Per capita meat consumption, by type, 2010–2019 ............................................................................................................ 19
Figure 8 Russian Federation: Total meat imports, by quantity, 2010–2019 .............. 21
Figure 9 The distribution network in the Russian Federation .................................... 22
Figure 10 Viet Nam: Total meat imports, by quantity, 2010–2019 .............................. 24
Figure 11 The distribution network in Viet Nam .......................................................... 27
Figure 12 Kazakhstan: Per capita meat consumption, by type, 2010–2019 ............... 29
Figure 13 Kazakhstan: Total meat imports, by quantity, 2010–2019 .......................... 30
Figure 14 The distribution network in Kazakhstan ...................................................... 32
Analysis of Key Destination Markets for Mongolian Meat Exporters
vii
Tables
Table 1 Normalized scores for the selection of Mongolia’s top 10 export markets ......................................................................................................... 3
Table 2 Recent and forecast meat consumption per capita, 2018–2028 (kilograms) ..................................................................................................... 3
Table 3 China: Export quota breakdown ................................................................. 12
Table 4 Stages of export development to China ...................................................... 12


Analysis of Key Destination Markets for Mongolian Meat Exporters
1
1 Project purpose
In 2018, the United Nations Conference on Trade and Development (UNCTAD) launched a project titled “Integrating Landlocked Commodity Dependent Countries into Regional and Global Value Chains” with the goal to support integrated value chain development in four landlocked countries primarily through the agri-food sector. The project has already studied activities in Ethiopia, Lao People’s Democratic Republic and Uzbekistan. The fourth and final country to be studied is Mongolia, which derived nearly 25 per cent of its GDP from mining and quarrying activities in 2018. For a variety of reasons, increasing meat exports is a viable way for Mongolia to diversify away from mineral commodities and become a more integrated part of the regional and global economy.
Accordingly, two studies were conducted. The first report focuses on the domestic and export meat value chain in Mongolia. It analyses the downstream value chain of meat in Mongolia in order to inform policy discussions about how to improve the enabling environment for meat agribusiness.
This report complements the first study by identifying the top five potential export markets for Mongolian meat exporters. These markets will be reviewed by taking an in-depth look at each market’s meat trends and consumer preferences, imports, existing trade channels and transportation, as well as options to establish commercial partnerships in these countries.
2 Export Market Selection
2.1 Criteria
This study established a specific methodology to identify the strongest potential markets for Mongolian meat exports. The potential export destinations were analysed through the lens of multiple pre-determined criteria related to current and past meat trade flows and average meat consumption.
2.1.1 Meat trade flows
The analysis looked at where Mongolian meat products are exported in tandem with what countries are Mongolia’s largest trading partners. If countries have pre-existing meat trade with Mongolia, it will likely be easier to export to them because their consumers are already familiar with Mongolian products. At the same time, Mongolian

Analysis of Key Destination Markets for Mongolian Meat Exporters
2
businesses likely already know how to navigate the regulatory and logistical networks of these countries.
The data used for this study, the total amount of meat exported from Mongolia in the last seven years, came from the country’s General Customs Office. This allowed for selecting the countries that have imported the highest quantity of meat from Mongolia as main potential markets.
2.1.2 Meat consumption
Potential export markets were also determined by meat consumption per capita and total meat consumed by the country. The use of these two metrics allowed for better assessing potential consumer demand for imported meat in the destination country. Countries with high levels of meat consumption per capita indicate high demand for meat, though countries with low meat consumption per capita may have potential to expand their meat market and increase their consumption. Data were provided by the FAOstat database of the Food and Agriculture Organization of the United Nations.
2.1.3 Cost of shipping per ton
The final metric was the cost of shipping per ton. An important aspect of any business is pricing analysis. Using this metric allowed for determining whether exporting Mongolian meat to certain countries is financially viable. The transportation cost data was acquired from the World Bank database.
2.1.4 Ranking system
As of 2019, Mongolia exported meat products to 18 countries throughout the world. Data were collected for these countries on meat imports in 2019 (the most recent year available), average Mongolian meat imports between 2013 and 2019, the growth rate in Mongolian meat imports from 2013 and 2019, total meat consumption, and the cost of shipping to each market from Mongolia.
The values obtained for the three indicators (meat trade flows, meat consumption and cost of shipping per ton) were then normalized and summed to rank the potential of each market. Countries with the highest sum of normalized scores are the markets with the most potential for Mongolian meat exports.
2.2 Selected export markets
The rankings revealed that the top five destination markets for Mongolian meat are China, Japan, the Russian Federation, Viet Nam, and Kazakhstan (table 1).
The Chinese market has the most potential for increased meat exports due to the large amount it currently imports from Mongolia as well as its massive population, which

Analysis of Key Destination Markets for Mongolian Meat Exporters
3
consumes an estimated 75 million tons of meat annually. 1 The Russian market is promising for similar reasons. The Russian Federation is the largest country in Europe by population and is Mongolia’s second-largest trading partner. Japan and Kazakhstan will also be examined as potential export markets because both countries significantly increased their imports from Mongolia in the last five years. Viet Nam also ranks highly as a meat export destination due to its large population and its significant increase in meat consumption. As the growth in domestic meat output does not keep up with the current consumption trends, the Vietnamese market offers good prospects for meat exporters, such as Mongolia.
Table 1 Normalized scores for the selection of Mongolia’s top 10 export markets
Top 5 Country Normalized scores
1 China 6.03
2 Japan 2.64
3 Russian Federation 2.20
4 Viet Nam 2.19
5 Kazakhstan 1.92
6 Germany 1.53
7 Iran 1.46
8 Italy 1.45
9 Austria 1.28
10 Democratic People’s Republic of Korea 1.07 Source: Prepared by the author.
The following sections discuss recent and forecast meat consumption and other relevant information in selected destination markets for Mongolia (table 2).
Table 2 Recent and forecast meat consumption per capita, 2018–2028 (kilograms)
Country 2018 2019 2020 2021 2024 2028 Average 2018–2028
China 48.9 48.4 49.8 50.2 51.2 52.9 558.8
Japan 40.7 40.7 41 41.2 41.8 42.8 458
Republic of Korea 59.3 60.4 60.9 61.2 62.3 63.8 680.3
Russian Federation
62.8 63.6 64.3 64.7 65.6 66.9 716.9
Viet Nam 52.5 53.1 53.9 54.5 56.7 59.8 616.3
Source: https://stats.oecd.org/, accessed 23 October 2021.
1 https://stats.oecd.org/ (accessed 23 October 2021).
Analysis of Key Destination Markets for Mongolian Meat Exporters
4
2.2.1 China
China is the world’s most populous country, with a population of just under 1.4 billion. Based on consumption numbers from the Organization for Economic Cooperation and Development (OECD), the people of China consumed more than 75 million tons of meat in 2018. The OECD further predicts that meat consumption per capita in China will increase by 8 per cent, or 6 million tons, between 2020 and 2028,2 far outpacing forecast population growth of 2 per cent over the same period. In addition, China has increased its total imports from Mongolia and became the main destination market for Mongolian meat exporters in 2018. The country imported more than US$100 million in meat in 2018, five times more than the next largest meat importer, Iran.
2.2.2 Japan
In 2018, Japan was one of only three countries to import horse meat from Mongolia and was the second largest importer of Mongolian sheep and goat meat by value (US$2.4 million). The largest importer of Mongolian sheep and goat meat was Italy (US$2.7 million), but Japan is a potentially bigger export market for meat than Italy for several reasons. Japan had a population of more than 126 million in 2018, more than double that of Italy. While Japan’s population will decline by 4 per cent through 2028, meat consumption per capita will grow by a surprising 5 per cent and increase meat demand by 288,000 tons.3
2.2.3 Russian Federation
After China, the Russian Federation is the second largest importer of Mongolian meat products, according to the Mongolian customs agency. On average, the Russian Federation imported US$5.38 million annually in horse meat from Mongolia between 2010 and 2019. However, this only represents a fraction of the Russian Federation’s total meat imports, meaning there is significant room for Mongolia to supplant countries currently supplying the Russian Federation with meat. The Russian Federation has the largest population in Europe and its citizens consume 28 per cent more meat per capita than Chinese peers. Russians also will consume 6 per cent more meat per capita by 2028.4
2.2.4 Viet Nam
The Vietnamese economy grew by 7.1 per cent in 2018, making it the tenth-fastest growing economy in the world, according to the World Bank. Total imports from Mongolia have also grown by 161 per cent since 2014 as Viet Nam’s economy has grown.5 Between 2000 and 2018, Vietnamese meat consumption grew by 180 per cent
2 Ibid. 3 OECD and FAO, 2020, OECD and-FAO Agricultural Outlook 2020–2029, FAO, Rome/OECD Publishing, Paris, available at https://doi.org/10.1787/1112c23b-en. 4 Ibid. 5 https://www.trademap.org (accessed 23 October 2021).
Analysis of Key Destination Markets for Mongolian Meat Exporters
5
to 52.49 kg/person. Meat consumption will grow by a further 14 per cent or 776,000 tons by 2028.6 Growth in meat consumption will outpace population growth of 8 per cent during this same time horizon.
2.2.5 Kazakhstan
Kazakhstan’s meat imports continued to grow in 2019 despite its progress towards increasing domestic production and exports. The United States remains the top meat exporter to Kazakhstan, with total exports of US$128 million in 2019, constituting 47 per cent of Kazakhstan’s total meat imports.7 Kazakhstan mainly imports horse meat from Mongolia (US$580,000 in 2019). Kazakhstan had a population of more than 18.6 million in 2019, and meat consumption per capita has increased slightly since 2016.8
3 Market profiles
Now that the statistical criterion to select the potential markets for Mongolia’s meat exports has been established, this section will comprehensively explore each market based on the following:
1. Market trends and consumer preferences: This section includes the main developments in the meat sector in the selected countries, indicating the main drivers of change and the main characteristics that shape the meat-eating culture.
2. Meat imports: This section is based on trade figures downloaded through the International Trade Centre (ITC) Trade Map, using Harmonized System (HS) code 02: Meat and edible meat offal,9 disaggregated per supplying country. The data presented distinguish different origins in order to identify the main competitors per market, specifically highlighting the main suppliers from meat-producing countries. Such data also serve as an indication of the market size/share for meat, which can be used to indicate current market demand in each market as well as the potential for scalability.
3. Trade channels and transportation: Since product freshness and quality preservation is the main concern when transporting meat, this section reviews the current structure of meat exporting channels such as identifying exporters’ methods of selling meat, the purchaser of the meat, and types of meat exports.
6 OECD and FAO, 2020, OECD and-FAO Agricultural Outlook 2020–2029, FAO, Rome/OECD Publishing, Paris, available athttps://doi.org/10.1787/1112c23b-en. 7 https://www.trademap.org (accessed 23 October 2021). 8 OECD and FAO, 2020, OECD and-FAO Agricultural Outlook 2020–2029, FAO, Rome/OECD Publishing, Paris, available at https://doi.org/10.1787/1112c23b-en. 9 https://www.trademap.org (accessed 23 October 2021).
Analysis of Key Destination Markets for Mongolian Meat Exporters
6
This section also looks at transportation options from Mongolia to each selected destination, such as air and sea freight.
4. Establishing a commercial partnership. This section reviews ongoing business practices and examines ways commercial partnerships can be established.
3.1 Market profile – China
3.1.1 Market trends and consumer preferences
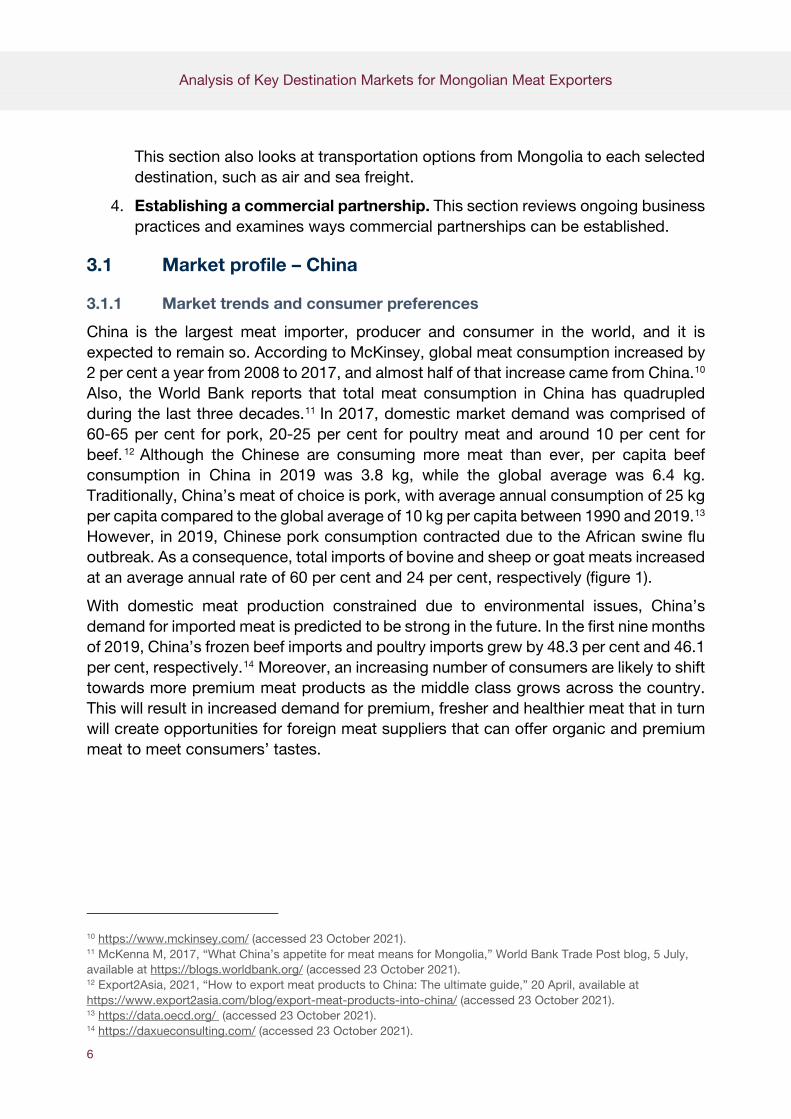
China is the largest meat importer, producer and consumer in the world, and it is expected to remain so. According to McKinsey, global meat consumption increased by 2 per cent a year from 2008 to 2017, and almost half of that increase came from China.10 Also, the World Bank reports that total meat consumption in China has quadrupled during the last three decades.11 In 2017, domestic market demand was comprised of 60-65 per cent for pork, 20-25 per cent for poultry meat and around 10 per cent for beef. 12 Although the Chinese are consuming more meat than ever, per capita beef consumption in China in 2019 was 3.8 kg, while the global average was 6.4 kg. Traditionally, China’s meat of choice is pork, with average annual consumption of 25 kg per capita compared to the global average of 10 kg per capita between 1990 and 2019.13 However, in 2019, Chinese pork consumption contracted due to the African swine flu outbreak. As a consequence, total imports of bovine and sheep or goat meats increased at an average annual rate of 60 per cent and 24 per cent, respectively (figure 1).
With domestic meat production constrained due to environmental issues, China’s demand for imported meat is predicted to be strong in the future. In the first nine months of 2019, China’s frozen beef imports and poultry imports grew by 48.3 per cent and 46.1 per cent, respectively.14 Moreover, an increasing number of consumers are likely to shift towards more premium meat products as the middle class grows across the country. This will result in increased demand for premium, fresher and healthier meat that in turn will create opportunities for foreign meat suppliers that can offer organic and premium meat to meet consumers’ tastes.
10 https://www.mckinsey.com/ (accessed 23 October 2021). 11 McKenna M, 2017, “What China’s appetite for meat means for Mongolia,” World Bank Trade Post blog, 5 July, available at https://blogs.worldbank.org/ (accessed 23 October 2021). 12 Export2Asia, 2021, “How to export meat products to China: The ultimate guide,” 20 April, available at https://www.export2asia.com/blog/export-meat-products-into-china/ (accessed 23 October 2021). 13 https://data.oecd.org/ (accessed 23 October 2021). 14 https://daxueconsulting.com/ (accessed 23 October 2021).

Analysis of Key Destination Markets for Mongolian Meat Exporters
7
Figure 1 China: Per capita meat consumption, by type, 2010–2019
Source: https://stats.oecd.org/ (accessed 23 October 2021).
3.1.2 Meat imports
According to General Administration of Customs data, during the Covid-19 outbreak in the first four months of 2020, China’s meat imports rose 82 per cent year-over-year to 3.03 million tons. Accordingly, its April 2020 meat imports were 862,000 tons, with an emphasis on pork.15 China’s total meat imports amounted to US$16.353 billion in 2019, with its biggest meat exporters being Argentina, Brazil, New Zealand and Australia. The paragraphs below discuss the types of meat imported into China from the major exporters.16 Figure 2 presents China’s total meat exports by value from 2010–2019.
Beef: China has solidified its position as the fastest-growing beef import market in the world. In 2019, its biggest suppliers were Oceania and South American countries. The total value of its imports climbed 56 per cent from 2018 to US$4.9 billion. China’s total frozen bovine imports (HS code 0201, 0202) amounted to nearly US$8 billion in 2019, having increased at an average annual rate of 67 per cent since 2010.17
Latin American ranchers benefit from surging Chinese beef demand. The largest suppliers of bovine meat to China in 2019 were Brazil, Argentina and Uruguay, supplying 24 per cent, 23 per cent and 17 per cent of the market share, respectively. Brazil, the biggest beef exporter in the world, has had an average annual increase in its exports to
15 Reuters, 2020, “China meat imports rise 82% in first four months – customs,” 7 May, available at https://www.reuters.com/article/china-trade-economy-meat/china-meat-imports-rise-82-in-first-four-months-customs-idUSB9N2B801S 16 Data for meat imports are from the ITC Trade Map (https://www.trademap.org) except where otherwise indicated. 17 Beef Magazine, 2019, “China’s beef imports continue to soar, but obstacles for U.S. beef increase,” 12 September, available at https://www.beefmagazine.com/exports/china-s-beef-imports-continue-soar-obstacles-us-beef-increase
0
5
10
15
20
25
30
35
2010 2011 2012 2013 2014 2015 2016 2017 2018 2019 2020
Kg
/Cap
ita
Beef and veal Sheep Pork Poultry
Analysis of Key Destination Markets for Mongolian Meat Exporters
8
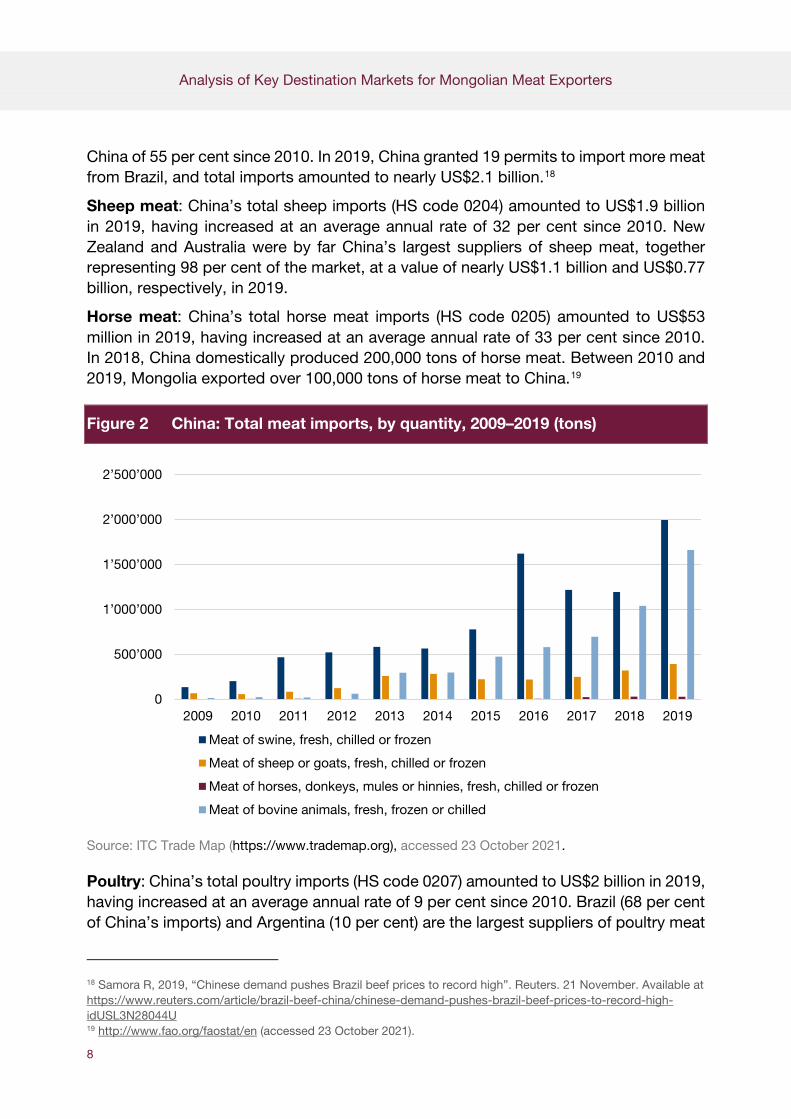
China of 55 per cent since 2010. In 2019, China granted 19 permits to import more meat from Brazil, and total imports amounted to nearly US$2.1 billion.18
Sheep meat: China’s total sheep imports (HS code 0204) amounted to US$1.9 billion in 2019, having increased at an average annual rate of 32 per cent since 2010. New Zealand and Australia were by far China’s largest suppliers of sheep meat, together representing 98 per cent of the market, at a value of nearly US$1.1 billion and US$0.77 billion, respectively, in 2019.
Horse meat: China’s total horse meat imports (HS code 0205) amounted to US$53 million in 2019, having increased at an average annual rate of 33 per cent since 2010. In 2018, China domestically produced 200,000 tons of horse meat. Between 2010 and 2019, Mongolia exported over 100,000 tons of horse meat to China.19
Figure 2 China: Total meat imports, by quantity, 2009–2019 (tons)
Source: ITC Trade Map (https://www.trademap.org), accessed 23 October 2021.
Poultry: China’s total poultry imports (HS code 0207) amounted to US$2 billion in 2019, having increased at an average annual rate of 9 per cent since 2010. Brazil (68 per cent of China’s imports) and Argentina (10 per cent) are the largest suppliers of poultry meat
18 Samora R, 2019, “Chinese demand pushes Brazil beef prices to record high”. Reuters. 21 November. Available at https://www.reuters.com/article/brazil-beef-china/chinese-demand-pushes-brazil-beef-prices-to-record-high-idUSL3N28044U 19 http://www.fao.org/faostat/en (accessed 23 October 2021).
0
500’000
1’000’000
1’500’000
2’000’000
2’500’000
2009 2010 2011 2012 2013 2014 2015 2016 2017 2018 2019
Meat of swine, fresh, chilled or frozen
Meat of sheep or goats, fresh, chilled or frozen
Meat of horses, donkeys, mules or hinnies, fresh, chilled or frozen
Meat of bovine animals, fresh, frozen or chilled
Analysis of Key Destination Markets for Mongolian Meat Exporters
9
to China, together accounting for three-quarters of total imports, at nearly US$1.5 billion. Imports from Brazil have increased at an annual average rate of 7 per cent since 2010, while imports from Argentina have declined at an annual average rate of 5 per cent.
Pork: China’s total pork imports (HS code 0203) amounted to US$4.5 billion in 2019, having increased at an average annual rate of 41 per cent since 2010. Spain (20 per cent of China’s imports) and Germany (15 per cent) are the largest suppliers of pork meat to China, at a value of over US$900 million and US$668 million, respectively.
3.1.3 Trade channels and transportation
3.1.3.1 Meat distribution
Due to China’s constantly expanding transportation network, there have been vast improvements in its distribution networks, which in turn has helped develop more regional trade in fresh meat and processed meat products. These developments have allowed producers to reach consumers in less populated regions. Domestically, supermarkets and hypermarkets are the new retail agencies through which processed meat products are distributed. Hema Fresh and Yonghui are retailers that dominate the distribution of meat. Foreign hypermarkets also aid in the distribution of products and reap the benefits of China’s ever-rising need for high-quality meat.
China’s increasing technological advances have popularized e-commerce. The popularity of online shopping has surged in China in tandem with its rapidly growing e-commerce market. In 2019, the online retail transaction value in China was approximately US$1.5 trillion, with a 25 per cent compound annual growth rate between 2017 and 2019 and projected to grow further.20 Following this trend, hypermarkets and supermarkets have shifted their view towards offering an online to offline shopping experience. Hema Fresh offers mobile applications for online orders as well as in-store catering and offline shopping, and around 60 per cent of the sales in Hema are made via the Hema mobile application. Hema’s successful pilot in China’s “new retail” landscape has pushed food retailers to rethink their distribution networks.21
Foreign companies seeking to distribute their meat in China, whether through online or offline shopping, are required to obtain a registered local distributor who is responsible not only for distribution but also for post-sale services.
3.1.3.2 Logistics and transportation options
Mongolia has always exported its meat supply by land to China. According to data provided by the General Administration of Customs, since 2018, Mongolia has stopped exporting meat on trains, and in 2019 it shipped a total of 48,867 tons of meat by road. In 2019, it made 22 exporting trips carrying an average of 2,222 tons of meat per trip.
20 Bu L, Lang J, Wei Wang K and Zipser D, 2019, “China digital consumer trends in 2019,” McKinsey, 26 September, available at https://www.mckinsey.com/featured-insights/china/china-digital-consumer-trends-in-2019. 21 Daxue Consulting, 2020, “The meat market in China: Pork making way for the growth of beef,” 20 January, available at https://daxueconsulting.com/ (accessed 23 October 2021).

Analysis of Key Destination Markets for Mongolian Meat Exporters
10
The meat is delivered to Erenhot, a city in Inner Mongolia on the Sino-Mongolian border. From there, Chinese companies distribute the meat to domestic meat processors and markets. Since the delivery trip is relatively short, Mongolian companies choose to export their meat by refrigerated car rather than by train.
The Belt and Road initiative (BRI) is a global infrastructure development led by the Chinese government with the aim to improve regional connections with more than 66 countries. Within the BRI, the China-Mongolia-Russia Economic Corridor (CMREC) provides Mongolia with opportunities to enhance trade with its neighbouring countries as well as with the European Union and Asian ports. Accordingly, the countries signed various agreements under the CMREC, including the advancement of rail transit and highways through Mongolia, which has seen increasing freight traffic. However, the CMREC program is not proceeding quickly enough, according to most stakeholders involved.
3.1.4 Establishing a commercial partnership in China
Due to China’s vast landscape and regionalized markets, there has been little progress in developing a consistent cold chain network there. Most of its exports enter through the east and northeast parts of China, which are Shanghai, Guangzhou, and Tianjin, and in the case of Mongolia’s meat exports, through Inner Mongolia. Domestically, the distribution of fresh meat is divided into three channels: retail channels (51 per cent), food service (28 per cent) and institutional channels (21 per cent) (figure 3).
Recently, Mongolia experienced cases of illegal exporting of meat to China after it established a quota system among domestic meat producers. Meat producers would then proceed to sell leftover quotas to those unauthorized to export. Thus, in the distribution scheme, exporters can be labelled as authorized and unauthorized.
Once the meat crosses borders, the main retail channel for it is the traditional wet markets that differentiate themselves from other retailers with their cheaper prices and are built close to major residential areas. But these markets are usually under heavy inspection by Chinese authorities due to sanitary issues. The country’s hazards analysis and critical control points can often result in the suspension of trade of meat products from these venues. Thus, when planning to enter the Chinese market, exporters must be aware of where they will be selling their meat and check that necessary health and sanitary regulations are being maintained.

Analysis of Key Destination Markets for Mongolian Meat Exporters
11
Figure 3 The distribution network in China
Source: Prepared by the author.
According to the European Commission, in order to get the most suitable strategy to enter the market, exporters can utilize intermediary wholesalers, agents, brokers and professional logistical support service providers in China.22 However, the first point of action should be coming into contact with a steady Chinese importer. For Mongolian meat exporters, some of the established Chinese importers include Two even Xin HSBC Trade, Erlian city Xiang Hong Trade, Erlian Minghaoweioye Economic and Trade, and Beijing Hongye Hong Food Trade.
3.1.4.1 Meat exports to China – Meat export quotas in 2020
According to the Mongolian Meat Association, a total meat export quota of 102,800 tons was applied to Mongolian meat producers exporting horse, beef, mutton and goat meat to China (table 3). Of the total, 62,800 tons have been provided under the general trade category and an additional 40,000 tons under a specific arrangement. This 40,000-ton export quota has been applied to six provinces that have been affected by summer drought and harsh winters, which resulted in lower livestock output. Quotas are then allocated to meat processing companies holding export licenses, depending on their meat processing capacity.
22 European Commission Research Executive Agency, 2018, “The food and beverage market entry handbook: The People’s Republic of China,” 8 May, available at https://ec.europa.eu/chafea/agri/en/content/food-and-beverage-market-entry-handbook-people%E2%80%99s-republic-china
Exporter
Supermarkets
Importer Consumers Food
services/ Processor
Traditional wet markets

Analysis of Key Destination Markets for Mongolian Meat Exporters
12
Table 3 China: Export quota breakdown Export quota under general
trade category (tons) Export quota under specific arrangements
with provinces
Beef 8,300 Gobi-Altai, Bayankhongor
Horse meat (frozen) 27,900 Omnogobi
Beef (heat processed) 8,000 Dundgobi
Mutton 6,600 Arkhangai
Goat meat 12,000 Ovorkhangai
Total quota 62,800 tons Total quota 40,000 tons
Grand total: 102,800 tons
Source: Mongolian Meat Association.
3.1.4.2 Meat export to China – Stages of export development
Table 4 Stages of export development to China
Mongolian
meat processing company
Inspection
Authority of Mongolia
Ministry of
Food and
Agriculture
Ministry of
Foreign Affairs
General
Administration of Customs of China
Submission of export proposal
(online)
Preliminary inspection of the
proposal
Preliminary inspection of the
proposal
Dispatch proposal through the
diplomatic post
Inspection and approval (or
rejection) decision
?
Embassy of
Mongolia in
Beijing, China
Ministry of
Foreign Affairs
Inspection Authority of Mongolia
Mongolian
meat processing company
Chinese
meat importing company
Receipt of decision,
translation into Mongolia
Inspection of decision
Grants meat exporting
license to the company
Meat/meat export to China (field
inspection takes place regularly)
Receipt of meat/meat products
Source: Mongolian Meat Association.
(example)

Analysis of Key Destination Markets for Mongolian Meat Exporters
13
To export to China, companies need to hold an export license (table 4). Next, a meat processing company wanting to export meat/meat products to China needs to submit an official export proposal. The proposal is submitted online. Then a preliminary inspection is conducted by the Inspection Authority of Mongolia as well as the Ministry of Food and Agriculture and then taken to the Ministry of Foreign Affairs. The Ministry of Foreign Affairs dispatches the proposal via diplomatic post to China’s General Administration of Customs. The customs office thoroughly inspects the proposal and approves or rejects it. If needed, the customs office asks for clarification or additional information at this stage. The decision made by the customs office is then brought to the Embassy of Mongolia in China, translated into Mongolian, and then delivered back to the Ministry of Foreign Affairs. The Inspection Authority of Mongolia grants the final approval and provides the export license to the company. Upon presentation of the export permit, China’s customs office conducts a physical field inspection.
3.2 Market profile – Japan
3.2.1 Market trends and consumer preferences
Red meats dominate Japanese meat consumption. In 2019, Japan consumed 2.6 million tons of pork and 1.3 million tons of beef, amounts that have been increasing since 2015 at average annual rates of 1.7 per cent and 2.3 per cent, respectively.23 Despite the Japanese population decreasing at a rate of around 0.1 to 0.2 per cent each year,24 red meat consumption has been rising.
Japan has been experiencing dramatic shifts in the dietary preferences of its citizens due to rising incomes, an increasing number of supermarkets, convenience stores and fast-food chains, and trade liberalization. In the last four decades, beef and pork consumed within the country increased by 160 per cent and 90 per cent, respectively.25 The popularity of a red-meat-based diet has resulted in a relative decline in rice and fish consumption and major changes in the average Japanese menu.
Also, according to the United States Department of Agriculture (USDA) Foreign Agricultural Service, the growth of beef consumption in Japan is prompted by increased familiarity with beef-based Western-style cuisine among senior citizens, who make up a large segment of Japan’s population. Moreover, seniors are encouraged by Japan’s medical community to consume more red meat to support their muscle retention, which will continue to boost short- to medium-term consumption of beef. Regarding pork consumption, according to the Ministry of Internal Affairs and Communications, Japanese households’ per capita pork consumption has dropped and households are shifting away from processed meats like ham and sausage.26 However, pork will remain
23 https://data.oecd.org (accessed 23 October 2021). 24 https://apps.fas.usda.gov (accessed 23 October 2021). 25 Ibid. 26 Ibid.

Analysis of Key Destination Markets for Mongolian Meat Exporters
14
one of the most popular protein choices for households and consumption of it is likely to overtake fish and shellfish.
Japanese consumers’ preference for white meats (chicken and fish) is notable. By individual types of meat, poultry leads per capita consumption and has been climbing at an average annual rate of 1.8 per cent since 2015 (figure 4). Declining supplies of fish and shellfish, a traditional Japanese stable protein source, is pushing consumers to switch to poultry as an affordable substitute,.27 Also, product differentiation of poultry meats and rapidly growing demand for different flavours and size varieties on the market are helping to pull poultry consumption upward.
Figure 4 Japan: Per capita meat consumption, by type, 2010–2019
Source: https://stats.oecd.org/ (accessed 23 October 2021).
3.2.2 Meat imports
Overall, in 2019, Japan imported a total of 2.3 million tons of meat worth over US$10.9 billion through sea and air cargo (figure 5).28 The paragraphs below discuss the types of meat imported into Japan from the major exporters.29
Beef: Japan’s total frozen bovine imports (HS code 0201, 0202) amounted to nearly US$3.5 billion in 2019, having increased at an average annual rate of 5 per cent since 2010. In 2019, Australia and the United States were by far Japan’s largest suppliers of beef, together dominating 88 per cent of the market at values of nearly US$1.7 billion and US$1.4 billion, respectively. Japan’s beef imports from the United States have shown an average annual increase of 7 per cent since 2010. In contrast, imports from Australia have been decreasing at an average annual rate of 4 per cent. Imported beef
27 Ibid. 28 E-Stat Statistics of Japan, https://www.e-stat.go.jp/en (accessed 23 October 2021). 29 Data for meat imports are from the ITC Trade Map (https://www.trademap.org) except where otherwise indicated.
0
5
10
15
20
2010 2011 2012 2013 2014 2015 2016 2017 2018 2019 2020
Kg
/Cap
ita
Beef and veal Sheep Pork Poultry
Analysis of Key Destination Markets for Mongolian Meat Exporters
15
cuts will remain competitive as domestic production continues to shift toward high-priced wagyu breeds.30
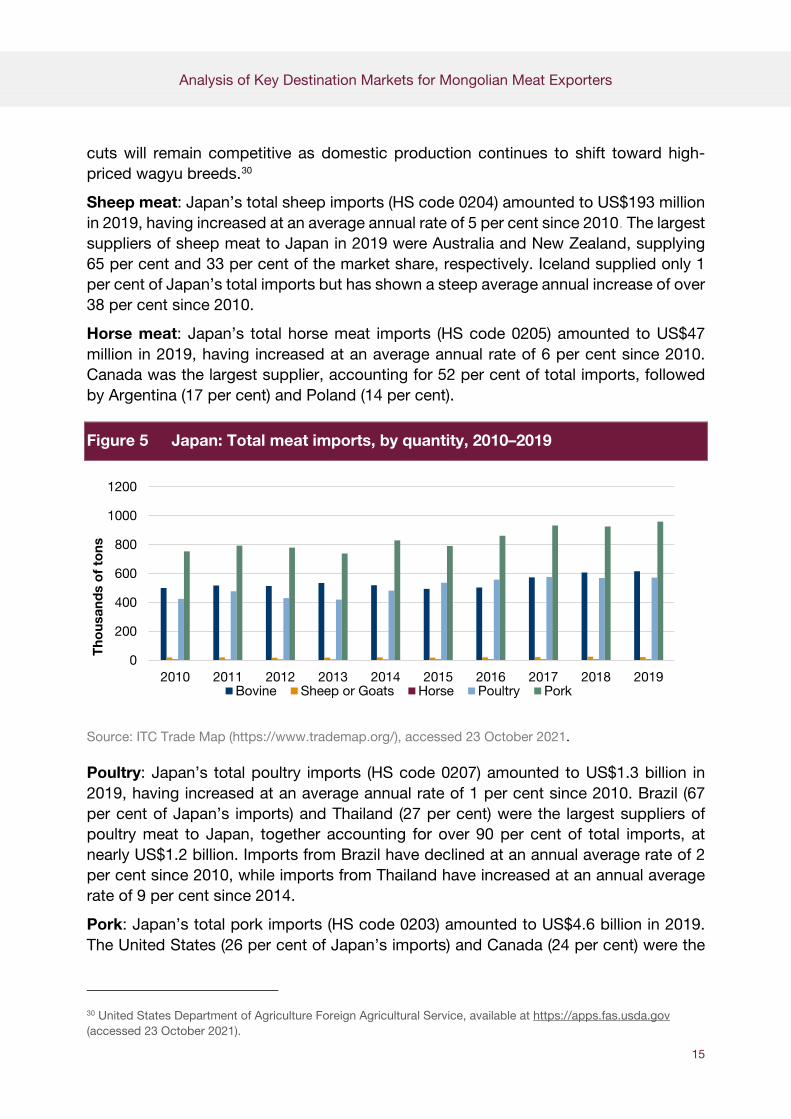
Sheep meat: Japan’s total sheep imports (HS code 0204) amounted to US$193 million in 2019, having increased at an average annual rate of 5 per cent since 2010. The largest suppliers of sheep meat to Japan in 2019 were Australia and New Zealand, supplying 65 per cent and 33 per cent of the market share, respectively. Iceland supplied only 1 per cent of Japan’s total imports but has shown a steep average annual increase of over 38 per cent since 2010.
Horse meat: Japan’s total horse meat imports (HS code 0205) amounted to US$47 million in 2019, having increased at an average annual rate of 6 per cent since 2010. Canada was the largest supplier, accounting for 52 per cent of total imports, followed by Argentina (17 per cent) and Poland (14 per cent).
Figure 5 Japan: Total meat imports, by quantity, 2010–2019
Source: ITC Trade Map (https://www.trademap.org/), accessed 23 October 2021.
Poultry: Japan’s total poultry imports (HS code 0207) amounted to US$1.3 billion in 2019, having increased at an average annual rate of 1 per cent since 2010. Brazil (67 per cent of Japan’s imports) and Thailand (27 per cent) were the largest suppliers of poultry meat to Japan, together accounting for over 90 per cent of total imports, at nearly US$1.2 billion. Imports from Brazil have declined at an annual average rate of 2 per cent since 2010, while imports from Thailand have increased at an annual average rate of 9 per cent since 2014.
Pork: Japan’s total pork imports (HS code 0203) amounted to US$4.6 billion in 2019. The United States (26 per cent of Japan’s imports) and Canada (24 per cent) were the
30 United States Department of Agriculture Foreign Agricultural Service, available at https://apps.fas.usda.gov (accessed 23 October 2021).
0
200
400
600
800
1000
1200
2010 2011 2012 2013 2014 2015 2016 2017 2018 2019
Tho
usan
ds
of
tons
Bovine Sheep or Goats Horse Poultry Pork
Analysis of Key Destination Markets for Mongolian Meat Exporters
16
largest suppliers of pork to Japan, at values of over US$1.2 billion and US$1.1 billion, respectively.
3.2.3 Trade channels and transportation
3.2.3.1 Meat distribution
In 2019, Japanese domestic spending on beef increased by 3.1 per cent over 2018.31 Domestic producers and distributors are developing and adapting to Japan’s rising demand for meat by improving efficiency and increasing production. Japan hosts a dual system of meat distribution: traditional retail markets and online retailers (e-retailers). For instance, NH Foods Group, one of the main distributors in Japan, accounts for nearly 20 per cent of Japan’s fresh meat market. The firm developed its own independent nationwide logistics structure to enhance the quality of its meat and the efficiency of delivery. Within its structure, NH Foods Group maintains two of Japan’s largest distribution centres and international distribution centres. It sells meat products through 117 sites in major cities such as Tokyo, Yokohama, Sapporo, and Osaka.32 There are also small-scale domestic companies that set up smaller breeding farms and their own butcher shops to distribute their meat.
While domestic distributors sell their meat through retail supermarkets, restaurants and meat markets, recent developments in online service have also prompted them to turn to independent e-retailers. For instance, Shingaki Meats Inc., which was founded 70 years ago as a butcher shop, has worked with around 400 businesses including bars, restaurants, and hotels. However, today, alongside its in-person services, the firm distributes meat online with items for sale on its personal website, Rakuten Market, Yahoo Shopping, and Amazon.33 Independent meat e-retailers, such as Whole Meat and The Meat Guy, are also present in Japan’s meat distribution chain.34,35
For international and domestic distributors, the e-commerce market is a necessary step to compete, as Japan has one of the biggest as well as fastest-growing e-commerce markets in the world. International businesses cannot join the e-commerce market directly. If a company is non-American and would like to register a seller account, both Rakuten and Yahoo Shopping require that companies either start a local company or use a local agency as an intermediary. Amazon, however, provides an easier opportunity for international distributors to penetrate the market by letting them list their own seller account.
31 Wortley K, 2019, “Japanese demand continues to outstrip supply,” Food Navigator-Asia.com, 11 June, available at https://www.globalmeatnews.com/Article/2019/06/11/Japanese-demand-continues-to-outstrip-domestic-supply. 32 https://www.nipponham.co.jp/eng/group/business/meats.html (accessed 23 October 2021). 33 https://shingaki-net.co.jp/en/shop.html (accessed 23 October 2021). 34 https://www.themeatguy.jp/en/ (accessed 23 October 2021). 35 https://wholemeat.jp/ (accessed 23 October 2021).
Analysis of Key Destination Markets for Mongolian Meat Exporters
17
In 2020, Japan was named the fourth-largest e-commerce market worldwide, with annual sales of US$79 billion, only behind China, the United States and the United Kingdom.36 According to Statista, revenue from Japanese e-commerce was projected to reach US$98.9 billion by the end of 2020. In addition, engagement in the e-commerce market for Japan is constantly expanding, as user penetration was 76.7 per cent in 2020 and is expected to hit 86.7 per cent by 2024.37 The market shows potential, with an annual growth rate of 6.8 per cent, which will result in a projected market volume of US$128 billion by 2024. Within the market, the largest segment is food & personal care, including meat and meat-related products, with a projected market volume of US$25.9 billion in 2020.38
3.2.3.2 Logistics and transportation options
Air freight: As Japan does not have access to land transportation and Mongolia cannot provide sea transportation, the sole channel of transportation for Mongolia to ship its goods is by air. In 2019, according to data provided by the General Customs Office of Mongolia, Mongolia exported a total of 1,532 kg of meat to Japan. The total value of the exports was US$16,894.
3.2.4 Establishing a commercial partnership in Japan
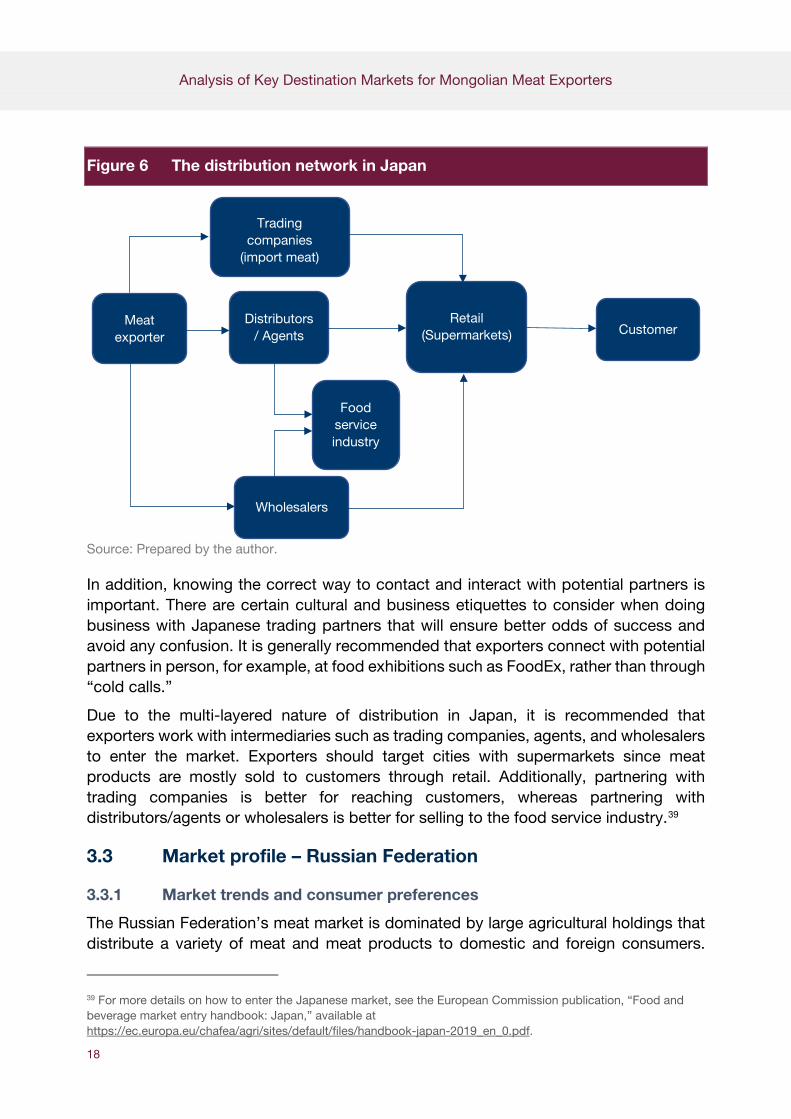
To enter the Japanese meat market, exporters must either establish an office in Japan or partner with an intermediary. While establishing an office provides direct contact with customers and business partners, a partnership with an intermediary provides support service and guidance in developing the right market entry strategy. Since distribution in Japan is multi-layered, with multiple “middlemen” involved, intermediary companies are vital to reaching customers. As shown in figure 6, there are several different ways to enter the Japanese meat market. However, retailers most often purchase meat from trading companies that form vertical Keiretsu, large groups of related companies that dominate Japan’s sales and distribution in certain industries.
Choosing the right partner to work with is a crucial part of entering the Japanese meat market. Meat exporters need to match the strengths of a potential partner’s network to their product. Also, the Japanese Meat Trading Association may help try to identify a suitable trader. In terms of logistics and transportation, road freight and shipping are the most widely used.
36 Business.com, 2020, “The 10 largest E-commerce markets in the world by country,” 14 April, available at https://www.business.com/articles/10-of-the-largest-ecommerce-markets-in-the-world-b/ 37 https://www.statista.com/outlook/243/121/ecommerce/japan (accessed 23 October 2021). 38 Ibid.
Analysis of Key Destination Markets for Mongolian Meat Exporters
18
Figure 6 The distribution network in Japan
Source: Prepared by the author.
In addition, knowing the correct way to contact and interact with potential partners is important. There are certain cultural and business etiquettes to consider when doing business with Japanese trading partners that will ensure better odds of success and avoid any confusion. It is generally recommended that exporters connect with potential partners in person, for example, at food exhibitions such as FoodEx, rather than through “cold calls.”
Due to the multi-layered nature of distribution in Japan, it is recommended that exporters work with intermediaries such as trading companies, agents, and wholesalers to enter the market. Exporters should target cities with supermarkets since meat products are mostly sold to customers through retail. Additionally, partnering with trading companies is better for reaching customers, whereas partnering with distributors/agents or wholesalers is better for selling to the food service industry.39
3.3 Market profile – Russian Federation
3.3.1 Market trends and consumer preferences
The Russian Federation’s meat market is dominated by large agricultural holdings that distribute a variety of meat and meat products to domestic and foreign consumers.
39 For more details on how to enter the Japanese market, see the European Commission publication, “Food and beverage market entry handbook: Japan,” available at https://ec.europa.eu/chafea/agri/sites/default/files/handbook-japan-2019_en_0.pdf.
Trading companies
(import meat)
Meat exporter
Distributors/ Agents
Retail (Supermarkets) Customer
Wholesalers
Food service industry
Analysis of Key Destination Markets for Mongolian Meat Exporters
19
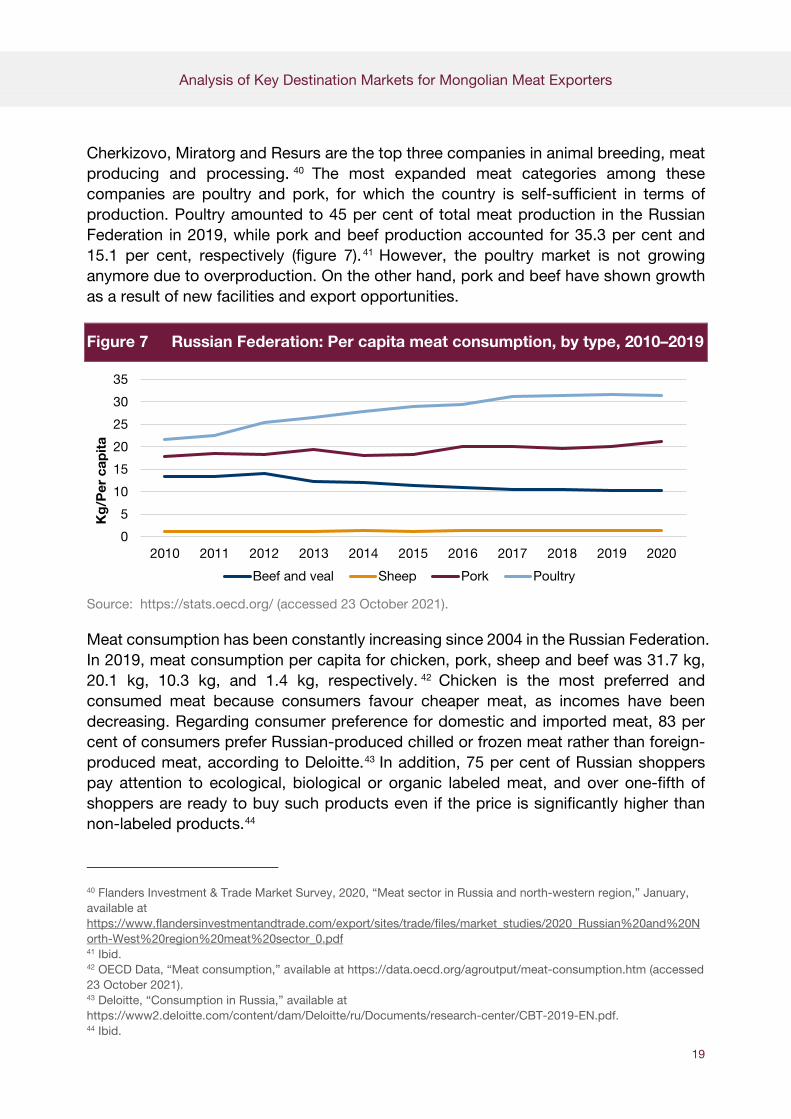
Cherkizovo, Miratorg and Resurs are the top three companies in animal breeding, meat producing and processing. 40 The most expanded meat categories among these companies are poultry and pork, for which the country is self-sufficient in terms of production. Poultry amounted to 45 per cent of total meat production in the Russian Federation in 2019, while pork and beef production accounted for 35.3 per cent and 15.1 per cent, respectively (figure 7). 41 However, the poultry market is not growing anymore due to overproduction. On the other hand, pork and beef have shown growth as a result of new facilities and export opportunities.
Figure 7 Russian Federation: Per capita meat consumption, by type, 2010–2019
Source: https://stats.oecd.org/ (accessed 23 October 2021).
Meat consumption has been constantly increasing since 2004 in the Russian Federation. In 2019, meat consumption per capita for chicken, pork, sheep and beef was 31.7 kg, 20.1 kg, 10.3 kg, and 1.4 kg, respectively. 42 Chicken is the most preferred and consumed meat because consumers favour cheaper meat, as incomes have been decreasing. Regarding consumer preference for domestic and imported meat, 83 per cent of consumers prefer Russian-produced chilled or frozen meat rather than foreign-produced meat, according to Deloitte.43 In addition, 75 per cent of Russian shoppers pay attention to ecological, biological or organic labeled meat, and over one-fifth of shoppers are ready to buy such products even if the price is significantly higher than non-labeled products.44
40 Flanders Investment & Trade Market Survey, 2020, “Meat sector in Russia and north-western region,” January, available at https://www.flandersinvestmentandtrade.com/export/sites/trade/files/market_studies/2020_Russian%20and%20North-West%20region%20meat%20sector_0.pdf 41 Ibid. 42 OECD Data, “Meat consumption,” available at https://data.oecd.org/agroutput/meat-consumption.htm (accessed 23 October 2021). 43 Deloitte, “Consumption in Russia,” available at https://www2.deloitte.com/content/dam/Deloitte/ru/Documents/research-center/CBT-2019-EN.pdf. 44 Ibid.
0
5
10
15
20
25
30
35
2010 2011 2012 2013 2014 2015 2016 2017 2018 2019 2020
Kg
/Per
cap
ita
Beef and veal Sheep Pork Poultry
Analysis of Key Destination Markets for Mongolian Meat Exporters
20
3.3.2 Meat imports
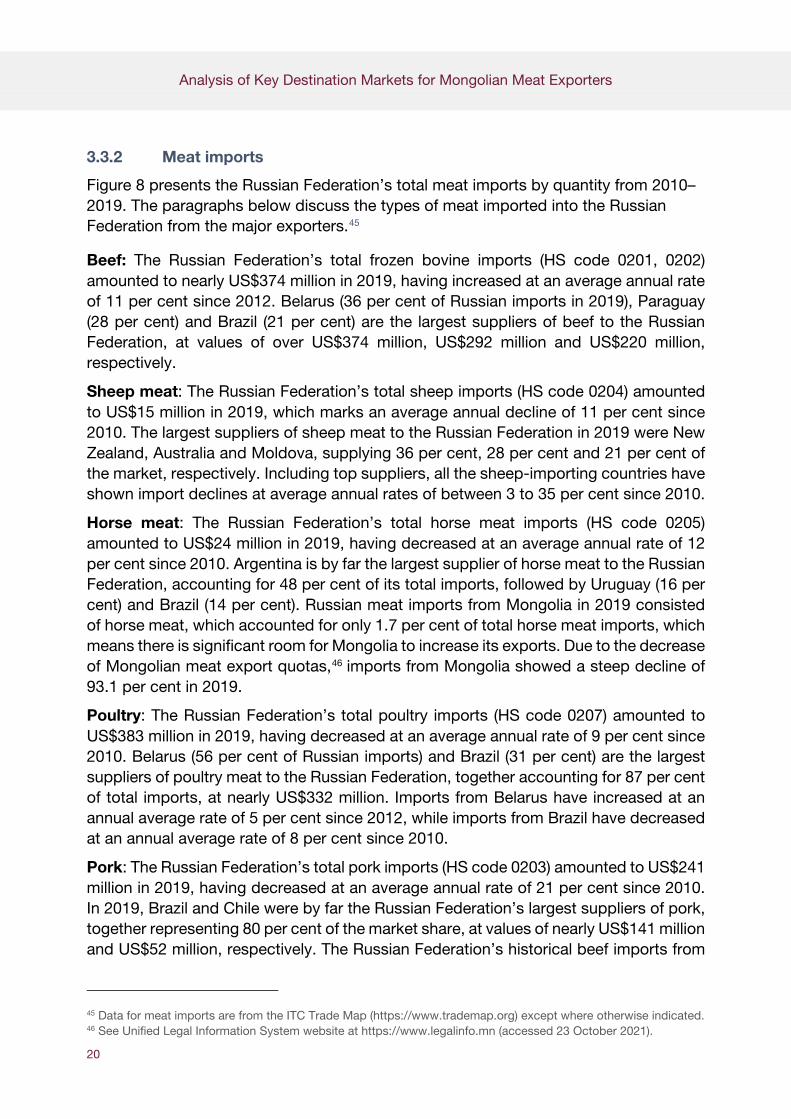
Figure 8 presents the Russian Federation’s total meat imports by quantity from 2010–2019. The paragraphs below discuss the types of meat imported into the Russian Federation from the major exporters.45
Beef: The Russian Federation’s total frozen bovine imports (HS code 0201, 0202) amounted to nearly US$374 million in 2019, having increased at an average annual rate of 11 per cent since 2012. Belarus (36 per cent of Russian imports in 2019), Paraguay (28 per cent) and Brazil (21 per cent) are the largest suppliers of beef to the Russian Federation, at values of over US$374 million, US$292 million and US$220 million, respectively.
Sheep meat: The Russian Federation’s total sheep imports (HS code 0204) amounted to US$15 million in 2019, which marks an average annual decline of 11 per cent since 2010. The largest suppliers of sheep meat to the Russian Federation in 2019 were New Zealand, Australia and Moldova, supplying 36 per cent, 28 per cent and 21 per cent of the market, respectively. Including top suppliers, all the sheep-importing countries have shown import declines at average annual rates of between 3 to 35 per cent since 2010.
Horse meat: The Russian Federation’s total horse meat imports (HS code 0205) amounted to US$24 million in 2019, having decreased at an average annual rate of 12 per cent since 2010. Argentina is by far the largest supplier of horse meat to the Russian Federation, accounting for 48 per cent of its total imports, followed by Uruguay (16 per cent) and Brazil (14 per cent). Russian meat imports from Mongolia in 2019 consisted of horse meat, which accounted for only 1.7 per cent of total horse meat imports, which means there is significant room for Mongolia to increase its exports. Due to the decrease of Mongolian meat export quotas,46 imports from Mongolia showed a steep decline of 93.1 per cent in 2019.
Poultry: The Russian Federation’s total poultry imports (HS code 0207) amounted to US$383 million in 2019, having decreased at an average annual rate of 9 per cent since 2010. Belarus (56 per cent of Russian imports) and Brazil (31 per cent) are the largest suppliers of poultry meat to the Russian Federation, together accounting for 87 per cent of total imports, at nearly US$332 million. Imports from Belarus have increased at an annual average rate of 5 per cent since 2012, while imports from Brazil have decreased at an annual average rate of 8 per cent since 2010.
Pork: The Russian Federation’s total pork imports (HS code 0203) amounted to US$241 million in 2019, having decreased at an average annual rate of 21 per cent since 2010. In 2019, Brazil and Chile were by far the Russian Federation’s largest suppliers of pork, together representing 80 per cent of the market share, at values of nearly US$141 million and US$52 million, respectively. The Russian Federation’s historical beef imports from
45 Data for meat imports are from the ITC Trade Map (https://www.trademap.org) except where otherwise indicated. 46 See Unified Legal Information System website at https://www.legalinfo.mn (accessed 23 October 2021).
Analysis of Key Destination Markets for Mongolian Meat Exporters
21
Brazil have shown an average annual decline of 16 per cent since 2010. In contrast, imports from Chile have been increasing at an average annual rate of 31 per cent. The Russian Federation’s imports from its third-biggest supplier, Argentina, have shown a steep average annual increase of over 89 per cent since 2010.
Figure 8 Russian Federation: Total meat imports, by quantity, 2010–2019
Source: ITC Trade Map (https://www.trademap.org/), accessed 23 October 2021.
3.3.3 Trade channels and transportation
3.3.3.1 Meat distribution
The Russian Federation’s meat market has a large range of distribution, with marketing channels differing significantly across the country. According to the Federal State Statistics Service, most domestically produced meat is distributed to processors (63.3 per cent) and wholesalers (21.8 per cent), while 6.8 per cent of the production is marketed by the state, 4.1 per cent is sold through retail stores, and the remaining 3.3 per cent is retailed by hotels, restaurants and cafes.47 Meat products are a large part of the retail food market. The Russia Federation’s local producers usually supply to large retail chains such as X5-Retail Group, Magnit, Seventh Continent, Dixie, Auchan and German Metro AG. There are also open markets where frozen meats are marketed, farmers’ markets where fresh meat is sold, and branded company stores where processed meat products are retailed. Correspondingly, the country’s modern retail trade sells 30 per cent of all meat and meat products, on average.48 The retail share is higher in big cities: 50 per cent in Moscow and 80 per cent in St. Petersburg.
The bulk of imported poultry goes into retail and is mainly sold on open markets and in small stores in rural areas. Ten per cent of imported poultry is processed, and the
47 FAO Investment Centre, 2014, “Russian Federation: Meat sector review,” available at http://www.fao.org/3/a-i3533e.pdf. 48 Ibid.
-
500
1’000
1’500
2’000
2’500
2010 2011 2012 2013 2014 2015 2016 2017 2018 2019
Tho
usan
ds
of
tons
Bovine Sheep or Goats
Analysis of Key Destination Markets for Mongolian Meat Exporters
22
remaining amount is channelled through retail stores. For imported beef and pork, over 80 per cent goes into further processing, as they come frozen.
3.3.4 Establishing a commercial partnership in the Russian Federation
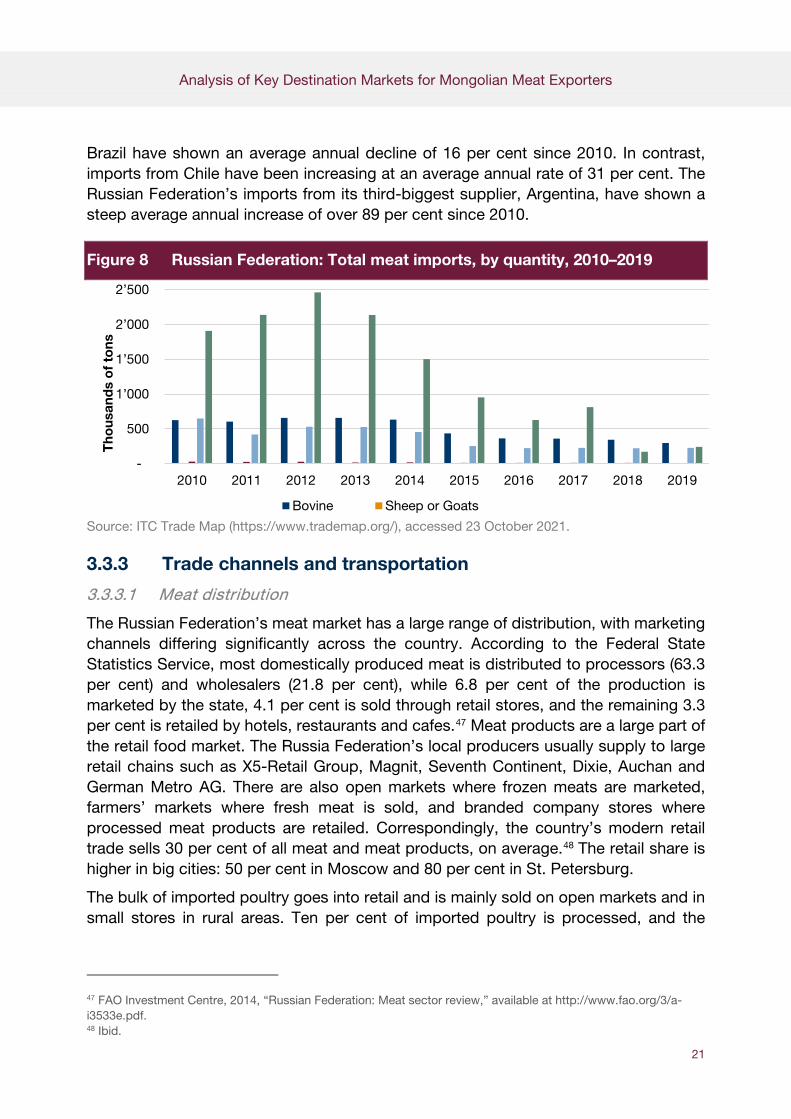
To establish an export channel to the Russian Federation (figure 9), it is vital to understand the country’s the legal environment. Despite the country’s accession to the World Trade Organization in 2012, Russian agency control over imported food remains complex and bureaucratic.
Food importers’ offices and warehouses are mostly located in the port cities of St. Petersburg and Vladivostok, or in Moscow, the capital and the main centre of consumption. Food processing facilities are located in most Russian regions, but larger factories are located in the Central/Southern and Ural parts of the country near urban areas. Most of the inter-regional delivery across the Russian Federation is done by truck. The railroad is used occasionally for long-distance deliveries. The eastern and western parts of the Russian Federation are 6,000 miles apart and therefore often operate as independent markets with separate channels of supply and distribution.
Figure 9 The distribution network in the Russian Federation
Source: Prepared by the author.
3.4 Market profile – Viet Nam
3.4.1 Market trends and consumer preferences
Viet Nam’s fast-growing economy, along with its rising population, urbanization and income, have been increasing the demand for and consumption of meat over the years. In addition, better health and food safety awareness, the advancement of distribution channels, and increased diversity of meat and meat products from imports are effectively contributing to the growth of the meat sector.49 The country’s average volume
49 EU-Viet Nam Business Network, “Viet Nam meat sector: Edition 2016,” Research Report, available at https://www.flandersinvestmentandtrade.com/export/sites/trade/files/attachments/EVBN-MEAT-REPORT-2016.pdf.
Exporter
Russian importer
Processor
Food retail Consumer

Analysis of Key Destination Markets for Mongolian Meat Exporters
23
of meat consumption per capita was 56.8 kg in 2020 and it is expected to increase steadily until 2025,50 with poultry and pork showing the largest increase.
Accordingly, pork plays a major role in the Vietnamese meat market, as many traditional dishes are made from pork. It accounts for three-quarters of animal proteins in the Vietnamese diet. Demand for pork consumption was about 2.2 million tons in 2018, an increase of 1.8 per cent from 2017.51 The domestic meat production market is highly competitive. The largest three companies in producing, processing and trading meat products in Viet Nam are VISSAN Company, Dobaco Group and Ha Long Canned Food Joint Stock Corporation.52
Most consumers in Viet Nam prefer to buy fresh meat from traditional wet markets, and it is not popular to buy processed or frozen meat from supermarkets and convenience stores. This is due to Vietnamese people favouring freshness of meat to eat on a daily basis. However, this practice has been declining, as the modern retail market is growing fast in urban areas for younger people. Vietnamese consumers also prioritize meat quality for health concerns. As a result, the demand for lean pork has been increasing, in contrast to high-fat pork. However, buying better-quality meats mainly depends on people’s income. Low- and middle-income consumers usually purchase meat from traditional markets at a favourable price, while high-income people in urban areas are able to pay for high-quality meats and imported meats. Furthermore, consumers in Viet Nam enjoy meats that have a light colour, no odour, and have consistency and freshness, so pork is indeed preferred.53
The increasing demand for meat has also increased meat imports. The value of imported meat in Viet Nam doubled from 2010 to 2014, 54 particularly frozen bovine meat. Accordingly, in recent years, imported meats have been attracting more customers and challenging the domestic livestock industry, as foreign production is highly developed and cost-efficient compared to domestic productions.
3.4.2 Meat imports
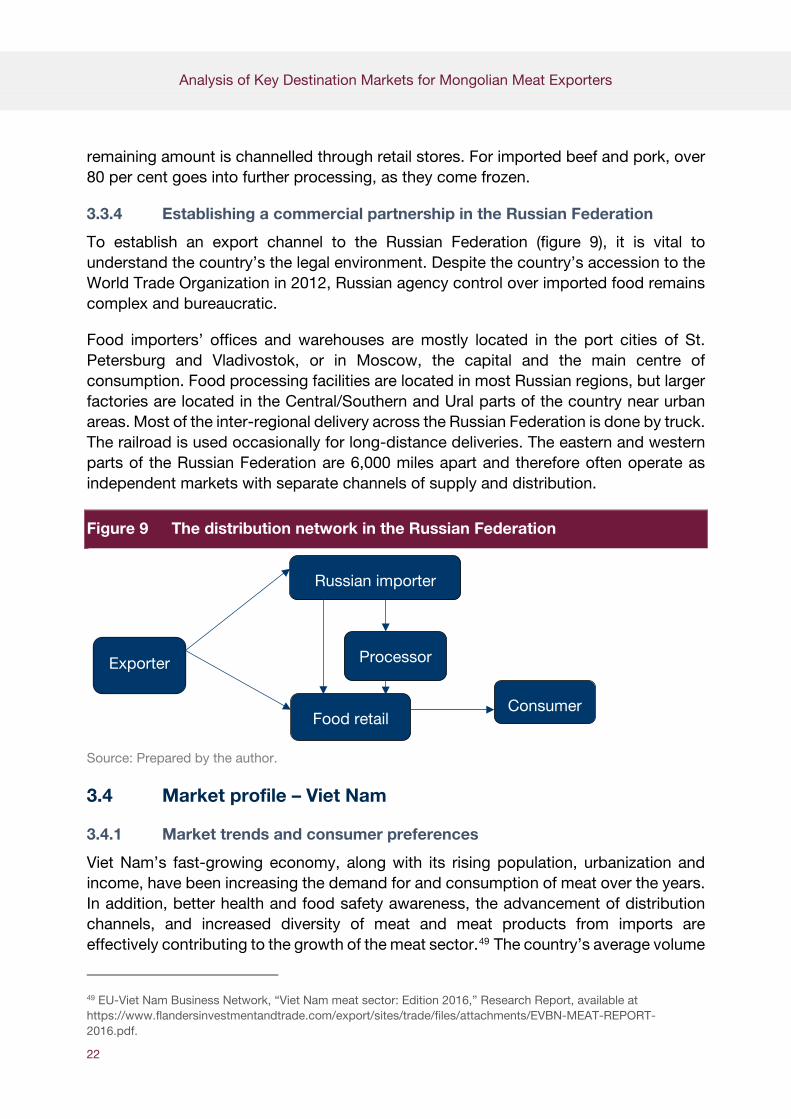
Figure 10 presents Viet Nam’s total meat imports by quantity from 2010–2019. The paragraphs below discuss the types of meat imported into Viet Nam from the major exporters.55
50 Statista, “Fresh meat,” available at https://www.statista.com/outlook/40141000/127/fresh-meat/vietnam#market-volume (accessed 23 October 2021). 51 https://busy.org/@nguyentrung/about-meat-industry-in-vietnam (accessed 23 October 2021). 52 EU-Viet Nam Business Network, “Viet Nam meat sector: Edition 2016,” Research Report, available at https://www.flandersinvestmentandtrade.com/export/sites/trade/files/attachments/EVBN-MEAT-REPORT-2016.pdf. 53 Ibid. 54 IPSOS Business Consulting, undated, “Viet Nam meat market,” available at https://www.ipsos.com/sites/default/files/2016-08/meat-market-in-vietnam.pdf 55 Data for meat imports are from the ITC Trade Map (https://www.trademap.org) except where otherwise indicated.
Analysis of Key Destination Markets for Mongolian Meat Exporters
24
Beef: Viet Nam’s total frozen bovine imports (HS code 0201, 0202) amounted to nearly US$244 million in 2018, having increased at an average annual rate of 29 per cent since 2010. In 2018, the largest beef suppliers to Viet Nam were India (US$84 million), Australia (US$71 million) and the United States (US$70 million), which accounted for 34.9 per cent, 29.1 per cent, and 28.9 per cent of total meat imports, respectively. Imports from the United States have increased rapidly at an annual average rate of 44 per cent since 2010, while Australia has had annual average growth of 31 per cent. India has had a moderate increase in beef supply to Viet Nam, with annual average growth of 22 per cent since 2010.
Sheep meat: Viet Nam’s total sheep imports (HS code 0204) amounted to US$5.7 million in 2018, having increased at an average annual rate of 2.9 per cent since 2010. Australia and New Zealand supplied all of Viet Nam’s sheep meat imports in 2018, accounting for 78 per cent and 21 per cent of total imports, respectively. Imports from Australia saw annual average growth of 2.1 per cent while New Zealand saw annual average growth of 9.8 per cent.
Figure 10 Viet Nam: Total meat imports, by quantity, 2010–2019
Source: ITC Trade Map (https://www.trademap.org/), accessed 23 October 2021.
Poultry: Viet Nam’s total poultry imports (HS code 0207) amounted to US$186 million in 2018, having increased at an average annual rate of 13 per cent since 2010. The United States is the largest supplier of poultry meat to Viet Nam, accounting for over 49 per cent of total imports, at nearly US$91 million. Imports from the United States have increased at an annual average rate of 5.9 per cent since 2010.
Pork: Viet Nam’s total pork imports (HS code 0203) amounted to US$28 million in 2018. Brazil (41.8 per cent of Viet Nam’s imports) and Poland (25.9 per cent) are the largest suppliers of pork to Viet Nam, at values of over US$12 million and US$7 million, respectively.
0
10
20
30
40
50
60
70
2010 2011 2012 2013 2014 2015 2016 2017Tho
usan
ds
of
tons
Bovine Sheep or Goats

Analysis of Key Destination Markets for Mongolian Meat Exporters
25
3.4.3 Trade channels and transportation
3.4.3.1 Meat distribution
Viet Nam’s meat supply chain consists of several contributors, including livestock farms, slaughterhouses, retailers, processors and consumers.56 Small-scale livestock farms dominate the country’s meat production, which maintains its own distribution channels with processors, wholesalers, retailers, and hotels, restaurants and cafes. According to a study conducted by the Viet Nam National University of Agriculture in 2015 on the country’s pig supply chain, about 55.8 per cent of the pork produced from farms was distributed to slaughterhouses, while 41.6 per cent was shipped to collectors, who further retailed the meat to consumers. The remaining 2.6 per cent was processed by livestock farms themselves and then marketed to consumers in the neighbourhood. With regard to slaughterhouses, 64.8 per cent of the slaughtered pig meat was distributed to retailers, 31.2 per cent directly sold to consumers, and the remaining 4 per cent dispensed to processors.
The percentage of meat that goes to distribution channels differs with different types of meat. As reported by the Consultative Group for International Agricultural Research, in 2011, 49.7 per cent of pork and 31 per cent of poultry was sent to slaughterhouses, while 12.9 per cent of poultry and cattle, and 6.4 per cent of buffalo, cows, goats and sheep, was distributed to slaughterhouses.
Retailers are a major part of the meat marketing industry in Viet Nam. Most fresh meats are distributed to wet markets after being slaughtered, as these markets are a popular traditional retail channel among Vietnamese people. The biggest wet markets are Dong Xuan Market and Ben Thanh Market. In 2017, there were about 9,000 wet markets and 800 supermarkets in the country.57 Frozen and processed meats that are not in high demand in Viet Nam are usually distributed to super/hypermarkets and convenience stores.
Regarding imported food products including meat, there are three most-used practices in the field of distribution. Food products including meat are either directly distributed from exporters to food processors; first distributed to local importers/distributors and then dispensed to processors; or first allocated to local importers, and then further distributed to wholesalers, traditional or modern sales channels, and small food processors.58
56 EU-Viet Nam Business Network, “Viet Nam meat sector: Edition 2016,” Research Report, available at https://www.flandersinvestmentandtrade.com/export/sites/trade/files/attachments/EVBN-MEAT-REPORT-2016.pdf. 57 https://en.wikipedia.org/wiki/Wet_market#cite_note-vne-142 (accessed 23 October 2021). 58 EU-Viet Nam Business Network, “Viet Nam meat sector: Edition 2016,” Research Report, available at https://www.flandersinvestmentandtrade.com/export/sites/trade/files/attachments/EVBN-MEAT-REPORT-2016.pdf.

Analysis of Key Destination Markets for Mongolian Meat Exporters
26
3.4.3.2 Logistics and transportation options
Land freight: Most meat products exported to Viet Nam from Mongolia are transported by road to Vladivostok and then via sea freight to Viet Nam. In 2019, a total of 1,284 tons of meat was exported to Viet Nam.
Rail freight: A small amount of meat products are exported to Viet Nam from Mongolia by railways. In 2019, 374 tons of meat was exported to Viet Nam by rail freight.
3.4.4 Establishing a commercial partnership in Viet Nam
When breaking into the Vietnamese meat market, exporters must be aware that imports of meat can only officially be undertaken by a Vietnamese company that is approved as a trader in meat and poultry products. Hence, whichever end-consumer distribution channel is of primary interest, the identification of a suitable, approved partner is crucial. As shown in figure 11, there are several ways for meat exporters to enter the Vietnamese market. Meat exporters can distribute directly to the food service industry/food processors, to importers who distribute to the foodservice industry and/or wholesalers and retailers, or to supermarket chains. Among these options, the EU report “Food and Beverage Market Entry Handbook: Viet Nam” recommends distributing to importers because they already have distribution networks in place throughout the country.59
Most importers are primarily located in Hanoi and Hồ Chí Minh City and focus on the north and south regions of Viet Nam. Hồ Chí Minh City is the most attractive location for imported meat products due to its large great number of modern retail stores and a large foreign population.
If meat exporters in Mongolia want to enter the Vietnamese market, they need to establish a partnership with an importer in either Hanoi or Hồ Chí Minh City. These two locations are ideal not only due to their high consumer concentration but also their proximity to large ports. Once a partnership is established, the importer will deal with distribution to wholesalers, retailers and food processors. Furthermore, it is crucial to match the strength of a potential partner’s network to the product one is exporting and maintain a good relationship.
In terms of logistics and transportation, the most widely used are road freight and shipping. Shipping is an important route for goods entering Viet Nam, as there are 320 ports throughout the country. There are three regional hubs for transporting goods:
• North region: Hai Phong port.
• Central region: Da Nang, Qui Nhơn and Cảng Vũng Áng.
59 The report is available at https://ec.europa.eu/chafea/agri/en/food-and-beverage-market-entry-handbook-vietnam (accessed 23 October 2021).

Analysis of Key Destination Markets for Mongolian Meat Exporters
27
• South region: A network of ports around Hồ Chí Minh City together create the fifth largest port in the Association of Southeast Asian Nations region and account for around two-thirds of port shipments in Viet Nam. Ports include Cai Mep (deep water) and Cat Lai. Road freight is the most popular method of transporting goods in Viet Nam, accounting for three-quarters of total freight transport. The road network is 250,000 km, one-fifth of which is paved.
Figure 11 The distribution network in Viet Nam
Source: Prepared by the author.
In addition to identifying the right partner and figuring out logistics, knowing the correct way to contact and interact with potential business partners is important. Some key factors to consider in Vietnamese culture are:
• Face-to-face meetings are preferred.
• It is important to address names correctly (starting with the surname, followed by the middle name and then the first name if Vietnamese).
• It is important to “save face,” which often means avoiding confrontation rather than directly and publicly tackling issues.
• The normal practice is to arrange meetings a week in advance.
• The Vietnamese place a high emphasis on personal relationships, s one can expect the first few meetings to revolve around building a relationship.
• A common practice is to give gifts, such as fruit or flowers, when meeting to show appreciation.
• Elders attending any meeting should be respected.
• When greeting, it is advisable to shake both hands, maintain eye contact, and bow your head slightly.
Meat exporter
Food service industry/Food
processor
Importer Customer Wholesaler/ retailer
Large supermarket
chains
Analysis of Key Destination Markets for Mongolian Meat Exporters
28
• When giving or receiving a business card, it is advisable to do so with both hands and to look at the card carefully.
• Being late is considered rude.
• It is advisable not to cross your arms or stand with hands on your hips, and to use the whole hand, not one finger, to point.
• Documents should be presented in Vietnamese, and a Vietnamese interpreter should be brought to a meeting.
3.5 Market profile – Kazakhstan
3.5.1 Market trends and consumer preferences
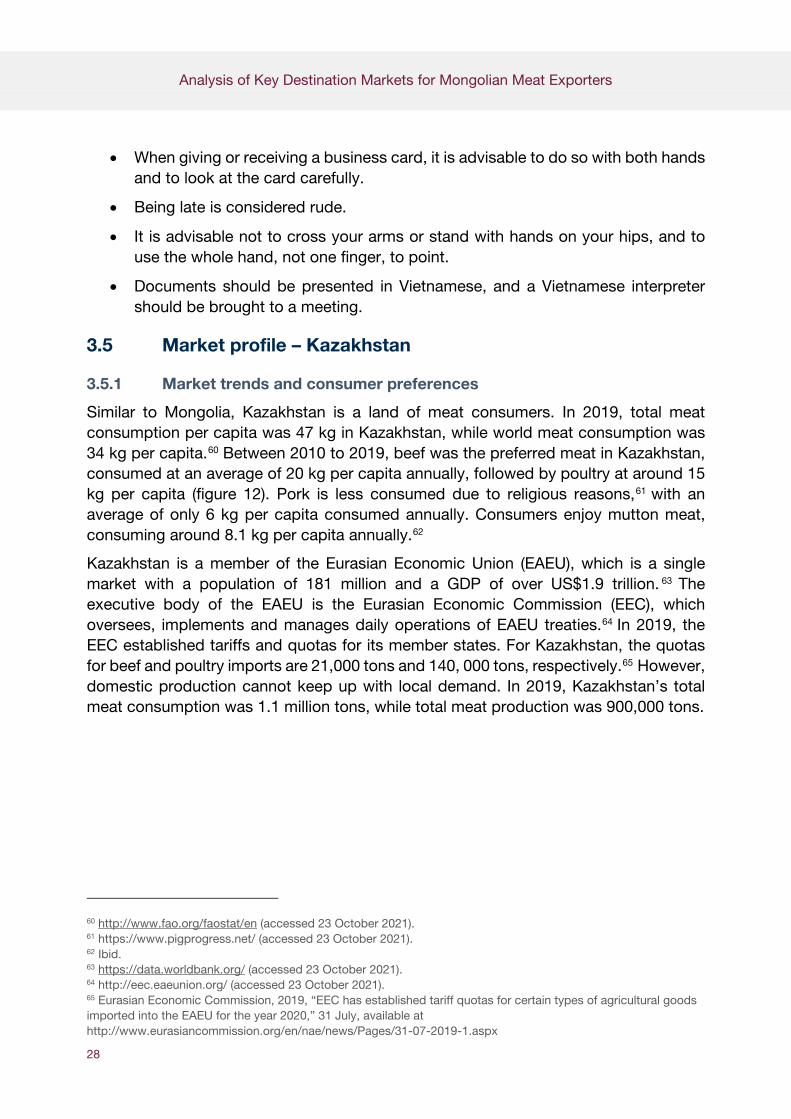
Similar to Mongolia, Kazakhstan is a land of meat consumers. In 2019, total meat consumption per capita was 47 kg in Kazakhstan, while world meat consumption was 34 kg per capita.60 Between 2010 to 2019, beef was the preferred meat in Kazakhstan, consumed at an average of 20 kg per capita annually, followed by poultry at around 15 kg per capita (figure 12). Pork is less consumed due to religious reasons,61 with an average of only 6 kg per capita consumed annually. Consumers enjoy mutton meat, consuming around 8.1 kg per capita annually.62
Kazakhstan is a member of the Eurasian Economic Union (EAEU), which is a single market with a population of 181 million and a GDP of over US$1.9 trillion. 63 The executive body of the EAEU is the Eurasian Economic Commission (EEC), which oversees, implements and manages daily operations of EAEU treaties.64 In 2019, the EEC established tariffs and quotas for its member states. For Kazakhstan, the quotas for beef and poultry imports are 21,000 tons and 140, 000 tons, respectively.65 However, domestic production cannot keep up with local demand. In 2019, Kazakhstan’s total meat consumption was 1.1 million tons, while total meat production was 900,000 tons.
60 http://www.fao.org/faostat/en (accessed 23 October 2021). 61 https://www.pigprogress.net/ (accessed 23 October 2021). 62 Ibid. 63 https://data.worldbank.org/ (accessed 23 October 2021). 64 http://eec.eaeunion.org/ (accessed 23 October 2021). 65 Eurasian Economic Commission, 2019, “EEC has established tariff quotas for certain types of agricultural goods imported into the EAEU for the year 2020,” 31 July, available at http://www.eurasiancommission.org/en/nae/news/Pages/31-07-2019-1.aspx
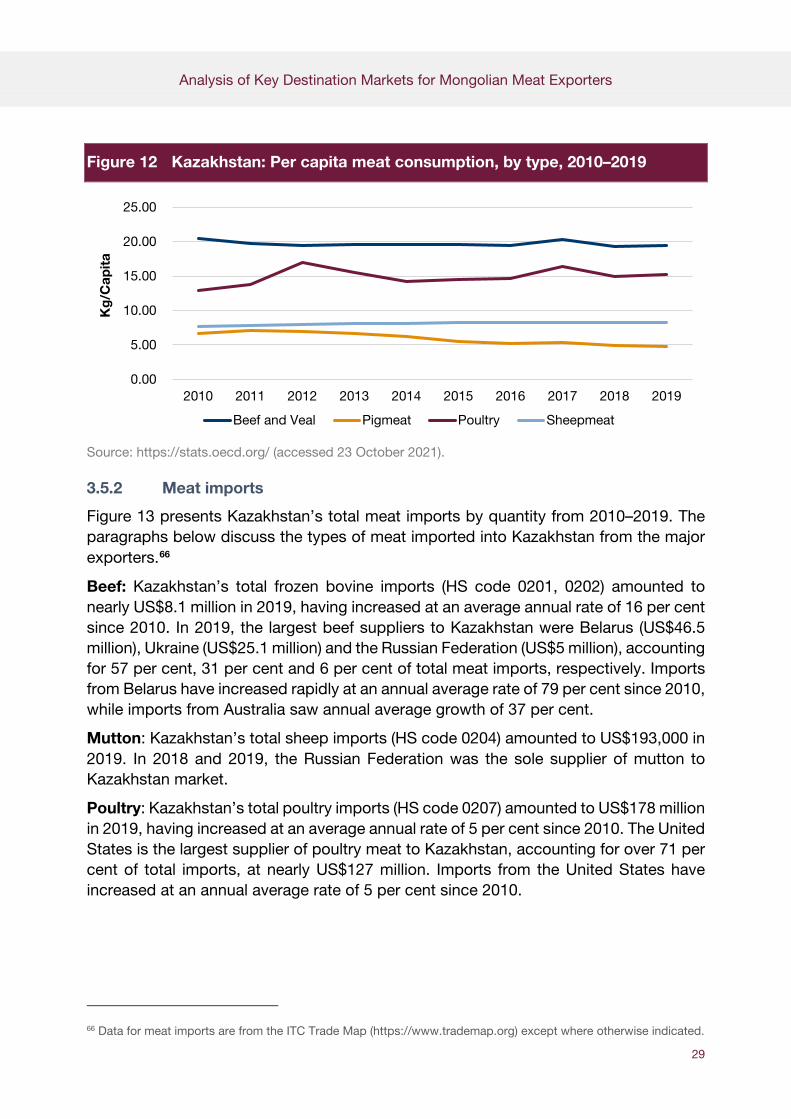
Analysis of Key Destination Markets for Mongolian Meat Exporters
29
Figure 12 Kazakhstan: Per capita meat consumption, by type, 2010–2019
Source: https://stats.oecd.org/ (accessed 23 October 2021).
3.5.2 Meat imports
Figure 13 presents Kazakhstan’s total meat imports by quantity from 2010–2019. The paragraphs below discuss the types of meat imported into Kazakhstan from the major exporters.66
Beef: Kazakhstan’s total frozen bovine imports (HS code 0201, 0202) amounted to nearly US$8.1 million in 2019, having increased at an average annual rate of 16 per cent since 2010. In 2019, the largest beef suppliers to Kazakhstan were Belarus (US$46.5 million), Ukraine (US$25.1 million) and the Russian Federation (US$5 million), accounting for 57 per cent, 31 per cent and 6 per cent of total meat imports, respectively. Imports from Belarus have increased rapidly at an annual average rate of 79 per cent since 2010, while imports from Australia saw annual average growth of 37 per cent.
Mutton: Kazakhstan’s total sheep imports (HS code 0204) amounted to US$193,000 in 2019. In 2018 and 2019, the Russian Federation was the sole supplier of mutton to Kazakhstan market.
Poultry: Kazakhstan’s total poultry imports (HS code 0207) amounted to US$178 million in 2019, having increased at an average annual rate of 5 per cent since 2010. The United States is the largest supplier of poultry meat to Kazakhstan, accounting for over 71 per cent of total imports, at nearly US$127 million. Imports from the United States have increased at an annual average rate of 5 per cent since 2010.
66 Data for meat imports are from the ITC Trade Map (https://www.trademap.org) except where otherwise indicated.
0.00
5.00
10.00
15.00
20.00
25.00
2010 2011 2012 2013 2014 2015 2016 2017 2018 2019
Kg
/Cap
ita
Beef and Veal Pigmeat Poultry Sheepmeat
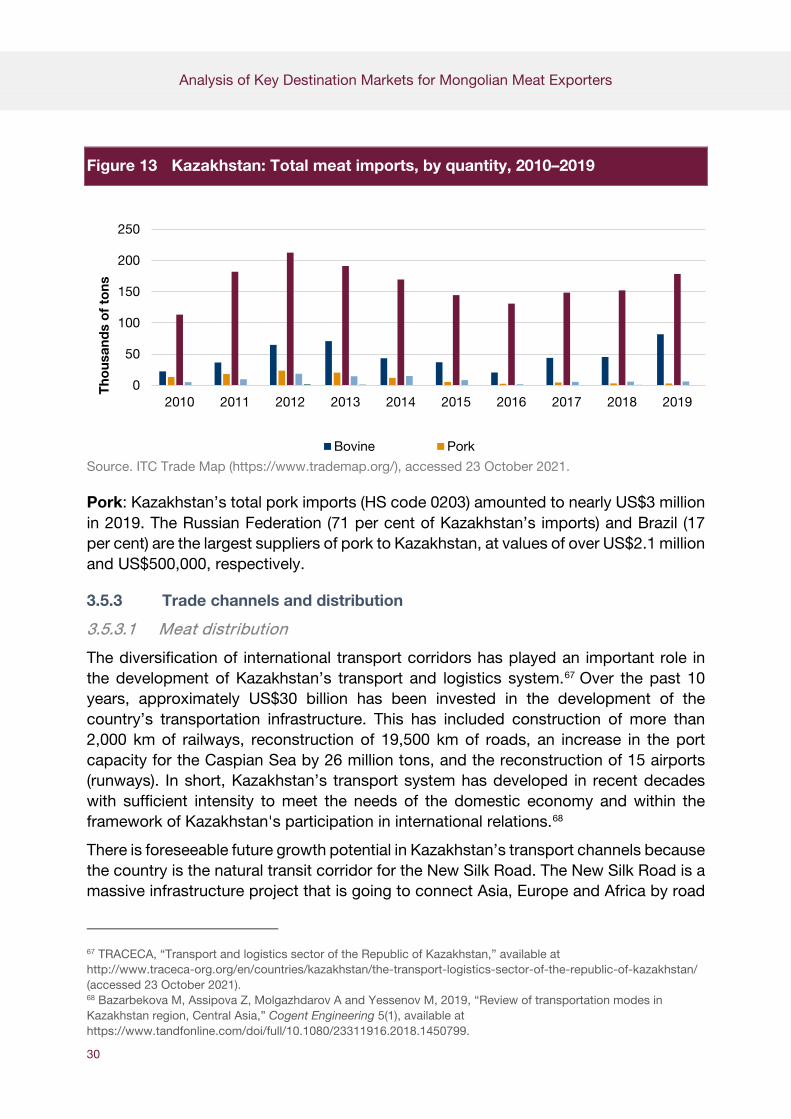
Analysis of Key Destination Markets for Mongolian Meat Exporters
30
Figure 13 Kazakhstan: Total meat imports, by quantity, 2010–2019
Source. ITC Trade Map (https://www.trademap.org/), accessed 23 October 2021.
Pork: Kazakhstan’s total pork imports (HS code 0203) amounted to nearly US$3 million in 2019. The Russian Federation (71 per cent of Kazakhstan’s imports) and Brazil (17 per cent) are the largest suppliers of pork to Kazakhstan, at values of over US$2.1 million and US$500,000, respectively.
3.5.3 Trade channels and distribution
3.5.3.1 Meat distribution
The diversification of international transport corridors has played an important role in the development of Kazakhstan’s transport and logistics system.67 Over the past 10 years, approximately US$30 billion has been invested in the development of the country’s transportation infrastructure. This has included construction of more than 2,000 km of railways, reconstruction of 19,500 km of roads, an increase in the port capacity for the Caspian Sea by 26 million tons, and the reconstruction of 15 airports (runways). In short, Kazakhstan’s transport system has developed in recent decades with sufficient intensity to meet the needs of the domestic economy and within the framework of Kazakhstan's participation in international relations.68
There is foreseeable future growth potential in Kazakhstan’s transport channels because the country is the natural transit corridor for the New Silk Road. The New Silk Road is a massive infrastructure project that is going to connect Asia, Europe and Africa by road
67 TRACECA, “Transport and logistics sector of the Republic of Kazakhstan,” available at http://www.traceca-org.org/en/countries/kazakhstan/the-transport-logistics-sector-of-the-republic-of-kazakhstan/ (accessed 23 October 2021). 68 Bazarbekova M, Assipova Z, Molgazhdarov A and Yessenov M, 2019, “Review of transportation modes in Kazakhstan region, Central Asia,” Cogent Engineering 5(1), available at https://www.tandfonline.com/doi/full/10.1080/23311916.2018.1450799.
0
50
100
150
200
250
2010 2011 2012 2013 2014 2015 2016 2017 2018 2019
Tho
usan
ds
of
tons
Bovine Pork

Analysis of Key Destination Markets for Mongolian Meat Exporters
31
and railway, in part through Kazakhstan.69 Kazakhstan can also benefit from both road and rail transportation by using new technologies. For instance, driverless trucks will revolutionize traditional transport by potentially cutting average transport time in half.70
Domestically, meat is primarily sold in Kazakhstan at city markets and local bazaars and supplied by intermediaries who procure it from herder households. Livestock farms in Kazakhstan are generally located within 100-200 kilometres from cities. Intermediaries usually buy and transport the livestock to the slaughterhouse and supply the meat to the local bazaars. This is the preferred shorter value chain due to its attractive price. In contrast, imported livestock meat is usually processed through Class A meat factories that have strict sanitary controls, and then distributed to groceries and supermarkets that target high-income urban consumers.
3.5.3.2 Logistics and transportation options
Land freight: Mongolia has always exported its meat to Kazakhstan by road.
Air freight: In October 2019, because of agreements made during the visit of the Prime Minister of Mongolia to Kazakhstan, 71 a change to the legal environment made it possible to export Mongolian mutton to Kazakhstan by air freight. Despite this opportunity, according to the General Customs Office, there has not been any meat exports to Kazakhstan since the agreement.
3.5.4 Establishing a commercial partnership in Kazakhstan
To establish an export channel to Kazakhstan, it is recommended that an exporter, with the help of up-to-date information, check all import documents closely and ensure that they do not violate the laws or product-specific regulations of Kazakhstan, including rules recently revised due to EAEU policies and the country’s accession to the World Trade Organization.
69 Tweed D, 2019, “China’s new silk road,” Bloomberg, 16 April, available at https://www.bloomberg.com/quicktake/china-s-silk-road 70 World Bank Group, 2017, “Creating markets in Kazakhstan country private sector diagnostic,” November, available at https://www.ifc.org/wps/wcm/connect/afc4fc4a-9caf-4066-a1ed-836267a97845/Kazakhstan-CPSD-2017.pdf?MOD=AJPERES&CVID=m03qk3E 71 See Gogo Mongolia at https://gogo.mn/r/dqk3l (accessed 23 October 2021).

Analysis of Key Destination Markets for Mongolian Meat Exporters
32
Figure 14 The distribution network in Kazakhstan
Source: Prepared by the author.
Since Mongolia does not have a border with Kazakhstan, the exported meat must be shipped through either the Russian Federation or China. Road and rail connections between the Russian Federation and Kazakhstan are fairly good, but there is no information about how Mongolian meat is being shipped to Kazakhstan through China. Also, there could be some difficulties such as no option for package tracking because the product is transiting through other countries before arriving in Kazakhstan.
In July 2019, the Mongolian government approved the Intergovernmental Agreement on International Road Transport along with the Asian Highway Network,72 which was an agreement within a program to establish the Mongolia-China-Russia Economic Corridor. This is significant for Kazakhstan and Mongolian relations, as it allows for easier passage for Mongolian exports into Kazakhstan.
Within Kazakhstan’s meat value chain, consumers are able to purchase their meat from two main sources (figure 14). The first is supermarkets, where the meat is obtained from a production chain that is held to high sanitary standards. The second is bazaars. Generally, meat sold at bazaars is inspected, but there is the risk that bazaar traders also sell cheaper uninspected meat. The nature of these different processes has an impact on prices. When entering the market, meat exporters must be aware of necessary health and sanitary regulations and decide upon which production channel their meat will pass through.
72 Intergovernmental Agreement on the Asian Highway Network, available at https://treaties.un.org/doc/source/events/2004/English_text.pdf
Exporter
Slaughterhouse
Live animal market
Supermarkets
Bazaars
Importer Food
services/ Processor
Consumers
Analysis of Key Destination Markets for Mongolian Meat Exporters
33
4 Conclusions and recommendations
4.1 Summary: Market profiles
4.1.1 Market trends and consumer preferences
The market trends and consumer preferences among the countries selected for this study differ considerably due to market and cultural disparities. However, all of the countries show substantial growth in demand for meat, and meat preferences overall are shifting rapidly due to changes in lifestyles. China is the largest meat importer, producer and consumer in the world, and continues to show fast growth in demand. Accordingly, due to the country’s constrained domestic meat production, imported meats are rapidly increasing there. Beef and mutton are the most preferred meats among the Chinese people, and fresher and healthier meat is favoured due to the increase in middle-class households.
For Japan’s meat sector, red meats including beef and pork dominate the market, and consumption of red meats has been growing despite a declining population. The Japanese diet has seen a major change in recent years due to rising income, the prominence of supermarkets, and trade liberalization. The traditional meat in Japan, fish, has been decreasing in supply and consumption, so demand for poultry as the alternative to fish is increasing. Furthermore, Japanese consumers have been shifting away from processed meats such as ham and sausage.
In the Russian Federation, meat consumption per capita has been growing steadily and will continue to do so in the future. Correspondingly, the production of meat, especially beef, has been improving due to new facilities. Poultry and pork are the most demanded and produced meats in the country, and poultry in particular is preferred among Russian consumers. Locally produced healthy meats are valued highly over imported meats.
Regarding Viet Nam’s meat industry, there is increasing demand for and consumption of meat as a result of a growing population, rising incomes, and urbanization. Pork is the most enjoyed meat and consumers favour fresh meats from traditional markets. However, modern retailers of frozen and processed meats are growing fast in the urban areas of the country. Additionally, consumers in Viet Nam perceive imported meats as having a better quality, so cheap imported meats have been challenging domestic production.
In Kazakhstan, unlike the other countries, pork is not consumed (for religious reasons) and is mainly used in sausage production. However, the consumption of other meat in Kazakhstan is relatively higher than the world average. As a meat-consuming country, Kazakhstan is struggling to keep up with local demand.
Analysis of Key Destination Markets for Mongolian Meat Exporters
34
4.1.2 Meat imports
Most imports into the selected markets consist of meat from South America, more specifically from Brazil and Argentina, as well as Australia and the United States. There is a pattern in the case of sheep meat, as New Zealand and Australia are the prominent suppliers for Japan, China, Viet Nam and the Russian Federation. Australia and the United States are the main suppliers of beef in Japan, Viet Nam, and the Russian Federation, but not China. This can be partially explained by China’s trade war with the United States, which has heavily increased tariffs on United States exports to China.
Similarly, in the case of poultry and pork, Brazil is the largest supplier for the selected markets. Uniquely, Belarus competes strongly with the dominant meat suppliers in the Russian meat market. Likewise, Mongolia does have the potential to play a similar role in the Chinese market. This conveys a need for Mongolia to maintain a steady supply of meat exports in order to compete within the selected markets.
Mongolia is chiefly known for the export of horse meat, being the main supplier of it to China. Russian and Kazakhstan imports from Mongolia consist only of horse meat. However, China also domestically produces horse meat and related products, but its horse meat exports to the Russian Federation only constitute 1.7 per cent of the Russian Federation’s total horse meat imports. Thus, Mongolia should strive to maintain its unique position in supplying horse meat to its neighbours and even amplify its export supply. Besides horse meat, Mongolia does not play a significant role in total meat exports in the selected markets. This may be due to the fact that Mongolia faces challenges in becoming a trusted supplier. The Japanese market does show promise, as Japan has agreed to remove tariffs on beef if Mongolia becomes free of foot-and-mouth disease.
As a member of the Eurasian Economic Commission, Kazakhstan is somewhat different from the other markets selected for this study. While the country imports mutton only from the Russian Federation, there is still excessive demand for mutton in Kazakhstan. The Mongolian government has recognized this opportunity by establishing the legal environment to export mutton to Kazakhstan at the Mongolian-Kazakh business forum.
4.1.3 Trade channels and transportation
Meat distribution among the countries is comparable to a certain extent. In China and Japan, meat and meat products are commonly retailed through e-commerce and traditional markets, including super/hypermarkets. In the Russian Federation, most produced meats are distributed to processors and wholesalers, which are further marketed to large retail chains. The large retailers are the most significant distribution channel in the country, while other small channels also exist, including open markets, farmers’ markets and branded company stores. Imported meats in Russia are usually marketed through open markets and small stores. In contrast, imported meats in Kazakhstan are distributed through groceries and supermarkets, after being processed in Class A meat factories that have strict sanitary controls. In Viet Nam, most produced

Analysis of Key Destination Markets for Mongolian Meat Exporters
35
meats are distributed to slaughterhouses and collectors, with most then further distributed to traditional wet markets that dominate the meat marketing industry. Imported meats in Viet Nam are usually distributed through local importers/distributors, food processors and wholesalers.
Since it is a landlocked country, Mongolia’s channels for trade are limited to mostly land and air freight. As a neighbour state to China and the Russian Federation, Mongolia needs to utilize land transportation to export its meat to those nations. Land transportation includes both railway and roadway transport. Viet Nam and Kazakhstan also receive their imports through land freight. Air freight is solely used when exporting to Japan. Having a heavy emphasis on land freight, Mongolia should concentrate on developing the necessary infrastructure to improve the efficiency of its land transportation.
4.2 Recommendations
4.2.1 Promote Mongolia’s meat and meat products at trade shows and events
Large-scale international trade shows and events are a significant mechanism to promote and expand businesses in all sectors. For the meat industry, various livestock, meat, agricultural and food trade fairs take place across countries, which is a considerable opportunity for Mongolian meat businesses and industry experts to promote domestically produced and processed meats as well as gain a better understanding of the industry and discover new products, technologies and equipment. Likewise, organizing adequate and extensive trade shows and festivals domestically could attract new international and domestic business partnerships, enhance the standards of the meat industry in Mongolia, promote opportunities in the country’s meat sector, and increase overall consumption.
Recommendations
• Encourage the participation of local individuals and businesses involved in the meat industry to take part in international trade fairs and festivals in order to access up-to-date innovations, learn from industry professionals, and connect with new consumers and partnerships. It would also be valuable for them to experience and understand how an international trade fair is arranged on a large scale.
• Organize and encourage local meat and agricultural trade shows and events in Mongolia in order to increase the competence of local producers, promote the market profile of Mongolia, encourage more people to take interest in the sector, and increase public awareness about the industry. Further, invite international organizations, consumers and experts to these events in order to increase the international profile of Mongolia’s meat businesses.
Analysis of Key Destination Markets for Mongolian Meat Exporters
36
• Create and arrange an international food/agricultural/meat trade fair in Mongolia with activities such as seminars and business meetings and matchings. Promote opportunities for local businesses to expand their businesses to international markets and establish foreign partnerships.
4.2.2 Distribute exported meat and meat products through strategic local partners
Foreign partnerships play an important role in exporting and distributing domestically produced meat to international markets. Local import distributors carry the responsibility for customs clearance, logistics, transportation, warehousing, managing orders, marketing and retailing, administering requests, contracts, and post-sale services. Consequently, it is crucial to select capable and devoted partners to successfully enter foreign markets and profitably export products.
Recommendations
• Raise awareness and provide advice on choosing competent foreign partnerships for local businesses.
• Create guidelines to encourage Mongolian exporters to develop a sufficient export marketing plan that includes detailed information regarding exporters’ offerings and objectives in target markets, preferred distribution channels, pricing levels, advertising methods, and expected results.
• Connect and network with Mongolia’s embassies and international organizations to gain information about leading import distributors in target markets, including conducting research on the distributors’ capabilities in terms of market coverage, consumer reach, distribution channels and promotion.
4.2.3 Explore alternative distribution models in export markets
Emerging e-retail markets in China and Japan present a number of marketing and distribution opportunities for Mongolian meat distributors who wish to access the market directly and sell meats to individual consumers instead of selling to intermediary meat processors. As such, developing their own brands and marketing Mongolian meat may facilitate an increase in interest to buy meat directly through online retailers.
Recommendations
• Research necessary regulatory requirements and qualifications needed to sell private-label products within the selected markets, especially through e-retail.
• Identify the capacity and willingness of Mongolian producers to supply traditional and emerging markets on the basis of private labels in order to encourage this approach.

Analysis of Key Destination Markets for Mongolian Meat Exporters
37
• Facilitate collaboration among domestic producers and capable international retailers through Mongolia’s embassies and international organizations.
• Invest in sustainability workshops and training sessions for Mongolian producers concerning food safety, quality management, product specifications, logistics and distribution for exporting to foreign markets.