mongodb for time series data
TRANSCRIPT

MongoDB for Time Series Data
Principal Technologist and Technical Director
Chris Biow
@chris_biow
#MongoDBTimeSeries
What is Time Series Data?

Time Series
A time series is a sequence of data points, typically
consisting of successive measurements made over a
time interval.
– Wikipedia j.mp/1yLbf1s
0 2 4 6 8 10 12
time

Time Series Data is Everywhere
• Financial markets pricing (stock ticks)
• Sensors (temperature, pressure, proximity)
• Industrial fleets (location, velocity, operational)
• Social networks (status updates)
• Mobile devices (calls, texts)
• Systems (server logs, application logs)

Time Series Data is Everywhere

• Tool for managing & monitoring MongoDB systems
– 100+ system metrics visualized and alerted
• 35,000+ MongoDB systems submitting data every 60
seconds
• 90% updates, 10% reads
• ~30,000 updates/second
• ~3.2B operations/day
• 8 x86-64 servers
Example: MMS Monitoring

MMS Monitoring Dashboard

Time Series Data at a Higher Level
• Widely applicable data model
• Applies to several different "data use cases"
• Various schema and modeling options
• Application requirements drive schema design

Time Series Data Considerations
• Arrival rate & ingest performance
• Resolution of raw events
• Resolution needed to support
– Applications
– Analysis
– Reporting
• Data retention policies

Data Retention
• How long is data required?
• Strategies for purging data
– TTL collections
– Capped collections
– Batch remove({query})
– Drop collection
• Performance
– Can effectively double write load
– Fragmentation and Record Reuse
– Index updates

Application Requirements
Event Resolution
Analysis
– Dashboards
– Analytics
– Reporting
Data Retention Policies
Event and Query Volumes

Application Requirements
Event Resolution
Analysis
– Dashboards
– Analytics
– Reporting
Data Retention Policies
Event and Query Volumes
Schema Design

Application Requirements
Event Resolution
Analysis
– Dashboards
– Analytics
– Reporting
Data Retention Policies
Event and Query Volumes
Schema Design
Aggregation Queries
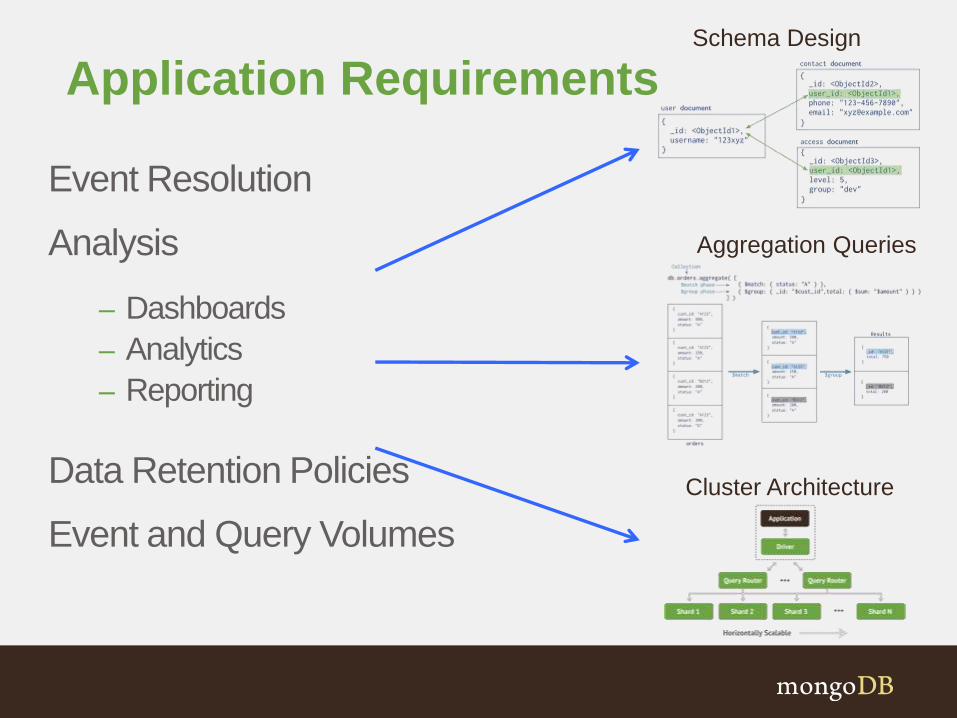
Application Requirements
Event Resolution
Analysis
– Dashboards
– Analytics
– Reporting
Data Retention Policies
Event and Query Volumes
Schema Design
Aggregation Queries
Cluster Architecture

Our Mission Today


Develop Nationwide traffic monitoring system
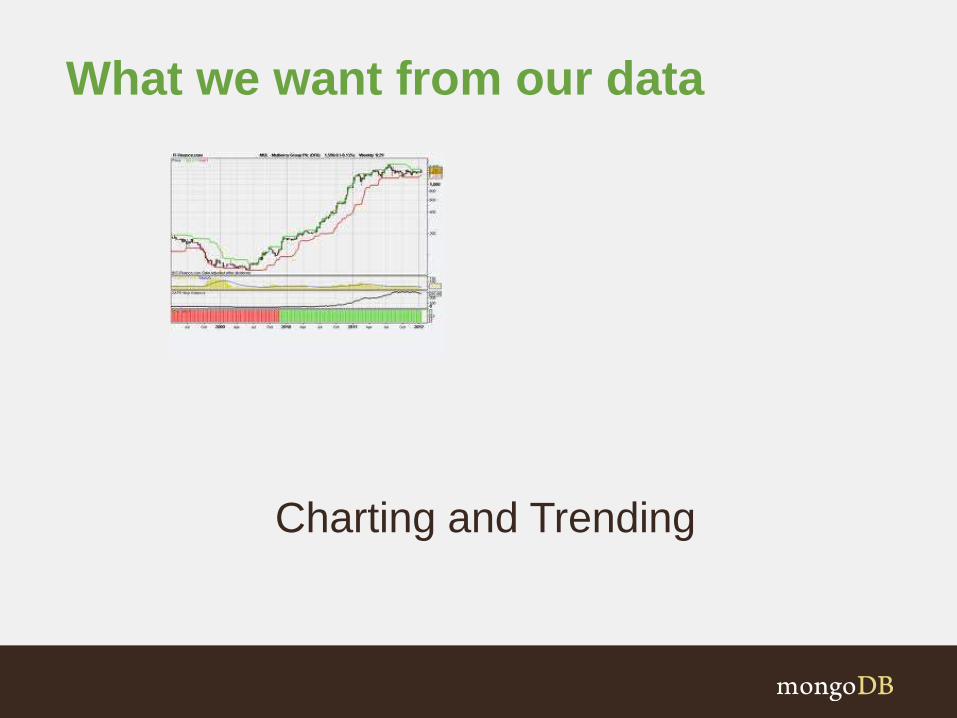
What we want from our data
Charting and Trending

What we want from our data
Historical & Predictive Analysis

What we want from our data
Real Time Traffic Dashboard

Traffic sensors to monitor interstate conditions
• 16,000 sensors
• Measure
• Speed
• Travel time
• Weather, pavement, and traffic conditions
• Frequency: average one sample per minute
• Support desktop, mobile, and car navigation
systems

Other requirements
• Need to keep 3 year history
• Three data centers
• VA, Chicago, LA
• Need to support 5M simultaneous users
• Peak volume (rush hour)
• Every minute, each request the 10 minute average
speed for 50 sensors

Master Agenda
• Design a MongoDB application for scale
• Use case: traffic data
• Presentation Components
1. Schema Design
2. Aggregation
3. Cluster Architecture

Schema Design Considerations

Schema Design Goals
• Store raw event data
• Support analytical queries
• Find best compromise of:
– Memory utilization
– Write performance
– Read/analytical query performance
• Accomplish with realistic amount of hardware

Designing For Reading, Writing, …
• Document per …
– event
– minute (average)
– minute (seconds)
– hour
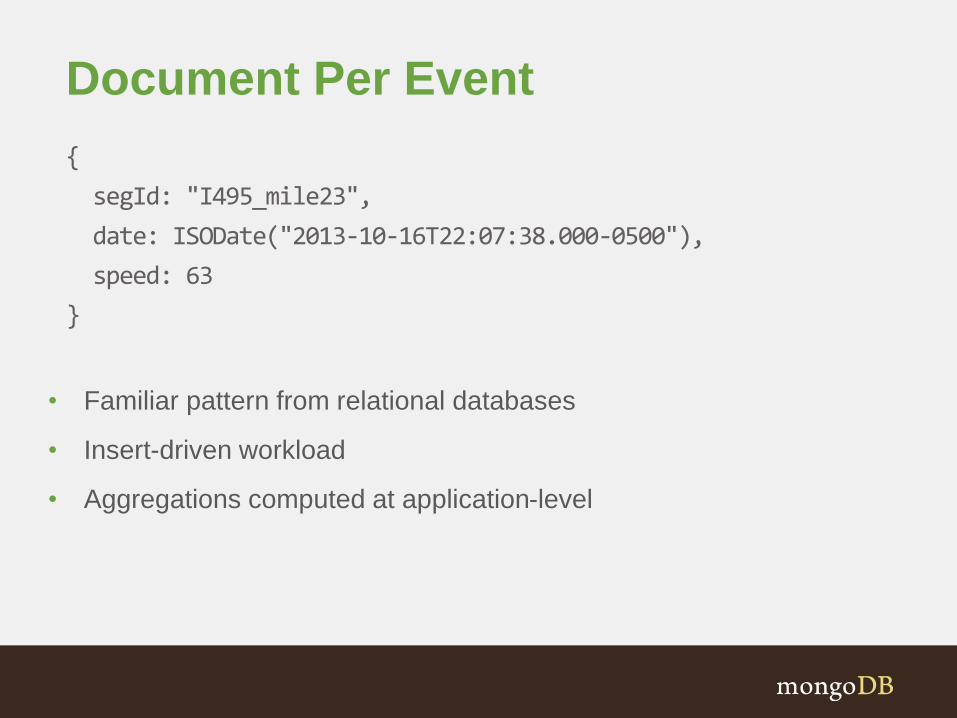
Document Per Event
{
segId: "I495_mile23",
date: ISODate("2013-10-16T22:07:38.000-0500"),
speed: 63
}
• Familiar pattern from relational databases
• Insert-driven workload
• Aggregations computed at application-level

Document Per Minute (Average)
{
segId: "I495_mile23",
date: ISODate("2013-10-16T22:07:00.000-0500"),
speed_count: 18,
speed_sum: 1134,
}
• Pre-aggregate to compute average per minute more easily
• Update-driven workload
• Resolution at the minute-level
• Note: averaging speeds may not be valid for some purposes (average
of averages); used here for simplicity of example.

Document Per Minute (By Second)
{
segId: "I495_mile23",
date: ISODate("2013-10-16T22:07:00.000-0500"),
speed: { 0: 63, 1: 58, …, 58: 66, 59: 64 }
}
• Store per-second data at the minute level
• Update-driven workload
• Pre-allocate structure to avoid document moves

Document Per Hour (By Second)
{
segId: "I495_mile23",
date: ISODate("2013-10-16T22:00:00.000-0500"),
speed: { 0: 63, 1: 58, …, 3598: 45, 3599: 55 }
}
• Store per-second data at the hourly level
• Update-driven workload
• Pre-allocate structure to avoid document moves
• Updating last second requires 3599 steps
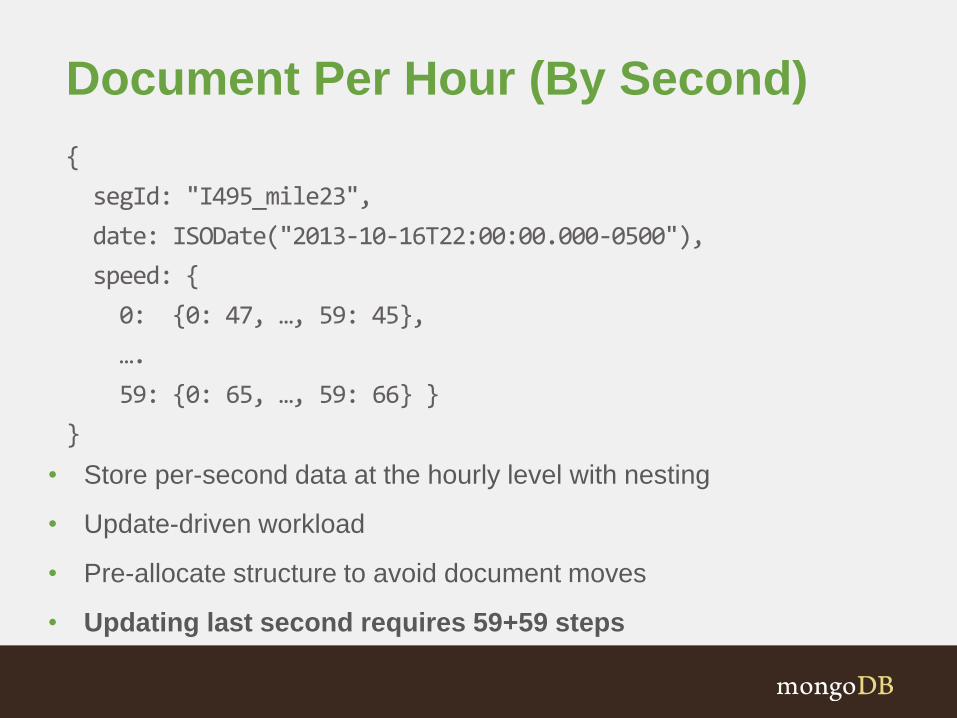
Document Per Hour (By Second)
{
segId: "I495_mile23",
date: ISODate("2013-10-16T22:00:00.000-0500"),
speed: {
0: {0: 47, …, 59: 45},
….
59: {0: 65, …, 59: 66} }
}
• Store per-second data at the hourly level with nesting
• Update-driven workload
• Pre-allocate structure to avoid document moves
• Updating last second requires 59+59 steps

Characterizing Write Differences
• Example: data generated every second
• For 1 minute:
• Transition from insert driven to update driven
– Individual writes are smaller
– Performance and concurrency benefits
Document Per Event
60 writes
Document Per Minute
1 write, 59 updates

Characterizing Read Differences
• Example: data generated every second
• Reading data for a single hour requires:
• Read performance is greatly improved
– Optimal with tuned block sizes and read ahead
– Fewer disk seeks
Document Per Event
3600 reads
Document Per Minute
60 reads

Characterizing Memory Differences
• _id index for 1 billion events:
• _id index plus segId and date index:
• Memory requirements significantly reduced
– Fewer shards
– Lower capacity servers
Document Per Event
~32 GB
Document Per Minute
~.5 GB
Document Per Event
~100 GB
Document Per Minute
~2 GB

Traffic Monitoring System Schema
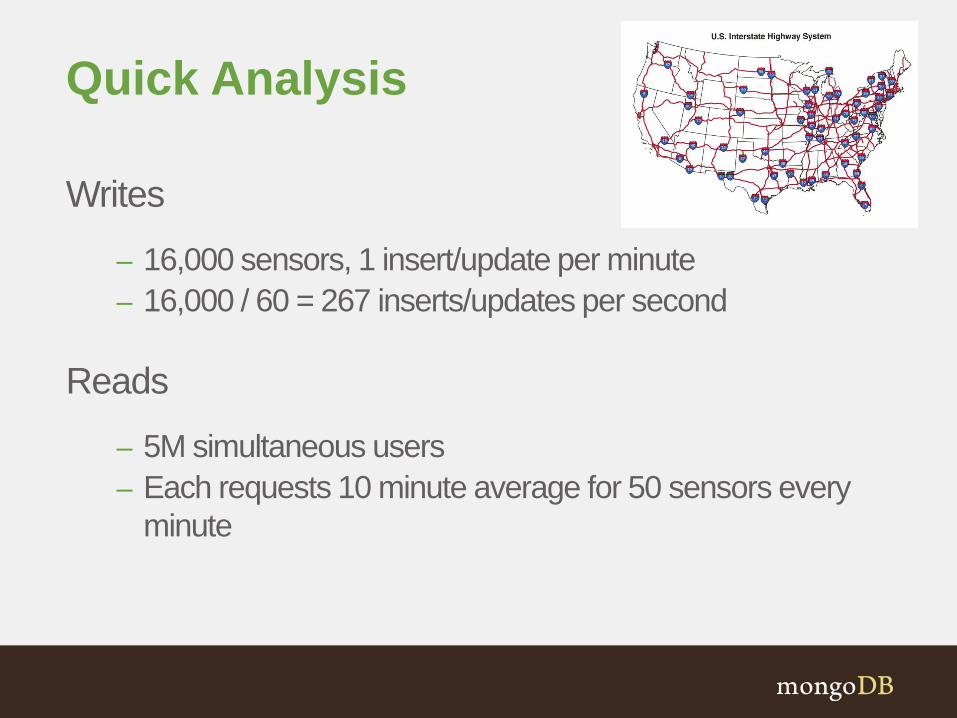
Quick Analysis
Writes
– 16,000 sensors, 1 insert/update per minute
– 16,000 / 60 = 267 inserts/updates per second
Reads
– 5M simultaneous users
– Each requests 10 minute average for 50 sensors every
minute

Tailor your schema to your
application workload

Reads: Impact of Alternative Schemas
10 minute average query
Schema 1 sensor 50 sensors
1 doc per event 10 500
1 doc per 10 min 1.9 95
1 doc per hour 1.3 65
Query: Find the average speed over the
last ten minutes
10 minute average query with 5M
users
Schema ops/sec
1 doc per event 42M
1 doc per 10 min 8M
1 doc per hour 5.4M

Writes: Impact of alternative schemas
1 Sensor - 1 Hour
Schema Inserts Updates
doc/event 60 0
doc/10 min 6 54
doc/hour 1 59
16000 Sensors – 1 Day
Schema Inserts Updates
doc/event 23M 0
doc/10 min 2.3M 21M
doc/hour .38M 22.7M

Sample Document Structure
Compound, unique
Index identifies the
Individual document
{ _id: ObjectId("5382ccdd58db8b81730344e2"),
segId: "900006",
date: ISODate("2014-03-12T17:00:00Z"),
data: [
{ speed: NaN, time: NaN },
{ speed: NaN, time: NaN },
{ speed: NaN, time: NaN },
...
],
conditions: {
status: "Snow / Ice Conditions",
pavement: "Icy Spots",
weather: "Light Snow"
}
}
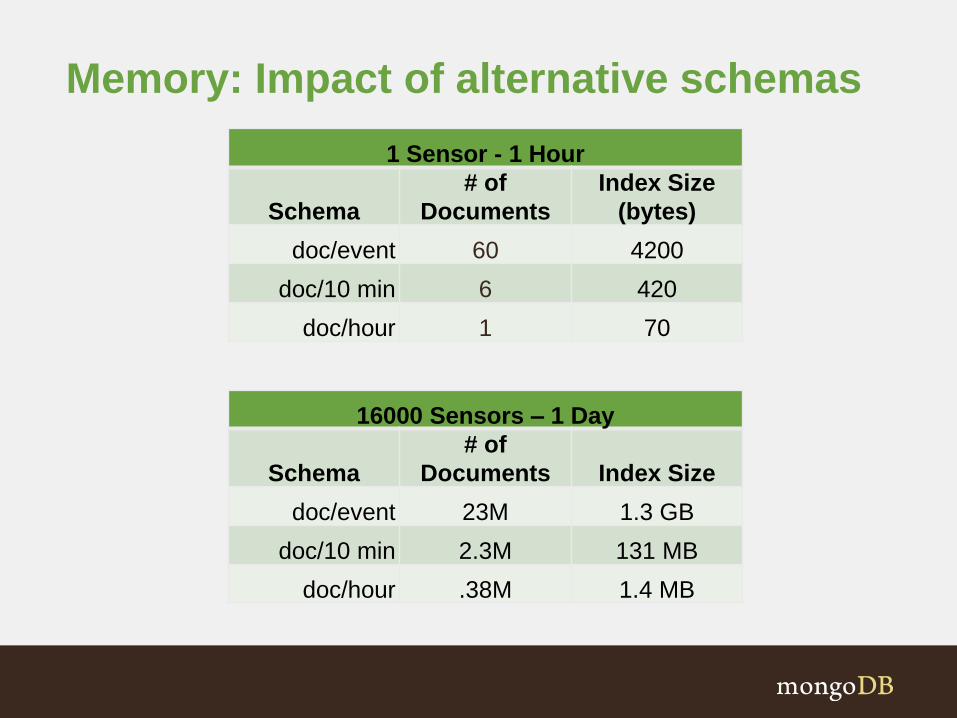
Memory: Impact of alternative schemas
1 Sensor - 1 Hour
Schema
# of
Documents
Index Size
(bytes)
doc/event 60 4200
doc/10 min 6 420
doc/hour 1 70
16000 Sensors – 1 Day
Schema
# of
Documents Index Size
doc/event 23M 1.3 GB
doc/10 min 2.3M 131 MB
doc/hour .38M 1.4 MB
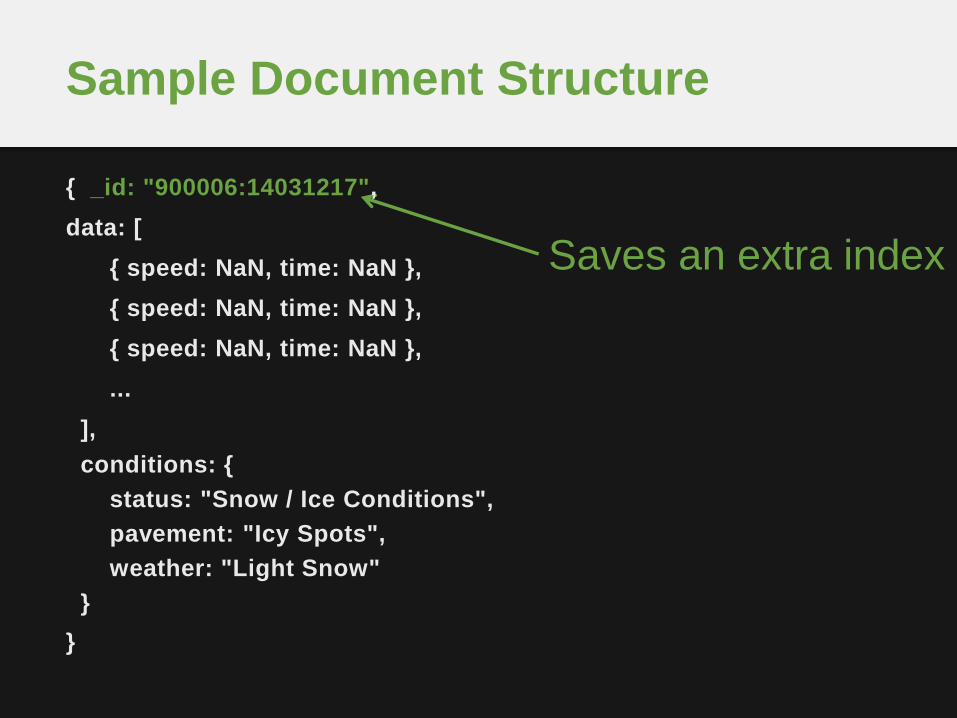
Sample Document Structure
Saves an extra index
{ _id: "900006:14031217",
data: [
{ speed: NaN, time: NaN },
{ speed: NaN, time: NaN },
{ speed: NaN, time: NaN },
...
],
conditions: {
status: "Snow / Ice Conditions",
pavement: "Icy Spots",
weather: "Light Snow"
}
}

{ _id: "900006:14031217",
data: [
{ speed: NaN, time: NaN },
{ speed: NaN, time: NaN },
{ speed: NaN, time: NaN },
...
],
conditions: {
status: "Snow / Ice Conditions",
pavement: "Icy Spots",
weather: "Light Snow"
}
}
Sample Document Structure
Range queries:
/^900006:1403/
Regex must be
left-anchored &
case-sensitive

{ _id: "900006:140312",
data: [
{ speed: NaN, time: NaN },
{ speed: NaN, time: NaN },
{ speed: NaN, time: NaN },
...
],
conditions: {
status: "Snow / Ice Conditions",
pavement: "Icy Spots",
weather: "Light Snow"
}
}
Sample Document Structure
Pre-allocated,
60 element array of
per-minute data

Analysis with The Aggregation Framework
Pipelining operations
Piping command line operations

Pipelining operations
grep
Piping command line operations

Pipelining operations
grep | sort
Piping command line operations

Pipelining operations
grep | sort | uniq
Piping command line operations

Pipelining operations
Piping aggregation operations

Pipelining operations
$match
Piping aggregation operations
Stream of documents

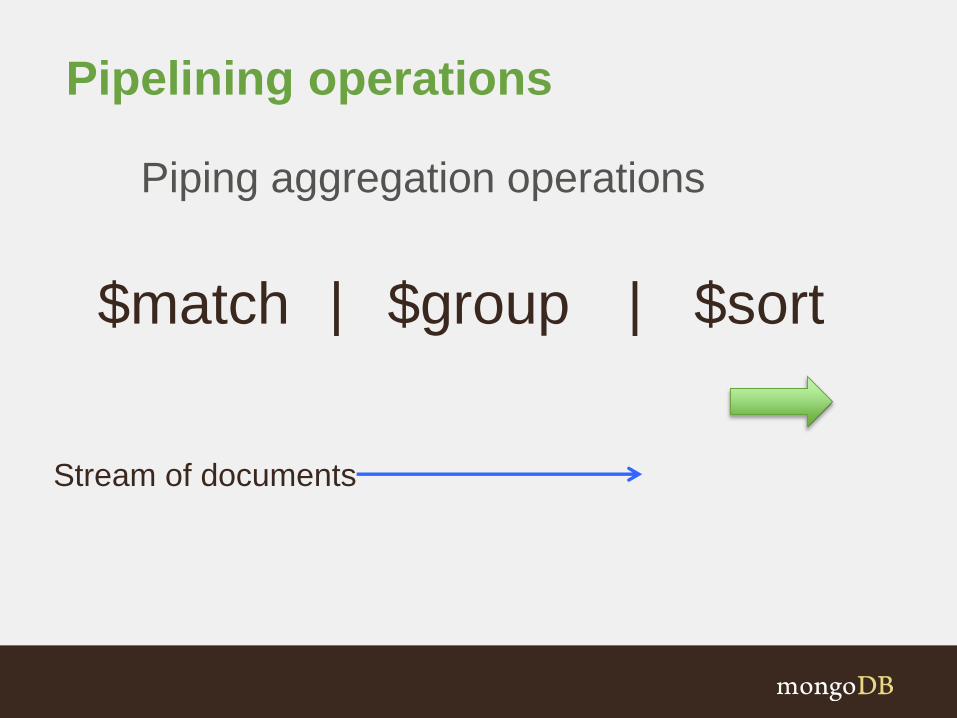
Pipelining operations
$match $group|
Piping aggregation operations
Stream of documents
Pipelining operations
$match $group | $sort|
Piping aggregation operations
Stream of documents
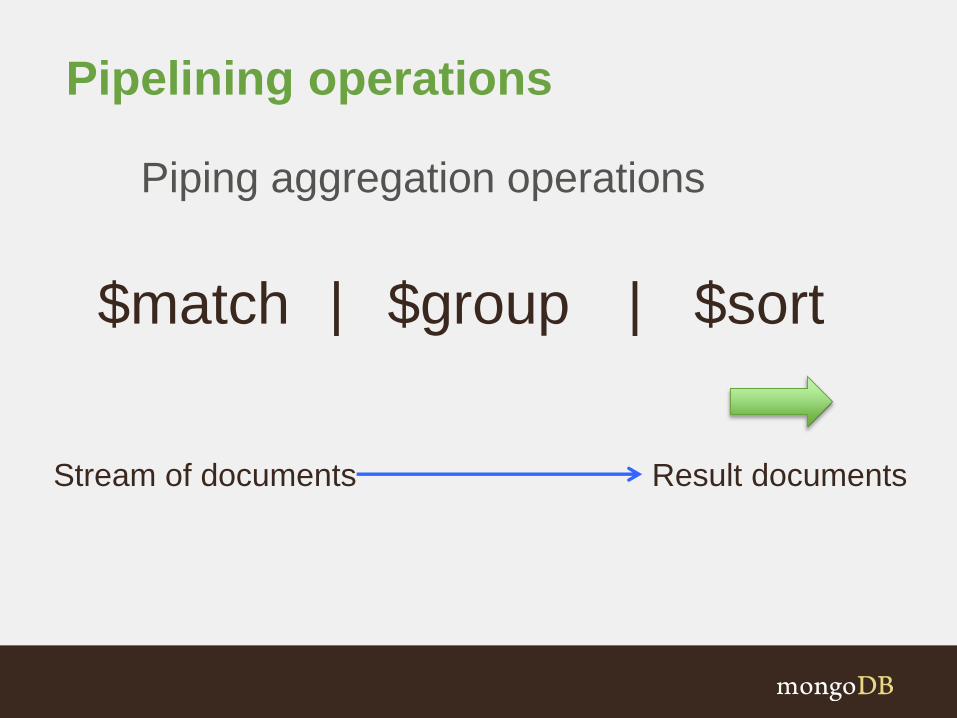
Pipelining operations
$match $group | $sort|
Piping aggregation operations
Stream of documents Result documents

What is the average speed for a given road segment?
> db.linkData.aggregate(
{ $match: { "_id" : /^20484097:/ } },
{ $project: { "data.speed": 1, segId: 1 } } ,
{ $unwind: "$data"},
{ $group: { _id: "$segId", ave: { $avg: "$data.speed"} } }
);
{ "_id" : 20484097, "ave" : 47.067650676506766 }

What is the average speed for a given road segment?
Select documents on the target segment
> db.linkData.aggregate(
{ $match: { "_id" : /^20484097:/ } },
{ $project: { "data.speed": 1, segId: 1 } } ,
{ $unwind: "$data"},
{ $group: { _id: "$segId", ave: { $avg: "$data.speed"} } }
);
{ "_id" : 20484097, "ave" : 47.067650676506766 }

What is the average speed for a given road segment?
Keep only the fields we really need
> db.linkData.aggregate(
{ $match: { "_id" : /^20484097:/ } },
{ $project: { "data.speed": 1, segId: 1 } } ,
{ $unwind: "$data"},
{ $group: { _id: "$segId", ave: { $avg: "$data.speed"} } }
);
{ "_id" : 20484097, "ave" : 47.067650676506766 }

What is the average speed for a given road segment?
Loop over the array of data points
> db.linkData.aggregate(
{ $match: { "_id" : /^20484097:/ } },
{ $project: { "data.speed": 1, segId: 1 } } ,
{ $unwind: "$data"},
{ $group: { _id: "$segId", ave: { $avg: "$data.speed"} } }
);
{ "_id" : 20484097, "ave" : 47.067650676506766 }

What is the average speed for a given road segment?
Use the handy $avg operator
> db.linkData.aggregate(
{ $match: { "_id" : /^20484097:/ } },
{ $project: { "data.speed": 1, segId: 1 } } ,
{ $unwind: "$data"},
{ $group: { _id: "$segId", ave: { $avg: "$data.speed"} } }
);
{ "_id" : 20484097, "ave" : 47.067650676506766 }

More Sophisticated Pipelines: average speed with variance
{ "$project" : {
mean: "$meanSpd",
spdDiffSqrd : {
"$map" : {
"input": {
"$map" : {
"input" : "$speeds",
"as" : "samp",
"in" : { "$subtract" : [ "$$samp", "$meanSpd" ] }
}
},
as: "df", in: { $multiply: [ "$$df", "$$df" ] }
} } } },
{ $unwind: "$spdDiffSqrd" },
{ $group: { _id: mean: "$mean", variance: { $avg: "$spdDiffSqrd" } } }

High Volume Data Feed (HVDF)
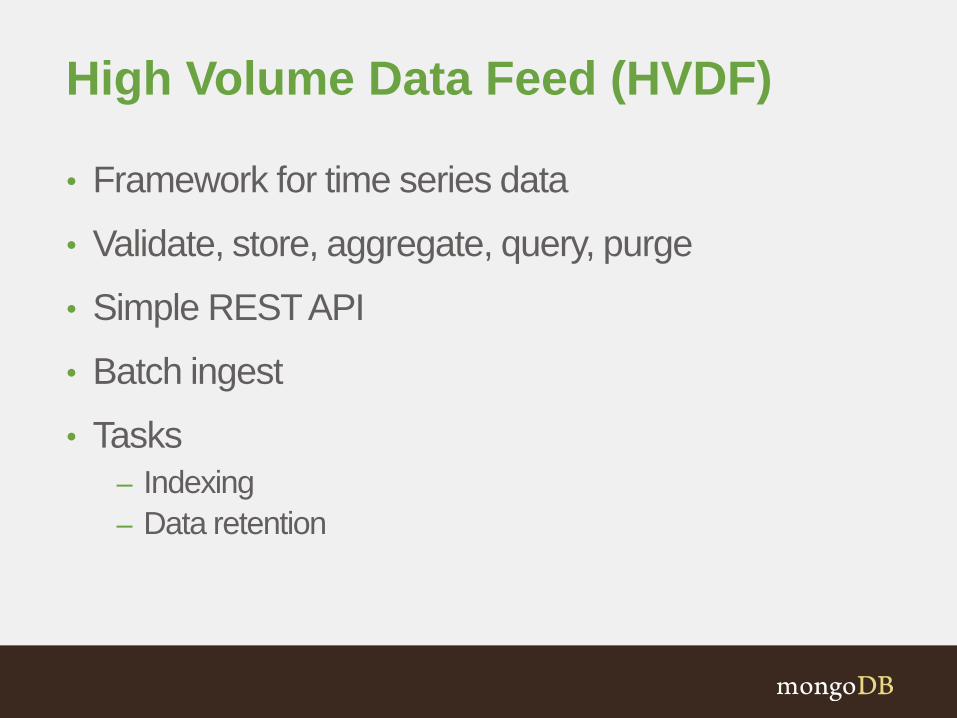
High Volume Data Feed (HVDF)
• Framework for time series data
• Validate, store, aggregate, query, purge
• Simple REST API
• Batch ingest
• Tasks
– Indexing
– Data retention
High Volume Data Feed (HVDF)
• Customized via plugins
– Time slicing into collections, purging
– Storage granularity of raw events
– _id generation
– Interceptors
• Open source
– https://github.com/10gen-labs/hvdf
Summary
• Tailor your schema to your application workload
• Bucketing/aggregating events will
– Improve write performance: inserts updates
– Improve analytics performance: fewer document reads
– Reduce index size reduce memory requirements
• Aggregation framework for analytic queries

Questions?