money market fund statistics - sec
TRANSCRIPT

Money Market Fund Statistics Data as of
November 30, 2015
Issued December 22, 2015
U.S. Securities and Exchange Commission
Division of Investment Management
This is a report of the Staff of the Division of Investment Management of the U.S. Securities and Exchange Commission. The Commission has expressed no view regarding this report or the information contained in it.

P a g e | 2 Table of Contents
TOPIC 11/30/2015 Change 10/31/2015 Page Number of Money Market Funds Reporting (Not Including Feeder Funds) 516 -2 518 3
Assets (in billions) Total Money Market Funds $3,079.4 -$6.6 $3,086.0 4
Prime Funds $1,726.0 -$64.9 $1,790.9
Government (Govt) & Treasury Funds $1,097.4 $56.3 $1,041.1
Tax Exempt Funds $256.0 $2.0 $254.0
7-Day Yields Gross Prime Funds 0.27% 0.02% 0.25% 5
Government & Treasury Funds 0.15% 0.03% 0.12%
Tax Exempt Funds 0.06% -0.01% 0.07%
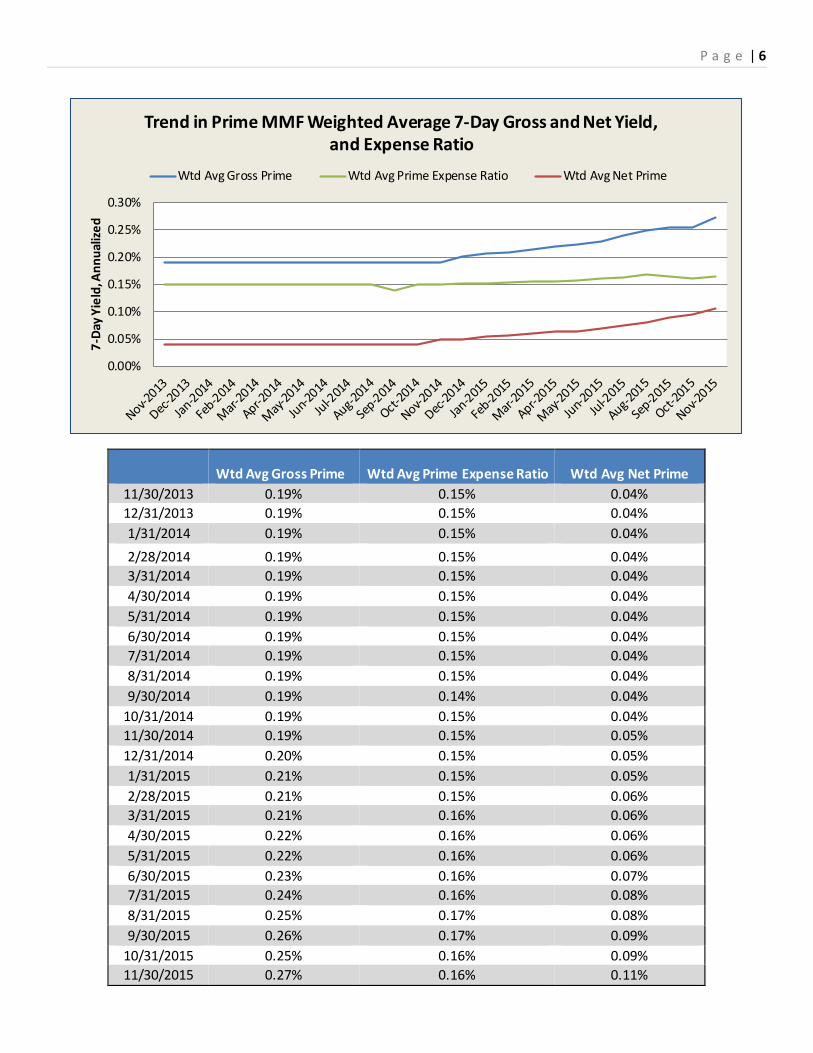
7-Day Yields Prime Funds Gross 0.27% 0.02% 0.25% 6
Net 0.11% 0.02% 0.09% Expense Ratio 0.16% - 0.16% Weighted Average Life (WAL), Weighted by Fund Assets Prime Funds 66.7 days -3.4 days 70.1 days 7
Government & Treasury Funds 84.6 days -4.2 days 88.8 days
Tax Exempt Funds 31.7 days -2.6 days 34.3 days Weighted Average Maturity (WAM), Weighted by Fund Assets Prime Funds 32.8 days -3.0 days 35.8 days 8
Government & Treasury Funds 38.3 days -2.1 days 40.4 days
Tax Exempt Funds 29.2 days -2.9 days 32.1 days Liquidity of Prime Funds, As a Percent of Total Amortized Cost Daily Liquidity 30.1% 2.6% 27.5% 9
Weekly Liquidity 43.1% 1.4% 41.7%
Prime Funds' Bank Holdings Holdings by Country 10
Change in Holdings by Country 11
Holdings by Major Region 12 Prime Funds' Portfolio Composition (in billions) Certificates of Deposit $509.0 (29.5%) -$27.4 $536.4 (30.1%) 13
Non-Financial Co. Commercial Paper (CP) & Other Short Term Instruments $409.0 (23.7%) -$14.5 $423.5 (23.7%)
Government & Treasury (Direct and Repo) $477.5 (27.7%) -$5.0 $482.5 (27.0%)
Financial Co. Commercial Paper (CP) $232.8 (13.5%) -$11.9 $244.7 (13.7%)
Asset-Backed Commercial Paper (ABCP) $98.1 (5.7%) $0.2 $97.9 (5.5%)
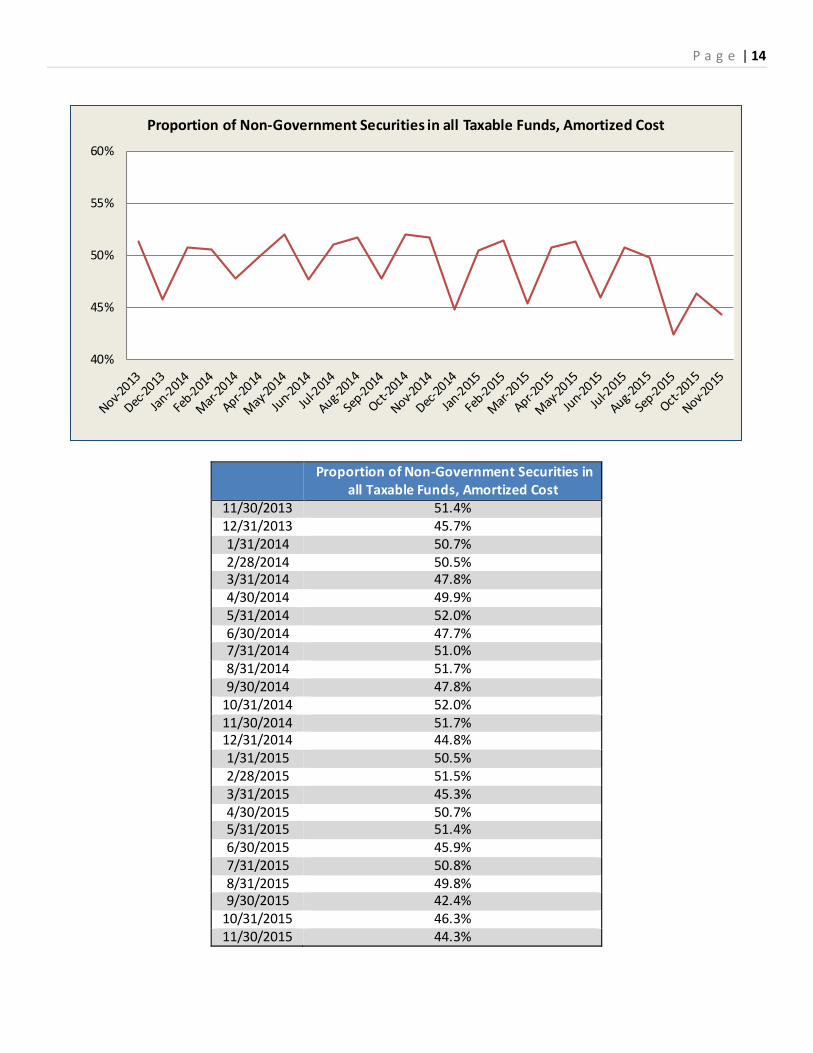
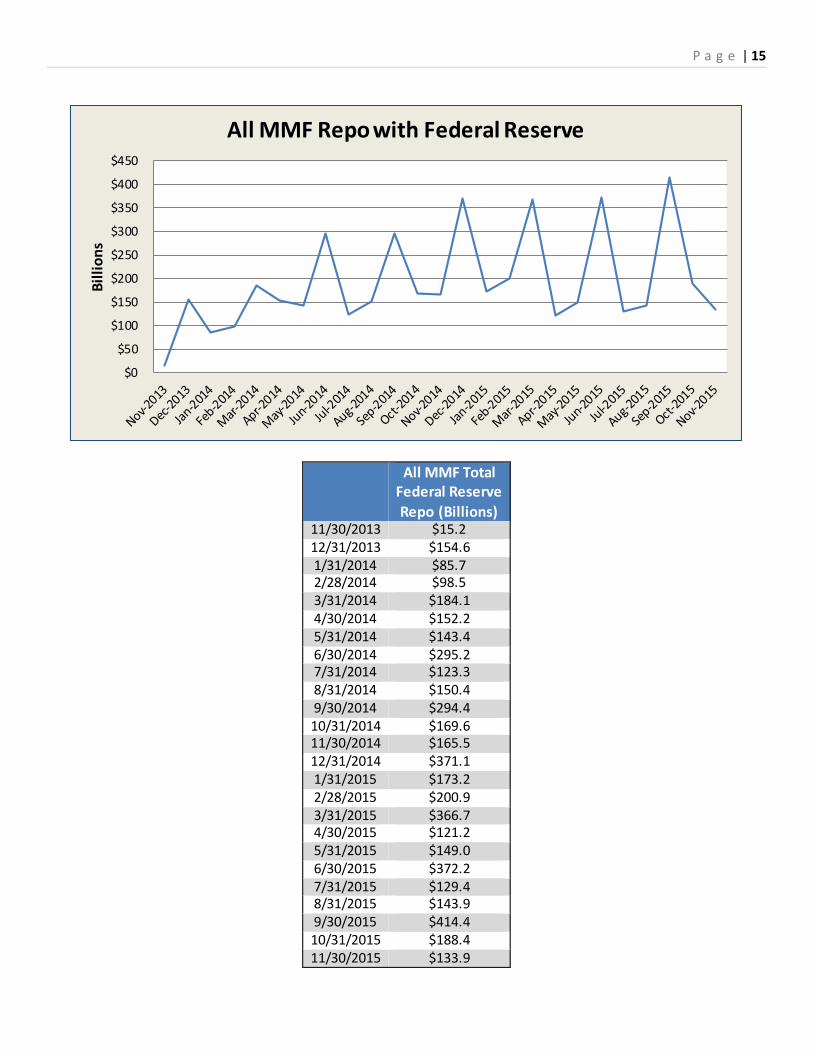
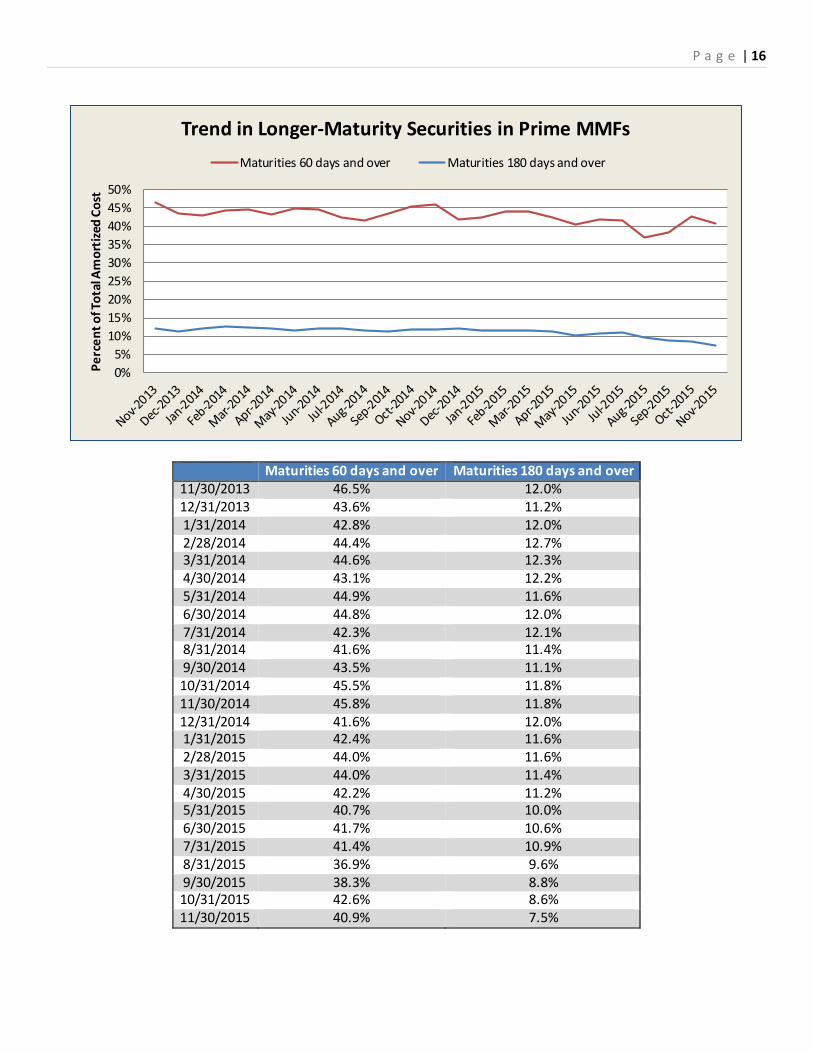
Non-Government Securities All Taxable Funds 44.3% -2.0% 46.3% 14 MMF Repo with the Fed (in billions) $133.9 -$54.5 $188.4 15 Longer-Maturity Securities 60 Days and Over 40.9% -1.7% 42.6% 16 180 Days and Over 7.5% -1.1% 8.6%
Information presented in this report is based upon data reported by filers for the period ending November 30, 2015, except where specifically noted that a chart incorporates staff judgments. The presented information does not reflect data from amended filings submitted after the required reporting deadline. Some calculations in the change column in the above table of contents may not appear to total as expected due to rounding. If staff identifies data in this report that requires corrections, an amended report will be published with the corrected information.

P a g e | 3
Number of Funds
11/30/2013 565 12/31/2013 561 1/31/2014 559 2/28/2014 559 3/31/2014 559 4/30/2014 558 5/31/2014 557 6/30/2014 556 7/31/2014 553 8/31/2014 560 9/30/2014 558 10/31/2014 553 11/30/2014 551 12/31/2014 546 1/31/2015 544 2/28/2015 543 3/31/2015 542 4/30/2015 542 5/31/2015 537 6/30/2015 537 7/31/2015 531 8/31/2015 523 9/30/2015 521 10/31/2015 518 11/30/2015 516
490
500
510
520
530
540
550
560
570
Num
ber
Trend in Number of Money Market Funds
Does not include feeder funds

P a g e | 4
(Millions) Prime Govt & Treas Tax Exempt Total
11/30/2013 $1,783,333 $951,551 $273,155 $3,008,039 12/31/2013 $1,792,224 $980,874 $281,230 $3,054,328 1/31/2014 $1,794,287 $973,672 $279,055 $3,047,014 2/28/2014 $1,779,870 $958,662 $278,843 $3,017,375 3/31/2014 $1,777,905 $946,123 $280,232 $3,004,260 4/30/2014 $1,743,255 $929,843 $267,440 $2,940,538 5/31/2014 $1,738,151 $940,705 $266,923 $2,945,779 6/30/2014 $1,718,330 $945,611 $263,904 $2,927,845 7/31/2014 $1,710,127 $926,990 $266,213 $2,903,330 8/31/2014 $1,732,955 $948,940 $266,421 $2,948,316 9/30/2014 $1,726,386 $984,560 $264,469 $2,975,415
10/31/2014 $1,751,547 $984,404 $261,534 $2,997,485 11/30/2014 $1,763,437 $992,092 $261,737 $3,017,266 12/31/2014 $1,772,398 $1,038,089 $270,199 $3,080,686 1/31/2015 $1,768,941 $1,019,407 $268,414 $3,056,762 2/28/2015 $1,780,289 $999,774 $268,181 $3,048,244 3/31/2015 $1,746,228 $996,224 $266,924 $3,009,376 4/30/2015 $1,704,160 $979,416 $252,164 $2,935,740 5/31/2015 $1,730,801 $983,871 $253,268 $2,967,940 6/30/2015 $1,706,487 $1,007,042 $250,954 $2,964,483 7/31/2015 $1,727,069 $1,023,972 $254,370 $3,005,411 8/31/2015 $1,749,739 $1,019,963 $256,591 $3,026,294 9/30/2015 $1,748,329 $1,022,731 $252,663 $3,023,724
10/31/2015 $1,790,928 $1,041,095 $253,986 $3,086,010 11/30/2015 $1,725,981 $1,097,413 $255,994 $3,079,388
0200,000400,000600,000800,000
1,000,0001,200,0001,400,0001,600,0001,800,0002,000,000
Mill
ions
Trend in Money Market Fund Assets, by Type of Fund Prime Govt & Treas Tax Exempt

P a g e | 5
Wtd Avg Gross Prime Wtd Avg Gross Tax Exempt Wtd Avg Gross Govt & Treas 11/30/2013 0.19% 0.11% 0.09% 12/31/2013 0.19% 0.10% 0.08% 1/31/2014 0.19% 0.10% 0.08% 2/28/2014 0.19% 0.09% 0.08% 3/31/2014 0.19% 0.11% 0.08% 4/30/2014 0.19% 0.15% 0.08% 5/31/2014 0.19% 0.11% 0.07% 6/30/2014 0.19% 0.10% 0.08% 7/31/2014 0.19% 0.10% 0.08% 8/31/2014 0.19% 0.08% 0.07% 9/30/2014 0.19% 0.08% 0.06%
10/31/2014 0.19% 0.08% 0.07% 11/30/2014 0.19% 0.08% 0.08% 12/31/2014 0.20% 0.07% 0.08% 1/31/2015 0.21% 0.06% 0.08% 2/28/2015 0.21% 0.06% 0.08% 3/31/2015 0.21% 0.06% 0.10% 4/30/2015 0.22% 0.12% 0.10% 5/31/2015 0.22% 0.13% 0.10% 6/30/2015 0.23% 0.10% 0.10% 7/31/2015 0.24% 0.07% 0.11% 8/31/2015 0.25% 0.07% 0.12% 9/30/2015 0.26% 0.07% 0.12%
10/31/2015 0.25% 0.07% 0.12% 11/30/2015 0.27% 0.06% 0.15%
0.00%
0.05%
0.10%
0.15%
0.20%
0.25%
0.30%
7-Da
y Gro
ss Y
ield
, Ann
ualiz
ed
Trend in Weighted Average 7-Day Gross Yield, by Type of Fund
Wtd Avg Gross Prime Wtd Avg Gross Tax Exempt Wtd Avg Gross Govt & Treas
P a g e | 6
Wtd Avg Gross Prime Wtd Avg Prime Expense Ratio Wtd Avg Net Prime
11/30/2013 0.19% 0.15% 0.04% 12/31/2013 0.19% 0.15% 0.04% 1/31/2014 0.19% 0.15% 0.04% 2/28/2014 0.19% 0.15% 0.04% 3/31/2014 0.19% 0.15% 0.04% 4/30/2014 0.19% 0.15% 0.04% 5/31/2014 0.19% 0.15% 0.04% 6/30/2014 0.19% 0.15% 0.04% 7/31/2014 0.19% 0.15% 0.04% 8/31/2014 0.19% 0.15% 0.04% 9/30/2014 0.19% 0.14% 0.04%
10/31/2014 0.19% 0.15% 0.04% 11/30/2014 0.19% 0.15% 0.05% 12/31/2014 0.20% 0.15% 0.05% 1/31/2015 0.21% 0.15% 0.05% 2/28/2015 0.21% 0.15% 0.06% 3/31/2015 0.21% 0.16% 0.06% 4/30/2015 0.22% 0.16% 0.06% 5/31/2015 0.22% 0.16% 0.06% 6/30/2015 0.23% 0.16% 0.07% 7/31/2015 0.24% 0.16% 0.08% 8/31/2015 0.25% 0.17% 0.08% 9/30/2015 0.26% 0.17% 0.09%
10/31/2015 0.25% 0.16% 0.09% 11/30/2015 0.27% 0.16% 0.11%
0.00%
0.05%
0.10%
0.15%
0.20%
0.25%
0.30%
7-Da
y Yie
ld, A
nnua
lized
Trend in Prime MMF Weighted Average 7-Day Gross and Net Yield, and Expense Ratio
Wtd Avg Gross Prime Wtd Avg Prime Expense Ratio Wtd Avg Net Prime

P a g e | 7
(Days) Prime Funds Govt & Treas Funds Tax Exempt Funds 11/30/2013 82.4 67.9 40.1 12/31/2013 79.6 65.7 36.4 1/31/2014 79.6 67.2 33.4 2/28/2014 79.8 68.4 31.1 3/31/2014 79.9 69.7 31.2 4/30/2014 78.3 71.5 30.4 5/31/2014 78.1 71.3 28.8 6/30/2014 77.8 71.8 34.2 7/31/2014 76.1 74.9 33.8 8/31/2014 76.2 73.6 38.5 9/30/2014 76.3 72.8 41.6 10/31/2014 78.3 78.2 40.5 11/30/2014 79.1 77 39.4 12/31/2014 76.6 74.9 37.2 1/31/2015 77.8 79.7 34.0 2/28/2015 77.5 80.1 32.2 3/31/2015 77.5 81.9 32.1 4/30/2015 76.3 82.2 30.8 5/31/2015 74.4 78.2 28.3 6/30/2015 72.9 75.4 33.6 7/31/2015 72.6 76.8 34.3 8/31/2015 67.7 78.4 33.6 9/30/2015 67.1 82.8 34.0 10/31/2015 70.1 88.8 34.3 11/30/2015 66.7 84.6 31.7
0102030405060708090
100
Days
Trend in WAL, Weighted by Fund Assets, by Type of Fund Prime Funds Govt & Treas Funds Tax Exempt Funds

P a g e | 8
(Days) Prime Funds Govt & Treas Funds Tax Exempt Funds 11/30/2013 48.1 50.3 38.5 12/31/2013 46.0 48.3 35.3 1/31/2014 46.7 48.8 32.2 2/28/2014 46.8 47.8 29.8 3/31/2014 46.3 45.3 29.5 4/30/2014 44.7 44.6 29.0 5/31/2014 44.6 42.5 27.4 6/30/2014 44.1 42.7 32.9 7/31/2014 43.7 45.5 33.8 8/31/2014 45.5 44.0 37.3 9/30/2014 46.0 44.5 40.2 10/31/2014 46.8 48.3 39.3 11/30/2014 45.8 46.4 38.4 12/31/2014 42.8 43.5 36.2 1/31/2015 43.5 43.7 33.0 2/28/2015 43.4 42.9 30.9 3/31/2015 41.6 44.2 30.6 4/30/2015 39.6 42.8 29.1 5/31/2015 38.5 40.9 26.7 6/30/2015 36.8 39.5 31.6 7/31/2015 36.6 40.6 32.2 8/31/2015 32.3 38.6 31.2 9/30/2015 32.0 38.0 31.8 10/31/2015 35.8 40.4 32.1 11/30/2015 32.8 38.3 29.2
0
10
20
30
40
50
60
Days
Trend in WAM, Weighted by Fund Assets, by Type of Fund Govt & Treas Funds Prime Funds Tax Exempt Funds

P a g e | 9
Total Daily Liquidity
Total Weekly Liquidity
11/30/2013 25.4% 39.2% 12/31/2013 23.9% 37.3% 1/31/2014 23.9% 38.9% 2/28/2014 25.1% 40.4% 3/31/2014 27.8% 37.8% 4/30/2014 25.2% 38.7% 5/31/2014 23.5% 39.4% 6/30/2014 24.7% 38.4% 7/31/2014 24.2% 39.3% 8/31/2014 26.3% 40.9% 9/30/2014 25.3% 38.3%
10/31/2014 26.8% 40.1% 11/30/2014 26.6% 40.0% 12/31/2014 22.5% 41.3% 1/31/2015 25.7% 40.6% 2/28/2015 26.0% 39.9% 3/31/2015 25.1% 38.8% 4/30/2015 24.6% 39.8% 5/31/2015 25.7% 39.8% 6/30/2015 26.2% 41.0% 7/31/2015 26.4% 40.0% 8/31/2015 27.7% 41.6% 9/30/2015 24.3% 42.2%
10/31/2015 27.5% 41.7% 11/30/2015 30.1% 43.1%
0%5%
10%15%20%25%30%35%40%45%50%
Perc
ent T
otal
Pri
me
Am
orti
zed
Cost
Trend in Daily and Weekly Liquidity of Prime Money Market Funds
Total Weekly Liquidity Total Daily Liquidity

P a g e | 10
Country Prime MMF (Millions) Canada $200,436
US $188,911 France $179,928 Japan $172,077
Sweden $108,561 Aust/NZ $88,191
UK $73,627 Netherlands $50,962 Switzerland $45,123
Germany $38,772 Norway $35,432
Singapore $18,879 Belgium $12,586
Other $9,250 China $3,735 Spain $1,154
Grand Total $1,227,625
SEC staff had to make judgments in some limited cases as to whether certain securities held in prime money market funds were issued by a specific bank. The banks were then grouped by country based on location of their global headquarters. In general, the calculations include Asset Backed CP sponsored by a bank and all repos with that bank as counterparty. If identifiable with a specific bank, money market tranches of ABS are included in the calculation. Securities guaranteed, but not issued by, bank-related entities are not included.
$0
$50,000
$100,000
$150,000
$200,000
$250,000
Mill
ions
Prime MMF Holdings of Bank Related Securities, by Country November 2015

P a g e | 11
Country Change (Millions) Canada $11,866
US $2,303 Belgium $1,341
Spain $348 Other $23
UK -$111 Singapore -$267
China -$294 Switzerland -$1,162
Aust/NZ -$1,431 Netherlands -$2,535
Sweden -$5,017 Japan -$6,915
Germany -$7,943 France -$8,104 Norway -$13,081
SEC staff had to make judgments in some limited cases as to whether certain securities held in prime money market funds were issued by a specific bank. The banks were then grouped by country based on location of their global headquarters. In general, the calculations include Asset Backed CP sponsored by a bank and all repos with that bank as counterparty. If identifiable with a specific bank, money market tranches of ABS are included in the calculation. Securities guaranteed, but not issued by, bank-related entities are not included.
-$15,000
-$10,000
-$5,000
$-
$5,000
$10,000
$15,000
Mill
ions
Change in Prime MMF Bank Related Securities, by Country, October 2015 to November 2015

P a g e | 12
(Millions) Europe Euro-zone Americas Asia and Pacific
11/30/2013 $633,537 $351,754 $389,328 $307,322 12/31/2013 $526,996 $230,508 $407,362 $316,051 1/31/2014 $653,259 $353,591 $397,161 $311,499 2/28/2014 $651,067 $356,054 $391,278 $296,627 3/31/2014 $556,687 $312,662 $390,235 $287,552 4/30/2014 $650,425 $344,265 $383,688 $287,422 5/31/2014 $641,476 $341,803 $396,681 $283,745 6/30/2014 $503,316 $278,043 $403,805 $292,188 7/31/2014 $606,555 $313,697 $400,146 $292,301 8/31/2014 $615,562 $315,775 $414,472 $339,186 9/30/2014 $492,060 $247,267 $408,751 $304,004
10/31/2014 $609,541 $283,664 $422,338 $309,488 11/30/2014 $603,310 $287,797 $428,774 $310,709 12/31/2014 $462,666 $235,169 $421,684 $308,909 1/31/2015 $626,172 $315,420 $407,069 $303,528 2/28/2015 $626,600 $315,368 $404,668 $312,152 3/31/2015 $468,020 $248,685 $405,404 $301,992 4/30/2015 $586,490 $286,551 $404,816 $290,789 5/31/2015 $598,836 $287,718 $405,031 $298,475 6/30/2015 $436,893 $219,682 $410,216 $307,195 7/31/2015 $597,194 $300,041 $429,659 $297,824 8/31/2015 $607,487 $306,772 $428,203 $288,633 9/30/2015 $425,642 $226,840 $392,802 $279,030
10/31/2015 $586,639 $302,055 $377,774 $294,191 11/30/2015 $550,184 $284,541 $391,809 $285,631
Euro-zone is a subset of Europe and Euro-zone values are also included in totals for Europe.
SEC staff had to make judgments in some limited cases as to whether certain securities held in prime money market funds were issued by a specific bank. The banks were then grouped by country based on location of their global headquarters. In general, the calculations include Asset Backed CP sponsored by a bank and all repos with that bank as counterparty. If identifiable with a specific bank, money market tranches of ABS are included in the calculation. Securities guaranteed, but not issued by, bank-related entities are not included.
$0$100,000$200,000$300,000$400,000$500,000$600,000$700,000
Mill
ions
Trend in Prime MMF Holdings of Bank Related Securities by Major Region
Europe Euro-zone Americas Asia and Pacific

P a g e | 13
(Millions)
CD
Non-Financial CP and Other Short Term Securities
Govt (Direct &
Repo) Financial Co.
CP ABCP
Total Amortized
Cost 11/30/2013 $579,823 $417,884 $406,561 $268,153 $106,480 $1,778,901 12/31/2013 $585,029 $359,549 $474,571 $250,080 $105,208 $1,774,437 1/31/2014 $629,217 $399,619 $402,094 $268,876 $102,207 $1,802,013 2/28/2014 $613,990 $400,995 $404,519 $267,782 $99,178 $1,786,464 3/31/2014 $590,928 $351,416 $472,169 $251,317 $100,120 $1,765,950 4/30/2014 $615,826 $398,568 $366,015 $266,701 $100,270 $1,747,380 5/31/2014 $623,169 $311,391 $354,182 $267,912 $98,960 $1,655,614 6/30/2014 $597,853 $319,228 $441,524 $243,227 $97,085 $1,698,917 7/31/2014 $616,131 $380,021 $372,010 $254,551 $94,948 $1,717,661 8/31/2014 $617,783 $405,833 $358,055 $253,916 $95,372 $1,730,959 9/30/2014 $589,180 $354,600 $415,860 $239,719 $96,214 $1,695,573
10/31/2014 $602,875 $460,517 $339,950 $257,814 $92,388 $1,753,544 11/30/2014 $615,412 $441,974 $345,926 $260,014 $94,115 $1,757,442 12/31/2014 $580,077 $340,485 $503,726 $238,248 $97,206 $1,759,741 1/31/2015 $611,275 $425,141 $371,869 $264,084 $98,207 $1,770,575 2/28/2015 $610,002 $445,535 $356,354 $269,810 $93,218 $1,774,919 3/31/2015 $565,628 $338,350 $495,632 $241,224 $96,541 $1,737,374 4/30/2015 $564,264 $439,606 $350,540 $258,376 $90,277 $1,703,063 5/31/2015 $576,506 $452,573 $344,676 $259,007 $91,551 $1,724,313 6/30/2015 $540,883 $357,401 $451,851 $244,854 $92,747 $1,687,736 7/31/2015 $572,594 $459,559 $338,105 $261,556 $95,776 $1,727,591 8/31/2015 $573,424 $461,532 $366,240 $252,335 $99,382 $1,752,914 9/30/2015 $518,770 $318,150 $567,599 $231,523 $98,308 $1,734,350
10/31/2015 $536,390 $423,476 $482,490 $244,734 $97,867 $1,784,957 11/30/2015 $508,976 $408,991 $477,527 $232,774 $98,101 $1,726,369
$0
$100,000
$200,000
$300,000
$400,000
$500,000
$600,000
$700,000
Mill
ions
Trend in Prime MMF Portfolio Composition CD Non-Financial Co. CP and
Other Short Term SecuritiesGovt (Direct & Repo) Financial Co. CP ABCP
P a g e | 14
Proportion of Non-Government Securities in
all Taxable Funds, Amortized Cost 11/30/2013 51.4% 12/31/2013 45.7% 1/31/2014 50.7% 2/28/2014 50.5% 3/31/2014 47.8% 4/30/2014 49.9% 5/31/2014 52.0% 6/30/2014 47.7% 7/31/2014 51.0% 8/31/2014 51.7% 9/30/2014 47.8%
10/31/2014 52.0% 11/30/2014 51.7% 12/31/2014 44.8% 1/31/2015 50.5% 2/28/2015 51.5% 3/31/2015 45.3% 4/30/2015 50.7% 5/31/2015 51.4% 6/30/2015 45.9% 7/31/2015 50.8% 8/31/2015 49.8% 9/30/2015 42.4%
10/31/2015 46.3% 11/30/2015 44.3%
40%
45%
50%
55%
60%
Proportion of Non-Government Securities in all Taxable Funds, Amortized Cost
P a g e | 15
All MMF Total
Federal Reserve Repo (Billions)
11/30/2013 $15.2 12/31/2013 $154.6 1/31/2014 $85.7 2/28/2014 $98.5 3/31/2014 $184.1 4/30/2014 $152.2 5/31/2014 $143.4 6/30/2014 $295.2 7/31/2014 $123.3 8/31/2014 $150.4 9/30/2014 $294.4 10/31/2014 $169.6 11/30/2014 $165.5 12/31/2014 $371.1 1/31/2015 $173.2 2/28/2015 $200.9 3/31/2015 $366.7 4/30/2015 $121.2 5/31/2015 $149.0 6/30/2015 $372.2 7/31/2015 $129.4 8/31/2015 $143.9 9/30/2015 $414.4 10/31/2015 $188.4 11/30/2015 $133.9
$0
$50
$100
$150
$200
$250
$300
$350
$400
$450
Billi
ons
All MMF Repo with Federal Reserve
P a g e | 16
Maturities 60 days and over Maturities 180 days and over 11/30/2013 46.5% 12.0% 12/31/2013 43.6% 11.2% 1/31/2014 42.8% 12.0% 2/28/2014 44.4% 12.7% 3/31/2014 44.6% 12.3% 4/30/2014 43.1% 12.2% 5/31/2014 44.9% 11.6% 6/30/2014 44.8% 12.0% 7/31/2014 42.3% 12.1% 8/31/2014 41.6% 11.4% 9/30/2014 43.5% 11.1% 10/31/2014 45.5% 11.8% 11/30/2014 45.8% 11.8% 12/31/2014 41.6% 12.0% 1/31/2015 42.4% 11.6% 2/28/2015 44.0% 11.6% 3/31/2015 44.0% 11.4% 4/30/2015 42.2% 11.2% 5/31/2015 40.7% 10.0% 6/30/2015 41.7% 10.6% 7/31/2015 41.4% 10.9% 8/31/2015 36.9% 9.6% 9/30/2015 38.3% 8.8% 10/31/2015 42.6% 8.6% 11/30/2015 40.9% 7.5%
0%5%
10%15%20%25%30%35%40%45%50%
Perc
ent o
f Tot
al A
mor
tized
Cos
t
Trend in Longer-Maturity Securities in Prime MMFs Maturities 60 days and over Maturities 180 days and over

P a g e | 17
If you have any questions or comments about Money Market Fund Statistics, please contact Sharon Pichler and Isaac Kuznits, in the Risk and Examinations Office (REO) of the Division of Investment Management, at [email protected].