money and collateral - imf · money and collateral prepared by manmohan singh and peter stella1...
TRANSCRIPT

Money and Collateral
Manmohan Singh and Peter Stella
WP/12/95

© 2012 International Monetary Fund WP/12/95
IMF Working Paper
Research Department
Money and Collateral
Prepared by Manmohan Singh and Peter Stella1
Authorized for distribution by Stijn Claessens
April 2012
Abstract
Between 1980 and before the recent crisis, the ratio of financial market debt to liquid assets rose exponentially in the U.S. (and in other financial markets), reflecting in part the greater use of securitized assets to collateralize borrowing. The subsequent crisis has reduced the pool of assets considered acceptable as collateral, resulting in a liquidity shortage. When trying to address this, policy makers will need to consider concepts of liquidity besides the traditional metric of excess bank reserves and do more than merely substitute central bank money for collateral that currently remains highly liquid.
JEL Classification Numbers: G21; G28; F33; K22; G18; G15
Keywords: Money, collateral, liquidity, financial crisis, securitization, central bank
Author’s E-Mail Address: [email protected]; [email protected]
1 We wish to thank Stijn Claessens for several useful discussions. We would also like to acknowledge Phil Prince and Joe Abate for their continued dialogue in shaping this paper. Mohsan Bilal provided very useful data analysis.
This Working Paper should not be reported as representing the views of the IMF. The views expressed in this Working Paper are those of the author(s) and do not necessarily represent those of the IMF or IMF policy. Working Papers describe research in progress by the author(s) and are published to elicit comments and to further debate.

2
Contents Page
I. Introduction ............................................................................................................................3
II. Money and the (Adjusted) Money Multiplier .......................................................................3 III. Collateral ..............................................................................................................................6
IV. Safe Assets and Treasury-bills—What Determines their Supply? ....................................11
V. Collateral Chains .................................................................................................................13
VI. Monetary Policy and Financial Lubrication ......................................................................15
VII. Conclusion ........................................................................................................................16 References ................................................................................................................................18 Table 1. Definition of Terms Used ......................................................................................................7 Figure 1. Monetary Base and Deposits at the Central Bank (1959-2011) ............................................5 2. U.S. Total Credit Market Assets (ratio to GDP) ...................................................................6 3. U.S. Ratio of Total US Financial Intermediaries Liabilities to Ultimate Liquidity ..............9 4. Ratio of Total US Commercial Bank Liabilities to Ultimate Liquidity ..............................10 5. Ratio of Total US Nonbank Financial Intermediaries Liabilities to their holdings of C1 ..10 6. Ratio of T-Bills/Total Issuance by U.S. Treasury Since 1982 ............................................12 7. Bills/Total Issuance Relative to 10 year Yields minus 6-month Yields (1961-2011) .........17 Annex 1. Debt Management Strategy of U.S. Treasury since the 1960s ............................................17

3
I. INTRODUCTION
In the traditional view of a banking system, credit and money are largely counterparts to each other on different sides of the balance sheet. In the process of maturity transformation, banks are able to create liquid claims on themselves, namely money, which is the counterpart to the less liquid loans or credit.2 Owing to the law of large numbers, banks have—for centuries—been able to safely conduct this business with relatively little liquid reserves, as long as basic confidence in the soundness of the bank portfolio is maintained.
In recent decades, with the advent of securitization and electronic means of trading and settlement, it became possible to greatly expand the scope of assets that could be transformed directly, through their use as collateral, into highly liquid or money-like assets. The expansion in the scope of the assets that could be securitized was in part facilitated by the growth of the shadow financial system, which was largely unregulated, and the ability to borrow from non-deposit sources. This meant deposits no longer equaled credit (Schularick and Taylor, 2008). The justification for light touch or no regulation of this new market was that collateralization was sufficient (and of high quality) and that market forces would ensure appropriate risk taking and dispersion among those educated investors best able to take those risks which were often tailor made to their demands. Where regulation fell short was in failing to recognize the growing interconnectedness of the shadow and regulated sectors, and the growing tail risk that sizable leverage entailed (Gennaioli, Shleifer and Vishny, 2011).
Post-Lehman, there has been a disintermediation process leading to a fall in the money multiplier. This is related to the shortage of collateral (Singh 2011). This is having a real impact—in fact deleveraging is more pronounced due to less collateral. Section II of the paper focuses on money as a legal tender, the money multiplier; then we introduce the adjusted money multiplier. Section III discusses collateral, including tail-risk collateral. Section IV tries to bridge the money and collateral aspects from a “safe assets” angle. Section V introduces collateral chains and describes the economics behind the private pledged collateral market. Section VI brings the monetary and collateral issues together under an overall financial lubrication framework. In our conclusion (section VII) we offer a useful basis for understanding monetary policy in the current environment.
II. MONEY AND THE (ADJUSTED) MONEY MULTIPLIER
Payments finality can be defined in a contract or understood to be defined in law. In the U.S., for example, Federal Reserve (FR) banknotes are legal tender for all debts, both public and private. In other words, if you owe someone $100 million, your offer to pay them in FR notes cannot be refused unless pre-specified in a contract. The market practice (and/or law) is to accept deposits in any FR bank as final payment (they can always be converted into FR notes) for all debts. This does not mean other financial assets cannot be accepted as payment, just that central bank money cannot be rejected. The further advantage of central bank
2 Banks create money-like assets (not money). Ricks (2011) makes a legal distinction between fiat money and other money-like other instruments.

4
“money” is that it is risk free in nominal terms (not in real terms, as inflation is unknown). Other financial assets, even U.S. Treasury bills, have a degree of nominal price risk. They thus raise the issue of the price of the asset in terms of central bank money. For example, if you pay a debt of $100 million due today in central bank money at 10 am or 2 pm, it is the same "quantity" of deposits at the FR. If someone is settling in T-bills or bonds, or Exxon shares, however, the price will not be the same at 10 am and 2 pm, in general. This entails the added complexity of trying to determine the "market" price, as well as opens up the opportunity to distort the market price in somebody’s favor. The value of central bank money in terms of the nation's unit of account never fluctuates. One can always pay a $50 million debt with a central bank deposit of $50 million. In paying a $50 million debt in T-bills or Exxon shares, the number of bills and shares will fluctuate. Now society might benefit from moving from settlement finality in central bank money to settlement in Exxon shares since Exxon shares yield say a 4 percent real return on average while central bank money yields a negative real return on average. So, in that case we can imagine (in the context of Exxon shares) that all prices would be quoted in terms of Exxon shares and Exxon could issue fractional shares and coins. The general price level would then change with changes in the perceived value of Exxon shares as well as with share splits and reverse share splits, etc. Shareholders would receive their dividends in more shares (not fiat money).3 This is clearly not optimal. People prefer nominal claims for a reason! Now let us imagine an economy that has not done away with the legal tender of central bank money; however, there are many other assets in the market, such as Exxon shares, T-bills, bonds, and securitized revenue streams that are very widely accepted and held. So dealers finance their inventories through borrowing and swapping securities that are "high" yielding (or at least positive yield), thereby minimizing the use of central bank money which is low yielding. Financial market investors do not like to hold much monetary base (i.e., central bank money). Instead they prefer to hold claims on money market funds (that have variable prices, unlike bank deposits), and various other mutual funds or securitized assets.
The money multiplier (m) says something about the efficiency of the infrastructure of the financial intermediary sector. The conventional money multiplier m is defined as the ratio of total monetary liabilities and the monetary base. The monetary base is comprised of central bank monetary liabilities, that is, currency and central bank depository liabilities. These central bank liabilities (legal tender) are the most liquid assets in the economy. We can think of more than one money multiplier, though, where each money multiplier refers to a specific aspect of the efficiency of financial services provision.4 Specifically, currency in modern economies is held largely by households and nonfinancial enterprises. In order to better assess how efficient financial intermediaries are at financing lending upon a
3 For a further discussion of private money see Krozner (2003). 4 Let’s therefore define money multiplier as the ratio of L(i), total monetary liabilities of financial institutions satisfying characteristics “i”, and the monetary base. Or mi =L(i)/monetary base.
5
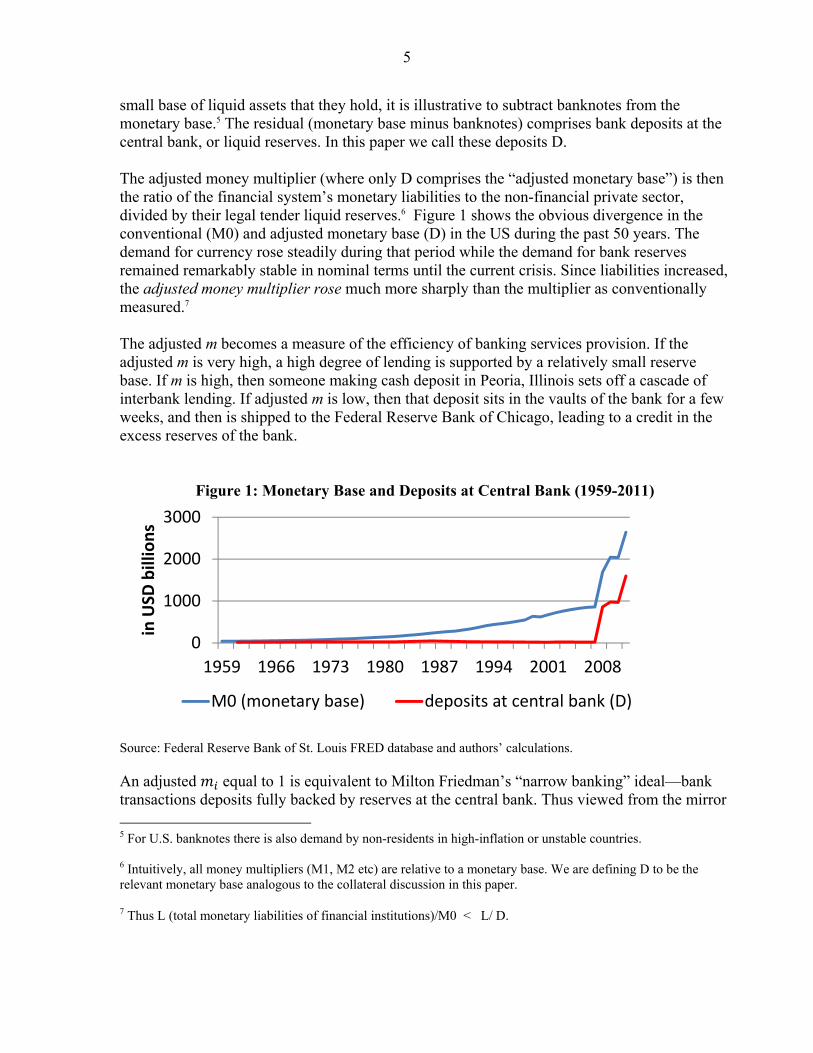
small base of liquid assets that they hold, it is illustrative to subtract banknotes from the monetary base.5 The residual (monetary base minus banknotes) comprises bank deposits at the central bank, or liquid reserves. In this paper we call these deposits D. The adjusted money multiplier (where only D comprises the “adjusted monetary base”) is then the ratio of the financial system’s monetary liabilities to the non-financial private sector, divided by their legal tender liquid reserves.6 Figure 1 shows the obvious divergence in the conventional (M0) and adjusted monetary base (D) in the US during the past 50 years. The demand for currency rose steadily during that period while the demand for bank reserves remained remarkably stable in nominal terms until the current crisis. Since liabilities increased, the adjusted money multiplier rose much more sharply than the multiplier as conventionally measured.7 The adjusted m becomes a measure of the efficiency of banking services provision. If the adjusted m is very high, a high degree of lending is supported by a relatively small reserve base. If m is high, then someone making cash deposit in Peoria, Illinois sets off a cascade of interbank lending. If adjusted m is low, then that deposit sits in the vaults of the bank for a few weeks, and then is shipped to the Federal Reserve Bank of Chicago, leading to a credit in the excess reserves of the bank.
Figure 1: Monetary Base and Deposits at Central Bank (1959-2011)
Source: Federal Reserve Bank of St. Louis FRED database and authors’ calculations.
An adjusted equal to 1 is equivalent to Milton Friedman’s “narrow banking” ideal—bank transactions deposits fully backed by reserves at the central bank. Thus viewed from the mirror
5 For U.S. banknotes there is also demand by non-residents in high-inflation or unstable countries. 6 Intuitively, all money multipliers (M1, M2 etc) are relative to a monetary base. We are defining D to be the relevant monetary base analogous to the collateral discussion in this paper.
7 Thus L (total monetary liabilities of financial institutions)/M0 < L/ D.
0
1000
2000
3000
1959 1966 1973 1980 1987 1994 2001 2008
in U
SD b
illio
ns
M0 (monetary base) deposits at central bank (D)

6
image, adjusted m provides a short-hand metric of the degree of liquidity risk present in the financial system. While the liquidity risk of the banking system is of interest, we expect to find the most interesting dynamics in the shadow financial system. Since the early 1980s through 2008, this portion of the US financial system has accounted for almost the entire growth in US financial deepening (Figure 2).8
Source: Stella (2009) updated by authors from US Flow of Funds. Furthermore, since only banks have access directly to central bank deposits, the adjusted of the total financial system—both banks and the shadows—have increased sharply over the same period. This happened largely through the use of securitization and collateralized borrowing. In other words, the financial system expansion has relied on the increased use of collateral as complementary “liquid” assets beyond bank reserves (D).
III. COLLATERAL
We next consider the efficiency of the financial system in using collateral. For this, we introduce a multiplier, c, analogous to m, defined as the ratio of all financial market liabilities (satisfying certain characteristics) to the sum of deposits at the central bank (D) plus liquid collateral held by the financial system, which we denote as “C”. Where C differs crucially from D is that unlike D, which, at least in a floating exchange rate regime, is determined entirely by the central bank, C is partially market determined.
To illustrate this point let us divide C into C1 and C2. C1 comprises a class of assets that in all states of the world are accepted as collateral as they can either be directly converted into D or are direct obligations of a (fiscally sound) sovereign. C2 is composed of other assets deemed acceptable as collateral under normal market conditions but lose value when markets are distressed. C1 is primarily determined by the sovereign and central bank. It is partially
8 For non-commercial bank assets, we use flow of funds, and subtract Monetary Authority (L109) and US commercial Banks (L110) from Financial Business (L108).
0.0
2.0
4.0
1951 1961 1971 1981 1991 2001 2007 2009 2011
Figure 2: U.S. Total Credit Market Assets (ratio to GDP)
Commercial bank assets Non commercial bank assets

7
determined by market forces since households and non-financial enterprises hold C1 assets, which limits the supply available to the financial system.9 Here, for illustrative purposes, since we use the U.S. Flow of Funds data, we define C1 to comprise only direct obligations of the central government (e.g., US T-bills, or US Treasuries). The volume of C2 is fully market determined depending on market sentiment, counterparty fears, the length of collateral chains, and market imposed haircuts. C1 and C2 may be considered within Gorton’s (2012) framework as information insensitive and information sensitive assets respectively.10 The proximate cause of the 2008 liquidity crisis was the differentiation of C2 collateral from C1 collateral. The major central banks and treasuries responded to the crisis by both increasing the monetary base and swapping superior for inferior collateral.11 This led to an exponential rise and subsequent crash in the ratio of total US financial sector liabilities to what we refer to as “ultimate liquidity” (D + C1 held by banks).12
Table 1: Definition of Terms Used Terms Description
D Bank deposits at the central bank. (D excludes banknotes, vault cash) C1 Good collateral in all states of nature; can be converted to D at no haircut C2 Collateral that under normal market conditions is “good”; else loses value
C1 held by banks Only banks can convert C1 to D overnight. Nonbanks cannot change C1 to D Ultimate Liquidity D plus C1 held by banks.
The nonfinancial sector has gone from holding bank liabilities to holding a diversified portfolio of securitized assets directly. While not backed by D, they were backed by C. As long as there is confidence in the assets comprising C, or as long as C1 remains a significant share of C, it may be assumed that these claims are "liquid", i.e., they can be converted into central bank money at fairly short notice. In recent years, the financial system converted a huge stock of claims on future revenues (loans, cell phone fee receivables, etc.) from illiquid claims into notionally highly liquid claims. In the process, this created a demand to securitize other claims, such as legal damage claims, awards, lottery payouts, etc.
So what happens in that economy when suddenly there are doubts about the underlying value of Exxon shares and other securitized revenue streams? Naturally they lose their
9 Certain buy and hold financial investors such as pension funds or insurance companies may also limit the share of eligible assets that are available to the market for collateral purposes. 10 Note that Government Sponsored Enterprise and Agency debt (e.g., Fannie Mae and Freddie Mac) is now considered “safe” owing to an explicit guarantee ex-post. However, ex ante there were reasons to believe it was not a par with Treasuries. In fact, a credit event was declared on Fannie and Freddie that triggered their Credit Default Swaps. Also see Gorton and Ordoñez (2012). 11 Less generous media accounts referred to these measures as “cash for trash” or “trash for treasuries”. 12 C1 is held by banks in their own name (i.e., a balance sheet item). Pledged collateral of clients is not part of C1 as it is not included in the balance sheet of the bank (despite rights of re-use via rehypothecation of pledged collateral). Flow of Funds only captures balance sheet items (and not footnotes to balance sheet).

8
attractiveness as investments and as liquid assets that are used as money. Suddenly there is deemed to be a liquidity shortage and this intensifies when it is clear just to what extent the value of pseudo liquid assets in the economy has expanded in relation to central bank money. Other collateral or money may continue to be acceptable, such as U.S. Treasuries, Bunds etc. So there is a sudden split between cash and certain types of collateral, and everything else. Everything else ceases to be liquid.
Some analytics of collateral --pre and post crisis Before the 2008 crisis, C2 comprised an abundance of securities and the nature and number of such securities was growing. Ultimate liquidity leverage (total liabilities/{D+C1 held by commercial banks}) was growing exponentially as D was extremely small. There was a price differential among D, C1, and C2 but it was small, a few basis points. So the market was operating with a reasonable liquidity cushion, i.e. although ultimate liquidity leverage was quite high, total liquidity leverage ( or total liabilities/{D+C1+C2}) may have been deemed adequate or more than adequate.
During the crisis, the quantity and nature of securities comprising C2 changed dramatically. At the same time, there was a surge in demand for liquidity. Basically, institutions that were borrowing using C2 as collateral had to find C1 or D to avoid default as they could no longer use the securities (now distressed) that used to be in C2. This differs from some of the academic work that lumps all collateral together. Some collateral will always remain close to par or above par and not lose value (i.e., C1). There was a race to acquire the highest quality collateral, C1 that was then hoarded. The information sensitive portion of C (i.e., C2) became subject to a “lemons” problem. C2 consequently was no longer accepted at a full information market clearing price or, sometimes, at any price. Central banks became subject to a form of Gresham’s Law if they were slow or reluctant to adjust their collateral policies accordingly.13
This may be a detour, but there is at present a similar discussion regarding liquidity provision in the context of the demand for short duration Bunds, but this stems from the Eurozone crisis and the need to skirt political/legal constraints to obtain seniority. However, short Bund yields have been negative recently, suggesting that there has been no bending over backwards to cater to the demand for ‘safe’ assets. In fact, if the short-end curve bias continues due to the LTROs, then EU bills—if issued in the near future—would be one part of the arsenal to contain the crisis. It may be useful to note that Japanese short end issuance is intertwined with other monetary policy variables, including key foreign-exchange levels for the yen (and thus draws parallels to the pre-1981 policy in the United States). This raises, in addition, the interesting question as to whether the provision of liquidity relief through
13 The recent events in the Eurozone are in line with this theoretical description. Policymakers have the task to increase the volume of C1 collateral in the market domain. One way is to accept C2 collateral (which will have a zero velocity by definition as it will be parked at the central bank) in exchange for D or C1 at a subsidized price (see Chailloux, Gray and McCaughrin, 2008). Printing money via conventional Quantitative Easing (QE) i.e., exchanging D for C1 does not increase D + C1.

9
collateral substitution (C1 for C2) should be better undertaken by treasuries (fiscal agent)—owing to the fiscal risk entailed—or by central banks.14 Although we do not have a long historical series for C2, we do have them for D and C1 via the Flow of Funds data.15 As defined earlier, we call the sum of D and the portion of C1 held by banks “ultimate liquidity.” Only C1 held by banks were included in ultimate liquidity as only banks could transform C1 into D overnight. One can see that before the crisis, the ratio of total financial intermediaries’ liabilities—the broadest measure of financial sector liabilities available—to ultimate liquidity was rising exponentially. This measure is currently back to a level last seen in the 1970s, before the rapid expansion of the shadows and the securitization boom that started with mortgage backed securities in the early 1980s. Total financial system ultimate liquidity leverage rose from 4 at end 1951 to 673 at end 2006 before falling sharply to 33 at end 2011 (Figure 3). By comparison, ultimate liquidity leverage was 36 at end 1981. Ultimate liquidity deleveraging was effected almost entirely through an increase in D. Between end 2007 and end 2011, D rose by $1.5 trillion and C1 held by banks rose by only $0.1 trillion.16 Total liabilities rose by $1.1 trillion over the same period.
Source: US Flow of Funds and authors’ calculations
14 During 2008-09 both the US Treasury and the Fed had MBS purchase programs; in other words, such actions muddle the fiscal costs to Central Bank balance sheets. 15 Flow of Funds Tables L108 and L109 "Total Liabilities of Financial Business minus Total Liabilities of Monetary Authority" (Financial Business table in FOF is sum of all types of financials including Fed so needed to subtract Fed)—see Figure 3. For Figure 4, we use FOF’s Table L110 "Total Liabilities of US Chartered Commercial Banks". For Figure 5, we use Table L108, L109, and L110 ""Total Liabilities of Financial Business minus Total Liabilities of Monetary Authority minus Total Liabilities of US Chartered Commercial Banks" (Financial Business table in FOF is sum of all types of financials including Fed, we subtract Fed and Commercial banks to arrive at Nonbank financials). 16 We exclude Federal Reserve Bank liabilities and holdings of Treasuries in these calculations as the Fed has increasingly provide support to this market in recent years. Fed holdings of US Treasuries are thus removed in our charts and other calculations.
0
200
400
600
800
1951
1956
1961
1966
1971
1976
1981
1986
1991
1996
2001
2006
2011
Figure 3: Ratio of Total US Financial Intermediaries Liabilities to Ultimate Liquidity

10
We next consider banks and nonbanks liquidity leverages. The liquidity leverage of both banks and nonbanks experienced a similar increase and dramatic decrease before and after the crisis as seen in Figure 4 and Figure 5 below. Whereas liquidity deleveraging was accomplished in the banking system through an increase in D, for nonbanks this was not possible (note, the denominators of Figure 4 and Figure 5 are different). Consequently, their liquidity deleveraging was effected through an increase in holdings of C1 and a decline in total liabilities. In the context of banks and nonbanks, the substitution of D and C1 is important. Between end 2007 and end 2011, C1 held by nonbanks rose by $1.4 trillion while total liabilities fell by $2.7 trillion.17 Clearly, from the balance sheet identity, nonbank holdings of C2 assets had to fall. Among the more prominent declines were in mortgages, which fell by $1 trillion (due to Fed’s buying program), and holdings of commercial paper and bankers’ acceptances, by $0.6 trillion.
Source: US Flow of Funds and authors’ calculations
Source: US Flow of Funds and authors’ calculations
17 Figure 3 is sum of numerators of Figure 3 + Figure 4 divided by the denominator of Figure 3 only. The intuition is that nonbank financials hold the vast proportion of C1; post crisis the banks picked up D and the nonbanks C1.
0
50
100
1951
1956
1961
1966
1971
1976
1981
1986
1991
1996
2001
2006
2011
Figure 4: Ratio of Total US Commerical Bank liabilities to Ultimate Liquidity
0
20
40
60
1951
1956
1961
1966
1971
1976
1981
1986
1991
1996
2001
2006
2011
Figure 5: Ratio of Total US Nonbank Financial Intermediaries Liabilities to their holdings of C1

11
Thus, before crisis, there was an inverse pyramid on a very small "money and safe collateral base". What has happened post crisis is that there has been a disintermediation process; people are withdrawing from leveraged institutions, there has been a reassessment of what is acceptable collateral, an increase in the haircuts applied to that collateral, fear of insolvency, etc. (e.g., Greek collateral is not acceptable for repo at LCH’s Repoclear arm).18 Therefore the interbank/ inter-institutional market is grinding to a halt. This is exactly what Friedman’s narrow banking proposal had been designed to prevent—payments gridlock. During the crisis, not only has the interbank market dried up and the exposures to each other become restricted, but the volume of credit to the nonbank sector has also fallen (Singh and Aitken, 2009). To the extent that the central bank merely substitutes central bank money for assets that have retained their value as collateral, not much liquidity relief is attained. In order to provide effective liquidity relief for the system, central bank money and liquid collateral must be injected against illiquid or undesirable assets (C2); the supply of unencumbered collateral has to increase. This requires the government or the central bank to take some risk on their balance sheets. As part of their crisis response the treasuries of the U.K., U.S. and Norway, inter alia, swapped government debt for a variety of less liquid collateral including mortgage backed securities (MBS). Not all operations provided collateral liquidity, however. Purchases of highly liquid government debt (C1) for D did not provide liquidity in that the sum of D + C1 remained unchanged.19
IV. SAFE ASSETS AND TREASURY-BILLS—WHAT DETERMINES THEIR SUPPLY
Around end-2011, the short term US Treasury yield curve was at 1 basis point (bp) for 1 month, 2 bps at 3 month, 6 bps at 6 month, and 12 bps at 12 month. Meanwhile the Fed is currently paying banks 25 bps on overnight deposits. Clearly, no US bank is going to bid in the T-bill auction for its own account. This takes out quite a lot of demand. So for the market to be clearing at such low rates there must be sizable demand coming from somewhere—nonbanks (e.g., mutual funds). Nonbanks investors flush with liquidity prefer fewer bonds and more T-bills; cash rich nonbanks continue to suggest there remains a shortage of bills and lobby for more.20 However, the total volume of debt issuance is determined by budgetary needs and financing options (long vs. short tenor).
Related to this discussion is the recent research that highlights demand for “safe assets” (which may have several definitions, including Gorton 2012). Since 1982, the U.S. Treasury’s ‘regular and predictable debt issuance strategy’ had a primary goal: issue at least
18 Some C2 collateral was indistinguishable from C1 collateral in the good state. However, post crisis, some of the C2 type collateral does not have a “market clearing” price. Last year, Greek bonds were not acceptable at LCH Clearnet (U.K.) at any level of haircut. Although the newly issued Greek restructured bonds are acceptable at the ECB such C2 collateral does not have a market clearing price and are still not accepted at LCH Clearnet.
19 Although liquidity relief was not provided by our definition, interest rate risk may have been traded. 20 This is exactly what the Fed “twist” did (T-bill supply increased while bonds in the market decreased).

12
cost. Figure 6 illustrates that the Treasury is roughly meeting its objective. The correlation between bills/total issuance and 10 year minus 6 month spread is over 0.6. (Annex 1 highlights the debt management policy and structural changes since 1961). In the current environment, a change in the composition of U.S. debt toward the short end would shift interest rate risk from the private sector to the public balance sheet. This increases the Treasury’s fiscal risk unless one presumes that nonbanks would be bailed out anyway, as happened in 2008/09 (see Tuckman, 2012). Thus catering to the nonbank demand ex-ante is a feint attempt to skirt the more obvious needs that would become apparent during a crisis.
Figure 6: Ratio of T-Bills/Total issuance by U.S. Treasury since 1982
Source: Fed and Treasury; we remove Fed holding of US Treasury issues
It is also important to note that D is currently yielding zero but providing a nominal guarantee (put at par) for free. As discussed in the context of money, D is more liquid than C1 by definition. The desire to pick up yield on assets that can be put to a central bank at par is what makes C1 more attractive than D. In the past, this put was largely ignored but at zero interest rates the insurance premium imposed by FDIC on bank deposits is material.21 Another relevant example was the Transaction Account Guarantee extension whereby FDIC stipulated that for those opting for (extended) deposit insurance would have to pay between 15 bps-25 bps.22
Safety of principal (i.e., no interest is paid) is being offered by one of the two main US custodians, Bank of New York (charging 13 bps). If demand for 1 month T-bills is indeed
21 http://www.ft.com/intl/cms/s/0/bd97ee02-beaf-11e0-a36b-00144feabdc0.html#axzz1owTdW18t FDIC (under Dodd Frank Act) allows temporary unlimited deposit insurance till end-2012 on non-interest bearing transaction accounts. 22 http://www.fdic.gov/news/news/financial/2009/fil09048.html Here, the public sector must recognize that liquidity has externalities for financial stability and consequently should not necessarily be provided only at “market” prices.
-2
0
2
4
-0.15
0.05
0.25
0.45
1982 1992 2002 2012
Bills / Total (LHS) Spread 10y - 6m (RHS)

13
relatively inelastic (see Duffee, 1998), the market can clear at much lower T-Bill spreads (i.e., up to negative 13 basis points). Thus one might raise the question why the Fed is paying 25 bps rather than charging 13 bps for accepting deposits—this is a 38 bps subsidy to the banks when compared to the shadow ‘market clearing’ price for safe assets for nonbanks. An intuitive explanation of the 38 bps “wedge” and (likely) arbitrage is due to market segmentation. A newly established bank will have to pay FDIC for deposit insurance. This cost of deposit insurance may (more than) wipe-out the 13 bps or similar fee charged to a client for unlimited deposits. The remaining 25 bps on excess reserves is still available for a new bank which will be weighed against the cost of entering the market, the likelihood of Fed maintaining ‘25 bps on excess reserves’ etc. .
The recent U.S. Treasury’s Borrowing Advisory “broadly agreed that flooring interest rates at zero, or capping issuance proceeds at par, was prohibiting proper market function. The Committee unanimously recommended that the Treasury Department allow for negative yield auction results as soon as logistically practical.” 23 Some other elements of the TBAC report are also interesting (see Box 1).
Box 1. Floating Rate Note “puts”—are they forthcoming? At the time of the discussions leading up to the Fed-Treasury Accord of 1951 which ended an extended period of artificially suppressed interest rates on Treasury bonds, there was much internal debate about the potential deleterious impact on bondholders from a “surprise” rise in rates. There was also concern about a potential buyers strike and/or fear that a new market equilibrium would entail a sharp spike in rates. This discussion was conditioned by the similar situation faced by the U.S. Treasury in 1919 after it promised to stabilize bond prices during and after WWI. This policy caused conflict with certain Fed policymakers and the eventual losses on Liberty bonds were still remembered by Congress and the Treasury in 1951, 30 years later. As a consequence, at the time of the announcement of the Accord, buyback options were offered by the Treasury, that is the U.S. Treasury offered to swap the outstanding stock of long-term debt with new long term debt with higher coupons (coupled with restrictions on sales before maturity). The idea was to cushion the market from capital losses. Might the U.S. Treasury go down a similar path again in conjunction with an eventual Fed exit strategy? In the current environment, markets have witnessed a 30 year secular decline in bond market yields. Serious market turbulence might result, significantly greater than that associated with the February 1994 “surprise” rise in rates initiating a tightening cycle, were the market to believe it were embarking on a steady (or rocky) rise in rates from near zero to a “neutral” fed funds rate of 400 bps and a "normal' 5 percent yield on 2-year U.S. Treasuries. The recent TBAC’s proposal for floating rate notes (FRNs) seems an obvious option to cushion the transition for the market. As an indication that the eventual unwinding and normalization of the yield curve will take time and inflict pain on holders of fixed income debt, the market appears already to be requesting such "puts". In this context, it is useful to quote from recent TBAC report (Jan 31, 2012) “… ways to explore the viability of Treasury issuing floating rate notes (FRNs). In particular, the presentation [attached] assessed potential client demand, optimal maturity, reference index, and reset frequency. The structural decline in the stock of global high-quality government bonds, coupled with an increase in demand for non-volatile liquid assets, should make U.S. government issued FRNs extremely attractive. Pricing for a hypothetical two year FRN was estimated to be in the arena of 3 month Treasury bills plus 8 basis points.”
23 Report to the Secretary of the Treasury form the Treasury Borrowing Advisory Committee of the Securities Industry and Financial Markets Association, January 31, 2012.
14
In this context, it is useful to recall that the U.S. Treasury discontinued 30 year bonds in the early 2000s—the Treasury did not factor in the demand for duration coming from pension funds and insurers. Due to the primary surplus in the Clinton years, the U.S. Treasury continued to largely embrace their debt issuance strategy. In fact, with no new 30 year bonds, the 30 year swap curve turned negative as pension/insurers were short of the 30 year bonds. So although at present some nonbank sectors continue to demand more T-Bills issuance, it is not clear why U.S. Treasury has to accommodate to such lobby. It should be noted that the role of government policy-–in reshuffling debt issuance--is diminished when debt is high/capped (Greenwood, Hanson, Stein, 2011).24
V. COLLATERAL CHAINS
Many recent financial regulations have largely focused on building significant equity cushions and reducing leverage at large banks and have not fully incorporated the nonbank/bank funding nexus.25 Until recently, non-bank funding to banks was assumed to be sticky and mainly in the form of household deposits. However, the size and elasticity of the “nonbank/bank funding” nexus is also an important component that should be considered (Borio and Disyatat, 2011).26 Furthermore, leverage-like elements that stem from the pledged collateral market add to the overall “financial lubrication” of the monetary world. An example of nonbank funding to banks is via the ‘supply’ of pledged collateral that is typically received by the central collateral desk of large banks active in the collateral business (this market is independent of tri-party repo market that is a primary dealer market backstopped by the Fed). The key providers of primary (or source) collateral to the ‘street’ (or large banks) are: (i) hedge funds; (ii) securities lending (via custodians) on behalf of pension funds, insurers, official sector accounts, etc. The securities they hold are continuously re-invested to maximize returns over their maturity tenor. Source collateral is collateral that can be re-pledged, creating collateral chains. The term re-pledged is a legal term and means that the dealer receiving the collateral has the right to re-use it in its own
24 Their suggestion of “replacing the entire stock of T-Bills with maturity greater than 100 days, with T-Bills of an average duration of 58 days” will entail rollover risk. In the present environment the long end offers free money in real terms. 25Much of the empirical work undertaken using variants of equity and leverage from the banking sector has neglected to include this hidden fragility of nonbank funding in their analytical frameworks; thus their work (and associated empirical results) is susceptible to model misspecification. 26 Analytically, bank credit to ultimate borrowers is either funded by the equity of the banking system or by the savings that non-banks (i.e., households, pension funds and insurers) provide to the banking system. The traditional view of a banking system is that total debt funding from nonbanks is relatively “sticky.” In other words, it is often assumed that non-bank funding to banks predominantly reflects households’ deposits (or M2) only and since the stock of household deposits is steady, the debt funding to banks did not vary. However, ignoring non-M2 related funding was a flawed assumption.

15
name.27 Since a single piece of source collateral can be re-used several times by several different intermediaries, the aggregate volume of re-pledged collateral reflects both the availability of collateral (that is collateral from the “source) as well as the re-use rate of source collateral. Empirical evidence suggests that these chains (on average) were longer pre-Lehman (around 3 as of end-2007 compared to about 2.4 as of end-2010 and may have likely fallen even further in 2011 (Singh, 2011). Intuitively, this means that collateral from a primary source now takes ‘fewer steps’ before reaching the ultimate client. This is due to the concern of source collateral providers about the counterparty risk posed by the large banks, and also to the demand for higher quality collateral by the ultimate clients; lower quality collateral is difficult to move in present times. Aggregating across the major banks active in collateral trading, the volume of source collateral that was re-pledged (or re-used) was about $10 trillion at year-end 2007. While re-pledged collateral reached a nadir of $5 trillion at end-2009, it remained sizable at around $5.8 trillion (end-2010). This means that there are large volumes of source collateral accruing to global banks which they can “freely” recycle in financial markets. These operations lead to cross-border interconnections that straddle multiple jurisdictions.28 However, none of the regulatory proposals address these velocity-like characteristics of pledged collateral which is a serious lacuna in regulators’ field of vision.
VI. MONETARY POLICY AND FINANCIAL LUBRICATION
Regulators may take solace from the fact that lower leverage and shorter collateral chains lessen financial stability risks. However, from a monetary policy perspective, the global financial market transmission mechanism is currently in the midst of an episode of grinding gears. The reduced availability of collateral and shorter “collateral chains”—resulting from constrained collateral trading— lower global financial lubrication and increase the overall cost of capital to the real economy. In the U.S. and Europe, both the Fed and ECB consider many information variables when determining monetary policy. The monetary base or M2 is an integral part of the “orthodox” monetary informational variable tool-kit where the velocity of money is considered stable.29 After Lehman and the aforementioned grinding of the gears of the transmission mechanism, and as central banks have drifted toward the “zero” interest rate lower bound, traditional operational variables such as the overnight interest rate and guideposts such as the Taylor rule have become largely moot. Instead, there has been an increased resort to quantitative-based or QE policies (Hanoun, 2012).
27 Since the U.S. has restrictions on re-use of client collateral, the prevalence of rehypothecation outside the U.S. allows for a market clearing price for financial collateral in Europe (i.e., U.K. and continental Europe). 28 Cross-border funding is important for large banks, allowing for the efficient arbitrage of their funding operations.
29 Ricks (2011) makes a legal distinction between fiat money and other money-like other instruments.

16
In considering an appropriate degree of balance sheet expansion, it is important to recognize that what has been done so far by the key central banks may not have sufficiently substituted for the loss in financial collateral, particularly to the extent that traditional QE may have merely substituted D for C1. The state of the pledged collateral market needs to be considered when setting monetary policy and more consideration may need to be given to qualitative easing such as the substitution of D or C1 for less liquid assets.30 An example is the recent move by the FSA (UK) that allows banks to undertake liquidity swaps with insurers/pension funds whereby the banks receive gilts or highly liquid collateral (C1) against C2 collateral (e.g., mortgage backed or infrastructure bonds). There are links between pledged collateral that is intermediated by large banks and “quantitative” monetary policy instruments. For example, in many markets cash and unencumbered collateral substitute for each other—certain CCPs or central clearing entities are indifferent between cash or (acceptable) collateral. Through QE, central banks have tried to add towards global lubrication. Overall, global liquidity remains below pre-Lehman levels. This does not imply anything about the optimality of the pre-Lehman level of global liquidity. When we consider collateral use/reuse in addition to M2 in the U.S., U.K. and Eurozone, overall financial lubrication was over $30 trillion before Lehman (and one-third came via pledged collateral); now it is lower by about $4 - 5 trillion (Singh, 2011). Unless there is some rebound in the pledgeable collateral market (by either an increase in ‘source’ collateral, or its velocity or re-use rate), the likely asymmetry in the demand and supply of good collateral may entail some difficult choices for the markets and the regulators.
VII. CONCLUSION
“Monetary” policy is currently being undertaken in uncharted territory and may change some fundamental assumptions that link monetary and macro-financial policies. Central banks are considering whether and how to augment the apparently ‘failed’ transmission mechanism and in so doing will need to consider the role that collateral plays as financial lubrication (see also Debelle, 2012). Swaps of “good” for “bad” collateral may become part of the standard toolkit.31 If so, the fiscal aspects and risks associated with such policies—which are virtually nil in conventional QE swaps of central bank money for treasuries—are important and cannot be ignored. Furthermore, the issue of institutional accountability and authority to engage in such operations touches at the heart of central bank independence in a democratic society.32
30 See Tarullo (2011) and Dudley (2011), two Fed policymakers, for recent views along lines favoring new purchases of MBS rather than Treasuries. As noted earlier, similar actions could in principle be undertaken by the Treasury where the attendant fiscal risk might be more appropriately managed and budgeted. Other FOMC members have argued against resuming MBS purchases and for returning quickly to a “Treasuries only” policy. 31 Since the Lehman crisis, central banks have interposed themselves as risk-taking intermediaries in the market and/or have circumvented the transmission mechanism by acting directly on specific long term interest rates through quantitative interventions. See Chailloux et al (2008). 32 See Lacker (2009), Plosser (2012) and Shirakawa (2009) for considerations of this question.
(continued…)

17
These fundamental questions concerning new policy tools and institutional design have arisen at the same time as developed countries have issued massive amounts of new debt. Although the traditional bogeyman of pure seigniorage financing, that is, massive monetary purchases of government debt may have disappeared from the dark corners of central banks, this does not imply that inflation has been forever arrested. Thus a central bank may “stand firm” yet witness rises in the price level that occur to “align the market value of government debt to the value of its expected real backing.” 33 Hence current concerns as to the potential limitations fiscal policy places on monetary policy are well founded and indeed are novel only to those unfamiliar with similar concerns raised for decades in emerging and developing countries as well as in the “mature” markets before World War II.34
33 In models of the fiscal theory of the price level, such as Leeper and Walker (2011), inflations may have fiscal origins without any necessary debt monetization.
34 Problems that may arise when the fiscal authorities do not support central banks are discussed in Sims (2003), Stella (2005) and Park (2012).

18
Annex 1: U.S. Treasury Debt Management Strategy since the 1960s 35
Prior to 1982, the U.S. Treasury had issued debt on a “tactical” basis that did not follow a predictable pattern and often caught investors off guard and also adversely impacted markets. During the early 1960s, the Treasury issued every quarter for cash and to retire maturing debt. Maturities were selected after surveying market participants’ demand for various tenors. During the 1970s, due to the sizable deficit in 1975, sizable tactical offerings were disrupting the market. The Treasury decided to change the framework for debt issuance to a more “regular and predictable” timetable so that the investors could plan in advance. Also, before 1982, the Treasury had sometimes announced other policy objectives in addition to least-cost financing. For example, in the 1960s, Treasury issuance would be influenced by the desire to increase (or maintain upward pressure) on short-term interest rates to prop up the value of the U.S. dollar or, contain long-term interest rates to spur economic growth. As shown in the figure below, prior to 1982 there were too many policy objectives that did not result in least-cost financing (i.e. there is no discernable relationship between issuance of US T-Bills relative to total debt issuance and the cost of long-term/short-term funding). The structural break in the series from 1960-2011 in the early 1980s (Chow test), provides support to the inception of “regular and predictable.”
Figure 7. Bills/Total Issuance Relative to 10-year Yields Minus 6-month Yields
Source: US Treasury; data removes Fed holdings of The U.S. Treasury
However, since 1982, the “regular and predictable” issuance became a pre-condition to least cost financing objective. The correlation between the ratio of US T-bills/Total debt issuance, and the relevant funding costs is over 0.6. This strategy, however, gives the Treasury some flexibility to alter the timing of the auction schedules. For example, in 1985, STRIPS were introduced; these enhanced demand and contributed to lower financing costs. In 1991, there was a shift from bills to longer term notes; also in 1993, seven-year notes gave way to thirty-year bonds; in 1998, three-year notes were substituted by five-year notes. Also during the early 2000s, the 30-year bonds were discontinued in light of large and persistent federal budget surpluses and a significant reduction in financing requirements. Thus given the “regular and predictable” issuance schedule since 1982 and the bias towards least cost financing, taking rollover risk at taxpayer expense may not be feasible today (especially when cost of long term debt is almost zero in real terms).
35 This box primarily builds on the findings of the NY Fed’s Economic Policy Review (March 2007, Garbade).
-2
-1
0
1
2
3
4
0.00
0.05
0.10
0.15
0.20
0.25
0.30
0.35
0.40
0.45
1960 1970 1980 1990 2000 2010
Bills / Total (LHS) Spread 10y - 6m (RHS)
Post-1982: Debt management's single objective of least cost financing
19
References Abate, Joseph, 2012, Barclays Capital, Collateral Updates, various issues. Borio, Claudio, and Piti Disyatat, 2011, “Global Imbalances and the Financial Crisis,”
BIS Working Papers No 346 http://www.bis.org/publ/work346.pdf. Chailloux, Alexandre, Simon Gray, Ulrich Klüh, Seiichi Shimizu, and Peter Stella, 2008,
“Central Bank Response to the 2007–08 Financial Market Turbulence: Experiences and Lessons Drawn,” IMF Working Paper 08/210.
Chailloux, Alexandre, Simon Gray, and Rebecca McCaughrin, 2008, “Central Bank
Collateral Frameworks: Principles and Policies,” IMF Working Paper 08/222 Debelle, Guy, On Europe’s Effects on Australian Financial Markets, Address to Bloomberg
Seminar,Sydney – 14th February, 2012 http://www.rba.gov.au/speeches/2012/pdf/sp-ag-140212.pdf
Dudley, William C., 2011, “Securing the Recovery and Building for the Future,” Remarks at
the United States Military Academy, West Point, New York, November 17. Garbade, Kenneth D., 2007, “The Emergence of Regular and Predictable As A Treasury
Debt Management Strategy” (Federal Reserve Bank of New York, Economic Policy Review, March).
Gennaioli, Nicola, Andrei Shleifer, and Robert Vishny, 2011, “A Model of Shadow
Banking,” NBER Working Paper No. 12115. www.nber.org/papers/w17115. Gorton, Gary. B., Lewellen, Stefan M., and Metrick, Andrew, 2012, “The Safe-Asset Share.”
Available at SSRN: http://ssrn.com/abstract=1986945 Gorton, Gary B., and Guillermo Ordoñez, 2012, “Collateral Crisis,” NBER Working Paper
17771, January. Hanoun, Herve, 2012, “Bank for International Settlement speech, Monetary Policy in
Crisis—Testing the Limits of Monetary Policy,” January 27. http://www.bis.org/speeches/sp120216.pdf Krozner, Randall S., 2003, “Currency Competition in a Digital Age,” Chapter 7 in Evolution
and Procedures in Central Banking, eds. David E. Altig and Bruce D. Smith, Cambridge University Press.
Lacker, Jeffery M, 2009, “Government lending and Monetary Policy,” Speech at the National
Association for Business Economics,” Washington Economic Policy conference, Alexandria, Virginia, March 2.

20
Leeper, Eric M., and Todd B. Walker, 2011, “Perceptions and Misperceptions of Fiscal Inflation,” BIS Working Paper No. 364.
Park, Seok Gil, 2012, “Central Bank Quasi-Fiscal Policies and Inflation,” IMF Working
Paper 12/14. Plosser, Charles I., 2012, “Fiscal Policy and Monetary Policy: Restoring the Boundaries,”
speech to the U.S. Monetary Policy Forum, University of Chicago Booth School of Business, New York, February 24. http://www.philadelphiafed.org/publications/speeches/plosser/2012/02-24-12_us-monetary-policy-forum.pdf
Ricks, Morgan, 2011, “Regulating Money Creation After The Crisis,” Harvard Business Law
Review 75, Vol 1. Schularick, Moritz, and Alan M.Taylor, “Credit Booms Gone Bust: Monetary Policy,
Leverage Cycles and Financial Crisis, 1870-2008,” NBER WP 15512 (forthcoming AER).
Shirakawa, Masaaki, 2009, “Unconventional Monetary Policy—Central Banks: Facing the
Challenges and Learning the Lessons,” remarks at a conference co-hosted by the People’s Bank of China and the BIS, Shanghai, August 8.
Sims, Christopher, 2003, “Limits to Inflation Targeting,” www.princeton.edu/~sims/. Singh, Manmohan, 2011, “Velocity of Pledged Collateral—Policy and Implications,” IMF
Working Paper, 11/256. Singh, Manmohan, and James Aitken, 2009, “Deleveraging Post-Lehman—Some Evidence
from Reduced Rehypothecation,” IMF Working Paper 11/42. Stein, Jeremy, 2012, Interview, Study Center, Gerzensee, Swiss National Bank
www.szgerzensee.ch/fileadmin/Dateien.../Newsletter_January_2012.pdf. Stella, Peter, 2005, “Central Bank Financial Independence and Policy Credibility,”
IMF Staff Papers, Vol. 52 No. 2. –––––, 2009, “The Federal Reserve System Balance Sheet: What Happened and Why it
Matters,” IMF Working Paper 09/120. Tarullo, Daniel K. 2011, “Unemployment, the Labor Market, and the Economy,” speech at
the World Leaders Forum, Columbia University, New York, NY, October 20. TBAC, 2012, Report to the Secretary of the Treasury form the Treasury Borrowing Advisory
Committee of the Securities Industry and Financial Markets Association, Jan’31. Tuckman, Bruce, 2012, “Federal Liquidity Options: Containing Runs on Deposit Like Assets
without Bailouts and Moral Hazard,” Center for Financial Stability.