monetary policy transparency and pass-through of retail interest rates ming-hua liu, dimitri
TRANSCRIPT
Monetary Policy Transparency
and Pass-Through of Retail Interest Rates
Ming-Hua Liu, Dimitri Margaritis and Alireza Tourani-Rad
Paper 23-2005

ISSN 1176-1997
MONETARY POLICY TRANSPARENCY AND PASS-THROUGH OF RETAIL INTEREST RATES
Ming-Hua Liu, Dimitri Margaritis and Alireza Tourani-Rad
2005 © - Copyright of the Author(s) Dimitri Margaritis
Faculty of Business Auckland University of
Technology Private Bag 92006
Auckland 1020 New Zealand
Tel: +64-(0)9-917-9999 x5394 Fax: +64-(0)9-917-9876
e-mail: [email protected]
Ming-Hua Liu * Faculty of Business
Auckland University of Technology
Private Bag 92006 Auckland 1020 New Zealand
Tel: +64-(0)9-917-9999 x5398 Fax: +64-(0)9-917-9876 e-mail: [email protected]
Alireza Tourani-Rad Faculty of Business
Auckland University of Technology
Private Bag 92006 Auckland 1020 New Zealand
Tel: +64-(0)9-917-9999 x5336 Fax: +64-(0)9-917-9876
e-mail: [email protected] * Author for Correspondence
The opinions and views expressed in this paper are those of the author(s) and not necessarily those of
AUT of the General Editor or Review Panel of Enterprise and Innovation.
Printed by PrintSprint, Wakefield St., Auckland, NZ

AUT AUTHORS
ASSOCIATE PROFESSOR MING-HUA LIU
Dr Liu is currently an associate professor of finance with expertise in banking, investments and financial risk management. Dr Lui worked in the financial services industry for twelve years prior to joining AUT, and his research articles have appeared in the Journal of Banking and Finance, Pacific Basin Finance Journal, Advances in Pacific Basin Financial Markets, Advances in Pacific Business, Economics and Finance, and Law and Policy in International Business. He is an associate editor of African Finance Journal. Dr Liu’s research has won best paper awards in major international finance conferences and also received the teacher of the year award.
PROFESSOR DIMITRI MARGARITIS
Dimitri Margaritis is Professor of International Finance in the Faculty of Business. He was previously Professor of Economics at the University of Waikato and has in the past held academic appointments at SUNY-Buffalo, Southern Illinois University, the University of Washington, and the University of British Columbia. He served as Advisor and Manager of Research at the Reserve Bank of New Zealand in the early 1990s and was subsequently appointed as the Bank's Senior Research Fellow while he returned to teach at Waikato Universiity. He was a member of the World Bank's project on Financial Reform and is currently the leader of the New Zealand Enterprise Efficiency and Productivity project funded by the Foundation for Research, Science and Technology. He has published extensively in the international refereed literature in monetary policy, international finance, health economics, economic growth and productivity.
PROFESSOR ALIREZA TOURANI-RAD Dr. Alireza Tourani-Rad is a Professor in Finance and head of the Finance Research Centre. His previous positions include Professor of Finance at the University of Waikato Management School and Associate Professor at Masstricht University in the Netherlands. Dr. Tourani-Rad specialises in the corporate and international finance areas. He completed his Ph.D. at the Free University of Brussels and his Masters’ degree at the Catholic University of Leuven in Belgium. He was Executive Vice President of the European Financial Management Association and Secretary of the Limburg Institute of Financial Economics. He has held visiting positions at a number of leading European Universities and has published extensively in international journals.

MONETARY POLICY TRANSPARENCY AND PASS-THROUGH OF RETAIL INTEREST RATES
ABSTRACT
This paper examines the degree of pass-through and adjustment speed of retail
interest rates in response to changes in benchmark wholesale rates in New
Zealand during the period 1994 to 2004. We consider the effect of policy
transparency and financial structure in the transmission mechanism. New
Zealand is the first OECD country to adopt a formal inflation targeting regime with
specific accountability and transparency provisions. Policy transparency was
further enhanced by a shift from quantity (settlement cash) to price (interest rate)
operating targets in 1999. We find complete long-term pass-through for some but
not all retail rates. Our results also show that the introduction of the Official Cash
Rate (OCR) increased the pass-through of floating and deposit rates but not fixed
mortgage rates. Overall, our results confirm that monetary policy rate has more
influence on short-term interest rates and that increased transparency has
lowered instrument volatility and enhanced the efficacy of policy.
JEL classification: E43
Key Words: Monetary Policy, Transmission Mechanism, Interest Rates

1
I. INTRODUCTION Monetary policy is the primary tool of macroeconomic management in nearly all
industrialized countries. When monetary policy needs to be tightened (loosened),
the central bank or monetary authority will increase (decrease) the official interest
rate, banks and other types of financial institutions will follow suit by raising
(reducing) their deposit and lending rates. Faced with higher (lower) cost of
funds, consumers and companies will adjust their consumption and expenditure
accordingly, thus affecting output and inflation. The efficacy of monetary policy
thus depends on how fast and to what extent financial institutions pass through
changes in the official rate to their customers.
While there are numerous studies on monetary policy transmission, the
retail interest rates pass-through process is relatively under-explored, at least
until recently. Most of the studies on the transmission mechanism of monetary
policy assume immediate and complete pass-through of changes in official rates
to retail bank rates (for example, Bernanke and Gertler, 1995; Kashyap and
Stein, 2000; Altunbas et al, 2002). Recent studies show that the pass-through
may be incomplete and that the adjustment speed may be sluggish. The pass-
through and adjustment speed also differ across financial institutions and across
financial products, which implies that the speed of monetary transmission varies
across different segments of the banking sector. Further, some studies also find
that the adjustment speed is different depending on whether rates are above or
below their long-term equilibrium level (Chong et al, 2005; Kleimeier and Sander,
2005).
In this study, we examine the degree of pass-through and adjustment
speed of retail interest rates when benchmark interest rates change in New
Zealand. Specifically, we analyze the following issues: Firstly, we consider the

2
long-term pass-through of the official rate and interbank rate to various retail
interest rates such as deposit and lending rates including the base lending rate
and mortgage rates of different maturities. We employ the Phillips-Loretan (1991)
methodology which eliminates asymptotic bias problems and allows for
meaningful statistical inferences on the long-run coefficients. By incorporating
the effect of dynamics in the data generation process (DGP), this method also
accounts explicitly for the role of past policy surprises and future expected policy
settings in the relationship between retail rates and policy instruments. Secondly,
we examine the short-term pass-through and the adjustment speed of retail
interest rates using an error correction model and also test whether the
adjustment speed is symmetric or asymmetric. Finally, we investigate whether a
change in monetary policy operating procedures and increased transparency of
monetary policy as a result of the adoption of the Official Cash Rate (OCR)
instrument in 1999 has had a different effect on the pass-through and adjustment
speed of interest rates in New Zealand.
There are at least three reasons why a study of the New Zealand
transmission mechanism is important. Firstly, New Zealand is the first country to
adopt an explicit inflation targeting regime with specific accountability and
transparency provisions. These arrangements became a prototype model for the
policy frameworks adopted by other OECD countries and more recently a
number of developing countries. Secondly, unlike most other countries, there
was a major shift in the monetary control mechanism in New Zealand during this
period away from quantity targets (settlement cash balances) and towards price
based (OCR) settings. Although under either of these two regimes the
transmission of monetary policy would operate primarily through interest rates,
the question is whether and to what extent there will be a change in the degree
and adjustment speed of pass-through from policy instruments to retail rates and
by implication to the effectiveness of monetary control. We would expect that
under a price regime the role of interest rates in the transmission mechanism will
become much more transparent. Settlement cash balances, unlike interest rates

3
(and exchange rates), do not normally have a stable relationship with nominal
income or inflation and generally lead to considerably higher interest rate volatility
compared to an interest rate target. Quantity targets do, however, offer certain
operating advantages as they provide a better cushion against accommodating
unintentionally inflationary increases as is often the case under an interest rate
targeting regime. They also facilitate a rapid interest rate response which may be
crucial during periods of high or renewed inflationary pressures (see Spencer,
1992).
The third reason relates to the observation that New Zealand is one of the
most heavily indebted OECD countries and its household sector has negative
savings rate. The banking sector, almost all foreign owned, relies more and more
on overseas borrowing. It would be interesting to see the effectiveness of
monetary policy when there are leakages in the system. According to official
statistics by the Reserve Bank of New Zealand, as of March 2005, the private
sector’s foreign debt was NZ$149 billion, or 101 percent of New Zealand’s GDP,
which is 8.8 times more than the government’s overseas debt (NZ$17 billion, or
12 percent of GDP). While the business sector has increased their savings due to
higher profits, the household savings have been declining steadily. The New
Zealand household sector has one of the lowest savings rates among the OECD
countries. According to Statistics New Zealand, households in New Zealand on
average do not save anything out of current income but, instead, “dis-save” about
12 percent of income per year. Residential mortgage debt accounts for 90
percent of the total household debt which in turn accounts for over 50 percent of
the total loan portfolio of all New Zealand’s financial institutions.i As a result of
the shortage of local savings, banks in New Zealand have been increasingly
borrowing wholesale funds from overseas markets to meet the strong demand for
mortgages, which may have some impact on the relationship between OCR and
fixed-rate mortgages.

4
Our findings show that the long-term pass-through of market interest rates
to various retail rates differs across financial products. Some rates show
complete pass-through while others do not. The short-term pass-through and
adjustment speed also differ across products. We find no evidence that banks in
New Zealand adjust their rates (both lending and deposit rates) up more slowly
than they adjust them down. The introduction of OCR has increased the long-
term pass-through of floating and fixed deposit rates, but had no impact on the
other rates.
The remainder of the paper is organized as follows: Section 2 provides
some institutional background on New Zealand monetary policy. Section 3
provides the conceptual framework and the literature review. Section 4 outlines
our methodology. Section 5 discusses the data and results and the final section
concludes the paper.
II. MONETARY POLICY IN NEW ZEALAND The Reserve Bank of New Zealand (RBNZ), New Zealand’s central bank, is
responsible for operating monetary policy independently to achieve price stability
which is defined in the Policy Targets Agreement (PTA). The PTA is a specific
and public contract negotiated between the Governor of the Reserve Bank and
the Minister of Finance on behalf of the Government. It is an important
component of the monetary policy framework as set out in the 1989 Reserve
Bank Act. The current PTA, signed in September 2002, requires the Reserve
Bank to keep inflation as measured by annual increase of CPI between 1 and 3
percent on average over the medium term.
In the 1990 and 1993 PTAs, price stability was defined to be 0 to 2 percent
inflation over a one year period. The target band was widened to 0 to 3 percent in
the December 1996 PTA. As inflation had actually been outside the target range

5
on the upper side for nearly two years at that point and never below 1 percent,
the new target band in essence did not represent a major shift in regime.
However, pressing difficulties to keep inflation within the target band forced the
Reserve Bank at the time to make a major shift in policy setting.
Previously, the Bank had set policy so as to avoid moving outside the
target range a year ahead. It had made that judgment largely on the basis of the
direct transmission effect from foreign prices through the exchange rate onto
inflation (see Huang, Margaritis and Mayes, 2001). This in effect amounted to
setting exchange rate bands as an intermediate target. Thereafter the Bank
aimed to bring inflation info the middle of the target range 6 to 8 quarters ahead.
This difference in both adopting a longer policy horizon and aiming towards the
middle of the band represented a substantial change in the way policy was set.
From July 1997 to March 1999, the RBNZ used a Monetary Conditions Index
(MCI) as a means of communicating its monetary policy requirements. Since
March 1999, the RBNZ has changed its principal instrument of policy from
managing the quantity of overnight cash to setting the interest rate for it (OCR).
This rate is reviewed eight times a year.ii
Unlike most countries New Zealand did not set an interest rate as such
prior to 1999. Instead the RBNZ influenced market conditions by specifying 90-
day bank bill rates that would be consistent with price stability – initially in
combination with a range for the exchange rate and from late 1996 in terms of a
Monetary Conditions Index that combined the two in a single measure. Although
it could achieve any given market rate by use of quantitative controls in the
overnight market – it set a ‘cash target’ for its daily market operations – the Bank
did not normally have to use that weapon to achieve the market conditions it
wanted. The combination of the threat that it could act and the statements
explaining what was required were normally sufficient means of achieving its
policy objectives.
6
The Bank thus set policy through what have often been described as
‘Open Mouth Operations’ (Guthrie and Wright, 2000). Normally the quarterly
Monetary Policy Statements were the vehicle used but in between times if there
were shocks or the market moved too far the Governor or other senior members
of the Bank would issue a brief statement saying what the Bank wanted.
Unanticipated changes were infrequent and typically the Bank’s settings will
sanction market movements. By changing to an OCR setting the Bank adopted a
more conventional Cash Rate instead of the quantitative target.
The OCR system is simpler and can be easily understood.iii It operates as
follows: when an OCR is announced, the Reserve Bank is prepared to pay
financial institutions an interest rate 0.25 percentage points below the OCR for
their deposits with the Reserve Bank and is also prepared to lend overnight cash
to banks against good security at an interest rate of 25 basis points above the
OCR. More importantly, there is no limit on the amount of cash that it is willing to
take in or let out at 25 basis points below and above the OCR, respectively. As
the central bank acts as a market-maker in the short-term money market without
any limits imposed on the amount traded, no commercial bank is likely to offer
short-term loans at a rate significantly higher than the OCR. In a competitive
financial system, other banks would undercut that by borrowing money from the
Reserve Bank. Similarly, a financial institution is unlikely to lend short-term at
much lower than the OCR since it can lend to the Reserve Bank at the OCR
level, without any credit risk at all.
By lending or borrowing overnight money in unlimited volumes, the
Reserve Bank is able to maintain the short-term interbank interest rate at the
Bank's OCR level. By setting the OCR, the Reserve Bank can substantially affect
other types of short-term interest rates, e.g., the 90-day bill rate, floating
mortgages, etc. The OCR can also influence other retail interest rates
administered by commercial banks and other types of financial institutions. As a
result, changes in OCR will influence the overall level of economic activity in the

7
country and hence inflation. However, this process takes time and the pace of
adjustment speed varies across products and over time.
III. RIGIDITIES IN THE INTEREST RATE ADJUSTMENT PROCESS
The adjustment of retail interest rates by financial institutions to changes in
monetary policy rate or benchmark money market interest rates is not
spontaneous and the pass-through may be incomplete. In the industrial
organization literature, a similar phenomenon in the goods market is known as
price rigidity. The rigidity in the interest rate adjustment process is due to a
number of factors that include fixed menu costs, high switching costs, imperfect
competition and asymmetric information.
Under the menu costs hypothesis, banks are reluctant to change their
interest rates if the changes of the benchmark interest rates are very small and/or
temporary in nature (see Dutta et al., 1999). As there are adjustment costs
involved in changing retail interest rates to bank customers, banks may respond
slowly to temporary changes in monetary policy rate, but quickly to more
permanent changes in policy rates.
Under the switching cost hypothesis, customers are unlikely to switch
financial products and/or institutions in search of better funding or investment
terms when there are high switching costs (see Heffernan, 1997). Customers
need to spend time and effort to find out which bank offers the best deal and may
find it too inconvenient and/or too costly to switch banks. For example, in the
case of prepayment of loans and early withdrawal of time deposits by customers,
some banks may charge a fee to make it costly for the customers to exercise
those embedded options. The rigidity in interest rates may thus be attributed to
the banks’ exploitation of consumers’ inertia in switching financial products and/or
institutions. If banks can selectively price their products to exploit customers’
inertia, then rates are expected to be rigid upwards for customer deposits, but

8
downwards for loans. In other words, banks may adjust their deposit rate
upwards more slowly and adjust their loan rate downwards more slowly. This will
lead to asymmetry in the adjustment speed in interest rates.
Under the imperfect competition hypothesis, because of the collusive price
arrangement among banks, rate adjustments in uncompetitive markets can be
asymmetric, i.e., deposit rates are expected to be rigid upwards, while loan rates
are expected to be rigid downwards (see Hannan and Berger, 1991, Neuman
and Sharpe, 1992).
Finally, according to the asymmetric information hypothesis, banks face
both adverse selection and moral hazard problems when they are required to
raise loan rates in response to rising market interest rates (see Stiglitz and
Weiss, 1981). The presence of agency costs makes banks more reluctant to
increase loan rates significantly over a short period of time. Higher loan rates
make loan payments more difficult for borrowers, leading to more problem loans
and defaults. Unless their margins are under pressure and market rates are
expected to remain high, banks are reluctant to raise loan rates. Instead, banks
are more likely to ration the amount of credit extended to borrowers when there is
an upward pressure on loan rates. As a result, loan rates are expected to be
more rigid upwards under the asymmetric information model.
A combination of the above factors may play a different role in the retail
interest rates’ short-term and long-term adjustment process. Switching cost and
menu costs, for example, are more likely to be the primary factors in influencing
the short-term adjustment speed whereas imperfect competition and asymmetric
information are more likely to be the primary factors in affecting the long-term
pass-through (see Bondt, 2002).
Thus it becomes an empirical question as to whether the deposit rates and
loan rates are more rigid upwards or downwards. Furthermore, it is also likely for

9
the rigidity in retail interest rates to vary across different financial products. For
example, such differences may be observed for loan rates versus deposits rates,
floating mortgages versus fixed rate mortgages, short-term versus long-term
rates, depending on the relative level of customers’ inertia or the importance of
switching costs. Customer inertia, for example, may be greater on saving deposit
than on time deposits.
Hannan and Berger (1991) and Neuman and Sharpe (1992) were the first
to study the stickiness of deposit rates. While assuming complete and immediate
pass-through for retail lending rates, they examined the impact of market power
in the deposit market on the stickiness of deposit rates in the United States. They
found asymmetric adjustment in the deposit rate, i.e., banks adjust their deposit
rates upwards more slowly than they adjust them downwards and they attributed
it to banks’ market power in the deposit market. Cottarelli and Kourelis (1994)
were the first to study the pass-through to retail lending rates. Using an
autoregressive distributed lag (ADL) model, they examined the response of
lending rates in both developed and developing countries to changes in market
interest rates. They found that interest rate pass-through differs across countries
and that loan rate stickiness can be reduced by several factors: the existence of
a market for short-term negotiable instrument, lower money market interest rate
volatility, and relatively weak barrier to entry/competition.
Paisley (1994) and Heffernan (1997) examined the relationship between
market rates and retail rates in the UK. Whilst Paisley (1994) did not find
complete pass-thorough in mortgage rates for British building societies,
Heffernan (1997) found complete pass-through in repayment mortgages but
incomplete pass-through for current and savings accounts of British banks and
building societies. Hofmann and Mizen (2004) studied 13 deposit and mortgage
products of individual British financial institutions using a non-linear model and
found complete pass-through for deposit rates but not for mortgage rates.
10
Mojon (2000) examined the short-term pass-through to lending and
deposit rates in five Euro-area countries, (Belgium, Germany, France,
Netherlands and Spain), assuming there is full pass-through in the long term. He
found that retail interest rates respond sluggishly to changes in money market
rates; long-term rates respond more slowly than short-term rates, and there is an
asymmetry in the degree of pass-through. Pass-through to lending rates is higher
when market rates are increasing than when they are decreasing, but the
opposite is true for deposit rates. Bondt (2002) examined the relationship
between government bond yields and deposit and lending rates on a matched-
maturity basis for the Euro area as a whole. He found that pass-through is
complete for most lending rates, but it is incomplete on impact for both deposit
and lending rates. Kleimeier and Sander (2005) examined the pass-through in
the euro-zone’s retail banking markets and found that loan rates respond faster
to changes in anticipated monetary impulses.
Chong et al (2005) examined the deposit rates of various maturities and
lending rates of both commercial banks and finance companies in Singapore and
found that financial institutions adjust their rates upwards more slowly than they
adjust downwards. They also found that the adjustment speed differs across
financial products and between banks and finance companies. They did not find
complete pass-through of interest rates.
IV. METHODOLOGY
In this paper, we examine both the long-run and short-run pass-through of
monetary policy rates to various retail interest rates as well as the adjustment
speed of the short-term dynamics to the long-term equilibrium relationship.
The long-term relationship between the retail interest rate and the
benchmark market rate is expressed as:
ttt xy εαα ++= 10 (1)

11
where ty is the bank lending or deposit rate; tx represents the
corresponding policy or money market rate; tε is the error term; 0α and 1α are
the long-run parameters. The interest rate series are expected to be integrated,
I(1), variables and the error term is expected to be stationary. As discussed in
Rousseas (1985), 0α measures the markup and 1α measures the degree of
pass-through in the long term. The long-run pass-through is complete if 1α is
statistically not different from one.
We estimate equation (1) using the Phillips-Loretan (1991) method. This
method is well suited to the estimation of long-run relationship involving
integrated variables where dynamics may play an important role in the DGP
for ty . It is modeled by the following triangular system of equations:
ttt uxy 1+′+= βα (1a)
tt ux 2=∆ , (1b)
where [ ]′′= ttt uuu 21 is a stationary vector.
Equation (1a) can be estimated using single equation methods, and
provided that the equation is appropriately augmented, the asymptotic properties
of the estimator and its distribution can be readily determined. These properties
hinge on the interrelationships that exist between tu1 and tu2 , which are assumed
to be stationary.
If the variance-covariance matrix of tu is block diagonal (so that the
partitioned elements of the vector do not co-vary) and tu is also (i.i.d.) then
equation (1a) can be estimated using least squares. The estimates will be
normally distributed, at least asymptotically, and will be equivalent to maximum
likelihood estimates of the parameters of the system. This result is important as it
enables statistical inference using standard statistical tables to be used with
integrated variables.

12
If the variance covariance matrix of tu is block diagonal but the residuals
are autocorrelated (but also block diagonal) the regression can be augmented
with lagged error correction terms, counteracting the autocorrelation of tu1 . This
solution works because the regressors –xt– are super-exogenous. They are
independent of the past and future history of tu1 , i.e. they are orthogonal to
{ }+∞−∞=ttu1 .
If tu1 and tu2 are correlated one can alleviate the problems that this causes
by augmenting the regression with leads and lags of tx∆ . One can think of this as
projecting tu1 against leads and lags of tu2 and then applying the Frisch –Waugh -
Lovell theorem. The error from the projection is uncorrelated with tu2 , and the
endogeneity or contemporaneity problem is thus dealt with. The inclusion of
leads eliminates feedback from tu1 back to tu2 and it is important for valid
conditioning. The basic problem is that, a priori, we do not know whether
tu1 correlates with leads of tu2 or vice versa.
The inclusion of two-sided lag differences eliminates the endogeneity problem,
while the autocorrelation problem may need to be remedied by including lags of
the error correction term too. Phillips and Loretan then estimate the following
equation using least squares:
( ) t
L
liiti
K
kktktktt xdxydxy 12
11 νββα +∆+′−+′+= ∑∑
−=−
=−−
(1c)
Phillips and Loretan demonstrate that the parameter estimates from
estimating this single equation are equivalent to maximum likelihood estimation
of the system and hence are efficient. Furthermore, the parameters are
asymptotically unbiased and normally distributed. In contrast, the OLS estimator
of (1) while superconsistent is not asymptotically unbiased or normally distributed
13
and its finite sample bias may be large and persistent. An added advantage of
considering the specification given by (1c) is that it accounts explicitly for the role
of past policy surprises and future expected policy settings in the relationship
between retail rates and policy instruments.
Equation (1) is a long run model. As monetary policy rate changes, banks
will not adjust their retail rates immediately. Short-term rates are expected to be
adjusted more quickly than medium and long-term rates since the latter depend
on future short-term rates as well as current short-term rates.
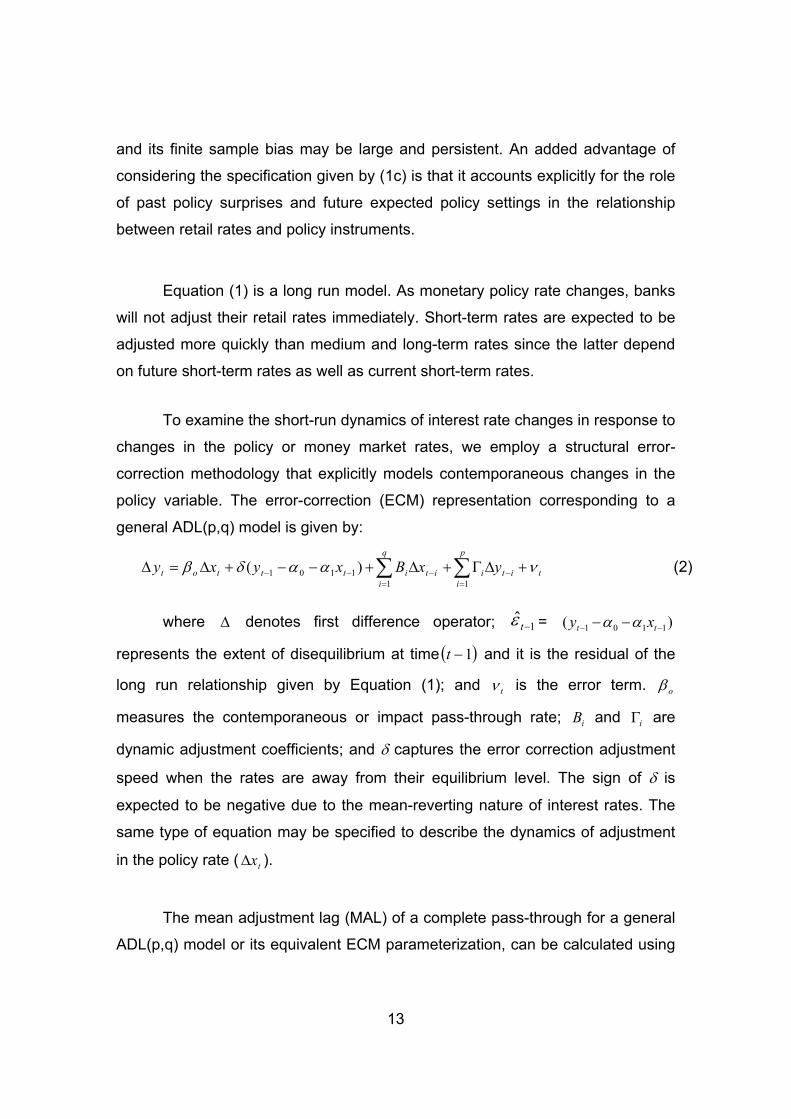
To examine the short-run dynamics of interest rate changes in response to
changes in the policy or money market rates, we employ a structural error-
correction methodology that explicitly models contemporaneous changes in the
policy variable. The error-correction (ECM) representation corresponding to a
general ADL(p,q) model is given by:
tit
p
iiit
q
iitttot yxBxyxy νααδβ +∆Γ+∆+−−+∆=∆ −
=−
=−− ∑∑
111101 )( (2)
where ∆ denotes first difference operator; 1ˆ −tε = )( 1101 −− −− tt xy αα
represents the extent of disequilibrium at time ( )1−t and it is the residual of the
long run relationship given by Equation (1); and tν is the error term. oβ
measures the contemporaneous or impact pass-through rate; iB and iΓ are
dynamic adjustment coefficients; and δ captures the error correction adjustment
speed when the rates are away from their equilibrium level. The sign of δ is
expected to be negative due to the mean-reverting nature of interest rates. The
same type of equation may be specified to describe the dynamics of adjustment
in the policy rate ( tx∆ ).
The mean adjustment lag (MAL) of a complete pass-through for a general
ADL(p,q) model or its equivalent ECM parameterization, can be calculated using

14
the formula given in Hendry (1995). For the special case of an ADL(1,1) model,
this simplifies to:
δβ /)1( −= oMAL (3)
The MAL is simply the weighted average of all lags and it is a measure of
the speed with which retails rates respond to movements in policy rates.
Several studies have shown that the short-term adjustment may be asymmetric,
in other words, the adjustment speed may differ when rates are above the
equilibrium from that when rates are below (see Chong et al, 2005 and Scholnick,
1996). To test for the existence of asymmetric adjustments in the retail rates in
New Zealand, we add a dummy variable,λ , to Equation (2). λ is equal to one if
the residual, 1ˆ −tε , is positive and 0 otherwise. The asymmetric short-run dynamic
equation is as follows:
tit
p
iiit
q
iitttot yxBxy ηελδελδβ +∆Γ+∆+−++∆=∆ −
=−
=−− ∑∑
111312 ˆ)1(ˆ (4)
where 2δ captures the error correction adjustment speed when the rates
are above their equilibrium values and 3δ captures the error correction
adjustment speed when the rates are below their equilibrium values. To test for
the existence of asymmetric adjustment, we use the standard Wald test to
determine if 2δ is significantly different from 3δ .
As with the symmetric adjustment case, we can define the asymmetric
mean adjustment lags (MAL) of a complete pass-through using the formula in
Hendry (1995). For the special case of an ADL(1,1) model, this is given by:
20 /)1( δβ −=+MAL (5)
30 /)1( δβ −=−MAL (6)
where +MAL represents the mean adjustment lag when the retail interest
rates are above their equilibrium value and −MAL represents the mean
adjustment lag when the retail interest rates are below their equilibrium value.
15
V. DATA AND ANALYSIS OF RESULTS
Data
We use monthly series of interest rate data from two sources. The fixed
mortgage rates of maturities of one to three years are obtained from a major
commercial bank in New Zealand and the rest of the data, namely, the base
lending rate, the floating mortgage rate and the six-month time deposit rate, the
OCR and the overnight interbank rate, are all from the Reserve Bank of New
Zealand. The sampling period is from August 1994 to December 2004, covering
a time span of over 10 years. The sample size is 125 for most interest rate
series.
Table 1 provides the descriptive statistics for the sample data. Panel A
shows that descriptive statistics for the whole sample and Panel B shows those
for the subsample after the OCR was introduced which covers the period March
1999 to December 2004. The average fixed mortgage rates are positively related
with maturity, indicating an upward sloping yield curve. Panel B also shows that
the standard deviation of interest rates in New Zealand has decreased
substantially with the introduction of OCR. Previously, the monthly volatility of
interest rates was much higher, more than 1 percent for most series, with the
overnight interbank rate having the highest monthly volatility at 1.72 percent.
After the OCR was introduced, interest rates became much more stable than
before, the monthly volatility of all the rates declined to the range of 0.6 to 0.75
percent.

16
Panel A: The whole sample covering the period 1994:8 – 2004:12 * Starting from March 1999 when it was first implemented.
Panel B: The after-OCR subsample covering the period 1999:3 – 2004:12 (No. of Obs. = 70)
Table 1: Descriptive Statistics
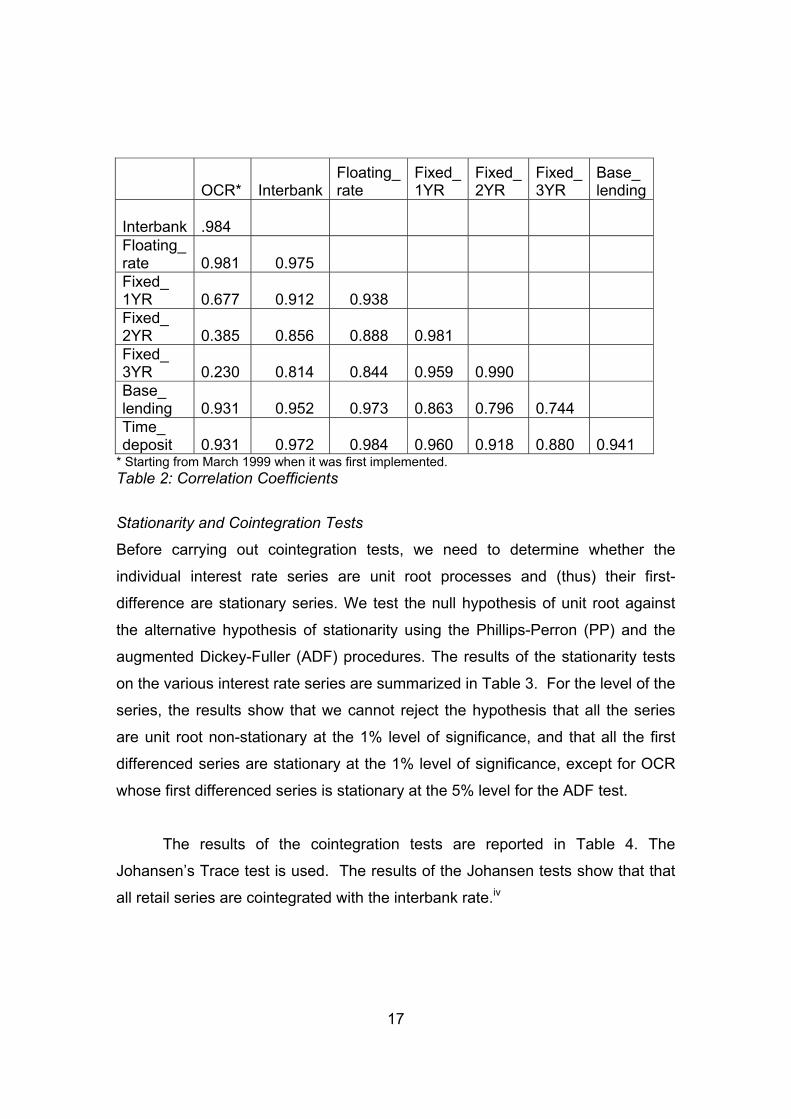
The pair-wise correlation coefficients between the various interest rates
are reported in Table 2. The OCR is shown to be highly correlated with the
floating mortgage rate, the time deposit rate and base lending rate, but less
correlated with the fixed rate mortgages. The OCR is also highly correlated with
the overnight interbank rate.
Series
Mean Median
Maximum Minimum
Std.Dev.
OCR 5.43 5.38 6.50 4.50 0.63 Interbank 5.44 5.53 6.50 4.07 0.64
Floating_rate 7.49 7.58 8.77 6.50 0.68 Fixed_1YR 6.91 6.85 9.25 5.90 0.65
Fixed_2YR 7.27 7.15 8.70 6.25 0.59
Fixed_3YR 7.55 7.50 8.80 6.30 0.61 Base_lending 9.70 9.88 11.09 8.36 0.75
Time_deposit (6MTH) 5.31 5.25 6.70 4.27 0.62
Mean Median Maximum Minimum Std Dev Obs.OCR* 5.54 5.50 6.50 4.50 0.65 70Interbank 6.54 6.15 10.00 3.30 1.72 125Floating_rate 8.67 8.44 11.50 6.50 1.56 125Fixed_1YR 8.04 7.50 11.50 5.90 1.49 125Fixed_2YR 8.27 7.95 11.50 6.25 1.30 125Fixed_3YR 8.41 8.25 11.50 6.30 1.17 125Base_lending 10.55 10.36 12.75 8.36 1.24 125Time_deposit (6MTH)
6.39 6.20 9.17 4.15 1.45 125
17
OCR* Interbank Floating_rate
Fixed_1YR
Fixed_2YR
Fixed_ 3YR
Base_ lending
Interbank .984
Floating_ rate
0.981 0.975
Fixed_ 1YR
0.677 0.912 0.938
Fixed_ 2YR
0.385 0.856 0.888
0.981
Fixed_ 3YR
0.230 0.814 0.844
0.959
0.990
Base_ lending
0.931 0.952 0.973
0.863
0.796
0.744
Time_ deposit
0.931 0.972 0.984
0.960
0.918
0.880
0.941
* Starting from March 1999 when it was first implemented. Table 2: Correlation Coefficients Stationarity and Cointegration Tests
Before carrying out cointegration tests, we need to determine whether the
individual interest rate series are unit root processes and (thus) their first-
difference are stationary series. We test the null hypothesis of unit root against
the alternative hypothesis of stationarity using the Phillips-Perron (PP) and the
augmented Dickey-Fuller (ADF) procedures. The results of the stationarity tests
on the various interest rate series are summarized in Table 3. For the level of the
series, the results show that we cannot reject the hypothesis that all the series
are unit root non-stationary at the 1% level of significance, and that all the first
differenced series are stationary at the 1% level of significance, except for OCR
whose first differenced series is stationary at the 5% level for the ADF test.
The results of the cointegration tests are reported in Table 4. The
Johansen’s Trace test is used. The results of the Johansen tests show that that
all retail series are cointegrated with the interbank rate.iv

18
Phillips-Perron test
Level First difference Series Prob. Bandwidth Obs Series Prob. Bandwidth Obs
OCR 33.5% 5 69 D(OCR) 0.0% 4 68 Interbank 29.5% 6 124 D(Interbank) 0.0% 2 123Floating_Rate 36.3% 6 124 D(Floating_Rate) 0.0% 2 123Fixed_1YR 32.3% 3 124 D(Fixed_1YR) 0.0% 1 123Fixed_2YR 32.1% 2 124 D(Fixed_2YR) 0.0% 3 123Fixed_3YR 31.6% 1 124 D(Fixed_3YR) 0.0% 3 123Base_lending 26.4% 6 124 D(Base_lending) 0.0% 2 123Time_deposit 37.1% 7 124 D(Time_deposit) 0.0% 3 123
ADF test
Level 1st difference
Series Prob. Lag Max Lag Obs Series Prob. Lag
Max Lag Obs
OCR 6.1% 2 10 67 D(OCR) 3.2% 1 10 67 Interbank 28.2% 1 12 123 D(Interbank) 0.0% 0 12 123Floating_Rate 14.8% 2 12 122 D(Floating_Rate) 0.0% 1 12 122Fixed_1YR 48.5% 0 12 124 D(Fixed_1YR) 0.0% 0 12 123Fixed_2YR 45.7% 0 12 124 D(Fixed_2YR) 0.0% 0 12 123Fixed_3YR 38.6% 0 12 124 D(Fixed_3YR) 0.0% 0 12 123Base_lending 20.3% 1 12 123 D(Base_lending) 0.0% 0 12 123Time_deposit 21.7% 1 12 123 D(Time_deposit) 0.0% 0 12 123
Table 3: Unit Root Tests

19
Cointegration of series (y) with interbank rate(x)
(Normalised) Cointegrating
Vector Series r=0 r≤1 (1, -α1, αo)
Floating_rate
15.79 4.84 (.051) (.302)
(1, -0.91, -2.71)
Fixed_1YR
19.48 5.39 (.064) (.243)
(1, -0.82, -2.64)
Fixed_2YR
21.61 5.53 (.045) (.230)
(1, -0.69, -3.69)
Fixed_3YR
21.53 5.48 (.033) (.235)
(1, -0.61, -4.39)
Base_lending
14.78 5.12 (.064) (.024)
(1, -0.61, -6.53)
Time_deposit
24.56 6.59 (.012) (.150)
(1, -0.84, -0.85)
Numbers in brackets are MacKinnon-Haug-Michelis (1999) p-values. Table 4: Johansen cointegration rank test (trace) results ( ttt xy εαα ++= 10 )
Long-Term Pass-Through and Structural Change
Having established that the overnight interbank interest rate is cointegrated with
the various retail interest rates, we then estimate the long-term pass-through for
the whole sample. The results of both Phillips-Loretan estimator and the OLS
estimator are reported in Table 5. Our results show that the Phillips-Loretan
estimates can differ quite substantially in some cases from the OLS estimates.
Hence, the OLS results, especially t-values, should be interpreted with caution.
On the other hand, from Tables 4 and 5 we can see that the Phillips-Loretan
estimates are quite similar to those obtained by using the bivariate (VAR)
Johansen model specification.v

20
Over the entire sampling period, the χ2 test statistic and p-values in the
last two columns of Table 5 results show that the long-term pass-through is
incomplete for all the series except the floating and fixed one-year mortgage rate
at the 5 percent level. The slope coefficients are in the range of 58.8% to 93.4%
(pass-through). In general, the degree of long-term pass-through is higher for
short-term retail interest rates than that for longer-term rates. This is consistent
with the expectation hypothesis of the term structure of interest rates. As the
OCR is an overnight rate, it is more highly correlated with short-term rates than
with long-term rates. Long-term rates are influenced not only by current short-
term rates but also future short-term rates.
Notes: RHS Variable (x) is interbank rate. The degree of pass-through is measured by the slope, 1α . * indicates significance at the 5 percent level. Numbers in brackets are t-ratios of estimated coefficients (the null hypothesis is: 1α =0); all estimates and
statistics are computed using the Phillips-Loretan method unless otherwise stated. χ2( 1α =1) is the test statistic for the hypothesis that the slope coefficient is equal to one (complete pass-through). DW values for OLS regressions (not reported here) are quite low indicating the presence of serial correlation and possibly misspecified (omitted) dynamics. Table 5: Long-run Pass through (Phillips-Loretan Estimates) ( ttt xy εαα ++= 10 )
Dependent Variable (y)
Constant
Constant (OLS)
Slope
Slope (OLS)
R2
DW
χ2( 1α =1) Prob.
Floating_rate
2.498* (6.033)
2.094*
(11.258) 0.934*
(15.056)
1.004*
(29.529)0.978
1.826
1.127 0.289
Fixed_1YR
2.780* (3.720)
3.648* (6.775)
0.793*(7.051)
0.621* (6.402)
0.954
1.964
3.374 0.066
Fixed_2YR
3.742* (4.953)
5.772* (9.717)
0.686*(6.015)
0.297* (2.776)
0.943
1.976
7.713* 0.006
Fixed_3YR
4.511* (5.236)
6.857*
(11.390) 0.588*
(4.532)
0.147 (1.349)
0.922
2.026
10.043* 0.001
Base_lending
3.825* (2.440)
4.098*
(15.701) 0.761*
(9.598)
1.035* (22.021)
0.989
1.929
9.105* 0.002
Time_deposit
0.957* (2.688)
0.445 (1.503)
0.825*(15.350)
0.907*
(17.113)0.991
1.981
10.669* 0.001

21
Since the shift to OCR in March 1999 represented a major change in New
Zealand monetary policy, we test next if there is a structural change associated
with the introduction of the new policy instrument. The standard dummy-variable
test is used to test the stability of the constant and slope coefficients of Equation
1. The dummy variable (D) takes on the value of zero between August 1994 and
February 1999 (i.e., prior to the introduction of OCR) and the value of one
between March 1999 and December 2004 (i.e., after its introduction). The test
results on long-term pass-through are reported in Table 6.
Constant Slope Dummy (D) Slope Dummy (D*x)
Coef. t-value Coef. t-value Coef. t-value Coef. t-value
Floating_rate 5.021 8.478* 0.629 8.720* -2.690 -3.831* 0.322 2.944*
Fixed_1YR 4.141 3.613* 0.646 4.632* -0.199 0.128 -0.086 -0.341
Fixed_2YR 5.018 3.220* 0.537 2.818* 1.471 0.855 -0.371 -1.341
Fixed_3YR 5.162 3.497* 0.526 2.911* 1.272 0.714 -0.304 -1.070
Base-lending 6.126 6.655* 0.674 6.020* -1.586 -2.054* 0.278 2.410*
Time_deposit 2.983 5.794* 0.593 9.492* -2.053 -3.002* 0.216 1.954**
Notes: D is a dummy variable. D = 0 for observations before March 1999 and 1 otherwise. The column under the heading “Slope Dummy” measure the changes in the long-term pass through after the introduction of the OCR regime. * indicates significance at the 5 percent level; ** indicates significance at 10 percent.
Table 6: Structural Change (Phillips-Loretan estimates) ( tttt xDDxy εαααα ++++= *3210 )
The results show that prior to the introduction of OCR in 1999, the long-
term degree of pass-through for all series was in the range of 52.6% to 67.4%,
none of which is complete. In comparison, after the introduction of OCR, the
degree of pass-through for the floating mortgage rate, the base lending rate and
the 6-month deposit rate increased, but that for the fixed 1-3 year mortgage rates
did not change significantly (at least not statistically). In fact the degree of pass
through is statistically complete for the floating and base rates at the 5 percent
level and for the 6-month deposit rate at the 10 percent level (the p-values for

22
testing the hypothesis that the sum of the slope coefficients is equal to 1 in Table
6 are 0.653, 0.746 and 0.087 for the floating, base lending and 6-month deposit
rate equations, respectively).
The increase in the long-term pass-through from official to retail rates is
probably due to less interest rate volatility and more transparency and
competition in the marketplace. After the introduction of OCR, interest rates, as
expected, became much less volatile, as shown in Table 1. With more stable
interest rates, we would expect bank interest rate adjustment costs to decrease
and hence a higher degree of pass-through. In addition, with the introduction of
OCR, there has been more transparency in the way policy is set and
communicated to the financial markets resulting in more competition in the
banking industry. Kleimeier and Sander (2005) also show that greater
transparency in the conduct of monetary policy can increase the degree of long-
term pass-through.
While the increased transparency in monetary policy and the subsequent
decrease in volatility can explain the increase in the degree of long-term pass-
through for floating interest rates and fixed deposit rates, it had no impact on the
fixed mortgage rates. One possible reason is the heavy reliance of New Zealand
banks on foreign borrowing.
Due to the negative savings rate of the household sector in New Zealand,
banks and other types of financial institutions in New Zealand actively source
their funding globally, in Eurodollar markets and the US money market in
particular. A mixture of instruments such as bank loans, Euro commercial paper,
medium term notes (MTNs) and bonds are used. In theory, the substantial
amount of overseas borrowing should not render monetary policy in New Zealand
less effective if banks effectively hedge against the currency risk in the foreign
currency debt. By swapping it into fixed or floating domestic currency (i.e., New
Zealand dollars) through foreign exchange (FX) swaps and cross currency

23
interest rate swaps, the effective borrowing cost overseas would be about the
same as that of domestic interest rate with the same maturity, ignoring
transaction costs associated with the hedge. In this case, banks are borrowing
synthetically from overseas. Under interest rate parity, changes in domestic
interest rates would be reflected in the funding cost. If FX risk hedging is not
done, then borrowing from overseas would have significant impact on the
effectiveness of monetary policy in the country due to the leakage. In practice,
short-term FX risk can be hedged easily through FX swaps, currency swaps,
hedging against longer-term currency risk is more costly and less effective,
reducing the effectiveness of domestic monetary policy. Further, if hedging is
done using options, currency volatility as well as domestic interest rate can affect
the hedging cost and hence the true funding cost, influencing the effectiveness of
monetary policy on retail rates. Our results suggest that the longer term FX risk
may not be hedged effectively in New Zealand.
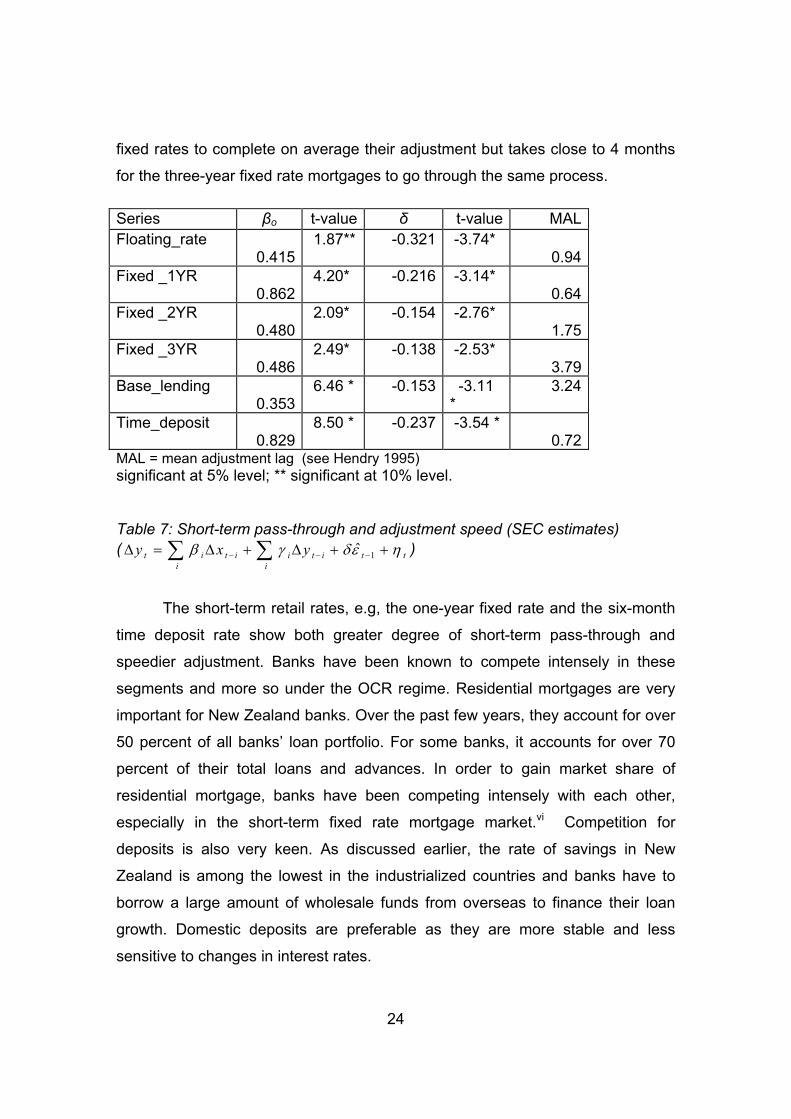
Short-Term Pass-Through and Adjustment Speed
We use bivariate specifications of structural-error-correction (SEC) models to
estimate the short-run dynamics of adjustment of retail interest rates and
benchmark wholesale rates. The results of the retail interest rate adjustment are
reported in Table 7. We only report the estimates for the impact and error
correction coefficients. Coefficient estimates for the other variables in the retail
interest rate equations and the results of the interbank rate equations are not
reported but are available upon request. All the parameters have the expected
sign and are statistically significant. The impact pass-through coefficients, βo, are
positive and statistically significant. For fixed rate mortgages, the
contemporaneous pass-through, ranges from 35.3% for the base lending rate to
86.2% for the 1-year fixed rate. All the estimates of error correction speed or
adjustment speed,δ , are negative and statistically significant, indicating that the
retail rates mean-revert to their long-run equilibrium values. The mean
adjustment lags show a similar picture. It only takes less than a month for 1-year
24
fixed rates to complete on average their adjustment but takes close to 4 months
for the three-year fixed rate mortgages to go through the same process. Series βo t-value δ t-value MAL Floating_rate
0.415 1.87** -0.321 -3.74*
0.94 Fixed _1YR
0.862 4.20* -0.216 -3.14*
0.64 Fixed _2YR
0.480 2.09* -0.154 -2.76*
1.75 Fixed _3YR
0.486 2.49* -0.138 -2.53*
3.79 Base_lending
0.353 6.46 * -0.153 -3.11
* 3.24
Time_deposit 0.829
8.50 * -0.237 -3.54 * 0.72
MAL = mean adjustment lag (see Hendry 1995) significant at 5% level; ** significant at 10% level.
Table 7: Short-term pass-through and adjustment speed (SEC estimates) ( ttit
iiit
iit yxy ηεδγβ ++∆+∆=∆ −−− ∑∑ 1ˆ )
The short-term retail rates, e.g, the one-year fixed rate and the six-month
time deposit rate show both greater degree of short-term pass-through and
speedier adjustment. Banks have been known to compete intensely in these
segments and more so under the OCR regime. Residential mortgages are very
important for New Zealand banks. Over the past few years, they account for over
50 percent of all banks’ loan portfolio. For some banks, it accounts for over 70
percent of their total loans and advances. In order to gain market share of
residential mortgage, banks have been competing intensely with each other,
especially in the short-term fixed rate mortgage market.vi Competition for
deposits is also very keen. As discussed earlier, the rate of savings in New
Zealand is among the lowest in the industrialized countries and banks have to
borrow a large amount of wholesale funds from overseas to finance their loan
growth. Domestic deposits are preferable as they are more stable and less
sensitive to changes in interest rates.

25
Asymmetric Adjustment Speed
We estimate structural error-correction models that allow for different speed of
adjustment towards equilibrium. The results on the asymmetric adjustment
models are reported in Table 8. Comparing the asymmetric adjustment speed
coefficients, δ2 and δ3, there is no evidence of asymmetric adjustment speed for
any of the retail interest rates. We also estimated the impact of the introduction
OCR on the asymmetric adjustment speed, there is no statistically significant
difference either. There is some evidence to suggest that a differential speed of
adjustment may exist for the base lending rate but the results are not conclusive.
We also investigated the possibility that bank adjusted rates upwards at a
different speed than adjusting them downwards during the post OCR period but
there was no conclusive evidence to suggest that this is indeed the case. There
was some weak evidence again that banks adjust rates faster upwards for base
lending rates post OCR and also that they adjust rates faster downwards for the
1-year fixed rate. The latter result may be indicative of the intense competition
that is taking place among banks in recent years for market share in this
particular market segment.

26
Series βo δ2 δ3 χ2
(δ1=δ2)) MAL+ MAL-
Floating_rate
0.411** (1.760)
- 0.324*
(3.118)-0.314* (2.381)
0.004
0.94
0.97
Fixed 1YR
0.802* (4.112)
-0.220* (2.517)
- 0.296** (1.928)
0.182
0.90
0.67
Fixed 2YR
0.479* (2.076)
-0.162* (2.156)
- 0.144** (1.684)
0.026
1.70
1.81
Fixed 3YR
0.483* (2.461)
-0.145* (2.041)
-0.126 (1.402)
0.027
3.55
4.09
Base_lending
0.391* (9.922)
-0.108; (1.426)
-0.214* (2.774)
0.823
7.84
3.95
Time_deposit 0.825* (8.331)
-.0.248* (2.923)
-.0.219* (2.058)
0.049
0.70
0.80
Notes: T-value in brackets. *significant at 5% level; ** significant at 10% level. D is a dummy variable. D = 0 for observations before March 1999 and 1 otherwise. Under the asymmetric ECM, MAL+ represents the mean adjustment lag when the retail rates are above their equilibrium value and MAL- represents the mean adjustment lag when the retail rates are below their equilibrium value. βo measures the degree of pass-through in the short-term. Table 8: Short-term pass-through and asymmetric adjustment speed (SEC estimates) (A: tttit
iiit
iit yxy ηελδελδγβ +−++∆+∆=∆ −−−− ∑∑ 1312 ˆ)1(ˆ )
VI. CONCLUSION
In this paper we have examined the following issues: Firstly, we considered the
long-term pass through of various retail interest rates including mortgage rates of
different maturities. Secondly, we examined the short-term pass-through and the
adjustment speed of those retail interest rates using an error correction and test
whether the adjustment is symmetric or asymmetric. Finally, we investigated
whether a change in monetary policy operating procedures as a result of the
adoption of the Official Cash Rate (OCR) instrument in 1999 has had a different
effect on the pass-through and adjustment speed of interest rates in New
Zealand.
Our findings show that the long-term pass-through of retail rates varies
across financial products. Short-term rates show a higher degree of pass-through

27
and faster adjustment speed than long-term rates, but there is no evidence of
significant asymmetric adjustment. We also find that the introduction of OCR is
associated with an increase in the pass-through for floating and deposit rates but
not for fixed mortgage rates. The latter result suggests that in a small open
economy with a substantial amount of overseas borrowing the effectiveness of
monetary policy may be weakened.
Overall, our results show that monetary policy rate has more influence on
short-term interest rates. We also find evidence suggesting that increased
transparency in the conduct of monetary policy has reduced the volatility of
official policy rates and led to more competition in the banking industry. As
monetary policy transparency increases and interest rate volatility decreases,
future short-term rate changes become less uncertain, thereby enhancing the
degree of pass-through of official rates to retail rates in tandem with the efficacy
of monetary policy.

28
NOTES 1 The New Zealand financial system is dominated by banks. Bank assets account for 76% of the total assets of the financial system. Foreign own banks dominate the banking system. 98% of bank assets are owned by foreign banks, mostly Australian banks (RBNZ, 2005). 2 OCR is typically reviewed at the release of the Reserve Bank’s quarterly Monetary Policy Statements and about halfway between each Monetary Policy Statement. Unscheduled adjustments to the OCR are made only in exceptional circumstances. For example, OCR was adjusted shortly after the 11 September terrorist attacks on the United States in 2001. 3 This is in contrast to the volatile experience with the MCI where markets, particularly those offshore, had at times difficulties reading the signals of policy. 4 We assessed whether the overnight interbank can be used as a proxy of monetary policy stance. We adopt a two step procedure. First, we test the relationship between the two series over the period between March 1999 and December 2004. We find that the two series cointegrate using a Johansen test and that the slope coefficient has an estimated value of .99 which is insignificantly different from one (Johansen cointegrating restriction χ2 test p-value=.19). Secondly, we estimate the long-term relationship between OCR and the various retail interest rates over the same period. We also estimate the long-term relationship between the overnight interbank interest rate and the various retail rates over the same period. The results are very similar using either the OCR or the overnight rate, indicating that the overnight interbank rate can be used as a proxy for the monetary policy stance, which is a common practice in the literature (Chong et al, 2005). To test for robustness, we also used the 90 T-bill rate as an alternative measure of the market benchmark rate. The results are similar to those of using the interbank rate. 5 It is possible that the finite bias of the OLS estimator may be less or negligible compared to the other two estimators for floating and possibly base-lending rates to the extent that there are no dynamics in the DGP for those interest rates (as banks typically adjust them in full after a policy change) and switching or menu costs are unimportant. 6As at March 2005, about 25% of mortgages are priced on a floating rate basis and 75% on a fixed rate basis. Among the fixed rate mortgages, 30% out of the 75% is fixed for up to one-year, 35% fixed for one to two year, and only 10% are for the remaining fixed terms (i.e., three and five-year fixed rates).

29
REFERENCES Altunbas, Y. O. Fazylov and P. Molyneux. (2002) “Evidence on the bank lending
channel in Europe”. Journal of Banking and Finance 26, 2093-2110. Bernanke, B., Gertler, M., (1995) “Inside the black box: The credit channel of
monetary policy transmission”. Journal of Economics Perspective 9, 27-48. Bondt, G. D., (2002) “Retail bank interest rate pass-through: New evidence from
the Euro area level”. Working paper No.136, European Central Bank Working Paper Series.
Chong, B. S., Liu, M. H., Shrestha, K. (2005) “Monetary transmission via the administered interest rate channel”. Journal of Banking and Finance, Forthcoming.
Cottarelli C., Kourelis A., (1994) “Financial structure, bank lending rates, and the transmission mechanism of monetary policy”. IMF Staff Papers 41, 587 – 623
Dutta, S., Bergen, M., Levy, D., Venable, R., (1999) “Menu costs, posted prices, and multiproduct retailers”, Journal of Money, Credit, and Banking 31, 683-703.
Guthrie, G., Wright, J., (2000) “Open mouth operations”. Journal of Monetary Economics 46 (2), 489-516.
Hannan, T., Berger, A., (1991) “The rigidity of prices: Evidence from banking industry”. American Economic Review 81: 938-945.
Heffernan, S.A., (1997) Modelling British interest rate adjustment: An error correction approach. Economica 64, 211-31.
Hendry, D.F., (1995) “Dynamic Econometrics”. Oxford University Press, Oxford. Hofmann, B., Mizen P., (2004) “Interest rate pass-through and monetary
transmission: Evidence from individual financial institutions’ retail rates”. Economica 71, 99-123.
Huang, A., Margaritis, D., Mayes, D., (2001) “Monetary policy rules in practice: Evidence from New Zealand”. Multinational Finance Journal, 5 (3), 175-200.
Kashyap A. K., Stein. J., (2000) “What do a million observations on banks say about the transmission of monetary policy”. American Economic Review 86, 310-14.
Kleimeier, S., Sander H., (2005) “Expected versus unexpected monetary policy impulses and interest rate pass through in euro-zone’s retail banking markets”. Journal of Banking and Finance, accepted and forthcoming.
MacKinnon, J. G., Haug, A.A. and Michelis L., (1999) “Numerical distribution functions of likelihood ratio tests for cointegration”. Journal of Applied Econometrics, 14, 563-577.
Mojon, B., (2000) “Financial structure and the interest rate channel of the ECB monetary policy”, Working paper No. 40, European Central Bank Working Paper Series.
Neuman D., Sharpe, S., (992) “Market structure and the nature of price rigidity: Evidence from the market for consumer deposits”. Quarterly Journal of Economics 107, 657 – 680.
Paisley, J., (1994) “A model of building society interest rate setting”. Bank of England Working Paper 22.
30
Phillips, P. C. B. and Loretan, M., (1991) “Estimating long-run equilibria”, The
Review of Economic Studies 58(3), 407-436. Reserve Bank of New Zealand, (2005) “Financial Stability Report”. May,
Wellington, New Zealand. Rousseas, S., (1985) “A markup theory of bank loan rates”, Journal of Post
Keynesian Economics 8, 135-144. Sarno, L., Thornton, D.L., (2003) “The dynamic relationship between the federal
funds rate and the Treasury bill rate: An empirical investigation”. Journal of Banking and Finance 27, 1079-1110.
Scholnick, B., (1996) “Asymmetric adjustment of commercial bank interest rates: evidence from Malaysia and Singapore”. Journal of International Money and Finance 15, 485-496.
Spencer, G., (1992) “Monetary policy: The New Zealand experience”. In Monetary Policy and the New Zealand Financial System, 3rd ed., Reserve Bank of New Zealand, Wellington, New Zealand.
Stiglitz, J., Weiss, A., (1981) “Credit rationing in markets with imperfect information”. American Economic Review 71, 393-410.

ENTERPRISE AND INNOVATION
FACULTY OF BUSINESS RESEARCH PAPER SERIES
01-2003 SIMON MOWATT and
HOWARD COX
Innovation Networks and the Development of Consumer-Driven ICT-Based Management Systems
02-2003 BILL DOOLIN,
BOB MCQUEEN and MARK WATTON
Internet Strategies for Established Retailers: Five Case Studies from New Zealand
03-2003 ROGER BAXTER and
SHEELAGH MATEAR Measuring Intangible Value in Business to Business Buyer-Seller Relationships: An Intellectual Capital Perspective
04-2003 HOWARD COX and
SIMON MOWATT Technology, Organisation and Innovation: The Historical Development of the UK Magazine Industry
05-2003 CHRISTOPHER BOGGS,
BRETT COLLINS and MARTIE-LOUISE VERREYNNE
Examining the Effects of Referent Power on Intrinsic Motivation in Organisations: A Self-Concept Based Approach
06-2003 MARK GLYNN,
JUDY MOTION and RODERICK BRODIE
Retailers’ Perceived Value of Manufacturers’ Brands
07-2003 DERYL NORTHCOTT and
LI-CHENG CHANG The Use of Performance Measurement as an Accountability Mechanism: A Case Study in the UK National Health Service
08-2003 ROY SMOLLAN and
JONATHAN MATHENY Emotions Experienced Through Organisational Events: An Exploratory Framework of Perceived Justice and Outcomes
09-2003 ROBIN H. LUO and
L. CHRISTOPHER PLANTIER
The Persistence of NZ Dollar Misalignments Relative to Purchasing Power Parity

10-2004 SIMON MOWATT New Perspectives on the Supply-Chain and
Consumer-Driven Innovation 11-2004 HELEN ANDERSON and
JONATHAN MATHENY Paying Attention To The Construct Of Salience In Identity-related Literature and Beyond
12-2004 AARON GILBERT, ALIREZA
TOURANI-RAD and TOMASZ WISNIEWSKI
The Impact of Regulatory Change on Insider Trading Profitability: Some Early Evidence from New Zealand
13-2004 AARON GILBERT, ALIREZA
TOURANI-RAD and TOMASZ WISNIEWSKI
Do Insiders Crowd Out Analysts?
14-2004 AARON GILBERT, ALIREZA
TOURANI-RAD and TOMASZ WISNIEWSKI
Insiders and the Law: The Impact of Regulatory Change on Insider Trading
15-2004 JULIE DOUGLAS Wages and Conditions of Clinical Coders in
New Zealand. A report of surveys conducted in 1998 and 2004
16-2005 GLEN OLIVER and PETER
MCGHEE
In Search of Professional Identity: A Descriptive Study of New Zealand “Professional” Bodies’ Codes of Ethics
17-2005 PAUL WELLS The Supply of Accounting Graduates in New
Zealand 18-2005 PAUL WELLS and PETER
FIEGER Accounting: Perceptions of Influential High School Teachers in the USA and NZ
19-2005 RACHEL MORRISON
Testing for the Invariance of a Causal Model of Friendships at Work: An Investigation of Job Type and Needs
20-2005 MARTIE-LOUISE
VERREYNNE Strategy-Making Process and Firm Performance in Small Firms
21-2005 BART FRIJNS, AARON
GILBERT and ALIREZA TOURANI-RAD
Insider Trading, Regulation and the Components of the Bid-Ask Spread

22-2005 BELINDA LUKE and MARTIE-LOUISE VERREYNNE
Exploring Entrepreneurship in the Public Sector: Examining the Application of Strategic Entrepreneurship to SOEs
23-2005 MING-HUA LIU, DIMITRI
MARGARITIS and ALIREZA TOURANI-RAD
Monetary Policy Transparency and Pass-Through of Retail Interest Rates
24-2005 HARDJO KOERNIADI and
ALIREZA TOURANI-RAD
Accruals and Cash Flows Anomalies: Evidence from the New Zealand Stock Market