monetary policy report 2018 world economic outlook (weo), indicated that global economic growth...
TRANSCRIPT

Monetary Policy Report
May 2018
Volume XVIIII Number 1
ISSN 1817-9959 Draft
CENTRAL BANK OF TRINIDAD AND TOBAGO MONETARY POLICY REPORT MAY 2018
2
PART I – OVERVIEW AND OUTLOOK
OVERVIEW
Since the last Monetary Policy Report (MPR) of November 2017, the international economic
and financial environment strengthened further. The International Monetary Fund (IMF), in its
April 2018 World Economic Outlook (WEO), indicated that global economic growth increased
momentum in 2017. According to the IMF, this improvement was due to a rebound in global
trade which was driven by a recovery in inventory investment in advanced economies (AEs), an
upswing in emerging Europe and a pick-up in activity in some commodity exporters.
With the exception of the United States, monetary policy remained generally accommodative
in early 2018 as inflation rates hovered around central banks’ targets in both AEs and
emerging market and developing economies (EMDEs). Following hikes in the Federal Funds
Rate in December 2017 and March 2018, the US Federal Reserve (Fed) increased the range for
the Federal Funds Rate in June 2018. The Fed anticipates further improvements in US economic
activity and labour market conditions which increases the likelihood of future rate hikes this year.
The Fed also remains committed to unwinding the build-up of assets undertaken in the
‘Quantitative Easing’ era, which may further tighten interest rate conditions. In the United
Kingdom (UK), inflation in April 2018 remained above its target; however, weak economic
growth in the first quarter prompted the Bank of England (BOE) to keep its policy benchmark rate
unchanged in May 2018 in order to stimulate domestic activity. Nevertheless, the BOE warned
that gradual interest rate increases would be appropriate in the medium term to bring inflation
within target. In the Euro Area, in light of low inflation pressures, the European Central Bank
(ECB) maintained its benchmark refinancing rate at 0.0 per cent in April 2018. Among the
EMDEs, Russia and Brazil slowed the pace of monetary policy adjustments by maintaining their
policy rates in April and May 2018, following 25 basis point reductions in both countries in
March. Meanwhile, the Reserve Bank of India and the People’s Bank of China kept their
benchmark interest rates unchanged in April and May.
International energy prices remained strong over the first five months of 2018. Notably, oil
prices rose by 27.5 per cent (year-on-year). West Texas Intermediate (WTI) prices averaged
US$65 per barrel as cuts in production from the Organization of Petroleum Exporting Countries
(OPEC), coupled with robust demand, kept prices higher over the four-month period. Natural
gas prices averaged US$3.0 per mmbtu, a marginal decline from levels seen one year earlier.
On the domestic front, Trinidad and Tobago’s economy saw improved economic activity in
the energy sector from the latter half of 2017 into the first quarter of 2018, but activity in the
non-energy sector lagged. The energy sector’s performance was supported by new natural gas
production from the Juniper platform since August 2017, which engendered healthy outturns in

CENTRAL BANK OF TRINIDAD AND TOBAGO MONETARY POLICY REPORT MAY 2018
3
mid-stream (liquefied natural gas (LNG) and natural gas liquids (NGL)) and downstream activity
(ammonia and methanol). Data for the first quarter of 2018 suggest continued growth in energy
sector output as the increase in production of natural gas continues to have positive knock-on
effects on the mid-stream energy industries and petrochemicals sub-sectors. Preliminary data for
the non-energy sector indicate that there was less subdued activity in the first quarter of 2018 in
distribution while construction activity remains quite sluggish.
The Central Government financial accounts improved in the first seven months of fiscal year
(FY) 2017/18. Preliminary data from the Ministry of Finance show that the Central Government
accounts incurred a deficit of $2.9 billion in the first seven months of FY 2017/18 (FY runs from
October to September) compared to a deficit of $9.0 billion in the corresponding period one
year earlier. The smaller deficit was consistent with higher energy and non-energy revenues
along with reduced expenditure. The Mid-Year Budget Review signaled the Government’s
intention to reduce public expenditure by 3.3 per cent to $48.8 billion from $50.5 billion
originally budgeted for FY2017/18. The Government also reallocated $213 million to fund key
areas. In addition, expenditure on the capital programme is anticipated to reach $4.0 billion at
the end of FY2017/18 compared to $5.1 billion initially envisaged. As a result, the overall deficit
is projected at $4.2 billion, $500 million less than initially budgeted for FY2017/18.
Inflation remained well contained. In March 2018, the headline (year-on-year) inflation rate
stood at 0.8 per cent, down from the 1.2 per cent reported in September 2017. Food inflation
measured 2.1 per cent in March 2018, compared with 1.8 per cent in September 2017. Within
the food inflation category, there was some volatility in vegetables and seasoning prices while
higher international dairy prices impacted imported dairy products within the milk, cheese and
eggs sub-index. Core inflation eased over the six-month period to March 2018 influenced by
muted aggregate demand pressures. The Producer Price Index also reflected the general
macroeconomic setting, declining 1.2 per cent in the first quarter of 2018.
The Monetary Policy Committee (MPC) of the Central Bank maintained its neutral stance and
held the “Repo” rate at 4.75 per cent following its deliberations in March 2018. The
Committee noted that although inflation was low and short term TT-US differentials were below
parity, the nascent recovery of the energy sector had not yet spilled over to non-energy activities.
At the same time the Committee remained concerned about the further potential impact of the
US Fed’s policy rate decisions on the TT-US interest rate differentials and hence on Trinidad and
Tobago’s external balances. Meanwhile, the Bank continued to manage open market operations
(OMOs) flexibly to meet changing market conditions. With rising energy prices and improved
Government revenues in the first five months of 2018, net domestic fiscal injections surged
relative to the second half of 2017. As a result, between February and May, the Bank responded
by withdrawing liquidity from the system. Liquidity in the first five months of 2018 therefore
averaged $2,602.7 million daily, which was slightly lower than the $2,767.0 million daily over the
third and fourth quarters of 2017.

CENTRAL BANK OF TRINIDAD AND TOBAGO MONETARY POLICY REPORT MAY 2018
4
Since the last MPR, financial system credit to the private sector accelerated. Lending by the
consolidated system grew by 6.1 per cent in March 2018 (12 month basis) compared to 3.6 per
cent in September 2017. The uptick in credit reflected stronger growth in business credit, while
growth in loans to consumers is underpinned by loans for debt consolidation and refinancing. In
March 2018, real estate mortgage lending continued to grow robustly supported by declining
loan rates on residential mortgages.
Conditions in the local foreign currency market remained relatively tight, but eased
somewhat over the period January to May 2018, relative to the same period a year prior.
Sales of foreign currency by authorised dealers to the public were marginally higher; however the
increase in purchases of foreign exchange from the public (excluding from the Central Bank) by
authorised dealers were relatively larger due to larger conversions by energy companies in the
context of the improvement in energy prices. Foreign exchange sales were mainly driven by
credit cards and the retail and distribution and manufacturing sectors. As a result of these
conditions, the Central Bank was able to lower somewhat its foreign exchange sales to the market
compared to the first five months of 2017, while maintaining its bi-weekly intervention schedule.
OUTLOOK
According to the IMF’s WEO (April 2018), global economic growth is likely to strengthen to
3.9 per cent in both 2018 and 2019, owing to improved momentum across major advanced
economies, favourable financial conditions, and a pick-up in activity in commodity exporting
economies. In particular, tax cuts and higher public spending in the US should stimulate
economic activity, and provide growth stimuli to other countries. Growth in the UK is likely to be
modest due to weak consumer spending and the drag on business investment from the ongoing
political and economic uncertainty relating to Brexit negotiations. Activity in the Euro Area is
likely to remain steady in 2018. As for EMDEs, growth is expected to rise further in 2018,
reflecting stronger economic outcomes in emerging Asia and improved prospects for commodity
exporters.
The forecast for global growth, however, carries some risks which appear to be broadly
balanced over the short term. On the upside, business and consumer confidence have
remained strong thus far in 2018, which could lead firms to expand their capital investment and
thereby promote growth. On the downside, a faster pick-up in inflation in the US could trigger a
more rapid increase in interest rates by the US Fed leading to a tightening of global financing
conditions and higher credit costs. Further, impositions by large countries of cross border trade
barriers could dampen economic activity and weaken confidence in global commerce.
Domestically, growth will continue to be led by energy sector output, stemming mainly from
increased natural gas from the Juniper project and the anticipated commencement of the

CENTRAL BANK OF TRINIDAD AND TOBAGO MONETARY POLICY REPORT MAY 2018
5
Angelin project in late 2018. This will continue to support strong mid-stream and downstream
output. The boost in energy production is expected to progressively spill over to non-energy
activities; the pace of recovery will depend among other factors on the speed of execution of
public capital projects as well as the responsiveness of the private sector. The fiscal situation will
remain challenging in the short term, although there would be an impetus to revenue if
international energy prices and domestic energy output remain buoyant. Likewise, a measure of
tightness in the foreign exchange market is also likely to persist over the next few months, but
high energy prices—if sustained—could relieve pressure by adding to forex inflows. A durable
balance in the forex market would ultimately be dependent on an appropriate combination of
fiscal, structural and monetary policies.
Headline inflation is expected to remain relatively low over 2018, but the US Fed is on
course to raise interest rates further. Aggregate demand pressures on inflation are likely to be
fairly muted as the economy slowly recovers, although a possible rise in water and electricity rates
in the wake of a review by the Regulated Industries Commission would impact core inflation. At
the same time, the near certainty of additional interest rate hikes by the Fed in 2018 would
create further challenges for domestic monetary policy by exacerbating the already negative
interest differential between Trinidad and Tobago and US short term instruments.

CENTRAL BANK OF TRINIDAD AND TOBAGO MONETARY POLICY REPORT MAY 2018
6
TABLE Ia
TRINIDAD AND TOBAGO: SUMMARY OF ECONOMIC INDICATORS
2016 2017
Jan-March
2017
Jan-March
2018
Real Sector Activity
Energy Sector
Total Depth Drilled (metres) 108,886.1 121,396.4
37,793.7 24,704.0
Crude Oil Production (b/d) 71,503.6 71,852.9
74,353.3 68,140.7
Crude Oil Exports (000 bbls) 10,291.7 9,971.7
2,915.4 2,402.3
Refinery Throughput (b/d) 148,251.4 130,788.8
132,412.0 126,929.7
Natural Gas Production (mmcf/d) 3,326.6 3,366.0
3,315.3 3,761.0
Natural Gas Utilization (mmcf/d) 3,103.8 3,171.5
3,091.7 3,468.7
LNG Production (000 cubic metres) 24,408.2 25,072.8
6,163.6 7,431.0
Fertilizer Production (000 tonnes) 5,521.9 5,595.0
1,337.8 -
Fertilizer Exports (000 tonnes) 5,149.8 5,140.8
1,279.2 -
Methanol Production (000 tonnes) 4,655.0 4,974.9
1,115.5 1,333.2
ECPI (Jan 2007 = 100) 67.8 83.5
84.1 96.8
Non Energy
Local Sales of Cement (000 tonnes) 524.3 497.3
124.6 119.3
New Motor Vehicle Sales 16,203.0 14,153.0
3,204.0 3,685.0
Average Daily Job Vacancy Advertisements 577.0 450.8
498.0 394.0
Prices (Average)
Year-on-Year per cent change
Producer Prices 1.2 1.9
2.8 -1.2
Headline Inflation 3.1 1.9
3.0 0.9
Food Inflation 7.5 2.9
4.7 2.4
Core Inflation 2.2 1.6
2.6 0.5
Monetary (end of period)
Year-on-Year per cent change
Private Sector Credit 3.3 4.6
2.6 6.1
Consumer Lending 6.6 5.1
5.8 6.5
Business Lending 0.3 1.3
-0.7 4.5
Real Estate Mortgages 4.4 8.0
4.3 7.7
M-1A 2.6 -3.0
-2.5 -1.7
M-2 3.2 -2.1
-0.3 -0.8
Commercial Banks' Daily Average Excess Reserves (TT$ millions) 3,959.8 3,060.6
3,516.3* 2,665.6*
TT 91 day Treasury Bill Rate (end of period; per cent) 1.20 1.21
1.30** 1.20**
Fiscal (October-September)
Overall Fiscal Balance -7,972.1 -12,643.5re
-2,909.8*** -8,991.1***
Overall Fiscal Balance to GDP -5.3 -8.5
- -
Financial Stability - Commercial Banks
Non-Performing Loans (per cent) 3.1 2.9
3.1 3.1
Capital Adequacy Ratio (per cent) 21.9 21.0
21.8 22.2
Capital Market
Composite Price Index (1983 = 100; end of period) 1,209.5 1,266.4
1,216.3** 1,247.1**
Volume of Shares Traded (millions) 92.0 84.6
35.4* 29.7*
Mutual Funds Under management ($Billions) 43.0 43.2
- -
External
US$ millions
Authorised Dealers Sales of Foreign Exchange to Public 5,776.8 5,189.5
2,159.6* 2,249.5*
Authorised Dealers Purchases of Foreign Exchange from Public 4,289.0 3,606.9
1,398.9* 1,588.8*
CBTT Sales to Authorised Dealers 1,811.6 1,755.0
785.0* 645.0*
Net Official Reserves (end of period) 9,465.8 8,369.8
8,995.6** 7,965.4**
Sources: Central Bank of Trinidad and Tobago, Central Statistical Office, Trinidad and Tobago Stock Exchange and Ministry of Energy and Energy Industries.
* Data for the period January to May.
** Data as at the end of May.
*** Data for the period October-April.
re Revised Estimate.

CENTRAL BANK OF TRINIDAD AND TOBAGO MONETARY POLICY REPORT MAY 2018
7
PART II – INTERNATIONAL AND REGIONAL MONETARY POLICY DEVELOPMENTS
The rebound in global trade and recovery of investment were the primary drivers of the global
economic expansion of 3.8 per cent in 2017 according to the International Monetary Fund (IMF) in
its April 2018 World Economic Outlook (WEO). The increase in global economic activity in the
second half of 2017 was the strongest since the second half of 2010. The IMF forecast further
strengthening in global recovery in 2018 and 2019, with an expansion of 3.9 per cent for both
years (Chart IIa). This uptick will be supported by strong momentum, favourable market
sentiment, accommodative financial conditions, and the stimulus from expansionary fiscal policy in
the United States (US). However, trade friction between the US and other large trading partners
threatens global activity and sentiment. Gradual improvements are anticipated for commodity
exporters, mainly due to the expected modest recovery in commodity prices in the near term. The
global monetary policy environment remained generally supportive in early 2018 as inflation
remained low in many AEs and EMDEs. Economic prospects in the Caribbean are generally
improving. In its April 2018 Regional Economic Outlook (REO), the IMF forecasts real Gross
Domestic Product (GDP) growth for commodity exporting countries in the Caribbean1
a rebound
to positive growth of 0.8 per cent in 2018, following a contraction of 1.5 per cent in 2017, whilst
tourism-dependent economies2
are projected to grow further by 1.7 per cent in 2018, aided by
improvements in external demand. The recovery in international commodity prices is expected to
increase inflationary and external account pressures particularly in service-based economies.
Moreover, CARICOM members continue to face macroeconomic challenges of high
unemployment, deficits in fiscal and external positions and high levels of sovereign indebtedness.
CHART IIa
GLOBAL GROWTH – REAL GDP
(Annual Per Cent Change)
Source: International Monetary Fund, World Economic Outlook, April 2018.
ADVANCED ECONOMIES
The US continued to normalize its monetary policy in light of stable economic growth and falling
unemployment. The US Federal Reserve increased its target range for the Federal Funds Rate at
1.75 to 2.00 per cent at its June 2018 monetary policy meeting (Chart IIb). However, the Fed
continues to reduce its holdings of treasury and agency securities. The Fed anticipates
1 Commodity exporting countries include Belize, Guyana, Suriname and Trinidad and Tobago.
2 Tourism dependent economies include The Bahamas, Barbados, Jamaica and the members of the Eastern Caribbean Currency
Union (ECCU).

CENTRAL BANK OF TRINIDAD AND TOBAGO MONETARY POLICY REPORT MAY 2018
8
improvements in US economic activity and labour market conditions, as well as higher inflation
over the near term, which would underpin increases in the federal funds rate in 2018.
Meanwhile, the Bank of England (BoE) maintained its benchmark interest rates at 0.5 per cent in
May 2018; however, it warned that tighter monetary policy was appropriate to return inflation to
its target level. In June 2018, the European Central Bank (ECB) maintained its benchmark
refinancing rate at 0.0 per cent, while committing to keep net asset purchases at €30.0 billion
until the end of September 2018. The monthly pace of the net asset purchases will be
reduced to €15 billion from September to December 2018, and will then end. Amidst lethargic
growth and low inflation, the Bank of Japan (BOJ) held its policy rate at minus 0.1 per cent and its
10-year government bond yield target around 0.0 per cent in April 2018 (Chart IIb).
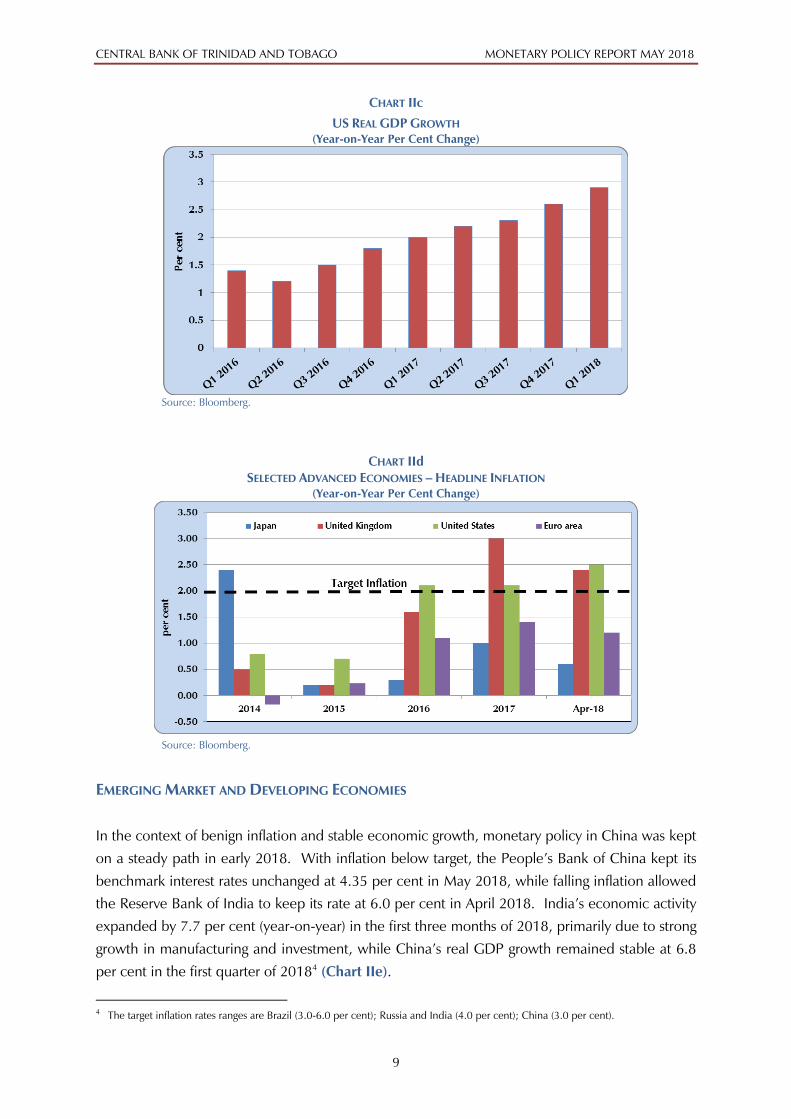
Over the first quarter of 2018 economic growth in the AEs, with the exception of the US, was
muted as compared to the second half of 2017. The US economy expanded by 2.8 per cent
(year-on-year) in the first quarter of 2018, up from 2.6 per cent (year-on-year) in the previous
quarter, reflective of positive contributions from nonresidential fixed investment and personal
consumption expenditures (PCE) (Chart IIc). Meanwhile, inflation rates in the AEs continued to
trend below their respective central bank target levels3
in the first few months of 2018. The US
core personal consumption expenditure price index (PCEPI), the Fed’s preferred inflation
measure, moved closer to the Fed’s target of 2.0 per cent registering 1.8 per cent (year-on-year)
in April 2018. Slower rises in the cost of transport resulted in the deceleration of the inflation rate
in Japan to 0.6 per cent (year-on-year) in April 2018 (Chart IId). In contrast, inflation in the UK
remained above target despite decelerating to 2.4 per cent (year-on-year) in May 2018.
CHART IIb
SELECTED ADVANCED ECONOMIES – POLICY RATES
Source: Bloomberg.
3 The target inflation rate for the United States, United Kingdom, Euro Area and Japan is 2.0 per cent.
CENTRAL BANK OF TRINIDAD AND TOBAGO MONETARY POLICY REPORT MAY 2018
9
CHART IIc
US REAL GDP GROWTH
(Year-on-Year Per Cent Change)
Source: Bloomberg.
CHART IId
SELECTED ADVANCED ECONOMIES – HEADLINE INFLATION
(Year-on-Year Per Cent Change)
Source: Bloomberg.
EMERGING MARKET AND DEVELOPING ECONOMIES
In the context of benign inflation and stable economic growth, monetary policy in China was kept
on a steady path in early 2018. With inflation below target, the People’s Bank of China kept its
benchmark interest rates unchanged at 4.35 per cent in May 2018, while falling inflation allowed
the Reserve Bank of India to keep its rate at 6.0 per cent in April 2018. India’s economic activity
expanded by 7.7 per cent (year-on-year) in the first three months of 2018, primarily due to strong
growth in manufacturing and investment, while China’s real GDP growth remained stable at 6.8
per cent in the first quarter of 20184
(Chart IIe).
4 The target inflation rates ranges are Brazil (3.0-6.0 per cent); Russia and India (4.0 per cent); China (3.0 per cent).

CENTRAL BANK OF TRINIDAD AND TOBAGO MONETARY POLICY REPORT MAY 2018
10
The Central Bank of Russia held its one-week repo rate at 7.25 per cent in April 2018, while the
Central Bank of Brazil also maintained its key policy rates at 6.50 per cent in May following a 25
basis point reduction in March. The accommodative monetary policy stance of Brazil and Russia
is consistent with below-target inflation and continued positive economic growth in both
economies. Brazil’s real GDP growth eased to 1.2 per cent (year-on-year) in the first quarter of
2018, primarily due to a slow rise in fixed investment and contraction in government spending.
Meanwhile, Russia’s real GDP growth expanded to 1.3 per cent in the first quarter of 2018 – its
sixth consecutive quarter of positive growth after two years of contractions.
Monetary policy in several economies in the Latin American region continued to support
economic activity (Table IIa). The Bank of Mexico slowed its monetary policy tightening, holding
its benchmark interest rate at 7.50 per cent in May. In April 2018, inflation in Mexico eased but
remained above the upper bound of the inflation target range (Chart IIf).
CHART IIe
BRIC COUNTRIES – QUARTERLY REAL GDP GROWTH
(Year-on-Year Per cent Change)
Source: Bloomberg.
CHART IIf
SELECTED LATIN AMERICAN COUNTRIES – INFLATION TARGET
Sources: Bloomberg, Banco Central de Chile, Banco Central de Colombia, Central Reserve Bank of
Peru and Banco de Mexico.

CENTRAL BANK OF TRINIDAD AND TOBAGO MONETARY POLICY REPORT MAY 2018
11
TABLE IIa
SELECTED KEY CENTRAL BANK POLICY RATES IN THE REGION
(Per cent Per Annum)
CURRENT RATE1
LAST CHANGE AMOUNT OF CHANGE
Chile 2.50 May 2017 -0.25
Colombia 4.25 Apr. 2018 -0.25
Peru 2.75 Mar. 2018 -0.25
Mexico 7.50 Feb. 2018 +0.25
Brazil 6.50 Mar. 2018 -0.25
Sources: Banco Central de Chile, Banco Central de Colombia, Central Reserve Bank of Peru, Banco de Mexico
and Banco Central do Brasil
1 As at June 04, 2018.
THE CARIBBEAN
Barbados’ weak external position prompted its Central Bank to continue its tight monetary policy
stance into January 2018. The Central Bank of Barbados increased the requirements of
commercial bank holdings of domestic deposits from 18 to 20 per cent in January. Inflationary
pressures have increased primarily due to the pass-through of higher international oil prices and
indirect taxes during 2017. Meanwhile, real GDP contracted by 0.7 per cent in the first three
months of 2018 reflecting conditions in the tourism sector, the slowing of construction activity
and the late start to the annual sugar harvest.
Economic activity in Jamaica was supported by the accommodative monetary policy stance of the
Bank of Jamaica (BoJ). For the fourth time in 2018, the BoJ lowered its policy interest rate (the
overnight rate placements with the Bank) in May. Real GDP expanded by 1.1 per cent (year-on-
year) in the fourth quarter of 2017 due to improved performances in the goods and services
industries. Meanwhile, Jamaica’s inflation rate fell below its target range of 4.0 to 6.0 per cent
after decelerating to 3.2 per cent (year-on-year) in April 2018 – the lowest inflation rate since
January 2017. Similarly, inflation in Guyana continued to decelerate in March (0.6 per cent year-
on-year), mainly owing to decreases in the sub-indices ‘footwear and repairs’ and ‘education,
recreation and cultural services’. In February, the Monetary Council of the Eastern Caribbean
Central Bank (ECCB) maintained the minimum savings deposit rate at 2.0 per cent and the
Central Bank discount rate at 6.5 per cent.

CENTRAL BANK OF TRINIDAD AND TOBAGO MONETARY POLICY REPORT MAY 2018
12
PART III – DOMESTIC ECONOMIC CONDITIONS
Supported by higher output of natural gas, output in the energy sector as measured by the Central
Bank’s Quarterly Index of Real Economic Activity (QIEA) expanded by 3.2 per cent in the fourth
quarter of 2017; however, for the same period, output in the non-energy sector declined by 3.3
per cent. The improvements in the energy sector aided Government’s revenue position and this,
along with further expenditure cuts, helped curb the overall fiscal deficit in the first half of FY
2017/18. Inflation remained contained during the early months of 2018. In the financial markets,
rising short-term interest rates in the US along with generally static domestic rates further widened
the already negative TT-US short-term differential.
a) REAL ECONOMIC ACTIVITY
Provisional estimates from the Central Bank’s QIEA indicate that the energy sector grew by 3.2
per cent in the fourth quarter of 2017, while the non-energy sector slipped by 3.3 per cent. The
expansion in the energy sector reflected increased output of most commodities, most importantly
of natural gas, which is a key input for other commodities down the production chain. During
the quarter, natural gas output rose by 6.4 per cent as a result of new output from the Juniper gas
project. This new production helped to ameliorate the long standing problem of gas shortages
and reinvigorated activity in the midstream and downstream energy industries. Substantial
improvements were therefore observed in natural gas liquids (NGL), liquefied natural gas (LNG),
methanol and ammonia. However, urea output, bucking the trend, fell by 30.2 per cent due to
maintenance downtime in December 2017. Meanwhile, crude oil production was slightly down
(1.9 per cent) (Chart IIIa), while refinery throughput fell by 9.8 per cent as the Petrotrin oil
refinery continued to face production challenges.
Economic performance in the non-energy sector, however, remained sluggish in the final quarter
of 2017. The distribution sector is estimated to have contracted by 5.8 per cent as indicated by
the Index of Retail Sales during the fourth quarter of 2017. Supermarket and grocery sales, sales
of construction and hardware materials, as well as household appliances and furniture and motor
vehicle parts, continued to decline. The finance, insurance, real estate and other businesses
sector contracted by 1.4 per cent as slower activity in the commercial banking and finance houses
sub-sectors weighed down improvements in other areas such as the trust and mortgage
companies and insurance companies. Construction activity remained weak, declining by 6.9 per
cent as sales of mined aggregates and local sales of cement fell by 15.1 per cent and 6.9 per cent,
respectively, and as the execution of the Central Government’s capital program slowed5
. The
manufacturing sector contracted by 3.0 per cent, with declines in the printing, chemicals, textiles
5 During the period October to December 2017, Central Government capital expenditure declined to $117.0 million compared with
$325.8 million during the corresponding period of 2016.

CENTRAL BANK OF TRINIDAD AND TOBAGO MONETARY POLICY REPORT MAY 2018
13
and assembly sub-sectors underpinning the outturn. The electricity and water sector declined by
1.0 per cent, while the transport sector recorded an increase of 1.4 per cent.
Estimates from the Central Bank’s QIEA suggest that the energy sector expanded by 9.3 per cent
(year-on-year) in the first quarter of 2018. The Juniper platform led the way, facilitating a 13.5
per cent jump in natural gas output. The knock-on effects of increased gas production have also
been reflected in higher LNG (20.6 per cent), NGLs (1.8 per cent) and methanol production
(19.5 per cent) during the first quarter of 2018, while fertilizer production also increased (8.8 per
cent). However, crude oil production fell 8.3 per cent given lower output from bpTT, with
refinery throughput also declining by 4.1 per cent.
In terms of the non-energy sectors, initial indicators point to an improvement (year-on-year) in
output in the distribution sector in the first quarter of 2018. New motor vehicle sales increased
by 15 per cent (year-on-year) owing to sharp increases in the sales of private motor vehicles (20.7
per cent) while commercial motor vehicle sales grew more modestly (3.4 per cent). However,
signs of recovery in the construction sector are yet to emerge, in light of evidence of continued
slowdown in local sales of cement and mined aggregates.
CHART IIIa
CRUDE OIL AND NATURAL GAS PRODUCTION
Source: Ministry of Energy and Energy Industries.
b) RETAIL PRICES
Inflation as measured by the CSO’s Index of Retail Prices (RPI) has been trending down since
2014, led by moderations in food prices, which are the main influence on headline rate.
Inflation has fallen further since the last MPR in November 2017, reaching 0.8 per cent in March
2018 (Chart IIIb). Core inflation, which is the measure excluding the volatile food component,
remained subdued, dipping below 1.0 per cent in December 2017 and easing further to 0.5 per
cent in March 2018. Over the six-month period to March 2018, lower prices for mobile services

CENTRAL BANK OF TRINIDAD AND TOBAGO MONETARY POLICY REPORT MAY 2018
14
drove consistent price declines in the Communication sub-index, while the Clothing and
Footwear sub-index moved lower on account of declines in homemade and ready-made clothing
(Table IIIa). Smaller price increases were also recorded in the Furnishings, Health and Hotels
sub-indices. Apart from the initial impact, adjustments to fuel prices through the reduction of
Government fuel subsidies seem not to have affected transportation prices in a sustained fashion
as the transportation sub-index has shown very little movement over the last six months. Food
inflation measured 2.1 per cent in March 2018, a slight increase from the 1.8 per cent recorded
in September 2017. Declines in the bread and cereals and meat sub-indices were offset by
increases in the prices of fish, fruits, sugar, jam and other confectioneries and Food products
N.E.C. sub-indices.
CHART IIIb
INDEX OF RETAIL PRICES
(Year-on-Year Per Cent Change)
Source: Central Statistical Office.
Producers’ Prices and Building Material Prices
Producer prices, as measured by the Producer Price Index of the CSO were generally contained
over the last year and declined by 1.2 per cent (year-on-year) in the first quarter of 2018. There
appears to be no significant impulses to consumer prices emanating from the producer prices
level. The fall-off in the first quarter was largely on account of an 11.3 per cent decline (year-on-
year) in the Chemicals and Non-Metallic Products sub-index, led by declines in the cement (29.4
per cent) and ‘Readymix’ concrete (18.3 per cent) indices, suggestive of sluggish demand for
construction materials. This follows contractions of 19.2 per cent and 18.3 per cent, respectively,
in the fourth quarter of 2017. The Index of Retail Prices of Buildings Materials on the other hand
increased 2.4 per cent in the first quarter of 2018 (year-on-year). Costs associated with site
preparation, structure and concrete frame and finishing, joinery units and painting and external
works declined, while all other costs increased.

CENTRAL BANK OF TRINIDAD AND TOBAGO MONETARY POLICY REPORT MAY 2018
15
TABLE IIIa
INDEX OF RETAIL PRICES
(Per Cent Change)
JANUARY 2015 = 100
YEAR-ON-YEAR
WEIGHTS FEB-18 MAR-18
HEADLINE INFLATION 1000 0.9 0.8
Food and Non-Alcoholic Beverages 173 2.6 2.1
Bread and Cereals 33 1.6 1.0
Meat 31 -0.5 -1.4
Fish 11 -2.2 0.4
Vegetables 24 4.6 4.3
Fruits 6 8.0 4.7
Milk, Cheese & Eggs 21 7.5 7.8
Butter, Margarine, Edible Oils 10 8.0 5.8
Sugar, Jam, Confectionery, etc. 6 1.4 2.1
Food Products NEC 13 4.0 0.7
Non-Alcoholic Beverages 18 0.7 0.8
CORE INFLATION 827 0.5 0.5
Alcoholic Beverages & Tobacco 8.7 -0.3 1.1
Clothing and Footwear 56.7 -6.4 -6.6
Furnishings, Household Equipment and Routine Maintenance 67.2 0.5 0.5
Health 40.6 2.8 2.4
Of which: Medical Services 10.4 3.5 3.5
Housing, Water, Electricity, Gas & Other Fuels 274.6 1.1 1.1
Of which: Rent 21.5 1.5 1.5
Home Ownership 193.3 1.3 1.3
Education 9.9 0.0 0.0
Recreation & Culture 65.5 0.7 0.7
Hotels, Cafes & Restaurants 24.9 2.4 2.4
Transport 147.4 1.4 1.4
Communication 45.1 -1.7 -1.7
Miscellaneous Goods and Other Services 85.9 1.2 1.2
Source: Central Statistical Office.

CENTRAL BANK OF TRINIDAD AND TOBAGO MONETARY POLICY REPORT MAY 2018
16
BOX 1: THE RECENT EVOLUTION OF DOMESTIC INFLATION
Inflation in Trinidad and Tobago is measured monthly via the computation of the Index of Retail Prices, which is issued
by the Central Statistical Office. Changes in the Index over corresponding periods provide a measure of the domestic
inflation rate which has two main measures: headline inflation, which is the overall rate of inflation, and core inflation,
which is the rate after excluding food inflation. Headline or overall inflation in the domestic economy has generally
trended downwards between 2013 and 2017. From an average rate of 5.2 per cent in 2013, headline inflation peaked
at 5.7 per cent in 2014 but fell thereafter to 1.9 per cent in 2017. The decline in headline inflation continued into the
early months of 2018 when monthly inflation slowed to 0.9 per cent, its lowest level in recent times. The cooling of the
headline inflation was associated with a slowing of the food component and the relative stability of core inflation (Chart
1).
Analysis of food inflation in Trinidad and Tobago reflects that it is traditionally impacted by movements in both imported
food products and locally produced items. Mahabir and Jagessar (2011)1 found that from 2004 to 2010 there was
generally a two month lag between changes in international food prices and changes domestically. They further found
that the impact of these changes could last anywhere between five and nine months. Looking at a more contemporary
time series we see that annual food inflation declined from 8.8 per cent in 2013 to 7.5 per cent in 2015 and 2016 (Chart
1). A closer look at the monthly data reflects that recently international FAO prices have had a weaker impact on
domestic food inflation, suggesting a shift away from the previously mentioned paradigm. Evidence of this was recently
seen in the divergences in the international and domestic sub-indices for both dairy and meat products among others.
From 2011 to present international food prices have actually diverged from domestic prices (Chart 2). Major reasons
attributed to this have been global oversupply (which began with the recommencement of Russian exports), a lower
energy price environment since 2014 and reduced demand from the Chinese economy. This was particularly noticeable
in 2015 and 2016. In these years international food prices as measured by the Food and Agricultural Organization’s
food index fell by an average of 10.1 per cent.
Further, domestic food supplies in these years were not significantly impacted by adverse weather such as droughts
and flood as in prior years. In 2016 the Government reintroduced VAT on a variety of food items which were previously
zero rated. While this would have placed higher pressures on food inflation, the impact of the change on overall
inflation was, however, limited as the general VAT rate was simultaneously reduced to 12.5 per cent from 15 per cent.
Subsequently, the impact of the reintroduction of VAT on previously zero-rated items in 2016 eventually wore off in
2017. Higher international food prices in the early stages of 2017 were transmitted to local retail prices and the impact
was observed mainly on the milk, cheese and eggs sub-index of the RPI.
Core inflation, on the other hand, has been relatively stable over the past five years, helping to slow overall inflation.
The economic declines in 2016 and 2017 helped to dampen aggregate demand, resulting in subdued inflationary
pressures. Trends in some macroeconomic indicators attest to the slow aggregate demand, for example, consumption
spending and business investment are likely to have slowed as suggested by weak consumer credit and business
borrowing from the consolidated financial system. During 2016 and 2017, domestic prices were also affected by
changes in fuel prices due to the reduction in fuel subsidies. However, the secondary impacts were limited because
some retailers and businesses may have absorbed some of the price increases. Further analysis shows that
recessionary periods generally coincide with notable decreases in headline inflation (Chart 3).
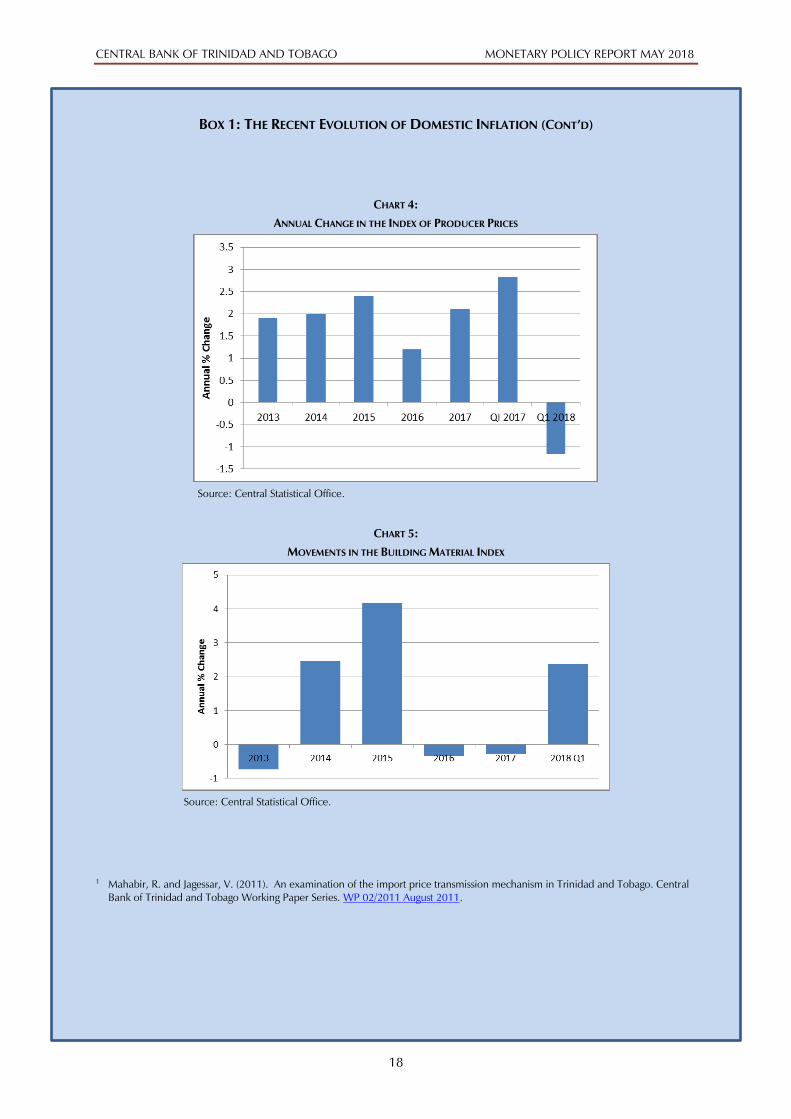
The current low inflationary environment at the consumer level is consistent with low inflation at the producer or
wholesale level and by low prices for building materials. The PPI monitors changes in prices that producers receive for
their goods before the goods are sold at the retail level. In 2017, the PPI increased by 2.1 per cent but over the first
quarter of 2018 fell by 1.2 per cent (year-on-year). The general contraction of the Index of Retail Prices of Buildings
Materials also contributed to the observed low rate of the core inflation (Charts 4 and 5). Owing to the significant
anemic activity in in the construction industry the prices of building materials generally declined in in 2016 and 2017.
However, these prices rebounded slightly over the first quarter of 2018 (2.4 per cent year-on-year).

CENTRAL BANK OF TRINIDAD AND TOBAGO MONETARY POLICY REPORT MAY 2018
17
BOX 1: THE RECENT EVOLUTION OF DOMESTIC INFLATION (CONT’D)
CHART 1:
ANNUAL CHANGE IN THE INDEX OF RETAIL PRICES
Source: Central Statistical Office.
CHART 2:
DOMESTIC VS. INTERNATIONAL FOOD INFLATION
Sources: Central Statistical Office and Food and Agriculture Organization.
CHART 3:
INFLATION IN DOWNTURN PERIODS
Sources: Central Statistical Office and Central Bank of Trinidad and Tobago.
CENTRAL BANK OF TRINIDAD AND TOBAGO MONETARY POLICY REPORT MAY 2018
18
BOX 1: THE RECENT EVOLUTION OF DOMESTIC INFLATION (CONT’D)
CHART 4:
ANNUAL CHANGE IN THE INDEX OF PRODUCER PRICES
Source: Central Statistical Office.
CHART 5:
MOVEMENTS IN THE BUILDING MATERIAL INDEX
Source: Central Statistical Office.
1 Mahabir, R. and Jagessar, V. (2011). An examination of the import price transmission mechanism in Trinidad and Tobago. Central
Bank of Trinidad and Tobago Working Paper Series. WP 02/2011 August 2011.

CENTRAL BANK OF TRINIDAD AND TOBAGO MONETARY POLICY REPORT MAY 2018
19
c) LABOUR MARKET
Latest official unemployment statistics from the CSO point to an unemployment rate of 5.3 per
cent in the second quarter of 2017, up from 4.5 per cent in the previous quarter. Between June
2016 (when the unemployment rate was 4.4 per cent) and June 2017, the number of persons
with jobs fell by 9.5 thousand, while those persons without jobs and actively seeking employment
increased by 5.5 thousand. This suggests that roughly 3.9 thousand persons left the labour force.
Consequently, the labour force participation rate dipped from 60.0 to 59.5 per cent over this 12
month period. The highest rates of unemployment were observed in the construction (11.1 per
cent) and petroleum and gas (8.4 per cent) industries, reflecting subdued economic activity in
those sub-sectors6
.
In the absence of official unemployment data for the latter half of 2017, a review of retrenchment
notices filed with the Ministry of Labour and Small Enterprise Development showed a slowdown
in the number of retrenchments reported7,8
. Between July and December 2017, the total number
of retrenchments amounted to 450 compared with 585 during the same period of 2016. The
majority occurred in the energy (148 persons), finance, insurance, real estate and business
services (126 persons), and manufacturing (67 persons) sectors.
Labour productivity, as measured by the Index of Productivity9
, improved slightly (0.6 per cent)
during the second half of 2017 relative to the year-earlier period. This was driven by the 13.1
per cent (year-on-year) improvement in the natural gas refining sub-component of the
Productivity Index due to the boost in natural gas production from the Juniper platform since the
third quarter of 2017. On the other hand, productivity in the non-energy sector continued to
wane with year-on-year declines in several sectors, including food processing (22.6 per cent),
water (21.7 per cent), and printing and newspaper publishing (15.1 per cent).
Meanwhile, average nominal wages rose in the second half of 2017 despite soft labour market
conditions. The Index of Average Weekly Earnings (AWE)10
, increased by 5.1 per cent year-on-
year over this 6 month period compared to the similar period of 2016.
6 Based on the Central Bank’s Quarterly Index of Real Economic Activity (QIEA), the construction and energy sectors experienced
year-on-year declines of 4.1 per cent and 3.1 per cent, respectively, during the second quarter of 2017.
7 This indicator for job separation is limited insofar as it only includes registered retrenchment notices, and does not capture other
forms of job separation, especially the non-renewal of contracts of temporary or short-term workers. Retrenchment refers to the
termination of employment of a worker at the initiative of an employer for the reason of redundancy according to the
Retrenchment and Severance Benefits Act (No. 32 of 1985). The act states that, “where an employer proposes to terminate the
services of five or more workers for the reason of redundancy he shall give formal notice of termination in writing to each involved
worker, to the recognised majority union and to the Minister of Labour”. As such, if fewer than five employees are terminated,
employers are not obligated to report to the Ministry.
8 However, there have also been reports of job cuts, voluntary separation of employment packages (VSEP), and non-renewal of
contracts in both public and private enterprises.
9 The Index of Productivity comprises data for the following industries: manufacturing, electricity, water, and energy (crude oil,
natural gas, and petrochemicals). It is calculated as the ratio of the Index of Domestic Production to the Index of Hours Worked.
10 The Index of Average Weekly Earnings, which is computed by the Central Statistical Office, is based on surveyed companies’
employment and wage bill. The average weekly earnings is calculated as the earnings (total amount paid to employees) divided by
the number of employees.

CENTRAL BANK OF TRINIDAD AND TOBAGO MONETARY POLICY REPORT MAY 2018
20
d) FISCAL OPERATIONS
The public sector accounts strengthened in the first seven months of fiscal year (FY) 2017/18
(Table IIIb). Preliminary data from the Ministry of Finance show that the Central Government
accounts incurred a deficit of $2,909.8 million in the first seven months of FY 2017/18 compared
to a deficit of $8,991.1 million in the corresponding period one year earlier. The smaller deficit,
which was consistent with higher energy and non-energy revenues and reduced expenditure, was
financed by borrowing primarily on the domestic capital market, some external multilateral loans
and the use of the Central Bank overdraft facility11
. As a result, the non-energy fiscal deficit fell to
$9,233.2 million from a deficit of $12,263.6 million one year ago.
Central Government total revenue rose year-on-year by $4,285.3 million to $23,058.0 million in
the first seven months of FY 2017/18. Energy revenue increased to $6,323.1 million from
$3,272.5 million, primarily on account of higher international petroleum prices12
, natural gas
output and royalties13
on crude oil and natural gas. Collections of non-energy revenues also
improved, by 12.8 per cent to $16,725.5 million, largely as a result of increased collections from
taxes on income and profits and goods and services and non-tax revenue. Non-energy receipts
were partially offset by lower collections on international trade. The data also show a large fall-off
in capital revenue to $9.2 million from $675.6 million, which partly reflected lower receipts year-
on-year from the sale of CL Financial assets14
.
On a year-on-year basis, Central Government aggregate expenditure fell by 6.5 per cent to
$25,967.8 million in the seven-month period to April 2018. This reflected lower spending across
most categories of current expenditure. Outlays on wages and salaries were lower due to a
moderation in payments of arrears to public officers, while expenditure on goods and services
also fell. Reduced spending on transfers and subsidies were observed in transfers to households,
particularly the petroleum subsidy15
and subventions to Statutory Boards and Similar Bodies.
Conversely, expenditure on the capital programme rose from $1,334.9 million to $1,479.2
million while interest payments rose from $1,868.5 million to $2,145.9 million.
In its Mid-Year Budget Review the Government signalled its intention to reduce public
expenditure by 3.3 per cent to $48.8 billion from $50.5 billion originally budgeted for
11
In December 2017, the Central Bank Act was amended to raise the limit on Central Bank financing to the Government to 20.0 per
cent from 15.0 per cent of Government revenue.
12 For example, over the first seven months of FY 2017/18 West Texas Intermediate (WTI) crude oil prices averaged US$59.28 per
barrel compared to US$50.57 per barrel in the year earlier period.
13 In the first seven months of FY2017/18 royalties amounted to roughly $1,335.8 million, compared to $324.1million in the
comparative period a year earlier. On December 1, 2017, royalty rates for both crude oil and natural gas were standardised at 12.5
per cent of their fair market value. Previously, crude oil royalty rates ranged between 10.0 per cent and 15.0 per cent while natural
gas was taxed at $0.015 per mmscf.
14 The Ministry of Finance (MoF) records sale of assets as capital revenue. According to the IMF’s Government Finance Statistics
Manual sale of assets are counted as “one-off fiscal financing”. The Central Bank follows the MoF method of recording.
15 In the first seven months of FY2017/18 there were no payments of petroleum subsidy. However, in the comparative period of FY
2016/17 petroleum subsidy payments amounted to $355.0 million.
CENTRAL BANK OF TRINIDAD AND TOBAGO MONETARY POLICY REPORT MAY 2018
21
FY2017/18. In addition, expenditure on the capital programme was anticipated to reach $4.0
billion compared to $5.1 billion initially budgeted. These adjustments were forecast to lower the
overall deficit by $0.5 billion to $4.2 billion.
Total public sector debt outstanding amounted to $120.4 billion at the end of April 2018, when
compared to $121.3 billion at the end of September 2017. Net of debt issued for liquidity
management purposes, public sector debt increased over the period to $95.6 billion from $93.6
billion in September 2017. During the first seven months of FY 2017/18, Central Government
borrowed $5.1 billion domestically under the General Development Loans Act to finance its fiscal
operations as well as for debt refinancing, while making principal repayments of $3.0 billion. As
a result, domestic debt (excluding sterilised debt and contingent debt) increased to $42.4 billion
at the end of April 2018 from $40.8 billion in September 2017. Similarly, external debt
increased to $24.8 billion in April 2018, from $23.5 billion in September 2017. The increase is
partially due to the disbursement of the first tranche of an external loan contracted from the
Corporación Andina de Fomento (CAF), the Development Bank of Latin America, as well as
disbursements made under existing arrangements with the Inter-American Development Bank
(IDB).

CENTRAL BANK OF TRINIDAD AND TOBAGO MONETARY POLICY REPORT MAY 2018
22
TABLE IIIb
SUMMARY OF CENTRAL GOVERNMENT FISCAL OPERATIONS
(TT$ Millions)
2015/
2016
2016/
2017re
Oct. –
Apr. 18
Oct. –
Apr.17
2017/
2018b
TOTAL REVENUE 44,972.6 37,835.7 23,058.0 18,772.7 45,741.8
Current Revenue 41,158.9 36,135.5 23,048.8 18,097.1 39,321.8
Energy Revenue 6,644.4 7,791.0 6,323.1 3,272.5 10,127.2
Non-Energy Revenue 34,514.5 28,344.5 16,725.4 14,824.6 29,194.6
Income 12,920.1 11,845.2 7,331.0 6,714.2 13,509.6
Property 3.2 3.1 1.2 1.3 253.2
Goods & Services 8,913.0 8,151.1 5,378.1 4,190.7 9,303.7
International Trade 3,016.3 2,582.9 1,483.3 1,519.0 2,679.2
Non-Tax Revenue 9,661.8 5,762.2 2,531.8 2,399.4 3,448.9
Capital Revenue 3,813.7 1,700.2 9.2 675.6 6,420.0
TOTAL EXPENDITURE 52,944.7 50,479.2 25,967.8 27,763.8 50,501.5
Current Expenditure 48,546.4 46,907.7 24,488.7 26,428.9 45,378.5
Wages and Salaries 9,601.9 10,021.5 5,254.7 6,073.7 9,346.5
Goods and Services 7,326.1 5,914.2 2,784.2 2,963.7 6,628.8
Interest Payments 3,762.4 4,537.5 2,145.9 1,868.5 3,572.7
Transfers and Subsidies1
27,856.1 26,434.5 14,303.9 15,523.0 25,830.5
Capital Expenditure and Net Lending 4,398.3 3,571.5 1,479.2 1,334.9 5,123.0
Current Account Surplus (+)/Deficit (-) -7,387.6 -10,772.2 -1,439.9 -8,331.8 -6,056.7
Current Account Surplus /Deficit (% of GDP) -4.9 -7.2 - - -3.9
Overall Surplus (+)/Deficit (-) -7,972.1 -12,643.5 -2,909.8 -8,991.1 -4,759.7
Overall Surplus /Deficit (% of GDP) -5.3 -8.5 - - -3.1
Financing 7,972.1 12,643.5 2,909.9 8,991.1 4,759.7
Foreign Financing 8,954.0 3,247.5 -337.2 1,437.7 3,690.5
Domestic Financing -981.9 9,396.0 3,247.1 7,553.4 1,069.2
Memo items:
Non-Energy Fiscal Deficit2
-14,616.5 -20,434.5 -9,233.2 -12,263.6 -14,886.9
Non-energy Fiscal Deficit (% of GDP) -9.7 -13.7 - - -9.5
HSF Transfers (+) / Withdrawals (-) -2,498.4 -1,712.2 0.0 -1,712.2 0.0
Source: Ministry of Finance.
1 Adjusted for transfers to the Infrastructure Development Fund, Government Assisted Tertiary Education Fund and CARICOM Petroleum Fund.
2 Computed as the sum of non-energy revenue and capital revenue less total expenditure.
b Budgeted.
re Revised Estimates.

CENTRAL BANK OF TRINIDAD AND TOBAGO MONETARY POLICY REPORT MAY 2018
23
e) EXTERNAL ACCOUNTS
Balance of Payments
(Data in this section are in US dollars unless otherwise stated)
Trinidad and Tobago’s external accounts recorded a smaller deficit of $136.9 million over the
period October to December 2017 compared to a deficit of $543.0 million in the corresponding
period one year earlier (Table IIIc). This brought gross official reserves to $8,369.8 million,
equivalent to 9.7 months of prospective imports of goods and services. The current account
recorded a surplus over the review period, in contrast to a deficit in 2016. This reflected a surplus
of $689.8 million on the Goods account, which came about owing to improved energy exports.
The financial account recorded a net outflow due to movement in direct and portfolio
investment.
Total exports rose by 11.0 per cent over the review period as the increase in energy exports
outweighed the decline in non-energy exports. Energy exports were estimated to have increased
to $2,447.4 million or $242.5 million more when compared with the final quarter in 2016.
Despite declines in crude oil and refined products, higher exports of LNG and petrochemicals
boosted energy exports earnings. The rise in LNG export volumes was related to the increase in
natural gas production as the Juniper platform came on stream. Preliminary estimates indicate
that non-energy exports fell marginally by $7.2 million to $414.0 million. Meanwhile, total
estimated imports decreased by 1.5 per cent in the final quarter of 2017 relative to the same
period one year earlier. Capital imports continued to wane, perhaps reflecting an observed
decline in new developmental activity in the energy sector and a slowdown in the pace of
Government’s infrastructure projects.
In the fourth quarter of 2017, the financial account registered a net outflow of $1,029.1 million, a
reversal of the net inflow of $154.6 million recorded in the similar period of 2016. Direct
investment liabilities decreased by $575.0 million due to repayments on inter-company loans,
and to a lesser extent a decline in reinvestment of earnings in Trinidad and Tobago. Similar to
previous years, the energy sector largely accounted for these transactions. Meanwhile, direct
investment abroad increased on account of inter-company lending and reinvested earnings.
Portfolio investment registered a net outflow of $241.2 million over the reference period, from
the net inflow of $387.8 million in 2016. Over the last three months of 2017, the growth in
portfolio assets occurred in the context of equity investments by the Heritage and Stabilisation
Fund (HSF) abroad while residents augmented their holdings of debt securities abroad – mainly in
the form of money-market instruments. In contrast, portfolio liabilities registered a decline as
residents made repayments on debt securities owed to non-residents. It is noteworthy that the
significant increase in portfolio investment liabilities in 2016 was primarily due to the issuance of

CENTRAL BANK OF TRINIDAD AND TOBAGO MONETARY POLICY REPORT MAY 2018
24
two public sector bonds on the international capital market. Movements in the other investment
account contributed to a net outflow of $166.9 million in the final quarter of 2017, lower than
the net outflow of $189.8 million in the corresponding period of 2016. The falloff in other
investment assets was due to a decline in trade credits, primarily reflecting transactions by the
energy sector and other accounts owed to residents. Moreover, other investment liabilities
registered a decrease due to a reduction in trade credits and other accounts owed to foreigners
by domestic entities.
Trinidad and Tobago’s gross official reserves amounted to $7,987.9 million at the end of the first
quarter of 2018, a falloff from the level at the end of 2017 of $8,369.8 million. Preliminary data
suggests an increase in total exports in the first quarter of 2018 compared to one year-earlier due
to improved energy sector conditions.

CENTRAL BANK OF TRINIDAD AND TOBAGO MONETARY POLICY REPORT MAY 2018
25
TABLE IIIc
TRINIDAD AND TOBAGO: SUMMARY BALANCE OF PAYMENTS
(US$Million)
2016r 2017
p
2016r 2017
p
I II III IV I II III IV
Current Account -653.2 2,325.1 -179.4 -26.3 -6.0 -441.4 804.8 269.4 740.9 510.0
Goods and Services -407.7 2,017.2 -148.9 -81.5 -130.8 -46.6 758.6 196.4 715.9 346.3
Goods, net* 1,368.1 3,821.2 317.5 349.1 280.6 420.9 1,126.9 732.6 1,271.8 689.8
Exports 8,225.9 9,926.6 1,881.9 1,971.8 2,167.3 2,204.9 2,532.1 2,127.0 2,820.2 2,447.4
Energy 6,430.8 7,633.3 1,560.4 1,578.6 1,508.1 1,783.7 1,959.5 1,772.6 1,867.8 2,033.4
Non-energy 1,795.1 2,293.3 321.4 393.2 659.2 421.2 572.6 354.4 952.3 414.0
Imports** 6,857.8 6,105.4 1,564.4 1,622.7 1,886.6 1,784.1 1,405.2 1,394.3 1,548.3 1,757.6
Fuels*** 1,514.3 1,602.0 302.3 371.2 395.5 445.4 373.1 344.4 370.2 514.3
Other 5,343.4 4,503.5 1,262.2 1,251.4 1,491.2 1,338.7 1,032.1 1,049.9 1,178.1 1,243.3
Services, net -1,775.8 -1,804.0 -466.3 -430.6 -411.4 -467.5 -368.3 -536.3 -556.0 -343.5
Primary income, net -300.7 261.9 -43.5 39.0 103.4 -399.6 34.1 58.7 16.0 153.1
Secondary income, net 55.3 46.0 12.9 16.2 21.4 4.8 12.1 14.3 9.0 10.6
Capital Account 0.2 1.0 0.0 0.0 0.0 0.2 0.0 0.4 0.6 0.0
Financial Account -1,460.4 863.9 -15.7 -296.4 -993.6 -154.6 93.8 141.6 -400.6 1,029.1
Direct investment 106.5 479.6 -306.8 339.5 30.4 43.4 -91.8 -24.0 -22.0 617.5
Net acquisition of financial assets 82.6 105.9 1.8 38.1 17.0 25.7 16.5 20.3 26.6 42.5
Net incurrence of liabilities -24.0 -373.8 308.5 -301.4 -13.4 -17.7 108.3 44.3 48.6 -575.0
Portfolio investment -1,497.0 397.5 171.3 -563.4 -717.2 -387.8 -36.8 97.8 95.3 241.2
Net acquisition of financial assets -101.0 234.9 36.7 -536.6 298.6 100.2 -45.3 64.0 92.2 124.0
Net incurrence of liabilities 1,396.0 -162.6 -134.6 26.8 1,015.8 488.0 -8.5 -33.8 -3.1 -117.2
Financial derivatives 0.0 4.7 -0.4 -0.7 1.2 0.0 4.1 -1.5 -1.3 3.4
Net acquisition of financial assets 0.0 4.4 -0.4 0.0 0.0 0.3 4.6 -2.0 -0.9 2.6
Net incurrence of liabilities 0.0 -0.3 0.1 0.7 -1.2 0.4 0.6 -0.4 0.4 -0.8
Other investment -69.8 -17.9 120.2 -71.8 -308.0 189.8 218.4 69.4 -472.6 166.9
Net acquisition of financial assets -162.0 366.7 -62.1 652.1 -661.9 -90.1 323.2 -13.7 123.6 -66.5
Net incurrence of liabilities -92.2 384.6 -182.3 723.9 -353.9 -279.9 104.9 -83.1 596.2 -233.4
Net errors and omissions -1,274.6 -2,558.3 -198.3 -275.4 -544.6 -256.3 -1,071.4 -497.7 -1,371.4 382.3
Overall Balance -467.2 -1,096.0 -362.0 -5.3 443.1 -543.0 -360.4 -369.5 -229.3 -136.9
Per Cent of GDP
Current Account -2.9 10.5 -3.1 -0.5 -0.1 -8.0 14.5 4.9 13.4 9.2
Goods, net 6.1 17.2 5.5 6.2 5.1 7.6 20.3 13.2 23.0 12.5
Exports 36.7 44.8 32.9 35.1 39.1 40.0 45.7 38.4 50.9 44.2
Imports 30.6 27.5 27.3 28.9 34.0 32.3 25.3 25.2 27.9 31.7
Services, net -7.9 -8.1 -8.1 -7.7 -7.4 -8.5 -6.6 -9.7 -10.0 -6.2
Primary income, net -1.3 1.2 -0.8 0.7 1.9 -7.2 0.6 1.1 0.3 2.8
Overall balance -2.1 -4.9 -6.3 -0.1 8.0 -9.8 -6.5 -6.7 -4.1 -2.5
MEMORANDUM ITEMS
Gross Official Reserves**** 9,465.8 8,369.8 9,571.0 9,565.7 10,008.8 9,465.8 9,105.4 8,735.9 8,506.6 8,369.8
Import Cover (months)**** 10.5 9.7 11.3 11.3 11.2 10.5 10.5 10.1 9.8 9.7
Source: Central Bank of Trinidad and Tobago.
Note: This table is an analytical presentation of the Balance of Payments and is presented in the accordance with the IMF’s Balance of Payments and International
Investment Position Manual, Sixth Edition (BPM6). Refer to Box 3 of the Economic Bulletin, March 2017 for a Technical Note on the Transition to BPM6.
* Energy goods data for 2016-2017 comprise estimates by the Central Bank of Trinidad and Tobago.
** Imports are now reported on a FOB (Free on Board) basis. Prior to this report, imports published in the balance of payments were reported on a CIF (Cost,
Insurance and Freight) basis.
*** Includes petroleum, petroleum products and related materials. This differs from previously published energy imports which included imports of chemicals and
related products. Energy exports include exports of petroleum, petroleum products and related materials and the exports of petrochemicals.
**** End of Period.
r Revised
p Provisional.

CENTRAL BANK OF TRINIDAD AND TOBAGO MONETARY POLICY REPORT MAY 2018
26
International Investment Position
(Data in this section are in US dollars unless otherwise stated)
At the end of December 2017, the net international investment position was estimated at
$4,759.8 million. This reflects an improvement of $1,103.0 million from the position registered
at the end of the third quarter of 2017. The movement resulted from an increase of $34.0
million in the stock of assets coupled with a significant decrease of $1,069.0 million in the stock
of liabilities (Table IIId).
Portfolio investment assets rose primarily due to changes in foreign asset holdings by the HSF.
This was partially offset by declines in reserve and other investment assets. There was a decrease
in direct investment liabilities—both equity and debt instruments, while portfolio investment
liabilities also fell as residents made repayments on debt securities owed to non-residents.
Decreases in the stock of other investment liabilities were on account of lower trade credits and
other accounts payable owed to non-residents by domestic entities.
TABLE IIId
TRINIDAD AND TOBAGO: INTERNATIONAL INVESTMENT POSITION (AT END OF PERIOD)
(US$ Million)
2016r
2017p
2016r
2017p
I II III IV I II III IV
Net International
Investment Position
4,469.3 4,759.8 5,622.5 5,658.7 5,335.1 4,469.3 4,133.7 4,309.2 3,656.8 4,759.8
Assets 24,002.5 23,908.7 24,542.2 24,627.4 24,738.6 24,002.5 24,063.9 23,834.6 23,874.7 23,908.7
Direct investment 752.3 787.9 774.8 784.8 763.2 752.3 753.9 758.8 772.8 787.9
Portfolio investment 9,336.0 9,960.1 9,533.0 9,011.4 9,410.7 9,336.0 9,426.7 9,567.5 9,734.8 9,960.1
Financial derivatives 0.2 4.4 0.0 0.0 0.0 0.2 4.5 2.0 1.8 4.4
Other investment 4,448.2 4,786.5 4,663.3 5,265.4 4,556.0 4,448.2 4,773.3 4,770.3 4,858.7 4,786.5
Reserve assets 9,465.8 8,369.8 9,571.0 9,565.7 10,008.8 9,465.8 9,105.4 8,735.9 8,506.6 8,369.8
Liabilities 19,533.2 19,148.9 18,919.7 18,968.7 19,403.6 19,533.2 19,930.2 19,525.4 20,217.9 19,148.9
Direct investment 9,579.4 9,021.2 10,425.9 9,804.1 9,637.7 9,579.4 9,864.7 9,666.0 9,738.5 9,021.2
Portfolio investment 4,451.1 4,278.1 2,971.7 2,973.4 3,972.3 4,451.1 4,437.8 4,398.2 4,408.1 4,278.1
Financial derivatives 1.9 1.6 1.9 1.9 1.9 1.9 1.6 1.6 1.6 1.6
Other investment 5,500.8 5,848.0 5,520.1 6,189.3 5,791.7 5,500.8 5,626.0 5,459.6 6,069.7 5,848.0
Source: Central Bank of Trinidad and Tobago.
r Revised.
p Provisional.

CENTRAL BANK OF TRINIDAD AND TOBAGO MONETARY POLICY REPORT MAY 2018
27
PART IV – MONETARY AND FINANCIAL SECTOR DEVELOPMENTS
MONETARY DEVELOPMENTS
Since the last Monetary Policy Report (in November 2017) the Monetary Policy Committee (MPC)
met in March 2018, and decided to maintain its neutral stance and the “Repo” rate, at 4.75 per
cent. As on previous occasions, the MPC balanced several considerations in arriving at this
decision. Inflation was observed to be on a downward path and had fallen to a monthly rate of
0.8 per cent in March 2018. While the energy sector had improved into the first quarter of 2018,
the non-energy sector remained sluggish. The domestic macroeconomic situation therefore
provided a case for loosening monetary policy to support an incipient recovery without
immediate inflation concerns. At the same time, short-term interest rates continued to rise in the
US while they remained more or less stable locally, pushing the TT/US 90-day Treasury bill
differential further negative. Consequently, the interest rate configuration – and indeed prognosis
given international market consensus of further Fed rate hikes in 2018 – argued for tightening
domestic monetary policy to forestall interest-sensitive capital outflows.
Meanwhile, the Bank continued to manage open market operations (OMOs) flexibly to meet
changing market conditions. In the first five months of 2018, net domestic fiscal injections16
(NDFIs),
the main source of excess liquidity, recovered from the latter half of 2017 as a result of higher energy
revenues accruing to the Government. NDFIs over the first five months of 2018 amounted to
$6,636.1 million, which was more than double the total fiscal injections over the third and fourth
quarters of 2017. Given the turnaround, the Bank withdrew liquidity from the financial system
through net sales of open market securities. While there were OMO maturities of $1,868.9 million in
January, over February to May 2018, $2,848.9 million was removed from the system via OMOs as
NDFI’s increased. This was in contrast to the third and fourth quarters of 2017 when total net
maturities of $3,932.9 million were allowed back into the system. Sales of foreign exchange by the
Central Bank to authorised dealers indirectly withdrew $4,310.2 million in the first five months of
2018 (Table IVa). Overall, during this period liquidity averaged $2,602.7 million daily, slightly lower
than the $2,767.0 million over the third and fourth quarters of 2017 (Chart IVa).
16
Net domestic fiscal injections reflect the balance of fiscal expenditure conducted domestically versus revenue collected domestically
by the Central Government, as well as bond redemptions.

CENTRAL BANK OF TRINIDAD AND TOBAGO MONETARY POLICY REPORT MAY 2018
28
CHART IVa
COMMERCIAL BANKS – EXCESS RESERVES
Source: Central Bank of Trinidad and Tobago.
TABLE IVa
FISCAL INJECTIONS AND LIQUIDITY ABSORPTION
(TT$ Million)
Jan-May 2017 Jan-May 2018
Fiscal Injections 2,924.3 6,636.1
Liquidity Absorption Measures
Open Market Operations (OMOs) 2,537.3 -1,633.0
Central Gov't Treasury Bond Issues 0.0 0.0
Commercial Banks' Fixed Deposits 1,500.0 0.0
Memo Item:
CBTT Sale of Foreign Exchange to Authorised Dealers1
5,415.7 4,310.2
Source: Central Bank of Trinidad and Tobago.
Note: A negative sign means that there was a net issue of OMOs and commercial banks’ fixed deposits resulting in a withdrawal of
liquidity and a positive sign means a net redemption of OMOs and maturity of commercial banks’ fixed deposits which
injects liquidity.
1 Includes transactions under the Foreign Exchange Liquidity Guarantee facility.
Domestic short-term rates were fairly steady over December 2017 to May 2018. By May, the TT
3-month Treasury bill rate had declined by 1 basis point relative to December 2017 to reach 1.20
per cent. However, the rate on the corresponding US 3-month Treasury bill increased from 1.39
per cent to 1.94 per cent over the same period. As a result, the 3-month TT-US differential
reached -74 basis points in May from -18 basis points below parity at the end of 2017, driven
almost entirely by the upward movement of the US 3-month Treasury rate.

CENTRAL BANK OF TRINIDAD AND TOBAGO MONETARY POLICY REPORT MAY 2018
29
Longer-term yield differentials over November 2017 to April 2018 were influenced mainly by a
recovering US economy and predictions about the future course of US fiscal and trade policy.
While the rate of the US 10-year Treasury bond stood at 2.40 per cent at the end of December
2017, it climbed to 2.87 per cent by the end of February 2018. This increase was largely due to
continuing improvement in the outlook for the US economy. However, concerns about an
escalation of trade friction between the United States and China led to a decline in the US 10-
Year Treasury rate to 2.74 per cent by the end of March, before recovering to 2.84 per cent in
April. The rate on the corresponding TT 10-year Treasury bond increased by 3 basis point to
reach 4.37 per cent over December 2017 to May 2018. The combination of these movements
resulted in a fall in the long term differential from +194 basis points in December 2017 to +153
basis points in May 2018 (Chart IVb).
Liquidity levels over December 2017 to May 2018 led to a rise in interbank activity. Daily
average interbank borrowing reached $138.9 million, up from $117.7 million in the preceding six
month period. The Central Bank’s repurchase facility was accessed once in the reference period,
on December 19, 2017, for $56.2 million.
Recent interest rate movements have resulted in declining bank spreads, more because of falling
loan rates than because of rising deposit rates. Between September 2017 and March 2018
(Chart IVc), the commercial banks’ weighted average lending rate decreased from 8.24 per cent
to 8.15 per cent, leading to a decrease in spreads from 7.63 per cent to 7.51 per cent.
CHART IVb
3-MONTH AND 10-YEAR TT-US DIFFERENTIALS
Source: Central Bank of Trinidad and Tobago.

CENTRAL BANK OF TRINIDAD AND TOBAGO MONETARY POLICY REPORT MAY 2018
30
CHART IVc
REPO RATE AND COMMERCIAL BANKS’ MEDIAN PRIME LENDING RATE
Source: Central Bank of Trinidad and Tobago.
There are signs of a recent expansion in credit to the private sector (Chart IVd). Since the last
MPR, private sector credit by the consolidated financial system rebounded, expanding by 6.1 per
cent in March 2018 compared to 3.6 per cent in September 2017. Looking at the main
institutions in the financial system, commercial bank credit grew by 6.5 per cent in March 2018
compared to 4.1 per cent in September 2017. Importantly, growth in non-bank lending also
supported overall credit growth in early 2018 (1.6 per cent compared to -1.9 per cent). Non-
bank lending had declined consistently between September 2017 and January 2018.
Looking at lending by purpose, overall consolidated system credit expanded on account of a pick-
up in business and consumer lending, along with continued growth in real estate credit. Business
credit rose by 4.5 per cent in March 2018, compared to 0.4 per cent in September 2017. On a
sectoral basis, lending to businesses for the purpose of construction declined 7.7 per cent in
March 2018, echoing other indicators that pointed to restrained construction activity.
Manufacturing loans contracted by 10.3 per cent, while the finance insurance and real estate
sector grew by 15.0 per cent.
Lending to consumers accelerated, notably for debt consolidation and refinancing, to 6.5 per cent
(12-month increase) in March 2018 compared to 4.5 per cent in September 2017. Credit card
lending moderated in the first quarter of 2018, growing by 8.5 per cent (year-on-year) partly due
to restrictions implemented on credit card usage for foreign currency transactions by commercial
banks.
Real estate lending – which measures both residential and commercial mortgages – continued its
growth into 2018, supported in part by falling interest rates for loans in the sector. On a year-on-
year basis real estate mortgage lending grew 7.7 per cent in March 2018. Average interest rates
on new mortgages narrowed by 10 basis points between December 2017 and March falling to
5.57 per cent. Residential mortgage rates lost 9 basis points in 2018 at 4.90 per cent, while

CENTRAL BANK OF TRINIDAD AND TOBAGO MONETARY POLICY REPORT MAY 2018
31
commercial mortgage rates rose by 43 basis points to 7.02 per cent. A disaggregation of
residential real estate lending for March showed strong growth in loans for the purchase of
existing houses (10.4 per cent), and to a lesser extent new houses (5.2 per cent), land (1.0 per
cent) and renovation (1.4 per cent).
Following sixteen months of contractions since June 2016, foreign currency loans rebounded in
October 2017 and continued to grow into 2018. On a year-on-year basis foreign currency loans
(almost 10.0 per cent of private sector credit) picked up in March 2018 growing by 9.8 per cent
compared to a decline of 5.3 per cent in September 2017. Foreign currency loans to businesses,
which comprise over 80 per cent of total foreign currency loans, continued its upward trajectory
in March 2018 (6.6 per cent), compared with a decline in September 2017 (7.0 per cent).
Despite a small uptick in February 2018, the main monetary aggregates remained stagnant. On a
year-on-year basis, M1-A declined by 1.7 per cent in March 2018 compared to a decline of 1.7
per cent in September 2017. M-2, however, declined for the thirteenth consecutive month (0.8
per cent in March 2018 compared to a contraction of 1.6 per cent in September 2017). Over the
past few years a new form of ‘money’, namely virtual currencies, which is not captured by the
monetary aggregate measures, has emerged. As a percentage of the global money supply, the
relative value of virtual currencies is not large; however, increased use of these alternative forms
of money for transaction purposes could potentially influence the money supply. (Box 2:
Financial Technology (FinTech) and Implications for Monetary Policy).
Foreign currency deposits declined by 4.3 per cent in March 2018 compared to a contraction of
0.3 per cent (year-on-year) in September 2017. Businesses’ foreign currency deposits, which
accounted for a larger portion of foreign currency deposits, declined by 3.2 per cent, while
consumers’ foreign currency deposits fell marginally (4.5 per cent).
CHART IVd
PRIVATE SECTOR CREDIT TO THE CONSOLIDATED FINANCIAL SYSTEM
(Year-on-Year Per Cent Change)
Source: Central Bank of Trinidad and Tobago.

CENTRAL BANK OF TRINIDAD AND TOBAGO MONETARY POLICY REPORT MAY 2018
32
FINANCIAL SECTOR DEVELOPMENTS
Developments in the Local Foreign Exchange Market
In the first five months of 2018, supplies of foreign exchange from public sources improved
notably, but the general tightness in the market remained. Purchases of foreign exchange by
authorised dealers from the public amounted to US$1,588.8 million, a 13.6 per cent increase
from the corresponding period a year prior. Over the first five months of 2018, energy sector
inflows increased by 22.1 per cent and were responsible for 71.6 per cent of the total purchases
from the public. The increase was indicative of the improvement in the energy sector.
Year-on-year sales of foreign currency increased marginally in the first five months of 2018. Sales
of foreign currency by authorised dealers to the public amounted to US$2,249.5 million, 4.2 per
cent higher relative to the same period a year earlier (Table IVb). The excess of sales over
purchases over the first five months of 2018 amounted to US$660.6million, representing a 13.1
per cent decrease in net sales over the same period a year prior. In the context of higher public
supplies to the market, the Central Bank sold US$645.0 million to authorised dealers, which was
20.4 per cent less than a year prior.
In May 2018, the monthly weighted average selling rate stood at US$1 = TT$6.7785, a slight
appreciation from US$1 = TT$6.7817 in December 2017.
TABLE IVb
AUTHORISED DEALERS: FOREIGN EXCHANGE MARKET ACTIVITY
(US$ Millions)
DATE
PURCHASES FROM
PUBLIC
SALES TO PUBLIC NET SALES
PURCHASES FROM
CBTT1
2013 5,802.2 7,076.4 1,274.2 1,315.0
2014 5,525.2 6,956.0 1,430.8 1,715.0
2015 4,941.3 7,382.5 2,441.2 2,640.9
2016 4,289.0 5,776.8 1,487.8 1,811.6
2017 3,606.9 5,189.5 1,582.6 1,816.0
Jan 2017 to May 2017 1,398.9 2,159.6 760.7 810.0
Jan 2018 to May 2018 1,588.8 2,249.5 660.6 645.0
Y-o-Y Per cent Change 13.6 4.2 -13.1 -20.4
Source: Central Bank of Trinidad and Tobago.
1 Purchases from the Central Bank of Trinidad & Tobago include transactions under the Foreign Exchange Liquidity Guarantee
facility.

CENTRAL BANK OF TRINIDAD AND TOBAGO MONETARY POLICY REPORT MAY 2018
33
BOX 2: FINANCIAL TECHNOLOGY (FINTECH) AND IMPLICATIONS FOR MONETARY POLICY
Rapid advancement in technology has created new opportunities in financial sectors around the world and can alter the way in
which Central Banks’ conduct monetary policy. In particular, within the sector products and services are being created or
enhanced through the application of technological innovations such as artificial intelligence, big data, biometry and
cryptography. The use of technology by the financial sector in this manner is broadly referred to as ‘FinTech’ and has resulted in
a variety of new applications including peer-to-peer lending platforms, robo-advisers and cryptocurrencies, to name a few.
Many of these advances seek to improve the provision and accessibility of financial services and while in many cases new
business models have emerged, financial services continue to be ultimately settled in fiat money. However, the advent of virtual
currencies, a new form of money created within a system that is unregulated by any monetary authority1 has been a cause for
concern for central banks and monetary authorities since virtual currencies could challenge the effectiveness of monetary policy.
A major challenge for central banks is that new virtual currencies, such as crypto-currencies, can alter the financial landscape
since they are unregulated by the monetary authority. According to the European Parliament (2017)2 “financial innovations may
reduce the demand for banknotes and bank deposits” since financial transactions can be conducted outside of the traditional
commercial banking system. This can result in difficulties for central banks when measuring and monitoring the various
monetary aggregates as unregulated, alternative forms of currency can supplement the official money supply. Crypto-currencies
can therefore potentially hinder the effectiveness of a central bank’s monetary policy. In light of this, Dabrowski (2017)3 suggests
that financial innovation will require an adjustment in the technical aspects of central bank operations, specifically in modifying
open-market operations and defining broader monetary aggregates.
Another possible challenge of crypto-currencies derives from their potential to play a role in the payment system, enabling
electronic payments without the need for third party banks or clearinghouses (Heller 2017)4. Although crypto-currencies may
provide a more efficient method of processing payments, they can also complicate monetary policy decisions by disrupting
monetary policy transmission, and can undermine the balance sheet of central banks through their negative impact on central
bank seigniorage. However, the use of crypto currencies is still limited in comparison to traditional banking and, as such,
currently “leaves monetary transmission largely unaffected” (Bernoth et al, 2017)5.
Research has shown that a central bank-issued digital currency (CBDC) can be an alternative form of money which may mitigate
some of the challenges arising from independently issued digital currencies. One benefit of a CBDC is the stability associated
with a currency issued and controlled by the regulatory authorities. A CBDC can eliminate the volatile fluctuations seen in
privately issued crypto-currencies such as Bitcoin. According to the IMF a CBDC would allow faster settlements of cross border
transactions (He et al 2017)6. According to Bordo and Levin (2017)
7, a CBDC is a costless medium of exchange and store of
value. Additionally, a CBDC would give the bank tighter control on monetary policy and maintain the transmission mechanism
since the central bank will have a greater ability to alter interest rates where the digital currency is interest bearing (European
Parliament 2017).
The Central Bank of Trinidad and Tobago, as the monetary authority for the country, is mindful of FinTech and the opportunities
and challenges it presents. The Bank continues to work on an appropriate strategy for dealing with FinTech. Such a strategy will
seek a suitable balance between allowing the Bank to fulfil its monetary stability mandate and accommodating the benefits and
efficiencies that can accrue to consumers, businesses and other economic agents.
1 The Financial Action Task Force defined virtual currency as “a digital representation of value that can be digitally traded and functions as (1) a medium of
exchange; and/or (2) a unit of account; and/or (3) a store of value, but does not have legal tender status.
2 European Parliament. (2017). “Financial Innovation and Monetary Policy: Challenges and Prospects”. Monetary Dialogue – May 2017 - Policy Department A:
Economy and Scientific Policy.
3 Dabrowski, Marek. (2017). “Potential Impact of Financial Innovation on Monetary Policy”. European Parliament - Monetary Dialogue – May 2017 - Policy
Department A: Economy and Scientific Policy.
4 Heller, Daniel. (2017). “The Implications of Digital Currencies for Monetary Policy”. European Parliament - Monetary Dialogue – May 2017 - Policy Department
A: Economy and Scientific Policy.
5 Bernoth, Kerstin, and S. Gebauer. (2017) “Monetary Policy Implications of Financial Innovation”. European Parliament - Monetary Dialogue – May 2017 - Policy
Department A: Economy and Scientific Policy.
6 He, D, R Leckow, V Haksar, T Mancini, N Jenkinson, M Kashima, T Khiaonarong, C Rochon, and H Tourpe (2017), “Fintech and Financial Services:
Initial Considerations”, International Monetary Fund Staff Discussion Note 17/05.
7 Michael D. Bordo & Andrew T. Levin, 2017. "Central Bank Digital Currency And The Future Of Monetary Policy," Economics Working Papers 17104, Hoover
Institution, Stanford University

CENTRAL BANK OF TRINIDAD AND TOBAGO MONETARY POLICY REPORT MAY 2018
34
STOCK MARKET DEVELOPMENTS
Following a notable recovery in 2017, the domestic stock market declined during the first four
months of 2018 (Chart IVe). The major Composite Price Index (CPI) fell by 2.8 per cent (year-to
date) over the period. Similarly, total stock market capitalization fell by 3.4 per cent to $119.7
billion. The weakening of the CPI was driven by the 1.8 per cent decline in the All T&T Index
(ATI) and 5.2 per cent drop in the Cross Listed Index (CLI). Most of the sub-indices on the local
exchange displayed negative movements over the four months ending April 2018 (Chart IVf).
The Energy sub-index was the only sub-index to register positive movements, advancing by 4.9
per cent, supported by higher natural gas output. Over this period, 22.8 million shares were
exchanged at a total value of $331.4 million.
CHART IVe
COMPOSITE PRICE INDEX AND STOCK MARKET CAPITALIZATION
Source: Trinidad and Tobago Stock Exchange.
CHART IVf
TRINIDAD AND TOBAGO STOCK MARKET SUB-INDICES
(January to April 2018)
Source: Trinidad and Tobago Stock Exchange.

CENTRAL BANK OF TRINIDAD AND TOBAGO MONETARY POLICY REPORT MAY 2018
35
Primary Debt Market Activity
Over the six-month period from October 2017 to March 2018 there were seven primary issues at
a value of approximately TT$4,787.8 million (Table IVc). The Central Government continued to
be the major borrower through four private placements amounting to TT$3,875.6 million. It
should be noted that in January 2018 the Central Government rolled over a short-term (6-month)
fixed rate TT$1.2 billion bond for another 6 months at 1.90 per cent. Subsequently, in March
2018, the Central Government financed another TT$1.2 billion via two tranches for the purpose
of pre-payment towards the short-term bond.
TABLE IVc
PRIMARY DEBT SECURITY ACTIVITY
October 2017 – March 2018 p
PERIOD ISSUED BORROWER
FACE VALUE
(TT$ M)
PERIOD TO
MATURITY
COUPON RATE PER
ANNUM (PER CENT)
PLACEMEN
T TYPE
October 2017
Home Mortgage Bank (HMB)
- Tranche 1
- Tranche 2
66.75
133.25
5.0 years
5.0 years
Floating Rate 3.5%
Floating Rate 4.72%
Private
Central Government of Trinidad and
Tobago
1,000.0 13.0 years
Fixed Rate 4.50%
Reset every 5 years at
1-yr OMO + 178 bps
Private
November
2017
Central Government of Trinidad and
Tobago
1,000.0 14.0 years
Fixed Rate 4.65%
Amortizing
Private
December
2017
Trinidad and Tobago Mortgage
Finance Company Limited
(TTMF)
100.0 1.0 year Fixed Rate 4.07% Private
Central Government of Trinidad and
Tobago
675.62
(US$100.0M)
3.0 years Fixed Rate 3.10% Private
January 2018 First Citizens Bank
612.22
(US$90.4M)
5.0 years Fixed Rate 4.25% Private
March 2018
Central Government of Trinidad and
Tobago
Tranche 1
Tranche 2
800.0
400.0
7 years
15 years
Fixed rate 4.15%
Fixed rate 5.15%
Private
Source: Central Bank of Trinidad and Tobago and Ministry of Finance.
p Provisional.
While no private sector companies entered the market, two state enterprises made issuances
during the 6 month period. Trinidad and Tobago Mortgage Finance Company Limited (TTMF)
financed TT$100 million via a short-term issue, while First Citizens Bank borrowed US$90.4
million through a private placement. Trading activity on the secondary government bond market
declined over the first four months of 2018 with 13 trades occurring at a face value of roughly
TT$123.4 million.

CENTRAL BANK OF TRINIDAD AND TOBAGO MONETARY POLICY REPORT MAY 2018
36
Central Government Yield Curve
The Central Government Yield Curve has been relatively stable over the first four months of the
year. The short-term 3-month and 1-year rates both slipped by 1 basis point to 1.20 per cent and
2.71 per cent, respectively. This was likely due to larger fiscal injections over the period, boosting
liquidity and increasing the demand for treasury securities. On the longer end, the 10-year and
15-year rates increased by 3 basis points to 4.37 per cent and 4 basis points to 5.10 per cent,
respectively (Chart IVg).
CHART IVg
TRINIDAD AND TOBAGO CENTRAL GOVERNMENT YIELD CURVE
Source: Central Bank of Trinidad and Tobago.
The trends in the longer-end of the sovereign yield curve were also reflected in the movements
on the Central Government bond index. Due to marginally higher medium and long term rates,
the Price Index marginally slipped by 0.1 per cent, however, the Total Return Index improved by
2.0 per cent during the quarter.
CHART IVh
TRINIDAD AND TOBAGO CENTRAL GOVERNMENT BOND INDEX
Source: Central Bank of Trinidad and Tobago.

CENTRAL BANK OF TRINIDAD AND TOBAGO MONETARY POLICY REPORT MAY 2018
37
Mutual Fund Market
During 2017, growth in the local mutual funds industry improved marginally. Aggregate funds
under management17
grew by 0.6 per cent to TT$43.2 billion compared to an increase of 3.7 per
cent in the same period one year earlier. Largely as a result of net redemptions, Income funds
slipped by 0.2 per cent to $34.7 billion over the year compared to a 3.0 per cent gain in 2016,
Equity funds under management grew by 2.9 per cent to $5.9 billion during 2017 following a 5.4
per cent contraction in 2016. The growth in equity funds is likely due to the recovery in the
domestic equity market during 2017. Furthermore, funds classified as other, such as money
market and high yield funds, expanded by 6.3 per cent to $2.6 billion over the year. In terms of
currency profile, TT dollar funds grew by 0.6 per cent to $34.2 billion while foreign currency
funds gained 0.7 per cent to just under the TT equivalent of $9.0 billion in 2017. In comparison,
during 2016, TT dollar and foreign currency funds grew by 2.4 per cent and 8.8 per cent,
respectively.
Over the year, the industry witnessed net sales of $109.4 million, which comprised of total sales
of $14,351.9 million and total redemptions of $14,242.5 million. In comparison, in 2016 the
industry experienced net sales of $396.4 million. In terms of currency, TT dollar funds posted
$206.6 million in net sales. However, in light of the lower supply of foreign currency in the
domestic market, foreign currency funds witnessed $97.1 million in net redemptions in 2017, as
opposed to $95.4 million in net sales in the previous year.
17
Aggregate funds under management refer to mutual fund information collected by the Central Bank of Trinidad and Tobago,
including funds managed by the Trinidad and Tobago Unit Trust Corporation, Royal Bank Trinidad and Tobago, Republic Bank
Limited and First Citizens Bank Limited.