monetary policy committee statement for third quarter … · monetary policy committee statement...
TRANSCRIPT

1
MONETARY POLICY COMMITTEE STATEMENT FOR
THIRD QUARTER 2017
Governor’s Presentation to the Media
22nd November, 2017

INTRODUCTION
2
The presentation is structured as follows:
1. Decision of the Monetary Policy Committee
2. Global economic developments
3. Domestic economic developments
4. Macroeconomic outlook

MONETARY POLICY DECISION3
At the Meeting held on 20 – 21 November 2017, Monetary Policy Committee decided to:
1. Reduce the Policy Rate by 75 basis points to 10.25% from 11.0%
2. Lower the Statutory Reserve Ratio by 150 basis points to 8.0% from 9.5%.

MONETARY POLICY DECISION4
The Committee took into account the following factors in arriving at its decisions:
Continued decline in inflation over the last ten months;
Inflation projections, which indicate that inflation will remainwithin the medium-term target range of 6-8%, with a bias towardthe lower bound of the inflation target range;
High cost of credit, which have been sluggish downwards;
Weak growth in credit to the private sector;
Risks to financial stability as reflected in elevated Non-performingloans; and,
Sluggish economic growth.

GLOBAL ECONOMIC DEVELOPMENTS
5
Global economic growth continued to exhibit signs of recovery in the third quarter of 2017
Underlying growth was
increased economic activities in China
increased investor confidence in advanced countries
loose monetary conditions in advanced countries –resulting in increased employment levels and output.
rebound in commodity prices
Commodity prices generally increased in Q3, 2017 (Table 1).

GLOBAL ECONOMIC DEVELOPMENTS
6
Table 1: Selected Global Commodity Prices
Q2 2017 Q3 2017
Copper Price (US$/ton) 5,668.0 6,617.2
Oil Price (Dubai) (US$/barrel) 49.7 54.1
Wheat (US$/ton) 176.0 183.8
Maize Price (US$/ton) 157.7 151.1
Cotton (US$/kg) 1.9 1.8
Sugar (US$/kg) 0.3 0.3
Soya beans (US$/ton) 386.0 398.0

DOMESTIC ECONOMIC DEVELOPMENTSMonetary Policy Operations
7
Monetary policy operations continued to focus on containing the overnight interbank rate within the Policy Rate corridor and anchoring inflationary expectations.
Market liquidity increased following net Government spending and purchase of foreign exchange by BoZ for international reserves build-up (Table 2).
With the further easing of monetary policy in August 2017, the interbank rate declined to 10.4% at end-September from 12.2% at end-June 2017 (Figure 1).
To keep the interbank rate within the Policy Rate corridor, the Bank withdrew K20.0 billion through open market operations, up from K10.8 billion in the second quarter.

DOMESTIC ECONOMIC DEVELOPMENTSMonetary Policy Operations
8
Table 2: Key Liquidity Influences (K’ billion)
Q2 2017 Q3 2017
Opening balance 0.8 0.3
Net Govt. spending 1.3 1.5
BoZ FX influence 1.8 1.1
Change in CIC -0.7 0.1
Change in SR deposits -0.4 -0.9
Overnight Lending Facility 0.03 -0.7
Net Govt securities influence -2.4 -1.1
Open market operations -0.3 0.3
Miscellaneous 0.0 0.0
Closing balance 0.3 0.7

DOMESTIC ECONOMIC DEVELOPMENTSMonetary Policy Operations
9
Following the easing of monetary policy stance, the overnight interbankrate declined to 10.4% at end-Q3 from 12.2% at end-Q2 2017.
Figure 1: Interest Rates and Excess Reserves
0
500
1000
1500
2000
2500
3000
3500
0
5
10
15
20
25
30
20
-No
v-1
6
20
-Dec
-16
20
-Jan
-17
20
-Feb
-17
20
-Mar
-17
20
-Ap
r-1
7
20
-May
-17
20
-Ju
n-1
7
20
-Ju
l-1
7
20
-Au
g-1
7
20
-Sep
-17
20
-Oct
-17
20
-No
v-1
7
Pe
rce
nt
Excess Reserves(K'mn)(RHS) 5-day Moving-Ave (LHS) BOZ Policy Rate (LHS)Lower Bound (LHS) Upper-Bound (LHS) Interbank Rate (LHS)OLF Rate(LHS)

DOMESTIC ECONOMIC DEVELOPMENTSMonetary Policy Operations
10
Figure 2: Interbank Trading Activity (K’ billion)
Volume of interbank trading rose despite higher market liquidity
26.4
10.2
12.7
19.6
23.3
0
5
10
15
20
25
30
Jun
'16
Dec
'16
Mar
'17
Jun
'17
Sep
'17

DOMESTIC ECONOMIC DEVELOPMENTSGovernment securities market
11
Table 3: Government Securities Auctions
Demand for Government securities remained strong with subscription rates for Bonds and T-bills above 100 percent.
Amount on offer(K’Billion)
Amount Received(K’Billion)
Subscription rate (%)
T-bills
2017Q2 6.3* 7.7 122
2017Q3 5.4 5.7 106
Bonds
2017Q2 1.0 1.7 170
2017Q3 2.0 3.7 185
* More Tbill auctions were conducted in Q2, but auction size remained the same.

A total of K7.0 billion was raised from auctions against the maturity of K4.8 billion, resulting in a surplus of K2.2 billion.
12
Figure 3: Government Securities (K’billion)
DOMESTIC ECONOMIC DEVELOPMENTSGovernment securities market
3.83.3
7.07.3
7.1 7.0
3.4
2.3
3.4
2.8
3.9
4.8
0.41.0
3.6
4.5
3.2
2.2
0.0
1.0
2.0
3.0
4.0
5.0
6.0
7.0
8.0
Q'2 2016 Q'3 2016 Q'4 2016 Q'1 2017 Q'2 2017 Q'3 2017
Funds Raised Maturities Surplus/Deficit

DOMESTIC ECONOMIC DEVELOPMENTSGovernment securities market
13
The total outstanding stock of Government securities increased by 7.8% to K45.3 billion.
Figure 4: Total Outstanding Government Securities (K’billion)
12.1 10.9 10.9 10.513.2
17.4 19.8 21.1
12.6 12.7 13.5 14.8
19.8
20.922.2
24.2
0.0
5.0
10.0
15.0
20.0
25.0
30.0
35.0
40.0
45.0
50.0
Dec
-15
Mar
-16
Jun
-16
Sep
-16
Dec
-16
Mar
-17
Jun
-17
Sep
-17
T-bills Bonds

14
Figure 5: Non-resident Holdings of Government Securities (K’billion)
DOMESTIC ECONOMIC DEVELOPMENTSGovernment securities market
Non-resident investors’ holdings of Government securities increased to K7.6 billion in Q3 from K7.5 billion in Q2 2017.
1.2 1.40.8 0.7 0.5
1.42.1
1.9 1.81.7
1.82.8
6.6 6.97.5 7.6
0.0
1.0
2.0
3.0
4.0
5.0
6.0
7.0
8.0
9.0
Mar
-15
Jun
-15
Sep
-15
Dec
-15
Mar
-16
Jun
-16
Sep
-16
Dec
-16
Mar
-17
Jun
-17
Sep
-17
T-bills Bonds

DOMESTIC ECONOMIC DEVELOPMENTSGovernment securities market
15
Yield rates on Government securities continued to trend downwards in the third quarter due to high liquidity conditions and sustained demand (Figure 6).
The weighted average Treasury bills yield rate fell to 15.3% in September from 15.7% in June 2017.
The weighted average Government bond yield rate fell to 17.7% from 19.3%.

DOMESTIC ECONOMIC DEVELOPMENTSGovernment securities market
16
Figure 8: Government securities yield rates (%)
0
5
10
15
20
25
30
Jun
-12
Sep
-12
Dec
-12
Mar
-13
Jun
-13
Sep
-13
Dec
-13
Mar
-14
Jun
-14
Sep
-14
Dec
-14
Mar
-15
Jun
-15
Sep
-15
Dec
-15
Mar
-16
Jun
-16
Sep
-16
Dec
-16
Mar
-17
Jun
-17
Sep
-17
Composite T- Bill Composite Bond rate
Per
cen
t

DOMESTIC ECONOMIC DEVELOPMENTSBanks’ Nominal Interest Rates
17
The average lendingrate declined to 25.4%in September from26.6% in June 2017.
Range for lending rateswidened to 8 – 39.5%from 8 – 37% in Q2.
Savings rates onnegotiated depositsrose to a range of 7.5-31.0% from 6-29.5% inQ2.
Figure 7: Nominal Interest Rates (%)
0
5
10
15
20
25
30
Sep
-13
Dec
-13
Mar
-14
Jun
-14
Sep
-14
Dec
-14
Mar
-15
Jun
-15
Sep
-15
Dec
-15
Mar
-16
Jun
-16
Sep
-16
Dec
-16
Mar
-17
Jun
-17
Sep
-17
Lending RatePolicy RateInterbank RateSavings Rate for 180-day deposit

DOMESTIC ECONOMIC DEVELOPMENTSMoney supply and credit
18
Money supply grew further by4.8%, up from a growth rate of2.0% in Q2 2017.
Growth mainly driven byexpansion of domestic creditto Government and theprivate sector.
On a year-on-year basis,money supply grew by 13.8%in September, up from agrowth of 8.3% in June 2017.
The increase in year-on-yeargrowth in money supply ispositive as it is supportive toeconomic activity.
Figure 8: Money Supply
-10
-5
0
5
10
15
20
25
30
35
40
45
0
10
20
30
40
50
60
Sep
-13
Dec
-13
Mar
-14
Jun
-14
Sep
-14
Dec
-14
Mar
-15
Jun
-15
Sep
-15
Dec
-15
Mar
-16
Jun
-16
Dec
-16
Mar
-17
Jun
-17
Sep
-17
K B
illi
on
M3 (K billion) LHS
M3 Growth (Q/Q, %) RHS
M3 Growth (Y/Y, %) RHS
Per
cent(
%)

DOMESTIC ECONOMIC DEVELOPMENTSMoney supply and credit
19
Total credit grew by 6.1% in Q3 compared with 6.5% growth recorded in Q2 2017 (Table 4).
Growth in credit to Government slowed down to 8.9% from 11.3% in Q2 2017.
Credit to households grew by 7.6%, up from a growth of 1.3% in Q2 2017.
However, credit to private enterprises contracted by 2.2% from a growth of 1.6% in Q2.
Although there are signs of growth in credit to the private sector, sustained credit growth to private enterprises is critical for sustaining private sector driven economic activity.

20
Table 4: Credit growth
DOMESTIC ECONOMIC DEVELOPMENTSMoney supply and credit
Q3 2016 Q4 2016 Q1 2017 Q2 2017 Q3 2017
Total Credit (Incl.
Govt)4.9 1.1 6.5 6.5
6.1
Total -(Excl. Govt) -1.7 -5.4 -3.2 1.6 3.0
Public
Enterprises-3.1 -9.2 -10.0 28.9 89.3
Government 15.7 10.2 18.1 11.3 8.9
Private
Enterprises-1.3 -4.6 -4.8 1.4 -2.2
Households -0.9 -7.1 -0.3 1.3 7.6
Non Bank Financial
Institutions-0.1 17.6 -7.9 5.9
49.4

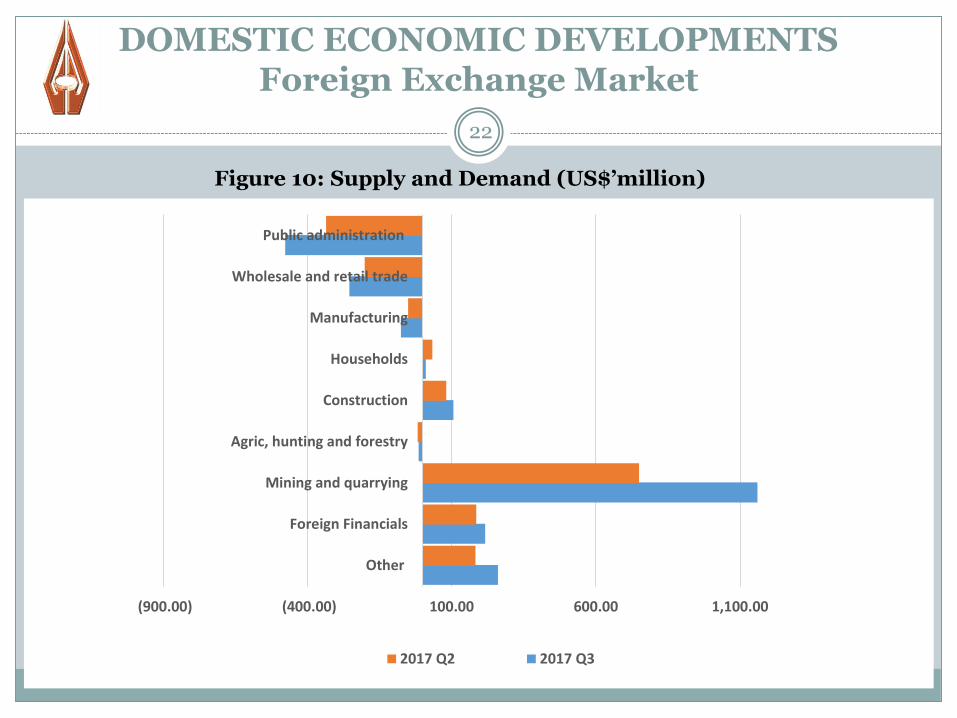
The Kwacha continued toappreciate in Q3 due toincreased supply of foreignexchange and positivesentiment from higher copperprices (Figure 9).
Against the US dollar, theKwacha appreciated by 3.5%compared an appreciation of5.0% in Q2 2017.
Mining companies’ andforeign financial institutionsand remained the majorsuppliers, while theGovernment continued to bethe lead buyer (Figure 10)
21
Figure 9: Exchange rate developments
DOMESTIC ECONOMIC DEVELOPMENTSForeign Exchange Market
0
0.1
0.2
0.3
0.4
0.5
0.6
0.7
0.8
0.9
1
4
6
8
10
12
14
16
18
20
Oct
-13
Jan
-14
Ap
r-1
4
Jul-
14
Oct
-14
Jan
-15
Ap
r-1
5
Jul-
15
Oct
-15
Jan
-16
Ap
r-1
6
Jul-
16
Oct
-16
Jan
-17
Ap
r-1
7
Jul-
17
Oct
-17
K/EUR K/GBP K/USD K/ZRA (RHS)
DOMESTIC ECONOMIC DEVELOPMENTSForeign Exchange Market
22
Figure 10: Supply and Demand (US$’million)
(900.00) (400.00) 100.00 600.00 1,100.00
Other
Foreign Financials
Mining and quarrying
Agric, hunting and forestry
Construction
Households
Manufacturing
Wholesale and retail trade
Public administration
2017 Q2 2017 Q3

DOMESTIC ECONOMIC DEVELOPMENTSReal Sector Activity
23
Available real sector data indicate an improvement in economicactivity during Q3 2017.
Higher output was recorded in both the mining and non-miningsectors.
copper production rose 7.8%, bringing total production in the year toSeptember 2017 to 576,128.1 metric tons (mt). This output of is 4.2%higher than the corresponding period last year (Figure 11).
In the non-mining sector, electricity generation continued to improve,supported by adequate water levels in the major reservoirs (Figure 12).
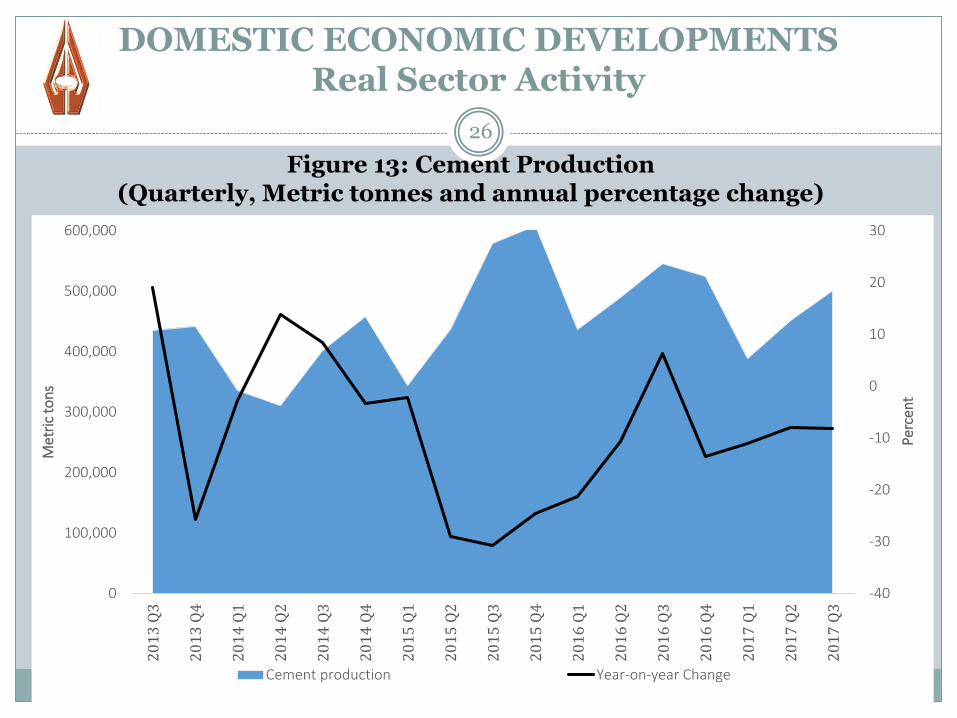
production of cement also increased by 11.1% to 193,068.1 mt onaccount of the continued rise in demand attributed to continuedconstruction activities (Figure 13).

DOMESTIC ECONOMIC DEVELOPMENTSReal Sector Activity
24
Figure 11: Mining Sector Output
20,000
70,000
120,000
170,000
220,000
270,000
20
13
Q3
20
13
Q4
20
14
Q1
20
14
Q2
20
14
Q3
20
14
Q4
20
15
Q1
20
15
Q2
20
15
Q3
20
15
Q4
20
16
Q1
20
16
Q2
20
16
Q3
20
16
Q4
20
17
Q1
20
17
Q2
20
17
Q3
-45
-35
-25
-15
-5
5
15
25
Met
ric
ton
s
Perc
ent
Copper production Y/Y growth

DOMESTIC ECONOMIC DEVELOPMENTSReal Sector Activity
25
Figure 12: Electricity Generation (Quarterly, Megawatt Hours and annual percentage change)
-40.0
-30.0
-20.0
-10.0
0.0
10.0
20.0
-
500,000
1,000,000
1,500,000
2,000,000
2,500,000
3,000,000
3,500,000
4,000,000
20
13
Q3
20
13
Q4
20
14
Q1
20
14
Q2
20
14
Q3
20
14
Q4
20
15
Q1
20
15
Q2
20
15
Q3
20
15
Q4
20
16
Q1
20
16
Q2
20
16
Q3
20
16
Q4
20
17
Q1
20
17
Q2
20
17
Q3
Pe
rce
nt
MW
h
Power Generation Y/Y Change
26
DOMESTIC ECONOMIC DEVELOPMENTSReal Sector Activity
-40
-30
-20
-10
0
10
20
30
0
100,000
200,000
300,000
400,000
500,000
600,000
20
13
Q3
20
13
Q4
20
14
Q1
20
14
Q2
20
14
Q3
20
14
Q4
20
15
Q1
20
15
Q2
20
15
Q3
20
15
Q4
20
16
Q1
20
16
Q2
20
16
Q3
20
16
Q4
20
17
Q1
20
17
Q2
20
17
Q3
Perc
ent
Met
ric
ton
s
Cement production Year-on-year Change
Figure 13: Cement Production (Quarterly, Metric tonnes and annual percentage change)

DOMESTIC ECONOMIC DEVELOPMENTSReal Sector Activity
27
Further, production of some manufactured products such as food and beverages increased.
Figure 14: Output of Food and Beverages (Quarterly, Hectolitres)
-
100,000
200,000
300,000
400,000
500,000
600,000
2016 Q1 2016 Q2 2016 Q3 2016 Q4 2017 Q1 2017 Q2 2017 Q3
Opaque beer Soft Drinks Clear beer Fresh Milk

The current account deficit narrowed to US$237.5 million in Q3 from US$338.7 million in Q2, largely explained by an increase in exports relative to imports.
28
Table 5: Balance of Payments (US$’million)
DOMESTIC ECONOMIC DEVELOPMENTSExternal Sector
Q2 2017 Q3 2017
Current Account Balance -338.7 -237.5
Balance on Goods 21.1 64.0
Total Exports 1,888.7 2,108.5
Copper 1,409.8 1,503.2
Cobalt 24.9 41.1
Gold 38.9 34.5
NTEs 399.2 513.9
Total Imports 1,867.6 2,044.4
Primary Income -277.0 -182.7
Secondary Income 66.6 66.2
Services Account -149.4 -185.0
Capital Account 14.7 14.8
Financial Account -507.4 -67.0
Net Errors/Omissions 5.4 1.1
Overall Balance -188.8 154.5
Change in Reserve Assets and Related
items
174.1 -167.6

DOMESTIC ECONOMIC DEVELOPMENTSFiscal performance
29
Preliminary data indicate that the fiscal deficit of 1.4% of GDP ona cash basis was recorded in Q3. This was 1.3 percentage pointslower than the target
The deficit continued to be financed through domestic financingdue to low inflows from external financing.
In Q3, net domestic financing through issuance of Governmentsecurities amounted to K3.0 billion, down from K3.3 billion inQ2 2017.

DOMESTIC ECONOMIC DEVELOPMENTSInflation
30
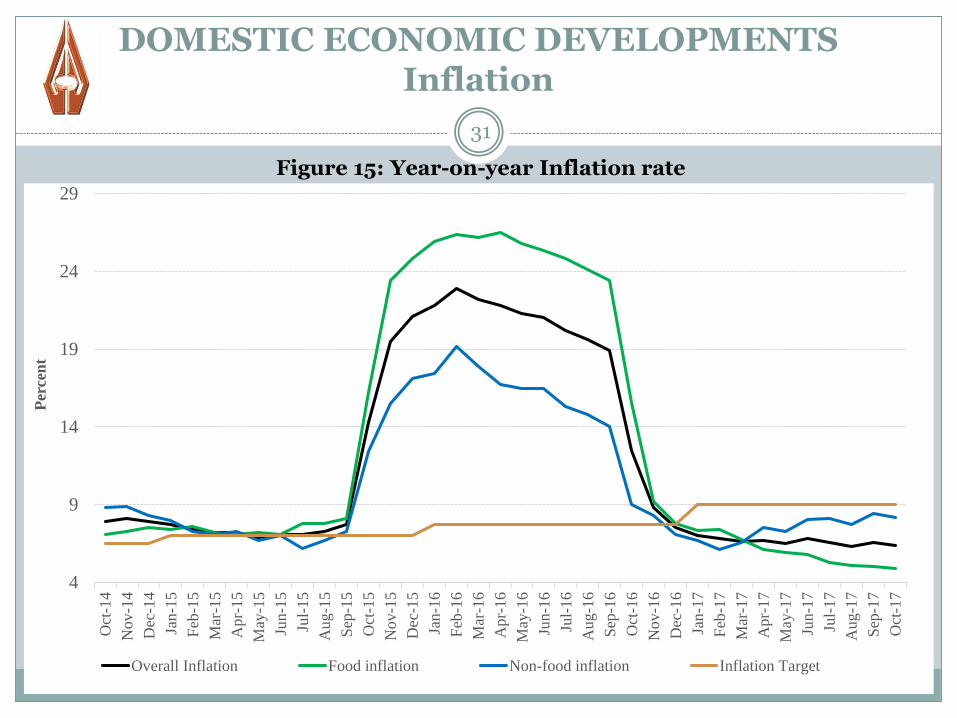
In Q3, inflation declined to an average of 6.5% from 6.7% in Q2 2017.
In terms of end-period developments, inflation declined to 6.6% in September 2017 from 6.8% in June 2017. In October, inflation declined further to 6.4% (Figure 15).
Annual food inflation declined to 5.0% in September 2017, a levellast seen in July 2011, from 5.8% in June 2017.
However, annual non-food inflation rose to 8.4% in Septemberfrom 8.0% in June 2017, driven by increase in electricity tariffs.
Appreciation of the Kwacha and improved supply of food items,particularly maize grain and products, accounted for the decline ininflation.
31
DOMESTIC ECONOMIC DEVELOPMENTSInflation
4
9
14
19
24
29
Oct
-14
Nov-1
4
Dec
-14
Jan-1
5
Feb
-15
Mar
-15
Apr-
15
May
-15
Jun-1
5
Jul-
15
Aug-1
5
Sep
-15
Oct
-15
Nov-1
5
Dec
-15
Jan-1
6
Feb
-16
Mar
-16
Apr-
16
May
-16
Jun-1
6
Jul-
16
Aug-1
6
Sep
-16
Oct
-16
Nov-1
6
Dec
-16
Jan-1
7
Feb
-17
Mar
-17
Apr-
17
May
-17
Jun-1
7
Jul-
17
Au
g-1
7
Sep
-17
Oct
-17
Per
cen
t
Overall Inflation Food inflation Non-food inflation Inflation Target
Figure 15: Year-on-year Inflation rate

DOMESTIC ECONOMIC DEVELOPMENTSInflation
32
• Month-on-month inflation declined to 0.3% in Septemberfrom 0.6% in June 2017, but rose marginally to 0.4% inOctober (Figure 16).
• Food inflation ended Q3 at negative 0.1% compared withnegative 0.3% in June.
• Likewise, non-food inflation declined to 0.8% from 1.7% overthe same period.
• Year to October inflation was 3.9%

DOMESTIC ECONOMIC DEVELOPMENTSInflation
33
Figure 16: Month-on-month Inflation rate
(1.0)
-
1.0
2.0
3.0
4.0
5.0
6.0
7.0
8.0
Apr-
15
May
-15
Jun-1
5
Jul-
15
Aug-1
5
Sep
-15
Oct
-15
Nov-1
5
Dec
-15
Jan-1
6
Feb
-16
Mar
-16
Apr-
16
May
-16
Jun-1
6
Jul-
16
Aug-1
6
Sep
-16
Oct
-16
No
v-1
6
Dec
-16
Jan-1
7
Feb
-17
Mar
-17
Apr-
17
May
-17
Jun-1
7
Jul-
17
Aug-1
7
Sep
-17
Oct
-17
Per
cen
t
Overall Food Non-food

Gradual pick-up in domestic GDP growth expected (though still below 7% average:2011-14), driven by mining, agriculture, manufacturing and tourism.
34
Figure 17: GDP Growth
MACROECONOMIC OUTLOOKGDP growth
10.3
5.6
7.6
5.14.7
2.9
3.83.84.2
5.05.4
2
3
4
5
6
7
8
9
10
11
20
10
20
11
20
12
20
13
20
14
20
15
20
16
20
17
f
20
18
f
20
19
f
Real GDP Growth (%) GDP Growth Projection (%)
MACROECONOMIC OUTLOOKInflation Outlook
35
Low inflationary pressures are projected over the next 8quarters, with inflation forecast to remain around the lowerbound of the inflation target in 2019.
The upside risks include the following:
1. Currently relatively high fiscal deficit and debt levels; and
2. The second round effects of the proposed tax measures inthe 2018 budget address.

MACROECONOMIC OUTLOOKInflation Outlook
36
The downside risks include the following:
1. Increase in copper price which will support relative stabilityto the exchange rate;
2. Excess supply of maize grain which will moderate foodprices; and
3. Increased supply of electricity which will keep the cost ofproduction relatively low.
For the rest of 2017, inflation is projected to remain at currentlevels, though with a downward bias.

37
THANK YOU AND GOD BLESS…