monetary policy 101: a primer on the fed's changing ... policy 101: a primer on the fed’s...
TRANSCRIPT

Finance and Economics Discussion SeriesDivisions of Research & Statistics and Monetary Affairs
Federal Reserve Board, Washington, D.C.
Monetary Policy 101: A Primer on the Fed’s Changing Approachto Policy Implementation
Jane E. Ihrig, Ellen E. Meade, and Gretchen C. Weinbach
2015-047
Please cite this paper as:Jane E. Ihrig, Ellen E. Meade, and Gretchen C. Weinbach (2015). “Monetary Policy 101: APrimer on the Fed’s Changing Approach to Policy Implementation,” Finance and EconomicsDiscussion Series 2015-047. Washington: Board of Governors of the Federal Reserve System,http://dx.doi.org/10.17016/FEDS.2015.047.
NOTE: Staff working papers in the Finance and Economics Discussion Series (FEDS) are preliminarymaterials circulated to stimulate discussion and critical comment. The analysis and conclusions set forthare those of the authors and do not indicate concurrence by other members of the research staff or theBoard of Governors. References in publications to the Finance and Economics Discussion Series (other thanacknowledgement) should be cleared with the author(s) to protect the tentative character of these papers.

Monetary Policy 101: A Primer on the Fed’s Changing Approach to Policy Implementation
Jane Ihrig, Ellen E. Meade, and Gretchen C. Weinbach*
June 30, 2015
Abstract
The Federal Reserve conducts monetary policy in order to achieve its statutory mandate of maximum employment, stable prices, and moderate long-term interest rates as prescribed by the Congress and laid out in the Federal Reserve Act. For many years prior to the financial crisis, the FOMC set a target for the federal funds rate and achieved that target through small purchases and sales of securities in the open market. In the aftermath of the financial crisis, with a superabundant level of reserve balances in the banking system having been created as a result of the Federal Reserve’s large scale asset purchase programs, this approach to implementing monetary policy will no longer work. This paper provides a primer on the Fed’s implementation of monetary policy. We use the standard textbook model to illustrate why the approach used by the Federal Reserve before the financial crisis to keep the federal funds rate near the FOMC’s target will not work in current circumstances, and explain the approach that the Committee intends to use instead when it decides to begin raising short-term interest rates.
Keywords: Federal Reserve, FOMC, monetary policy implementation, monetary policy tools, monetary policy normalization, liftoff
JEL Classifications: E58, E52, E43
* Economists in the Division of Monetary Affairs at the Board of Governors of the Federal Reserve System. We thank Miguel Acosta, Jim Clouse, Melanie Josselyn, Joe Kachovec, Steve Meyer, Ben Miller, and Bill Nelson for comments. Melanie Josselyn and Joe Kachovec provided excellent research assistance. The views expressed here are those of the authors and do not necessarily reflect the views of other members of the research staff, the Board of Governors of the Federal Reserve System, or the Federal Reserve System.

1 Introduction The Federal Reserve conducts monetary policy in order to achieve its statutory mandate of maximum employment, stable prices, and moderate long-term interest rates as prescribed by the Congress and laid out in the Federal Reserve Act.1 For many years prior to the financial crisis, the Federal Open Market Committee (FOMC or “Committee”) set a target for the federal funds rate, an overnight interbank borrowing rate, and achieved that target through small purchases and sales of securities in the open market, known as open market operations. In the aftermath of the financial crisis, with a superabundant level of reserve balances in the banking system having been created as a result of the Federal Reserve’s large scale asset purchase programs, this approach to implementing the FOMC’s monetary policy will no longer work. This paper provides a primer on how the Federal Reserve will implement monetary policy when the FOMC decides it is time to raise interest rates. We begin with the standard textbook model of reserve balances to illustrate the approach used by the Federal Reserve before the financial crisis to keep the federal funds rate near the FOMC’s target. We then explain why that pre-crisis approach will not work in the current environment. After that, we discuss the policy tools available to the FOMC to implement monetary policy today, and explain the approach that the Committee intends to take when it decides to begin raising short-term interest rates. 2 How did the Fed implement monetary policy prior to the financial crisis? Money and Banking textbooks have long sketched out the framework under which open market operations (OMOs) were effective in implementing monetary policy, a framework based importantly on two key features—reserve requirements and reserve scarcity. Reserve requirements are set by the Federal Reserve and banks hold reserve balances to meet these requirements (see Box 1 for more information about how reserve requirements affect reserve balances). At the same time, before the financial crisis, banks generally kept their balances to a minimum, in part because the balances earned no return. The combination of Federal Reserve-created demand for reserve balances and banks’ desire to limit such balances drove an active interbank market—known as the federal funds market—for exchanging these funds, one in which banks borrowed from and lent funds to each other on a daily basis at an interest rate known as the federal funds rate. With reserve balances generally scarce, the Federal Reserve could meaningfully affect the market-determined level of the federal funds rate and keep it close to the FOMC’s target level by announcing the target level of the federal funds rate and making small changes in the supply of aggregate reserves, as needed.
1 The Federal Reserve’s statutory mandate is often referred to as a “dual mandate” of maximum employment and price stability because moderate long-term interest rates will result if prices are expected to be stable.
Page 2 of 29

Box 1: How do reserve requirements affect reserve balances?
The Federal Reserve Act (as amended by the Monetary Control Act of 1980) and the International Banking Act of 1978 impose reserve requirements on most deposit-taking institutions in the United States, requiring that they hold a certain fraction of their deposits in reserve. In particular, all depository institutions—commercial banks, savings banks, thrift institutions, and credit unions—as well as most U.S. branches and agencies of foreign banks (hereafter “banks,” for simplicity) are assessed reserve requirements against certain deposit liabilities. Banks are required to satisfy their reserve requirements in the form of vault cash, which they hold primarily to meet the liquidity needs of their customers and, if the quantity of vault cash held is insufficient, also in the form of a balance maintained at the Federal Reserve. The balances banks maintain at the Federal Reserve that are necessary for meeting reserve requirements are called required reserve balances; any reserve balances held in excess of what is necessary to meet reserve requirements are termed excess balances.2 Prior to the financial crisis, many banks in the United States satisfied their entire reserve requirement with vault cash, though about 900 banks did not and so also needed to maintain reserve balances at the Fed to satisfy their requirements. The total amount of reserve balances in the banking system hovered around $15 billion, with excess balances making up less than $2 billion of this total. However, as discussed in greater detail in section 2 and shown in the figure below, reserve balances have grown tremendously since the financial crisis. In late December 2014, reserve balances stood at more than $2.6 trillion and have remained in that neighborhood since then, with excess balances making up all but about $90 billion of this total.
Total reserve balances
2 In practice, banks meet their required reserve balances (also referred to as “reserve balance requirements”) with some leeway. A penalty-free band is used to create a range on both sides of the required reserve balance within which a bank needs to maintain its average balance over a given period. For more information on the calculation and maintenance of reserve requirements, see the Federal Reserve Board’s Reserve Maintenance Manual and web page on Reserve Requirements. Data on reserve balances are published weekly on the H.3 Statistical Release.
Page 3 of 29

Figure 1 presents the standard demand and supply framework for reserve balances shown in many Money and Banking textbooks. Demand is downward sloping because the higher is the opportunity cost of holding reserve balances, the lower is the demand for them. Conversely, as the price of overnight borrowing falls, banks are generally inclined to borrow more in order to satisfy their reserve requirements and also possibly to leave themselves with a bit of extra balances to protect against unexpected outflows that can cause reserve balance deficiencies, for which banks are charged a penalty. In theory, the price, or rate of interest, that an institution is willing to pay to borrow funds overnight—that is, the federal funds rate—should be capped at the Federal Reserve’s primary credit rate. The primary credit rate is the interest rate that the Fed charges banks to borrow overnight from its primary credit program (part of the Fed’s discount window), which provides banks with a source of back-up funding at an interest rate that is well above the Fed’s target federal funds rate. Thus, a bank would be unlikely to borrow in the federal funds market at a rate above the primary credit rate because it could instead obtain the funding it needs more cheaply by borrowing directly from the Fed.3
Figure 1 Banks’ demand for and the Fed’s supply of reserve balances
The supply curve for reserve balances is vertical because the Fed is a monopolistic supplier of reserves; the supply curve shifts to the right or left when the Fed adds or subtracts reserves from the banking system using OMOs.4 The intersection of the demand and the supply curves occurs at the market federal funds rate.
3 Although, in theory, banks should be unwilling to pay more than the primary credit rate for overnight funding, they sometimes do. Transactions costs as well as reputation effects (termed “stigma”) associated with borrowing from the Fed lead some banks to borrow from other institutions in the federal funds market at interest rates that exceed the primary credit rate. Data on banks’ aggregate borrowings from the Fed are published weekly on the H.3 Statistical Release. For more information on the Fed’s discount window programs, see Purposes and Functions (2005). 4 Note that when banks trade existing reserve balances among themselves in the federal funds market, that trading leaves the aggregate amount of reserve balances unchanged.
Page 4 of 29

A key feature of the supply and demand framework for reserves prior to the financial crisis is that the supply curve intersected the demand curve on the downward-sloping portion of the demand curve. This meant that the Fed was able to achieve the FOMC’s desired target level for the federal funds rate by using OMOs to adjust the supply of reserve balances. In particular, if the market federal funds rate was above (below) the FOMC’s target federal funds rate, then the Fed would execute purchases (sales) of securities that would add (drain) reserve balances to (from) the banking system and shift the supply curve to the right (left).5 Each business day the Federal Reserve examined demand and supply conditions and, informed by staff models, determined whether an adjustment to reserve supply was needed, which kind of OMO was suitable, and what approximate size would be appropriate; it then executed one or more small operations to produce the desired movement in supply necessary to achieve the Committee’s target federal funds rate (see Box 2 for more information about the kinds of OMOs the Fed conducted).6
Box 2: What kinds of OMOs did the Fed traditionally conduct? The kind of OMO the Fed would use prior to the financial crisis depended importantly on its assessment of conditions in the market for reserves. For example, suppose banks were trading federal funds at interest rates above the FOMC’s target federal funds rate. In this situation, the Federal Reserve—more specifically, the Open Market Trading Desk at the Federal Reserve Bank of New York (the Desk)—would purchase a security from the private sector, a transaction that cleared through banks and resulted in reserve balances being added to the banking system. In Figure 1, this transaction would shift the supply curve to the right for as long as the Fed owned the security, and thereby put downward pressure on the market federal funds rate. (The Appendix describes the mechanism by which increases in the Fed’s security holdings result in a commensurate increase in the amount of reserve balances in the banking system.) If the Desk thought that the demand for reserves was elevated only temporarily, perhaps around long, holiday weekends when banks often hold extra reserves, it could instead use an OMO to purchase the security for only a short time, thereby increasing reserve balances temporarily, with the transaction including a step to sell the security back to the original holder at an agreed-upon time in the future. Such a transaction is known as a “repurchase agreement,” also referred to as “repo” or “RP.”7 All else
5 More specifically, the Fed kept the “effective” federal funds rate near the FOMC’s target level. The effective federal funds rate is a volume-weighted average of federal funds transactions. The Federal Reserve Bank of New York publishes data on the effective federal funds rate each day. For simplicity, we refer to this rate as the market federal funds rate, or just the federal funds rate (to distinguish from the FOMC’s target federal funds rate). 6 For a discussion of how OMOs were forecast, see Judson and Klee (2010). 7 The market for repos is complex. There are two basic types of repo transactions: “bilateral” and “tri-party,” referring to the number of participants involved in the transaction. Within the tri-party market there is a large segment called the GCF repo market, referred to in Figure 2. For more information on the structure of repo markets, see Copeland et al. (2012).
Page 5 of 29

equal, once the repurchase agreement was concluded, with the security having made its round-trip back to the private sector, the supply curve for reserve balances would also be back where it started. The Fed could also drain reserve balances temporarily if it needed to do so using a reverse repurchase agreement, also known as a “reverse repo” or “RRP.” In this type of OMO, illustrated in the figure below, the Desk would sell a security to the private sector, a transaction that would initially result in a decline in the quantity of reserve balances in the banking system, shifting the supply curve to the left. As with a repo transaction, this transaction would include a second step in which the transaction is unwound—the Desk would repurchase the security at a specified price at an agreed-upon time in the future and return the funds it had been holding, leaving reserve balances back where they started. In either a repo or reverse repo transaction, the difference between the sale price and the repurchase price of the security, together with the length of time between the sale and purchase steps of the transaction, implies a rate of interest earned by the party that purchased the security and loaned the funds.8
Illustration of an RRP transaction
As shown in Figure 2, the federal funds rate and other short-term market interest rates continue to move together. This reflects, in part, the fact that many of the same financial institutions are active participants in the market for various money market instruments, including federal funds, Eurodollar, and repo markets.9 In particular, as shown in Table 1, banks
8 Technically, when the Fed buys a security in a repo transaction or sells a security in a reverse repo transaction the size of its securities holdings is unchanged, in accordance with generally accepted accounting principles. However, these transactions do temporarily change the composition of the Fed’s balance sheet while the trades are outstanding. For example, a reverse repo transaction shifts funds out of reserve balances and into reverse repos, resulting in a compositional change in the Fed’s liabilities and no change to its assets. For more information, see the Appendix and the FAQ on the Federal Reserve Bank of New York’s website. 9 A Eurodollar transaction is very similar to a federal funds transaction—both are unsecured trades. While federal funds are U.S.-dollar deposits at U.S. banks, Eurodollars are U.S.-dollar deposits at a bank outside of the United States. A repo transaction, on the other hand, is a secured trade (details are provided in Box 2).
Page 6 of 29

are active borrowers in all three of these money markets, and while the lenders vary a bit across the markets, there is also notable overlap. All in all, arbitrage generally works well to keep money market rates highly correlated.
Figure 2 Overnight market interest rates
Source: For Eurodollar, Bloomberg; for Treasury GCF Repo, Depository Trust & Clearing Corporation (DTCC); for Federal Funds, Federal Reserve Bank of New York; for Interest on Excess Reserves, Federal Reserve Board.
Table 1
Major borrowers and lenders of cash in money markets
Federal funds Eurodollar Repo and Reverse Repo
Borrowers of cash Banks Banks Banks Securities dealers
Lenders of cash Banks
Securities dealers GSEs*
Money market funds Other financial firms Nonfinancial firms
Money market funds Securities dealers
GSEs* Hedge funds
* GSEs are government-sponsored enterprises such as Fannie Mae, Freddie Mac, and the Federal Home Loan Banks (FHLBs). Moreover, changes in the level of short-term interest rates over time have generally been transmitted to other, longer-term interest rates as well, including those commonly faced by businesses and households, thereby ultimately influencing the pace of economic activity. As conditions in the economy changed over time, the Committee adjusted monetary policy
Page 7 of 29

accordingly, typically by raising or lowering its target for the federal funds rate, so as to foster economic conditions it judged to be consistent with achieving its statutory goals of maximum employment, stable prices, and moderate long-term interest rates. An increase in the target federal funds rate is generally considered a “tightening” of monetary policy because higher interest rates tend, all else equal, to discourage economic activity by making borrowing costs more expensive for businesses and households; conversely, a reduction in the target federal funds rate is considered an “easing” of monetary policy. This basic transmission channel of monetary policy is depicted in Figure 3.
Figure 3 Transmission channel of monetary policy
3 How did the global financial crisis affect the Fed’s operational framework?
The first event commonly associated with the financial crisis took place in early August of 2007.10 As shown in the left panel of Figure 4, on the eve of that event, the Federal Reserve’s assets were comprised principally of Treasury securities holdings of $791 billion; its liabilities were mainly currency, with banks holding about $15 billion in reserve balances at the Federal Reserve. At the onset of the financial crisis, the FOMC began reducing its target for the federal funds rate.11 Over a short period of time, the target rate was moved down substantially from its peak level just prior to the crisis of 5¼ percent, where it stood in August 2007, to its effective lower bound of 0 to 25 basis points in December 2008, where it still stands today.12
In addition, to counteract the devastating effects on the U.S. economy of the financial crisis and subsequent Great Recession, the FOMC carried out a series of large-scale asset purchase programs (LSAPs) between November 2008 and October 2014 in which the Fed purchased in the secondary market about $1,690 billion in Treasury securities, $2,070 billion in agency mortgage-backed securities (MBS), and $170 billion in debt issued or guaranteed by
10 On August 9, 2007, BNP Paribas suspended withdrawals from three of its investment funds due to problems in the subprime mortgage market. 11 The Federal Reserve also responded to the financial crisis with a number of credit and liquidity programs designed to support the liquidity of financial institutions and foster improved conditions in financial markets. Although these programs led to significant increases in the Federal Reserve's balance sheet, the programs have expired or were concluded, and they are not boosting the Fed’s balance sheet today. Details of these liquidity programs are available on the Federal Reserve Board’s website. 12 The target or “intended” federal funds rate is published on the Federal Reserve Board’s website.
Page 8 of 29

Figure 4 A simplified Federal Reserve balance sheet: Before and after the financial crisis
(billions of dollars)
Before: August 8, 2007
After: December 24, 2014
Assets Liabilities Assets Liabilities
Securities 791 Reserve balances 14 Securities 4,247 Reserve
balances 2,610
Other assets 78 Currency 777 Other
assets 262 Currency 1,294
Other 45 Other 548
Capital 34 Capital 57
Total 869 Total 869 Total 4,509 Total 4,509
government agencies.13 With short-term interest rates already near zero, the purpose of these operations was to put downward pressure on longer-term interest rates in the economy (see Figure 3)—the purchases reduced the available supply of securities in the market, leading to an increase in the prices of these securities and a reduction in their yields.14
In order to maintain these effects on yields, the Fed has been keeping its securities holdings steady by reinvesting principal payments on agency debt and agency MBS and by rolling over Treasury securities as they mature. As a result of these LSAPs and the FOMC’s securities reinvestment policy, as illustrated in the right panel of Figure 4, the Fed’s securities holdings rose to nearly 5½ times their pre-crisis level, with agency MBS representing about 40 percent of the securities portfolio.15 In addition, reserve balances became the largest liability, amounting to $2.6 trillion. As we will explain shortly, in an environment with a superabundant level of reserves, the Federal Reserve can no longer rely on small changes in the supply of aggregate reserves to adjust the level of the federal funds rate.
Another important factor affecting the federal funds market and thus the implementation of monetary policy going forward is the introduction of interest payments on reserve balances. Since October 2008, the Federal Reserve has paid interest on the balances that banks maintain
13 In addition, the Fed conducted a maturity extension program where it sold $667 billion in shorter-dated Treasury securities and purchased the same amount of longer-dated Treasury securities. More details regarding all the purchase programs may be found on the Board’s website. 14 The LSAPs also helped to support mortgage markets. For more information on LSAPs, see the Board’s website. 15 The increase in securities holdings on the Fed’s balance sheet between August 2007 and December 2014 is less than total securities purchased because the FOMC did not implement its reinvestment policy until August 2010.
Page 9 of 29
to satisfy their reserve requirements and on banks’ excess balances.16 Since the Fed began paying interest on reserves, the market federal funds rate has generally been below the IOER rate. This situation has arisen because, in addition to banks not needing to borrow actively from each other because of the high quantity of reserves in the banking system, there are also nonbank lenders in the federal funds market who, by law, are not eligible to earn the IOER rate on the balances they keep at the Fed (see the first column of table 1). Thus, those nonbanks have an incentive to lend reserves at any rate above zero while banks have an incentive to purchase federal funds at rates below the IOER rate in order to earn the spread between the market rate at which they purchased the funds and the IOER rate they earn from the Fed on those funds. This is an example of an arbitrage transaction, and we discuss the role of arbitrage in more detail below.
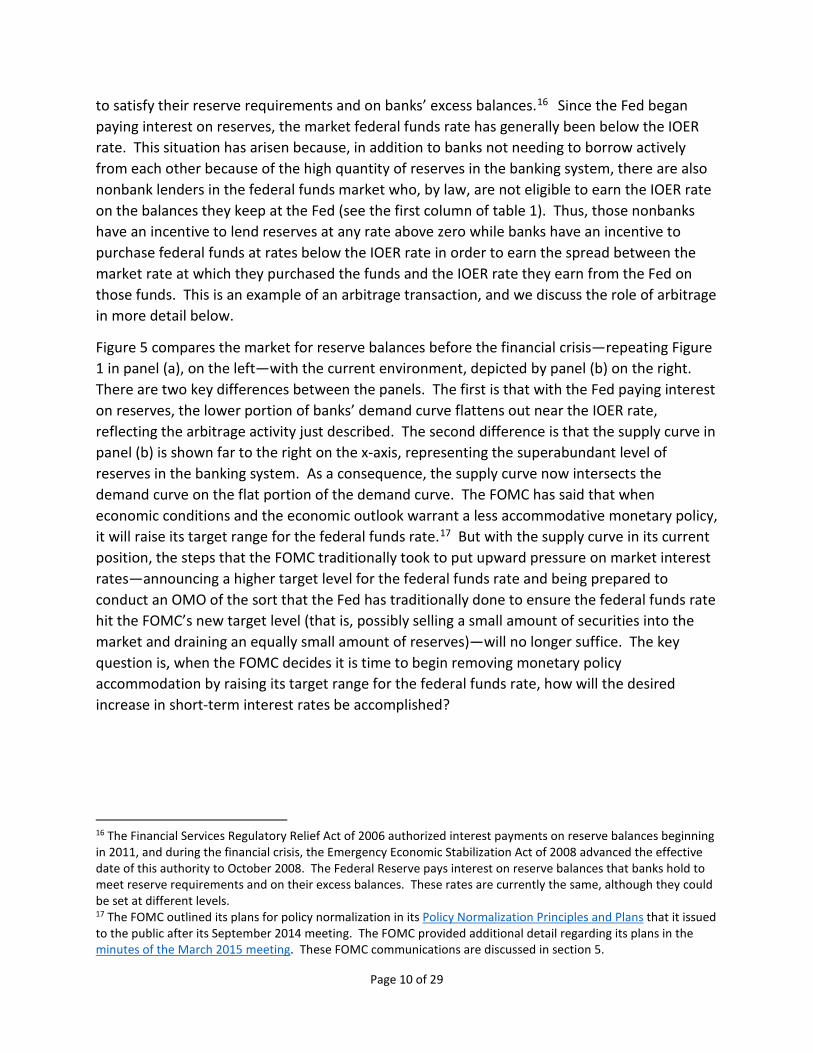
Figure 5 compares the market for reserve balances before the financial crisis—repeating Figure 1 in panel (a), on the left—with the current environment, depicted by panel (b) on the right. There are two key differences between the panels. The first is that with the Fed paying interest on reserves, the lower portion of banks’ demand curve flattens out near the IOER rate, reflecting the arbitrage activity just described. The second difference is that the supply curve in panel (b) is shown far to the right on the x-axis, representing the superabundant level of reserves in the banking system. As a consequence, the supply curve now intersects the demand curve on the flat portion of the demand curve. The FOMC has said that when economic conditions and the economic outlook warrant a less accommodative monetary policy, it will raise its target range for the federal funds rate.17 But with the supply curve in its current position, the steps that the FOMC traditionally took to put upward pressure on market interest rates—announcing a higher target level for the federal funds rate and being prepared to conduct an OMO of the sort that the Fed has traditionally done to ensure the federal funds rate hit the FOMC’s new target level (that is, possibly selling a small amount of securities into the market and draining an equally small amount of reserves)—will no longer suffice. The key question is, when the FOMC decides it is time to begin removing monetary policy accommodation by raising its target range for the federal funds rate, how will the desired increase in short-term interest rates be accomplished?
16 The Financial Services Regulatory Relief Act of 2006 authorized interest payments on reserve balances beginning in 2011, and during the financial crisis, the Emergency Economic Stabilization Act of 2008 advanced the effective date of this authority to October 2008. The Federal Reserve pays interest on reserve balances that banks hold to meet reserve requirements and on their excess balances. These rates are currently the same, although they could be set at different levels. 17 The FOMC outlined its plans for policy normalization in its Policy Normalization Principles and Plans that it issued to the public after its September 2014 meeting. The FOMC provided additional detail regarding its plans in the minutes of the March 2015 meeting. These FOMC communications are discussed in section 5.
Page 10 of 29
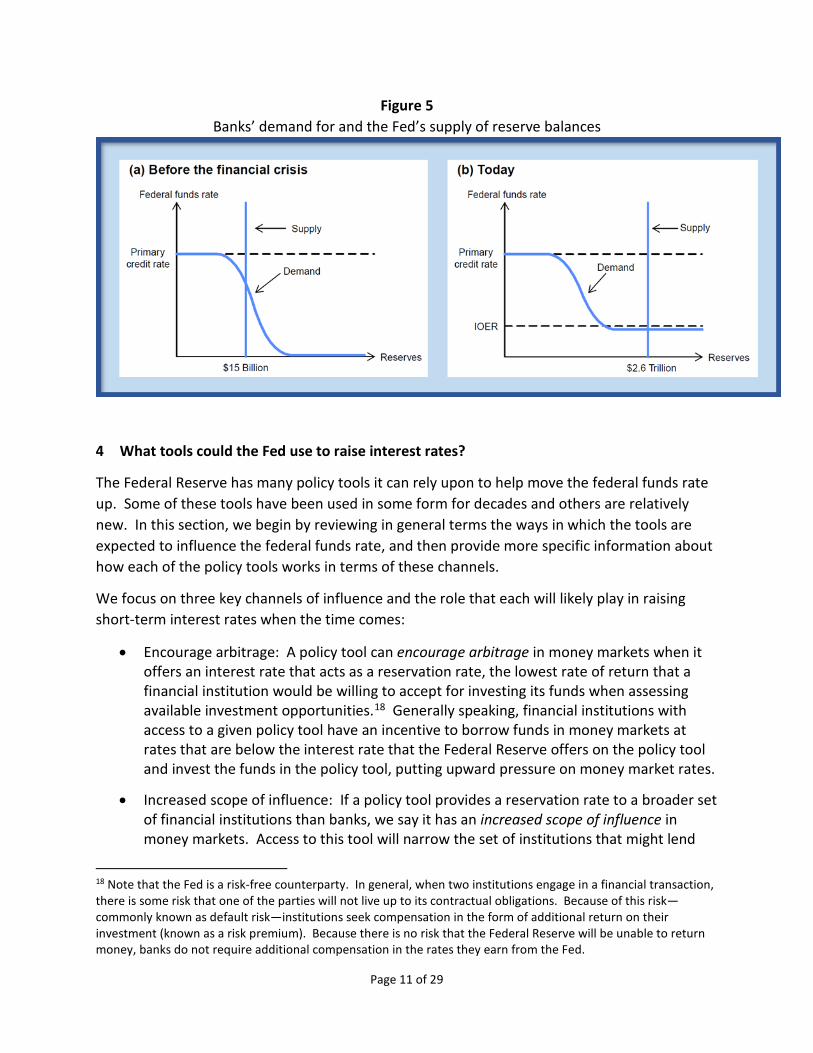
Figure 5 Banks’ demand for and the Fed’s supply of reserve balances
4 What tools could the Fed use to raise interest rates?
The Federal Reserve has many policy tools it can rely upon to help move the federal funds rate up. Some of these tools have been used in some form for decades and others are relatively new. In this section, we begin by reviewing in general terms the ways in which the tools are expected to influence the federal funds rate, and then provide more specific information about how each of the policy tools works in terms of these channels.
We focus on three key channels of influence and the role that each will likely play in raising short-term interest rates when the time comes:
• Encourage arbitrage: A policy tool can encourage arbitrage in money markets when it offers an interest rate that acts as a reservation rate, the lowest rate of return that a financial institution would be willing to accept for investing its funds when assessing available investment opportunities.18 Generally speaking, financial institutions with access to a given policy tool have an incentive to borrow funds in money markets at rates that are below the interest rate that the Federal Reserve offers on the policy tool and invest the funds in the policy tool, putting upward pressure on money market rates.
• Increased scope of influence: If a policy tool provides a reservation rate to a broader set of financial institutions than banks, we say it has an increased scope of influence in money markets. Access to this tool will narrow the set of institutions that might lend
18 Note that the Fed is a risk-free counterparty. In general, when two institutions engage in a financial transaction, there is some risk that one of the parties will not live up to its contractual obligations. Because of this risk—commonly known as default risk—institutions seek compensation in the form of additional return on their investment (known as a risk premium). Because there is no risk that the Federal Reserve will be unable to return money, banks do not require additional compensation in the rates they earn from the Fed.
Page 11 of 29
money below the rate earned on the policy tool and put upward pressure on the lowest interest rates in money markets.
• Increase reserve scarcity: Use of the policy tool can increase reserve scarcity by draining reserve balances and moving the level of aggregate reserves closer to its traditional position. If the aggregate level of reserve balances were reduced sufficiently, banks would need to resume borrowing federal funds to meet their demand for reserve balances, leading them to put upward pressure on the market federal funds rate.
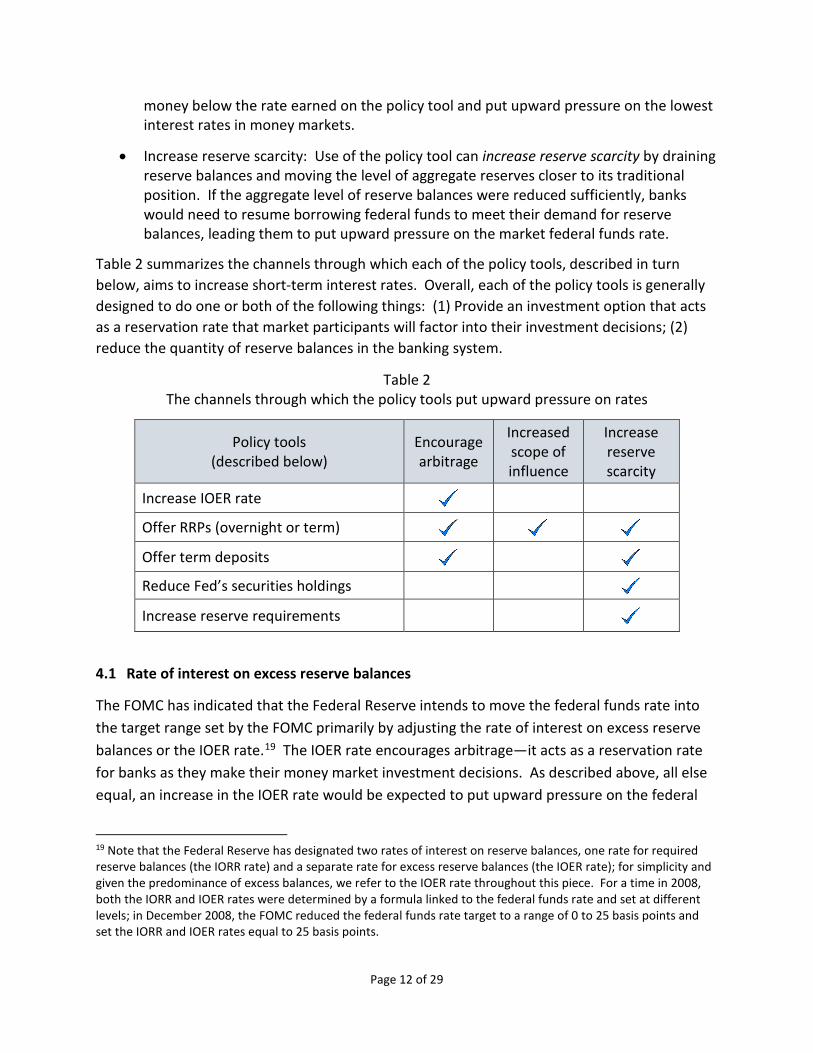
Table 2 summarizes the channels through which each of the policy tools, described in turn below, aims to increase short-term interest rates. Overall, each of the policy tools is generally designed to do one or both of the following things: (1) Provide an investment option that acts as a reservation rate that market participants will factor into their investment decisions; (2) reduce the quantity of reserve balances in the banking system.
Table 2 The channels through which the policy tools put upward pressure on rates
Policy tools (described below)
Encourage arbitrage
Increased scope of influence
Increase reserve scarcity
Increase IOER rate
Offer RRPs (overnight or term)
Offer term deposits Reduce Fed’s securities holdings
Increase reserve requirements
4.1 Rate of interest on excess reserve balances
The FOMC has indicated that the Federal Reserve intends to move the federal funds rate into the target range set by the FOMC primarily by adjusting the rate of interest on excess reserve balances or the IOER rate.19 The IOER rate encourages arbitrage—it acts as a reservation rate for banks as they make their money market investment decisions. As described above, all else equal, an increase in the IOER rate would be expected to put upward pressure on the federal
19 Note that the Federal Reserve has designated two rates of interest on reserve balances, one rate for required reserve balances (the IORR rate) and a separate rate for excess reserve balances (the IOER rate); for simplicity and given the predominance of excess balances, we refer to the IOER rate throughout this piece. For a time in 2008, both the IORR and IOER rates were determined by a formula linked to the federal funds rate and set at different levels; in December 2008, the FOMC reduced the federal funds rate target to a range of 0 to 25 basis points and set the IORR and IOER rates equal to 25 basis points.
Page 12 of 29
funds rate because banks would have an incentive to borrow in the federal funds market at rates below the IOER rate and place those balances at the Fed to earn the IOER rate.20 Similarly, other money market rates should increase as banks arbitrage between holding excess reserve balances and these alternative money market instruments.
Of course, banks need to be willing and able to actively perform this arbitrage for these effects to be realized. To date, banks have been willing to arbitrage the IOER rate so that, as shown in Figure 2, the federal funds rate has been highly correlated with other money market rates. But, as also illustrated in the figure, these money market rates have remained below the IOER rate because, as noted above and in Table 1, banks are not the only participants in the federal funds market. Government-sponsored enterprises (GSEs), institutions that also hold reserve accounts at the Fed but are not eligible to earn interest on those balances, also participate in the federal funds market. These institutions are willing to lend out federal funds at rates that are relatively low because their return on balances held at the Fed is zero.21 Moreover, because reserve balances are superabundant among banks, nearly all of the federal funds trading reflects borrowing by banks from non-IOER-earning institutions, at relatively low rates, to engage in such arbitrage activity. Next we discuss a tool that was designed to support short-term interest rates from below.
4.2 Overnight RRPs
The FOMC has indicated that, when the time comes to begin to raise the target federal funds rate, it intends to use an overnight reverse repurchase agreement facility as needed to help keep the federal funds rate within its target range. Box 2 provided a description of how the Fed conducted RRP transactions prior to the financial crisis, and noted that such transactions were conducted for the purposes of causing a temporary decline in reserve balances in order to put upward pressure on the federal funds rate. At that time, the Fed occasionally conducted relatively small-dollar amounts of overnight RRPs or “ON RRPs” with a group of institutions known as “primary dealers.”22 Today, the Fed is routinely conducting ON RRPs in the form of test exercises; these ON RRPs have three key operational differences relative to their use in monetary policy operations before the financial crisis. The first difference is that ON RRPs have been offered on a daily basis with an offering rate that is pre-announced and can act as a reservation rate, encouraging arbitrage in money markets. In particular, the offering rate is the maximum interest rate the Fed is willing to pay in the
20 In conducting this arbitrage activity, reserve balances are shuffled among banks; this activity will not bring about a change in the aggregate quantity of reserve balances in the banking system (see the Appendix for more detail). 21 See Goodfriend (2015). 22 A primary dealer makes markets in Treasury securities; that is, it buys (sells) Treasury securities directly from (to) the government with the intention of acting as the “middleman” between the government and market participants in the private sector.
Page 13 of 29

operation. As was the case with the payment of interest on excess reserves, the Fed’s ON RRPs is an investment option that potential participants take into account when deciding which of various money market instruments to invest in. Counterparties will compare the Fed’s ON RRP offering rate to other money market rates and determine whether to invest in those other money market instruments or instead to bid in the Fed’s ON RRP operation (see Box 3 for a more detailed description). Because the Fed sets the ON RRP rate, it can influence the extent to which money market participants consider ON RRPs an attractive investment option. If the Fed’s offering rate is relatively low, demand for ON RRPs could be small. Alternatively, if the Fed’s ON RRP rate was greater than comparable alternative interest rates in money markets, counterparties could bid relatively large amounts. In testing ON RRPs, the Fed at times has varied the offering rate, and this has generally demonstrated that demand for ON RRPs is indeed sensitive to the pattern of interest rates. The second difference is that the set of counterparties that are eligible to participate in the Fed’s ON RRP operations is much broader than it was in the past, increasing the sphere of influence that the ON RRP rate has in money markets. The Fed conducted traditional OMOs with a set of primary dealers; today, the institutions that are eligible to participate in the Fed’s ON RRP operations include about two dozen banks as well as a lengthy list of nonbanks (money market funds, primary dealers, and GSEs).23 As a result, more institutions—and, importantly, more types of institutions—are able to consider the Fed’s ON RRPs a direct investment option. In particular, the eligible nonbank institutions, which are unable to earn interest on reserves, may be encouraged to engage in arbitrage activity relative to the ON RRP rate because they have little incentive to lend funds in money markets at interest rates below the one they can receive directly from the Fed. Such activity has the important effect of providing a floor under the level of money market interest rates and supporting them from below. The third operational difference relates to the way in which ON RRPs could be used today to increase reserve scarcity. When the Fed announces an ON RRP test operation, it also announces an aggregate offering amount—the total amount of dollars the Fed is willing to accept at the operation. During the initial portion of the testing period for ON RRPs, which began in September 2013, the aggregate offering amount on these exercises was first uncapped, so that the Fed accepted all bids, subject to a limit on each institution’s bid, that eligible participants wanted to place at the Fed. In September 2014, the aggregate offering size was capped at $300 billion, where it stands today. With an aggregate cap on ON RRP operations, the Fed needs to use a procedure, described in Box 3, to award the aggregate offering amount when the total amount bid at an operation exceeds the total amount offered.
23 The Federal Reserve Bank of New York publishes on its website a list of the Fed’s primary dealers and eligible ON RRP counterparties.
Page 14 of 29

The Fed’s testing of ON RRP operations has demonstrated that these operations can set a soft floor under the level of the federal funds rate and other short-term market interest rates, as long as market participants are confident that the aggregate cap on ON RRPs is large enough to meet demand.
If the Fed wanted to increase the scarcity of reserves in the banking system, it could set the offering amount on its ON RRP operation relatively high, and possibly also adjust the offering rate, to encourage demand for these operations. However, the FOMC has discussed concerns associated with having a persistently large ON RRP program, a topic to which we will return in section 5. Thus, the role that ON RRPs may play in increasing reserve scarcity over time is likely to be limited. Instead, the Fed could use other tools, such as term RRPs or term deposits to increase reserve scarcity, and we discuss these next.
Box 3: How does the Fed determine take-up at each ON RRP operation?
Financial institutions that are eligible to engage in ON RRP operations with the Fed compare the Fed’s offering rate on ON RRPs to market interest rates on similar assets and choose how many securities to bid for—and thus how many dollars to place with the Fed—at each operation. During the testing phase of the ON RRP exercises, the Fed has typically allowed eligible institutions to bid up to $30 billion at each operation. How does the Fed decide which bids to accept? The answer depends on whether the Fed has capped the ON RRP operation in aggregate size or not, and if so, whether the total amount bid is above or below the cap. If an operation is not capped in aggregate or if the total amount bid is less than the cap, all bids are accepted at the Fed’s offering rate. But if the operation is capped and the total amount bid exceeds the cap, an auction process is used to allocate the available amount of the operation. Next we walk through these two cases.
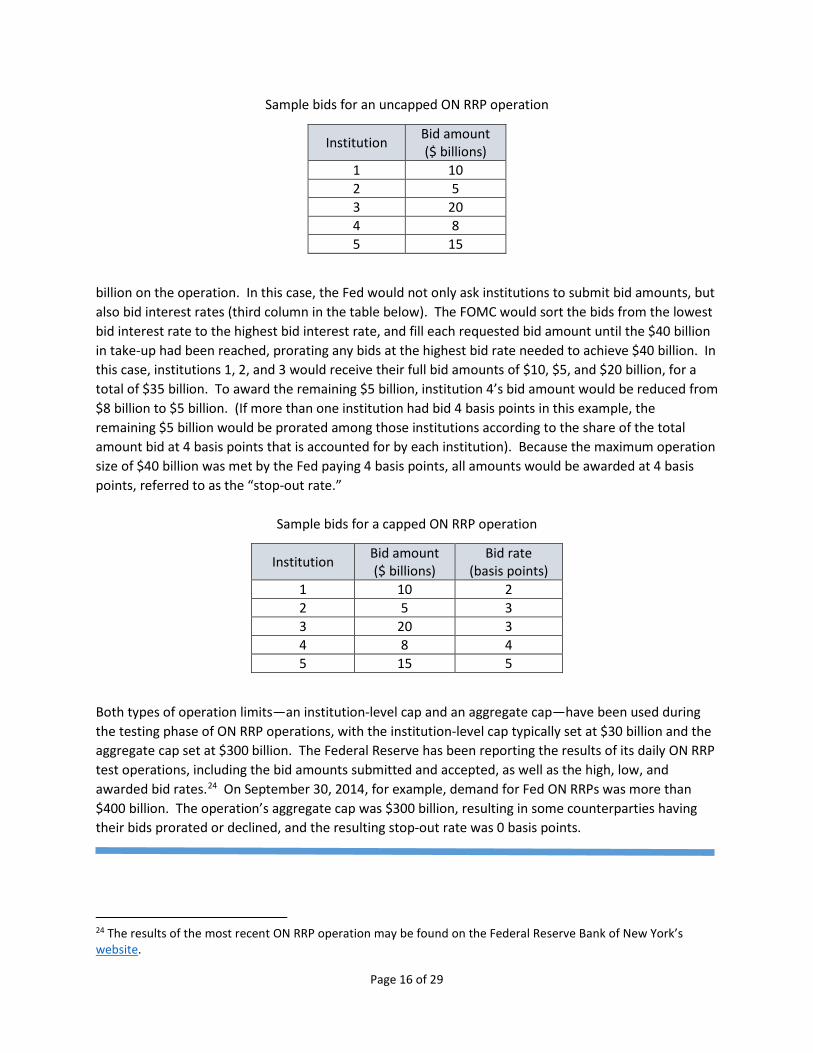
First, suppose that the Fed offers ON RRPs in an unlimited aggregate amount. Further, let’s suppose, as has typically been the case during the testing phase of the ON RRP exercises, that the Fed’s offering rate is 5 basis points. Also assume, as illustrated in the table below, that five institutions submit bids that range between $5 and $15 billion for a total of $58 billion. With no capacity constraints on the operation, all counterparties would be awarded their bid amount at the operation’s offering rate of 5 basis points. What this means is that these institutions would place $58 billion at the Fed overnight, and the Fed would return the funds with interest the next day. (See the Appendix for a full analysis of an ON RRP transaction, including its effects on reserve balances and the Fed’s securities holdings.)
Now suppose instead that the Fed wanted to limit the size of this operation to $40 billion in aggregate—that is, each institution could still bid up to $30 billion, but the Fed wanted to award only $40 billion in total. The Fed could do this by announcing ahead of time that there will be an aggregate cap of $40
Page 15 of 29
Sample bids for an uncapped ON RRP operation
Institution Bid amount ($ billions)
1 10 2 5 3 20 4 8 5 15
billion on the operation. In this case, the Fed would not only ask institutions to submit bid amounts, but also bid interest rates (third column in the table below). The FOMC would sort the bids from the lowest bid interest rate to the highest bid interest rate, and fill each requested bid amount until the $40 billion in take-up had been reached, prorating any bids at the highest bid rate needed to achieve $40 billion. In this case, institutions 1, 2, and 3 would receive their full bid amounts of $10, $5, and $20 billion, for a total of $35 billion. To award the remaining $5 billion, institution 4’s bid amount would be reduced from $8 billion to $5 billion. (If more than one institution had bid 4 basis points in this example, the remaining $5 billion would be prorated among those institutions according to the share of the total amount bid at 4 basis points that is accounted for by each institution). Because the maximum operation size of $40 billion was met by the Fed paying 4 basis points, all amounts would be awarded at 4 basis points, referred to as the “stop-out rate.”
Sample bids for a capped ON RRP operation
Institution Bid amount ($ billions)
Bid rate (basis points)
1 10 2 2 5 3 3 20 3 4 8 4 5 15 5
Both types of operation limits—an institution-level cap and an aggregate cap—have been used during the testing phase of ON RRP operations, with the institution-level cap typically set at $30 billion and the aggregate cap set at $300 billion. The Federal Reserve has been reporting the results of its daily ON RRP test operations, including the bid amounts submitted and accepted, as well as the high, low, and awarded bid rates.24 On September 30, 2014, for example, demand for Fed ON RRPs was more than $400 billion. The operation’s aggregate cap was $300 billion, resulting in some counterparties having their bids prorated or declined, and the resulting stop-out rate was 0 basis points.
24 The results of the most recent ON RRP operation may be found on the Federal Reserve Bank of New York’s website.
Page 16 of 29
4.3 Term RRPs
In addition to conducting RRPs on an overnight basis, the Fed can conduct the same type of transaction with the same set of eligible financial institutions but with the RRP outstanding over a longer time period; such transactions are known as “term RRPs.” In general, term RRPs work through the same three channels as the overnight operations, but drain reserves from the banking system for a longer period of time.
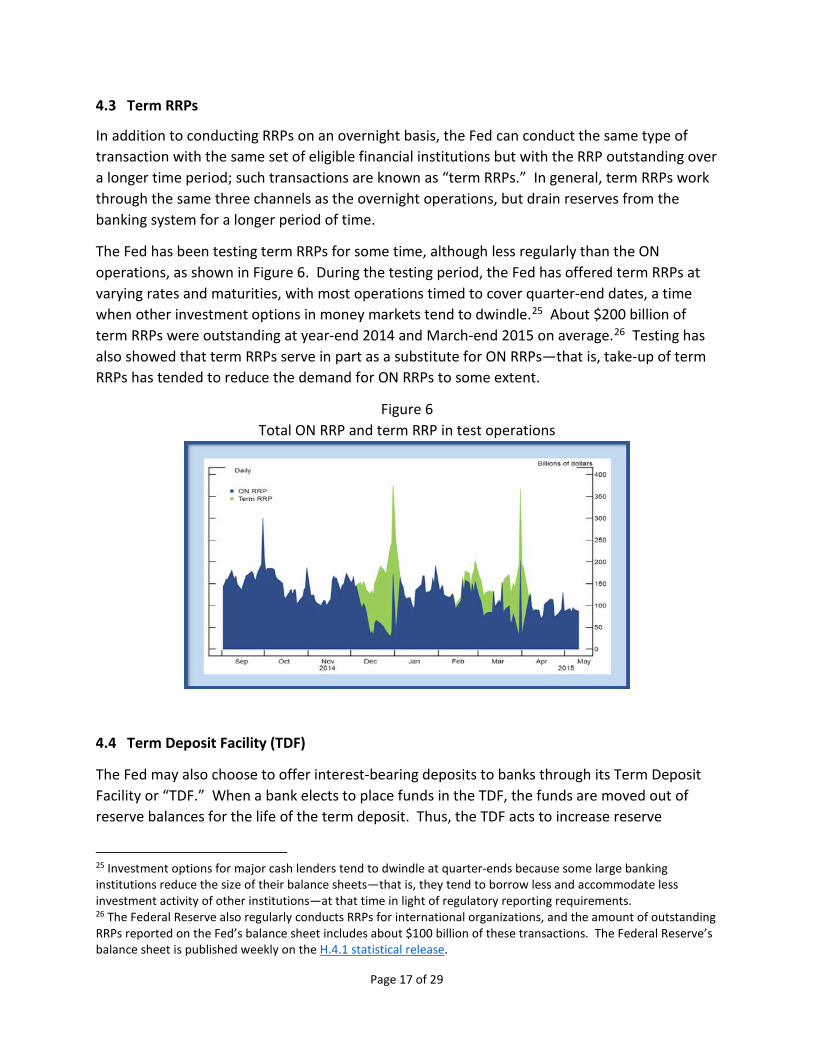
The Fed has been testing term RRPs for some time, although less regularly than the ON operations, as shown in Figure 6. During the testing period, the Fed has offered term RRPs at varying rates and maturities, with most operations timed to cover quarter-end dates, a time when other investment options in money markets tend to dwindle.25 About $200 billion of term RRPs were outstanding at year-end 2014 and March-end 2015 on average.26 Testing has also showed that term RRPs serve in part as a substitute for ON RRPs—that is, take-up of term RRPs has tended to reduce the demand for ON RRPs to some extent.
Figure 6 Total ON RRP and term RRP in test operations
4.4 Term Deposit Facility (TDF)
The Fed may also choose to offer interest-bearing deposits to banks through its Term Deposit Facility or “TDF.” When a bank elects to place funds in the TDF, the funds are moved out of reserve balances for the life of the term deposit. Thus, the TDF acts to increase reserve
25 Investment options for major cash lenders tend to dwindle at quarter-ends because some large banking institutions reduce the size of their balance sheets—that is, they tend to borrow less and accommodate less investment activity of other institutions—at that time in light of regulatory reporting requirements. 26 The Federal Reserve also regularly conducts RRPs for international organizations, and the amount of outstanding RRPs reported on the Fed’s balance sheet includes about $100 billion of these transactions. The Federal Reserve’s balance sheet is published weekly on the H.4.1 statistical release.
Page 17 of 29

scarcity. The TDF also encourages arbitrage as banks compare the yield the Fed offers on a term deposit with other investments of a similar term.
The Fed has been testing the functionality of the TDF since June 2010. During these operational tests, two types of term deposit operations have been conducted. In the first type, the Fed offers a given dollar amount of term deposits; banks then bid for the size of the deposit they want and specify the interest rate on the deposit. The Fed accepts bids beginning with the lowest bid rate and proceeding to higher bid rates until the total offered amount is exhausted. When this type of term deposit operation is conducted, all banks receive an interest rate that is identical to the rate paid to the last bank whose bid was accepted—that is, all banks receive the highest bid rate. In the second type of term deposit operation, the Fed sets an offering rate and allows banks to deposit the amount of funds they desire, up to a predetermined maximum.
In its test operations, the Fed has varied some features, including the length of the term, the offering rate, and whether banks are permitted to withdraw their deposits prior to the end of the term, subject to a penalty.27 The latter feature has proven to be particularly attractive to banks in making their cash management decisions. During testing in February 2015, term deposits outstanding grew to about $400 billion on the Fed’s balance sheet.
4.5 Reduce the Fed’s securities holdings
As noted above, the Federal Reserve purchased large quantities of securities during its large-scale asset purchase programs and it has been reinvesting any maturing or prepaying securities in order to maintain its holdings of longer-term securities at sizable levels and help maintain accommodative financial conditions. The FOMC has said that, at some point after it begins to increase the target range for the federal funds rate, it will reduce the Federal Reserve's securities holdings in a gradual and predictable manner, primarily by ceasing to reinvest repayments of principal on securities held by the Federal Reserve.
Ending reinvestments would cause the Fed’s holdings of securities to decline when either a Treasury security matures or an agency MBS prepays. The pace at which this would occur is driven in part by the maturity dates of the Fed’s holdings of Treasury and agency securities, which are known for certain, and also by the pace at which agency MBS might prepay, which can only be estimated. Prepayment of agency MBS occurs, for example, when households pay off some or all of a mortgage balance early because they refinance their original mortgage with a lower available mortgage rate, pay off their mortgage in full when they sell a house to move, or pay down a portion of their mortgage to reduce the level of their debt.
As discussed below in Box 4, the Fed’s securities holdings could decline noticeably once the FOMC decides to end reinvestments. Doing so would naturally shift the reserve supply curve
27 Results of all term deposit operations can be found on the Federal Reserve Board’s website.
Page 18 of 29

gradually to the left, increasing reserve scarcity. Of course, it would take a number of years for the quantity of securities to decline sufficiently to create a meaningful inward shift in the supply curve—that is, one that would be effective in helping to put upward pressure on the federal funds rate.
Box 4: What would stopping reinvestments imply for the Fed’s securities holdings?
As of late December 2014, the Federal Reserve held a total of $4.2 trillion of securities, of which about $2.5 trillion were Treasury securities, $1.7 trillion were agency MBS, and about $39 billion were agency debt. The Federal Reserve Bank of New York regularly reports details regarding the Fed’s securities portfolio, including the Committee on Uniform Securities Identification Procedures (CUSIP) number of each Treasury security and agency MBS the Fed holds in its portfolio.28
If the FOMC were to end its policy of reinvesting its securities holdings at some point over the near term, the Fed’s holdings of securities would decline noticeably. As shown in the table below, nearly $700 billion of securities would mature or roll off of the Fed’s portfolio in 2016 and 2017 taken together, comprised of about $410 billion of Treasury securities and an estimated $285 billion of agency MBS.
Absent reinvestment, how many securities would mature or roll off in 2016-17? (billions of dollars)
Date Treasury securities Agency MBS* Total
2016: H1 129 85 214
2016: H2 86 75 161
2017: H1 103 65 168
2017: H2 91 60 151
Cumulative 409 285 694
* Using actual holdings of securities as of December 24, 2014, and projected agency MBS prepayments based on the model in Carpenter et al. (2015) along with Blue Chip interest rate projections at that time.
The Fed could also sell securities in order to reduce its holdings, which would cause reserve balances to decline commensurately. However, the FOMC has indicated that it will raise interest rates by taking actions to move the federal funds rate into the new target range rather than through actions to adjust the size or composition of the Fed’s balance sheet. In particular, in section 5 we discuss why securities sales are not a feature of the FOMC’s chosen approach.
28 These details may be found on the Federal Reserve Bank of New York’s website.
Page 19 of 29

4.6 Reserve requirements
In the past, the Federal Reserve has adjusted reserve requirements infrequently and not used them as an active tool in monetary policy implementation.29 Although the FOMC has not indicated that it is considering adjusting reserve requirements when it raises short-term interest rates, we nonetheless include this tool here for completeness. As was discussed above in Box 1, reserve requirements are calculated as fractions of certain deposit account levels, and have traditionally helped to create demand for reserve balances. These reserve ratios are re-evaluated annually, although they have not been adjusted since 1992. In theory at least, the Fed could increase existing reserve ratios in order to require that additional reserve balances be held by banks, thereby contributing to the scarcity of excess reserve balances.30
5 What is the FOMC’s preferred approach for policy “normalization”?
Recall that before the financial crisis, the Fed’s approach to implementing monetary policy relied on the reserve scarcity channel: Given banks’ demand for reserves balances and the relatively low quantity of reserves in the banking system, the Fed could make small adjustments to the aggregate supply of reserves using OMOs in order to cause the supply of reserves to intersect banks’ demand curve at the FOMC’s target federal funds rate. And recall that with the superabundant level of reserve balances in the banking system that exists today, the Fed cannot rely on the reserve scarcity channel to influence the level of short-term interest rates when it begins to raise the target range for the federal funds rate. So, how will the Fed tighten monetary policy going forward?
Returning to panel (b) of Figure 5, in theory the Fed could take steps to shift the supply of reserve balances left until it intersects the downward-sloping portion of the demand curve again—that is, return the banking system to a position of sufficient reserve scarcity. But that would require the Fed either to rely on sizable operations through its ON RRP facility for an extended period, run very significant term RRP and TDF operations, sell a substantial quantity of its securities holdings, or undertake all of these activities in some combination. Instead, the FOMC has chosen an approach to implementing monetary policy that relies primarily on the other two key channels of influence on interest rates that we discussed—that is, it plans to use its policy tools both to encourage arbitrage and to increase its scope of influence in short-term money markets.
Many readers might ask, why doesn’t the Fed reverse course? That is, why doesn’t the Fed sell securities in order to shrink the supply of reserve balances substantially so as to permit the Fed
29 Like the Federal Reserve, the European Central Bank and the Bank of Japan also impose reserve requirements but do not use them as an active tool of monetary policy. 30 The Fed may also, after consulting Congress, impose so-called emergency reserve requirements if it finds that extraordinary circumstances require such action, a step that the Fed has never before taken. Authorization for emergency reserve requirements is given in Section 204.5 of the Federal Reserve Board’s Regulation D.
Page 20 of 29

to implement monetary policy as it did before the financial crisis? As noted above, the FOMC has indicated that when it begins to remove policy accommodation, it prefers to target the federal funds rate, as it did prior to the financial crisis, instead of affecting longer-term interest rates by actively managing the size and composition of its balance sheet. This judgment reflects a couple of considerations. First, it would take some time to sell a large fraction of the Fed’s securities holdings and so such a tactic is not sufficiently nimble. For example, if the chosen pace of the Committee’s securities purchases under its LSAPs programs is any guide, it would take a number of years to sell a sufficient quantity of securities so as to cause a meaningful inward shift in the reserves supply curve. Moreover, such sales might bring about unwanted effects in financial markets—for instance, the upward pressure on market interest rates that would accompany sizable sales of the Fed’s holdings of securities could be hard to gauge and control. And second, monetary policy around the globe has generally been implemented in short-term financial markets. For example, the FOMC has many years of experience affecting conditions in the federal funds market, an overnight market, and prefers to continue to implement its policy through this market even while its balance sheet is large.
The FOMC has formulated and issued plans regarding the approach it intends to take when it decides that the time has come to begin raising short-term interest rates, one part of a process that it refers to as policy “normalization.”31 When the FOMC decides that economic conditions warrant the commencement of the policy normalization process, it will tighten the stance of monetary policy by adjusting the target range for the federal funds rate, a step that some have nicknamed interest rate “liftoff.” Framing the stance of policy in terms of the federal funds rate focuses the Committee’s monetary policy communications on an interest rate that is familiar to the public. The FOMC has also indicated that it plans to continue to set a target range for the federal funds rate that is 25 basis points wide, something it has been doing since December 2008. Continuing to maintain a target range for the federal funds rate will be an effective way for the Fed to communicate its policy stance and is consistent with the FOMC’s approach in recent years. Targeting a particular level of the federal funds rate, something the FOMC did before the financial crisis, would likely not convey very much more information about the Committee’s intentions for the general level of short-term interest rates so long as the quantity of reserve balances remains highly elevated.
The primary policy tool that the FOMC will use to move the federal funds rate into its new target range is the IOER rate; at liftoff, the IOER rate will be set to the top of the new federal funds target range. As described above, increases in the IOER rate will help to pull the federal funds rate and other short-term market interest rates into the target range via arbitrage.
The FOMC will also use an ON RRP facility as a supplementary tool to help to push money market interest rates up from below both by encouraging arbitrage and by having an increased
31 See the Policy Normalization Principles and Plans that were issued following the September 2014 FOMC meeting and augmented in the minutes of the March 2015 FOMC meeting. Potter (2015) provides an explanation for how policy normalization will be implemented.
Page 21 of 29
scope of influence in money markets (remember that the Fed can undertake its ON RRP operations with a different set of financial institutions than are eligible to earn the IOER rate). The Fed will offer the ON RRP rate on its daily operations; at liftoff, the ON RRP rate will be set to the bottom of the new target range.
The Fed will also need to set an offering amount of ON RRPs. The appropriate size of the ON RRP facility has been an important consideration of the FOMC. The FOMC has discussed the concern that a large and persistent ON RRP program could permanently alter patterns of borrowing and lending in those markets—a concern the FOMC has referred to as increasing the Federal Reserve’s role or size of its “footprint” in money markets. In addition, in times of stress in financial markets, demand for a safe and liquid central bank asset might increase sharply, potentially causing or exacerbating disruptions in the availability of funds to other participants in money markets. To mitigate these two concerns, the FOMC has agreed that it will use an ON RRP facility only to the extent necessary and will phase the facility out when it is no longer needed.32 Nonetheless, balancing the need for keeping control over short-term interest rates against the risks associated with a large ON RRP facility, the FOMC has determined that when policy normalization commences, the aggregate amount offered through its ON RRP facility will be temporarily elevated in order to help move the federal funds rate into its new target range. The Committee has also said that it expects that it will be appropriate to reduce the capacity of the facility fairly soon after it begins raising interest rates.33
With a target range of 25 basis points and the IOER rate set to the top of that range and the ON RRP rate to the bottom, there will be a 25-basis-point spread between these two administered overnight rates at liftoff. A spread of this size is expected to be narrow enough to allow sufficient control over short-term market interest rates but wide enough to keep the ON RRP facility from becoming so attractive that its potential size invokes concerns about the size of the Fed’s footprint in money markets or poses risks to financial stability.
Figure 7 illustrates how this will work. The region on the left represents the position of the target range for the federal funds rate and the Fed’s two overnight administered rates as they are set today, prior to liftoff, with a target range of 0 to 25 basis points (the shaded region), the IOER rate at 25 basis points (the green line), and the ON RRP rate at 5 basis points (the red line). Assuming, as depicted in the region to the right, that the new target range that is likely to prevail when the FOMC decides to commence policy normalization is 25 to 50 basis points, the IOER and ON RRP rates would be increased to 50 basis points and 25 basis points, respectively. The increases in these two administered rates will act to move the market federal funds rate and other short-term market interest rates up. So when it comes time to raise interest rates for
32 Details of the FOMC’s discussion of the footprint and financial stability issues associated with an ON RRP facility are available in the minutes of the FOMC’s April 2014, June 2014, and July 2014 meetings. For further analysis of these issues, see Frost et al. (2015). 33 See the minutes of the FOMC’s March 2015 meeting for a discussion of the options the FOMC considered for setting the aggregate size of the ON RRP facility in the early stages of the policy normalization process.
Page 22 of 29
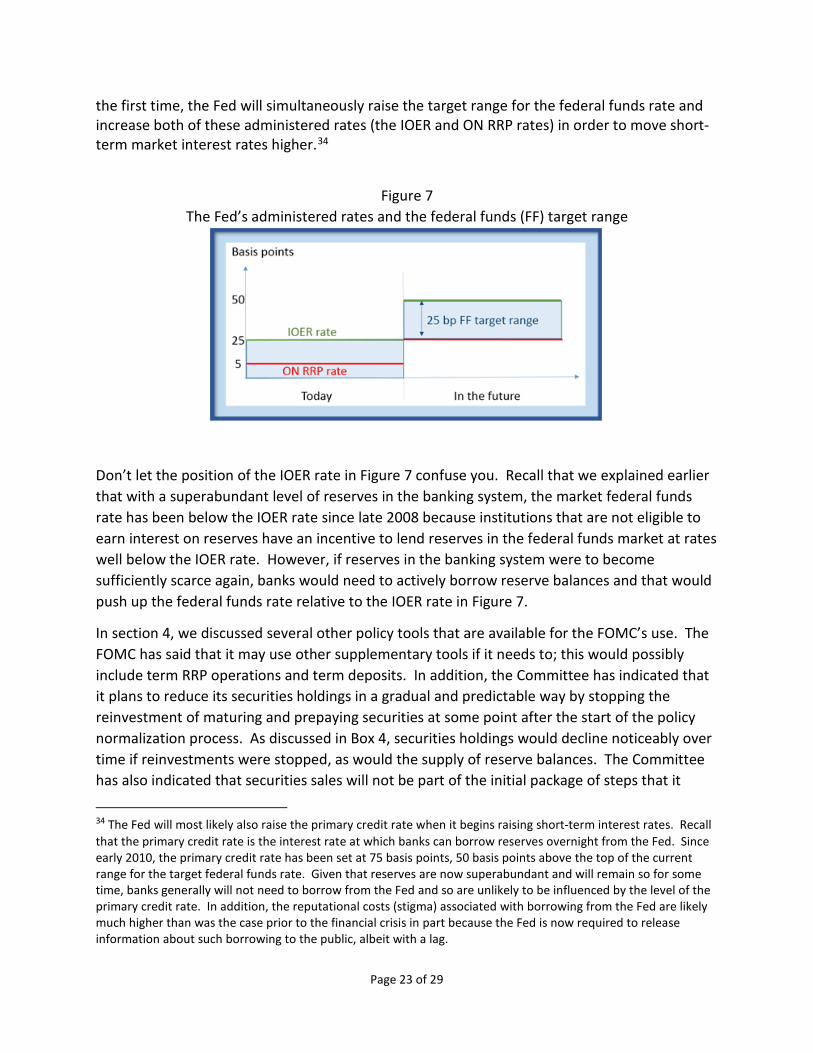
the first time, the Fed will simultaneously raise the target range for the federal funds rate and increase both of these administered rates (the IOER and ON RRP rates) in order to move short-term market interest rates higher.34
Figure 7 The Fed’s administered rates and the federal funds (FF) target range
Don’t let the position of the IOER rate in Figure 7 confuse you. Recall that we explained earlier that with a superabundant level of reserves in the banking system, the market federal funds rate has been below the IOER rate since late 2008 because institutions that are not eligible to earn interest on reserves have an incentive to lend reserves in the federal funds market at rates well below the IOER rate. However, if reserves in the banking system were to become sufficiently scarce again, banks would need to actively borrow reserve balances and that would push up the federal funds rate relative to the IOER rate in Figure 7.
In section 4, we discussed several other policy tools that are available for the FOMC’s use. The FOMC has said that it may use other supplementary tools if it needs to; this would possibly include term RRP operations and term deposits. In addition, the Committee has indicated that it plans to reduce its securities holdings in a gradual and predictable way by stopping the reinvestment of maturing and prepaying securities at some point after the start of the policy normalization process. As discussed in Box 4, securities holdings would decline noticeably over time if reinvestments were stopped, as would the supply of reserve balances. The Committee has also indicated that securities sales will not be part of the initial package of steps that it
34 The Fed will most likely also raise the primary credit rate when it begins raising short-term interest rates. Recall that the primary credit rate is the interest rate at which banks can borrow reserves overnight from the Fed. Since early 2010, the primary credit rate has been set at 75 basis points, 50 basis points above the top of the current range for the target federal funds rate. Given that reserves are now superabundant and will remain so for some time, banks generally will not need to borrow from the Fed and so are unlikely to be influenced by the level of the primary credit rate. In addition, the reputational costs (stigma) associated with borrowing from the Fed are likely much higher than was the case prior to the financial crisis in part because the Fed is now required to release information about such borrowing to the public, albeit with a lag.
Page 23 of 29

intends to take to begin to raise interest rates, and that it does not anticipate selling agency MBS as part of the policy normalization process although limited sales might be warranted in the longer run to reduce or eliminate residual holdings. The Committee has emphasized that the timing and pace of any securities sales would be communicated to the public in advance.
Of course, economic and financial developments will continue to evolve, both leading up to the first increase in the target range for the federal funds rate and as the policy normalization process progresses, and the Committee has said that it is prepared to adjust the details of its approach in light of such developments. 6 Conclusion Over the past seven years, the Federal Reserve has taken steps to counteract a financial crisis and move the economy out of a protracted recession and back toward maximum employment and price stability. The steps have included keeping the federal funds rate near zero since December 2008 and purchasing securities in the open market to put downward pressure on longer-term interest rates. These purchases resulted in a superabundant level of reserve balances in the banking system. In this paper, we discussed why the traditional approach to raising the federal funds rate, which was used for many years prior to the financial crisis, will not work in the current environment. We described the toolkit available to Federal Reserve policymakers and reviewed the Committee’s preferred approach to raising the federal funds rate. Testing of the policy tools suggests that the proposed approach should work well. Of course, after policymakers decide that the time has come to begin raising short-term interest rates, they will be vigilant in using their available tools to adjust their approach, as needed, to ensure appropriate control over the federal funds rate and other short-term interest rates.
Page 24 of 29

Other References
Seth B. Carpenter, Jane E. Ihrig, Elizabeth C. Klee, Daniel W. Quinn, and Alexander H. Boote (2015), “The Federal Reserve's Balance Sheet and Earnings: A Primer and Projections,” International Journal of Central Banking, March, pp. 237-283. Adam Copeland, Darrell Duffie, Antoine Martin, and Susan McLaughlin (2012), “Key Mechanics of the U.S. Tri-Party Repo Market,” Economic Policy Review 18:3, Federal Reserve Bank of New York, pp. 17-28. Josh Frost, Lorie Logan, Antoine Martin, Patrick McCabe, Fabio Natalucci, and Julie Remache (2015), “Overnight RRP Operations as a Monetary Policy Tool: Some Design Considerations,” Finance and Economics Discussion Series 2015-010. Washington: Board of Governors of the Federal Reserve System, http://dx.doi.org/10.17016/FEDS.2015.010
Marvin Goodfriend (2015), “The Fed Should Fix the Interest on Reserves Floor,” prepared for the Shadow Open Market Committee Meeting, March, http://shadowfed.org/wp-content/uploads/2015/03/GoodfriendSOMC-March2015.pdf. Ruth A. Judson and Elizabeth Klee (2010), “Whither the liquidity effect: The impact of Federal Reserve open market operations in recent years,” Journal of Macroeconomics 32:3, pp. 713-731.
Simon Potter (2015), “Money Markets and Monetary Policy Normalization,” remarks to the Money Marketeers, New York University, April 15. http://www.ny.frb.org/newsevents/speeches/2015/pot150415.html Purposes & Functions (2005), Board of Governors of the Federal Reserve System, Washington DC, 9th edition, http://www.federalreserve.gov/pf/pf.htm.
Page 25 of 29

Appendix
How do the Fed’s operations affect the balance sheets of the Fed, banks, and nonbanks?
A fundamental feature of U.S. monetary policy implementation is the way in which the Federal Reserve’s operations—such as securities purchases, ON RRP transactions, and term deposits—affect the balance sheets of not only the Fed, but also its key financial counterparties: banks and nonbanks. The Fed’s balance sheet is reported to the public weekly on the H.4.1 statistical release.35 The balance sheets of banks and nonbanks tend to be reported less frequently, typically at quarter ends. This appendix uses an accounting framework to walk through how the Fed’s interactions with the private sector affect the balance sheets of the entities involved.
A.1 Federal Reserve securities purchases
The effects of Federal Reserve securities purchases are illustrated in Figures A1 and A2, which display simplified balance sheets for a financial nonbank entity, a bank, and the Federal Reserve. In the initial time period (Figure A1), a nonbank entity holds securities (SN) and deposits (DN) on the asset side of its balance sheet, with liabilities (LN) and equity (EN) counterbalancing. The bank holds securities (SB), loans (LNB), and reserves balances at the Fed (R) as assets, counterbalanced with deposits (DB) and equity (EB). The Federal Reserve’s key asset is securities (SF), main liabilities are reserves (R) and currency (C), and it holds capital (K).
Figure A1: Initial balance sheets
The shaded items in Figure A2 highlight the balance sheet effects of $1 worth of securities purchases by the Federal Reserve from a nonbank entity. The nonbank entity sells a security (SN ➜ SN – $1) and, in the course of clearing and settling that transaction through the banking sector, receives deposits in return (DN ➜ DN + $1). As the bank is the intermediary for the
35 The H.4.1 statistical release may be found on the Federal Reserve Board’s website.
L + E A L + K
LNB C EB EN
R
L + E A
SN LN
A
SB DB SF R
DN
K
A = assets; L = liabilities; E = equity; K = capital; S = securities; D = deposits; LN = loans; R = reserves; C = currency
Nonbank entity Bank Federal Reserve
Page 26 of 29

transaction, it receives payment in its reserve account (R ➜ R + $1) from the Fed, and then credits this payment to the nonbank’s deposit account (DB ➜ DB + $1). That increase in deposits in the account that the nonbank holds at the bank is realized on the liability side of the bank’s balance sheet. Meanwhile, the Federal Reserve ends up with the desired additional securities on its balance sheet (SF ➜ SF + $1) and a larger reserves liability (R ➜ R + $1).
Figure A2: Balance sheets following Federal Reserve securities purchase
Note that while an individual bank may take steps to reduce its reserve balances, the aggregate quantity of reserves in the banking system generally cannot be reduced without further actions by the Federal Reserve.36 For example, a bank can sell reserves to another bank in the federal funds market and reduce its own holdings of such balances, but this activity leaves reserve balances unchanged in total. Or a bank could reduce the rate of interest that it pays on deposits with the aim of causing depositors to withdraw some of their deposits, a step that would, all else equal, cause the bank’s reserve balances to decline to the same extent. However, these depositors would most likely shift their funds to another bank (instead of holding cash) and that bank’s reserve balances would then increase. Again, total reserve balances in the banking system would be unchanged.
A.2 Federal Reserve ON RRP operations
The shaded items in Figure A3 highlight the effects of an ON RRP operation conducted by the Fed on the same three balance sheets. Most ON RRPs are conducted with nonbank counterparties, such as money market funds, and we illustrate this case. Figure A1 again represents the initial time period, before the ON RRP operation is conducted. The shaded items in Figure A3 illustrate the balance sheet effects of $1 worth of ON RRPs conducted by the Fed with a nonbank entity. The nonbank counterparty increases its RRPs holdings (RRPN ➜ RRPN +
36 A bank could reduce its reserve balances by paying down loans from the Federal Reserve.
L + E A L + K
LNB C EB EN
R + $1
L + E A
SN - $1 LN
A
SB DB + $1 SF + $1 R + $1
DN + $1
K
A = assets; L = liabilities; E = equity; K = capital; S = securities; D = deposits; LN = loans; R = reserves; C = currency
Nonbank entity Bank Federal Reserve
Page 27 of 29
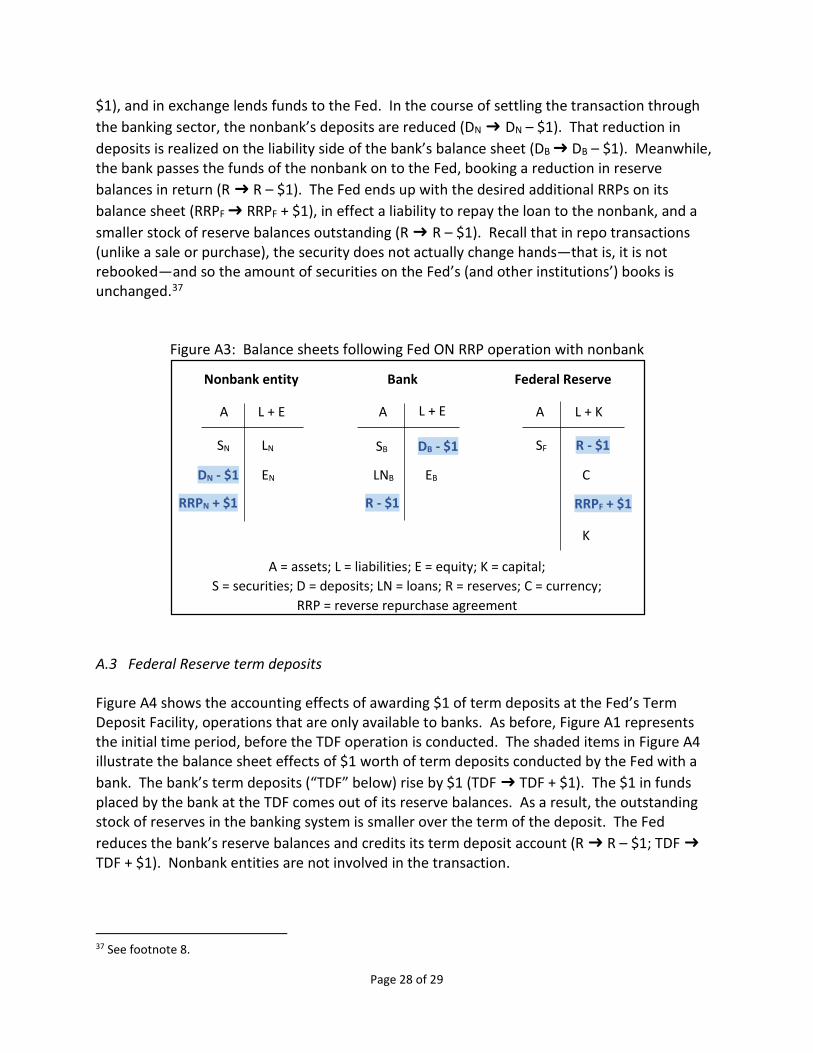
$1), and in exchange lends funds to the Fed. In the course of settling the transaction through the banking sector, the nonbank’s deposits are reduced (DN ➜ DN – $1). That reduction in deposits is realized on the liability side of the bank’s balance sheet (DB ➜ DB – $1). Meanwhile, the bank passes the funds of the nonbank on to the Fed, booking a reduction in reserve balances in return (R ➜ R – $1). The Fed ends up with the desired additional RRPs on its balance sheet (RRPF ➜ RRPF + $1), in effect a liability to repay the loan to the nonbank, and a smaller stock of reserve balances outstanding (R ➜ R – $1). Recall that in repo transactions (unlike a sale or purchase), the security does not actually change hands—that is, it is not rebooked—and so the amount of securities on the Fed’s (and other institutions’) books is unchanged.37
Figure A3: Balance sheets following Fed ON RRP operation with nonbank
A.3 Federal Reserve term deposits
Figure A4 shows the accounting effects of awarding $1 of term deposits at the Fed’s Term Deposit Facility, operations that are only available to banks. As before, Figure A1 represents the initial time period, before the TDF operation is conducted. The shaded items in Figure A4 illustrate the balance sheet effects of $1 worth of term deposits conducted by the Fed with a bank. The bank’s term deposits (“TDF” below) rise by $1 (TDF ➜ TDF + $1). The $1 in funds placed by the bank at the TDF comes out of its reserve balances. As a result, the outstanding stock of reserves in the banking system is smaller over the term of the deposit. The Fed reduces the bank’s reserve balances and credits its term deposit account (R ➜ R – $1; TDF ➜ TDF + $1). Nonbank entities are not involved in the transaction.
37 See footnote 8.
L + E A L + K
LNB C EB EN
R - $1
L + E A
SN LN
A
SB DB - $1 SF R - $1
DN - $1
K
A = assets; L = liabilities; E = equity; K = capital; S = securities; D = deposits; LN = loans; R = reserves; C = currency;
RRP = reverse repurchase agreement
Nonbank entity Bank Federal Reserve
RRPF + $1 RRPN + $1
Page 28 of 29

Figure A4: Balance sheets following Federal Reserve TDF
L + E A L + K
LNB C EB EN
R - $1
L + E A
SN LN
A
SB DB SF R - $1
DN
K
A = assets; L = liabilities; E = equity; K = capital; S = securities; D = deposits; LN = loans; R = reserves; C = currency;
TDF = Term Deposit Facility
Nonbank entity Bank Federal Reserve
TDF + $1
TDF + $1
Page 29 of 29