mondi groupmondi group results for the · pdf fileresults for the year ended 31 december...
TRANSCRIPT

MONDI GROUPMONDI GROUPRESULTS FOR THE YEAR ENDED31 DECEMBER 201131 DECEMBER 2011
23 February 2012

Agenda
Hi hli htHighlights
Financial overview
Operational review
Capital allocationCapital allocation
Summary
Appendices
Page 2

Highlights
€622m EBIT margin % Record financial performanceUnderlying operating profit up 36%
1
Underlying operating profit
H2€502m
€441m
€294m
€458m
10.8%
Underlying operating profit up 36%
Earnings per share – alternative measure up 57%
Return on capital employed of 15%
1
H1
8.0% 7.0%
5.6%
8.2% p p y
Excellent cash generationNet debt down 39% to €831 million
2007 2008 2009 2010 2011 Free cash flow of 72 cents per share, up 72%
Significant contribution from Syktyvkar & Ś i i i t t
Underlying earnings
H2€241m €206
€340m
71.8 Cents per share
Świecie investments
Successful demerger of Mpact
I d di i
1
1
H1
€172m
€95m
€206m
46.9
33.9
45.6
Investment grade credit ratings
Proposed full year dividend of 26 euro cents per ordinary share, up 30%
2007 2008 2009 2010 2011
18.7 per ordinary share, up 30%
Page 3
Record results on strong operational performance1 From continuing operations, therefore excluding Mpact.

Agenda
Hi hli htHighlights
Financial overview
Operational review
Capital allocationCapital allocation
Summary
Appendices
Page 4

Basis of preparation
Income statement
2010 comparative figures restated to reflect continuing operations
Mpact (including gain on disposal) reflected as a discontinued operation
Statement of financial position
Mpact is included in the 2010 figuresp g
Statement of cash flows
Incl des Mpact cash flo s ntil date of demergerIncludes Mpact cash flows until date of demerger
EPS alternative measure
Adjusted to exclude Mpact earnings
Number of shares adjusted for effect of share consolidation
Reflects business of continuing operations of Mondi Group on a like for like basis
Page 5

Operating financial highlights
€ millions 2010 2011 % Ch
H22010
H12011
H22011Change 2010 2011 2011
Group revenue 5,610 5,739 2% 2,858 2,942 2,797
EBITDA 798 964 21% 427 526 438 % Margin 14.2% 16.8% 14.9% 17.9% 15.7%
Underlying operating profit 458 622 36% 254 354 268
1
2Underlying operating profit 458 622 36% 254 354 268 % Margin 8.2% 10.8% 8.9% 12.0% 9.6%
Basic earnings per share (€ cents) - alternative measure 45.6 71.8 57% 25.4 41.7 30.1
Working capital cashflows (121) (68) 44% 20 (143) 75
Cash generated from operations 778 917 18% 509 403 514 g p
Net debt (1,364) (831) 39% (1,364) (1,200) (831)
Group ROCE 12 3% 15 0% 22% 12 3% 15 2% 15 0%3Group ROCE 12.3% 15.0% 22% 12.3% 15.2% 15.0%
Page 6
Record financial performance1 EBITDA is operating profit of subsidiaries and joint ventures before special items, depreciation and amortisation, excluding Mpact. 2 Underlying operating profit is operating profit from continuing operations before special items. 3 Group return on capital employed (ROCE) is an annualised measure based on underlying operating profit plus share of associates net earnings divided by average trading capital employed before impairments and adjusted for major capital projects not yet commissioned.

Divisional underlying operating profit1
Underlying operating profit
118
128
120
140
98
81
105
87
100 100
H1 2010
H2 2010
H1 2011
55
81
71
78 73
60
80
€millions
H1 2011
H2 2011
48 46
27
35 40
€
18
1 (5) (5) (13)0
20
(20)
Uncoated Fine Paper Corrugated Bags & Coatings South Africa division Newsprint
Page 7
All major European businesses contributing meaningfully1 Underlying operating profit is operating profit of subsidiaries and joint ventures before special items.

Input costs
4 500
Variable costs Recovered paper2
160
180
3 000
3 500
4 000
n 80
100
120
140
160
/ ton
ne
1 000
1 500
2 000
2 500
€m
illion
0
20
40
60
€
2007 2008 2009 2010 2011
500
1 000
2008 2009 2010 2011 700
Chemical prices3
2007 2008 2009 2010 2011
Wood Recovered paperEnergy Other variable costsVariable selling expenses PaperPulp Merchandise
1
400
500
600
/ ton
ne
Average fibre input costs increasedWood prices up around 10% on averageAverage recycled fibre prices up over 28%
200
300
€
Chlor-Alkaline Bleaching chemicals200920082007 2010 2011
Increased pulp self-sufficiency in Syktyvkar offset increased wood costs
Merchant volumes removed with disposal of Europapier in prior period
Chlor-Alkaline Bleaching chemicals
Page 8
Increased pulp self-sufficiency improves cost position1 Other variable costs consist mainly of 70% Chemical costs and 15% Packaging costs.2 Source - PIX statistics for "OCC 1.04 dd “ 3 Source - Harriman reports

Fixed costs
2 500€ million
Fixed costs as % of revenue Fixed costs composition
2 000
2 500
20%
25%
1 000
1 500
25.3% 26.1% 23.4% 22 1%
15%
500
1 000 22.1%
5%
10%
0 2008 2009 2010 2011
Personnel costs Maintenance and th i di t t
0%2008 2009 2010 2011
Fixed costs excl. depreciation
Continued focus on cost management
other indirect costsOther net operating expenses Depreciation and amortisation
Fixed costs excl. depreciation
Ongoing improvement in fixed cost recovery
Page 9
Focused cost management delivers further results

Financial review
€ millions 2010 2011 % Change
H22010
H12011
H22011
1Underlying operating profit 458 622 36% 254 354 268
Net finance costs (106) (111) (5%) (64) (60) (51)( ) ( ) ( ) ( ) ( ) ( )
Associate net earnings 2 1 (50%) - 2 (1)
Underlying profit before tax 354 512 45% 190 296 216Underlying profit before tax 354 512 45% 190 296 216
Tax before special items (88) (102) (16%) (42) (59) (43)
Total non-controlling interest (61) (70) (15%) (34) (42) (28)
Underlying earnings from continuing operations 205 340 66% 114 195 145
Special items (after tax and minorities) (15) (53) (>100%) (22) 4 (57)
Profit from discontinued operation - Mpact 34 43 26% 23 13 30
Reported profit after tax and minority interests for total operations
224 330 47% 115 212 118
Page 10
Record bottom line profit1 Underlying operating profit is operating profit from continuing operations before special items.

Finance charges
€ millions 2010 2011 % Change
H22010
H12011
H22011
Net debt (1,364) (831) 39% (1,364) (1,200) (831)
Total investment income (31) (30) (3%) (17) (15) (15)( ) ( ) ( ) ( ) ( ) ( )Total interest expense 152 141 7% 78 74 67 Interest expense, net of investment income 121 111 8% 61 59 52 Less: interest capitalised (8) - (100%) (1) (1) 1 Net debt finance charges and other financial 113 111 2% 60 58 53Net debt finance charges and other financial 113 111 2% 60 58 53 Foreign currency losses / (gains) (7) - (100%) 4 2 (2)Net finance costs 106 111 (5%) 64 60 51
Net finance charges upLower average net debt, offset by
Effective interest rate (before capitalised interest) 8.0% 8.6% 8.1% 8.3% 9.0%
Lower average net debt, offset byZero capitalised interestForeign exchange effectsMarginally higher effective net interest ratesa g a y g e e ec e e e es a es
85% of Group borrowings are at fixed interest ratesCash interest paid down 9% at €106 million
Page 11
Net finance charges marginally up

Taxation and non-controlling interests
Taxation Non-controlling interestsTaxation Non controlling interests€ millions 2010 2011 %
Change€ millions 2010 2011 %
Change
Underlying tax charge 88 102 (16%)
Tax on special items (6) (2) 67%
Taxation charge 82 100 (22%)
Non-controlling share before special items 62 70 (13%)
Non-controlling share of special items (1) - (100%)
g ( )
Underlying effective tax rate 25% 20%
Cash tax rate 12% 17%
Profit attributable to non-controlling interests 61 70 (15%)
Reduction in effective tax rate before special items to 20%
Strong results across most operations with non-controlling interests (notably Świecieand Ružomberok)
Cash tax rate 12% 17%
Increased profitability in regions with lower tax ratesBenefit from tax incentives mainly in Poland
and Ružomberok)
Page 12
Further reduction in effective tax rate

Special items
Operating items (€54 million loss): Non-operating items (€1 million loss):Operating items (€54 million loss):Uncoated fine paper (€2 million gain)
release of restructuring provisions no longer
Non operating items (€1 million loss):Corrugated (€3 million gain)
finalisation of sale of Frohnleiten and UK required
Bags & Coatings (€23 million loss)
reversal of restructuring provisions no longer
corrugated plants
Bags & Coatings (€4 million loss)
sale of Unterland flexible packagingreversal of restructuring provisions no longer required
Restructuring activities in Coatings & Consumer Packaging
sale of Unterland, flexible packaging business
Consumer Packaging
asset impairments in Kraft paper
Newsprint (€33 million loss)
impairment of Aylesford assets
Page 13
€55 million special items, of which €48 million non-cash

Cash flow
€ millions 2010 2011 % Change
H22010
H12011
H22011
EBITDA (including Mpact) 882 996 13% 477 562 434 Working capital movements (121) (68) 44% 20 (143) 75 Other operating cash flow items 17 (11) (>100) 12 (16) 5
1
Other operating cash flow items 17 (11) (>100) 12 (16) 5Cash generated from operations 778 917 18% 509 403 514 Dividends from financial investments and associates 3 2 (33%) 1 - 2 Taxes paid (47) (85) (81%) (11) (45) (40)Taxes paid (47) (85) (81%) (11) (45) (40)Net cash inflow from operating activities 734 834 14% 499 358 476 Capital expenditure, excl. major projects (234) (231) 1% (141) (109) (122)Investment in forestry assets (46) (42) 9% (25) (23) (19)Investment in forestry assets (46) (42) 9% (25) (23) (19)Proceeds on sale of fixed assets and other items 13 9 (31%) 6 12 (3)
467 570 22% 339 238 332Major expansionary projects' expenditure (160) (32) 80% (68) (18) (14)Major expansionary projects expenditure (160) (32) 80% (68) (18) (14)Acquisitions (2) (14) (>100) (13) (12) (2)Disposals 100 (21) (>100) 36 14 (35)N t h fl ft i ti ti iti 405 503 24% 294 222 281Net cash flow after investing activities 405 503 24% 294 222 281
Page 14
Significant cash generation1 EBITDA is operating profit before special items, depreciation and amortisation, including Mpact up to date of demerger.

Working capital
Working capital cash flows2Working capital management1
17.2% 1,000.0
1,200.0
g pg p g
€248m
14.6%
11.9%
10.0% 10.0% 600.0
800.0
1,000.0
10%
12%€97m
9.9%
200.0
400.0
10%
€27m
2006 2007 2008 2009 2010 2011
-2006 2007 2008 2009 2010 2011
Working Capital
(€82m)(€121m)
(€68m)
g pWorking Capital % of Turnover
Working capital at lower end of target range of 10% to 12% of revenueDecreased demand and selling prices in second halfActive inventory management
Page 15
Working capital management an ongoing focus1 Excluding Mpact in 2011
2 Including Mpact

Capital expenditure
Capital expenditure Cash spend, excluding major
200%
350
400projects and Mpact was 63% of depreciation (2010: 63%)
13 135
189 150%
250
300
ions
25627
179
121 92
68
18 14
100%
150
200€m
illi
114
182 194
116 106 93 141
108 123
18
0%
50%
0
50
100
0%0H1
2007H2
2007H1
2008H2
2008H1
2009H2
2009H1
2010H2
2010H1
2011H2
2011
Capital expenditure, excl. Intangible assets, excl. major projectsMajor projectsDepreciation as % of CAPEX, excl. major projects
Page 16
Capital expenditure down as major projects completed

Debt facilities & net debt
€ millions 2010 2011 % Change
H22010
H12011
H22011
Net debt (1 364) (831) 39% (1 364) (1 200) (831)
Committed facilities 2 889 1 839 (36%) 2 889 1 897 1 839Committed facilities 2 889 1 839 (36%) 2 889 1 897 1 839 Of which undrawn 1 481 889 (40%) 1 481 781 889
Gearing (Net debt / Trading capital employed) 30% 22% 30% 27% 22%
Strong cash flow generation and Mpact demerger effect (€172 million) reduces net debt
Net debt / 12 month trailing EBITDA (times) 1.5 0.8 1.5 1.3 0.8
Strong cash flow generation and Mpact demerger effect (€172 million) reduces net debt
New €750 million 5 year syndicated revolving credit facility to refinance €1.55 billion “demerger” facilityg y
New facilities of €140 million from EIB1 & EBRD2
Average maturity of committed facilities is 4.3 years (2.6 years at 31 December 2010)Average maturity of committed facilities is 4.3 years (2.6 years at 31 December 2010)
Page 17
Robust financial structure1 European Investment Bank
2 European Bank for Reconstruction and Development

Dividends
Final dividend of 17.75 euro cents per Dividends per shareshare recommended (26 euro cents for the year)
Di id d f 2 8 ti26
25
30
p
Dividend cover of 2.8 times
Record date 13 April 2012
23
20 20
25
hare
Payment date 10 May 201215.7
16 5
17.75
12.7 15
r cen
ts p
er s
h
7.3 7.7 8.25
5.0
7.0
16.5 9.5
5
10 Eur
2.5 3.5
-
5
2007 2008 2009 2010 2011
Interim Dividend Final Dividend
Page 18
Full year dividend up 30%

Agenda
Hi hli htHighlights
Financial overview
Operational review
Capital allocationCapital allocation
Summary
Appendices
Page 19

Uncoated Fine Paper
Continued strong performanceP iti t di i t
Underlying operating profit
Positive trading environmentAnnual production records achievedLow cost baseH2€179m
€205m
14.3%
EBIT margin %
Benefiting from first full year contribution from Syktyvkar mill modernisation
I d t f d t l€99m
€126m €146m
8.1%
10.8% 11.8%
%
Industry fundamentalsDemand
Structural decline in Western Europe, continued h i E E
H15.9%
growth in Eastern Europe
SupplyIndustry rationalisation continuing
2007 2008 2009 2010 2011
Closures announced amounting to approximately 700kt (± 7% of European capacity)
Page 20
Delivering strongly

Uncoated Fine Paper –Performance vs IndustryPerformance vs Industry
Mondi and Industry sales volume growth in Mondi’s ROCE (%) Uncoated fine paperMondi and Industry sales volume growth in 2011 vs 2007 and 2010 (%)
2
11
Mondi’s ROCE (%), Uncoated fine paper price (EUR/tonne)
1%2%
11 vs 07 11 vs 10
H201
880
900 25%
€/tonne % ROCE
1%
-2%
8 2%
11.4%
14.5%16.9% 16.7%
780
800
820
840
860
10%
15%
20%
-11%
8.2%
700
720
740
760
0%
5%
2007 2008 2009 2010 2011Industry MondiMondiIndustry 2007 2008 2009 2010 2011
Annual ROCE A4 B-copy
Page 21Source: PIX – FOEX Indexes Ltd, Euro-Graph UFP deliveries to Europe and overseas, Pyrbelisk and Mondi estimates. Mondi UFP sales exclude SA and Hadera volumes and include Szolnok volumes.
Benefiting from exposure to higher growth geographies

Corrugated
Continued improvement in performanceImproved trading conditions, although
€178m EBIT margin %
Underlying operating profit
Improved trading conditions, although slow down in demand in H2 2011Converting plants delivered pleasing margin improvement and improved
H2€133m
€119m8.2%
9.6% 12.8%
margin improvement and improved contributionRebuilt Syktyvkar VCB machine H1€49m
€119m 8.2%
3.2%
2.2% contributed stronglyIndustry fundamentals
Demand
€23m
2007 2008 2009 2010 2011Demand
Structural growth
Supply1.41.5
Selling prices - indexed
Announced recycled containerboard net capacity increases of 1.2 million tpa (excluding Russia)2 unchanged
N K ftli it0.9
11.11.21.31.4
No new Kraftliner capacity
0.50.60.70.8
Kraftliner - indexedWhite-top Kraftliner - indexedRCB / Recovered paper differential - indexed
2006 2007 2008 2009 2010 2011
11
1
Page 22
Well invested capital base delivers excellent returns1 Source: PIX – FOEX Indexes Ltd2 Mondi estimates

Corrugated –Performance vs IndustryPerformance vs Industry
VCB Mondi and Industry sales volume Mondi’s ROCE (%), kraftliner price and RB ygrowth in 2011 vs 2007 and 2010 (%) fluting – OCC price differential (EUR/tonne)
11 vs 07 11 vs 10
5%
15.1% 14.9%
18.5%H2
600
700
16%
18%
20%
€/tonne % ROCE
-2%
2%
0%
5 1% 3 6%300
400
500
6%
8%
10%
12%
14%
MondiIndustry
-4%
MondiIndustry
-4%
5.1% 3.6%
100
200
0%
2%
4%
2007 2008 2009 2010 2011yy
Industry incl. Russian market Industry excl. Russian market
Annual ROCE Kraftliner RB Fluting-OCC differential
Page 23Source: PIX – FOEX Indexes Ltd, Cepi VCB deliveries to Europe and overseas, RISI and Mondi estimates.
Benefiting from exposure to higher growth geographies

Bags & CoatingsKraft Paper
20% increase in average selling prices€228m EBIT margin %
Underlying operating profit
g g p
Strong sales volumes in 1st half
Significant downtime in 2nd half – ±10% of annual
H2€154m €159m
€133m Significant downtime in 2 half ±10% of annual capacity
Some price weakness going into 2012H1
€82m 7.6% 7.4%
4.5% 6.0%
9.2%
Industry fundamentals2007 2008 2009 2010 2011
Evidence of destocking coming to an end
No new capacity
Unbleached sack kraft prices
€/to
nne
average
2001 2002 2003 2004 2005 2006 2007 2008 2009 2010 2011
Page 24
Record financial performance, despite challenging 2nd halfSource : Mondi - Nominal prices.

Bags & Coatings (continued)
Industrial BagsM i i t
Sales revenue mix (%)Margin improvements
Selling price increases
More than offsetting higher paper input costsg g p p p
Restructuring following Smurfit Kappa acquisitions delivering positive returns
Coatings & Consumer Packaging61%
39%
Restructuring initiatives completed - delivering improved performance
Some new lines to start up in 2012Some new lines to start-up in 2012
Consumer packaging demand typically stable through down cycles. Strong structural growth.Kraft Paper & Industrial Bags
Coatings & Consumer packagingCoatings demand typically more cyclical, although still overall structural growth
Coatings & Consumer packaging
Page 25
Strong and stable earnings generators

Bags & Coatings –Performance vs IndustryPerformance vs Industry
Sack kraft paper Mondi and Industry sales Mondi’s ROCE (%), sack kraft paper prices
900 0
yvolume growth in 2011 vs 2007 and 2010 (%) (EUR/tonne) and indexed bags price (%)
19.0%
700 0750.0800.0850.0900.0
15.0%
20.0%0.4%
0.0%
-0.2%
11 vs 07 11 vs 10
11.4% 11.1%
7.5%
11.8%
500 0550.0600.0650.0700.0
0 0%
5.0%
10.0%
2011
2010
500.00.0%2007 2008 2009 2010 2011
Annual ROCE Unbleached sack Kraft (€/tonne)
-7.0%
2009
2008
2007
MondiIndustryMondiIndustry
2007
Page 26Source: Mondi nominal indexed prices, Eurokraft sack kraft paper deliveries to Europe and overseas.
Benefiting from leading market position and forward integration
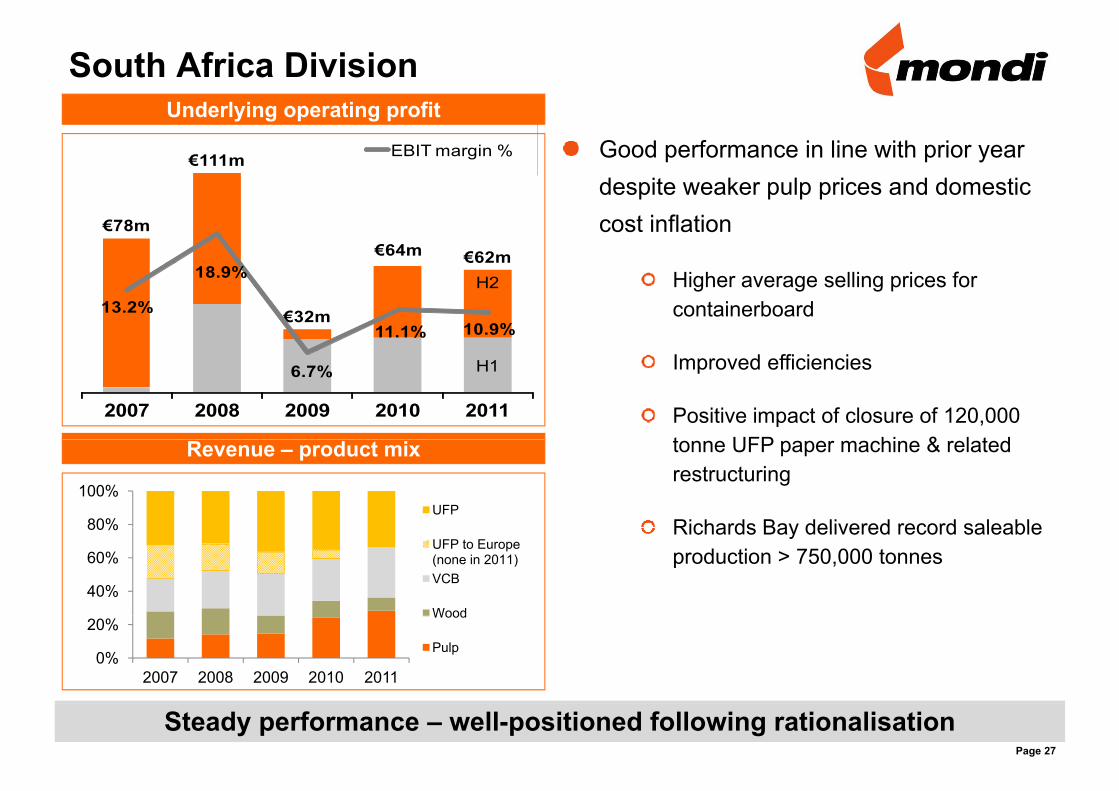
South Africa Division
Good performance in line with prior year €111m EBIT margin %
Underlying operating profit
despite weaker pulp prices and domestic cost inflation€78m
€64m €62m Higher average selling prices for containerboard
H2
€32m 13.2%
18.9%
11.1% 10.9%
Improved efficiencies
Positive impact of closure of 120,000 t UFP hi & l t d
H1
2007 2008 2009 2010 2011
6.7%
tonne UFP paper machine & related restructuring
Richards Bay delivered record saleable80%
100%UFP
Revenue – product mix
Richards Bay delivered record saleable production > 750,000 tonnes
40%
60%
80%UFP to Europe (none in 2011)VCB
Wood
0%
20%
2007 2008 2009 2010 2011
Wood
Pulp
Page 27
Steady performance – well-positioned following rationalisation

Agenda
Hi hli htHighlights
Financial overview
Operational review
Capital allocationCapital allocation
Summary
Appendices
Page 28

Free cash flow priorities
Maintain investment grade credit metrics
1 Selective capital investment opportunities, mainly
around cost optimisation
Support dividends
M&A, if appropriate
2 Increased shareholder distributions
Page 29
Continued disciplined cash flow allocation

Capital investment opportunities
Syktyvkar Bark Boiler & Pulp Dryer
Approved
Syktyvkar Bark Boiler & Pulp Dryer
Świecie Biomass DryerApproved± €170 million investment Stambolijski Steam Turbine & Recovery Boiler Economiser
Two to three years to completion Frantschach Recovery Boiler
ROCE > 40%Richards Bay Steam Turbine
Under consideration Various
Three to four years to completion
Up to ±€250 million
Page 30
Focus on high return energy and de-bottlenecking opportunities
Selected mergers & acquisitions opportunities
Saturn Investment (± €90 million)
Intention to exercise call option to acquire 100% of the power and heat generating plant
Expected to complete by mid 2012p p y
Tender offer for Świecie minorities (± €280 million)
C h bli t d ff f PLN69 00 (€16 48) h f 17 illi hCash public tender offer of PLN69.00 (€16.48) per share for 17 million shares (34% of shareholding) of Mondi Świecie in Poland
Offer at premium of 15.6% over last three months average price of PLN59.71 (€14.26)Offer at premium of 15.6% over last three months average price of PLN59.71 (€14.26)
Offer expected to be concluded in mid April 2012
F ll acceptance of offer PLN1 2 billion (€280 million) considerationFull acceptance of offer – PLN1.2 billion (€280 million) consideration
Page 31
Świecie opportunities

Agenda
Hi hli htHighlights
Financial overview
Operational review
Capital allocationCapital allocation
Summary
Appendices
Page 32

Summary
Very strong performance – delivering ROCE of 15%
Strong operational performance
Investment grade credit ratings
Successful demerger of Mpact leading to a further refined portfolio
Cash utilised toStrengthen balance sheet
Invest in selected high return projects
Grow dividendGrow dividend
OutlookMacroeconomic risks remainMacroeconomic risks remain
Order books improved & prices stabilised
Price increases announced in certain grades
Supply side fundamentals remain good
Page 33
Continuing to deliver
Agenda
Hi hli htHighlights
Financial overview
Operational review
Capital allocationCapital allocation
Summary
Appendices
Page 34
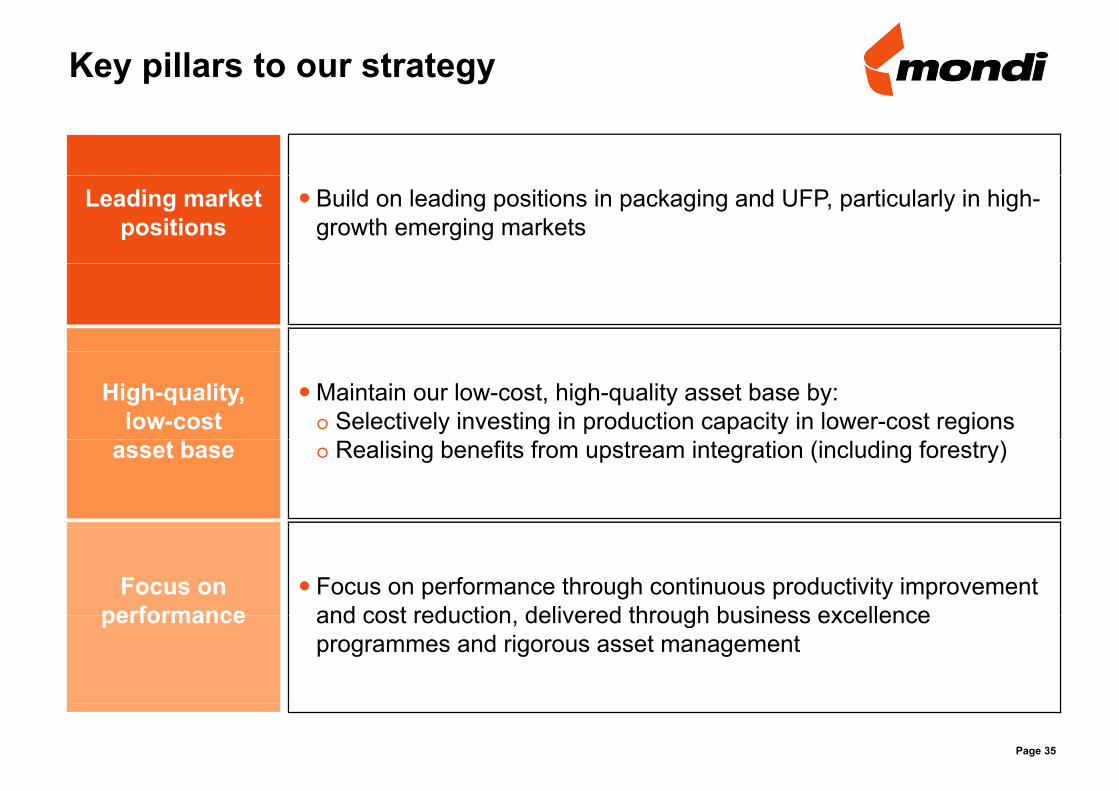
Key pillars to our strategy
Leading market positions
Build on leading positions in packaging and UFP, particularly in high-growth emerging markets
High-quality, low-cost
Maintain our low-cost, high-quality asset base by: Selectively investing in production capacity in lower-cost regions
asset base Realising benefits from upstream integration (including forestry)
Focus on performance
Focus on performance through continuous productivity improvement and cost reduction delivered through business excellenceperformance and cost reduction, delivered through business excellence programmes and rigorous asset management
Page 35

Mondi at a glanceSouth Africa NewsprintUFP
€1 4B €0 6B €0 2B
gBags & Coatings
€2 5B€1 4B
Corrugated
24%
41%
9%3%
2011Sales 1
€1.4B €0.6B €0.2B€2.5B€1.4B
23%41%
2011 EBIT %
14.3% 9.2%12.8% 10.9% (11.1)%
P d tProducts
Positions in relevant
No. 1 in Newsprint in South Africa2
No. 1 in Office Paper and UFP in Europe 3
Europe South Africa Europe/SA No. 1 in Kraft Paper in
Europe2 No. 2 Virgin
containerboard i E 2
No. 1 in Office Paper in SA 2
in relevant markets(2011)
Europe 3 No. 1 in Industrial Bags in Europe3
No. 1 in Commercial release liner in Europe3
in Europe 2
No. 1 Recycled containerboard in Emerging Europe2
No. 1 Corrugated Packaging in Emerging
No. 1 in White Top Kraftliner in SA 2
Page 361 Segment revenues, including inter-segment revenues. EBIT % is before special items. 2 Based on production capacity. 3 Based on sales volume. 4 Based on production.Sources: RISI, Pöyry Forest Industry Consulting, Freedonia, BMI Foodpack, PAMSA, Mondi.
Packaging in Emerging Europe 4

Focus on Packaging and UFP in emerging markets1emerging markets1
Revenue by destination Revenue by origin Net operating assets
29%44%
71%56%
44%50%50%
Mature marketsEmerging markets
Mature marketsEmerging markets
Mature marketsEmerging markets
14%
Virgin-based production Revenue by product
24%
23%
15%
14%
81%
19% Corrugated productsUncoated fine paper
Kraft paper & industrial bags
Coatings & consumer packaging23%24%
Mature marketsEmerging markets
Other
Page 37
Competitive cost base1 Mondi 2011 data, excluding Mpact.

Emerging market asset base leads to low cost positions across the group’s main grades…
+
Leading market positions
Grade 1st Quartile 2nd Quartile 3rd Quartile 4th Quartile
Percentage of Mondi's capacity in overall cost curve at Q3 2011 1
+High quality, low cost asset base
Unbleached Sack Paper 40% - 35% 26%NSSC Fluting 100% - - -Unbleached Kraftliner 100%
Low cost asset base
Unbleached Kraftliner 100% - - -White Top Kraftliner 100% - - -BHKP (Pulp)2 - 100% - -Recycled Fluting 75% - 25% -UFP 61% 10% 21%3 8%3
1 Delivered to Frankfurt except where notedDelivered to Frankfurt except where noted2 Delivered to Rotterdam3 Includes specialities
Page 38Source: RISI and Mondi estimates.
High quality, low cost, well invested asset base

Integrated value chain 2011
+
Leading market positions
Pulp Virgin Containerboard
+High quality, low cost asset base
Low cost asset base
Upstream production cost advantages
Kraft Paper Recycled Containerboard
g
Page 39Source: Mondi – 2011, excluding Mpact
Exploiting benefits of upstream integration
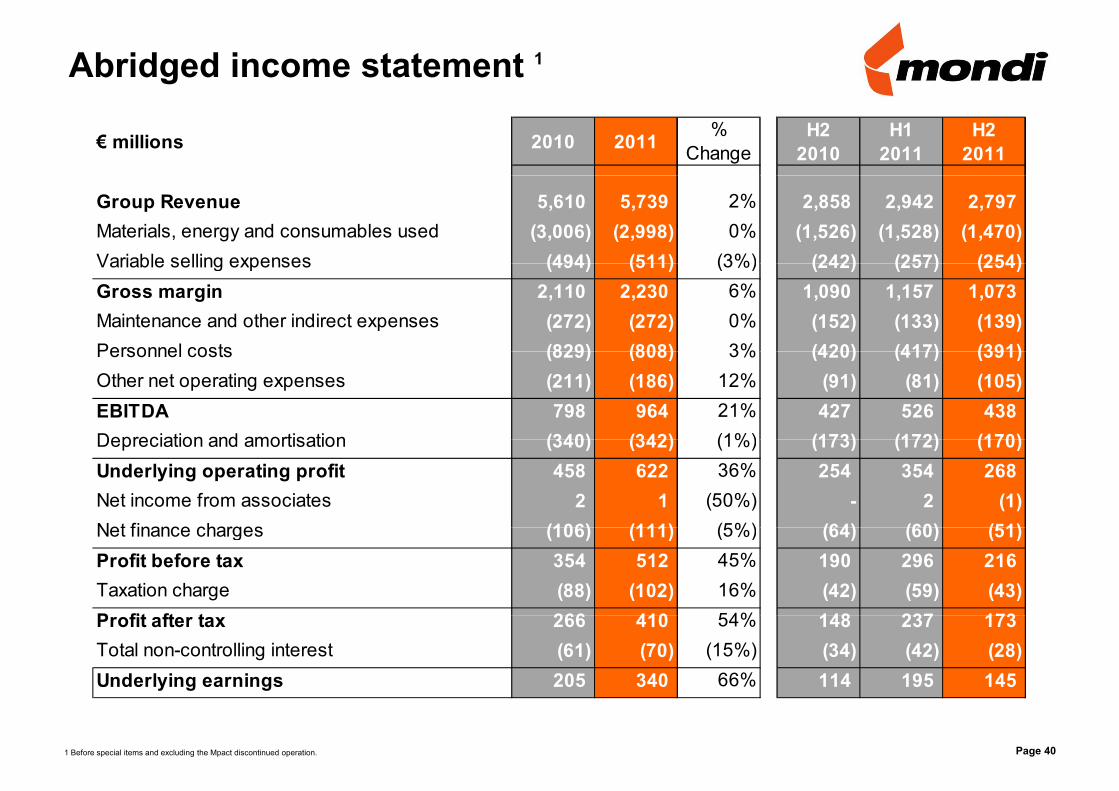
Abridged income statement 1
€ millions 2010 2011 % Change
H22010
H12011
H22011
Group Revenue 5,610 5,739 2% 2,858 2,942 2,797 Materials, energy and consumables used (3,006) (2,998) 0% (1,526) (1,528) (1,470)Variable selling expenses (494) (511) (3%) (242) (257) (254)Variable selling expenses (494) (511) (3%) (242) (257) (254)Gross margin 2,110 2,230 6% 1,090 1,157 1,073 Maintenance and other indirect expenses (272) (272) 0% (152) (133) (139)Personnel costs (829) (808) 3% (420) (417) (391)Personnel costs (829) (808) 3% (420) (417) (391)Other net operating expenses (211) (186) 12% (91) (81) (105)EBITDA 798 964 21% 427 526 438 Depreciation and amortisation (340) (342) (1%) (173) (172) (170)Depreciation and amortisation (340) (342) (1%) (173) (172) (170)Underlying operating profit 458 622 36% 254 354 268 Net income from associates 2 1 (50%) - 2 (1)Net finance charges (106) (111) (5%) (64) (60) (51)Net finance charges (106) (111) (5%) (64) (60) (51)Profit before tax 354 512 45% 190 296 216Taxation charge (88) (102) 16% (42) (59) (43)P fit ft t 266 410 54% 148 237 173Profit after tax 266 410 54% 148 237 173Total non-controlling interest (61) (70) (15%) (34) (42) (28)Underlying earnings 205 340 66% 114 195 145
Page 401 Before special items and excluding the Mpact discontinued operation.

Exchange rates
2010 2011 % Change
H22010
H12011
H22011
Closing rates against the euro
South African rand 8.86 10.48 18% 8.86 9.86 10.48 Pounds sterling 0.86 0.84 (3%) 0.86 0.90 0.84 Polish zloty 3.97 4.46 12% 3.97 3.99 4.46 Russian rouble 40.82 41.77 2% 40.82 40.40 41.77 US dollar 1.34 1.29 (3%) 1.34 1.45 1.29 Czech koruna 25.06 25.79 3% 25.06 24.34 25.79 Turkish lire 2.07 2.44 18% 2.07 2.35 2.44
Average rates for the period against the euro
South African rand 9.70 10.10 4% 9.42 9.69 10.51 Pounds sterling 0.86 0.87 1% 0.85 0.87 0.87 Polish zloty 3.99 4.12 3% 3.99 3.95 4.29 Russian rouble 40.27 40.88 2% 40.66 40.14 41.62 US dollar 1.33 1.39 5% 1.33 1.40 1.38 Czech koruna 25.29 24.59 (3%) 24.85 24.35 24.84
Page 41
Turkish lire 2.00 2.34 17% 2.00 2.21 2.34

Production volumes
€ millions 2010 2011 % Change
H22010
H12011
H22011
Europe & InternationalUncoated fine paper Tonnes 1 524 225 1 400 991 (8%) 733 477 712 886 688 105 Containerboard Tonnes 1 939 935 2 009 984 4% 931 630 991 970 1 018 014 Kraft paper Tonnes 984 607 955 741 (3%) 518 451 535 238 420 503 Corrugated board and boxes m m² 1 308 1 213 (7%) 595 609 604 Industrial bags m units 3 850 3 958 3% 1 992 2 050 1 908 Coating and release liners m m² 3 187 3 357 5% 1 586 1 797 1 560 gNewsprint Tonnes 197 601 199 337 1% 99 550 97 931 101 406
South Africa Uncoated fine paper Tonnes 276 957 233 837 (16%) 124 294 114 686 119 151Uncoated fine paper Tonnes 276 957 233 837 (16%) 124 294 114 686 119 151 Containerboard Tonnes 259 785 257 680 (1%) 130 955 126 516 131 164 Wood chips (bone dry) Tonnes 280 154 206 150 (26%) 150 638 101 454 104 696 External hardwood pulp Tonnes 223 016 320 817 44% 98 384 128 882 191 935
Newsprint JVs (attributable share)Aylesford Tonnes 187 971 188 536 0% 95 396 95 955 92 581 Mondi Shanduka Newsprint Tonnes 126 530 124 914 (1%) 61 554 61 548 63 366 p ( )
Page 42