monday, july 23, 2018 from equity research key indexdmia.danareksaonline.com/upload/morning pack...
TRANSCRIPT

Equity SNAPSHOT Monday, July 23, 2018
Danareksa Sekuritas – Equity SNAPSHOT
FROM EQUITY RESEARCH
Consumer: Better days ahead (Overweight) Based on our recent discussions with several companies in the
consumer sector, we note that sales performance improved in April
and May 2018, both on a yearly basis and also compared to 1Q18. Despite this, the sector has underperformed the JCI by 14.5% over
the past two years. Nonetheless, we believe that the bottom has now been reached and that the recent weakness in the sector
actually presents investors with a good opportunity to BUY. Maintain Overweight.
To see the full version of this report, please click here
Erajaya Swasembada: Seeking higher market share
(ERAA IJ. IDR 3,040. BUY. TP IDR 3,500) We believe that ERAA performed well in 2Q18, benefitting from
Lebaran, various new product launches, and Jakarta Fair. As such,
we significantly revise up our 2018F revenues estimates. Going forward, the company seeks to increase its market share through
aggressive retail expansion, enhanced business efficiency and IoT expansion. We reiterate our BUY call on ERAA with a higher TP of
IDR3,500. To see the full version of this report, please click here
1H18 RESULTS PTBA: Lowered quarterly net profit due to capping of DMO prices
To see the full version of this report, please click here WSKT: Strong earnings growth
To see the full version of this report, please click here
WSBP: Turnkey projects lifted margins
To see the full version of this report, please click here
MARKET NEWS
Macroeconomy
Ministry of Finance to offer new bonds to retail investors Sector
Property: The Jakarta Provincial Government to revise the regulation of Taxable Value of Land & Building (NJOP)
Plantation: Full implementation of B20 program to improve CPO
price and reduce CAD Corporate
Puradelta Lestari (DMAS) booked land marketing sales of 22Ha in 1H18
KEY INDEX
Close
Chg Ytd Vol
(%) (%) (US$ m)
Asean - 5
Indonesia 5,873 0.0 (7.6) 319
Thailand 1,671 1.5 (4.7) 2,011
Philippines 7,400 0.2 (13.5) 63
Malaysia 1,755 (0.3) (2.3) 748
Singapore 3,298 0.6 (3.1) 732
Regional
China 2,829 2.0 (14.5) 29,445
Hong Kong 28,224 0.8 (5.7) 12,764
Japan 22,465 (1.0) (1.3) 2,034
Korea 2,285 (0.2) (7.4) 4,357
Taiwan 10,932 0.9 2.7 5,372
India 36,496 0.4 7.2 421
NASDAQ 7,820 (0.1) 13.3 105,954
Dow Jones 25,058 (0.0) 1.4 10,820
CURRENCY AND INTEREST RATE
Rate
w-w m-m ytd
(%) (%) (%)
Rupiah Rp/1US$ 14,495 (0.8) (4.0) (6.9)
SBI rate % 5.25 - 0.5 1.0
10y Gov Indo bond 7.88 0.4 0.6 1.6
HARD COMMODITY
Unit Price
d-d m-m ytd
(%) (%) (%)
Coal US$/ton 118 (1.3) 2.8 16.8
Gold US$/toz 1,234 0.2 (2.8) (5.3)
Nickel US$/mt.ton 13,437 1.4 (9.8) 5.8
Tin US$/mt.ton 19,575 (0.1) (5.6) (2.6)
SOFT COMMODITY
Unit Price
d-d m-m ytd
(%) (%) (%)
Cocoa US$/mt.ton 2,278 (1.5) (5.9) 19.9
Corn US$/mt.ton 126 2.2 0.3 0.6
Oil (WTI) US$/barrel 68 (0.1) (0.6) 12.9
Oil (Brent) US$/barrel 73 0.0 (3.3) 9.3
Palm oil MYR/mt.ton 2,196 0.1 (2.4) (8.1)
Rubber USd/kg 132 (0.2) (2.5) (10.1)
Pulp US$/tonne 1,205 N/A 2.8 20.5
Coffee US$/60kgbag 86 0.5 0.4 (6.2)
Sugar US$/MT 322 1.2 (5.8) (18.4)
Wheat US$/ton 140 - 2.3 10.8
Soy Oil US$/lb 28 0.2 (3.2) (14.5)
Soy Bean US$/by 853 0.4 (4.6) (10.4)
Source: Bloomberg
Equity Research Consumer
See important disclosure at the back of this report www.danareksa.com
Monday,23 July 2018
Consumer OVERWEIGHT
Maintain Better days ahead
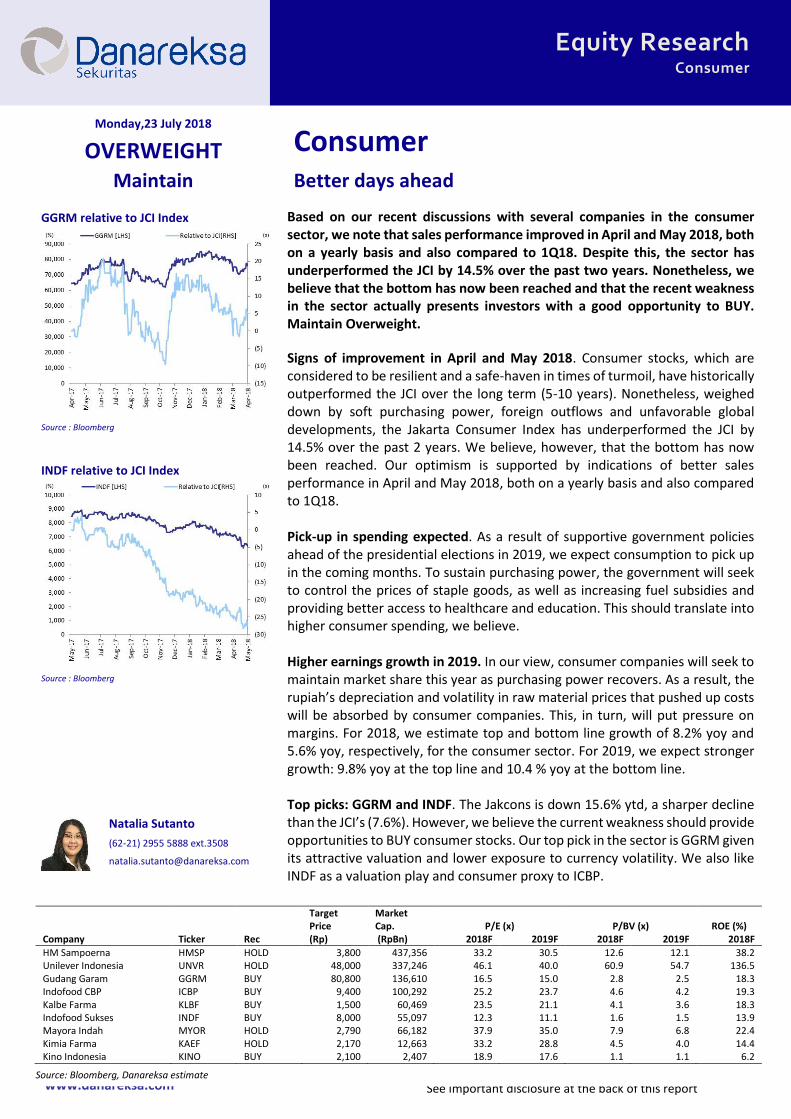
Based on our recent discussions with several companies in the consumer sector, we note that sales performance improved in April and May 2018, both on a yearly basis and also compared to 1Q18. Despite this, the sector has underperformed the JCI by 14.5% over the past two years. Nonetheless, we believe that the bottom has now been reached and that the recent weakness in the sector actually presents investors with a good opportunity to BUY. Maintain Overweight.
Signs of improvement in April and May 2018. Consumer stocks, which are considered to be resilient and a safe-haven in times of turmoil, have historically outperformed the JCI over the long term (5-10 years). Nonetheless, weighed down by soft purchasing power, foreign outflows and unfavorable global developments, the Jakarta Consumer Index has underperformed the JCI by 14.5% over the past 2 years. We believe, however, that the bottom has now been reached. Our optimism is supported by indications of better sales performance in April and May 2018, both on a yearly basis and also compared to 1Q18. Pick-up in spending expected. As a result of supportive government policies ahead of the presidential elections in 2019, we expect consumption to pick up in the coming months. To sustain purchasing power, the government will seek to control the prices of staple goods, as well as increasing fuel subsidies and providing better access to healthcare and education. This should translate into higher consumer spending, we believe. Higher earnings growth in 2019. In our view, consumer companies will seek to maintain market share this year as purchasing power recovers. As a result, the rupiah’s depreciation and volatility in raw material prices that pushed up costs will be absorbed by consumer companies. This, in turn, will put pressure on margins. For 2018, we estimate top and bottom line growth of 8.2% yoy and 5.6% yoy, respectively, for the consumer sector. For 2019, we expect stronger growth: 9.8% yoy at the top line and 10.4 % yoy at the bottom line. Top picks: GGRM and INDF. The Jakcons is down 15.6% ytd, a sharper decline than the JCI’s (7.6%). However, we believe the current weakness should provide opportunities to BUY consumer stocks. Our top pick in the sector is GGRM given its attractive valuation and lower exposure to currency volatility. We also like INDF as a valuation play and consumer proxy to ICBP.
GGRM relative to JCI Index
Source : Bloomberg
INDF relative to JCI Index
Source : Bloomberg
x Natalia Sutanto
(62-21) 2955 5888 ext.3508
Target Price
Market Cap. P/E (x) P/BV (x) ROE (%)
Company Ticker Rec (Rp) (RpBn) 2018F 2019F 2018F 2019F 2018F
HM Sampoerna HMSP HOLD 3,800 437,356 33.2 30.5 12.6 12.1 38.2 Unilever Indonesia UNVR HOLD 48,000 337,246 46.1 40.0 60.9 54.7 136.5 Gudang Garam GGRM BUY 80,800 136,610 16.5 15.0 2.8 2.5 18.3 Indofood CBP ICBP BUY 9,400 100,292 25.2 23.7 4.6 4.2 19.3 Kalbe Farma KLBF BUY 1,500 60,469 23.5 21.1 4.1 3.6 18.3 Indofood Sukses INDF BUY 8,000 55,097 12.3 11.1 1.6 1.5 13.9 Mayora Indah MYOR HOLD 2,790 66,182 37.9 35.0 7.9 6.8 22.4 Kimia Farma KAEF HOLD 2,170 12,663 33.2 28.8 4.5 4.0 14.4 Kino Indonesia KINO BUY 2,100 2,407 18.9 17.6 1.1 1.1 6.2
Source: Bloomberg, Danareksa estimate
www.danareksa.com See important disclosure at the back of this report 1
Equity Research Company Update
Monday, 23 July 2018
Erajaya Swasembada(ERAA IJ) BUY
Maintain Seeking higher market share
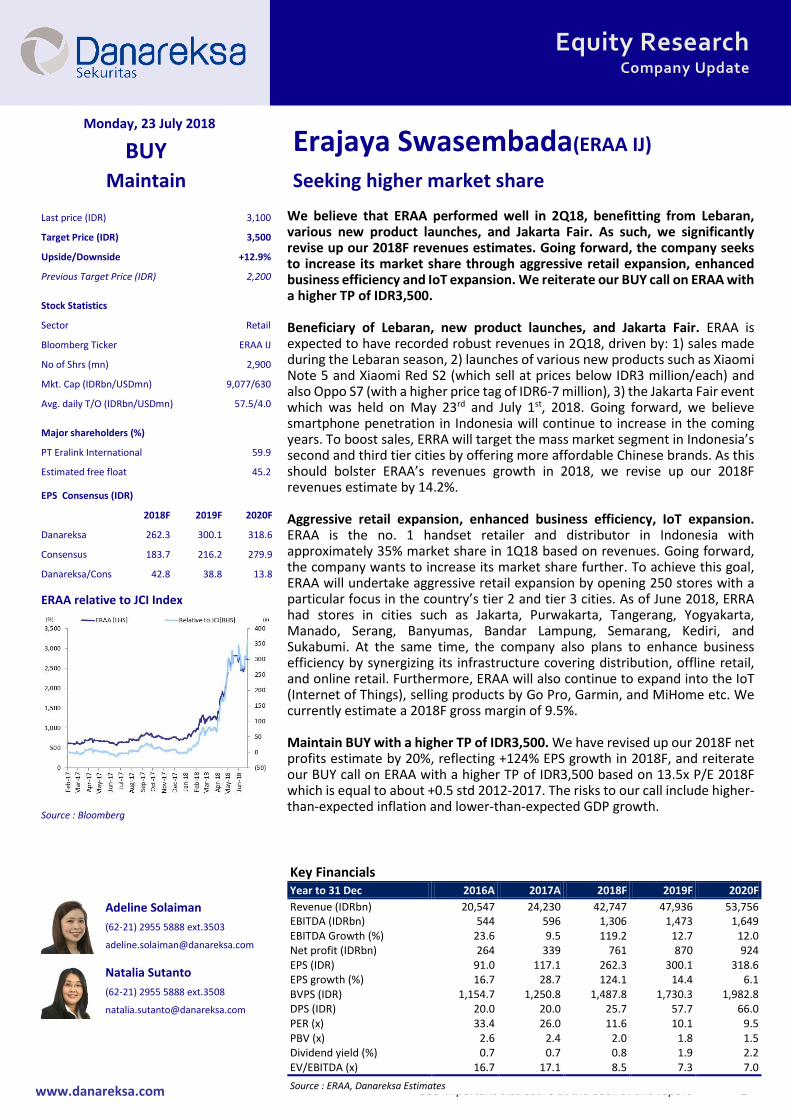
We believe that ERAA performed well in 2Q18, benefitting from Lebaran, various new product launches, and Jakarta Fair. As such, we significantly revise up our 2018F revenues estimates. Going forward, the company seeks to increase its market share through aggressive retail expansion, enhanced business efficiency and IoT expansion. We reiterate our BUY call on ERAA with a higher TP of IDR3,500. Beneficiary of Lebaran, new product launches, and Jakarta Fair. ERAA is expected to have recorded robust revenues in 2Q18, driven by: 1) sales made during the Lebaran season, 2) launches of various new products such as Xiaomi Note 5 and Xiaomi Red S2 (which sell at prices below IDR3 million/each) and also Oppo S7 (with a higher price tag of IDR6-7 million), 3) the Jakarta Fair event which was held on May 23rd and July 1st, 2018. Going forward, we believe smartphone penetration in Indonesia will continue to increase in the coming years. To boost sales, ERRA will target the mass market segment in Indonesia’s second and third tier cities by offering more affordable Chinese brands. As this should bolster ERAA’s revenues growth in 2018, we revise up our 2018F revenues estimate by 14.2%. Aggressive retail expansion, enhanced business efficiency, IoT expansion. ERAA is the no. 1 handset retailer and distributor in Indonesia with approximately 35% market share in 1Q18 based on revenues. Going forward, the company wants to increase its market share further. To achieve this goal, ERAA will undertake aggressive retail expansion by opening 250 stores with a particular focus in the country’s tier 2 and tier 3 cities. As of June 2018, ERRA had stores in cities such as Jakarta, Purwakarta, Tangerang, Yogyakarta, Manado, Serang, Banyumas, Bandar Lampung, Semarang, Kediri, and Sukabumi. At the same time, the company also plans to enhance business efficiency by synergizing its infrastructure covering distribution, offline retail, and online retail. Furthermore, ERAA will also continue to expand into the IoT (Internet of Things), selling products by Go Pro, Garmin, and MiHome etc. We currently estimate a 2018F gross margin of 9.5%. Maintain BUY with a higher TP of IDR3,500. We have revised up our 2018F net profits estimate by 20%, reflecting +124% EPS growth in 2018F, and reiterate our BUY call on ERAA with a higher TP of IDR3,500 based on 13.5x P/E 2018F which is equal to about +0.5 std 2012-2017. The risks to our call include higher-than-expected inflation and lower-than-expected GDP growth.
Last price (IDR) 3,100
Target Price (IDR) 3,500
Upside/Downside +12.9%
Previous Target Price (IDR) 2,200
Stock Statistics
Sector Retail
Bloomberg Ticker ERAA IJ
No of Shrs (mn) 2,900
Mkt. Cap (IDRbn/USDmn) 9,077/630
Avg. daily T/O (IDRbn/USDmn) 57.5/4.0
Major shareholders (%)
PT Eralink International 59.9
Estimated free float 45.2
EPS Consensus (IDR)
2018F 2019F 2020F
Danareksa 262.3 300.1 318.6
Consensus 183.7 216.2 279.9
Danareksa/Cons 42.8 38.8 13.8
ERAA relative to JCI Index
Source : Bloomberg
x Adeline Solaiman
(62-21) 2955 5888 ext.3503
x Natalia Sutanto
(62-21) 2955 5888 ext.3508
Key Financials Year to 31 Dec 2016A 2017A 2018F 2019F 2020F
Revenue (IDRbn) 20,547 24,230 42,747 47,936 53,756 EBITDA (IDRbn) 544 596 1,306 1,473 1,649 EBITDA Growth (%) 23.6 9.5 119.2 12.7 12.0 Net profit (IDRbn) 264 339 761 870 924 EPS (IDR) 91.0 117.1 262.3 300.1 318.6 EPS growth (%) 16.7 28.7 124.1 14.4 6.1 BVPS (IDR) 1,154.7 1,250.8 1,487.8 1,730.3 1,982.8 DPS (IDR) 20.0 20.0 25.7 57.7 66.0 PER (x) 33.4 26.0 11.6 10.1 9.5 PBV (x) 2.6 2.4 2.0 1.8 1.5 Dividend yield (%) 0.7 0.7 0.8 1.9 2.2 EV/EBITDA (x) 16.7 17.1 8.5 7.3 7.0
Source : ERAA, Danareksa Estimates

www.danareksa.com See important disclosure at the back of this report 1
Equity Research Results Note
Monday,23 July 2018
Bukit Asam (PTBA IJ) BUY
Maintain Lowered qoq profit due to capping of DMO prices
Bukit Asam (PTBA) reported net profits of IDR1,125bn in 2Q18 (-22.5% qoq, but +31.9% yoy). We believe the capping of prices under the DMO regulation from March 2018 was reflected in lower ASP. Cumulatively, net profits rose by 49.4% yoy in 1H18 thanks to sturdy coal prices. The results are slightly above our expectations, but within the consensus estimates. We are reviewing our target price but maintain our BUY call on the expectation of: a) strong production growth to sustain earnings in 2018 and b) business diversification to provide greater earnings over the long-term.
Lower quarterly net profits on the capping of DMO prices. The company reported 22.5% qoq lower net profits of IDR1,125bn in 2Q18. This mainly owed to lower revenues (-16.9%qoq). We believe that the capping of prices under the DMO regulation from March 2018 was reflected in lower ASP. Nonetheless, lower operating expenses (-33.8% qoq) and a tax rate of 24.4% in 2Q18 (1Q18: 29.1%) helped to prevent a further decline in net profits.
Strong net profits on higher coal prices. Net profits went up by 49.4% yoy to IDR2,576bn in 1H18. This mainly owed to: a) higher coal prices which were reflected in 17.4% yoy higher revenues and b) a lower tax rate of 27.1% in 1H18 (1H17: 29.4%). Thanks to sturdy coal prices, the gross and operating margins expanded to 42.0% and 33.5% in 1H18 from 37.3% and 27.6% in 1H17, respectively.
To book strong earnings in 2018. The capping of the coal price at USD70/tonne for the DMO of coal sold to PLN impacted on the ASP and performance of the company in 2Q18. In addition, we also expect a higher stripping ratio and higher crude oil prices to increase the cash cost of production further. Nonetheless, we expect PTBA to continue to book strong earnings in 2018 owing to: a) greater production capacity following higher railway capacity and b) more sales from high contribution calorific value coal to boost the company’s ASP and c) sturdy coal prices.
Maintain BUY while reviewing our previous target price. We continue to like the company given: a) sturdy earnings on higher production and solid ASP, b) abundant reserves and c) diversification into power plants. The main downside risk relates to further unfavorable government policies concerning domestic coal prices and the risk of further consolidation in coal prices.
Last price (IDR) 4,260
Target Price (IDR) U/R
Upside/Downside n/a
Previous Target Price (IDR) 3,600
Stock Statistics
Sector Coal Mining
Bloomberg Ticker PTBA IJ
No of Shrs (mn) 10,871
Mkt. Cap (IDRbn/USDmn) 46,309/3,195
Avg. daily T/O (IDRbn/USDmn) 118.1/8.2
Major shareholders (%)
Indonesia Asahan Aluminium 65.0
Estimated Free Float 26.5
EPS Consensus (IDR)
2018F 2019F 2020F
Danareksa 425.3 445.0 468.1
Consensus 441.8 464.5 458.0
Danareksa/Cons (3.7) (4.2) 2.2
PTBA relative to JCI Index
Source : Bloomberg
x Stefanus Darmagiri
(62-21) 29 555 831
Key Financials Year to 31 Dec 2016A 2017A 2018F 2019F 2020F
Revenue (IDRbn) 14,059 19,471 20,700 22,605 24,245 EBITDA (IDRbn) 2,876 6,569 6,571 6,791 6,588 EBITDA Growth (%) 1.8 128.4 0.0 3.4 (3.0) Net profit (IDRbn) 2,006 4,476 4,623 4,838 5,089 EPS (IDR) 184.6 411.8 425.3 445.0 468.1 EPS growth (%) (1.5) 123.1 3.3 4.6 5.2 BVPS (IDR) 958.7 1,251.8 1,533.0 1,829.2 2,141.5 DPS (IDR) 56.2 55.4 144.1 148.9 155.8 PER (x) 23.1 10.3 10.0 9.6 9.1 PBV (x) 4.4 3.4 2.8 2.3 2.0 Dividend yield (%) 1.3 1.3 3.4 3.5 3.7 EV/EBITDA (x) 15.6 6.6 6.3 6.2 6.4
Source : PTBA, Danareksa Estimates
www.danareksa.com See important disclosure at the back of this report 1
Equity Research Results Note
Monday,23 July 2018
Waskita Karya(WSKT IJ) BUY
Maintain Strong earnings growth
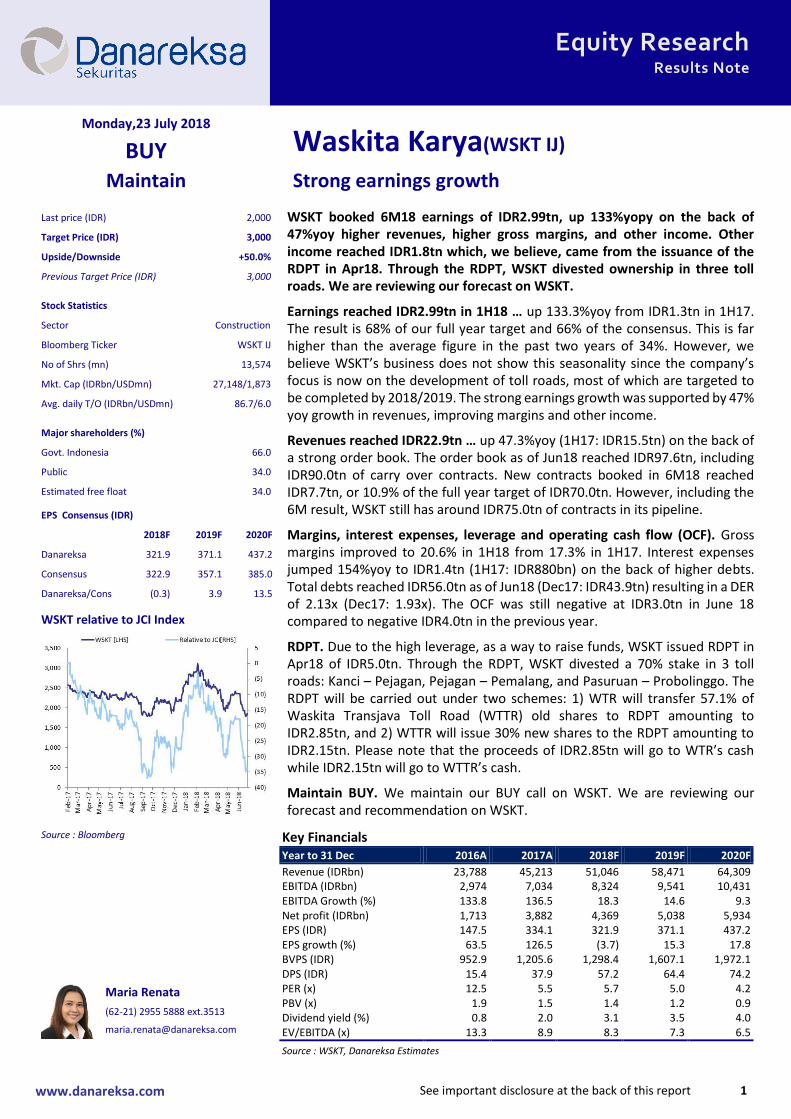
WSKT booked 6M18 earnings of IDR2.99tn, up 133%yopy on the back of 47%yoy higher revenues, higher gross margins, and other income. Other income reached IDR1.8tn which, we believe, came from the issuance of the RDPT in Apr18. Through the RDPT, WSKT divested ownership in three toll roads. We are reviewing our forecast on WSKT.
Earnings reached IDR2.99tn in 1H18 … up 133.3%yoy from IDR1.3tn in 1H17. The result is 68% of our full year target and 66% of the consensus. This is far higher than the average figure in the past two years of 34%. However, we believe WSKT’s business does not show this seasonality since the company’s focus is now on the development of toll roads, most of which are targeted to be completed by 2018/2019. The strong earnings growth was supported by 47% yoy growth in revenues, improving margins and other income.
Revenues reached IDR22.9tn … up 47.3%yoy (1H17: IDR15.5tn) on the back of a strong order book. The order book as of Jun18 reached IDR97.6tn, including IDR90.0tn of carry over contracts. New contracts booked in 6M18 reached IDR7.7tn, or 10.9% of the full year target of IDR70.0tn. However, including the 6M result, WSKT still has around IDR75.0tn of contracts in its pipeline.
Margins, interest expenses, leverage and operating cash flow (OCF). Gross margins improved to 20.6% in 1H18 from 17.3% in 1H17. Interest expenses jumped 154%yoy to IDR1.4tn (1H17: IDR880bn) on the back of higher debts. Total debts reached IDR56.0tn as of Jun18 (Dec17: IDR43.9tn) resulting in a DER of 2.13x (Dec17: 1.93x). The OCF was still negative at IDR3.0tn in June 18 compared to negative IDR4.0tn in the previous year.
RDPT. Due to the high leverage, as a way to raise funds, WSKT issued RDPT in Apr18 of IDR5.0tn. Through the RDPT, WSKT divested a 70% stake in 3 toll roads: Kanci – Pejagan, Pejagan – Pemalang, and Pasuruan – Probolinggo. The RDPT will be carried out under two schemes: 1) WTR will transfer 57.1% of Waskita Transjava Toll Road (WTTR) old shares to RDPT amounting to IDR2.85tn, and 2) WTTR will issue 30% new shares to the RDPT amounting to IDR2.15tn. Please note that the proceeds of IDR2.85tn will go to WTR’s cash while IDR2.15tn will go to WTTR’s cash.
Maintain BUY. We maintain our BUY call on WSKT. We are reviewing our forecast and recommendation on WSKT.
Last price (IDR) 2,000
Target Price (IDR) 3,000
Upside/Downside +50.0%
Previous Target Price (IDR) 3,000
Stock Statistics
Sector Construction
Bloomberg Ticker WSKT IJ
No of Shrs (mn) 13,574
Mkt. Cap (IDRbn/USDmn) 27,148/1,873
Avg. daily T/O (IDRbn/USDmn) 86.7/6.0
Major shareholders (%)
Govt. Indonesia 66.0
Public 34.0
Estimated free float 34.0
EPS Consensus (IDR)
2018F 2019F 2020F
Danareksa 321.9 371.1 437.2
Consensus 322.9 357.1 385.0
Danareksa/Cons (0.3) 3.9 13.5
WSKT relative to JCI Index
Source : Bloomberg
x Maria Renata
(62-21) 2955 5888 ext.3513
Key Financials Year to 31 Dec 2016A 2017A 2018F 2019F 2020F
Revenue (IDRbn) 23,788 45,213 51,046 58,471 64,309 EBITDA (IDRbn) 2,974 7,034 8,324 9,541 10,431 EBITDA Growth (%) 133.8 136.5 18.3 14.6 9.3 Net profit (IDRbn) 1,713 3,882 4,369 5,038 5,934 EPS (IDR) 147.5 334.1 321.9 371.1 437.2 EPS growth (%) 63.5 126.5 (3.7) 15.3 17.8 BVPS (IDR) 952.9 1,205.6 1,298.4 1,607.1 1,972.1 DPS (IDR) 15.4 37.9 57.2 64.4 74.2 PER (x) 12.5 5.5 5.7 5.0 4.2 PBV (x) 1.9 1.5 1.4 1.2 0.9 Dividend yield (%) 0.8 2.0 3.1 3.5 4.0 EV/EBITDA (x) 13.3 8.9 8.3 7.3 6.5
Source : WSKT, Danareksa Estimates
www.danareksa.com See important disclosure at the back of this report 1
Equity Research Results Note
Monday,23 July 2018
Waskita Beton Precast(WSBP IJ) BUY
Maintain Turnkey projects lifted margins
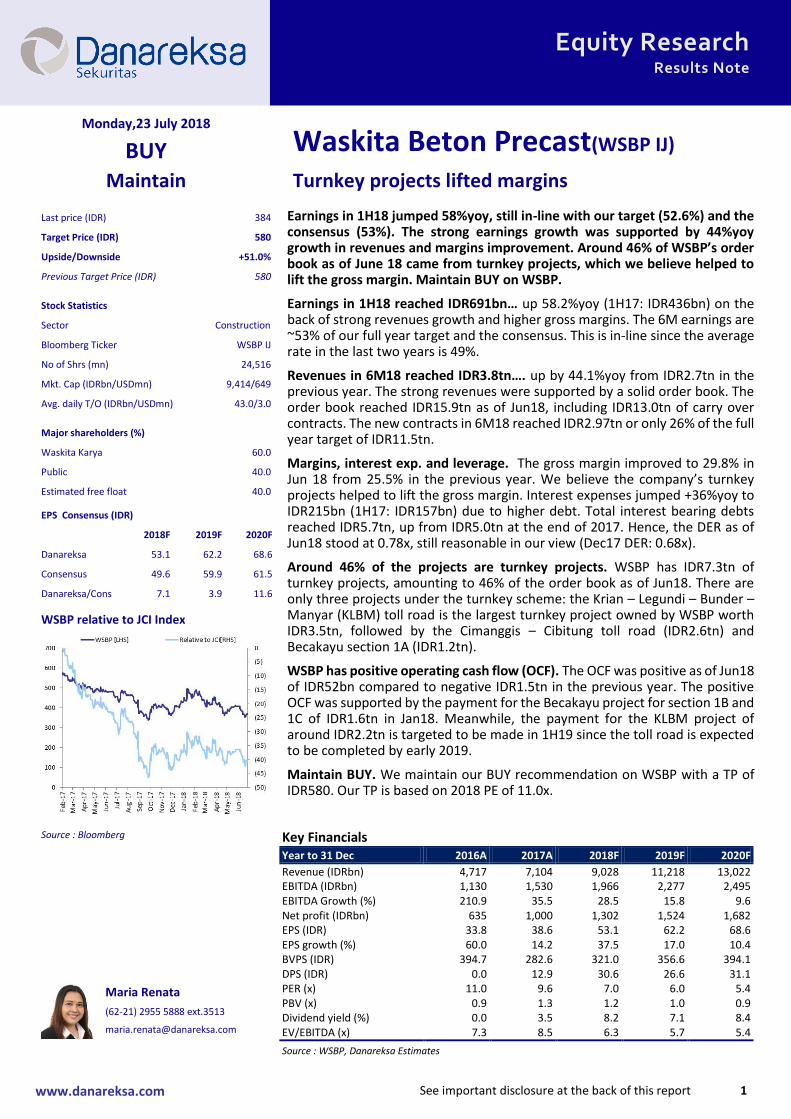
Earnings in 1H18 jumped 58%yoy, still in-line with our target (52.6%) and the consensus (53%). The strong earnings growth was supported by 44%yoy growth in revenues and margins improvement. Around 46% of WSBP’s order book as of June 18 came from turnkey projects, which we believe helped to lift the gross margin. Maintain BUY on WSBP.
Earnings in 1H18 reached IDR691bn… up 58.2%yoy (1H17: IDR436bn) on the back of strong revenues growth and higher gross margins. The 6M earnings are ~53% of our full year target and the consensus. This is in-line since the average rate in the last two years is 49%.
Revenues in 6M18 reached IDR3.8tn…. up by 44.1%yoy from IDR2.7tn in the previous year. The strong revenues were supported by a solid order book. The order book reached IDR15.9tn as of Jun18, including IDR13.0tn of carry over contracts. The new contracts in 6M18 reached IDR2.97tn or only 26% of the full year target of IDR11.5tn.
Margins, interest exp. and leverage. The gross margin improved to 29.8% in Jun 18 from 25.5% in the previous year. We believe the company’s turnkey projects helped to lift the gross margin. Interest expenses jumped +36%yoy to IDR215bn (1H17: IDR157bn) due to higher debt. Total interest bearing debts reached IDR5.7tn, up from IDR5.0tn at the end of 2017. Hence, the DER as of Jun18 stood at 0.78x, still reasonable in our view (Dec17 DER: 0.68x).
Around 46% of the projects are turnkey projects. WSBP has IDR7.3tn of turnkey projects, amounting to 46% of the order book as of Jun18. There are only three projects under the turnkey scheme: the Krian – Legundi – Bunder – Manyar (KLBM) toll road is the largest turnkey project owned by WSBP worth IDR3.5tn, followed by the Cimanggis – Cibitung toll road (IDR2.6tn) and Becakayu section 1A (IDR1.2tn).
WSBP has positive operating cash flow (OCF). The OCF was positive as of Jun18 of IDR52bn compared to negative IDR1.5tn in the previous year. The positive OCF was supported by the payment for the Becakayu project for section 1B and 1C of IDR1.6tn in Jan18. Meanwhile, the payment for the KLBM project of around IDR2.2tn is targeted to be made in 1H19 since the toll road is expected to be completed by early 2019.
Maintain BUY. We maintain our BUY recommendation on WSBP with a TP of IDR580. Our TP is based on 2018 PE of 11.0x.
Last price (IDR) 384
Target Price (IDR) 580
Upside/Downside +51.0%
Previous Target Price (IDR) 580
Stock Statistics
Sector Construction
Bloomberg Ticker WSBP IJ
No of Shrs (mn) 24,516
Mkt. Cap (IDRbn/USDmn) 9,414/649
Avg. daily T/O (IDRbn/USDmn) 43.0/3.0
Major shareholders (%)
Waskita Karya 60.0
Public 40.0
Estimated free float 40.0
EPS Consensus (IDR)
2018F 2019F 2020F
Danareksa 53.1 62.2 68.6
Consensus 49.6 59.9 61.5
Danareksa/Cons 7.1 3.9 11.6
WSBP relative to JCI Index
Source : Bloomberg
x Maria Renata
(62-21) 2955 5888 ext.3513
Key Financials Year to 31 Dec 2016A 2017A 2018F 2019F 2020F
Revenue (IDRbn) 4,717 7,104 9,028 11,218 13,022 EBITDA (IDRbn) 1,130 1,530 1,966 2,277 2,495 EBITDA Growth (%) 210.9 35.5 28.5 15.8 9.6 Net profit (IDRbn) 635 1,000 1,302 1,524 1,682 EPS (IDR) 33.8 38.6 53.1 62.2 68.6 EPS growth (%) 60.0 14.2 37.5 17.0 10.4 BVPS (IDR) 394.7 282.6 321.0 356.6 394.1 DPS (IDR) 0.0 12.9 30.6 26.6 31.1 PER (x) 11.0 9.6 7.0 6.0 5.4 PBV (x) 0.9 1.3 1.2 1.0 0.9 Dividend yield (%) 0.0 3.5 8.2 7.1 8.4 EV/EBITDA (x) 7.3 8.5 6.3 5.7 5.4
Source : WSBP, Danareksa Estimates
Equity SNAPSHOT Monday, July 23, 2018
Danareksa Sekuritas – Equity SNAPSHOT
MACROECONOMY
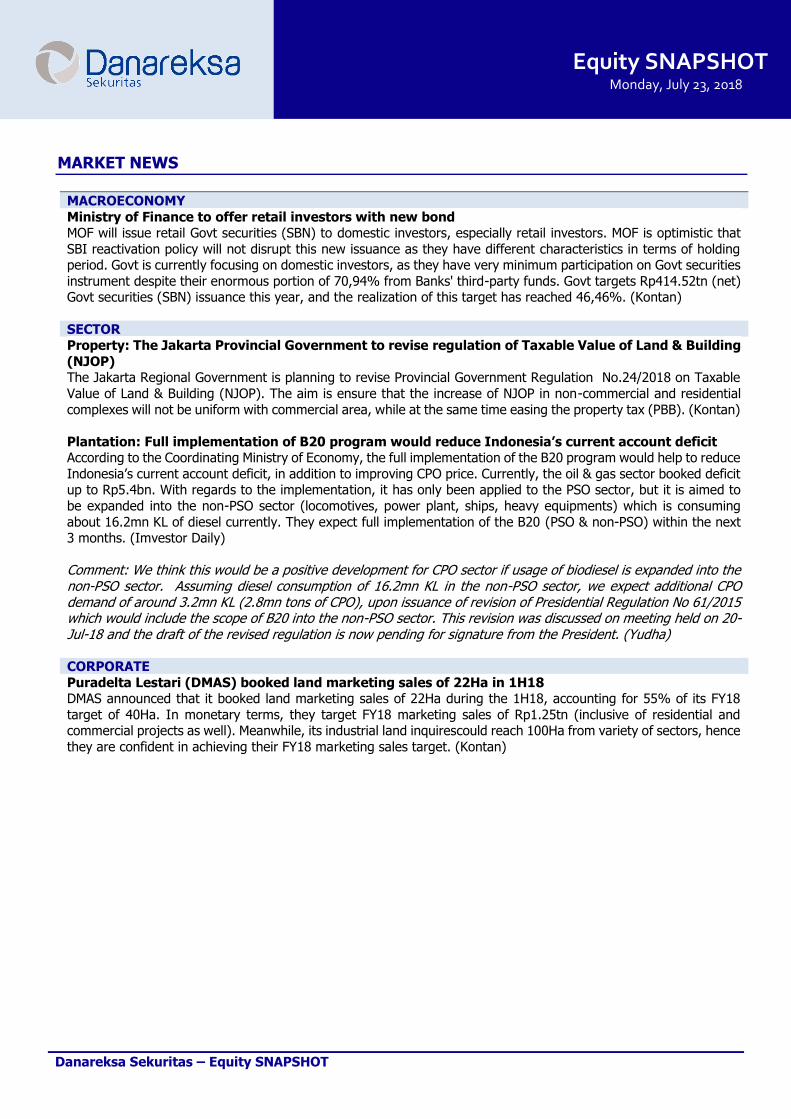
Ministry of Finance to offer retail investors with new bond MOF will issue retail Govt securities (SBN) to domestic investors, especially retail investors. MOF is optimistic that
SBI reactivation policy will not disrupt this new issuance as they have different characteristics in terms of holding period. Govt is currently focusing on domestic investors, as they have very minimum participation on Govt securities
instrument despite their enormous portion of 70,94% from Banks' third-party funds. Govt targets Rp414.52tn (net) Govt securities (SBN) issuance this year, and the realization of this target has reached 46,46%. (Kontan)
SECTOR Property: The Jakarta Provincial Government to revise regulation of Taxable Value of Land & Building
(NJOP) The Jakarta Regional Government is planning to revise Provincial Government Regulation No.24/2018 on Taxable
Value of Land & Building (NJOP). The aim is ensure that the increase of NJOP in non-commercial and residential
complexes will not be uniform with commercial area, while at the same time easing the property tax (PBB). (Kontan)
Plantation: Full implementation of B20 program would reduce Indonesia’s current account deficit According to the Coordinating Ministry of Economy, the full implementation of the B20 program would help to reduce
Indonesia’s current account deficit, in addition to improving CPO price. Currently, the oil & gas sector booked deficit up to Rp5.4bn. With regards to the implementation, it has only been applied to the PSO sector, but it is aimed to
be expanded into the non-PSO sector (locomotives, power plant, ships, heavy equipments) which is consuming
about 16.2mn KL of diesel currently. They expect full implementation of the B20 (PSO & non-PSO) within the next 3 months. (Imvestor Daily)
Comment: We think this would be a positive development for CPO sector if usage of biodiesel is expanded into the non-PSO sector. Assuming diesel consumption of 16.2mn KL in the non-PSO sector, we expect additional CPO demand of around 3.2mn KL (2.8mn tons of CPO), upon issuance of revision of Presidential Regulation No 61/2015 which would include the scope of B20 into the non-PSO sector. This revision was discussed on meeting held on 20-Jul-18 and the draft of the revised regulation is now pending for signature from the President. (Yudha) CORPORATE
Puradelta Lestari (DMAS) booked land marketing sales of 22Ha in 1H18 DMAS announced that it booked land marketing sales of 22Ha during the 1H18, accounting for 55% of its FY18
target of 40Ha. In monetary terms, they target FY18 marketing sales of Rp1.25tn (inclusive of residential and commercial projects as well). Meanwhile, its industrial land inquirescould reach 100Ha from variety of sectors, hence
they are confident in achieving their FY18 marketing sales target. (Kontan)
MARKET NEWS
Danareksa Sekuritas – Equity SNAPSHOT
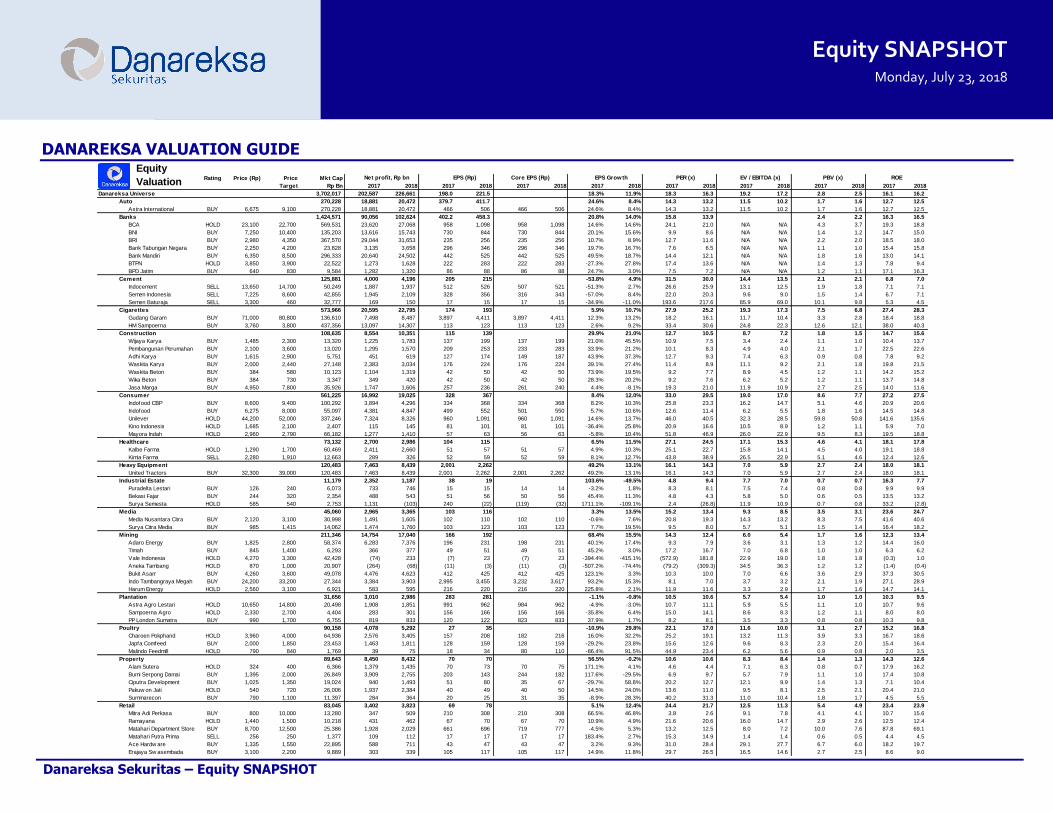
DANAREKSA VALUATION GUIDE
Equity SNAPSHOT Monday, July 23, 2018
Rating Price (Rp) Price Mkt Cap
Target Rp Bn 2017 2018 2017 2018 2017 2018 2017 2018 2017 2018 2017 2018 2017 2018 2017 2018
Danareksa Universe 3,702,017 202,587 226,661 198.0 221.5 18.3% 11.9% 18.3 16.3 19.2 17.2 2.8 2.5 16.1 16.2
Auto 270,228 18,881 20,472 379.7 411.7 24.6% 8.4% 14.3 13.2 11.5 10.2 1.7 1.6 12.7 12.5
Astra International BUY 6,675 9,100 270,228 18,881 20,472 466 506 466 506 24.6% 8.4% 14.3 13.2 11.5 10.2 1.7 1.6 12.7 12.5
Banks 1,424,571 90,056 102,624 402.2 458.3 20.8% 14.0% 15.8 13.9 2.4 2.2 16.3 16.5
BCA HOLD 23,100 22,700 569,531 23,620 27,068 958 1,098 958 1,098 14.6% 14.6% 24.1 21.0 N/A N/A 4.3 3.7 19.3 18.8
BNI BUY 7,250 10,400 135,203 13,616 15,743 730 844 730 844 20.1% 15.6% 9.9 8.6 N/A N/A 1.4 1.2 14.7 15.0
BRI BUY 2,980 4,350 367,570 29,044 31,653 235 256 235 256 10.7% 8.9% 12.7 11.6 N/A N/A 2.2 2.0 18.5 18.0
Bank Tabungan Negara BUY 2,250 4,200 23,828 3,135 3,658 296 346 296 346 19.7% 16.7% 7.6 6.5 N/A N/A 1.1 1.0 15.4 15.8
Bank Mandiri BUY 6,350 8,500 296,333 20,640 24,502 442 525 442 525 49.5% 18.7% 14.4 12.1 N/A N/A 1.8 1.6 13.0 14.1
BTPN HOLD 3,850 3,900 22,522 1,273 1,628 222 283 222 283 -27.3% 27.8% 17.4 13.6 N/A N/A 1.4 1.3 7.8 9.4
BPD Jatim BUY 640 830 9,584 1,282 1,320 86 88 86 88 24.7% 3.0% 7.5 7.2 N/A N/A 1.2 1.1 17.1 16.3
Cement 125,881 4,000 4,196 205 215 -53.8% 4.9% 31.5 30.0 14.4 13.5 2.1 2.1 6.8 7.0
Indocement SELL 13,650 14,700 50,249 1,887 1,937 512 526 507 521 -51.3% 2.7% 26.6 25.9 13.1 12.5 1.9 1.8 7.1 7.1
Semen Indonesia SELL 7,225 8,600 42,855 1,945 2,109 328 356 316 343 -57.0% 8.4% 22.0 20.3 9.6 9.0 1.5 1.4 6.7 7.1
Semen Baturaja SELL 3,300 460 32,777 169 150 17 15 17 15 -34.9% -11.0% 193.6 217.6 85.9 69.0 10.1 9.8 5.3 4.5
Cigarettes 573,966 20,595 22,795 174 193 5.9% 10.7% 27.9 25.2 19.3 17.3 7.5 6.8 27.4 28.3
Gudang Garam BUY 71,000 80,800 136,610 7,498 8,487 3,897 4,411 3,897 4,411 12.3% 13.2% 18.2 16.1 11.7 10.4 3.3 2.8 18.4 18.8
HM Sampoerna BUY 3,760 3,800 437,356 13,097 14,307 113 123 113 123 2.6% 9.2% 33.4 30.6 24.8 22.3 12.6 12.1 38.0 40.3
Construction 108,635 8,554 10,351 115 139 29.9% 21.0% 12.7 10.5 8.7 7.2 1.8 1.5 14.7 15.6
Wijaya Karya BUY 1,485 2,300 13,320 1,225 1,783 137 199 137 199 21.0% 45.5% 10.9 7.5 3.4 2.4 1.1 1.0 10.4 13.7
Pembangunan Perumahan BUY 2,100 3,600 13,020 1,295 1,570 209 253 233 283 33.9% 21.2% 10.1 8.3 4.9 4.0 2.1 1.7 22.5 22.6
Adhi Karya BUY 1,615 2,900 5,751 451 619 127 174 149 187 43.9% 37.3% 12.7 9.3 7.4 6.3 0.9 0.8 7.8 9.2
Waskita Karya BUY 2,000 2,440 27,148 2,383 3,034 176 224 176 224 39.1% 27.4% 11.4 8.9 11.1 9.2 2.1 1.8 19.8 21.5
Waskita Beton BUY 384 580 10,123 1,104 1,319 42 50 42 50 73.9% 19.5% 9.2 7.7 8.9 4.5 1.2 1.1 14.2 15.2
Wika Beton BUY 384 730 3,347 349 420 42 50 42 50 28.3% 20.2% 9.2 7.6 6.2 5.2 1.2 1.1 13.7 14.8
Jasa Marga BUY 4,950 7,800 35,926 1,747 1,606 257 236 261 240 4.4% -8.1% 19.3 21.0 11.9 10.9 2.7 2.5 14.0 11.6
Consumer 561,225 16,992 19,025 328 367 8.4% 12.0% 33.0 29.5 19.0 17.0 8.6 7.7 27.2 27.5
Indofood CBP BUY 8,600 9,400 100,292 3,894 4,296 334 368 334 368 8.2% 10.3% 25.8 23.3 16.2 14.7 5.1 4.6 20.9 20.6
Indofood BUY 6,275 8,000 55,097 4,381 4,847 499 552 501 550 5.7% 10.6% 12.6 11.4 6.2 5.5 1.8 1.6 14.5 14.8
Unilever HOLD 44,200 52,000 337,246 7,324 8,326 960 1,091 960 1,091 14.6% 13.7% 46.0 40.5 32.3 28.5 59.8 50.8 141.6 135.6
Kino Indonesia HOLD 1,685 2,100 2,407 115 145 81 101 81 101 -36.4% 25.8% 20.9 16.6 10.5 8.9 1.2 1.1 5.9 7.0
Mayora Indah HOLD 2,960 2,790 66,182 1,277 1,410 57 63 56 63 -5.8% 10.4% 51.8 46.9 26.0 22.9 9.5 8.3 19.5 18.8
Healthcare 73,132 2,700 2,986 104 115 6.5% 11.5% 27.1 24.5 17.1 15.3 4.6 4.1 18.1 17.8
Kalbe Farma HOLD 1,290 1,700 60,469 2,411 2,660 51 57 51 57 4.9% 10.3% 25.1 22.7 15.8 14.1 4.5 4.0 19.1 18.8
Kimia Farma SELL 2,280 1,910 12,663 289 326 52 59 52 59 8.1% 12.7% 43.8 38.9 26.5 22.9 5.1 4.6 12.4 12.6
Heavy Equipment 120,483 7,463 8,439 2,001 2,262 49.2% 13.1% 16.1 14.3 7.0 5.9 2.7 2.4 18.0 18.1
United Tractors BUY 32,300 39,000 120,483 7,463 8,439 2,001 2,262 2,001 2,262 49.2% 13.1% 16.1 14.3 7.0 5.9 2.7 2.4 18.0 18.1
Industrial Estate 11,179 2,352 1,187 38 19 103.6% -49.5% 4.8 9.4 7.7 7.0 0.7 0.7 16.3 7.7
Puradelta Lestari BUY 126 240 6,073 733 746 15 15 14 14 -3.2% 1.8% 8.3 8.1 7.5 7.4 0.8 0.8 9.9 9.9
Bekasi Fajar BUY 244 320 2,354 488 543 51 56 50 56 45.4% 11.3% 4.8 4.3 5.8 5.0 0.6 0.5 13.5 13.2
Surya Semesta HOLD 585 540 2,753 1,131 (103) 240 (22) (119) (32) 1711.1% -109.1% 2.4 (26.8) 11.9 10.9 0.7 0.8 33.2 (2.8)
Media 45,060 2,965 3,365 103 116 3.3% 13.5% 15.2 13.4 9.3 8.5 3.5 3.1 23.6 24.7
Media Nusantara Citra BUY 2,120 3,100 30,998 1,491 1,605 102 110 102 110 -0.6% 7.6% 20.8 19.3 14.3 13.2 8.3 7.5 41.6 40.6
Surya Citra Media BUY 985 1,415 14,062 1,474 1,760 103 123 103 123 7.7% 19.5% 9.5 8.0 5.7 5.1 1.5 1.4 16.4 18.2
Mining 211,346 14,754 17,040 166 192 68.4% 15.5% 14.3 12.4 6.0 5.4 1.7 1.6 12.3 13.4
Adaro Energy BUY 1,825 2,800 58,374 6,283 7,376 196 231 198 231 40.1% 17.4% 9.3 7.9 3.6 3.1 1.3 1.2 14.4 16.0
Timah BUY 845 1,400 6,293 366 377 49 51 49 51 45.2% 3.0% 17.2 16.7 7.0 6.8 1.0 1.0 6.3 6.2
Vale Indonesia HOLD 4,270 3,300 42,428 (74) 233 (7) 23 (7) 23 -394.4% -415.1% (572.9) 181.8 22.9 19.0 1.8 1.8 (0.3) 1.0
Aneka Tambang HOLD 870 1,000 20,907 (264) (68) (11) (3) (11) (3) -507.2% -74.4% (79.2) (309.3) 34.5 36.3 1.2 1.2 (1.4) (0.4)
Bukit Asam BUY 4,260 3,600 49,078 4,476 4,623 412 425 412 425 123.1% 3.3% 10.3 10.0 7.0 6.6 3.6 2.9 37.3 30.5
Indo Tambangraya Megah BUY 24,200 33,200 27,344 3,384 3,903 2,995 3,455 3,232 3,617 93.2% 15.3% 8.1 7.0 3.7 3.2 2.1 1.9 27.1 28.9
Harum Energy HOLD 2,560 3,100 6,921 583 595 216 220 216 220 225.8% 2.1% 11.9 11.6 3.3 2.9 1.7 1.6 14.7 14.1
Plantation 31,656 3,010 2,986 283 281 -1.1% -0.8% 10.5 10.6 5.7 5.4 1.0 1.0 10.3 9.5
Astra Agro Lestari HOLD 10,650 14,800 20,498 1,908 1,851 991 962 984 962 -4.9% -3.0% 10.7 11.1 5.9 5.5 1.1 1.0 10.7 9.6
Sampoerna Agro HOLD 2,330 2,700 4,404 283 301 156 166 156 166 -35.8% 6.4% 15.0 14.1 8.6 8.3 1.2 1.1 8.0 8.0
PP London Sumatra BUY 990 1,700 6,755 819 833 120 122 823 833 37.9% 1.7% 8.2 8.1 3.5 3.3 0.8 0.8 10.3 9.8
Poultry 90,158 4,078 5,292 27 35 -10.9% 29.8% 22.1 17.0 11.6 10.0 3.1 2.7 15.2 16.8
Charoen Pokphand HOLD 3,960 4,000 64,936 2,576 3,405 157 208 182 216 16.0% 32.2% 25.2 19.1 13.2 11.3 3.9 3.3 16.7 18.6
Japfa Comfeed BUY 2,000 1,850 23,453 1,463 1,811 128 159 128 159 -29.2% 23.8% 15.6 12.6 9.6 8.3 2.3 2.0 15.4 16.4
Malindo Feedmill HOLD 790 840 1,769 39 75 18 34 80 110 -86.4% 91.5% 44.9 23.4 6.2 5.6 0.9 0.8 2.0 3.5
Property 89,643 8,450 8,432 70 70 56.5% -0.2% 10.6 10.6 8.3 8.4 1.4 1.3 14.3 12.6
Alam Sutera HOLD 324 400 6,366 1,379 1,435 70 73 70 75 171.1% 4.1% 4.6 4.4 7.1 6.3 0.8 0.7 17.9 16.2
Bumi Serpong Damai BUY 1,395 2,000 26,849 3,909 2,755 203 143 244 182 117.6% -29.5% 6.9 9.7 5.7 7.9 1.1 1.0 17.4 10.8
Ciputra Development BUY 1,025 1,350 19,024 940 1,493 51 80 35 67 -29.7% 58.8% 20.2 12.7 12.1 9.9 1.4 1.3 7.1 10.4
Pakuw on Jati HOLD 540 720 26,006 1,937 2,384 40 49 40 50 14.5% 24.0% 13.6 11.0 9.5 8.1 2.5 2.1 20.4 21.0
Summarecon BUY 790 1,100 11,397 284 364 20 25 31 35 -8.9% 28.3% 40.2 31.3 11.0 10.4 1.8 1.7 4.5 5.5
Retail 83,045 3,402 3,823 69 78 5.1% 12.4% 24.4 21.7 12.5 11.3 5.4 4.9 23.4 23.9
Mitra Adi Perkasa BUY 800 10,000 13,280 347 509 210 308 210 308 66.5% 46.8% 3.8 2.6 9.1 7.8 4.1 4.1 10.7 15.6
Ramayana HOLD 1,440 1,500 10,218 431 462 67 70 67 70 10.9% 4.9% 21.6 20.6 16.0 14.7 2.9 2.6 12.5 12.4
Matahari Department Store BUY 8,700 12,500 25,386 1,928 2,029 661 696 719 777 -4.5% 5.3% 13.2 12.5 8.0 7.2 10.0 7.6 87.8 69.1
Matahari Putra Prima SELL 256 250 1,377 109 112 17 17 17 17 183.4% 2.7% 15.3 14.9 1.4 1.4 0.6 0.5 4.4 4.5
Ace Hardw are BUY 1,335 1,550 22,895 588 711 43 47 43 47 3.2% 9.3% 31.0 28.4 29.1 27.7 6.7 6.0 18.2 19.7
Erajaya Sw asembada BUY 3,100 2,200 9,889 303 339 105 117 105 117 14.9% 11.8% 29.7 26.5 16.5 14.6 2.7 2.5 8.6 9.0
PER (x)
Equity
Valuation Net profit, Rp bn EPS (Rp) Core EPS (Rp) EPS Growth ROE EV / EBITDA (x) PBV (x)
Equity SNAPSHOT Monday, July 23, 2018
Danareksa Sekuritas – Equity SNAPSHOT
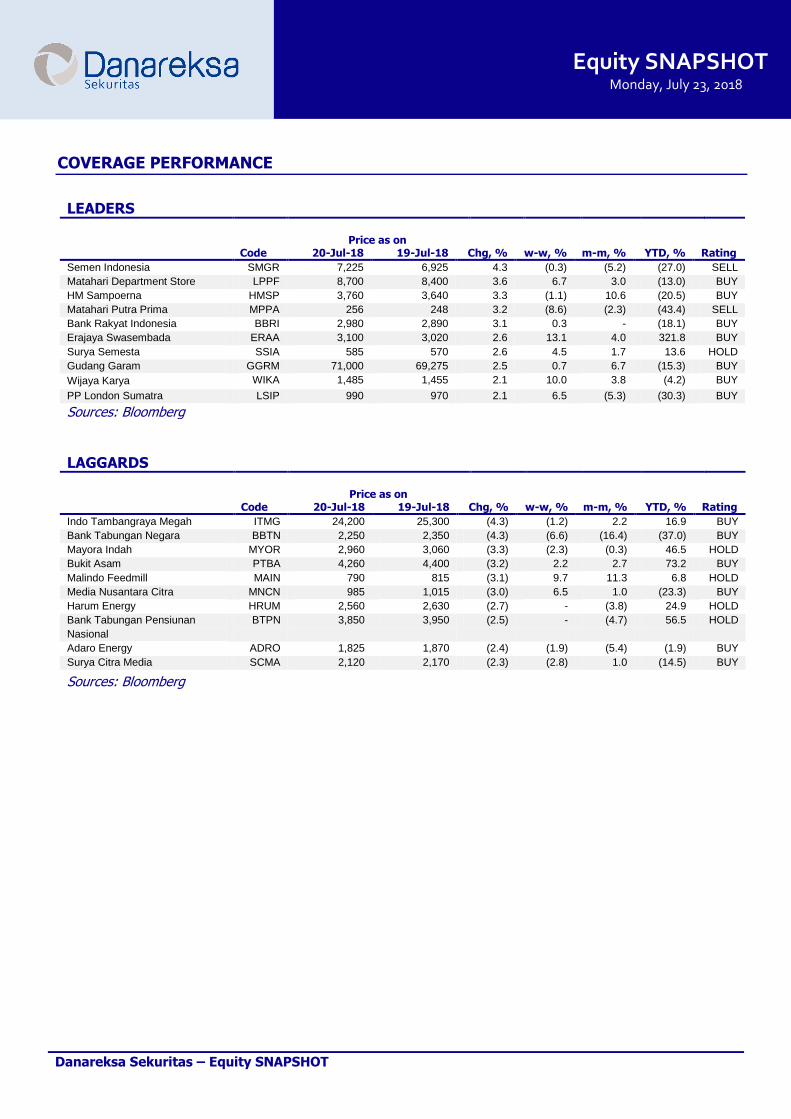
LEADERS Price as on Code 20-Jul-18 19-Jul-18 Chg, % w-w, % m-m, % YTD, % Rating
Semen Indonesia SMGR 7,225 6,925 4.3 (0.3) (5.2) (27.0) SELL
Matahari Department Store LPPF 8,700 8,400 3.6 6.7 3.0 (13.0) BUY
HM Sampoerna HMSP 3,760 3,640 3.3 (1.1) 10.6 (20.5) BUY
Matahari Putra Prima MPPA 256 248 3.2 (8.6) (2.3) (43.4) SELL
Bank Rakyat Indonesia BBRI 2,980 2,890 3.1 0.3 - (18.1) BUY
Erajaya Swasembada ERAA 3,100 3,020 2.6 13.1 4.0 321.8 BUY
Surya Semesta SSIA 585 570 2.6 4.5 1.7 13.6 HOLD
Gudang Garam GGRM 71,000 69,275 2.5 0.7 6.7 (15.3) BUY
Wijaya Karya WIKA 1,485 1,455 2.1 10.0 3.8 (4.2) BUY
PP London Sumatra LSIP 990 970 2.1 6.5 (5.3) (30.3) BUY
Sources: Bloomberg
LAGGARDS Price as on Code 20-Jul-18 19-Jul-18 Chg, % w-w, % m-m, % YTD, % Rating
Indo Tambangraya Megah ITMG 24,200 25,300 (4.3) (1.2) 2.2 16.9 BUY
Bank Tabungan Negara BBTN 2,250 2,350 (4.3) (6.6) (16.4) (37.0) BUY
Mayora Indah MYOR 2,960 3,060 (3.3) (2.3) (0.3) 46.5 HOLD
Bukit Asam PTBA 4,260 4,400 (3.2) 2.2 2.7 73.2 BUY
Malindo Feedmill MAIN 790 815 (3.1) 9.7 11.3 6.8 HOLD
Media Nusantara Citra MNCN 985 1,015 (3.0) 6.5 1.0 (23.3) BUY
Harum Energy HRUM 2,560 2,630 (2.7) - (3.8) 24.9 HOLD
Bank Tabungan Pensiunan
Nasional
BTPN 3,850 3,950 (2.5) - (4.7) 56.5 HOLD
Adaro Energy ADRO 1,825 1,870 (2.4) (1.9) (5.4) (1.9) BUY
Surya Citra Media SCMA 2,120 2,170 (2.3) (2.8) 1.0 (14.5) BUY
Sources: Bloomberg
COVERAGE PERFORMANCE

Equity SNAPSHOT Monday, July 23, 2018
Danareksa Sekuritas – Equity SNAPSHOT
PREVIOUS REPORTS
Bank Mandiri: So far, so good, BPD Jatim: Steady growth SnapShot20180720
Bank Negara Indonesia: Better balanced, Bank Tabungan Negara: Limiting the downside, Waskita Beton Precast: A Toll Road in East Java SnapShot20180719
Property: 1H18 Marketing Sales Check – In Line, Astra International: Decent upside following the correction, Bank Tabungan Pensiunan Nasional: Retaining its focus on the mass-market segment SnapShot20180718
Strategy: Turned into deficit in 2Q despite strong June surplus, Kimia Farma: On-track expansion SnapShot20180717 Bekasi Fajar Industrial Estate: Slow But Sure, Vale Indonesia: Brighter Outlook SnapShot20180713
Ramayana Lestari Sentosa: Modest growth in 1H18 revenues, Trade outlook - June Outlook: Softening on
Seasonality SnapShot20180712

Equity SNAPSHOT Monday, July 23, 2018
Danareksa Sekuritas – Equity SNAPSHOT
Adeline Solaiman
[email protected] (62-21) 2955 888 ext. 3503 Media, Retail, Poultry
PT Danareksa Sekuritas
Jl. Medan Merdeka Selatan No. 14 Jakarta 10110 Indonesia Tel (62 21) 29 555 888 Fax (62 21) 350 1709
Equity Research Team S
Sales team
Novrita E. Putrianti
[email protected] (62-21) 29555 888 ext. 3128
Ehrliech Suhartono
[email protected] (62-21) 29555 888 ext. 3132
Maria Renata
[email protected] (62-21) 29555 888 ext.3513 Construction
Laksmita Armandani
[email protected] (62-21) 29555 888 ext. 3125
Ignatius Teguh Prayoga
[email protected] (62-21) 29555 888 ext.3511 Research Associate
Tuty Sutopo
[email protected] (62-21) 29555 888 ext. 3121
Upik Yuzarni
(62-21) 29555 888 ext. 3137
Giovan Sitepu
(62-21) 29555 888 ext. 3130
Stefanus Darmagiri
[email protected] (62-21) 2955 888 ext. 3530 Auto, Coal, Heavy Equip, Metal, Cement
Natalia Sutanto
[email protected] (62-21) 29555 888 ext.3508 Consumer, Tobacco, Property
Yudha Gautama
[email protected] (62-21) 29555 888 ext.3509 Plantation, Property
Helmy Kristanto
[email protected] (62-21) 2955 888 ext. 3500
Head of Research, Strategy
Eka Savitri
[email protected] (62-21) 29555 888 ext.3506 Banking
Rendy Ben Philips
[email protected] (62-21) 29555 888 ext. 3148
Equity SNAPSHOT Monday, July 23, 2018
Danareksa Sekuritas – Equity SNAPSHOT
Disclaimer
The information contained in this report has been taken from sources which we deem reliable. However, none of P.T. Danareksa Sekuritas and/or its affiliated companies and/or their respective employees and/or agents makes any representation or warranty (express or implied) or accepts any responsibility or liability as to, or in relation to, the accuracy or completeness of the information and opinions contained in this report or as to any information contained in this report or any other such information
or opinions remaining unchanged after the issue thereof.
We expressly disclaim any responsibility or liability (express or implied) of P.T. Danareksa Sekuritas, its affiliated companies and their respective employees and agents
whatsoever and howsoever arising (including, without limitation for any claims, proceedings, action , suits, losses, expenses, damages or costs) which may be brought against or suffered by any person as a results of acting in reliance upon the whole or any part of the contents of this report and neither P.T. Danareksa Sekuritas, its
affiliated companies or their respective employees or agents accepts liability for any errors, omissions or misstatements, negligent or otherwise, in the report and any liability in respect of the report or any inaccuracy therein or omission there from which might otherwise arise is hereby expresses disclaimed.
The information contained in this report is not be taken as any recommendation made by P.T. Danareksa Sekuritas or any other person to enter into any agreement with regard to any investment mentioned in this document. This report is prepared for general circulation. It does not have regards to the specific person who may receive this report. In considering any investments you should make your own independent assessment and seek your own professional financial and legal advice.