molybdate inhibition of sulphate reduction in two-phase anaerobic digestion
TRANSCRIPT

www.elsevier.com/locate/procbio
Process Biochemistry 40 (2005) 2079–2089
Molybdate inhibition of sulphate reduction in two-phase
anaerobic digestion
M. Hasnain Isaa,*, G.K. Andersonb
aSchool of Civil Engineering, Engineering Campus, Universiti Sains Malaysia, 14300 Nibong Tebal, Penang, MalaysiabSchool of Civil Engineering and Geosciences, University of Newcastle upon Tyne, Newcastle upon Tyne NE1 7RU, UK
Received 22 November 2003; accepted 16 July 2004
Abstract
Several researchers have used molybdate (MoO42�) for the selective inhibition of sulphate reducing bacteria (SRB) in anaerobic digestion.
The feasibility of using MoO42� for the control of sulphate reduction in biological reactors, however, is not well established as some published
results have also indicated an adverse effect on methane producing bacteria (MPB). Two possible reasons may be attributed for this
observation, namely: (a) chronic inhibition of MPBs by MoO42� and (b) preferential acclimatisation of acidogenic bacteria to MoO4
2�. A
two-phase anaerobic digestion experiment was conducted to establish the reason for the cessation of methanogenesis as mentioned above. The
idea was to grow acidogenic and methanogenic bacteria in separate reactors so that the effect of MoO42� could be evaluated independently.
The experiment comprised a 4.55-l packed-bed acidogenic reactor and a 4.75-l suspended-biomass methanogenic reactor operated over a
period of more that 3 months. Glucose and Na2SO4 were used as the carbon and sulphate sources respectively. The concentration of MoO42�
used in the test was 2.5 mM. The study showed that MoO42� inhibited both sulphate reduction as well as methane production and caused a
change in VFA dominance from acetic to butyric acid. Acetic acid dominance in the reactor was resumed after the loading rate was decreased.
Whereas SRBs showed complete recovery from the MoO42� dose once it was omitted from the feed, MPBs did not recover. MoO4
2� was
bacteriostatic to SRBs and bacteriocidal to MPBs. Acidogenic bacteria were the first to acclimatise to MoO42�. MoO4
2� is not a suitable
selective inhibitor of SRBs in anaerobic reactors.
# 2004 Elsevier Ltd. All rights reserved.
Keywords: Two-phase anaerobic digestion; Sulphate reducing bacteria (SRB); Methane producing bacteria (MPB); Inhibition; Molybdate
1. Introduction
The reduction of sulphate to sulphide by sulphate
reducing bacteria (SRB) during anaerobic digestion of
wastewaters has a number of problems associated with it;
including the sharing of methanogenic substrate to result in
lower methane production, precipitation of trace metals such
as Fe, Ni and Co by S2� to cause nutrient deficiency to
methane producing bacteria (MPB), requirement for
expensive corrosion resistant tank lining, corrosion of
burners, odour, requirement of post-treatment due to
increased oxygen demand of treated effluents and toxicity
to methanogenic bacteria. Control of sulphate reduction
* Corresponding author. Tel.: +60 604 593 7788x6217;
fax: +60 604 594 1009.
E-mail address: [email protected] (M.H. Isa).
0032-9592/$ – see front matter # 2004 Elsevier Ltd. All rights reserved.
doi:10.1016/j.procbio.2004.07.025
(sulphide production) in anaerobic digestion processes,
therefore, presents an area of interest to many researchers.
Methods for dealing with hydrogen sulphide in anaerobic
digesters include pH adjustment, precipitation with iron salts
and off-gas scrubbing. Selective inhibition of sulphate
reducing bacteria (SRB), however, may present an ideal
solution as it would prevent sharing of methanogenic
substrate by SRBs and hence could provide an economic
solution.
Several researchers have used molybdate (MoO42�) for
the selective inhibition of SRBs [1–4] because in addition to
being an SRB inhibitor, it is also a nutrient for MPBs. The
feasibility of using molybdate for the control of sulphate
reduction in biological reactors, however, is not well
established as some published results have also indicated an
adverse effect on MPBs [5,6]. These reports have shown
resumption of SO42� reduction, inhibition of methanogen-

M.H. Isa, G.K. Anderson / Process Biochemistry 40 (2005) 2079–20892080
esis and accumulation of volatile fatty acids in the reactors.
The presence of acetic acid in the reactors shows that non-
availability of methanogenic substrate was not the under-
lying problem for the inhibition of CH4 production in these
studies. Two possible reasons may thus be attributed to this
observation.
(a) C
hronic inhibition of MPBs by MoO42�.(b) P
referential acclimatisation of acidogenic bacteria toMoO42�.
Case (a) results in an obvious response of non-utilisation of
acetic acid. In case (b), accumulation of acetic acid can be
explained in the light of upsetting the microbial species
balance which would otherwise cause acetate to be utilised
(converted to CH4) as soon as it was produced.
A two-phase anaerobic digestion experiment was con-
ducted to establish the reason for the cessation of
methanogenesis as discussed above. Acidogenic and metha-
nogenic bacteria were grown in separate reactors so that the
effect of MoO42� on them could be evaluated independently.
2. Materials and methods
The system used for this study (Fig. 1) [7] was part of a
compact package-unit developed by Armfield Ltd. for
laboratory biological wastewater treatment studies. It had
individual units mounted on a stainless steel base equipped
with an automatic monitoring and control board.
Fig. 1. Schematic diagram of tw
The two reactors were made of plexi-glass columns, each
approximately 360 mm high and 140 mm i.d. Each reactor
was maintained at 35 � 1 8C using jacket heating con-
trollers. Watson–Marlow peristaltic pumps were used for
feeding the reactors. Effluent was discharged via an inverted
siphon to prevent the escape of biogas and gas volumes were
measured by collecting the gas in Mariotte flasks using water
as the displacement liquid.
2.1. Acidogenic reactor
The acidogenic reactor was an upflow anaerobic packed
bed reactor. It was randomly packed with 130 non-porous
Etapak pal-rings confined within two metal grids spaced
245 mm apart. The lower grid was 40 mm above the base of
the reactor. The pal-rings were 27.5 mm high, 25.4 mm in
diameter and had a specific surface area of 100 m2/m3 with
95–97% void space. A centrally located glass tube was used
to feed the reactor. The liquid level in the reactor was
maintained at 35 mm above the packing medium to keep it
fully submerged and the headspace was 40 mm. The
effective volume of the reactor was 4.55 l.
2.2. Methanogenic reactor
The methanogenic reactor employed for the study was an
upflow anaerobic reactor (suspended biomass) with a
centrally located glass tube for feeding. Its effective volume
was 4.75 l. In order to maintain a higher hydraulic retention
time (HRT) in the reactor, a 250-ml storage vessel was
o-phase anaerobic reactors.
M.H. Isa, G.K. Anderson / Process Biochemistry 40 (2005) 2079–2089 2081
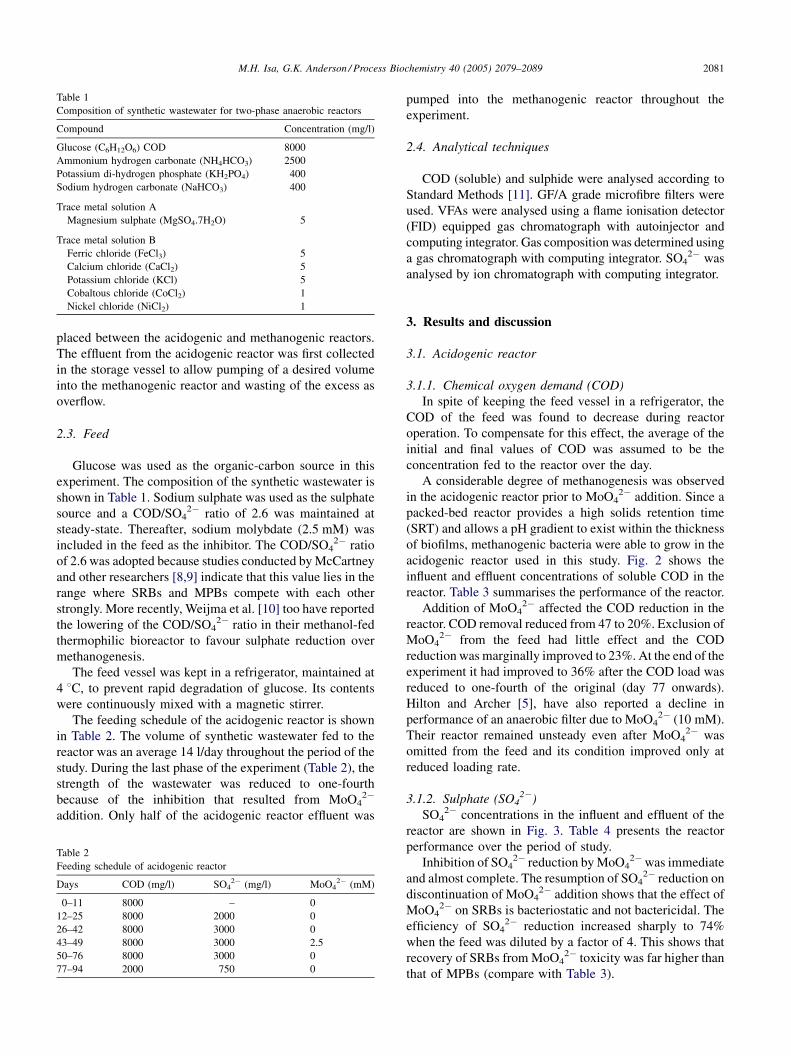
Table 1
Composition of synthetic wastewater for two-phase anaerobic reactors
Compound Concentration (mg/l)
Glucose (C6H12O6) COD 8000
Ammonium hydrogen carbonate (NH4HCO3) 2500
Potassium di-hydrogen phosphate (KH2PO4) 400
Sodium hydrogen carbonate (NaHCO3) 400
Trace metal solution A
Magnesium sulphate (MgSO4.7H2O) 5
Trace metal solution B
Ferric chloride (FeCl3) 5
Calcium chloride (CaCl2) 5
Potassium chloride (KCl) 5
Cobaltous chloride (CoCl2) 1
Nickel chloride (NiCl2) 1
placed between the acidogenic and methanogenic reactors.
The effluent from the acidogenic reactor was first collected
in the storage vessel to allow pumping of a desired volume
into the methanogenic reactor and wasting of the excess as
overflow.
2.3. Feed
Glucose was used as the organic-carbon source in this
experiment. The composition of the synthetic wastewater is
shown in Table 1. Sodium sulphate was used as the sulphate
source and a COD/SO42� ratio of 2.6 was maintained at
steady-state. Thereafter, sodium molybdate (2.5 mM) was
included in the feed as the inhibitor. The COD/SO42� ratio
of 2.6 was adopted because studies conducted by McCartney
and other researchers [8,9] indicate that this value lies in the
range where SRBs and MPBs compete with each other
strongly. More recently, Weijma et al. [10] too have reported
the lowering of the COD/SO42� ratio in their methanol-fed
thermophilic bioreactor to favour sulphate reduction over
methanogenesis.
The feed vessel was kept in a refrigerator, maintained at
4 8C, to prevent rapid degradation of glucose. Its contents
were continuously mixed with a magnetic stirrer.
The feeding schedule of the acidogenic reactor is shown
in Table 2. The volume of synthetic wastewater fed to the
reactor was an average 14 l/day throughout the period of the
study. During the last phase of the experiment (Table 2), the
strength of the wastewater was reduced to one-fourth
because of the inhibition that resulted from MoO42�
addition. Only half of the acidogenic reactor effluent was
Table 2
Feeding schedule of acidogenic reactor
Days COD (mg/l) SO42� (mg/l) MoO4
2� (mM)
0–11 8000 – 0
12–25 8000 2000 0
26–42 8000 3000 0
43–49 8000 3000 2.5
50–76 8000 3000 0
77–94 2000 750 0
pumped into the methanogenic reactor throughout the
experiment.
2.4. Analytical techniques
COD (soluble) and sulphide were analysed according to
Standard Methods [11]. GF/A grade microfibre filters were
used. VFAs were analysed using a flame ionisation detector
(FID) equipped gas chromatograph with autoinjector and
computing integrator. Gas composition was determined using
a gas chromatograph with computing integrator. SO42� was
analysed by ion chromatograph with computing integrator.
3. Results and discussion
3.1. Acidogenic reactor
3.1.1. Chemical oxygen demand (COD)
In spite of keeping the feed vessel in a refrigerator, the
COD of the feed was found to decrease during reactor
operation. To compensate for this effect, the average of the
initial and final values of COD was assumed to be the
concentration fed to the reactor over the day.
A considerable degree of methanogenesis was observed
in the acidogenic reactor prior to MoO42� addition. Since a
packed-bed reactor provides a high solids retention time
(SRT) and allows a pH gradient to exist within the thickness
of biofilms, methanogenic bacteria were able to grow in the
acidogenic reactor used in this study. Fig. 2 shows the
influent and effluent concentrations of soluble COD in the
reactor. Table 3 summarises the performance of the reactor.
Addition of MoO42� affected the COD reduction in the
reactor. COD removal reduced from 47 to 20%. Exclusion of
MoO42� from the feed had little effect and the COD
reduction was marginally improved to 23%. At the end of the
experiment it had improved to 36% after the COD load was
reduced to one-fourth of the original (day 77 onwards).
Hilton and Archer [5], have also reported a decline in
performance of an anaerobic filter due to MoO42� (10 mM).
Their reactor remained unsteady even after MoO42� was
omitted from the feed and its condition improved only at
reduced loading rate.
3.1.2. Sulphate (SO42�)
SO42� concentrations in the influent and effluent of the
reactor are shown in Fig. 3. Table 4 presents the reactor
performance over the period of study.
Inhibition of SO42� reduction by MoO4
2� was immediate
and almost complete. The resumption of SO42� reduction on
discontinuation of MoO42� addition shows that the effect of
MoO42� on SRBs is bacteriostatic and not bactericidal. The
efficiency of SO42� reduction increased sharply to 74%
when the feed was diluted by a factor of 4. This shows that
recovery of SRBs from MoO42� toxicity was far higher than
that of MPBs (compare with Table 3).

M.H. Isa, G.K. Anderson / Process Biochemistry 40 (2005) 2079–20892082
Fig. 2. Soluble COD concentration vs. time for acidogenic reactor.
3.1.3. Sulphide (S2�)
Fig. 4 shows the sulphide concentration in the effluent
from the acidogenic reactor. The complete disappearance of
S2� from the effluent verifies the inhibition potential of
MoO42� to SRBs. Beyond day 50, S2� started to reappear in
the effluent. At reduced loading rate, the S2� concentration
was observed to be comparable to the initial values (i.e. at
full load). This may be attributed to the high rate of CH4
production prior to MoO42� addition which resulted in
stripping of H2S and thus maintained a low S2� concentra-
tion in the reactor.
The results obtained in this study do not appear
to be affected by S2� toxicity as its concentration was
low (50 mg/l). Mizuno et al. [12] observed no inhibition
of sucrose degradation at free H2S concentration up to
99 mg/l.
3.1.4. Volatile fatty acid (VFA)
Fig. 5 shows the equivalent COD concentration of VFA
relative to the total COD of the reactor effluent. The degree
of acidification (based on effluent COD) prior to MoO42�
addition was high, about 81%. After addition of MoO42�
from day 43, acidification reduced to a minimum of 15% on
day 45. Acidogens, however, rapidly acclimatised to
MoO42� as indicated by the recovery of acidification of
Table 3
COD of acidogenic reactora
Number Flow (l/day) OLRb (kg COD/(m3 day) CODinf (mg/l) COD
1 14.16 23.75 7630 405
2 14.17 23.70 7610 608
3 14.25 23.61 7540 582
4 13.60 5.38 1800 115
a Values are average based upon days 35–43 for (1), 46–50 for (2), 62–76 fob Organic loading rate.
up to 44% on day 49 even though MoO42� was still being
added. After MoO42� addition was stopped on day 50, the
degree of acidification averaged 67% (days 62–76). It was
almost complete (99%, averaged over days 88–94) when the
loading rate was reduced to one-fourth.
The variation of individual volatile acids over the period
of study is shown in Fig. 6. In the presence of SO42�, the
concentration of volatile acids were generally in the order
acetic > butyric > propionic > valeric. The addition of
MoO42� changed the composition of VFA with a sharp
increase in butyric acid concentration and a rapid reduction
in acetic acid concentration. Butyric acid then became the
dominant volatile acid. Butyric rather than acetic acid tend
to be the main fermentation product when there is an
accumulation of H2 in the system [13]. Exclusion of
MoO42� from the feed led to a reduction in butyric acid and
an increase in acetic acid concentrations. These acids were
now, however, in comparable proportions (Fig. 6). Reduc-
tion of the loading rate re-established the dominance of
acetic acid and the reactor appeared to be no longer under the
effect of MoO42�.
3.1.5. Methane (CH4)
The volume of CH4 produced per day and the percentage
of CH4 in the digester gas are shown in Fig. 7. The addition
eff (mg/l) MoO42� (mM) COD removal (g/day) Efficiency (%)
0 0 50.69 47
0 2.5 21.68 20
0 0 24.51 23
0 0 8.84 36
r (3) and 88–94 for (4).

M.H. Isa, G.K. Anderson / Process Biochemistry 40 (2005) 2079–2089 2083
Fig. 3. Sulphate concentration vs. time for acidogenic reactor.
of MoO42� resulted in a reduction of both the quantity as
well as the percentage of CH4. No significant amount of CH4
was recorded even at the reduced load. This shows that COD
removal in this period was basically due to SO42� reduction
and not methanogenesis. In other words, SRBs were able to
recover better from the shock due to MoO42� and
acclimatise better to MoO42� than MPBs.
3.2. Methanogenic reactor
3.2.1. Chemical oxygen demand (COD)
Fig. 8 shows the variation of soluble COD in the
methanogenic reactor. A summary of the performance of the
reactor is given in Table 5.
Methanogenesis was strongly affected by MoO42�. The
efficiency of COD removal was reduced from 44 to 8% by
the addition of MoO42�. It did not recover despite exclusion
of MoO42� from the feed and reduction of the organic
loading rate.
3.2.2. Sulphate (SO42�)
SO42� concentrations in the reactor are shown in Fig. 9.
The performance of the reactor is shown in Table 6.
As is evident from Fig. 9, SRBs were coexisting with
MPBs in the reactor. The SO42� removal efficiency,
Table 4
SO42� of acidogenic reactora
Number Flow (l/day) SLRb (kg COD/m3 day) SO42�
inf (mg/l) SO42�
1 14.16 9.31 2990 1820
2 14.17 9.19 2950 2900
3 14.25 9.24 2950 2380
4 13.60 2.30 770 200
a Values are average based upon days 35–43 for (1), 46–50 for (2), 62–76 fob SO4
2� loading rate.
however, was generally lower than in the acidogenic reactor
(compare Tables 4 and 6) in different phases of the study.
The sharp increase in effluent SO42� concentration
(reduction in SO42� removal efficiency) shows strong
inhibition of SRBs by MoO42�. In this case as well, SO4
2�
reduction resumed after MoO42� was excluded from the
feed.
3.2.3. Sulphide (S2�)
Unlike the acidogenic reactor which received no S2�
from the influent, the influent of the methanogenic reactor
(i.e. effluent of the acidogenic reactor) contained S2� which
appeared as a result of SO42� reduction in the acidogenic
reactor. Thus it would be reasonable to expect S2� in the
effluent of the methanogenic reactor even if it were not
produced in it. Fig. 10 shows the influent and effluent S2�
concentration of the methanogenic reactor. Higher S2�
concentration in the effluent of the reactor than its influent
confirms the reduction of SO42� in the reactor. S2�
completely disappeared from the effluent on addition of
MoO42�, but reappeared when MoO4
2� addition was
discontinued. Though SO42� reduction was observed at
the reduced loading rate, Fig. 10 shows that the S2�
concentration in the effluent was not substantially higher
than that in the influent (as it was prior to MoO42� addition).
eff (mg/l) MoO42� (mM) SO4
2� removal (g/day) Efficiency (%)
0 16.57 39
2.5 0.71 2
0 8.12 19
0 7.75 74
r (3) and 88–94 for (4).

M.H. Isa, G.K. Anderson / Process Biochemistry 40 (2005) 2079–20892084
Fig. 4. Sulphide concentration vs. time for acidogenic reactor.
The reduced load together with the high SO42� removal
in the acidogenic reactor (Table 4) left only a very small
amount of SO42� in the influent of the methanogenic reactor
(200 mg/l). The efficiency of SO42� reduction in the
methanogenic reactor during this period was 15%. Bearing
in mind that stochiometrically, the S2� produced equals one-
third of the SO42� reduced, an estimate of S2� produced
yields 200 � 0.15 � (1/3) i.e. only 10 mg/l. Apart from
assimilation into cells and precipitation in the reactor, this
amount will be distributed between the liquid and gas phases
of the reactor contents and considering the possibility of loss
of S2� as H2S gas during transportation and analysis of
samples and the accuracy of the visual colour comparison
technique used for its determination, it is not unreasonable to
Fig. 5. VFA-COD relative to CO
expect little difference in the influent and effluent S2�
concentrations.
3.2.4. Volatile fatty acid (VFA)
The equivalent COD of VFA relative to the total COD of
the reactor effluent is shown in Fig. 11 while Table 7 shows
the degree of acidification in the methanogenic reactor. The
effect of MoO42� was similar to that observed in the case of
the acidification reactor i.e. from initial inhibition by
MoO42� to acclimatisation and recovery after MoO4
2� was
omitted from the feed. At reduced loading rate, acidification
was almost complete here as well (Fig. 11).
The degree of acidification calculated as 50% for the last
phase of the experiment is not realistic as the unacidified
D for acidogenic reactor.

M.H. Isa, G.K. Anderson / Process Biochemistry 40 (2005) 2079–2089 2085
Fig. 6. Individual VFA distribution in acidogenic reactor.
influent COD was only 20 mg/l which is merely about 2.0%
of the soluble COD. This is a very low concentration and
keeping in view the high concentration of the influent VFA
(>1100 mg/l), this low value is unlikely to cause a
significant measurable difference.
Fig. 12 shows the variation of individual volatile acids in
the effluent of the methanogenic reactor over the period of
study. Generally, the concentrations of volatile acids were in
the order acetic > butyric > propionic > valeric prior to
MoO42� addition (similar to that of the acidogenic reactor).
Addition of MoO42� caused butyric acid to dominate over
acetic acid. On exclusion of MoO42� from the feed, the
concentration of butyric acid decreased such that it was
comparable, but lower than the concentration of acetic acid.
Fig. 7. Methane production vs. t
Reduced loading rate resulted in a distinct dominance of
acetic acid again.
It may be recalled that in the last phase (i.e. reduced
loading rate) of the experiment, there was no observable
COD reduction (Table 5). It appeared that this reactor too
was behaving merely as an acidification reactor.
3.2.5. Methane (CH4)
Fig. 13 shows the daily CH4 production and percentage of
CH4 in the digester gas. Addition of MoO42� caused
cessation of CH4 production. Tables 5 and 7 show that before
MoO42� addition the reactor was able to treat an influent
VFA concentration of over 3200 mg/l with an overall soluble
COD removal efficiency of 44%. After exposure to MoO42�
ime for acidogenic reactor.

M.H. Isa, G.K. Anderson / Process Biochemistry 40 (2005) 2079–20892086
Fig. 8. Soluble COD concentrated vs. time for methanogenic reactor.
Table 5
COD of methanogenic reactora
Number Flow (l/day) OLRb (kg COD/(m3 day) CODinf (mg/l) CODeff (mg/l) MoO42� (mM) COD removal (g/day) Efficiency (%)
1 6.45 5.50 4050 2250 0 11.61 44
2 6.34 8.12 6080 5620 2.5 2.92 8
3 6.64 8.14 5820 5740 0 0.53 1
4 6.71 1.62 1150 1230 0 – –
a Values are average based upon days 35–43 for (1), 46–50 for (2), 62–76 for (3) and 88–94 for (4).b Organic loading rate.
the CH4 production, however, did not resume even though
MoO42� was omitted from the feed and the VFA
concentration was reduced to about 1100 mg/l (reduction
of loading rate). Methanogens were neither able to
acclimatise to MoO42� nor recover from its shock. It
Fig. 9. Sulphate concentration vs. ti
appears that the nature of toxicity of MoO42� to MPBs is
bactericidal rather than bacteriostatic.
Previous studies [3,4] show that MoO42� was effective as
a selective SRB inhibitor at concentrations of 3–5 mM in
batch experiments, while its feasibility in continuously fed
me for methanogenic reactor.

M.H. Isa, G.K. Anderson / Process Biochemistry 40 (2005) 2079–2089 2087
Table 6
SO42� of methanogenic reactora
Number Flow (l/day) SLRb (kg COD/m3 day) SO42�
inf (mg/l) SO42�
eff (mg/l) MoO42� (mM) SO4
2� removal (g/day) Efficiency (%)
1 6.45 2.47 1820 1300 0 3.35 29
2 6.34 3.87 2900 2710 2.5 1.20 7
3 6.64 3.33 2380 2070 0 2.06 13
4 6.71 0.28 200 170 0 0.20 15
a Values are average based upon days 35–43 for (1), 46–50 for (2), 62–76 for (3) and 88–94 for (4).b SO4
2� loading rate.
Fig. 10. Sulphide concentration vs. time for methanogenic reactor.
anaerobic reactors could not be established. The present
study shows specific inhibition of the methane producers due
to MoO42�. This is evident from the fact that after the
exclusion of MoO42� from the feed acetic acid production
recovered but methane production did not. Accumulation of
Fig. 11. VFA-COD relative to CO
VFAs (mainly acetic acid) after MoO42� addition has also
been reported by other researchers [5,6].
It appears that the reason behind the discrepancies in the
successful use of MoO42� as a selective SRB inhibitor
reported in literature is attributed to the way the experiments
D of methanogenic reactor.

M.H. Isa, G.K. Anderson / Process Biochemistry 40 (2005) 2079–20892088
Table 7
Acidification in methanogenic reactora
Number Influent (mg/l) Effluent (mg/l) MoO42� (mM) Acidification (%)
COD CODVFA Unacidified COD COD CODVFA Unacidified COD
1 4050 3270 780 2250 1830 420 0 46
2 6080 2300 3780 5620 2420 3200 2.5 15
3 5820 3920 1900 5740 4550 1190 0 37
4 1150 1130 20 1070 1060 10 0 50
a SO42� values are average based upon days 35–43 for (1), 46–50 for (2), 62–76 for (3) and 88–94 for (4).
Fig. 12. Individual VFA distribution in methanogenic reactor.
were conducted. Experiments showing its effectiveness were
generally conducted using serum bottle techniques (static,
one-time feed procedure) or for a short duration (a few hours
or days).
Fig. 13. Methane production f
It should be realised that none of these procedures
represent the true-life situation, which is characterised by
dynamic and long-term operation. These procedures at best
would only reflect the instantaneous response of the biomass
or methanogenic reactor.

M.H. Isa, G.K. Anderson / Process Biochemistry 40 (2005) 2079–2089 2089
and still leave sufficient room for uncertainties. For
example, because of a relatively delayed inhibition of
MPBs compared to SRBs, ample CH4 could have been
produced and collected in the head-space of a serum bottle to
provide a misleading conclusion. Also, a short-term
experiment will not reveal the acclimatisation capability
of bacteria as was demonstrated by SRBs in the present
study.
4. Conclusions
� SO42� reduction in the acidogenic reactor was higher than
was in the methanogenic reactor.
� M
oO42� induced inhibition of SO42� reduction was
immediate and complete.
� S
RBs showed complete recovery from the MoO42� onceit was omitted from the feed.
� S
howing their high potential for acclimatisation, acido-gens acclimatised to MoO42� even with its continued
inclusion in the feed.
� V
FA dominance was in the order acetic > butyric >propionic > valeric prior to exposure to MoO42� and with
the addition of MoO42� butyric acid became dominant
due to build-up of H2 in the reactor. Acetic acid
dominance in the reactor was resumed after the loading
rate was reduced.
� M
oO42� inhibited methanogenesis. Neither the dis-continuation of MoO42� addition in the feed nor the
reduction of loading rate helped to re-start CH4
production.
� M
PBs were neither able to acclimatise to MoO42� norrecover from its shock.
� M
oO42� is bactericidal to MPBs and bacteriostatic toSRBs.
� U
se of MoO42� as a selective inhibitor of SRBs inanaerobic reactors is not feasible.
References
[1] Smith RL, Klug MJ. Electron donors utilized by sulfate reducing
bacteria in eutrophic lake sediment. Appl Environ Microbiol
1981;42:116–21.
[2] Banat IM, Nedwell DB, Balba MT. Stimulation of methanogenesis by
slurries of saltmarsh sediment after the addition of molybdate to
inhibit sulfate reducing bacteria. J Gen Microbiol 1983;129:123–9.
[3] Tanaka S, Jayadevan J. Control of sulfate reduction by molybdate
addition in anaerobic digestion of sulfate-rich wastewater. In: Seventh
International Symposium on Anaerobic Digestion, Cape Town, South
Africa; 1994. p. 180–9.
[4] Tanaka S, Lee YH. Control of sulfate reduction by molybdate in
anaerobic digestion. In: Proceedings of ASIAN WATERQUAL’97,
Sixth IAWQ Asia-Pacific Regional Conference, Seoul, Korea; 1997;
p. 713–20.
[5] Hilton BL, Archer DB. Anaerobic digestion of a sulfate-rich molasses
wastewater: Inhibition of hydrogen sulfide production. Biotechnol
Bioeng 1988;31:885–8.
[6] Oonge Z, Parkin GF. Poisoning of sulfate reduction with molybdenum
in anaerobic reactors fed glucose. In: Proceedings of the 45th Indus-
trial Waste Conference, Purdue University, USA; 1992; p. 441–50.
[7] Hermana, J. Enhancing anaerobic digestion by manipulation of acid-
ogenesis-methanogenesis phases during two-phase anaerobic system.
Ph.D. thesis. University of Newcastle Upon Tyne, Newcastle Upon
Tyne, UK; 1997.
[8] McCartney DM, Oleszkiewicz JA. Competition between methanogens
and sulfate reducers: effect of COD:sulfate ratio and acclimation. Wat
Environ Res 1993;65(5):655–64.
[9] Choi E, Rim JM. Competition and inhibition of sulfate reducers and
methane producers in anaerobic treatment. Wat Sci Technol
1991;23:1259–64.
[10] Weijma J, Bots EAA, Tandlinger G, Stams AJM, Pol LWH, Lettinga
G. Optimisation of sulphate reduction in a methanol-fed thermophilic
bioreactor. Wat Res 2002;36:1825–33.
[11] APHA. Standard methods for the examination of water and waste-
water. 16th ed. Washington, DC: American Water Works Association;
1985.
[12] Mizuno O, Li YY, Noike T. The behavior of sulfate-reducing bacteria
in acidogenic phase of anaerobic digestion. Wat Res 1998;32(5):1626–
34.
[13] Mosey FE. Mathematical modelling of the anaerobic digestion pro-
cess: regulatory mechanisms for the formation of short-chain volatile
acids from glucose. Wat Sci Technol 1983;15:209–32.