molmicro resubmission final suppl figs new · pdf file450 pspa 1-222 effects of pspa 1-222...
TRANSCRIPT
Supporting information
The PspF-binding domain PspA1-144 and the PspA∙F complex - New insights into the coiled-coil dependent regulationof AAA+ proteins
Osadnik et al. (2015)
contains
Supporting Figures S1-S6Supporting tables S1-S2

N
C
C
N
A
C
CC1 CC2
NTR
coiled-coil core
extended hydro-phobic region
B
CC1 CC2N *
Conservation histogram Proteobacterial PspA
100
0
NTR
CC2
NTR
90°
D
E
NTR
Figure S1

Stereoscopic view of PspA M-domain superimposition C
N
C
N
C
N
C
N
C
N
C
N
C C
N N
Figure S2

WT
E23A
D24A
K27A
L28A
R30A
L31A I33
SQ34
AE35
AM
36A
E37A
D38A
Q136A
Q136K
B
PspA1-144
0
5
10
15
20
25
100
psp
A r
epor
ter
activ
ity (n
orm
aliz
ed)
empty
∆pspA reporter + PspA1-144
γ-proteobacterial PspA
100
0
100
All PspA/IM30 proteins
CC1 CC2N
N-terminal region (NTR) tip region NTR stabilization / FBR
Conservation
putative PspF binding region (FBR)
A
0
1
2
3
4
5
WT
K55A
K55E
R59A
R59E
psp
A r
epor
ter
activ
ity (n
orm
aliz
ed)
C
Regions of conservation in PspA1-144
Preliminary screens for conserved PspF-inhibiting residues in PspA1-144
PspA1-144
D24
L28
K27R30
E37
D38
L31Q34
I33M36
K55
R59
Q136
D Orientation of putative PspF-inhibiting residues in PspA1-144
PspA1-144
∆pspA reporter + PspA1-144
Figure S3
FT W E1 E2 E3 E4 E5 E6 E7
full-lengthPspA E37A
PspF
full-lengthWT-PspA
PspF
psp
A r
epor
ter
activ
ity (M
iller
Uni
ts)
1.3
5.3
1.4
2.8
1-22
21-
222
1-22
2
1-22
21-
144
1-14
41-
144
1-14
4
empty
empty
empty
empty
0
50
100
150
200
250
300
∆pspBWT ∆pspC ∆pspG
Full-length PspA induction effect depends on PspBC
WT
E37A
empty
psp
A r
epor
ter
activ
ity (M
iller
Uni
ts)
0
50
100
150
200
250
300
350
400
450
PspA1-222
Effects of PspA1-222
E37A in a WT reporter
A Effects of PspA1-144
E37A in a WT reporter
psp
A r
epor
ter
activ
ity (M
iller
Uni
ts)
0
50
100
150
200
250
300
350
400
450
WT
E37A
empty
PspA1-144
B
DC
E
PspF concentration is comparable in all tested strains
Co-Purification of full-length PspA and its variant with PspF
WT
E37A
R59E
WT
PspA1-144
PspA1-222
Figure S4
15
45
45
15

8 9 10 11 12 13 14 15 16 17 18 19 20 21 22
1:10
2:10
8:10
1:1
1:1 + AMPPNP
1:1+ATP
PspF
3:10
4:10
PspF1-265
1.7:1 + ATP
1.7:1 + AMPPNP
1.7:1
0.17:1
0.35:1
0.5:1
0.7:1
0.85:1
1:1
1.2:1
1.35:1
PspA1-144
PspF265only
1.7:1 + ATP
1.7:1 + AMPPNP
1.7:1
0.17:1
0.35:1
0.5:1
0.7:1
0.85:1
1:1
1.2:1
1.35:1
PspA145
only
Incr
easi
ng c
once
ntra
tion
of P
spA
free PspF
PspA:F complex
nucleotides
A B
0 2 4 6 8 100.00
0.05
0.10
0.15
0.20
0.05 mM ADP
0.25 mM ADP
1 µM PspF
Frac
tion
of U
V a
bso
rptio
n (2
30 n
m)
0.5 mM ADP
app)Sedimentation coef�cient (S
C
Dfree PspA
PspA (µM)0.0 0.2 0.4 0.6 0.8 1.0 2.0
frac
tion
of
fast
sed
imen
ting
spec
ies
(%)
0
20
40
60
80
100
1 µM PspF
WT
E37A
1.8
R59E
2 4 6 8 10 0
0.1
0.2
0.3
10 µM
app)
1µM
PspF6
PspF
Sedimentation coef�cient (S
Frac
tion
of U
V a
bso
rptio
n (2
30 n
m)
PspA·F complex formation in SEC concentration dependence of PspF self-hexamerization complex formation at low PspF concentration
effects of nucleotides at low PspF concentration
0
25
50
75
100
0 500 1000 1500 2000 2500
Pho
spha
te [µ
M]
Time after dilution (s)
Koff (app) ≈ 2.69∙10-4 s-1
Koff determination via de-repression of ATPase activity E
Figure S5

E37/Q136
K55/R59
A Atomistic simulation of PspA∙F complexes
FBR facing PspF
W56
sensor II
0 ns 138 ns
stable interaction
no interactionFBR pointing away
B model of the PspA∙F complex based on simulation
90°
Figure S6

Supplementary Figure Legends
Figure S1: The N-terminal region folds back to the PspF-binding domain. Important amino acids
(in a,b,c): conserved hydrophobic amino acids that attach the NTR to CC1; hydrophobic coiled-
coil core forming residues; laterally protruding hydrophobic amino acids from CC1 and one from
CC2 ( ) that link the hydrophobic core of the coiled coil and the hydrophobic region formed by
the back-folding NTR; a residue of CC2 (Lys128) that contacts the NTR; Asn14 and Ala17,
whose backbone is contacted by Asn14. Asn14 is needed for PspC interaction, see discussion. (a)
front and side view of the back-folding N-terminus.
(b) Schematic depiction of the front view in A, showing the large hydrophobic face of CC1 and
the extended hydrophobic region formed by the coiled-coil core and the back-folding NTR ( ).
(c) Conservation histogram of -proteobacterial PspA (overview) and detailed excerpts showing
the high overall degree of conservation of the highlighted amino acids.
(d) The N-terminal region is flexible, but stably attached to CC1 and CC2 during atomistic
simulations. PspA1-144
molecules (n=19) were aligned in their NTR/CC1 region after 18 ns of
simulation (avg.). Even though the rest of the protein as well as the NTR moved considerably and
the NTR showed high flexibility in the region 13-24 ( ), it was still tightly attached to CC1 ( ).
(e) The less well defined electron density of the crystal structure in the N-terminal region indicates
flexibility of this region as well. Cartoon representation of PspA1-144
, colored according to B-factor
of residues in the crystal structure, arrows as in D.
Figure S2: Stereoscopic views of superimposed backbones of ClpB-MD ( ) and PspA ( ) from
the alignment shown in Fig. 3A, as described in the main text.

Figure S3: Preliminary screen to identify putative change of inhibition variants of PspA1-144.
(a) Full overview of regions of PspA1-144
drawn on top of comparative consensus profiles of -
proteobacterial PspA (upper part) and PspA/IM30-family proteins (lower part) indicating regions
of structurally important amino acids (i.e. conserved in both profiles) as well as amino acids
putatively important for proteobacterial PspAs only (i.e., not conserved in all PspA/IM30-family
proteins). Colors for structurally important amino acids in PspA/IM30 as in Fig.2.
(b, c) Preliminary screen of single amino-acid variants of PspA either in the N-terminal (c) or the
C-terminal (c) part of the region conserved in -proteobacteria using a long-induction LacZ-activity
assay. All data normalized to repression level of the wild-type fragment. Several exchanges show
markedly reduced inhibition of PspF compared to the wild-type fragment ( ), or, in the case of the
R59E variant, slightly increased repression. Variants E37A and R59E were used for detailed
studies of PspF inhibition. Even weaker inhibiting variants (up to 25-fold higher psp levels) still
strongly inhibit PspF, as the empty vector control has a 100-fold increased psp level (panel b,
empty)
(d) Orientation of variants on the PspA structure. Variants from the screen in (b) are colored
depending on the strength of their effect ( - surface residues and non-surface residues with strong
loss of inhibition; weak to no effect on inhibition). Loss of inhibition variants cluster on one face
of PspA and point into the same direction as residues R59 and K55, indicating a putative PspF
binding patch, see also Fig.4A.

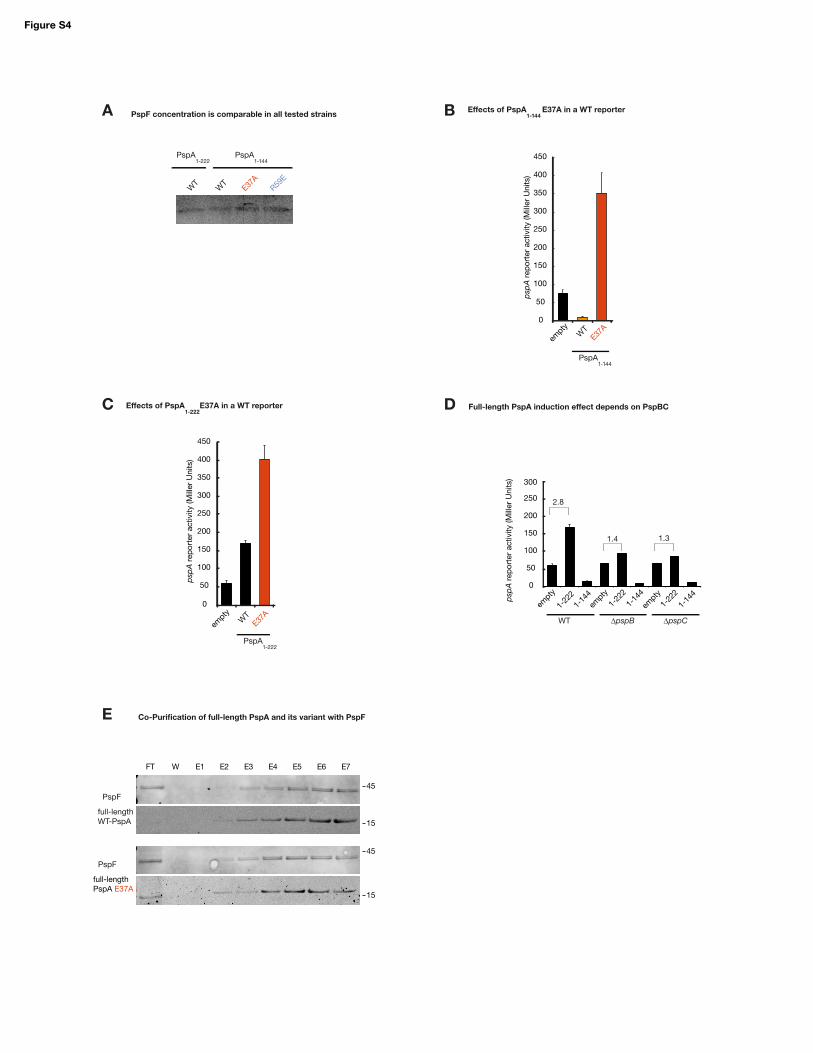
Figure S4: Effects of PspA variants in PspF regulation in vivo
(a) The PspF level in reporter strains with constitutively produced PspF is indeed comparable and
not influenced by different variants. Western Blot developed against the strep-tag of PspF-strep
after 3h induction (0.1% arabinose), compare to LacZ assays in Fig.4D.
(b) The upregulating effect of PspA1-144-E37A also exists in the full psp wild-type background and
is therefore independent of pspF overproduction. Long-term induction (compare to Fig.4D, right)
leads to strong induction of psp, while the wild-type fragment shows repression of psp as before.
(c) The E37A variant has the same up-regulating effect if introduced into full-length PspA (PspA1-
222), i.e. upregulation of psp. Experimental setup as in panel b. Note that this upregulation is much
stronger than the general increase of psp induction due to PspA overproduction, which we found
to be largely dependent on PspBC (see panel d).
(d) PspBC cause most of the inducing effect of long-term PspA overproduction. Comparison of
changes in pspA reporter levels in the wild-type psp background (WT) or pspB and pspC single
gene deletion mutants caused by production of either full-length PspA (1-222) or the fragment used
in this study (1-144) in comparison to the empty vector control (empty). The 2.8-fold induction in
the wild-type background is reduced to ~1.4-fold reporter levels in both deletion mutants. The only
PspF interacting fragment PspA1-144 inhibits psp in all backgrounds.
(e) Co-elution of strep-tagged PspF with his-tagged full-length PspA-E37A from the reporter strain,
with wild-type PspA shown as comparison (cf. Fig.4E)

Figure S5: PspA1-144
∙ PspF1-265
complex formation.
(a) Size exclusion chromatography with PspF1-265
and PspA1-144
indicates complex formation.
Ratio of PspA relative to PspF is given on the left at the start of each chromatogram. PspA∙F
appears at very low relative concentrations of PspA (0.17:1), while free PspA only appears at nearly
equimolar concentrations. Preincubation with nucleotides (ATP/AMPPNP) and MgCl2 (second and
third chromatogram from the top) does not change complex formation.
(b) Influence of PspF1-265
concentration on self-hexamerization. Distribution of sedimentation
coefficients of 1 or 10 µM PspF and their relative abundance (integrated absorption at 230 nm).
(c) Relative portion of the fast sedimenting species during titration (see Fig.5B) as percentage of
total UV-absorption (230 nm) in the sample cuvette. Addition of 0.08 µM PspA1-144
already leads
to a shift of 46% of PspF1-265
-absorption (the absorption of PspA is negligible at this point).
(d) Stable oligomerization of PspF1-265
in equilibrium is not promoted by ADP. Distribution of
sedimentation coefficients of 1 µM PspF with 0.05 to 0.5 mM ADP ( 5-fold KD) and their relative
abundance (integrated absorption at 230 nm). Larger concentrations of ADP could not be measured
due the high UV-absorption of nucleotides and the low amount of protein. Since PspF1-265
shows
ATPase-activity in vitro at 1 µM, this data does not exclude transient hexamer formation that occurs
spontaneously. Still, stable oligomerization of PspF upon addition, which could be shown in the
case of PspA (cf. Fig.5B), is not observed.
(e) Determination of the apparent dissociation constant (koff) of the PspA∙F complex. Jump dilution
(1:40) of the concentrated PspA1-144
∙ PspF1-265
complex into the ATPase assay. The koff was
determined (Tummino & Copeland, 2008) via curve fitting, with the hydrolysis rate of an
equilibrated sample serving as reference rate.

Figure S6: Atomistic simulations of complex stability of PspA and PspF.
(a) Four independent atomistic simulations of PspA1-144
and PspF1-275
after 138 ns of simulated time
(starting position of PspA was the same for all of them, shown in white cartoon representation,
results of the four simulations in shades of orange superimposed on the right). Stable complex
formation occurred when the FBR was facing PspF (schematically depicted on the left). In contrast,
PspA diffuses away during simulation when PspA is rotated 180° around its longitudinal axis so
that the FBR points away from PspF initially. In the superimposed pictures of simulations on the
right, all PspFs were omitted for clarity but the two from the starting conditions, since PspF did not
unfold or change its structure considerably during simulations.
(b) The modeled PspA1-144
∙ PspF1-265
complex based on the stable binding conformation shown in
panel b.

Supplemental Table S1. Primers used in this study.
cloning of pspA1-144
pspA-F
CCATGGGTATTTTTTCTCGCTTTGC
pspA144-R
CTCGAGCTGATGACGTAACATCAATGC
single amino acid exchanges
pspA-ex-E23A CTGTTAGAGAAAGCGGCTGATCCACAGAAACTGG /
CCAGTTTCTGTGGATCAGCCGCTTTCTCTAACAG
pspA-ex-D24A GAGAAAGCGGAAGCTCCACAGAAACTGG /
CCAGTTTCTGTGGAGCTTCCGCTTTCTC
pspA-ex-L28A GGAAGATCCACAGAAAGCGGTTCGTCTGATGATC /
GATCATCAGACGAACCGCTTTCTGTGGATCTTCC
pspA-ex-L31A CAGAAACTGGTTCGTGCGATGATCCAGGAGATG /
CATCTCCTGGATCATCGCACGAACCAGTTTCTG
pspA-ex-Q34A CTGGTTCGTCTGATGATCGCAGAGATGGAAGATACACTG /
CAGTGTATCTTCCATCTCTGCGATCATCAGACGAACCAG
pspA-ex-E37A GATGATCCAGGAGATGGCAGATACACTGGTTGAAG /
CTTCAACCAGTGTATCTGCCATCTCCTGGATCATC
pspA-ex-K55A CGTTGGCAGAAAAGGCACAGCTGACTCGC /
GCGAGTCAGCTGTGCCTTTTCTGCCAACG
pspA-ex-K55E CGTTGGCAGAAAAGGAACAGCTGACTCG /
CGAGTCAGCTGTTCCTTTTCTGCCAACG
pspA-ex-R59A GAAAAGAAACAGCTGACTGCCCGTATTGAACAAGCGTC /
GACGCTTGTTCAATACGGGCAGTCAGCTGTTTCTTTTC
pspA-ex-R59E GAAAAGAAACAGCTGACTGAACGTATTGAACAAGCGTCGG /
CCGACGCTTGTTCAATACGTTCAGTCAGCTGTTTCTTTTC
pspA-ex-Q136A CACGCGCTCGCGCCCAGGCATTGATGTTACGTCATCAGTGACTCGAGATATA /
TATATCTCGAGTCACTGATGACGTAACATCAATGCCTGGGCGCGAGCGCGTG
pspA-ex-Q136K CACGCGCTCGCAAACAGGCATTGATGTTACGTCATCAGTGACTCGAGATATA /
TATATCTCGAGTCACTGATGACGTAACATCAATGCCTGTTTGCGAGCGCGTG
BspHI-dependent mutagenesis
pspA-BspHI-L31-F1 TCATGATTCAGGAGATGGAAGATACAC
pspA-BspHI-L31-R1 TCATGAGACGAACCAGTTTCTGTG
pspA-BspHI-R30A TCATGAGTGCAACCAGTTTCTGTGGATCTTC
pspA-BspHI-I33S TCATGAGCCAGGAGATGGAAGATACAC
pspA-BspHI-E35A TCATGATTCAGGCAATGGAAGATACACTGGTTGAAG
pspA-BspHI-M36A TCATGATTCAGGAGGCAGAAGATACACTGGTTGAAGTACG
pspA-BspHI-D38A TCATGATTCAGGAGATGGAAGCAACACTGGTTGAAGTACGTTCTAC
cloning of pspF
pspF-F2 CATATGGCAGAATACAAAGATAATTTACTTGGT
pspF265-R2 GGATCCGGCGATAGCGTCTTCAG
pspF-R3 AAGCTTACTCGAGAATCTGGTGCTTTTTCAACAACG
Primer sequences are given in 5'-3' direction. 1Primers used for introduction of a BspHI site at the position that
codes for Leu31 in the amino acid sequence. 2Restriction sites at the 5' end of the primer are omitted for clarity
(NdeI for pspF-F, BamHI for pspF265-R). 3 Reverse primer (5’ HindIII site) for cloning of pspF into pUL-Ptat
contains a XhoI site before the HindIII site for future introduction of tags

Supplemental Table S2. Data collection and refinement statistics.
Dataset
PspA1-144
native
Se-PspA1-144
MAD remote
Se-PspA1-144
MAD peak
Se-PspA1-144
MAD inflection
Radiation source BESSY BL14.1 BESSY BL 14.1 BESSY BL 14.1 BESSY BL14.1
Wavelength (Å)
Energy (kEV)
0.9184
13.5000
0.9759
12.7100
0.9798
12.6540
0.9799
12.6525
Resolution range (Å)
Highest resolution shell (Å)
39.73 - 1.8
1.9 - 1.8
39.80 - 2.01
2.13 - 2.01
39.87 - 2.01
2.13 - 2.01
39.87 - 2.06
2.18 - 2.06
Space group C2 C2 C2 C2
Cell dimensions
a, b, c (Å) 79.65, 30.38, 80.48 79.72, 30.39, 80.70 79.95, 30.47, 80.87 79.94, 30.43, 80.94
() 90, 115.61, 90 90, 115.27, 90 90, 115.29, 90 90, 115.28, 90
Rmerge 3.1 (39.8) 5.2 (40.9) 4.7 (42.7) 4.8 (40.4)
I / I 20.5 (3.5) 11.0 (2.0) 11.7 (1.9) 12.0 (2.0)
Completeness (%) 96.8 (95.6) 96.8 (94.8) 96.7 (95.1) 96.8 (95.8)
Multiplicity 3.4 (3.4) 2.2 (2.2) 2.2 (2.20) 2.2 (2.2)
Wilson B 37.2 36.8 38.7 40.0
Refinement
No. reflections (work/test) 15170 / 798
Rwork / Rfree 0.213 / 0.264
No. atoms
Protein 1127
Buffer components 8
Water 77
B-factors (Å2)
Protein 54.5
Buffer components 71.8
Water 41.7
R.m.s deviations
Bond lengths (Å) 0.018
Bond angles () 1.87
Ramachandran plot (%)
Favoured
Allowed
Outlier
94.9
2.9
2.2
The values in parentheses are given for the highest resolution shell. For the native dataset Friedel pairs were merged, for the MAD
datasets Friedel pairs were treated as separate reflections.