molecular systematics of the butter y genus ithomia ... · r. mallarino et al. / molecular...
TRANSCRIPT

Molecular Phylogenetics and Evolution 34 (2005) 625–644
www.elsevier.com/locate/ympev
Molecular systematics of the butterXy genus Ithomia(Lepidoptera: Ithomiinae): a composite phylogenetic hypothesis
based on seven genes
Ricardo Mallarinoa, Eldredge Berminghama, Keith R. Willmottb,Alaine Whinnettb,c, Chris D. Jigginsd,¤
a Smithsonian Tropical Research Institute, Apartado 2072, Balboa, Panamab The Natural History Museum, Cromwell Road, London, SW7 5BD, UK
c Galton Laboratory, University College London, 4 Stephenson Way, London NW1 2HE, UKd Institute of Evolutionary Biology, University of Edinburgh, Edinburgh EH9 3JT, UK
Received 13 August 2004; revised 25 October 2004Available online 16 December 2004
Abstract
ButterXies in the nymphalid subfamily Ithomiinae are brightly colored and involved in mimicry. Here we present a phylogenetichypothesis for 23 of the 24 species in the genus Ithomia, based on seven diVerent gene regions, representing 5 linkage groups and4469 bp. We sequenced varying length regions of the following genes: (1) elongation factor 1� (Ef1�; 1028 bp); (2) tektin (tektin;715 bp); (3) wingless (wg; 405 bp); (4) ribosomal protein L5 (RpL5; 722 bp, exons 1, 2, 3, and introns 1 and 2); and (5) mitochondrialcytochrome oxidase I, II (Co1 and Co2 and intervening leucine tRNA; 1599 bp). The results show incongruence between somegenetic loci, although when alternate topologies are compared statistically it was generally true that one topology was supported bya majority of loci sampled. This highlights the need to sample widely across the genome in order to obtain a well-supported phyloge-netic hypothesis. A combined evidence topology is presented based on a Bayesian analysis of all the gene regions, except the fast-evolving RpL5. The resulting hypothesis is concordant with the most probable relationships determined from our topological com-parisons, although in some parts of the tree relationships remain weakly supported. The tree suggests diversiWcation has largelyoccurred within biogeographic regions such as Central America, the Amazon, the southern and northern Andes, with only occa-sional dispersal (or vicariance) between such regions. This phylogenetic hypothesis can now be used to investigate patterns of diver-siWcation across the genus, such as the potential role of color pattern changes in speciation. 2004 Elsevier Inc. All rights reserved.
Keywords: Lepidoptera; Mimicry; Phylogeny; Phylogenetic discordance; Speciation
1. Introduction
Phylogenetic approaches to the study of speciationare becoming increasingly common as molecular phylo-genetic analyses of entire species clades become available(Barraclough and Vogler, 2000; Barraclough et al.,
* Corresponding author. Fax: +44 131 650 6564.E-mail address: [email protected] (C.D. Jiggins).
1055-7903/$ - see front matter 2004 Elsevier Inc. All rights reserved.doi:10.1016/j.ympev.2004.10.021
1998). These studies rely on the fact that species-levelphylogenetic hypotheses permit both the rate and pat-tern of cladogenesis to be inferred. In combination withecological and morphological information for the spe-cies concerned, phylogenies can be used to test hypothe-ses regarding which factors promote cladogenesis.
The wing patterns of butterXies are traits that play animportant role in diversiWcation. A number of groupsshow great diversity and rapid divergence in color

626 R. Mallarino et al. / Molecular Phylogenetics and Evolution 34 (2005) 625–644
pattern between both populations and species (Bates,1862; Vane-Wright, 1979). Furthermore, the dual role ofwing patterns in signaling to both predators and poten-tial conspeciWc mates means that they may commonlycause reproductive isolation between divergent popula-tions. In the case of aposematic warning colors, switchesin color pattern between related species can generateboth pre- and post-mating reproductive isolation andthus contribute to speciation (Jiggins et al., 2001, 2004a).Therefore, color patterns are traits likely to play a role inspeciation, which are also easily recorded and thereforeamenable to comparative analysis.
The nymphalid sub-family Ithomiinae is a diversegroup of neotropical butterXies (around 360 species,Lamas, 2004). All are thought to be distasteful to preda-tors and form part of diverse Müllerian mimicry ringsthat include heliconiine nymphalid butterXies and manyother Lepidoptera, including day-Xying moths (Becca-loni, 1997; Brown, 1984). The larvae feed primarily onhosts in the family Solanaceae, a family known for itsdefensive chemicals (Drummond and Brown, 1987). Thegenus Ithomia consists of 24 recognized species of rela-tively abundant and widespread butterXies. These areoften involved in mimicry with other ithomiine species,notably in the genera Napeogenes, Hypothyris, Scada,and others. Males of this genus are readily recognized inthe Weld by a distinctive bump on the ventral hindwingopposite the dorsal androconial hair pencils, which con-tains densely packed elongate androconial scales (Fox,1940, 1968). This unusual morphological feature occursin Ithomia and its close relative Pagyris, while severalother morphological synapomorphies support themonophyly of Ithomia (Willmott and Freitas, in prepa-ration). Due to the abundance of individuals, and hencerelative ease of obtaining specimens, the strong morpho-logical support for monophyly of the genus, and thediversity of mimetic relationships found within thegroup we chose the Ithomia as a test case for future spe-cies-level molecular phylogenetic analyses across theIthomiinae. Understanding the phylogenetic relation-ships among members of this genus will hopefully pro-vide insights into the biological processes underlying thediversiWcation of the Ithomiinae.
The Wrst step towards testing ecological hypotheses isthe construction of a robust and reliable phylogenetichypothesis. Gene sequence data provide an excellentsource of characters that are likely to be independent ofthe morphological and ecological characters understudy. In addition, the mode of transmission and geneticbasis of sequence data can be determined explicitly, andthey facilitate estimation of evolutionary rates (Avise,1994). Nonetheless, it is becoming clear that all genomesare mosaics of regions with slightly diVerent genealogicalhistories (Lerat et al., 2003; Pääbo, 2003; Rokas et al.,2003). Two recent studies have used whole genomesequences to investigate this phenomenon (Lerat et al.,
2003; Rokas et al., 2003). Both showed that althoughthere is considerable evidence for incongruence in phylo-genetic signal between loci, nonetheless a consistent con-sensus topology was obtained from the majority ofgenes. Such studies emphasize the need to sample widelyacross the genome in reconstructing phylogenetichypotheses (Rokas et al., 2003).
We here use seven diVerent gene regions in order toinfer a phylogenetic hypothesis for the genus Ithomia.The results show incongruence between some geneticloci and highlight the need for such a wide sampling ofgenomic regions. There are some areas in the resultingIthomia phylogeny where congruence across many genesprovides high conWdence in the hypothesized relation-ships, and other areas where there is disagreementbetween loci suggesting additional analysis may berequired. Nonetheless, a most probable pattern of rela-tionships is presented that is supported by a majority ofthe loci sampled.
2. Materials and methods
2.1. Loci analyzed
Traditionally there has been an emphasis on the util-ity of mtDNA for inferring relationships among closelyrelated species and species groups, with many examplesin butterXies (Beltrán et al., 2002; Blum et al., 2003;Davies and Bermingham, 2002; Sperling and Harrison,1994). For comparison, we used the same mtDNA locistudied previously. In addition, we include threenuclear loci that have been shown to provide phyloge-netically useful information in recent work on butter-Xies and other insects, Ef1�, tektin, and wingless(Brower and DeSalle, 1998; Cho et al., 1995; Whinnettet al., in prep.). We also developed a gene region thathas not been previously reported in phylogenetic stud-ies, a fragment of the Ribosomal Protein L5 that con-tains two highly variable intron regions. This locus isuseful for resolving relationships among closely relatedtaxa. Our sampling therefore includes more loci than iscommon in phylogenetic studies.
2.2. Samples, DNA extraction, ampliWcation, and sequencing
Thorax or leg samples of butterXies were either col-lected by the authors or obtained through donation(Table 1). We obtained a total of 23 out of the 24 speciescurrently recognized in Ithomia. We were unable toobtain samples from I. leila. ButterXies in the closelyrelated genera Napeogenes and Pagyris (Willmott andFreitas, in prep.) were used as outgroups. The taxonomyof the species analyzed follows Lamas (2004), except fortwo cases. First, I. pseudoagalla, formerly considered a

R. Mallarino et al. / Molecular Phylogenetics and Evolution 34 (2005) 625–644 627
Table 1Specimens of Ithomia and related genera included in the present study
Numbers in parentheses represent original codes of donated samples. Decimal points given for latitude and longitude reXect diVering accuracydepending on whether GPS measurements were taken at the collecting site (3 dp) or determined from map coordinates (2 dp).
Taxa ID # Locality Lat Long
Ithomia agnosia agnosia Hewitson 8901 Macas—Puyo KM70, Morona-Santiago, Ecuador 2.317 S 78.512 WIthomia agnosia agnosia Hewitson 8902 Macas—Puyo KM70, Morona-Santiago, Ecuador 2.317 S 78.512 WIthomia agnosia agnosia Hewitson 8895 Puente Aguas Verdes, Rioja, San Martín, Peru 5.685 S 77.658WIthomia agnosia agnosia Hewitson 8896 Chumía, San Martín, Peru 6.695 S 76.186 WIthomia amarilla Haensch 9105 Río Tiputini, Orellana, Ecuador 0.422 S 76.005 WIthomia arduinna arduinna d’Almeida 8942 (3468) Río Madre de Dios, Cuzco, Peru 12.250 S 70.900 WIthomia avella epona Hewitson 9102 La Bonita-Tulcan rd, Sucumbíos, Ecuador 0.56 N 77.53 WIthomia avella epona Hewitson 9103 Río Sucio, Sucumbíos, Ecuador 0.48 N 77.56 WIthomia celemia lurida Haensch 9151 Municipio Ciudad Bolívar, Antioquia, Colombia 5.973 N 75.694 WIthomia cleora Hewitson 8905 Vilcabamba, Loja, Ecuador 4.25 S 79.25 WIthomia cleora Hewitson 8904 Vilcabamba, Loja, Ecuador 4.25 S 79.25 WIthomia diasia hippocrenis H. W. Bates 8286 Cerro Campana, Panama 8.687 N 79.920 WIthomia diasia hippocrenis H. W. Bates 8294 Santa Rita Ridge, Colón, Panama 9.32 N 79.78 WIthomia diasia hippocrenis H. W. Bates 2985 Continental Divide, Fortuna, Chiriquí, Panama 8.785 N 82.214 WIthomia drymo Hübner 9100 (B-16-5) Serro do Japi Municipal Park, Jundiai, São Paulo, Brazil 23.143 S 46.867 WIthomia eleonora Haensch 9114 Qbda. Siete Jeringas, Junín, Peru 11.20 S 75.40 WIthomia eleonora Haensch 9117 Qbda. Siete Jeringas, Junín, Peru 11.20 S 75.40WIthomia ellara Hewitson 9115 Qbda. Siete Jeringas, Junín, Peru 11.20 S 75.40 WIthomia heraldica H. W. Bates 8005 Qbda. Hornito, Fortuna, Chiriquí, Panama 8.693 N 82.225 WIthomia heraldica H. W. Bates 8006 Qbda. Hornito, Fortuna, Chiriquí, Panama 8.693 N 82.225 WIthomia hyala hyala Hewitson 8910 Hotel Tinalandia, Pichincha, Ecuador 0.284 S 79.050 WIthomia hyala hyala Hewitson 8911 Hotel Tinalandia, Pichincha, Ecuador 0.284 S 79.050 WIthomia hyala ssp. nov. 8844 Cerro Pirre, Darién, Panama 7.764 N 77.721 WIthomia hymettia Staudinger 9150 Municipio Ciudad Bolívar, Antioquia, Colombia 5.812 N 76.013 WIthomia iphianassa panamensis H. W. Bates 8102 Achiote Road, Colón, Panama 9.218 N 79.979 WIthomia iphianassa panamensis H. W. Bates 8804 Cana, Darién, Panama 7.756 N 77.684 WIthomia iphianassa panamensis H. W. Bates 8805 Cana, Darién, Panama 7.756 N 77.684 WIthomia iphianassa ssp. nov. 8912 Hotel Tinalandia, Pichincha, Ecuador 0.284 S 79.050 WIthomia iphianassa ssp. nov. 8914 Hotel Tinalandia, Pichincha, Ecuador 0.284 S 79.050 WIthomia iphianassa ssp. nov. 8107 Pedro Vicente Maldonado, Ecuador 0.118 N 79.059 WIthomia jucunda centromaculata Weymer 8873 Cana, Darién, Panama 7.756 N 77.684 WIthomia lagusa peruana Salvin 8915 Tarapoto—Yurimaguas KM8, San Martín, Peru 6.501 N 76.366 WIthomia lagusa peruana Salvin 8916 Tarapoto—Yurimaguas KM8, San Martín, Peru 6.501 N 76.366 WIthomia lagusa theuda Hewitson 9096 (E-30-6) Quebrada Chorillos, Zamora-Chinchipe, Ecuador 4.069 S 78.957 WIthomia lichyi dalmeidai R. M. Fox 8931 (3530) Río Inambari, Madre de Dios, Peru 12.600 S 70.083 WIthomia lichyi dalmeidai R. M. Fox 8933 (3534) Río Inambari, Madre de Dios, Peru 12.600 S 70.083 WIthomia lichyi dalmeidai R. M. Fox 8937 (3538) Río Inambari, Madre de Dios, Peru 12.600 S 70.083 WIthomia patilla Hewitson 8028 Finca Café Duran, Chiriquí, Panama 8.839 N 82.715 WIthomia patilla Hewitson 8031 Finca Café Duran, Chiriquí, Panama 8.839 N 82.715 WIthomia praeithomia Vitale & Bollino 9116 Qbda. Siete Jeringas, Junín, Peru 11.20 S 75.40 WIthomia pseudoagalla Rebel 8898 Hotel Tinalandia, Pichincha, Ecuador 0.284 S 79.050 WIthomia pseudoagalla Rebel 8899 Hotel Tinalandia, Pichincha, Ecuador 0.284 S 79.050 WIthomia salapia aquinia HopVer 8918 Tarapoto—Yurimaguas KM30, San Martín, Peru 6.501 N 76.366 WIthomia salapia aquinia HopVer 8919 Tarapoto—Yurimaguas KM30, San Martín, Peru 6.501 N 76.366 WIthomia salapia derasa Hewitson 8921 Puente Río Serranoyacu, Rioja, San Martín, Peru 5.675 S 77.675 WIthomia salapia derasa Hewitson 8922 Puente Río Serranoyacu, Rioja, San Martín, Peru 5.675 S 77.675 WIthomia salapia salapia Hewitson 8133 Jatun Sacha, Napo, Ecuador 0.782 S 77.804 WIthomia salapia salapia Hewitson 8135 Jatun Sacha, Napo, Ecuador 0.782 S 77.804 WIthomia terra vulcana Haensch 8041 Finca Café Duran, Chiriquí, Panama 8.839 N 82.715 WIthomia terra vulcana Haensch 8040 Finca Café Duran, Chiriquí, Panama 8.839 N 82.715 WIthomia terra vulcana Haensch 2990 Continental Divide, Fortuna, Chiriquí, Panama 8.785 N 82.214 WIthomia terra terrana Haensch 8924 Mindo, Pichincha, Ecuador 0.033 S 78.800 WIthomia terra terrana Haensch 8925 Mindo, Pichincha, Ecuador 0.033 S 78.800 WIthomia terra ssp. nov. 9113 Qbda. Siete Jeringas, Junín, Peru 11.20 S 75.40 WIthomia xenos H. W. Bates 8003 Qbda. Hornito, Fortuna, Chiriquí, Panama 8.693 N 82.225 WIthomia xenos H. W. Bates 8004 Qbda. Hornito, Fortuna, Chiriquí, Panama 8.693 N 82.225 WIthomia xenos H. W. Bates 8332 Qbda. Hornito, Fortuna, Chiriquí, Panama 8.693 N 82.225 WNapeogenes cranto paedaretus Goldman & Salvin 8312 Qbda. Hornito, Fortuna, Chiriquí, Panama 8.693 N 82.225 WNapeogenes cranto paedaretus Goldman & Salvin 8313 Qbda. Hornito, Fortuna, Chiriquí, Panama 8.693 N 82.225 WPagyris cymothoe sylvella Hewitson 8945 Hotel Tinalandia, Pichincha, Ecuador 0.284 S 79.050 WPagyris cymothoe sylvella Hewitson 8946 Hotel Tinalandia, Pichincha, Ecuador 0.284 S 79.050 W

628 R. Mallarino et al. / Molecular Phylogenetics and Evolution 34 (2005) 625–644
race of I. agnosia, is here ranked as a species based onthe molecular data (see Section 4). Second, it has beensuggested that I. hymettia might be a sub-species of I.lagusa (Lamas, 2004). However, the two forms are sym-patric in Colombia (Sandra Muriel, Pers. Comm.) sug-gesting species status, a conclusion supported bymolecular data (see Section 4). The wings of all sampledspecies are currently in the private collection of CD Jig-gins and will be accessioned to a museum collection oncemorphological studies are complete.
Samples for DNA analysis were preserved either in a20% Dimethylsulfoxide, 0.25 M EDTA and saturatedNaCl solution or in 95% Ethanol and are stored in theSmithsonian Tropical Research Institute in Panama.From each individual, one-half thorax was ground inlysis buVer and genomic DNA was extracted using theQiagen DNeasy TissueKit (Qiagen Incorporated), fol-lowing the protocol for animal tissue extraction, andpreserved at ¡80 °C.
We ampliWed a 1599 bp region of mtDNA spanningthe 3� end of Co1, leucine tRNA, and the entire Co2 genefrom individual genomic DNA using polymerase chainreaction (PCR) and published primers (Table 2). In addi-tion, we ampliWed a 1028 bp fragment of the nuclearelongation factor 1 alpha gene (Ef1�) using primers mod-iWed from Cho et al. (1995), a 405 bp fragment of thewingless gene (wg) using published primers (Brower andDeSalle, 1998), and a 715 bp fragment of the tektin geneusing primers designed by Whinnett et al. (in prep).Finally a 722 bp fragment of the Ribosomal Protein L5(RpL5) gene was ampliWed using novel primers (Table2). These were designed from a sequence obtained from acDNA library prepared from wing tissue of Heliconiuserato and identiWed as a homolog of the RpL5 gene(GenBank Accession No. CO377790). This sequence wasaligned to the corresponding Bombyx mori sequenceobtained from the Silkbase EST database (Mita et al.,2003). Primers were located in regions showing a highdegree of conservation between the two species, andwere found to amplify the region in both heliconiine andithomiine butterXies. Double stranded DNA for each ofthe gene regions was synthesized in 15�l reactions con-taining 2�l DNA, 1£ PCR buVer, 1 mM MgCl2, 0.8 mMdNTPs, 0.5mM of each primer, and 0.75 U/�l TaqQiagen. AmpliWcation conditions for the diVerent genesare shown in Table 2.
The PCR products were electrophoretically separatedfrom unincorporated nucleotides and primers in 1.5%low-melting point agarose gels run in TAE (Tris–acetatelow-EDTA buVer, pH 7.8) containing ethidium bromide(1 �g/ml). The ampliWcation product was cut, the agarosewas incubated at 70 °C for 10 min, digested with 1 �lGELase (Epicenter Technologies, Madison WI), fol-lowed by a 3 h incubation period at 45 °C.
One to two microliters (�l) of the puriWed PCR prod-uct was used as a template in a 10 �l cycle sequence reac-
Table
2A
mpl
iWca
tion
pri
mer
s an
d co
ndit
ions
use
d to
am
plif
y th
e It
hom
ia g
enes
use
d in
thi
s st
udy
Ref
eren
ces
are
give
n fo
r pr
evio
usly
pub
lishe
d pr
imer
s. E
, ext
erna
l pri
mer
; I, i
nter
nal p
rim
er.
Gen
e re
gion
Pri
mer
nam
es
(E, I
)Se
quen
ce (5
� to
3�)
Ref
eren
ceP
CR
con
diti
ons
Den
atur
atio
nA
nnea
ling
Ext
ensi
onN
o. o
f cy
cles
Co1
Jerr
y (E
)C
AA
CA
TT
TA
TT
TT
GA
TT
TT
TT
GG
Sim
on e
t al
. (19
94)
94°C
for
45
s48
°C f
or 4
5s
72C
for
1m
in5
Pat
(E
)T
CC
AA
TG
CA
CT
AA
TC
TG
CC
AT
AT
TA
94°C
for
45
s52
°C f
or 4
5s
72°C
for
1.5
min
30D
ick
(I)
CC
AA
CA
GG
AA
TT
AA
AA
TT
TT
TA
GA
TG
AT
TA
GC
Co2
Geo
rge
(E)
TA
GG
AT
TA
GC
TG
GA
AT
AC
CP
hylli
s (I
)G
C(A
CT
)GG
TA
AA
AT
AG
TT
CA
AA
TT
AA
TT
CIm
elda
(E
)C
AT
TA
GA
AG
TA
AT
TG
CT
AA
TT
TA
CT
A
Ef1
�E
F1a
-for
(E
)C
TG
AG
CG
YG
AR
CG
TG
GT
AT
Cho
et
al. (
1995
)94
°C f
or 3
0s
55°C
for
1m
in72
°C f
or 1
min
35E
F1a
-rev
(E
)A
CA
GC
NA
CK
GT
YT
GY
CT
CA
T
tekt
inT
ekti
n A
(E
)A
CC
AG
T G
GR
GA
Y A
TY
CT
W G
GW
hinn
ett
et a
l. (u
npub
lishe
d)94
°C f
or 1
min
55°C
for
1m
in72
°C f
or 1
.5m
in35
Tek
tin
3 (E
)C
GC
AG
T T
TY
TG
A T
RC
TY
T
wg
Lep
WG
1 (E
)G
AR
TG
YA
AR
TG
YC
AY
GG
YA
TG
TC
TG
GB
row
er a
nd D
eSal
le
(199
8)94
°C f
or 1
min
48°C
for
1m
in72
°C f
or 1
min
35L
epW
G2
(E)
AC
TIC
GC
RC
AC
CA
RT
GG
AA
TG
TR
CA
RpL
5R
pL5-
F44
(E
)T
CC
GA
CT
TT
CA
AA
CA
AG
GA
TG
Jigg
ins
et a
l. un
pub.
94 f
or 1
min
55°C
for
1m
in72
°C f
or 1
.5m
in35
RpL
5-R
441
(E)
CA
TA
TC
CT
GG
GA
AT
CT
CT
TG
AT
G

R. Mallarino et al. / Molecular Phylogenetics and Evolution 34 (2005) 625–644 629
tion containing 1 �l Big Dye 3.1, 1 �l primer, anddistilled-deionized water (ddH2O). Cycling conditionsfollowed standard ABI protocols (see Table 2 forsequencing primers). The cycle sequencing product wasdiluted in 10 �l ddH2O, puriWed in Centrisep columnsWlled with 700 �l G-50 Sephadex, and air dried. Eachsample was resuspended in 10 �l Hi-Di formamide,denatured at 95 °C for 2min and then run on an ABI3100 Automated DNA Sequencer following the manu-facturer’s protocol.
Chromatograms were edited and aligned usingSequencher 4.1 (Gene Codes Corporation) and nucleo-tide sequences were visually inspected for miscalls, read-ing frame errors, and termination codons. Variablelength intron sequences were aligned manually inSequencher 4.1.
2.3. Molecular characterization and phylogenetic analysis
Nucleotide sequences for protein coding mtDNA andnDNA sequences were translated to functional peptidesequences using MacClade 4.0 (Maddison and Maddi-son, 1997) as a further check. Data partition homogene-ity tests (Farris et al., 1995) implemented in PAUP*4.0b4a (SwoVord, 2000) were carried out to determinewhether diVerent data partitions (Co1, leucine tRNA,Co2, Ef1�, tektin, wg, and RpL5) were congruent andcould be analyzed together. Data sets were then analyzedusing MODELTEST 3.04 (Posada and Crandall, 1998)to determine the sequence evolution model that bestdescribed our data. The best Wt model chosen by Model-test using likelihood ratio tests was used to perform aBayesian analysis using the program Mr. Bayes 3.0(http://morphbank.ebc.uu.se/mrbayes/) (Huelsenbeck etal., 2001). We ran four simultaneous Markov chains for1,000,000 generations starting from random initial trees,and sampled a tree every 100 generations. Data from theWrst 100,000 generations were discarded, after conWrm-ing that likelihood values had stabilized prior to the100,000th generation. The consensus phylogeny and pos-terior probability of nodes were calculated from treessampled following the 100,000th generation. This pro-cess was repeated three times independently for eachdata set to account for the possibility of multiple optima.Model parameters for the Bayesian consensus tree werecalculated in PAUP*. For comparison, we also con-ducted Maximum Parsimony (MP) analyses in PAUP*,using a heuristic search with TBR branch swapping foreach data partition separately and for the combined evi-dence data set. In each case the consensus tree was calcu-lated using 50% majority rule, and conWdence inbranches was assessed by bootstrapping with TBRbranch swapping (1000 replicates). For the combinedevidence analysis, both majority rule and strict consen-sus trees were calculated for comparison. The programTreeRot (Sorenson, 1999) was used to calculate parti-
tioned Bremer support values to assess the contributionof each gene to the overall Bremer support values.
2.4. Molecular clock analysis
We used PAUP* to calculate the ¡lnL values fornon-clock and clock-enforced ML trees in order to testthe constancy of evolution rates across the tree. The treeswere compared using likelihood ratio tests.
3. Results
3.1. mtDNA
We sequenced 60 specimens representing 25 species,23 from the Ithomia and two outgroup species, Pagyriscymothoe and Napeogenes cranto. The Wnal mitochon-drial alignment consisted of 1599 base pairs, represent-ing 822 bp of the Co1 gene, the entire 62 bp of theintervening leucine tRNA, and 715 bp of the Co2 gene(GenBank Accession Nos. AY713036–AY713091). Ofthe 1599 nucleotide sites examined, 336 (21%) were vari-able and 284 (17%) were phylogenetically informative.The three individuals representing I. avella did notamplify for the entire mitochondrial fragment, and areonly represented by the Wrst 807 bp of the Co1 gene(GenBank Accession Nos. AY713115–AY713117).These specimens were obtained as dried material and thelack of ampliWcation was presumably due to sample deg-radation. There was no length variation between alignedregions of our mtDNA sequences.
Partition homogeneity tests showed the Co1, leucinetRNA, and Co2 genes to be congruent with one another(P D 0.13), thus all subsequent analyses were carried outon the combined mtDNA data. The best-Wt model cho-sen to describe the evolution of the mtDNA sequenceswas the GTR + I + G model (Yang, 1994) that incorpo-rates six rate parameters, the proportion of invariablesites, and a gamma-distribution of rate heterogeneity(for parameter value estimates see Table 3). The Bayes-ian tree produced under this model was well resolvedwith virtually all species-level relationships well sup-ported (Fig. 1). The mtDNA tree shows the speciesgrouped into Wve higher clades supported by Bayesianposterior probabilities greater or equal than 0.95: I. iphi-anassa (N D 5 species), I. hyala (N D 1 species), I. heral-dica (N D 2 species) I. eleonora (N D 7 species), and I.agnosia (N D 8 species).
3.2. Nuclear DNA
Four nuclear gene regions were sequenced: Ef1�(N D 46 individuals), tektin (N D 42 individuals), wg(N D 44 individuals), and RpL5 (N D 23 individuals). InHeliconius it is known that Ef1�, wg and RpL5 are on

630 R. Mallarino et al. / Molecular Phylogenetics and Evolution 34 (2005) 625–644
diVerent chromosomes (Jiggins et al., 2004b; Tobleret al., 2004). Information is not available for tektin.Hence, although it is not known whether linkage rela-tionships are conserved between Heliconius and Itho-mia, it nonetheless seems unlikely that these loci aretightly linked in our study species. The number of indi-viduals sequenced per locus varied for three reasons.First, as stated above, the DNA yielded by some of thedried material obtained through donation wasdegraded and led to ampliWcation problems (tektin forI. avella and wg for I. amarilla). Second, the relativelack of genetic variation at some nuclear genes made itunnecessary to sequence all conspeciWc individuals. Aninitial survey performed with randomly selected speciesfound that there was no sequence divergence amongconspeciWc taxa in the EF1� gene, despite the inclusionof diVerent races. Third, in the case of the RpL5 intron,the locus was selected to address a speciWc set of phylo-genetic relationships, and additional analysis acrossmore distantly related Ithomia was considered imprac-tical, mainly due to the diYculty in aligning intronsequences among distantly related taxa (Beltrán et al.,2002).
When the nuclear coding genes under investigationwere evaluated under the partition homogeneity test,tektin and Ef1� showed signiWcant heterogeneity(P D 0.03), whereas wg was not signiWcantly incongruentwhen evaluated against tektin (P D 0.57) or Ef1�(P D 0.81). Similarly, the RpL5 intron proved to be sig-niWcantly heterogeneous when compared to tektin andEf1� (P D 0.01), but not in comparison with wg(P D 1.00). Thus, we analyzed each nuclear gene indepen-dently and present the results for each gene in turn.
3.3. Ef1�
We obtained sequences for 46 individuals for the Ef1�gene (GenBank Accession Nos. AY704009–AY704054)corresponding to positions 2285–3312 in the DrosophilaF1 reference sequence (GenBank Accession No.X06869). This region also corresponds to bases 19–1046in the region used for a recent analysis of higher system-atics in the Nymphalidae (Wahlberg et al., 2003), Gen-Bank Accession No. AY090172. It is known that the
Ef1� gene exists as two copies in some insects such asDrosophila and Apis, although there is no evidence thatthis is the case in the Lepidoptera (Danforth and Ji,1998). Nonetheless, we aligned the amino acid sequencesfrom one of our specimens (8102) to both the F1 and F2copies of the Drosophila gene. Of the 44 amino acid resi-dues that distinguish the two copies of the Ef1� gene inDrosophila, 12 grouped the Ithomia sequence with the F2Drosophila copy, and 19 grouped it with the F1 copy ofthe gene. The Ithomia Ef1� that we sequenced is there-fore intermediate between the two Drosophila copies.Following arguments presented elsewhere (Cho et al.,1995; Wahlberg et al., 2003), our data provide no evi-dence of duplicate and functionally distinct Ef1� copiesin Lepidoptera, in contrast to the situation in Apis andDrosophila. Only two amino acid residues varied acrossthe 44 Ithomia and outgroup individuals analyzed.
Of the 1028 Ef1� nucleotide sites analyzed, 118 (11%)were variable and 99 (9%) were phylogenetically infor-mative. No sequences varied in length. Modeltest identi-Wed the TrNef + G model (Tamura and Nei, 1993) as thebest Wt to the Ef1� data (Table 3 provides model param-eter estimates for all genes). The tree produced by Bayes-ian methods (Fig. 2) has well resolved relationships,particularly at deeper phylogenetic nodes, and showssome topological diVerences with respect to the mtDNAtree, discussed in detail below.
3.4. Tektin
We sequenced 42 individuals for the tektin gene(GenBank Accession Nos. AY704055–AY704096) cor-responding to positions 350–1064 of the testis speciWcBombyx BmTST (GenBank Accession No. AB056651).Of the 715 nucleotide sites examined, 131 (18%) werevariable and 104 (14%) were phylogenetically infor-mative. There was no length variation in any of thesequences. The best-Wt model describing the data wasTrN + G (Tamura and Nei, 1993). The Bayesian tree(Fig. 3) is well resolved, and has a well-supportedtopology nearly identical to the Ef1� gene tree. The onlymajor diVerence between the tektin and Ef1� gene treesregards the relative placement of I. hyala (compareFigs. 2 and 3).
Table 3Parameter estimates of sequence evolution for the Ithomia genes used in this study
Gene region Model Substitution rates
Base composition Tr Tv
a c g t I � a–g c–t a–c a–t c–g g–t Tr/Tv
Co1 + Co2 GTR + I + G 0.3345 0.1062 0.1139 0.4455 0.674 0.8417 20.8742 62.7202 6.3276 3.9125 0 1 —Ef1� TrNef + G 0.25 0.25 0.25 0.25 0 0.0866 3.9134 9.8707 1 1 1 1 —tektin TrN + G 0.3654 0.1566 0.2333 0.2448 0 0.4019 2.75 5.21111 1 1 1 1 —Wingless K80 + G 0.25 0.25 0.25 0.25 0 0.3804 — — — — — — 3.7497Intron TrN + G 0.3042 0.1464 0.2049 0.3444 0 0.2479 1.2807 4.1383 1 1 1 1 —

R. Mallarino et al. / Molecular Phylogenetics and Evolution 34 (2005) 625–644 631
Fig. 1. Phylogenetic hypothesis for Ithomia based on 1599 nucleotide sites (336 variable) of mtDNA. Tree topology was inferred using Bayesianmethods. Shown is the consensus phylogeny calculated from trees sampled following the 100,000th generation based on the GTR + I + G model.Bayesian probabilities (above) and parsimony bootstrap support (below) is given for each branch.

632 R. Mallarino et al. / Molecular Phylogenetics and Evolution 34 (2005) 625–644
Fig. 2. Phylogenetic hypothesis for Ithomia based on 1028 nucleotide sites (118 variable) of the Ef1� gene. Tree topology was inferred using Bayesianmethods. Shown is the consensus phylogeny calculated from trees sampled following the 100,000th generation based on the TrNef + G model (Tam-ura and Nei, 1993) model. Bayesian probabilities (above) and parsimony bootstrap support (below) is given for each branch.

R. Mallarino et al. / Molecular Phylogenetics and Evolution 34 (2005) 625–644 633
Fig. 3. Phylogenetic hypothesis for Ithomia based on 715 nucleotide sites (131 variable) of the tektin gene. Tree topology was inferred using Bayesianmethods. Shown is the consensus phylogeny calculated from trees sampled following the 100,000th generation based on the TrN + G (Tamura andNei, 1993) model. Bayesian probabilities (above) and parsimony bootstrap support (below) is given for each branch.

634 R. Mallarino et al. / Molecular Phylogenetics and Evolution 34 (2005) 625–644
3.5. Wingless
A 405 bp region of the wg gene was sequenced for 44Ithomia and outgroup individuals (GenBank AccessionNos. AY704097–AY704140). We analyzed 405 nucleo-tide sites corresponding to positions 279–683 in a refer-ence sequence of Precis coenia (GenBank Accession No.L42142), of which 54 (13%) were variable and 43 (11%)were phylogenetically informative. No length variationwas observed in any of the wg sequences analyzed. Mod-eltest indicated the K80 + G model (Kimura, 1980) wasthe best Wt to the wg data. The Bayesian tree generatedfrom the wg data (Fig. 4) was poorly resolved, but wasgenerally consistent with tektin and Ef1�.
3.6. Rpl5 intron
To better determine phylogenetic relationshipsbetween I. salapia and I. iphianassa and close relatives,we analyzed introns 1 and 2 of the ribosomal proteinL5 (RpL5) gene for 23 individuals (GenBank AccessionNos. AY713092–AY713114). The Bombyx mori ESTsequence was used as a reference (GenBank AccessionNo. AF008229) to determine the nucleotide fragmentsrepresenting exons and introns in our alignment. Bases1–92 in our alignment represent the Wrst exon, corre-sponding to bases 239–330 of the Bombyx RpL5sequence. The second exon, positions 292–451 in ouralignment, corresponds to bases 331–490 in Bombyx,and the third exon fragment, positions 643–713 in ouralignment, corresponds to positions 492–562 inBombyx. It is not possible to compare intron positionsbetween Ithomia and Bombyx given the lack of intronsequence registered in GenBank for Bombyx. For theIthomia sequences analyzed the inferred length ofintron 1 varied from 94 to 99 bp, and the length ofintron 2 from 287 to 289 bp. Nonetheless, manualsequence alignments were generally unambiguous. Ouralignment contained 722 bp, of which 88 (12%) werevariable and 59 (8%) were phylogenetically informa-tive. Unlike the other gene regions, our RpL5 alignmentalso included several indels, which were mapped ontothe tree subsequent to the ML analysis (Fig. 5). AllRpL5 data were acquired by direct sequencing, andlength variation between alleles within an individualprobably caused the small number of failed sequencingattempts.
3.7. Relative rates of molecular evolution
Likelihood ratio tests were used to investigate rateheterogeneity across the phylogenetic trees. The likeli-hood was compared between trees with a single rateparameter enforced (strict molecular clock hypothesis)and an alternative hypothesis in which rates wereallowed to vary across all branches. In all Wve tests the
strict molecular clock hypothesis was not a signiWcantlyworse Wt to the data (combined mtDNA data, Ef1�, tek-tin, wg, and RpL5). This implies a relative constancy ofevolutionary rates across the tree for all of the generegions. Nonetheless, as expected evolutionary rates var-ied considerably between gene regions. Most notably themitochondrial genes evolve much faster than nucleargenes and rapidly become saturated. At about 1% diver-gence at Ef1� (Fig. 6A) and tektin (data not shown)mitochondrial divergence reaches 5–6% and begins toplateau. A similar pattern was seen at wg, although thereare less variable sites for comparison in this locus (datanot shown). In contrast, RpL5 shows a faster rate of evo-lution, almost comparable to the mtDNA (Fig. 6B).
3.8. Monophyly of Ithomia
The placement of the root of the mtDNA gene treewas somewhat unstable. When Napeogenes was used toroot the tree, Pagyris fell within Ithomia, basal to the I.agnosia clade in the phylogenies resulting from eitherBayesian or Maximum Parsimony analysis. The place-ment of Pagyris within Ithomia did not markedly aVectother Ithomia relationships. Furthermore, excludingNapeogenes and using Pagyris to root the mtDNA tree,led to very similar topology and Bayesian posteriorprobability measures. Trees were also analyzed using afar more distantly related outgroup, Heliconius (Beltránet al., 2002) GenBank Accession No. AF413708 with lit-tle change in the composition or relationships of majorclades. The instability in the root of the mtDNA tree ismost likely due to homoplasy caused by nucleotide sat-uration. When Napeogenes was used to root a maxi-mum parsimony tree inferred using only Wrst codonpositions, Ithomia was monophyletic with Pagyris sis-ter, as expected from morphological characters. Fur-thermore, Ithomia was monophyletic with respect toPagyris when Napeogenes was used to root the Ef1�,tektin and wg gene trees. The nuclear gene trees supportour assertion that paraphyly of Ithomia in the mtDNAphylogenetic analysis was an artifact of nucleotide satu-ration deep in the tree. The analyses presented belowwere carried out separately using both Pagyris andNapeogenes as outgroups with no major diVerences inthe results.
3.9. Comparison of the mtDNA and nuclear DNA trees
Partition homogeneity tests were performed usingmtDNA and each of the nuclear genes as data parti-tions. Homogeneity was rejected (P D 0.01) when eithertektin or Ef1� were paired with the mtDNA data parti-tion. The wg and mtDNA comparison failed to rejectthe null hypothesis (P D 0.84), although the test wasweak owing to the small number of informative sites inthe wg data. Homogeneity was similarly rejected

R. Mallarino et al. / Molecular Phylogenetics and Evolution 34 (2005) 625–644 635
Fig. 4. Phylogenetic hypothesis for Ithomia based on 405 nucleotide sites (54 variable) of the wg gene. Tree topology was inferred using Bayesianmethods. Shown is the consensus phylogeny calculated from trees sampled following the 100,000th generation based on the K80 + G (Kimura, 1980)model. Bayesian probabilities (above) and parsimony bootstrap support (below) is given for each branch.

636 R. Mallarino et al. / Molecular Phylogenetics and Evolution 34 (2005) 625–644
Fig. 5. Phylogenetic hypothesis for Ithomia based on 722 nucleotide sites (88 variable) of RpL5. Tree topology was inferred using Bayesian methods.Shown is the consensus phylogeny calculated from trees sampled following the 100,000th generation based on the TrN + G model (Tamura and Nei,1993). Bayesian probabilities (above) and parsimony bootstrap support (below) is given for each branch. Bold vertical lines show synapomorphicindel variation.

R. Mallarino et al. / Molecular Phylogenetics and Evolution 34 (2005) 625–644 637
(P D 0.023) when Ef1� was tested with tektin. Shimoda-ira–Hasegawa (SH) tests implemented in PAUP* dem-onstrated a similar lack of congruence between genes(Table 4).
To investigate the cause of the incongruence amonggene trees we used SH tests to compare speciWc hypothe-ses regarding the diVerent relationships suggested by thevarious genes. To do this, topological diVerences
Fig. 6. Plot of relative divergence rates of diVerent Ithomia genes. (A)mtDNA and (B) RpL5 uncorrected distances are plotted against Ef1�distance for all pairwise species comparisons.
between every possible pair of loci were recorded (i.e.,mtDNA vs. Ef1�, mtDNA vs. tektin, mtDNA vs. wg;Ef1� vs. mtDNA, Ef1� vs. tektin, Ef1� vs. wg; tektin vs.mtDNA, tektin vs. Ef1�, tektin vs. wg; wg vs. mtDNA,wg vs. Ef1�, and wg vs. tektin). The topology of the treegenerated for each data set was manually altered to mir-ror speciWc relationships from another data set, and SHtests were performed to compare the resulting topologyagainst the best tree for a particular gene (Table 5).
In general there was a fairly striking pattern wherebythe mtDNA data only weakly rejected the topology sug-gested by the nuclear data, but the nuclear data setsstrongly rejected the mtDNA topology. For example, thenuclear gene trees show I. terra as basal to the I. agnosiaclade, whereas the mtDNA tree grouped I. terra as asister species to the clade formed by I. agnosia +I. lichyi + I. pseudoagalla + I. drymo (Fig. 1). SH testsrevealed that placing I. terra basal to the clade was not asigniWcantly worse Wt to the mtDNA data (P > 0.05), butEf1� strongly rejected the I. amarilla + I. arduinna +I. jucunda clade as basal to the I. agnosia clade(P < 0.005). In this case we conclude that I. terra basal tothe I. agnosia clade is the best-supported relationship.
Similarly, I. xenos and I. lagusa fell within the I. ele-onora clade in the mtDNA tree while nuclear treesplaced them as basal to the I. eleonora and I. iphian-assa clades. As in the previous case, SH tests revealedthat the mtDNA data failed to reject the nuclear genetopology (P D 0.075) whereas each nuclear genestrongly rejected the mtDNA topology (P < 0.05;Table 5). Additional evidence supporting the nucleargene topology for this particular relationship comesfrom the high Bayesian posterior probabilities andbootstrap supports of the respective branches in thenuclear trees.
Table 4Results of SH tests comparing the ‘best Wt’ Ithomia tree topologies inferred from diVerent gene regions
Data sets of loci shown vertically were compared against topologies of data sets shown horizontally. The �Lnl (P value) is given for each comparison.
Data set
Topology MtDNA Ef1a Tektin wg
MtDNA * 146.21 (0.000*) 88.56 (0.000*) 79.57 (0.000*)Ef1a 175.29 (0.000*) * 27.58 (0.023*) 67.34 (0.000*)Tektin 317.49 (0.000*) 104.11 (0.000*) * 83.08 (0.000*)wg 414.74 (0.000*) 229.93 (0.000*) 152.06 (0.000*) *
Table 5
SH tests of speciWc topological hypotheses for Ithomia species inferred from diVerent gene regionsIn each pair, data sets of the Wrst locus shown were compared against the topology suggested by the second locus. The �Lnl (P value) is given foreach comparison. NC, not compared. See text for explanation.
Topological diVerences MtDNA vs. Ef1a Ef1a vs. mtDNA Tektin vs. mtDNA wg vs. mtDNA
Position of I. terra 3.19 (0.209) 21.41 (0.005*) 12.21 (0.054) 1.02 (0.337)Position of I. lichyi 0.10 (0.389) 0.57 (0.383) 4.07 (0.226) NCPosition of I. hyala 5.42 (0.122) 27.53 (0.019*) 27.10 (0.008*) NCPosition of I. heraldica + I. celemia 36.34 (0.003*) 4.54 (0.152) 9.94 (0.087) NCPosition of clade I. lagusa + I. xenos 12.64 (0.075) 50.62 (0.007*) 37.76 (0.006*) NCSister species of I. iphianassa + I. salapia clade 23.08 (0.027*) 14.81 (0.039*) 27.78 (0.011*) NC

638 R. Mallarino et al. / Molecular Phylogenetics and Evolution 34 (2005) 625–644
Contrary to the two previous examples, in the case ofI. heraldica and I. celemia, the topology of the mtDNAtree strongly rejected the topology suggested by thenuclear data. In this case I. heraldica and I. celemia fallwithin the I. iphianassa clade in the nuclear trees but arebasal to the I. iphianassa clade in the mtDNA tree. SHtests showed that mtDNA strongly reject the nucleartopology and result in a signiWcantly worse Wt to the data(P < 0.005), but that the nuclear data, both EF1�(P D 0.152) and tektin (P D 0.087), failed to reject themtDNA topology. We therefore conclude that themtDNA gene topology is the more likely in this instance.
In other cases species relationships were poorlyresolved in all data sets. For example none of the possi-ble relationships between I. agnosia, I. pseudoagalla, I.drymo, and I. lichyi were a signiWcantly worse Wt(P > 0.05) to any of the data sets. The lack of resolutionis evident from the low bootstrap and Bayesian posteriorprobability support for these particular branches in theoriginal trees.
One species that does seem to show genuine andstrongly supported discordance between data sets is I.hyala. While mtDNA, tektin, wg, and Rpl5 support theplacement of this species with the I. iphianassa clade,Ef1� shows it basal to the I. eleonora and I. iphianassaclades. Both of these hypotheses were rejected by at leastone data set at P < 0.05. It seems likely that this is a gen-uine case of incongruence between data partitions. How-ever, since four of the Wve genes are consistent with oneanother, Ef1� is the least likely to reXect the evolution-ary history of I. hyala.
3.10. The iphianassa/salapia relationship
The tree derived from RpL5 clearly diVerentiated thesister species I. salapia and I. iphianassa, supporting thetaxonomic separation of these forms into distinct species(Fig. 5). This result contrasts with the lack of diVerentia-tion between these two species in both mtDNA andnuclear exon data. The RpL5 region also provided addi-tional perspective on the topological disagreementsbetween nuclear and mtDNA data. First, there was clearsupport for the grouping of I. cleora as the closest rela-tive of I. salapia + I. iphianassa, in agreement with thenuclear exon data. The mtDNA tree shows I. diasia asthe closest relative of this species pair, whereas all of thenuclear genes show I. cleora as the sister species to thepair. After performing the corresponding tests, bothmtDNA and nuclear genes rejected the alternate hypoth-eses (P < 0.05). Furthermore, MP bootstrap and Bayes-ian posterior probabilities are high both in nuclear andmtDNA trees.
3.11. Combined evidence phylogeny
Despite the alternative relationships supported insome parts of the mtDNA and nuclear gene trees, wegenerated a combined evidence phylogeny derived fromconcatenated sequences of the six genes, Co1, leucinetRNA, Co2, Ef1�, tektin, and wg (RpL5 was not includedas only a subset of the species were sampled for thislocus). A single Bayesian analysis run was carried outusing independent models and parameter values for each
Table 6Partitioned Bremer support analysis for the combined data set
Node numbers correspond to those shown on Fig. 8.
Node number
Total Bremer support
Gene partition
Co1 tRNA Co2 EF1a Tk wg
1 16 2.1 0 4.9 3.9 4.2 12 7 1.9 0 1.2 0.7 3.2 03 28 3.4 0 4.2 14.2 5.2 14 7 4 0 4 ¡0.5 ¡0.5 05 3 ¡1 0 3 0 ¡1 26 10 3 0 6 1 0 07 11 ¡1 1 ¡2 2 7 48 19 3.4 0 2.2 3.2 8.2 29 8 8 0 0 0 0 0
10 0 ¡2.5 0 ¡3 2 3 0.511 3 ¡2.35 0 ¡1.3 2 4.2 0.512 12 1.1 0 ¡0.3 9.2 1 113 20 4.2 0 1.2 4.2 8 2.514 5 6.5 0 0.3 ¡1.9 0.1 015 5 2.7 0 ¡4.3 4 3.2 ¡0.516 7 ¡0.5 0 1 2 3 1.517 1 2.2 0 0.7 ¡2.1 0.2 018 7 6.6 0 ¡0.5 ¡6.5 7.2 0.219 7 0.2 0 0.7 1 4.2 120 21 6.4 0 2.9 4.9 4.9 2
Total 197 48 1 21 43 65 19
R. Mallarino et al. / Molecular Phylogenetics and Evolution 34 (2005) 625–644 639
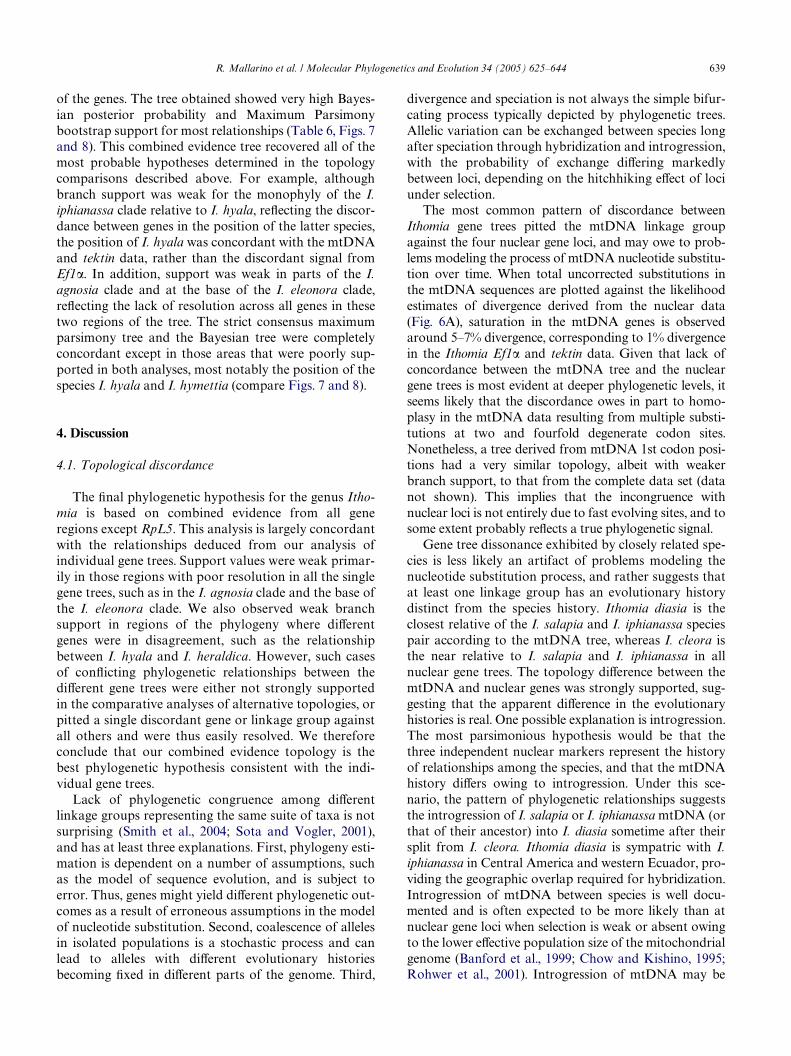
of the genes. The tree obtained showed very high Bayes-ian posterior probability and Maximum Parsimonybootstrap support for most relationships (Table 6, Figs. 7and 8). This combined evidence tree recovered all of themost probable hypotheses determined in the topologycomparisons described above. For example, althoughbranch support was weak for the monophyly of the I.iphianassa clade relative to I. hyala, reXecting the discor-dance between genes in the position of the latter species,the position of I. hyala was concordant with the mtDNAand tektin data, rather than the discordant signal fromEf1�. In addition, support was weak in parts of the I.agnosia clade and at the base of the I. eleonora clade,reXecting the lack of resolution across all genes in thesetwo regions of the tree. The strict consensus maximumparsimony tree and the Bayesian tree were completelyconcordant except in those areas that were poorly sup-ported in both analyses, most notably the position of thespecies I. hyala and I. hymettia (compare Figs. 7 and 8).
4. Discussion
4.1. Topological discordance
The Wnal phylogenetic hypothesis for the genus Itho-mia is based on combined evidence from all generegions except RpL5. This analysis is largely concordantwith the relationships deduced from our analysis ofindividual gene trees. Support values were weak primar-ily in those regions with poor resolution in all the singlegene trees, such as in the I. agnosia clade and the base ofthe I. eleonora clade. We also observed weak branchsupport in regions of the phylogeny where diVerentgenes were in disagreement, such as the relationshipbetween I. hyala and I. heraldica. However, such casesof conXicting phylogenetic relationships between thediVerent gene trees were either not strongly supportedin the comparative analyses of alternative topologies, orpitted a single discordant gene or linkage group againstall others and were thus easily resolved. We thereforeconclude that our combined evidence topology is thebest phylogenetic hypothesis consistent with the indi-vidual gene trees.
Lack of phylogenetic congruence among diVerentlinkage groups representing the same suite of taxa is notsurprising (Smith et al., 2004; Sota and Vogler, 2001),and has at least three explanations. First, phylogeny esti-mation is dependent on a number of assumptions, suchas the model of sequence evolution, and is subject toerror. Thus, genes might yield diVerent phylogenetic out-comes as a result of erroneous assumptions in the modelof nucleotide substitution. Second, coalescence of allelesin isolated populations is a stochastic process and canlead to alleles with diVerent evolutionary historiesbecoming Wxed in diVerent parts of the genome. Third,
divergence and speciation is not always the simple bifur-cating process typically depicted by phylogenetic trees.Allelic variation can be exchanged between species longafter speciation through hybridization and introgression,with the probability of exchange diVering markedlybetween loci, depending on the hitchhiking eVect of lociunder selection.
The most common pattern of discordance betweenIthomia gene trees pitted the mtDNA linkage groupagainst the four nuclear gene loci, and may owe to prob-lems modeling the process of mtDNA nucleotide substitu-tion over time. When total uncorrected substitutions inthe mtDNA sequences are plotted against the likelihoodestimates of divergence derived from the nuclear data(Fig. 6A), saturation in the mtDNA genes is observedaround 5–7% divergence, corresponding to 1% divergencein the Ithomia Ef1� and tektin data. Given that lack ofconcordance between the mtDNA tree and the nucleargene trees is most evident at deeper phylogenetic levels, itseems likely that the discordance owes in part to homo-plasy in the mtDNA data resulting from multiple substi-tutions at two and fourfold degenerate codon sites.Nonetheless, a tree derived from mtDNA 1st codon posi-tions had a very similar topology, albeit with weakerbranch support, to that from the complete data set (datanot shown). This implies that the incongruence withnuclear loci is not entirely due to fast evolving sites, and tosome extent probably reXects a true phylogenetic signal.
Gene tree dissonance exhibited by closely related spe-cies is less likely an artifact of problems modeling thenucleotide substitution process, and rather suggests thatat least one linkage group has an evolutionary historydistinct from the species history. Ithomia diasia is theclosest relative of the I. salapia and I. iphianassa speciespair according to the mtDNA tree, whereas I. cleora isthe near relative to I. salapia and I. iphianassa in allnuclear gene trees. The topology diVerence between themtDNA and nuclear genes was strongly supported, sug-gesting that the apparent diVerence in the evolutionaryhistories is real. One possible explanation is introgression.The most parsimonious hypothesis would be that thethree independent nuclear markers represent the historyof relationships among the species, and that the mtDNAhistory diVers owing to introgression. Under this sce-nario, the pattern of phylogenetic relationships suggeststhe introgression of I. salapia or I. iphianassa mtDNA (orthat of their ancestor) into I. diasia sometime after theirsplit from I. cleora. Ithomia diasia is sympatric with I.iphianassa in Central America and western Ecuador, pro-viding the geographic overlap required for hybridization.Introgression of mtDNA between species is well docu-mented and is often expected to be more likely than atnuclear gene loci when selection is weak or absent owingto the lower eVective population size of the mitochondrialgenome (Banford et al., 1999; Chow and Kishino, 1995;Rohwer et al., 2001). Introgression of mtDNA may be

640 R. Mallarino et al. / Molecular Phylogenetics and Evolution 34 (2005) 625–644
Fig. 7. Phylogenetic hypothesis for Ithomia based on sequences of the Co1, leucinetRNA, Co2, it Ef1�, tektin, and wg genes (3747 nucleotide sites).Genes were combined into a single Bayesian analysis run using independent models and parameter values for each of the genes (see text) Bayesianprobabilities (above) and parsimony bootstrap support (below) is given for each branch.

R. Mallarino et al. / Molecular Phylogenetics and Evolution 34 (2005) 625–644 641
Fig. 8. Maximum parsimony tree for Ithomia based on sequences of the Co1, leucinetRNA, Co2, Ef1�, tektin, and wg genes (3747 nucleotide sites).The strict consensus of 10 equally parsimonious trees from the combined data set of 6 gene partitions is shown (length D 1431; CI D 0.633;RI D 0.689). A single individual of each species was selected for this analysis. Bremer (above) and Bootstrap (below) values are shown adjacent tocorresponding nodes. Circled node numbers refer to nodes used in calculating total and Partitioned Bremer Support values (Table 6). The MP treewas generated using the branch-swapping algorithm with tree-bisection-reconnection (TBR).

642 R. Mallarino et al. / Molecular Phylogenetics and Evolution 34 (2005) 625–644
less probable in Lepidoptera, where hybrid breakdownoften reduces the viability or fertility of females, butnonetheless cannot be ruled out (Sperling, 1993).
4.2. Taxonomic implications
The Ithomia species level phylogeny presented hereresolves several uncertainties regarding the evolutionaryhistories and boundaries that mark closely related lin-eages in the group. In general genetic divergence betweenconspeciWc individuals was low relative to interspeciWcvariation, but there were two notable exceptions. Races ofI. agnosia and I. terra found on the east and west Xanks ofthe Andes exhibit mtDNA divergences of 6.04 and 7.41%,respectively. These genetic distances are roughly an orderof magnitude greater than the average genetic distance of0.54% found between geographic races of other speciessampled here, suggesting a moderately long period of sep-aration. In the case of I. agnosia, there is no known transi-tion zone between western Ecuadorian and Colombianpopulations. Indeed, the west Ecuadorian populationappears to be geographically isolated, occurring only inmoist forests of central western Ecuador, being absent inthe wetter forests in the far northwest (Esmeraldas andCarchi provinces—Willmott and Hall, unpublished data).We therefore, consider this west Ecuador population as adistinct species, Ithomia pseudoagalla stat. rev. (Rebel). Inthe case of I. terra we retain the present taxonomy, buthighlight that the eastern population should probablyalso be considered as a distinct species if biogeographicevidence corroborates the genetic divergence observedhere. The correct nomenclature here is uncertain, as thetype specimen of I. terra is from Colombia, without moreprecise data, and may therefore represent either east orwest Andean populations. Furthermore, more extensivesampling is needed to determine whether the mtDNAdivergence is concordant with morphologically distinctand/or geographically isolated populations.
Also notable from a taxonomic perspective is thelarge divergence between I. heraldica and I. iphianassa(7.26% in mtDNA, 1.48% in tektin, 0.8% in Ef1�, and1.7% in wg), as it has been suggested that these might begeographic races of the same species —this is clearly notthe case. Similarly, the form hymettia has been classiWedas a race of I. lagusa (Lamas, 2004). However, based onWeld observations of I. hymettia sympatric with I. lagusain Colombia (Sandra Muriel, Pers. Comm.), we consid-ered I. hymettia as a distinct species, a conclusion that isclearly conWrmed by the molecular analysis (Fig. 7).
The trans-Andean split within I. terra and thatbetween I. agnosia and I. pseudoagalla might representvicariant divergence associated with the rise of northernAndean cordilleras. However, this is diYcult to distin-guish from an alternative hypothesis in which occasionaldispersal led to the establishment of isolated populationsthat subsequently diverged. The divergence between
these two pairs of taxa is similar, 7.41 and 6.04%, respec-tively, and suggests divergence times of around 3 millionyears, assuming 1.1% divergence per lineage per millionyears (Brower, 1994). However, a recent molecular clockcalibration in the genus Papilio, based on biogeographicconstraints, suggested a much slower rate of molecularevolution (Zakharov et al., 2004) that would give diver-gence time estimates of around 8 million years for thesespecies. The latter would certainly be consistent withvicariance associated with the rise of the Andes, whilethe former would suggest trans-Andean dispersal subse-quent to the Wnal rise of the northern Andes. Resolutionof such issues will require a better calibration of themolecular clock for these butterXies.
In Ithomia there is a strong general relationshipbetween phylogeny and geography. The I. agnosia cladeis restricted almost entirely to southeastern Brazil and theAmazon Basin, the I. eleonora clade is restricted to theeastern and southern Andean region, and the I. iphian-assa clade is found almost exclusively in the westernAndes and Mesoamerica. This suggests a pattern ofdiversiWcation within regions rather than broad-scalevicariance. In addition, many sister species pairs haveallopatric or parapatric distributions suggesting a role forgeography in speciation. For example, the very closelyrelated species pair I. iphianassa and I salapia are parap-atric and likely come into contact in the eastern slopes ofthe Colombian Andes. Other species pairs suggest allo-patric divergence, such as I. xenos and I. lagusa, whichare distributed in Central America (trans-Andean) and tothe east of the Andes (cis-Andean), respectively. Theirdivergence could have been driven by geological eventssuch as the formation of the Andes mountains and theclosure of the Isthmus of Panama, in combination withpast Xuctuations in vegetation levels due to climatechange. The phylogenetic hypothesis presented here willallow future assessment of the roles that geography andwing color have played in the diversiWcation of these but-terXies and will contribute to a better understanding ofthe evolutionary history of Ithomia.
Acknowledgments
For the donation of specimens we thank AndrewBrower, Luis Mendoza Cuenca, Gerardo Lamas, SandraMuriel, and Marie Zimmermann. For discussion andsupport, we thank Gerardo Lamas, Oris Sanjur, JesusMavarez, and James Mallet. For their support both ofour collecting trips, and of some Wne ithomiine habitat inPanama, we thank Café Duran, EGE Fortuna and theCana Weld station. The work was funded by the Smithso-nian Tropical Research Institute and the Royal Society.KRW thanks the Leverhulme Trust for support througha postdoctoral fellowship from Standard Research Pro-ject Grant F/00696/C.

R. Mallarino et al. / Molecular Phylogenetics and Evolution 34 (2005) 625–644 643
References
Avise, J.C., 1994. Molecular Markers, Natural History and Evolution.Chapman and Hall, London, pp. xiv + 511.
Banford, H.M., Bermingham, E., Collette, B.B., McCaVerty, S.S., 1999.Phylogenetic systematics of the Scomberomorus regalis (Teleostei:Scombridae) species group: molecules, morphology and biogeogra-phy of Spanish mackerels. Copeia, 596–613.
Barraclough, T.G., Vogler, A.P., 2000. Detecting the geographical pat-tern of speciation from species-level phylogenies. American Natu-ralist 155, 419–434.
Barraclough, T.G., Vogler, A.P., Harvey, P.H., 1998. Revealing the fac-tors that promote speciation. Philosophical Transactions of theRoyal Society of London Series B-Biological Sciences 353, 241–249.
Bates, H.W., 1862. Contributions to an insect fauna of the Amazon val-ley. Lepidoptera: Heliconidae. Transactions of the Linnean Societyof London 23, 495–566.
Beccaloni, G., 1997. Vertical stratiWcation of ithomiine butterXy(Nymphalidae: Ithomiinae) mimicry complexes: the relationshipbetween adult Xight height and larval host-plant height. BiologicalJournal of the Linnean Society 62, 313–341.
Beltrán, M., Jiggins, C.D., Bull, V., McMillan, W.O., Bermingham, E.,Mallet, J., 2002. Phylogenetic discordance at the species boundary:gene genealogies in Heliconius butterXies. Molecular Biology andEvolution 19, 2176–2190.
Blum, M.J., Bermingham, E., Dasmahapatra, K., 2003. A molecularphylogeny of the neotropical butterXy genus Anartia (Lepidoptera:Nymphalidae). Molecular Phylogenetics and Evolution 26, 46–55.
Brower, A.V.Z., 1994. Rapid morphological radiation and convergenceamong races of the butterXy Heliconius erato inferred from patternsof mitochondrial DNA evolution. Proceedings of the NationalAcademy of Sciences of the United States of America 91, 6491–6495.
Brower, A.V.Z., DeSalle, R., 1998. Patterns of mitochondrial versusnuclear DNA sequence divergence among nymphalid butterXies:the utility of wingless as a source of characters for phylogeneticinference. Insect Molecular Biology 7, 73–82.
Brown, K.S., 1984. Adult-obtained pyrrolizidine alkaloids defendithomiine butterXies against a spider predator. Nature (London)309, 707–709.
Cho, S.W., Mitchell, A., Regier, J.C., Mitter, C., Poole, R.W., Fried-lander, T.P., Zhao, S.W., 1995. A highly conserved nuclear gene forlow-level phylogenetics—elongation factor-1-alpha recovers mor-phology-based tree for Heliothine moths. Molecular Biology andEvolution 12, 650–656.
Chow, S., Kishino, H., 1995. Phylogenetic relationships between tunaspecies of the genus Thunnus (Scombridae: Teleostei): inconsistentimplications from morphology, nuclear and mitochondrialgenomes. Journal of Molecular Evolution 41, 741–748.
Danforth, B.N., Ji, S.Q., 1998. Elongation factor-1 alpha occurs astwo copies in bees: implications for phylogenetic analysis of EF-1alpha sequences in insects. Molecular Biology and Evolution 15,225–235.
Davies, N., Bermingham, E., 2002. The historical biogeography of twoCaribbean butterXies (Lepidoptera: Heliconiidae) as inferred fromgenetic variation at multiple loci. Evolution 56, 573–589.
Drummond, B.A., Brown, K.S., 1987. Ithomiinae (Lepidoptera: Nymp-halidae): summary of known larval food plants. Annals of the Mis-souri Botanical Garden 74, 341–358.
Farris, J.S., Källersjö, M., Kluge, A.C., Bult, C., 1995. Constructing asigniWcance test for incongruence. Systematic Biology 44, 570–572.
Fox, R.M., 1940. A generic review of the Ithomiinae (Lepidoptera:Nymphalidae). Transactions of the American Entomological Soci-ety 66, 161–207.
Fox, R.M., 1968. Ithomiidae (Lepidoptera: Nymphaloidea) of CentralAmerica. Transactions of the American Entomological Society 94,155–208.
Huelsenbeck, J.P., Ronquist, F., Nielsen, R., Bollback, J.P., 2001. Evo-lution—Bayesian inference of phylogeny and its impact on evolu-tionary biology. Science 294, 2310–2314.
Jiggins, C.D., Estrada, C., Rodrigues, A., 2004a. Mimicry and the evo-lution of pre-mating isolation in Heliconius melpomene. Journal ofEvolutionary Biology 17, 680–691.
Jiggins, C.D., Mavarez, J., Beltrán, M., Johnston, J.S., Bermingham, E.,2004. A genetic map of the mimetic butterXy, Heliconius melpom-ene. Genetics, in press.
Jiggins, C.D., Naisbit, R.E., Coe, R.L., Mallet, J., 2001. Reproductiveisolation caused by colour pattern mimicry. Nature (London) 411,302–305.
Kimura, M., 1980. A simple method for estimating evolutionary ofbase substitution through comparative studies of nucleotidesequences. Journal of Molecular Evolution 16, 111–120.
Lamas, G., 2004. Ithomiinae. In: Heppner, J.B. (Ed.), Atlas of Neotrop-ical Lepidoptera. Checklist: Part 4A. Hesperioidea—Papilionoidea.Association for Tropical Lepidoptera/ScientiWc Publishers, Gains-ville.
Lerat, E., Daubin, V., Moran, N.A., 2003. From gene trees to organis-mal phylogeny in prokaryotes: the case of the gamma-proteobacte-ria. PLoS Biology 1, 101–109.
Maddison, W.P., Maddison, D.R., 1997. MacClade: Analysis of Phylog-eny and Character Evolution. Sinauer Associates, Sunderland, MA.
Mita, K., Morimyo, M., Okano, K., Koike, Y., Nohata, J., Kawasaki,H., Kadono-Okuda, K., Yamamoto, K., Suzuki, M.G., Shimada, T.,Goldsmith, M.R., Maeda, S., 2003. The construction of an ESTdatabase for Bombyx mori and its application. Proceedings of theNational Academy of Sciences of the United States of America 100,14121–14126.
Pääbo, S., 2003. The mosaic that is our genome. Nature (London) 421,409–412.
Posada, D., Crandall, K.A., 1998. Modeltest: testing the model of DNAsubstitution. Bioinformatics 14, 817–818.
Rohwer, S., Bermingham, E., Wood, C., 2001. Plumage and mitochon-drial DNA haplotype variation across a moving hybrid zone. Evo-lution 55, 405–422.
Rokas, A., Williams, B.L., King, N., Carroll, S.B., 2003. Genome-scaleapproaches to resolving incongruence in molecular phylogenies.Nature (London) 425, 798–804.
Simon, C., Frati, F., Beckenbach, A., Crespi, B., Liu, H., Flook, P., 1994.Evolution, weighting, and phylogenetic utility of mitochondrialgene sequences and a compilation of conserved polymerase chainreaction primers. Annals of the Entomological Society of America87, 651–702.
Smith, V.S., Page, R.D.M., Johnson, K.P., 2004. Data incongruence andthe problem of avian louse phylogeny. Zoologica Scripta 33, 239–259.
Sorenson, M.D., 1999. TreeRot. Boston University, Boston, MA.Sota, T., Vogler, A.P., 2001. Incongruence of mitochondrial and
nuclear gene trees in the carabid beetles Ohomopterus. SystematicBiology 50, 39–59.
Sperling, F.A.H., 1993. Mitochondrial-Dna variation and Haldane rulein the Papilio-Glaucus and P-Troilus species groups. Heredity 71,227–233.
Sperling, F.A.H., Harrison, R.G., 1994. Mitochondrial DNA variationwithin and between species of the Papilio machaon group of swal-lowtails. Evolution 48, 408–422.
SwoVord, D.L., 2000. PAUP* Phylogenetic Analysis Using Parsimony(¤ and Other Methods). Sinauer Associates, Sunderland, MA.
Tamura, K., Nei, M., 1993. Estimation of the number of nucleotide sub-stitutions in the control region of mitochondrial DNA in humansand chimpanzees. Molecular Biology and Evolution 10, 512–526.
Tobler, A., Kapan, D.D., Flanagan, N.S., Gonzalez, C., Peterson, E.,Jiggins, C.D., Johnston, J.S., Heckel, D.G., McMillan, W.O., 2004.First generation linkage map of the warningly colored butterXyHeliconius erato. Heredity, in press.

644 R. Mallarino et al. / Molecular Phylogenetics and Evolution 34 (2005) 625–644
Vane-Wright, R.I., 1979. Towards a theory of the evolution of butterXycolour patterns under directional and disruptive selection. Biologi-cal Journal of the Linnean Society 11, 141–152.
Wahlberg, N., Weingartner, E., Nylin, S., 2003. Towards a better under-standing of the higher systematics of Nymphalidae (Lepidoptera:Papilionoidea). Molecular Phylogenetics and Evolution 28, 473–484.
Yang, Z., 1994. Estimating the pattern of nucleotide substitution. Jour-nal of Molecular Evolution 39, 105–111.
Zakharov, E.V., Caterino, M.S., Sperling, F.A.H., 2004. Molecular phy-logeny, historical biogeography, and divergence time estimates forswallowtail butterXies of the genus Papilio (Lepidoptera: Papilioni-dae). Systematic Biology 53, 193–215.