molecular structure, vibrational analysis and first order...
TRANSCRIPT
Optics and Photonics Journal, 2015, 5, 91-107 Published Online March 2015 in SciRes. http://www.scirp.org/journal/opj http://dx.doi.org/10.4236/opj.2015.53008
How to cite this paper: Prashanth, J., Ramesh, G., Naik, J.L., Ojha, J.K., Reddy, B.V. and Ramana Rao, G. (2015) Molecular Structure, Vibrational Analysis and First Order Hyperpolarizability of 4-Methyl-3-Nitrobenzoic Acid Using Density Functional Theory. Optics and Photonics Journal, 5, 91-107. http://dx.doi.org/10.4236/opj.2015.53008
Molecular Structure, Vibrational Analysis and First Order Hyperpolarizability of 4-Methyl-3-Nitrobenzoic Acid Using Density Functional Theory Jyothi Prashanth1, Gaddam Ramesh1, Jarupula Laxman Naik1, Jai Kishan Ojha2, Byru Venkatram Reddy1*, Gandham Ramana Rao1 1Department of Physics, Kakatiya University, Warangal, India 2Department of Physics, Govt. Degree & P.G. College, Adilabad, India
Email: *[email protected] Received 16 January 2015; accepted 24 March 2015; published 25 March 2015
Copyright © 2015 by authors and Scientific Research Publishing Inc. This work is licensed under the Creative Commons Attribution International License (CC BY). http://creativecommons.org/licenses/by/4.0/
Abstract The Fourier Transform Infrared (FTIR) and FT-Raman spectra of 4-methyl-3-nitrobenzoic acid have been recorded in the range 4000 - 400 cm−1 and 3500 - 50 cm−1, respectively. The optimized geometry of the molecule, its vibrational frequencies along with corresponding intensities have been computed using the Density Functional Theory (DFT) employing B3LYP/6-311++G basis set. The scaled values of harmonic vibrational frequencies obtained in the computations have been compared with their experimental counter parts. The scaling factors have been refined to repro-duce the frequencies with an RMS error of 11.68 cm−1 between the experimental and computed frequencies. The theoretically constructed spectra agree satisfactorily with those of experimental spectra. First order hyperpolarizability constants have also been evaluated.
Keywords 4-Methyl-3-Nitrobenzoic Acid, Vibrational Spectra, DFT, First Order Hyperpolarizability
1. Introduction During the past two and a half decades, the quantum chemistry community has been trying very hard to develop “a priori” method of predicting vibrational frequencies of a given molecule. As a result, ab initio computations
*Corresponding author.
J. Prashanth et al.
92
refined to include density functional theory (DFT) have evolved. However, it was found that the values of com-puted vibrational frequencies using DFT were higher than the corresponding experimental frequencies. This over- estimation is attributed to the use of finite basis set, incomplete implementation of the electronic correlation and the neglect of anharmonicity effects [1]. Hence, it became essential to scale the ab initio force fields using spec-troscopic data for getting better agreement between the observed and calculated frequencies. In this connection, Pulay’s method, which was the basis of scaled quantum mechanical (SQM) force field, became very popular, as it gave transferable scale factors between similar molecules [2]. Yoshida et al. [3] proposed a scaling method, which was an improvement over the method of determining global scale factors for different levels of theory, by a least-squares fit of the calculated frequencies to the experimental frequencies. Sundius [4] modified his MOLVIB program that was capable of computing scale factor calculations accordingly. Researchers in this field, using DFT calculations incorporated into ab initio calculations, have shown that the computed vibrational fre-quencies and their intensities in the case of many organic molecules agree reasonably well with experimental frequencies on scaling [5]-[7]. But, it is necessary to extend DFT studies to many other molecular systems to prove the applicability of DFT beyond any reasonable doubt. We thought 4-methyl-3-nitrobenzoic acid (MNBA) was one such system.
Benzoic acid and its derivatives have been the subject matter of several investigations [8]-[17]. The reasons are many folds. These are: Benzoic acid occurs widely in plants and animal tissues. It is used in miticides, con-trast media in urology, cholocystographic examinations and in the manufacture of pharmaceuticals. The deriva-tives of benzoic acid are an essential component of the Vitamin B-complex. Further, the herbicidal activity of a molecule containing carboxylic acid group is mainly due to the presence of the acid moiety or a group that is easily convertible to this moiety. Methylnitrobenzoic acid and its derivatives are also known for their local anaesthetic action [16]. Further, it has been demonstrated that 4-Methyl-3-nitrobenzoic acid (MNBA) is a potent inhibitor cancer cell chemotaxis and may be developed into a novel anti-metastatis drug [17]. Hence, we thought it worthwhile to take up a systematic experimental and theoretical investigation of MNBA by recording its Fourier transform Infrared (FTIR) and Fourier transform Raman (FT-Raman) spectra and make a vibrational analysis of its spectra using current level of Density Functional Theory (DFT). Further, it was thought to eva-luate first order hyperpolarizability coefficients of MNBA to ascertain its non-linear optical (NLO) behaviour.
2. Spectral Measurements The sample MNBA was obtained from Aldrich Chemical Company, USA and used as such for the spectral measurements. The room temperature Fourier transform infrared (FTIR) spectrum of the compound was rec-orded using BRUKER IFS-66V FTIR Spectrometer, in the range 4000 - 400 cm−1 with a scanning speed of 30 cm−1∙min−1 and spectral width 2.0 cm−1. The FT-Raman spectrum of the sample was measured, in the range 3500 - 50 cm−1 in the Stokes region, using the above Spectrometer equipped with FRA-106 FT-Raman acces-sory. 1064 nm line of Nd: YAG laser source operating at 200 mw power was used for excitation. Spectral reso-lution is believed to be 2 cm−1.
3. Computational Details 3.1. Geometry and Vibrational Frequencies Optimization of molecular geometry, evaluation of energy and calculation of vibrational frequencies were car-ried out, for MNBA, with GAUSSIAN 09W software package [18] implemented on Pentium-V (3.2 GHz) Workstation using Becke’s three parameter hybrid functional [19], combined with Lee-Yang-Parr correlation functional [20] (abbreviated as B3LYP). The basis set used was 6-311++G. The SGI grid (50, 194) was used for numerical integration. Theoretical force constants in cartesian representation were computed at optimized geo-metry by assuming Cs point group symmetry. Scaling of the force constants was made according to scaled quantum mechanical (SQM) procedure [21] [22] employing selective scaling in the natural coordinate represen-tation [23] [24]. Transformation of the force field, normal coordinate analysis, least-square refinement of scale factors, calculation of potential energy distribution (PED) and the evaluation of the IR and Raman intensities were established with the MOLVIB program (version 7.0) written by Suindius [25] [26]. For plotting stimulated IR and Raman spectra, pure Lorentzian band shapes were employed with a band width (FWHM; full width at half maximum) of 10 cm−1.

J. Prashanth et al.
93
3.2. Raman Intensities The Raman activities (Si) were calculated using GAUSSIAN 09W Program. They were adjusted during the scaling procedure with MOLVIB and subsequently converted to relative Raman intensities (Ii). The following formula, derived from basic theory of Raman scattering [27] [28] was used for this purpose.
( ) ( ){ }40 1 expi i i i iI f S hc kTν ν ν ν = − − (1)
where, ν0 is the exciting frequency (in cm−1), νi is the frequency of the ith normal mode (in cm−1), h is the Planck’s constant, c is the velocity of light, k is the Boltzmann’s constant and f is a suitably chosen common normalization factor for all peak intensities.
3.3. First Order Hyperpolarizability The non-linear optical response of an isolated molecule in an electric field can be expressed as a Taylor series expansion of the total dipole moment, µt, induced by the field:
0t ij j ijk j kE E Eµ µ α β= + + + (2)
where, µ0 is the permanent dipole moment, αij are the components of polarizability, βijk are the components of the first order hyperpolarizability. The first order hyperpolarizability is a third rank tensor. Hence, it contains 27 components represented by a 3 ×
3 × 3 matrix. Due to Klienman symmetry [29], the 27 components get reduced to 10 components ( xyy yxy yyx yyz yzy zyyβ β β β β β= = = = = ;… Similarly other permutation of x, y, z subscripts also take same value). These components are:
, , , , , , , , ,xxx xxy xyy yyy xxz xyz yyz xzz yzz zzzβ β β β β β β β β β
They can be calculated using the following equation [30]:
( ) ( )1 3i iii ijj jij jjii jβ β β β β≠
= + + +∑ (3)
The total static dipole moment µt, the isotropic (or average) linear polarizability αt, the anisotropy of polari-zability ∆α, and the mean first order hyperpolarizability βt, using the x, y, z components are defined as:
( )1 22 2 2t x y zµ µ µ µ= + + (4)
( ) 3t xx yy zzα α α α= + + (5)
( ) ( ) ( )1 22 2 21 2 22 6xx yy yy zz zz xx xxα α α α α α α α− ∆ = − + − + − +
(6)
( )1 22 2 2t x y zβ β β β= + + (7)
where, x xxx xyy xzzβ β β β= + + (8)
y yyy xxy yzzβ β β β= + + (9)
.z zzz xxz yyzβ β β β= + + (10)
4. Results and Discussion 4.1. Ground State Geometry The molecule under investigation has two possible rotational conformers resulting from the rotation of the acid group around C-Cα bond. In the first conformer hydrogen atom of the acid group is nearer to the nitro group in
J. Prashanth et al.
94
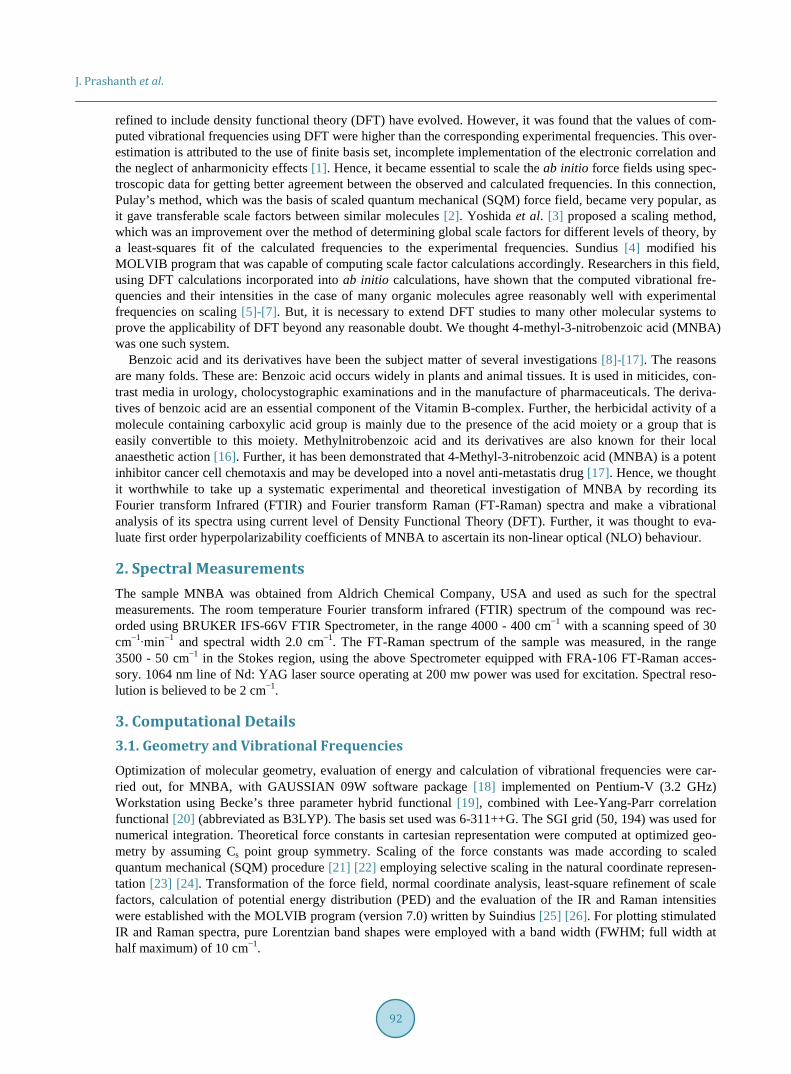
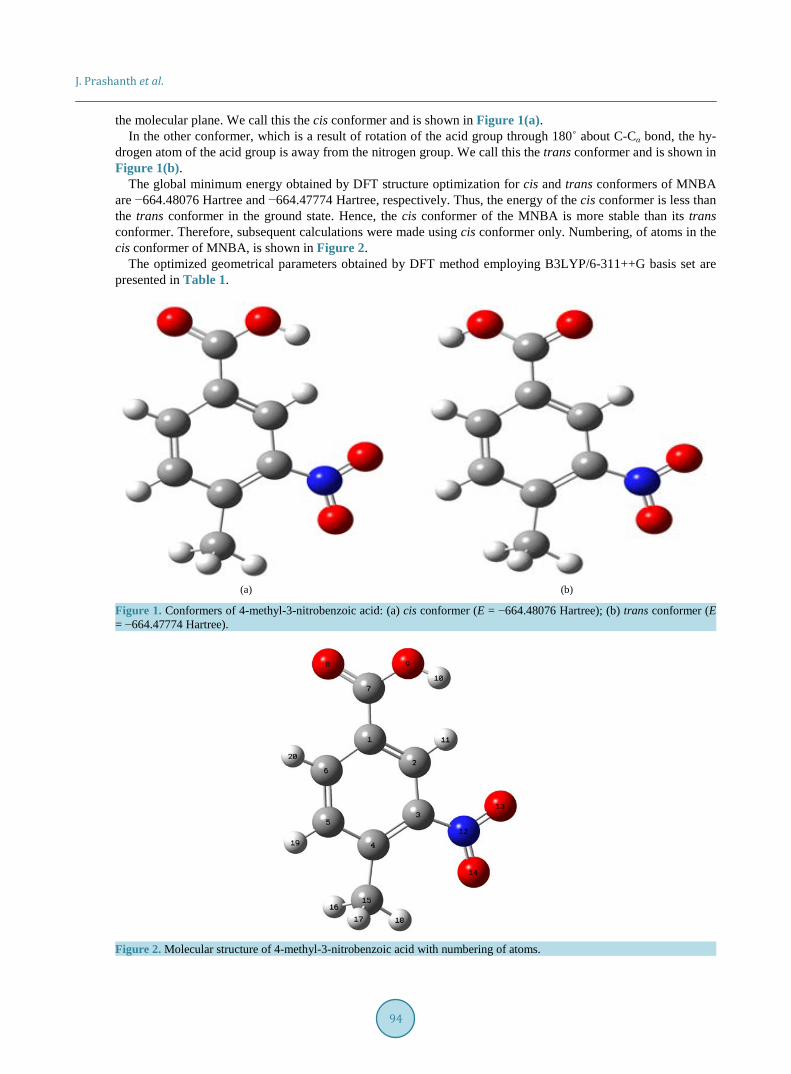
the molecular plane. We call this the cis conformer and is shown in Figure 1(a). In the other conformer, which is a result of rotation of the acid group through 180˚ about C-Cα bond, the hy-
drogen atom of the acid group is away from the nitrogen group. We call this the trans conformer and is shown in Figure 1(b).
The global minimum energy obtained by DFT structure optimization for cis and trans conformers of MNBA are −664.48076 Hartree and −664.47774 Hartree, respectively. Thus, the energy of the cis conformer is less than the trans conformer in the ground state. Hence, the cis conformer of the MNBA is more stable than its trans conformer. Therefore, subsequent calculations were made using cis conformer only. Numbering, of atoms in the cis conformer of MNBA, is shown in Figure 2.
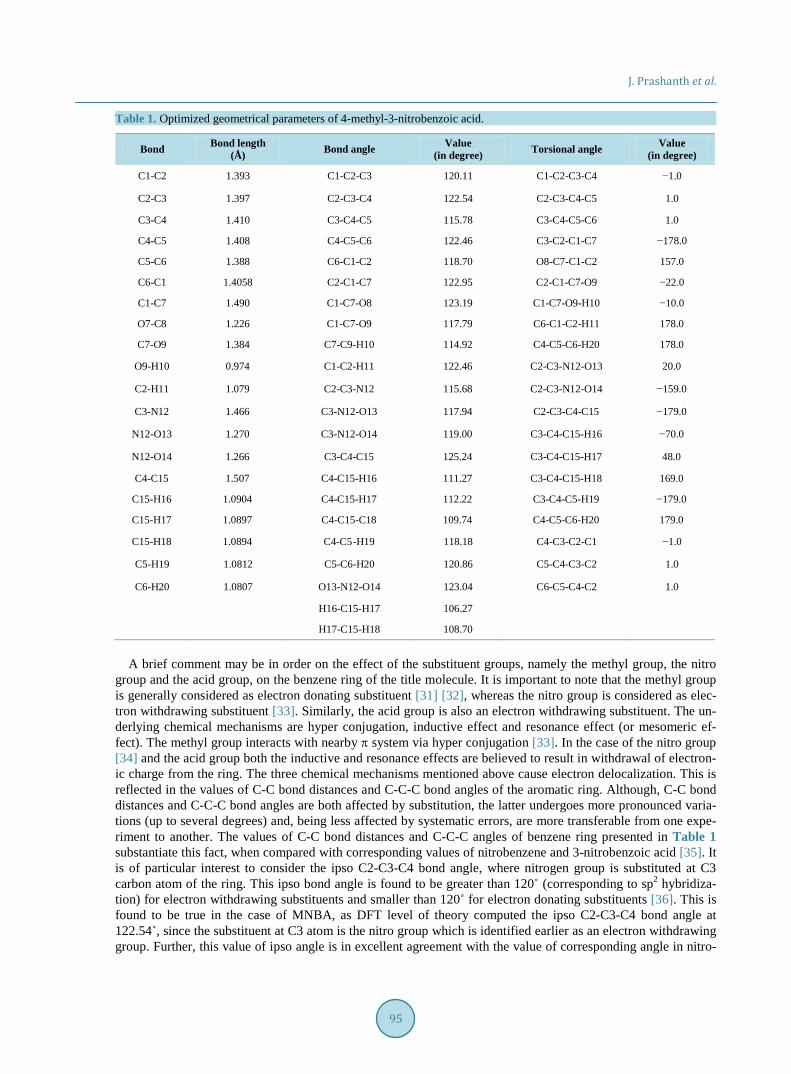
The optimized geometrical parameters obtained by DFT method employing B3LYP/6-311++G basis set are presented in Table 1.
(a) (b)
Figure 1. Conformers of 4-methyl-3-nitrobenzoic acid: (a) cis conformer (E = −664.48076 Hartree); (b) trans conformer (E = −664.47774 Hartree).
Figure 2. Molecular structure of 4-methyl-3-nitrobenzoic acid with numbering of atoms.
J. Prashanth et al.
95
Table 1. Optimized geometrical parameters of 4-methyl-3-nitrobenzoic acid.
Bond Bond length (Å) Bond angle Value
(in degree) Torsional angle Value (in degree)
C1-C2 1.393 C1-C2-C3 120.11 C1-C2-C3-C4 −1.0
C2-C3 1.397 C2-C3-C4 122.54 C2-C3-C4-C5 1.0
C3-C4 1.410 C3-C4-C5 115.78 C3-C4-C5-C6 1.0
C4-C5 1.408 C4-C5-C6 122.46 C3-C2-C1-C7 −178.0
C5-C6 1.388 C6-C1-C2 118.70 O8-C7-C1-C2 157.0
C6-C1 1.4058 C2-C1-C7 122.95 C2-C1-C7-O9 −22.0
C1-C7 1.490 C1-C7-O8 123.19 C1-C7-O9-H10 −10.0
O7-C8 1.226 C1-C7-O9 117.79 C6-C1-C2-H11 178.0
C7-O9 1.384 C7-C9-H10 114.92 C4-C5-C6-H20 178.0
O9-H10 0.974 C1-C2-H11 122.46 C2-C3-N12-O13 20.0
C2-H11 1.079 C2-C3-N12 115.68 C2-C3-N12-O14 −159.0
C3-N12 1.466 C3-N12-O13 117.94 C2-C3-C4-C15 −179.0
N12-O13 1.270 C3-N12-O14 119.00 C3-C4-C15-H16 −70.0
N12-O14 1.266 C3-C4-C15 125.24 C3-C4-C15-H17 48.0
C4-C15 1.507 C4-C15-H16 111.27 C3-C4-C15-H18 169.0
C15-H16 1.0904 C4-C15-H17 112.22 C3-C4-C5-H19 −179.0
C15-H17 1.0897 C4-C15-C18 109.74 C4-C5-C6-H20 179.0
C15-H18 1.0894 C4-C5-H19 118.18 C4-C3-C2-C1 −1.0
C5-H19 1.0812 C5-C6-H20 120.86 C5-C4-C3-C2 1.0
C6-H20 1.0807 O13-N12-O14 123.04 C6-C5-C4-C2 1.0
H16-C15-H17 106.27
H17-C15-H18 108.70
A brief comment may be in order on the effect of the substituent groups, namely the methyl group, the nitro
group and the acid group, on the benzene ring of the title molecule. It is important to note that the methyl group is generally considered as electron donating substituent [31] [32], whereas the nitro group is considered as elec-tron withdrawing substituent [33]. Similarly, the acid group is also an electron withdrawing substituent. The un-derlying chemical mechanisms are hyper conjugation, inductive effect and resonance effect (or mesomeric ef-fect). The methyl group interacts with nearby π system via hyper conjugation [33]. In the case of the nitro group [34] and the acid group both the inductive and resonance effects are believed to result in withdrawal of electron-ic charge from the ring. The three chemical mechanisms mentioned above cause electron delocalization. This is reflected in the values of C-C bond distances and C-C-C bond angles of the aromatic ring. Although, C-C bond distances and C-C-C bond angles are both affected by substitution, the latter undergoes more pronounced varia-tions (up to several degrees) and, being less affected by systematic errors, are more transferable from one expe-riment to another. The values of C-C bond distances and C-C-C angles of benzene ring presented in Table 1 substantiate this fact, when compared with corresponding values of nitrobenzene and 3-nitrobenzoic acid [35]. It is of particular interest to consider the ipso C2-C3-C4 bond angle, where nitrogen group is substituted at C3 carbon atom of the ring. This ipso bond angle is found to be greater than 120˚ (corresponding to sp2 hybridiza-tion) for electron withdrawing substituents and smaller than 120˚ for electron donating substituents [36]. This is found to be true in the case of MNBA, as DFT level of theory computed the ipso C2-C3-C4 bond angle at 122.54˚, since the substituent at C3 atom is the nitro group which is identified earlier as an electron withdrawing group. Further, this value of ipso angle is in excellent agreement with the value of corresponding angle in nitro-

J. Prashanth et al.
96
benzene determined from a regression analysis of the ring angles in the six derivatives of nitrobenzene studied by X-ray crystallography, which yielded a value of 122.7˚.
4.2. Vibrational Assignments 4-methyl-3-nitrobenzoic acid belongs to Cs point group symmetry. The molecule consists of 20 atoms. Hence, it has 54 fundamentals, distributed as 36 in-plane vibrations of a' species and 18 out-of-plane vibrations of a" spe-cies.
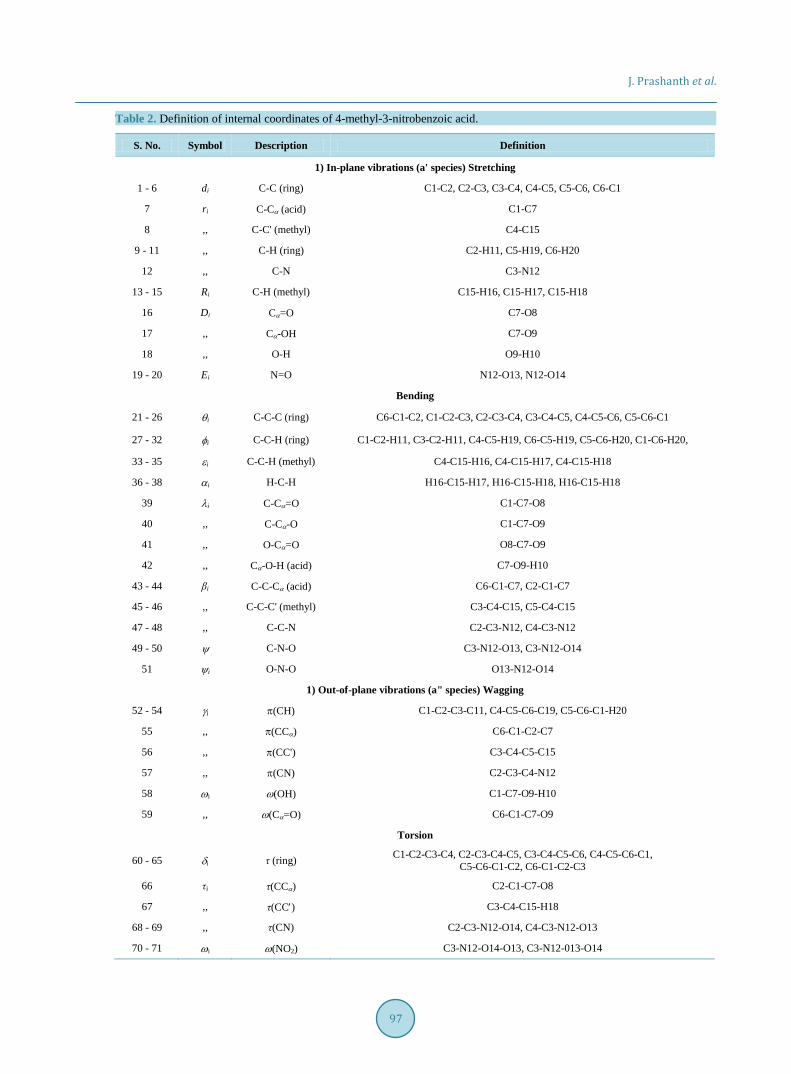
Detailed description of vibrational modes can be made by means of normal coordinate analysis. For this pur-pose, the full set of 71 primitive (or standard) internal valence coordinates, containing 17 redundancies, was de-fined as given in Table 2.
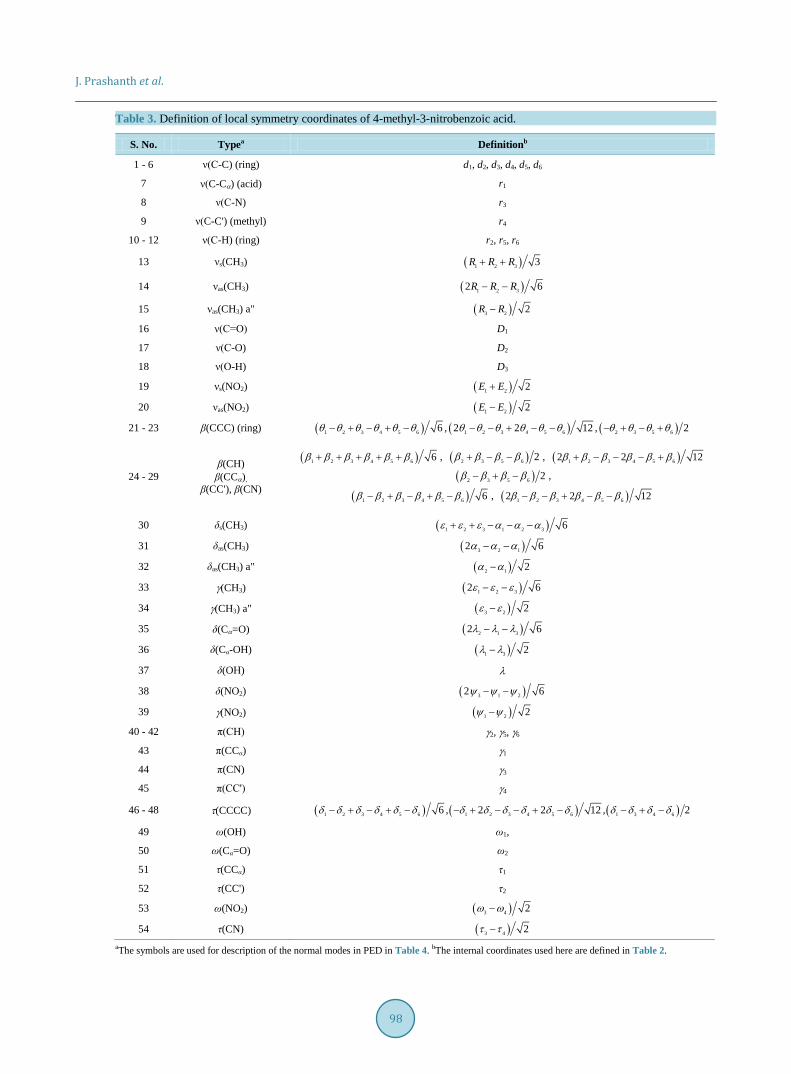
By a suitable linear combination of these internal coordinates, a non-redundant set of 54 natural internal coor-dinates (or local symmetry coordinates) was constructed following the recommendations of Fogarasi et al. [23] [24]. These are summarized in Table 3.
The theoretically calculated DFT force field was transformed to this later set of local symmetry coordinates and used in all subsequently calculations. Observed frequencies (both IR and Raman), calculated frequencies (both un-scaled and scaled), IR and Raman intensities (calculated), potential energy distribution (PED) and vi-brational assignment of MNBA are reported in Table 4. The results presented in Table 4 are self-explanatory and the discussion is confined to some of the important modes only.
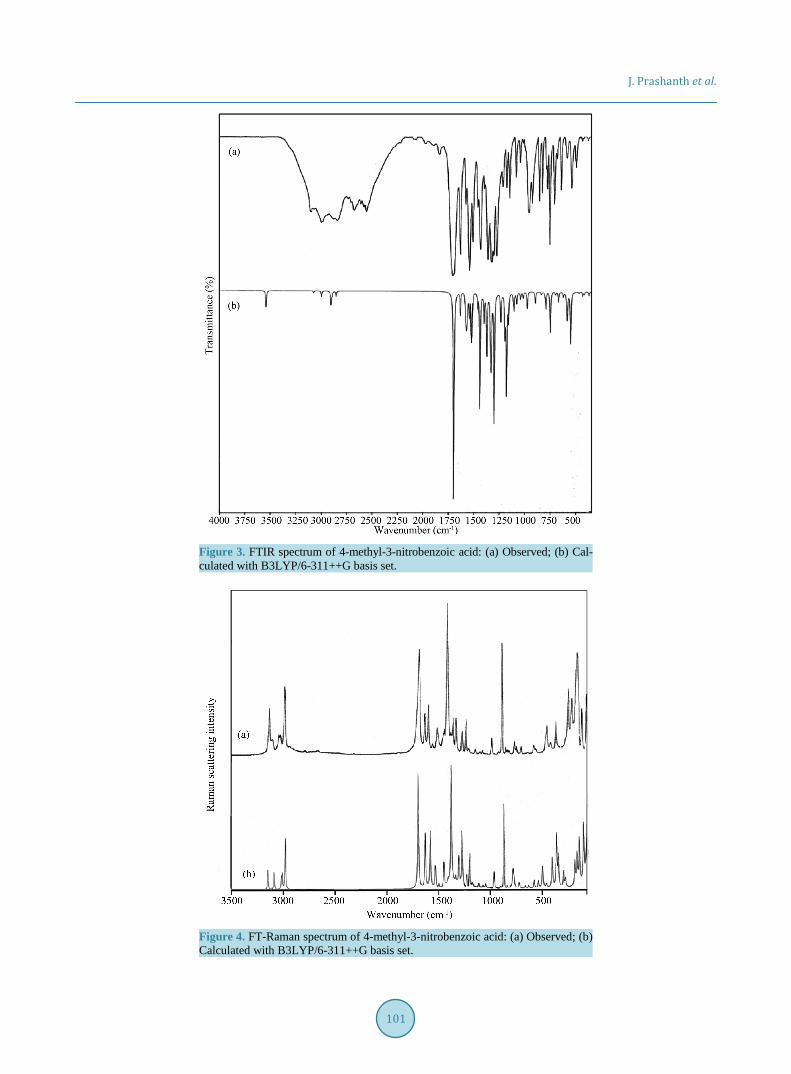
For visual comparison, the observed and simulated FTIR and FT-Raman spectra of MNBA are presented in Figure 3 and Figure 4, respectively.
The root mean square (rms) deviation between the calculated and experimental frequencies was calculated using following expression in order to determine the goodness of fit.
( ) ( ) ( ){ }2
1rms 1 1 cal expni iin ν ν
= = − − ∑ (11)
where, (νi)cal is the ith calculated frequency, (νi)exp is the ith experimental frequency, and “n” is the number of experimental frequencies. The rms error between unscaled frequencies and observed frequencies of MNBA was found to be 168.5 cm−1.
On using the refined scaling factors, this deviation was reduced to 11.68 cm−1.
4.2.1. C-C Stretching Vibrations The modes 1, 8a, 8b, 14, 19a and 19b are known as C-C stretching vibrations in benzene and its derivatives in Wilson’s notation [37]. But mode 1 is highly sensitive to the nature of the substituent and hence classified as ring vibration. Further, in MNBA, mode 14 is observed to have considerable mixing with C-H in-plane bending vibration 3. Hence, only the modes 8a, 8b, 19a and 19b are discussed in this section by deferring the discussion of modes 1 and 14 to appropriate sections to a later stage. In the molecule under investigation, modes 8a and 8b are expected around 1600 cm−1. The higher frequency has about 65% C-C stretching character in MNBA. The remaining PED comes from C-H in-plane bending vibration 18b and ring vibration 6b. The lower frequency is a C-C stretching mode to the extent of 51%. It mixes with C-C′ stretching mode 7b (C' is atom number 15 in Fig-ure 2), ring vibration 6a and C-N stretching vibration 7a. Further, they are known to appear with considerable intensity in the ir spectrum. Hence, the strong absorptions near 1567 and 1621 cm−1 are assigned to C-C stret-ching vibrations 8a and 8b, respectively. Modes 19a and 19b are expected in the spectral range 1400 - 1500 cm−1. The higher frequency is a C-C stretching mode to the extent of 56%. This vibration has a good amount of mix-ing from C-H in-plane bending mode18b in MNBA. The lower frequency exhibits C-C stretching character to the extent of 73% and mixes with C-N stretching vibration 7a. Hence, the band around 1474 cm−1 (scaled calcu-lated value) and ir absorption near 1497 cm−1 are ascribed to modes 19a and 19b, respectively.
4.2.2. Mode 14 and C-H in-Plane Bending Vibrations The assignment of mode 14 (the Kekule mode) in which alternate C-C bonds either increase or decrease, is usually difficult as the highest C-H in-plane bending vibration 3 appears in its vicinity around 1300 cm−1. Ac-cording to the DFT calculations, the bands observed at 1267 and 1296 cm−1 exhibit strong mixing between the
J. Prashanth et al.
97
Table 2. Definition of internal coordinates of 4-methyl-3-nitrobenzoic acid.
S. No. Symbol Description Definition
1) In-plane vibrations (a' species) Stretching
1 - 6 di C-C (ring) C1-C2, C2-C3, C3-C4, C4-C5, C5-C6, C6-C1
7 ri C-Cα (acid) C1-C7
8 ,, C-C' (methyl) C4-C15
9 - 11 ,, C-H (ring) C2-H11, C5-H19, C6-H20
12 ,, C-N C3-N12
13 - 15 Ri C-H (methyl) C15-H16, C15-H17, C15-H18
16 Di Cα=O C7-O8
17 ,, Cα-OH C7-O9
18 ,, O-H O9-H10
19 - 20 Ei N=O N12-O13, N12-O14
Bending
21 - 26 θi C-C-C (ring) C6-C1-C2, C1-C2-C3, C2-C3-C4, C3-C4-C5, C4-C5-C6, C5-C6-C1
27 - 32 φi C-C-H (ring) C1-C2-H11, C3-C2-H11, C4-C5-H19, C6-C5-H19, C5-C6-H20, C1-C6-H20,
33 - 35 εi C-C-H (methyl) C4-C15-H16, C4-C15-H17, C4-C15-H18
36 - 38 αi H-C-H H16-C15-H17, H16-C15-H18, H16-C15-H18
39 λi C-Cα=O C1-C7-O8
40 ,, C-Cα-O C1-C7-O9
41 ,, O-Cα=O O8-C7-O9
42 ,, Cα-O-H (acid) C7-O9-H10
43 - 44 βi C-C-Cα (acid) C6-C1-C7, C2-C1-C7
45 - 46 ,, C-C-C' (methyl) C3-C4-C15, C5-C4-C15
47 - 48 ,, C-C-N C2-C3-N12, C4-C3-N12
49 - 50 ψ C-N-O C3-N12-O13, C3-N12-O14
51 ψi O-N-O O13-N12-O14
1) Out-of-plane vibrations (a" species) Wagging
52 - 54 γi π(CH) C1-C2-C3-C11, C4-C5-C6-C19, C5-C6-C1-H20
55 ,, π(CCα) C6-C1-C2-C7
56 ,, π(CC') C3-C4-C5-C15
57 ,, π(CN) C2-C3-C4-N12
58 ωi ω(OH) C1-C7-O9-H10
59 ,, ω(Cα=O) C6-C1-C7-O9
Torsion
60 - 65 δi τ (ring) C1-C2-C3-C4, C2-C3-C4-C5, C3-C4-C5-C6, C4-C5-C6-C1, C5-C6-C1-C2, C6-C1-C2-C3
66 τi τ(CCα) C2-C1-C7-O8
67 ,, τ(CC′) C3-C4-C15-H18
68 - 69 ,, τ(CN) C2-C3-N12-O14, C4-C3-N12-O13
70 - 71 ωi ω(NO2) C3-N12-O14-O13, C3-N12-013-O14
J. Prashanth et al.
98
Table 3. Definition of local symmetry coordinates of 4-methyl-3-nitrobenzoic acid.
S. No. Typea Definitionb
1 - 6 ν(C-C) (ring) d1, d2, d3, d4, d5, d6
7 ν(C-Cα) (acid) r1
8 ν(C-N) r3
9 ν(C-C') (methyl) r4
10 - 12 ν(C-H) (ring) r2, r5, r6
13 νs(CH3) ( )1 2 3 3R R R+ +
14 νas(CH3) ( )1 2 32 6R R R− −
15 νas(CH3) a" ( )3 2 2R R−
16 ν(C=O) D1
17 ν(C-O) D2
18 ν(O-H) D3
19 νs(NO2) ( )1 2 2E E+
20 νas(NO2) ( )1 2 2E E−
21 - 23 β(CCC) (ring) ( ) ( ) ( )1 2 3 4 5 6 1 2 3 4 5 6 2 3 5 66 , 2 2 12 , 2θ θ θ θ θ θ θ θ θ θ θ θ θ θ θ θ− + − + − − − + − − − + − +
24 - 29 β(CH) β(CCα),
β(CC'), β(CN)
( )1 2 3 4 5 6 6β β β β β β+ + + + + , ( )2 3 5 6 2β β β β+ − − , ( )1 2 3 4 5 62 2 12β β β β β β+ − − − +
( )2 3 5 6 2β β β β− + − ,
( )1 2 3 4 5 6 6β β β β β β− + − + − , ( )1 2 3 4 5 62 2 12β β β β β β− − + − −
30 δs(CH3) ( )1 2 3 1 2 3 6ε ε ε α α α+ + − − −
31 δas(CH3) ( )3 2 12 6α α α− −
32 δas(CH3) a" ( )2 1 2α α−
33 γ(CH3) ( )1 2 32 6ε ε ε− −
34 γ(CH3) a" ( )3 2 2ε ε−
35 δ(Cα=O) ( )2 1 32 6λ λ λ− −
36 δ(Cα-OH) ( )1 3 2λ λ−
37 δ(OH) λ
38 δ(NO2) ( )3 1 22 6ψ ψ ψ− −
39 γ(NO2) ( )1 2 2ψ ψ−
40 - 42 π(CH) γ2, γ5, γ6
43 π(CCα) γ1
44 π(CN) γ3
45 π(CC') γ4
46 - 48 τ(CCCC) ( ) ( ) ( )1 2 3 4 5 6 1 2 3 4 5 6 1 3 4 66 , 2 2 12 , 2δ δ δ δ δ δ δ δ δ δ δ δ δ δ δ δ− + − + − − + − − + − − + −
49 ω(OH) ω1,
50 ω(Cα=O) ω2
51 τ(CCα) τ1
52 τ(CC') τ2
53 ω(NO2) ( )3 4 2ω ω−
54 τ(CN) ( )3 4 2τ τ− aThe symbols are used for description of the normal modes in PED in Table 4. bThe internal coordinates used here are defined in Table 2.

J. Prashanth et al.
99
Table 4. Observed and B3LYP/6-311++G level calculated vibrational frequencies (in cm−1) and vibrational assignments of 4-methyl-3-nitrobenzoic acid.
S. No. Modea Obs. freq. (cm−1) Cal. freq. (cm−1)
IRb(Ii) Ramanc(Ai) Vibrational assignmentd IR Raman Unscaled Scaled
Aromatic nucleus-in-plane vibrations
1 ν(C-C) 1 655 675 701 691 28.75 5.88 1(58) + 12(18) + 7a(12)
2 ν(C-C) 8a 1567 1571 1585 1594 55 28.23 8a(51) + 7b(27) + 6a(12) + 7a(11)
3 ν(C-C) 8b 1621 1625 1652 1658 85 70.58 8b(65) + 18b(12) + 6b(11)
4 ν(C-C) 14 1267 1264 1254 1254 87.5 24.7 14(49) + 3(26) + 12(10)
5 ν(C-C) 19a - - 1464 1474 14.16 20.61 19a(73) + 7a(19)
6 ν(C-C) 19b 1497 1494 1541 1520 78.75 9.411 19b(56) + 18b(23)
7 ν(C-H) 2 - 3087 3207 3083 25.12 29.41 2(99)
8 ν(C-H) 20a 3090 - 3204 3067 56.25 13.79 20a(99)
9 ν(C-H) 20b 3065 3067 3183 3063 53.75 11.76 20b(99)
10 ν(C-Cα) 13 1201 1204 1176 1180 40 17.64 13(38) + 3(34) + ν(Cα-OH)(16)
11 ν(C-N) 7a 1138 1140 1160 1140 45 3.52 6a(26) + 19a(18) + 7a(15) + 7b(10)
12 ν(C-C') 7b - - 1280 1293 36.8 31 14(30) + 7b(19) + 18b(15)
13 β(CH) 3 1296 1292 1203 1275 91.25 28.53 3(35) + 12(22) + 14(16)
14 β(CH) 18a 1168 1168 1106 1134 37.5 23.52 18a(45) + 8a(18) + 6a(12) + ν(Cα-OH)(10)
15 β(CH) 18b 1090 1074 1090 1084 57.05 4.7 19b(30) + 18b(18) + ν(Cα-OH)(10)
16 β(CCα) 15 - - 268 265 17.21 30.21 12(26) + 15(24) + 9b(21) + δ(Cα-OH)(13)
17 β(CN) 9b - - 338 336 21.61 22.21 9b(32) + γ(NO2)(24) + δ(Cα-OH)(13) + 15(10)
18 β(CC') 9a - 343 352 360 2.21 8.235 9a(25) + 6a(25) + 7a(19) + δ(Cα-OH)(12)
19 β(CCC) 6a - 508 482 478 21 7.058 6a(45) + δ(Cα-OH)(23) + γ(NO2)(18)
20 β(CCC) 6b - 377 397 390 2.13 20 1(31) + 6b(19) + 9a(14) + δ(Cα=O)(10)
21 β(CCC) 12 805 814 789 789 23.75 75.29 12(31) + δ(NO2)(15) + 1(15) + 13(11)
Aromatic nucleus-out-of-plane vibrations
22 π(CH) 5 830 856 877 871 47.5 3.52 5(84)
23 π(CH) 11 744 759 762 766 81.25 4.7 11(84)
24 π(CH) 17b 948 - 957 947 72.5 0.68 17b(65) + 16b(17)
25 π(CCα) 10b - 196 204 211 0.52 12.94 ω(NO2)(26) + 10b(21) + 17a(18) + τ(CCα)(15) + 16a(12)
26 π(CN) 17a - 172 158 158 44.7 1.37 10b(22) + 16b(15) + ω(Cα=O)(20) + 17a(14) + 10a(10)
27 π(CCʹ) 10a - 291 277 280 22.35 1.37 10a(28) + ω(Cα=O)(20) + 16a(15) + 10b(14)
28 τ(CCCC) 4 699 695 738 728 55 9.411 4(32) + ω(Cα=O)(20) + 10b(16)
29 τ(CCCC) 16a 560 - 574 575 27.5 7.58 16a(34) + ω(OH)(12) + 10b(12) + 17a(11)
30 τ(CCCC) 16b 485 489 445 450 32.5 4.7 16b(52) + 17a(16) + 10b(12)
Vibrations of acid group
31 ν(Cα=O) 1698 - 1713 1714 100 1.72 ν(Cα=O)(80)
32 ν(Cα-OH) 1319 1316 1316 1313 90 23.52 ν(Cα-OH)(29) + 12(25) + 14(22)
33 δ(OH) 1425 - 1455 1459 95 5.83 δ(OH)(61) + 19b(16)
34 ν(O-H) - - 3627 3627 8.33 3.44 ν(O-H)(100)
J. Prashanth et al.
100
Continued
35 δ(Cα=O) 630 629 636 636 47.5 7.05 6a(30) + δ(Cα=O)(17) + 9b(16)
36 δ(Cα-OH) - - 463 471 20 4.82 6a(30) + δ(Cα=O)(17) + δ(Cα-OH)(16)
37 ω(OH) 908 914 907 922 56.25 11.76 ω(OH)(55) + 4(16)
38 ω(Cα = O) - 139 140 138 2.17 38.82 ω(Cα=O)(62) + τ(CN)(23)
39 τ(CCα) - - 48 43 2.16 92 τ(CCα)(94)
Vibrations of methyl group
40 νs(CH3) 2945 2936 3037 2946 57.5 44.78 νs(CH3)(99)
41 νas(CH3) - 2977 3101 2991 3.33 14.11 νas(CH3)(99)
42 νas(CH3)a" 2990 2991 3114 3005 62.6 14.51 νas(CH3(93)a"
43 δs(CH3) 1370 1378 1398 1384 90 17.64 δs(CH3)(82)
44 δas(CH3) 1448 1449 1405 1460 56.25 17.64 δas(CH3)(79) + 19a(17)
45 δas(CH3)a" - - 1515 1480 4.01 4.13 δas(CH3)a"(84)
46 γ(CH3) 1010 1005 1028 1017 17.5 3.52 γ(CH3)(52) + δas(CH3)(16)
47 γ(CH3)a" - 1031 1034 1073 5.83 2.94 γ(CH3)a"(66) + δas(CH3)a"(19)
48 τ(CCʹ) - 86 100 99 70.58 0.68 τ(CCʹ)(82)
Vibrations of nitro group
49 νs(NO2) 1354 1352 1352 1356 85 100 νs(NO2)(37) + 14(19) + 7a(19)
50 νas(NO2) 1533 1535 1523 1531 97.5 32.94 νas(NO2)(69) + 19b(16)
51 δ(NO2) 761 778 745 769 45 4.7 1(35) + δ(NO2)(28) + 12(14)
52 γ(NO2) 532 - 513 514 45 6.2 γ(NO2)(31) + 6b(28) + 9b(14)
53 ω(NO2) - - 677 665 1.21 2.06 4(54) + ω(NO2)(13) + 10a(12)
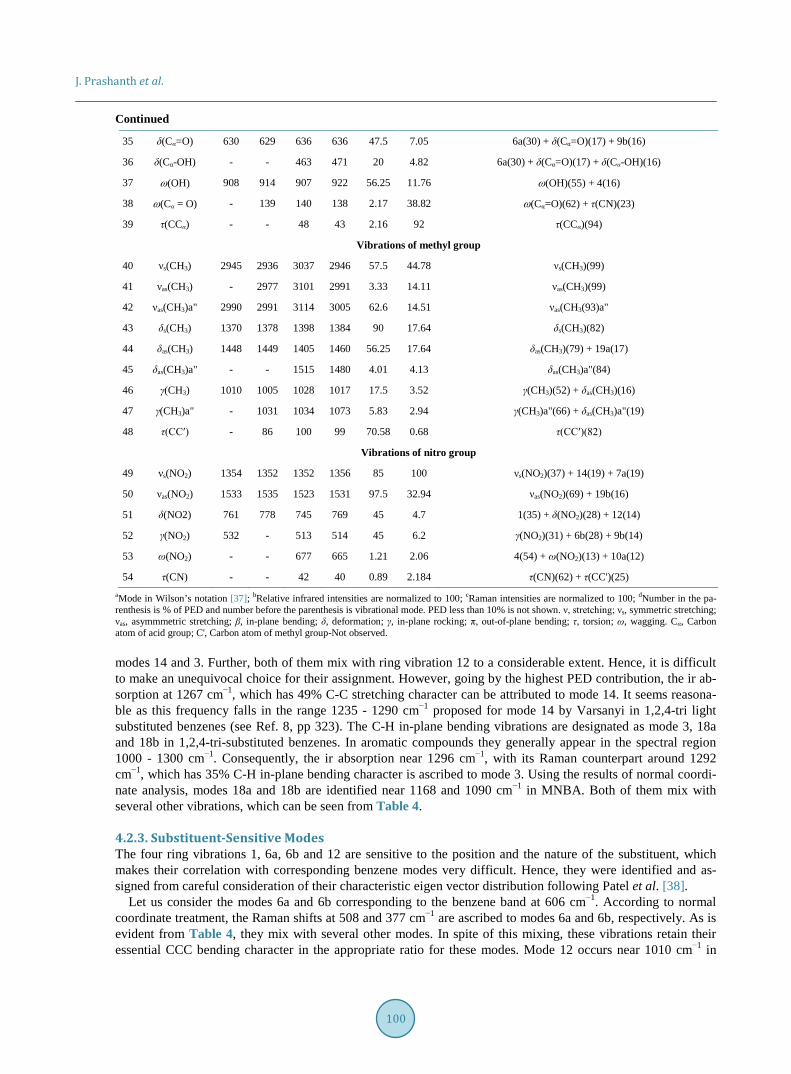
54 τ(CN) - - 42 40 0.89 2.184 τ(CN)(62) + τ(CC')(25) aMode in Wilson’s notation [37]; bRelative infrared intensities are normalized to 100; cRaman intensities are normalized to 100; dNumber in the pa-renthesis is % of PED and number before the parenthesis is vibrational mode. PED less than 10% is not shown. ν, stretching; νs, symmetric stretching; νas, asymmmetric stretching; β, in-plane bending; δ, deformation; γ, in-plane rocking; π, out-of-plane bending; τ, torsion; ω, wagging. Cα, Carbon atom of acid group; C', Carbon atom of methyl group-Not observed. modes 14 and 3. Further, both of them mix with ring vibration 12 to a considerable extent. Hence, it is difficult to make an unequivocal choice for their assignment. However, going by the highest PED contribution, the ir ab-sorption at 1267 cm−1, which has 49% C-C stretching character can be attributed to mode 14. It seems reasona-ble as this frequency falls in the range 1235 - 1290 cm−1 proposed for mode 14 by Varsanyi in 1,2,4-tri light substituted benzenes (see Ref. 8, pp 323). The C-H in-plane bending vibrations are designated as mode 3, 18a and 18b in 1,2,4-tri-substituted benzenes. In aromatic compounds they generally appear in the spectral region 1000 - 1300 cm−1. Consequently, the ir absorption near 1296 cm−1, with its Raman counterpart around 1292 cm−1, which has 35% C-H in-plane bending character is ascribed to mode 3. Using the results of normal coordi-nate analysis, modes 18a and 18b are identified near 1168 and 1090 cm−1 in MNBA. Both of them mix with several other vibrations, which can be seen from Table 4.
4.2.3. Substituent-Sensitive Modes The four ring vibrations 1, 6a, 6b and 12 are sensitive to the position and the nature of the substituent, which makes their correlation with corresponding benzene modes very difficult. Hence, they were identified and as-signed from careful consideration of their characteristic eigen vector distribution following Patel et al. [38].
Let us consider the modes 6a and 6b corresponding to the benzene band at 606 cm−1. According to normal coordinate treatment, the Raman shifts at 508 and 377 cm−1 are ascribed to modes 6a and 6b, respectively. As is evident from Table 4, they mix with several other modes. In spite of this mixing, these vibrations retain their essential CCC bending character in the appropriate ratio for these modes. Mode 12 occurs near 1010 cm−1 in
J. Prashanth et al.
101
Figure 3. FTIR spectrum of 4-methyl-3-nitrobenzoic acid: (a) Observed; (b) Cal-culated with B3LYP/6-311++G basis set.
Figure 4. FT-Raman spectrum of 4-methyl-3-nitrobenzoic acid: (a) Observed; (b) Calculated with B3LYP/6-311++G basis set.
J. Prashanth et al.
102
benzene. The only frequency which satisfies the criteria for mode 12 and yet cannot be considered as C-H in-plane bending vibration occurs near 805 cm−1 as strong ir absorption in MNBA. This frequency retains its es-sential CCC bending nature despite its mixing with several other vibrational frequencies. In benzene, mode 1 at 990 cm−1 is a pure stretching vibration as it is totally symmetric and widely separated from C-H stretching mod-es. As these restrictions are removed in substituted benzenes, mode 1 can mix with several of the bending modes and also with the lower frequencies of the substituent stretching modes. Hence, a pure mode corresponding to mode 1 of benzene cannot be expected. The only frequency which contains good amount of C-C stretching cha-racter and at the same time cannot be considered as C-H bending or CCC bending occurs around 655 cm−1 in MNBA. It mixes with several other vibrational modes, as can be seen from Table 4.
4.2.4. C-X [X = Cα (acid), N, C' (Methyl)] Stretching and in-Plane Bending Vibrations Modes 13, 7a and 7b are designated as C-Cα, C-N and C-C' stretching vibrations, whereas the modes 15, 9b and 9a represent the corresponding in-plane bending vibrations, respectively in MNBA. The ir absorption near 1201 cm−1 has its origin in the stretching vibration of C-Cα bond and assigned to mode 13 in the present molecule un-der investigation. Mode 13 has C-Cα stretching character to the extent of 38% and mixes with mode 3 and ν(Cα-OH). The band near 265 cm−1 (scaled calculated value) is attributed to C-Cα in-plane bending mode 15. It has 24% C-Cα in-plane bending character and mixes with several other fundamentals as reported in Table 4.
The strong ir absorption around 1138 cm−1 is identified as C-N stretching vibration 7a, whereas that near 338 cm−1 (scaled calculated value) is ascribed to the C-N in-plane bending mode 9b in MNBA. Their mixed nature can be seen from Table 4.
The band at 1293 cm−1 (scaled calculated value), with 19% C-C' stretching nature, is assigned to C-C' stret-ching mode 7b. This vibration mixes with C-C stretching vibration 14 and C-H in-plane bending mode 18b. The Raman shift near 343 cm−1 is attributed to C-C' in-plane bending mode 9a. This mode derives 25% PED from C-C' in-plane bending mode and mixes with several other vibrations as reported in Table 4.
4.2.5. C-H Stretching Vibrations Vibrations 2, 20a and 20b are known as C-H stretching vibrations in the titled molecule under investigation. They generally appear in a narrow spectral region 3000 - 3100 cm−1 in substituted benzenes. Further, the vibra-tional pair 20a and 20b, is usually strong in the infrared spectrum, whereas mode 2 is strong in Raman scattering (see Ref. 8, p. 21). Hence, ir bands at 3090 and 3065 cm−1 are assigned to the modes 20a and 20b, respectively, whereas the Raman shift around 3087 cm−1 is attributed to mode 2. According to normal coordinate analysis, as expected, these modes are pure, as each of them has 99% C-H stretching character and do not mix even among themselves.
4.2.6. C-H Out of Plane Bending Vibrations (Aromatic Nucleus) In tri-substituted benzenes, there are three out-of-plane C-H bending vibrations designated as modes 5, 11 and 17b. The phase relations are: +2, −1, −1 for mode 5; +1, +1, +1 for mode 11; 0, +2, −2 for mode 17b. The +ve and –ve sign indicate increase or decrease, respectively, of internal coordinates involved. Thus, identified ir ab-sorptions near 830, 744 and 948 cm−1 are assigned to the modes 5, 11 and 17b, respectively in MNBA. PED presented in Table 4 shows that the C-H out-of-plane bending character of modes 5 and 11 is 84%, whereas that of 17b is 65%. Further, vibrations 5 and 11 do not mix with any other mode, while mode 17b mixes with ring torsion vibration 16b to the extent of 17%.
4.2.7. CCCC Torsional Vibrations These are also known as ring torsions. There are three of them designated as modes 4, 16a and 16b in benzene and its derivatives. In mode 4, alternate CC torsion angles are either increasing or decreasing. In mode 16a, these angles change in the ratio +2, −1, −1, +2, −1, −1, whereas in vibration 16b, they change in the ratio 0, +2, −2, 0, +2, −2. Thus identified, according to the results of normal coordinate analysis, mode 4 appears near 699 cm−1 as a strong ir absorption. It mixes with ω(Cα=O) and mode 10b (Cα is the carbon atom of the acid group and same as carbon atom number 7 in Figure 2). The absorptions near 560 and 485 cm−1 having 34% and 52% ring torsion character are attributed to modes 16a and 16b, respectively. Other modes mixing with them can be understood from Table 4.

J. Prashanth et al.
103
4.2.8. C-X [X = Cα (Acid), N, C' (Methyl)] Out-of-Plane Bending Vibrations In MNBA, C-Cα, C-N and C-C' out-of-plane bending vibrations, associated with substituent acid, nitro and me-thyl groups, are designated as modes 10b, 17a and 10a, respectively. The Raman shifts near 196, 172 and 291 cm−1 are assigned to the modes 10b, 17a and 10a, respectively, on the basis of results of normal coordinate analysis. Table 4 reveals their mixed nature.
4.2.9. Vibrations of the Acid Group There are six in-plane vibrations and three out-of-plane vibrations that have their origin in the acid group of MNBA. These are, ν(Cα=O), ν(Cα-OH), δ(OH), ν(O-H), δ(Cα=O), δ(Cα-OH), ω(OH), ω(Cα=O) and τ(CCα). The most important characteristic feature of this group is that a very strong ir band appears in the range 1690 - 1800 cm−1, that has its origin in the carbonyl stretching vibration of the acid group. Thus, the very strong ir absorption at 1698 cm−1 is assigned to Cα=O stretching vibration in MNBA. It has 80% carbonyl stretching character. The stretching and in-plane bending vibrations, ν(Cα-OH) and δ(OH), of the acid group generally appear in the range 1200 - 1450 cm−1 depending on whether monomeric, dimeric or other hydrogen bonded species are present. Usually, δ(OH) appears at higher frequency than that of ν(Cα-OH). Moreover, these bands overlap with other bands that are due to aromatic nucleus or aliphatic chain vibrations making unambiguous assignment difficult. On the basis of results of normal coordinate analysis the ir absorption at 1425 cm−1 is found to have 61% of δ(OH) character. Hence, it is attributed to δ(OH). But, it is important to note that it mixes with C-C stretching mode 19b of the ring to the extent of 16%. The ir band around 1319 cm−1 having 29% of Cα-OH stretching cha-racter is attributed to ν(Cα-OH). It strongly mixes with modes 12 and 14 as can be seen from Table 4. All ben-zoic acids, being hydrogen bonded in the solid state, are characterised by a strong ir absorption, in the region 2200 - 3500 cm−1, attributable to ν(O-H) with a few superimposed maxima that have their origin in C-H stret-ching vibrations. MNBA is no exception. The centre of the band is around 2970 cm−1. We preferred not to in-clude this in our calculations. The value predicted by DFT near 3627 cm−1 for ν(O-H) corresponds to free mole-cule in the gaseous state. Assignment of remaining vibrations of this group can be understood from Table 4.
4.2.10. Vibrations of the Methyl Group There are six in-plane and three out-of-plane vibrations that can be associated with the methyl group of MNBA. These are νs(CH3), νas(CH3), νas(CH3)a", δs(CH3), δas(CH3), δas(CH3)a", γ(CH3), γ(CH3)a" and τ(CCʹ). On the ba-sis of the results of normal coordinate analysis, they are assigned to the bands at 2945, 2977R (R indicates Ra-man shift), 2990, 1370, 1445, 1515C (C indicates scaled calculated value), 1010, 1031R and 86 cm−1, respec-tively. These results agree with those of other methyl substituted benzenes [39] (and also see Ref.8, pp 395). The important observations that are worth mentioning are:
1) The three C-H stretching vibrations of the methyl group are pure modes as they do not mix with even among themselves and derive 93% to 99% PED from the corresponding C-H stretching vibration.
2) The symmetric deformation of the methyl group, along with its out-of-plane asymmetric deformation and methyl torsion should also be considered as pure as they do not mix with any other fundamental vibration. It is to be noted that they derive 82% - 84% PED from the relevant vibrational fundamental.
3) The in-plane asymmetric deformation of the methyl group gets predominant part of PED (79%) from δas(CH3). However, it mixes with C-C stretching mode of the ring 19a to the extent of 17%.
4) The in-plane rocking vibration of the methyl group exhibits γ(CH3) character to the extent of 52%. It mixes with mode 1 and mode 12 to a considerable extent (see Table 4).
5) The out-of-plane rocking mode of the methyl group has γ(CH3)a" nature to the extent of 66% and mixes with δas(CH3)a" to the extent of 19%.
4.2.11. Vibrations of the Nitro Moiety There are four in-plane and two out-of-plane vibrations that can reasonably expected to have their origin in the nitro moiety. These are νs(NO2), νas(NO2), δ(NO2), γ(NO2), ω(NO2) and τ(CN).
The symmetric stretching vibration of the nitro group occurs around 1354 cm−1. It has about 37% symmetric stretching character of the nitro group and acquires additional PED contributions from mode 14 and C-N stret-ching vibration 7a in MNBA.
The absorption at 1533 cm−1 could be assigned to the asymmetric stretching mode of the nitro group. It has about 69% of NO2 asymmetric stretching nature and mixes with modes 19b to the extent of 16%.

J. Prashanth et al.
104
The band near 761 cm−1 is due to the deformation of the NO2 group to the extent of 28%. It mixes with mode 1 and mode 12 to considerable extent.
The band near 532 cm−1 is mainly due to rocking vibration of the nitro group. However, it has to be described as a mixed mode as there are PED contributions from modes 6b and 9b.
The assignment of ω(NO2) and τ(CN) can be understood from Table 4.
4.3. First Order Hyperpolarizability Calculation of total molecular dipole moment µt and its components, total molecular first order hyperpolarizabil-ity βt and its components of MNBA were made at B3LYP/6-33++G level using GAUSSIAN 09W Program package. The results are summarized in Table 5.
The first order hyperpolarizability is a measure of non-linear optical (NLO) effects. NLO effects arise due to interaction of incident electromagnetic fields with media (NLO materials). The effect is manifested as genera-tion of new fields that differ in phase, frequency, amplitude or other propagation characteristics that differ from those of the incident fields [40]. NLO effects are important in providing the key functions of frequency shifting, optical modulation, optical switching, optical logic, optical memory for the emerging technologies in the area of telecommunications, signal processing and optical inter-connections [41]-[44]. Hence, DFT has been extensive-ly used to investigate the organic NLO materials [45]-[49].
Urea is a prototypical molecule used in the NLO properties of molecular systems. Hence, it was used fre-quently as a threshold value for the purpose of comparison. The calculated values of µt and βt for the title com-pound are 1.5802 Debye and 3.66 × 10⁻³⁰ cm5/esu, whereas, the corresponding values for Urea are 1.3732 Debye and 0.3728 × 10⁻³⁰ cm5/esu, respectively. Thus we find that the total dipole moment of the title com-pound is approximately 1.1 times greater than that of Urea and the total first order hyperpolarizability of the title molecules is 9.8 times greater than that of Urea. Hence, it can be concluded, on the basis of the magnitude of the first order hyperpolarizability, the title compound may be a potential applicant in the development of NLO ma-terials.
5. Conclusion A complete vibrational analysis of 4-methyl-3-nitrobenzoic acid is performed using the DFT method at B3LYP/
Table 5. Values of dipole moment, µ (in Debye) and first order hyperpolarizability, β (in 10−30 cm5/e.s.u) of 4-methyl-3-nitrobenzoic acid.
Type of component Value with B3LYP/6-311++G
µx 0.883
µy 1.2814
µz −0.5843
µt 1.5802
βxxx −139.047
βxxy −378.159
βxyy 219.875
βyyy −60.230
βxxz 11.4849
βxyz −3.733
βyyz 9.092
βxzz 1.599
βyzz 22.057
βzzz −22.35
βt 3.66
J. Prashanth et al.
105
6-311++G level of theory. The effect of methyl-, nitro- and acid groups on the structure of the title compound is discussed. All the fundamental frequencies of the molecule are assigned unambiguously based on the PED and eigenvectors obtained from normal coordinate analysis. The assignment of various vibrational modes is con-firmed by the quantitative agreement between the calculated and observed band intensities. It is demonstrated, beyond any reasonable doubt, that the title compound exhibits NLO properties.
Acknowledgements The financial support from University Grants Commission, New Delhi, India (F. No. 41-960/2012 (SR), dt.26/7/ 2012) is gratefully acknowledged. The authors are thankful to the Sophisticated Analytical Instrumentation Fa-cility (SAIF), IIT Madras, Chennai, India for the spectral measurements.
References [1] Loapez-Token, I., Becucci, M., Pietraperzia, G., Castellucci, E. and Otero, J.C. (2001) Vibrational Spectrum of
4-Fluoroaniline. Journal of Molecular Structure, 565-566, 421-425. http://dx.doi.org/10.1016/S0022-2860(00)00903-0 [2] Pulay, P., Fogarasi, G., Pongor, G., Boggs, J.E. and Vargha, A. (1983) Combination of Theoretical Ab Initio and Ex-
perimental Information to Obtain Reliable Harmonic Force Constants. Journal of the American Chemical Society, 105, 7037-7047. http://dx.doi.org/10.1021/ja00362a005
[3] Yoshida, H., Ehara, A. and Massura, H. (2000) Density Functional Vibrational Analysis Using Wavenumber-Linear Scale Factors. Chemical Physics Letters, 325, 477-483. http://dx.doi.org/10.1016/S0009-2614(00)00680-1
[4] Sundius, T. (2002) Scaling of Ab Initio Force Fields by MOLVIB. Vibrational Spectroscopy, 29, 89-95. http://dx.doi.org/10.1016/S0924-2031(01)00189-8
[5] Rauhut, G. and Pulay, P. (1995) Transferable Scaling Factors for Density Functional Derived Vibrational Force Fields. Journal of Physical Chemistry, 99, 3093-3100. http://dx.doi.org/10.1021/j100010a019
[6] Xu, L.C., Li, Z-Y., Tan, W., He, T-J., Liu, F-C. and Chen, D-M. (2005) Density Functional Theory Studies on the Ra-man and IR Spectra of Meso-Tetraphenylporphyrin Diacid. Spectrochimica Acta Part A: Molecular and Biomolecular Spectroscopy, 62, 850-862. http://dx.doi.org/10.1016/j.saa.2005.03.015
[7] Krishna Kumar, V., John Xavier, R. and Chithambarathanu, T. (2005) Density Functional Theory Study of Vibrational Spectra, and Assignment of Fundamental Vibrational Modes of Succinimide and N-Bromosuccinimide. Spectrochimi-ca Acta Part A: Molecular and Biomolecular Spectroscopy, 62, 931-939.
[8] Varasanyi, G. (1974) Assignments for Vibrational Spectra of Seven Hundred Benzene Derivatives. Vol. 1, Adam Hilger, London, 21, 55, 118, 124, 128, 135, 146, 164, 168, 200, 203, 205, 209, 221, 244, 248, 251, 268, 288, 303, 330- 331, 334-335, 337-338, 351, 356-358, 380, 382-384, 387, 395, 397-398, 401-402, 405, 412-413, 416, 427, 435.
[9] James, C., Ravikumar, C., Sundius, T., Krishnakumar, V., Kesavamurthy, R., Jayakumar, V.S. and Hubert Joe, I. (2008) FT-Raman and FTIR Spectra, Normal Coordinate Analysis and Ab Initio Computations of (2-Methylphenoxy) Acetic Acid Dimer. Vibrational Spectroscopy, 47, 10-20. http://dx.doi.org/10.1016/j.vibspec.2008.01.006
[10] Furic, K. and Durig, J.R. (1986) Proton-Pair Disorder in Dimers of Aromatic Carboxylic Acids: Vibrational Spectra of Benzoic Acid at Low Temperatures. Chemical Physics Letters, 126, 92-97. http://dx.doi.org/10.1016/0009-2614(86)85122-3
[11] Gunasekaran, S., Natarajan, R.K., Syamala, D. and Rathikha, R. (2006) Normal Coordinate Analysis of Urea Meta Ni-tro Benzoic Acid Crystal. Indian Journal of Pure and Applied Physics, 44, 315-319.
[12] Sundaraganesan, N., Dominic Joshua, B. and Settu, K. (2007) Vibrational Spectra and Assignments of 5-Amino- 2-chlorobenzoic Acid by Ab Initio Hartree-Fock and Density Functional Methods. Spectrochimica Acta Part A, 66, 381-388. http://dx.doi.org/10.1016/j.saa.2006.03.008
[13] Sundaraganesan, N., Dominic Joshua, B., Meganathan, C., Meenakshi, R. and Cornard, J.P. (2008) Vibrational Spectra and Quantum Chemical Calculations of 3,4-Diaminobenzoic Acid. Spectrochimica Acta Part A, 70, 376-383. http://dx.doi.org/10.1016/j.saa.2007.10.051
[14] Ramalingam, M., Sundaraganesan, N., Saleem, H. and Swaminathan, J. (2008) Experimental (FTIR and FT-Raman) and Ab Initio and DFT Study of Vibrational Frequencies of 5-Amino-2-nitrobenzoic Acid. Spectrochimica Acta Part A, 71, 23-30. http://dx.doi.org/10.1016/j.saa.2007.11.016
[15] Sundaraganesan, N., Dominic Joshua, B. and Radjakonmar, T. (2009) Molecular Structure and Vibrational Spectra of 2-Chlorobenzoic Acid by Density Functional Theory and Ab Initio Hartree-Fock Calculations. Indian Journal of Pure and Applied Physics, 47, 248-258.
[16] Tyagi, O.D. and Yadav, M. (1990) Text Book of Synthetic Drugs. Fifth Edition, Anmol Publications, New Delhi, 49.
J. Prashanth et al.
106
[17] Guo, H., Li, M.H., Chen, P., Blake, D.J., Kong, X.N., Hao, X.S., Niu, R.F. and Zhang, N. (2012) 4-Methyl-3-nitro- benzoic Acid, a Migration Inhibitor, Prevents Breast Cancer Metastasis in SCID Mice. Cancer Letters, 324, 232. http://dx.doi.org/10.1016/j.canlet.2011.08.005
[18] Frisch, M.J., Trucks, G.W., Schlegel, H.B., Scuseria, G.E., Robb, M.A., Cheeseman, J.R., et al. (2009) Gaussian, Inc., Wallingford.
[19] Becke, A.D. (1993) Density Functional Thermochemistry. III. The Role of Exact Exchange. The Journal of Chemical Physics, 98, 5648-5652. http://dx.doi.org/10.1063/1.464913
[20] Lee, C., Yang, W. and Parr, R.G. (1998) Development of the Colic-Salvetti Correlation-Energy Formula into a Func-tional of the Electron Density. Physical Review B, 37, 785-789. http://dx.doi.org/10.1103/PhysRevB.37.785
[21] Berces, A. and Ziegler, T. (1993) Dynamics of Molecules and Chemical Reactions. The Journal of Chemical Physics, 98, 4793-4804.
[22] Pulay, P., Fogarasi, G., Pongor, G., Boggs, J.E. and Vargha, A. (1983) Combination of Theoretical Ab Initio and Ex-perimental Information to Obtain Reliable Harmonic Force Constants. Scaled Quantum Mechanical (SQM) Force Fields for Glyoxal, Acrolein, Butadiene, Formaldehyde, and Ethylene. Journal of the American Chemical Society, 105, 7037-7047. http://dx.doi.org/10.1021/ja00362a005
[23] Fogarasi, G., Pulay, P. and Durig, J.R., Eds. (1985) Chapter 3, Vibrational Spectra and Structure. Elsevier, Amsterdam, Vol. 14, 125.
[24] Fogarasi, G., Zhou, X., Tayler, P.W. and Pulay, P. (1992) The Calculation of Ab Initio Molecular Geometries: Efficient Optimization by Natural Internal Coordinates and Empirical Correction by Offset Forces. Journal of the American Chemical Society, 114, 8191-8201. http://dx.doi.org/10.1021/ja00047a032
[25] Sundius, T. (1990) Molvib—A Flexible Program for Force Field Calculations. Journal of Molecular Structure, 218, 321-326. http://dx.doi.org/10.1016/0022-2860(90)80287-T
[26] Sundius, T. (2002) Scaling of Ab Initio Force Fields by MOLVIB. Vibrational Spectroscopy, 29, 89-95. http://dx.doi.org/10.1016/S0924-2031(01)00189-8 MOLVIB (V.7.0), Calculation of Harmonic Force Fields and Vibrational Modes of Molecules, QCPE Program No. 807, 2002.
[27] Keresztury, G., Holly, S., Varga, J., Besenyei, G., Warng, A.Y. and Durig, J.R. (1993) Vibrational Spectra of Mono-thiocarbamates-II. IR and Raman Spectra, Vibrational Assignment, Conformational Analysis and Ab Initio Calcula-tions of S-Methyl-N,N-dimethylthiocarbamate. Spectrochimica Acta Part A, 49, 2007-2017, 2019-2026. http://dx.doi.org/10.1016/S0584-8539(09)91012-1
[28] Keresztury, G., Chalmers, J.M. and Griffth, P.R., Eds. (2002) Raman Spectroscopy: Theory in Handbook of Vibra-tional Spectroscopy. Volume 1, John Wiley and Sons Ltd., New York, 71.
[29] Klienman, D.A. (1962) Nonlinear Dielectric Polarization in Optical Media. Physical Review, 126, 1977-1979. http://dx.doi.org/10.1103/PhysRev.126.1977
[30] Zhang, R., Du, B., Sun, G. and Sun, Y.X. (2002) Experimental and Theoretical Studies on o-, m- and p-Chlorobenzyli- deneaminoantipyrines. Spectrochimica Acta Part A, 75, 1115-1124. http://dx.doi.org/10.1016/j.saa.2009.12.067
[31] Abe, T., Saito, H., Niikura, Y. and Nakano, Y. (2001) Embryonic Development Assay with Daphnia magna: Applica-tion to Toxicity of Aniline Derivatives. Chemosphere, 45, 487-495. http://dx.doi.org/10.1016/S0045-6535(01)00049-2
[32] Lipkowitz, K.B. (1982) A Reassessment of Nitrobenzene Valence Bond Structures. Journal of the American Chemical Society, 104, 2647-2648. http://dx.doi.org/10.1021/ja00373a057
[33] Altun, A., Golcuk, K. and Kumru, M. (2003) Theoretical and Experimental Studies of Vibrational Spectra of m-Methylaniline. Journal of Molecular Structure, 625, 17-24.
[34] Politzer, P., Abrahmsen, L. and Sjoberg, P. (1984) Theoretical Organic Chemistry. Journal of the American Chemical Society, 106, 855-860. http://dx.doi.org/10.1021/ja00316a005
[35] Domenicano, A., Schultz, G., Harigittew, I., Colapietro, M., Portalone, G., George, P. and Bock, C.W. (1989) Molecu-lar Structure of Nitrobenzene in the Planar and Orthogonal Conformations: A Concerted Study by Electron Diffraction, X-Ray Crystallography, and Molecular Orbital Calculations. Structural Chemistry, 1, 107-122.
[36] Brunvoll, J., Samdal, S., Thomassen, H., Vilkov, L.V. and Volden, H.V. (1990) The Molecular Structure of Iodoben-zene and p-Iodonitrobenzene in the Gaseous State. Acta Chemica Scandinavica, 44, 23-30. http://dx.doi.org/10.3891/acta.chem.scand.44-0023
[37] Wilson, E.B. (1934) The Normal Modes and Frequencies of Vibration of the Regular Plane Hexagon Model of the Benzene Molecule. Physical Review, 45, 706-714. http://dx.doi.org/10.1103/PhysRev.45.706
[38] Patel, N.D., Kartha, V.B. and Narasimham, N.A. (1973) Vibrational Spectra Dihalogenated Benzenes. I. In-Plane Vi-brations. Journal of Molecular Spectroscopy, 48, 185-201. http://dx.doi.org/10.1016/0022-2852(73)90185-9

J. Prashanth et al.
107
[39] La Lau, C. and Snyder, R.G. (1971) A Valence Force Field for Alkyl Benzenes Toluene, p-Xylene, m-Xylene Mesity-lene, and Some of Their Deuterated Analogues. Spectrochimica Acta Part A, 27, 2073-2088. http://dx.doi.org/10.1016/0584-8539(71)80105-8
[40] Sun, Y.X., Hao, Q.L., Wei, W.X., Yu, Z.X., Lu, L.D., Wang, X. and Wang, Y.S. (2009) Experimental and Density Functional Studies on 4-(3,4-Dihydroxybenzylideneamino)antipyrine, and 4-(2,3,4-Trihydroxybenzylidene-amino) Antipyrine. Journal of Molecular Structure: THEOCHEM, 904, 74-82.
[41] Andraud, C., Brotin, T., Garcia, C., Pelle, F., Goldner, P., Bigot, B. and Collet, A. (1994) Theoretical and Experimental Investigations of the Nonlinear-Optical Properties of Vanillin, Polyenovanillin, and Bisvanillin Derivatives. Journal of the American Chemical Society, 116, 2094-2102. http://dx.doi.org/10.1021/ja00084a055
[42] Geskin, V.M., Lambert, C. and Bredas, J.L. (2004) Origin of High Second- and Third-Order Nonlinear Optical Re-sponse in Ammonio/Borato Diphenylpolyene Zwitterions: The Remarkable Role of Polarized Aromatic Groups. Journal of the American Chemical Society, 125, 15651-15658. http://dx.doi.org/10.1021/ja035862p
[43] Nakano, M., Fujita, H., Takahata, M. and Yamaguchi, K. (2002) Theoretical Study on Second Hyperpolarizabilities of Phenylacetylene Dendrimer: Toward an Understanding of Structure-Property Relation in NLO Responses of Fractal Antenna Dendrimers. Journal of the American Chemical Society, 124, 9648-9655. http://dx.doi.org/10.1021/ja0115969
[44] Sajan, D., Joe, H., Jayakumar, V.S. and Zaleski, J. (2006) Structural and Electronic Contributions to Hyperpolarizabil-ity in Methyl p-Hydroxy Benzoate. Journal of Molecular Structure, 785, 43-53.
[45] Sun, Y.X., Hao, Q.L., Yu, Z.X., Wei, W.X., Lu, L.D. and Wang, X. (2009) Experimental and Density Functional Studies on 4-(4-Cyanobenzylideneamino) Antipyrine. Molecular Physics, 107, 223-235. http://dx.doi.org/10.1080/00268970902769471
[46] Ahmed, A.B., Feki, H., Abid, Y., Boughzala, H., Minot, C. and Mlayah, A. (2009) Crystal Structure, Vibrational Spec-tra and Theoretical Studies of L-Histidinium Dihydrogen Phosphate-Phosphoric Acid. Journal of Molecular Structure, 920, 1-7.
[47] Abraham, J.P., Sajan, D., Shethigar, V., Dharmaprakash, S.M., Nemec, I., Joe, I.H. and Jayakumar, V.S. (2009) Effi-cient π-Electron Conjugated Push-Pull Nonlinear Optical Chromophore 1-(4-Methoxyphenyl)-3-(3,4-dimethoxyphenyl)- 2-propen-1-one: A Vibrational Spectral Study. Journal of Molecular Structure, 917, 27-36.
[48] Sagdinc, S.G. and Esme, A. (2010) Theoretical and Vibrational Studies of 4,5-Diphenyl-2-2 Oxazole Propionic Acid (Oxaprozin). Spectrochimica Acta Part A, 75, 1370-1376. http://dx.doi.org/10.1016/j.saa.2010.01.004
[49] Ahmed, A.B., Feki, H., Abid, Y., Bonghzala, H. and Minot, C. (2010) Crystal Studies, Vibrational Spectra and Non- Linear Optical Properties of L-Histidine Chloride Monohydrate. Spectrochimica Acta Part A, 75, 293-298. http://dx.doi.org/10.1016/j.saa.2009.10.026