molecular simulation study of gas storage and separation
TRANSCRIPT

MOLECULAR SIMULATION STUDY OF GAS
STORAGE AND SEPARATION BY NOVEL
MICROPORE ARCHITECTURES
Afsana Ahmed
Dissertation submitted in fulfillment of requirements for the degree of
Doctor of Philosophy
Faculty of Science, Engineering and Technology Swinburne University of Technology
2015

Abstract
Gas storage and separation in microporous materials is now a subject of greater interest
than ever before, even though the problem of finding suitable materials has existed from
the beginning of the 19th century. Since then, many researchers have attempted to
modify various materials’ chemical stability for gas storage and separation applications.
The 21st century has seen revolutionary advancement in microporous materials. A
promising candidate, named Porous Aromatic Frameworks (PAFs), has been discovered
which are ideal and have a unique combination of ultrahigh surface area and
extraordinary physicochemical stability.
In this work, based on molecular simulation, we present a method for hydrogen gas
storage within lithiated fullerenes (Li6C60) impregnated PAF materials, with the goal of
reaching the DoE capacity targets for on-board hydrogen storage at cryogenic
temperature (not within DoE specifications). Despite an apparent loss of free volume
related to pore filling by lithiated fullerenes, the adsorption capacity is increased at low
pressures for gravimetric uptake and increased at all pressures for volumetric uptake.
This improvement strategy may remove the need for high pressure vessels.
Water/Methanol separation by molecular simulation within fullerenes (C60)
incorporated (PAFs) is also studied. Grand Canonical Monte Carlo (GCMC)
simulations are utilized to calculate the pure component and mixture adsorption
isotherms. The adsorption of water is very small compared to methanol, a useful
material property for membrane and adsorbent-based separations. We have also studied
Molecular Dynamics (MD) simulations to confirm that the water diffusivity is also
i

inhibited by strong methanol adsorption in the mixture. Overall this study reveals
profound hydrophobicity in C60@PAF materials and recommends C60@PAFs as
suitable applicants for adsorbent and membrane-based separations of methanol/water
mixtures and other alcohol/water separation applications. The hydrophobic properties of
impregnated PAFs explain clearly the negligible affinity for H2O adsorption. Our
simulations also predict that C60@PAF may have promising properties for membrane-
based separations that differentiate them in important ways from other membrane
separation technologies.
Lithium-decorated fullerenes (Li6C60) impregnated within a series of PAFs of various
pore sizes were also studied for natural gas purification by molecular simulation.
Removing carbon dioxide, also known as ‘sweetening’, from natural gas is an important
industrial problem for natural gas purification. Our study demonstrates the strong
affinity of CO2 with the impregnated frameworks, which is also confirmed by density
functional theory, and leads to selective adsorption over CH4. The simulation isotherms
for pure components of CO2 and CH4 are in good agreement with the literature. In
comparison to other adsorbents, the impregnated PAFs show moderate selectivities with
relatively high working capacities at standard operating conditions cycling between 1
and 10 bar. Overall, the study reveals physical insights and proposes impregnated PAFs
to be promising candidates for CO2/CH4 separations for natural gas purification.
ii

Acknowledgements
First of all, I would like to thank the supreme power of the Almighty Allah who is
obviously the one has always guided me to work on the right path of life. Without His
grace this dissertation could not become a reality. Next, I would like to sincerely
acknowledge Prof. Billy D. Todd, Dr. Anita Hill and Dr. Aaron W. Thornton for their
great supervision during my study at Swinburne University of Technology. They have
given me the guidance, inspiring suggestions, encouragement and most of all belief in
me at every stage of my work. I couldn’t thank them enough for giving me the
opportunity to let me work with them and learning from them.
I would like to thank to Dr. Matthew R. Hill for his constructive suggestions and
valuable advice and all other members from manufacturing flagship in CSIRO, Clayton
for their constant help and encouraging discussions and proving me a friendly
environment in perusing my goal. I would also like to thank Swinburne University of
Technology for financial support through a SUPRA Scholarship and a top up from
CSIRO for additional support. I am indebted to CSIRO letting me use their software
license and supercomputer facilities for my study.
I am also thankful to all the students in our group for a friendly environment and social
activities that we had together.
Thanks to all my friends from our sisters group with whom I had a great time in all my
difficulties, constant support and pampering me with multi-cultural foods.
Finally my deepest thanks to my husband, 8 years old daughter Arina and my parents
for their endless love, support and encouragement in every step in my life.
iii
Declaration
I hereby declare the thesis entitled “Molecular simulation study of gas storage and
separation by novel nanopore architectures”, and submitted in fulfillment of the
requirements for the Degree of Doctor of Philosophy in the Faculty of Science,
Engineering and Technology of Swinburne University of Technology, is my own work
and that it contains no material which has been accepted for the award to the candidate
of any other degree or diploma, except where due reference is made in the text of the
thesis. To the best of my knowledge and belief, it contains no material previously
published or written by another person except where due reference is made in the text of
the thesis.
Afsana Ahmed
May 2015
iv

v

Publications from this thesis
The following papers have been based on part of this work:
1. Ahmed A, Thornton AW, Konstas K, Kannam SK, Babarao R, Todd BD, et al. Strategies toward enhanced low-pressure volumetric hydrogen storage in nanoporous cryoadsorbents. Langmuir. 2013;29(50):15689-97. 2. Ahmed A, Xie Z, Konstas K, Babarao R, Todd BD, Hill MR, et al. Porous aromatic frameworks impregnated with fullerenes for enhanced methanol/water separation. Langmuir. 2014;30(48):14621-14630. 3. Ahmed A, Babarao R, Huang R, Medhekar NV, Todd BD, Hill MR, et al. Porous aromatic frameworks impregnated with lithiated fullerenes for natural gas purification. J Phys Chem C. 2015;29(50):15689-15697. Publication not from this thesis: 4. Thornton AW, Ahmed A, Kannam SK, Todd BD, Majumder M, et al. Analytical diffusion mechanism (ADiM) model combining specular, knudesn and surface diffusion. J. Membr. Sci. 2015; 485:1-9.
5. Aaron WT, Afsana A, Majumder M, HoBum P, Anita JH. Ultrafast transport in nanotubes and nanosheets. Nanotubes and nanosheets: CRC Press 2015, p. 271-304.
vi

Table of Contents Abstract…………………………………………………………………………………..i
Acknowledgements……………………………………………………………………...ii
Declaration……………………………………………………………………………..iii
Publications from this thesis…………………………………………………………...vi
Table of contents……………………………………………………………………….vii
List of Figures…………………………………………………………………………...x
List of Tables…………………………………………………………………………..xiv
Notation………………………………………………………………………………...xv
1. Introduction to Porous Aromatic Frameworks………………………………….1 1.1 Background of Porous Materials …………………………………………………1
1.1.1 Activated Carbon, Silica Gel and Zeolites …………………………………...2
1.1.2 Metal Organic Frameworks (MOFs) and Covalent Organic Frameworks (COFs) ……………………………………………………………………………..3
1.1.3 Hypercrosslinked Polymers (HCPs) …………………………………………6
1.1.4 Porous Aromatic Frameworks (PAFs) ………………………………………….6
1.1.4.1 High Surface Area ………………………………………………………….6
1.1.4.2 Effective Binding site ……………………………………………………..11
1.1.4.3 Modification of Porous Aromatic Frameworks …………………………...12
1.1.4.3.1 Sulfonation ……………………………………………………………...12
1.1.4.3.2 Lithiation ………………………………………………………………..13
1.1.4.3.3 Amination………………………………………………………………..15
1.1.4.3.4 Carbonization …………………………………………………………...16
1.2 Conclusion ………………………………………………………………………17
2. Introduction to Gas Storage …………………………………………………….19 2. 1 Introduction ……………………………………………………………………..19
2.2 Storage method ………………………………………………………………….19
2.2.1 Physisorption ………………………………………………………………..21
2.2.2 Heat of adsorption …………………………………………………………..22
2.2.3 Surface area ………………………………………………………………....23
vii

2.2.4 Pore size …………………………………………………………………….25
2.2.4.1 t-method …………………………………………………………………26
2.2.4.2 αs–method ………………………………………………………………27
2.2.4.3 Micropore analysis (MP) –method ……………………………………...27
2.2.4.4 Molecular simulations…………………………………………………...29
2.2.4.4 Ab-initio calculation …………………………………………………….32
2.3 Nanoporous material for gas storage ………………………………………...….32
2.3.1 Hydrogen Storage …………………………………………………………..33
2.3.2 Others Application of Nanoporous materials ……………………………….37
2.4 Summary ………………………………………………………………………...38
3. Introduction to Gas Separation ………………………………………………...39 3.1 Introduction ……………………………………………………………………..39
3.2 Separation processes …………………………………………………………….40
3.2.1 Membrane based separation ………………………………………………...40
3.3 Adsorption based separation …………………………………………………….47
3.3.1 Method of adsorbent regeneration ………………………………………….48
3.3.2 Feed composition …………………………………………………………...49
3.3.3 Mechanism of separation …………………………………………………...49
3.4 Adsorption principles ……………………………………………………………50
3.4.1 Adsorption forces……………………………………………………………51
3.4.2 Isotherms and isobars………………………………………………………..53
3.5 Summary…………………………………………………………………………54
4. Molecular Simulations…………………………………………………………...56 4.1 Introduction………………………………………………………………………56
4.2 Introduction to Methods…………………………………………………………58
4.3 Theory……………………………………………………………………………59
4.3.1 MC as a configurationally sampling method………………………………..59
4.3.2 MC as importance sampling method………………………………………..61
4.3.3 MC as an optimization procedure…………………………………………...63
4.4 Simulating Adsorption…………………………………………………………...64
4.4.1 Sorption……………………………………………………………………...64
4.4.2 Configuration bias MC………………………………………………………67
viii

4.5 Conclusion……………………………………………………………………….68
5. Strategies towards Enhanced Low Pressure Volumetric Hydrogen Storage in Nanoporous Cryo-adsorbents………………………………………………………..69
5.1 Introduction……………………………………………………………………...69
5.2 Models and Simulation…………………………………………………………..73
5.3 Results and Discussion…………………………………………………………..77
5.4 Conclusions………………………………………………………………………99
6. Porous aromatic frameworks impregnated with fullerenes for enhanced methanol/water separation………………………………………………………….100
6.1 Introduction……………………………………………………………………..100
6.2 Simulation Models and Methods……………………………………………….104
6.2.1 Adsorption Model………………………………………………………….104
6.2.2 Diffusion Model……………………………………………………………107
6.3 Results and Discussion………………………………………………………....109
6.4 Conclusions……………………………………………………………………..122
7. Porous aromatic frameworks impregnated with lithiated fullerenes for natural gas purification………………………………………………………………………123
7.1 Introduction…………………………………………………………………….123
7.2 Models and Simulation…………………………………………………………128
7.3 Results and Discussion…………………………………………………………133
7.4 Conclusion……………………………………………………………………...148
8. Conclusion and Outlook………………………………………………………..150 8.1 Conclusion……………………………………………………………………...150
8.2 Outlook…………………………………………………………………………155
References……………………………………………………………………………157
ix

Table of Figures
Figure 1.1: X-ray structures of single-crystal of (a) MOF-5, (b) IRMOF-6 and IRMOF-8, taken from a part of a single cube from their respective cubic three-dimensional (3D) extended structures………………………………………………………………………4
Figure 1.2: Schematic representation of 3D COFs………………………………………5
Figure 1.3: Unit cells of (a) PAF-301, (b) PAF-302, (c) PAF-303, and (d) PAF-304, synthesized by structural topology design and geometry maximization………………...7
Figure 1.4: Typical structure of experimentally synthesized and simulated PAFs……...9
Figure 1.5: Grafting and synthesis of PPN-6…………………………………………..13
Figure 1.6: Synthesis of Li-PAF-1……………………………………………………..14
Figure 1.7: Synthetic route to polyamine-tethered PPNs………………………………16
Figure 2.1: Four gas storage methods………………………………………………….21
Figure 2.2: Lennard-Jones potential energy between an atom and an infinite flat
surface………………………………………………………………………………….22
Figure 2.3: General form of Langmuir isotherm……………………………………….24
Figure 2.4: (a) Standard type-II isotherm, (b) t-plot from type-II isotherm……………27
Figure 2.5: (a) Isotherrn of N2 on silica gel at 77.3 K (b) V-t curve……………………28
Figure 2.6: (a) Snapshots of H2 adsorption in PAF-304 with 28 Li6C60 at 0-100 pressure , (b) H2 spheres within the unit cell of a metal-organic framework at two different pressures of 0.1 (left) and 30 (right) bar………………………………………………..30
Figure 2.7: Summary of different hydrogen storage materials and their limitations…..35
Figure 3.1: Membrane classification…………………………………………………...41
Figure 3.2: Gas separation membrane with a constant concentration gradient across the membrane thickness 𝐿………………………………………………………………….42
Figure 3.3: Schematic representation of membrane-based gas separation
Mechanisms…………………………………………………………………………….45
Figure 3.4: Different porous structure used for various types of membranes………….47
Figure 5.1. Atomistic representation of a) PAF-303 and b) PAF-304 impregnated with Li6C60…………………………………………………………………………………...73
Figure 5.2: Pore size distribution from Voronoi construction for (a) empty PAF-303,
x

4Li6C60@PAF-303, 9Li6C60@PAF-303 and 32Li6C60@PAF-303 (b) empty PAF-304, 4Li6C60@PAF-304, 28Li6C60@PAF-304 and 72Li6C60@PAF-304 respectively……..75
Figure 5.3: Total H2 uptake in PAF-303 (a) gravimetric and (b) volumetric uptake embedded with no. of Li6C60 up to 1 bar and 77 K. Arrows indicate increased Li6C60
loading………………………………………………………………………………….79
Figure 5.4: Total H2 uptake in PAF-304 (a) gravimetric (b) volumetric uptake embedded with no. of Li6C60 up to 1 bar and 77 K. Arrows indicate increased Li6C60
loading………………………………………………………………………………….80
Figure 5.5: Total H2 uptake in PAF-303 (a) gravimetric (b) and volumetric uptake embedded with no. of Li6C60 up to 100 bar and 77 K. Arrows indicate increased Li6C60
loading………………………………………………………………………………….82
Figure 5.6: Total H2 uptake in PAF-304 (a) gravimetric (b) volumetric embedded with no. of Li6C60 up to 100 bar and 77 K. Arrows indicate increased Li6C60 loading…….83
Figure 5.7: Total (solid symbols) and excess (open symbols) H2 volumetric uptake for (a) PAF-303 and (b) PAF-304 with and without impregnated lithiated fullerenes…….84
Figure 5.8: Snapshots of H2 adsorption in PAF-304 without Li6C60 at 77 K and a pressure of (a) 0 bar (b) 0.01 bar (c) 0.1 bar (d) 1 bar (e) 10 bar (f) 100 bar and with 28 Li6C60 at a pressure of (g) 0 bar (h) 0.01 bar (i) 0.1 bar and (j) 1 bar (k) 10 bar (l) 100 bar respectively…………………………………………………………………………86
Figure 5.9: BET Surface area of Li6C60 (SABET = 6450 [m2/g]) with a binding energy of around 1.59 kcal/mol…………………………………………………………………...87
Figure 5.10: Total volumetric and gravimetric hydrogen uptake with Li6C60 loading in (a) PAF-303 and (b) PAF-304 at 77 K and various pressures………………………….89
Figure 5.11: Working capacity of PAF-304 and impregnated PAF-304 from (a) DoE prescribed cycle 5-100 bar and (b) vacuum-1 bar cycle………………………………..90
Figure 5.12: Hydrogen a) gravimetric and b) volumetric uptake with Li6C60 loading in PAF-303 at 77 K and various pressures………………………………………………..91
Figure 5.13: Hydrogen a) gravimetric and b) volumetric uptake with Li6C60 loading in PAF-304 at 77 K and various pressures………………………………………………..92
Figure 5.14: Structure-property relationships between gravimetric H2 uptake, Li6C60 loading and (a) heat of adsorption at 0.01 bar, (b) surface area at 1 bar and (c) pore volume at 100 bar………………………………………………………………………95
Figure 5.15: Structure-property relationships between volumetric H2 uptake, Li6C60 loading with surface area for (a) PAF-303 and (b) PAF-304…………………………..96
Figure 5.16: Isosteric heat of adsorption, Qst with respect to pressure for PAF-303 and
xi

PAF-304. Magenta represents PAF-303 and red represents PAF-304…………………97
Figure 5.17: H2 volumetric uptake with respect to temperature and pressure for (a) bare PAF-304 and (b) 28 Li6C60@PAF-304...........................................................................98
Figure 6.1: Schematic of porous aromatic frameworks formed with various ligands and then impregnated with fullerenes……………………………………………………..103
Figure 6.2: Total adsorption of single component (a) H2O in PAF-302 (b) CH3OH in PAF-302, (c) H2O in PAF-303 (d) CH3OH in PAF-303, (e) H2O in PAF-304 and (f) CH3OH in PAF-304 at 303 K…………………………………………………………110
Figure 6.3: Adsorption of an equimolar mixture of CH3OH/H2O at 303 K in (a) PAF-302 (b) PAF-303 and (c) PAF-304. Closed symbols are for CH3OH and open symbols are for H2O……………………………………………………………………………112
Figure 6.4: Selectivity of an equimolar mixture of CH3OH/H2O at 303 K in (a) PAF-302 (b) PAF-303 and (c) PAF-304……………………………………………………114
Figure 6.5: Selectivity vs CH3OH uptake at 303 K in (a) PAF-302 (b) PAF-303 and (c) PAF-304, where dashed lines represent the selectivities (1932, 1000, 20) of the highest performing materials in the literature………………………………............................115
Figure 6.6: Snapshot of CH3OH/H2O adsorption uptake at 303 K and 100 kPa in (a) 17 C60@ PAF-302 (b) 46 C60@ PAF-303 and (c) 104 C60@ PAF-304, where green and red dots are represent H2O and CH3OH density respectively……………………………116
Figure 6.7: Self-diffusivity of H2O and CH3OH at 303 K in the available PAFs. Red indicates the error in calculations…………………………………………………….119
Figure 6.8: Radial distribution function g(r) between the PAF framework atoms and the center of mass for CH3OH and H2O molecules during the mixed-gas molecular dynamics simulations at 303 K……………………………………………………….119
Figure 6.9: Diffusivity selectivity versus CH3OH diffusivity in the mixture of CH3OH/H2O at 303 K. Red indicates the error in calculations……………………….120
Figure 6.10: Adsorption of an equimolar mixture of CH3OH/H2O at 303 K with PAF-302 with and without charges…………………………………………………………121
Figure 6.11: Selectivity of an equimolar mixture of CH3OH/H2O at 303 K with PAF-302 with and without charges…………………………………………………………121
Figure 7.1: Schematic of CO2/CH4 separation in Li6C60 impregnated PAF………….128
Figure 7.2: Charge assignment within the frameworks (a) PAF-302 (four types of carbon and one type of hydrogen atom), (b) PAF-303 (eight types of carbon and two types of hydrogen atom), (c) PAF-304 (eight types of carbon and two types of hydrogen
xii

atom) and (d) Li6C60 (three types of carbon and one type of lithium atom)………….129
Figure 7.3: CO2 uptake at 2 bar and 298 K for Li6C60 impregnated (a) PAF-302, (b) PAF-303 and (c) PAF-304. Red dotted line is the experimental results of CO2 uptake in bare PAF-302…………………………………………………………………………136
Figure 7.4: CH4 uptake at 2 bar and 298 K for Li6C60 impregnated (a) PAF-302, (b) PAF-303 and (c) PAF-304. Arrows emphasize the trends with the increasing amount of impregnation………………………………………………………………………......138
Figure 7.5: Structure property relationships among CO2 uptake, Li6C60 loading and volumetric surface area at 2 bar and 298 K, Solid symbols are representing CO2 uptake in PAFs and open symbols are representing the volumetric surface area of corresponding PAFs………………………………………………………………….139
Figure 7.6: (a) CO2 isosteric heats of adsorption with DFT-based binding energy values (solid black symbols). (b) Strongest binding sites for CO2 on PAF and Li6C60 from DFT calculations with binding energies. (c) Isosteric heats of adsorption of CH4 in bare PAFs and impregnated PAFs………………………………………………………………..141
Figure 7.7: Radial distribution function g(r) between the Li6C60 and the center of mass for CO2 and CH4 molecules………………………………………………………….142
Figure 7.8: Ideal selectivity of CO2/CH4 at 298 K and 2 bar………………………...143
Figure 7.9: Ideal selectivity CO2/CH4 vs CO2 uptake at 298 K in Li6C60 impregnated (a) PAF-302, (b) PAF-303 (c) PAF-304. Arrows emphasize the trends with the increasing amount of impregnation………………………………………………………………145
Figure 7.10: Selectivity vs CO2 uptake at 298 K in (a) 27 Li6C60 PAF-304 (b) 10 Li6C60
PAF-303 for different ratio of CO2:CH4………………………………………………146
Figure 7.11: Selectivity vs CO2 uptake at 298 K in (a) 27 Li6C60 PAF-304 and (b) 10 Li6C60 PAF-303 at various pressures. The dashed line is selectivity value for most commercially used zeolites……………………………………………………….......147
Figure 7.12: Adsorption selectivities vs. working capacity (adsorption cycle between 1 and 1 bar) for CO2/CH4 mixtures at 300 K in a variety of MOFs, zeolite and PAFs structures. Dashed line highlights the upper bound trade-off trend…………………..148
xiii
List of Tables
Table 3.1: Gases involved in gas separation technologies and their application………46
Table 3.2: Commercially used adsorption separations…………………………………48
Table 5.1: Force field parameters………………………………………………………77
Table 5.2: The density, surface area and free volume of bare PAF and the chosen nLi6C60@PAF that deliver the maximum uptake………………………………………85
Table 6.1: Force field parameters for the PAF and fullerene…………………………105
Table 6.2: Force field parameters for H2O and CH3OH………………………………108
Table 7.1: Composition of natural gas reservoirs across the world…………………..125
Table 7.2 Lennard-Jones and and Coulombic parameters…………………………….131
xiv

Notation
Abbreviation
VDW Van der Waals interactions
MC Monte-Carlo algorithm
GCMC Grand canonical Monte Carlo
MOFs Metal organic frameworks
PCPs Porous coordination polymers
COFs Covalent organic frameworks
HCPs Hypercrosslinked polymers
PXRD Powder X-ray diffraction
TEM Transmission electron microscopy
CCS Carbon capture and sequestration
PAFs Porous aromatic frameworks
PE Potential energy
Frequently used symbols
𝑟 Distance between an atom and an infinite flat surface
𝜌 Atomic density of the surface
𝜎 Kinetic diameter
𝜖 Well depth
∆adH Heat of adsorption
𝑃1 and 𝑃2 Gas pressure
𝑇1 and 𝑇2 Gas temperature
𝜃 Surface coverage
𝑅 Universal gas constant
𝑃𝐸𝐿𝐽∗ Potential minimum depth
𝛼1 Proportionality constant
𝑁 and 𝑁𝑚 Number of molecules in the incomplete
xv

and complete monolayer
𝑃 Adsorbate pressure
𝐾 Equilibrium ratio
BET Brunauer, Emmett, and Teller equation
𝑉 and 𝑉m Adsorbed and a monolayer of adsorbed gas volume
𝑃 and 𝑃0 Adsorption pressure and vapor pressure
𝐶 BET constant
∆𝑑𝑒𝑠𝐻 Heat of desorption
∆𝑣𝑎𝑝𝐻 Heat of vaporization
𝑊𝑎 and 𝑊𝑚 Weight adsorbed at a particular relative pressure and the weight corresponding to the BET monolayer
𝜏 Thickness of one layer
𝑉𝑎𝑑𝑠 and 𝑉𝑙𝑖𝑞 Adsorbed volume and adsorbed liquid volume
∆𝐸 Potential energy difference
𝑉𝑚 Volumetric uptake
wt. % Gravimetric uptake
𝑚𝑔 Molecular mass of a gas molecule
𝑀 Total mass of the adsorbent structure
𝑁 and 𝑁𝑡𝑜𝑡 and Average number of gas molecule and total amount of adsorbed molecules
𝑁𝑒𝑥 and 𝑁𝑏𝑢𝑙𝑘 Excess adsorption molecules and bulk gas phase molecules
𝜌𝑏𝑢𝑙𝑘 Bulk gas density
𝑉𝑓 Is the free volume per mass of adsorbent
𝐽 Molecular flux
𝐷 Diffusivity,
𝐿 Membrane thickness
𝐶1 and 𝐶2 Concentrations of the downstream and
xvi

upstream
𝑝 Permeability
𝑆 Solubility coefficient
𝛼𝐴𝐵�
Separation ratio of a gas molecule mixture of A and B
TSA Temperature swing adsorption cycles
PSA Pressure swing adsorption cycles
𝛍𝐢 Induced dipole moment
𝛼 Polarizability of the molecule
𝐄 Electric field vector
𝛷𝑇𝑜𝑡𝑎𝑙 Total potential energy
𝛷𝐷 Dispersion energy
𝛷𝑅 Close-range repulsion
𝛷𝑃 Polarization energy
𝛷𝐹−𝜇 Field–dipole interaction
𝛷𝜕𝐹−𝑄 Field gradient–quadrupole interaction
𝛷𝑆𝑃 Self-potential
𝑄 Quadrupole moment
𝑑𝐸𝑑𝑅
Electric field gradient
𝐅𝑖 Force of atom 𝑖
𝑚𝑖 Mass of atom 𝑖
��𝑖 Second order derivative of the atoms’ position vector with respect to time.
𝜌(𝚪) Probability density
𝚪 Configuration space
𝑇(𝚪,𝚪ˊ) Transition probability
𝑘𝐵 Boltzmann constant
𝜔�𝚪,𝚪ˊ� Attempted probability
xvii

𝛼�𝚪,𝚪ˊ� Accepted probability
𝐑𝑖 Center-of-mass position
(𝛀𝑖) Molecule orientations
𝑁 Component loading
𝑓 Fugacity
𝜇 Chemical potential
° Denotes a reference state
𝜇𝑖𝑛𝑡𝑟𝑎,𝑖 Intramolecular chemical potential
𝑢𝑖𝑛𝑡𝑟𝑎,𝑖 Intramolecular potential
𝑤𝑘 Weight
𝑟0 Equilibrium bond distance
𝑈0 Well depth
𝑞𝛼 and 𝑞𝛽 Partial charges located at site 𝛼 and 𝛽
H2 Hydrogen gas
CO2 Carbon dioxide
CH4 Methane
H2O Water
CH3OH Methanol
Li6C60 Lithiated fullerene
C60 Fullerene
xviii

Chapter 1
Introduction to Porous Aromatic Frameworks
In this chapter we give a brief introduction to micro porous materials and their synthesis
and prospective applications for gas storage and separation.
1.1 Background of Porous Materials
Due to their extensive application in adsorption, separation, ion exchange,
petrochemistry and catalysis, porous materials have been drawing attention by
scientists all over the world. Some of the traditional porous materials include Metal
Organic Frameworks (MOFs), Zeolites, Activated Carbon and Silica gels. These
materials are used either directly or indirectly in almost 20% of the Gross Domestic
Product of various industries [1-3].
A porous material consists of interconnected pores. Performance of these materials
strongly depends on the size, shape and volume of these pores [4-6]. According to pore
size [7, 8] porous materials can be divided in to four main groups classified by the
IUPAC:
• Macroporous (pore sizes of greater than 50 nm)
• Mesoporous (pore sizes between 2-50 nm)
1

• Microporous (pore sizes of less than 2 nm)
• Ultramicroporus (pore sizes of less than 0.5 nm)
Our main focus for this work will be on microporous materials. Microporosity often
causes high surface areas [9]. Activated carbons [10] and zeolites [11, 12] are some of
the examples of microporous materials.
1.1.1 Activated Carbon, Silica Gel and Zeolites
Activated carbon is a graphite lattice with microcrystalities. It can be prepared as either
pellets or powder. Because of its micropore structure and high surface area it is used
for the adsorption, separation and purification of gases [13]. The commercial
application of activated carbons include trace impurity removal from contaminated gas
[14, 15], hydrogen production from a steam-methane reformer of gas [16] and nitrogen
production from air [17, 18]. In the reforming reaction, natural gas is mixed with
steam, heated to over 1,500 degrees Fahrenheit, and reacted with nickel catalyst to
produce hydrogen (H2) and carbon monoxide (CO). CO from the reforming reaction
then interacts with steam in the water gas shift reactor for producing additional H2.
Activated carbons are also used for waste gas and water treatment [11, 19-26] and
adsorption of organic and non polar substances [27, 28].
Silica gel is a partially dehydrated form of polymeric colloidal silicic acid [29]. It is an
amorphous form of SiO2 which is chemically inert, nontoxic and thermally stable (<
4000C) [30]. After the chemical reaction between sodium silicate and acetic acid silica
2

gel is prepared. After this it will go through a number of after-treatment processes such
as aging, pickling etc [31, 32]. After these post treatment methods one can obtain
different pore size distributions of the silica gel.
Zeolites are highly adsorbing materials [33]. They can be mined from nature or
synthesised in industry or by crystalline aluminosilicates or another silica source in an
autoclave with high pore network [34-37]. The synthesis process follows an ion
exchange procedure with a limited number of cations (Ca2+, K+, NH4+, Na+ and Li+)
[38]. The diameter of zeolite cage channels has a range from 2 to 9 Å [39]. Zeolites
are used in CO2 removal from natural gas [40, 41], CO removing from reforming gas
[42, 43], air separation [44-46], in catalytic cracking [47-53] and synthesis and
reforming for water infiltration [54-57].
1.1.2 Metal Organic Frameworks (MOFs) and Covalent Organic Frameworks (COFs)
Metal organic frameworks (MOFs), also known as porous coordination polymers
(PCPs), consist of metal containing nodes and organic linkers [58]. They consist of
metal containing nodes and organic linkers. The first MOF was discovered by Omar
Yaghi and his group for hydrogen storage in 1999 [59]. Since the last two decades
MOFs have been studied by many researchers due to their largest surface area, have
tunable pore sizes and chemical functionality [60-62]. Depending on the size and shape
of the pore and the surface areas extending beyond 6000 m2/g, MOFs can be used
successfully in different areas like storage, separation and catalysis [3, 5, 63-65]. As it
3

is easy to design MOFs, scientists can now make a model theoretical structure before
synthesizing in the lab [66, 67]. There are a large number of MOFs that have been
investigated for their high chemical stability, for example Ni-CPO-27 [68], UiO-66
[69], Cr-MIL-100 [70], Cr-MIL-101 [71], MIL-125 [72], CAU-1 [73] , ZIF-68, ZIF-69
and ZIF-70 [40] to name a few. Some of the latest applications of MOFs include
energy transfer, light harvesting, photocatalytic protons, CO2 reduction, water
oxidation, gas storage and separation, and toxic gas capture [4, 58, 65, 74-82]. Figure
1.1 shows the essential unit of a MOF and how the pore size can change with different
ligands.
Figure 1.1: X-ray structures of single-crystal of (a) MOF-5, (b) IRMOF-6 and IRMOF-
8, taken from a part of a single cube from their respective cubic three-dimensional
(3D) extended structures. A cluster [OZn4 (CO2)6] of an oxygen-centered Zn4
tetrahedron is bridged by six carboxylates of an organic linker on each corner. Here,
Zn, O and C are represented by blue polyhedron, red spheres and black spheres
respectively. The large yellow spheres represent the prime sphere that would fit in the
pores without affecting the van der Waals forces of the frameworks [8].
4

Covalent Organic Frameworks (COFs) are also in the group of crystalline porous
polymers. The first successful examples of covalent organic frameworks (COFs) were
developed by Yaghi and co-workers in 2005 [83]. They introduced the benefit of the
topological design strategy for the synthesis of porous organic frameworks [83]. COFs
don’t have metal centers and comprise only of light elements like boron, carbon,
nitrogen and hydrogen, which makes them different from MOFs [83]. Because of these
light weight linked element, COFs have low mass densities (0.17 g cm-3), exhibit high
thermal stabilities, possess permanent porosity, high specific surface areas (4000 m2 g-
1) and several open sites. These properties make COFs suitable candidates for gas
storage for hydrogen, methane, and carbon dioxide [84-93]. The first COFs were
named as COF-1 and COF-5 and were synthesized with a combination of several
reversible reactions by self-condensation of boronic acid and dialcohols and water as a
byproduct. Figure 1.2 shows both these COFs in a schematic representation.
Figure 1.2: Schematic representation of 3D COFs [94, 95]
5

1.1.3 Hypercrosslinked Polymers (HCPs)
Hypercrosslinked polymers (HCPs) are synthesised by a cross-linking reaction of
either polystyrene or macroporous polymers in a suitable solvent system [96, 97].
HCPs were first introduced in the early 1970s [98, 99] and during the last 2 decades
they have attracted considerable interest [100-102]. They have very low true density in
the dry state and the capability to swell in polar and non-polar media [103]. Their
sorption capacity for both polar and non-polar organic substances dissolved in either
water or gases are more than conventional polymeric sorbents or activated carbons. As
a result HCPs are produced and used at a commercial level [104-106]. HCPs have a
surface area up to 1900 m2/g [107] and are capable of storing hydrogen, carbon dioxide
and methane [108-112] and also removing toxic metal ions from water [113].
1.1.4 Porous Aromatic Frameworks (PAFs)
1.1.4.1 High Surface Area
A significant amount of research has been done for the application and synthesis of
crystalline materials like MOFs and COFs. An important drawback of these materials
is their low physicochemical stability. On the other hand, there are growing numbers of
porous polymer networks which have strong covalent bonds (C-C, C-H and C-N).
These stable bonds also give them a high physicochemical stability. But the problem
with these covalent linked porous polymer networks are their surface area, which is not
6

higher than 3,000 m2/g at this time. As promising candidates, PAFs are ideal
microporous materials with a unique combination of ultrahigh surface area and
extraordinary physicochemical stability. PAFs are named as PAF-30X, where 3
indicates 3D structure and X denotes the number of phenyl rings used to replace the
C−C bond. Unit cells of some PAFs are showing in Figure 1.3.
Figure 1.3: Unit cells of (a) PAF-301, (b) PAF-302, (c) PAF-303, and (d) PAF-304,
synthesized by structural topology design and geometry maximization. Pink and gray
spheres represent hydrogen and carbon atoms, respectively. The blue polyhedron in the
structure represents the carbon atoms with a tetrahedral bond [114].
7

The PAF-1 (which is also known as PAF-302) comes from the structural arrangement
and characteristics of diamond. All carbon atoms in diamond are connected
tetrahedrally by covalent bonds to four neighboring atoms. After breaking this C-C
covalent bond phenyl rings can be inserted and disclose more faces and edges of
phenyl rings with an increasing of internal surface area. The internal surface area and
mass density of PAF-301, PAF-302, PAF-303 and PAF-304 can be determined by first
principle calculation and grand canonical Monte Carlo (GCMC) simulation. Results
show that PAF-301 has a Langmuir surface area of 2,350 m2g-1 (Brunauer-Emmett-
Teller (BET) surface area of 1,880 m2g-1) and a mass density of 0.8364 g cm-3. PAF-
302 indicates a high Langmuir surface area of 7,000 m2g-1 (BET surface area, 5,640
m2g-1) with a density of 0.315 g cm-3[115]. PAF-303 also shows a high BET surface
area (up to 2,932 m2g-1). The details of these surface areas are further described in
chapter 2. The schematic representation of these PAFs are shown in Figure 1.4.
8

Figure 1.4: Typical structure of experimentally synthesized and simulated PAFs (C
purple; N blue; Si yellow, O green; Ge brown) [115].
For the synthesis of PAF-302, improved nickel(0)-catalyzed Yamamoto-type Ullman
cross-coupling was used. Yamamoto-type coupling involves a main component which
is a general aryl-halogenide compound named ‘aryl-aryl coupling’ made of
stoichiometric quantities of bis (1,5-cyclooctadiene) nickel(0) (Ni(COD)2).
Polymerization is carried out by a single, halogen functionalized second building unit
(SBU) for the formation of the organic framework [116]. There are two particular steps
of this coupling reaction. Firstly, oxidation is generated between Ni(0)Lm and halogen
functionalized monomer. Second, complex (III) is omitted by the disproportionation of
two complex (I) and complex (II) of nickel. This will regenerate Ni(0)Lm. During this
recycling process the formation of aryl-aryl bond consumes Ni(0)Lm. Another C-C
coupling reaction, like Sonogashira-Hagihara routes [117-126] and Suzuki cross
coupling [127-136], are also used for PAF synthesis. But Yamamoto coupling has the
unique criteria of unexpected halogen elimination that helps prepare an ultrahigh
porosity solid. Use of Yamamoto-type cross coupling successfully synthesized PAF-1
with a high BET surface area of 5,640 m2g-1. Similarly, PAF-303 and PAF-304 were
also synthesized by quadricovalent Si (PAF-3) and Ge (PAF-4) [132]. Synthesizing
PAF-3 using Yamamoto-type cross coupling shows a BET surface area of 1,102 m2g-1
[137]. Recently the same optimized Yamamoto-type cross coupling method has been
9

used to reproduce these structures, which is also known as PPN-4 (see Figure 1.5),
with a high surface area (BET) of 6,461 m2g-1 [138].
Yuan et. al. [139] have used the ‘Suzuki cross-coupling reaction’ for the synthesis of
PAF-11. Theoretically they were expecting that the PAF-11 pore size should reach the
mesoporous level, but the results showed that the pore size is lower than PAF-1, and
FTIR (Fourier transform infrared spectroscopy) [140] and CP/MAS (Magic Angle
Spinning) NMR (Nuclear Magnetic Resonance) [141, 142] discovered the presence of
bromo-capping species. As expected, the BET surface area was found to be 704 m2g-1,
which is also lower than PAF-1. The distribution of pore size of PAF-11 was found
between 0.5 and 5 nm, which is very widely spread compared to PAF-1 which has a
confined pore size distribution. This fact also proves that Yamamoto-type Ullmann
cross coupling has more efficiency and explicitness for aryl–aryl coupling.
PAFs show a very high surface area and excellent physiochemical stability while
compared with other ultra high porous materials. Powder X-ray diffraction (PXRD)
patterns and Transmission Electron Microscopy (TEM) results confirmed that PAF-1
has an amorphous nature with a uniform wormlike pore size [115]. These results also
give us an idea that remarkably high surface areas are not only applicable for highly
ordered molecular networks. It can also be found in rigid frameworks of biphenyl. In
order to make high surface areas the important keys are to use three-dimensional dia-
topology configuration and removal of heavy atoms like the ending of bromo groups
[115].
10

1.1.4.2 Effective Binding site
Most of the PAFs reported here do not turn to liquid in organic solvents and can resist
decomposition in boiling water and cold acid or alkaline solution. The strong C-C
covalent bonding and cross-linked rigid phenyl ring make it possible to sustain them in
extreme conditions. PAF-1, PAF-3, and PAF-4 were used for high-pressure hydrogen
storage system at 77 K [132, 143-145]. The Clausius–Clapeyron equation was used to
calculate the heat of adsorption (Qst) at 77 and 87 K. These results indicate that at high
pressure Qst is not the dominant factor for determining the number of gas molecules
that could be stored because of the weak interaction between gas molecules and the
porous structures. Surface area is a dominant factor for medium-pressure gas storage as
it reveals the porosity of a framework. The greater the surface area of a material, the
more gas could be potentially stored. For low-pressure gas storage at ambient
operating condition (1 bar, 298 K) both Qst and surface area should be important to
consider. In particular, the higher value of Qst often indicates higher gas uptakes. Again
at high pressure pore volume is the dominant factor [146].
PAFs also exhibit excellent selectivity for greenhouse gases. At 1 bar and 273 K, PAF-
1, PAF-3, and PAF-4 show very high selectivity to adsorb methane (CH4) and carbon
dioxide (CO2) compared to hydrogen (H2), nitrogen (N2), oxygen (O2), and argon (Ar).
This implies that PAFs could be capable to capture and enhance greenhouse gases
from dry air, which has promising applications in carbon capture and sequestration
(CCS) [132, 147].
11
1.1.4.3 Modification of Porous Aromatic Frameworks
1.1.4.3.1 Sulfonation
Though PAFs possess excellent physicochemical stability and ultra high surface area,
they have a practical drawback of low Qst at ambient conditions. In 2011, Zhou et al.
reported a post-synthetic method to improve the heat of adsorption of PAF-1 [148].
PPN-6 (also known as PAF-1) was synthesized by tetrakis (4-bromophenyl) methane
coupling (Figure 1.6 (a)). Then a sulfone group was introduced to PAF-1 in the form of
chlorosulfonic acid (Figure 1.6 (b)). After chemical reaction, PAF-1 developes into
two species named sulfonate-grafted acid (PPN-6-SO3OH) and lithium salt (PPN-6-
SO3Li) (Figure 1.6 (c)). This sulfonation reduces the surface area of PPN-6-SO3OH
and PPN-6-SO3Li to 1,254 and 1,186 m2g-1 respectively, but increases the high value
of Qst to 30.4 and 35.7 kJ mol-1 respectively. This will create a strong interaction
between CO2 and the sulfonate-grafted compound and will increase the uptake of CO2.
There are three reasons behind this. Firstly, functionalization of all-carbon frameworks
will create electric fields on the surface which produce a strong affinity toward CO2.
Secondly, small pore size and polar functionalities will increase the heat of adsorption.
Thirdly, Li+ ions in PPN-6-SO3Li will create strong interaction between CO2 and the
Li+ cation and will also increase Qst. As a result, a high (13.1 and 13.5 wt.%) CO2
uptake were found for PPN-6-SO3OH and PPN-6-SO3Li respectively.
12

Figure 1.5: Grafting and synthesis of PPN-6 [148].
For post-combustion carbon capture procedure (15 % CO2 and 85 % N2), sulfonate-
grafted samples show unexpected enhanced adsorption selectivity for carbon dioxide
and nitrogen. Therefore, these sulfonate materials hold significant promise for post
combustion carbon capture application [149-156].
1.1.4.3.2 Lithiation
In 2012 Konstas et al. reported a new class of material with exceptional gas storage
properties [157] (Figure 1.6). By following the same method used on Conjugated
Microporous Polymers (CMPs) [158], they prepared Li@PAF-1 with lithium
naphthalenide and adjusted the Li loading as preferred (Figure 1.7(a)). For the
activation of lithium ions (Li+) and removal of naphthalene from the framework,
higher temperatures were used to reduce the framework (Figure 1.7(b)). 1H, 13C and
6Li Magic-angle spinning nuclear magnetic resonance (MAS NMR) was used to check
the presence of Li@PAF-1. In both 1H and 13C NMR, there was no trace of
13
naphthalene, which proved the completed activated framework. Furthermore, in
5%_Li@PAF-1 the resonances of the aromatic protons were shifted as a result of the
increasing local electron density of the reduced framework shown in 1H NMR.
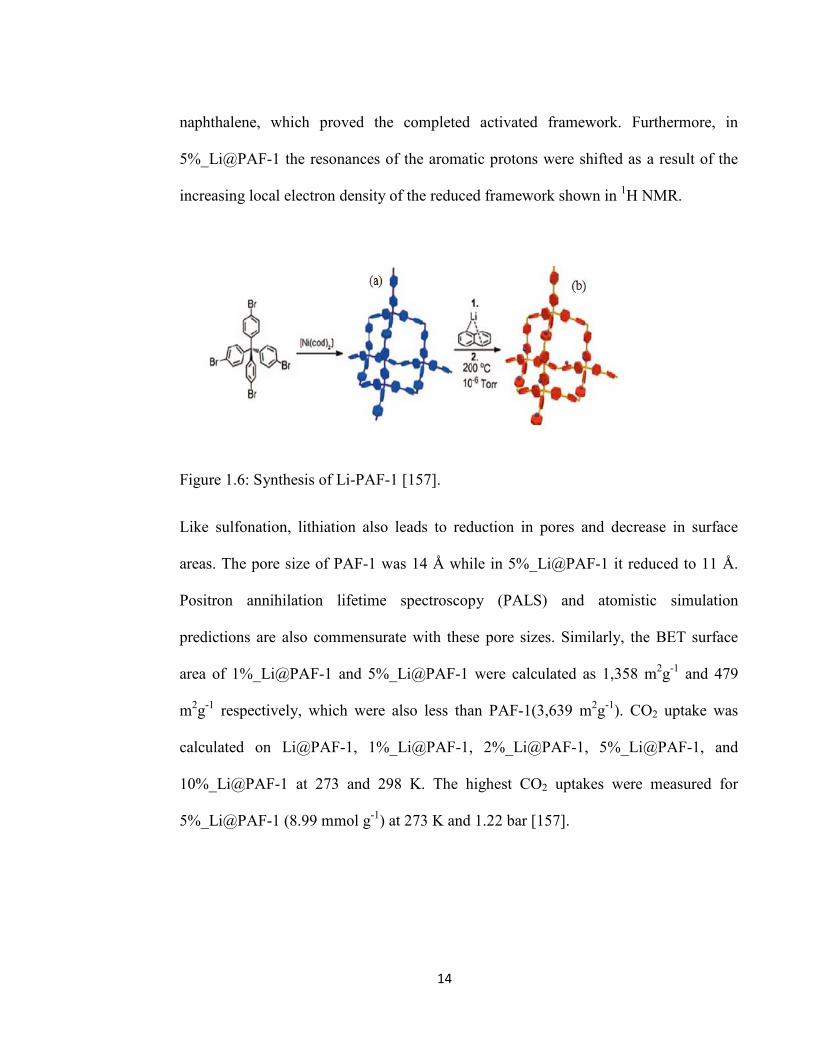
Figure 1.6: Synthesis of Li-PAF-1 [157].
Like sulfonation, lithiation also leads to reduction in pores and decrease in surface
areas. The pore size of PAF-1 was 14 Å while in 5%_Li@PAF-1 it reduced to 11 Å.
Positron annihilation lifetime spectroscopy (PALS) and atomistic simulation
predictions are also commensurate with these pore sizes. Similarly, the BET surface
area of 1%_Li@PAF-1 and 5%_Li@PAF-1 were calculated as 1,358 m2g-1 and 479
m2g-1 respectively, which were also less than PAF-1(3,639 m2g-1). CO2 uptake was
calculated on Li@PAF-1, 1%_Li@PAF-1, 2%_Li@PAF-1, 5%_Li@PAF-1, and
10%_Li@PAF-1 at 273 and 298 K. The highest CO2 uptakes were measured for
5%_Li@PAF-1 (8.99 mmol g-1) at 273 K and 1.22 bar [157].
14

1.1.4.3.3 Amination
For high physiochemical stability of PAF-1 (also known as PPN-6) and high porosity
(both surface area and pore volume), many different amines can be modified and
adjusted within the frameworks (Figure 1.8). A resealable flask is charged with PPN-6
and heated to 900C for 3 days and then dried to produce PPN-6-CH2Cl (Figure 1.7 (a)).
Then, a resealable flask is charged with PPN-6-CH2Cl and diethylenetriamine and
heated to 900C for 3 days to produce PPN-6-CH2DETA (Figure 1.7 (b)) [159]. Zhou et
al. first synthesized PPN-6-CH2Cl and then eventually introduced several kinds of
polyamine groups on it [159]. The porosity of these polyamine-tethered PAFs was
measured by nitrogen sorption isotherms. After amination as expected, the BET
surface areas decreased, from 4,023 m2g-1 for PPN-6 to 1,740, 1,014, 663, 634, and
555 m2g-1 for PPN-6-CH2Cl, PPN-6-CH EDA, PPN-6-CH2TAEA, PPN-6-CH2TETA
and PPN-6-CH2DETA, respectively. The highest CO2 uptake of 4.3 mmol g-1 (15.8
wt.%) was measured for PPN-6-CH2DETA at 295 K and 1 bar.
15

Figure 1.7: Synthetic route to polyamine-tethered PPNs [159].
1.1.4.3.4 Carbonization
Carbonization on PAFs is denoted by PAF-1-x. Here ‘x’ denotes the carbonization
temperature (in °C) in nitrogen with traces of oxygen. Qiu et al. have developed these
carbonized PAFs in 2012 [160]. Carbonization will induce an electric field onto the
framework surface because of the all carbon-scaffold networks, which will in return
increase the gas uptake. The carbonization of PAF-1 also leads to shrinkage of pore
size and surface area. The BET surface areas were 4,033, 2,881, 2,292, and 1,191 m2g-
1for PAF-1-350, PAF-1-380, PAF-1-400, and PAF-1-450, respectively. The pore size
distribution shrunk from 1.44 nm for PAF-1 to 1.00 nm for PAF-1-450. PAF-1-450
showed a significant increase in CO2 uptake, with a value of 100 cm2 g-1 (equal to
16.5wt.%,4.5 mmol g-1). Carbonization also leads to higher CH4 and H2 uptakes and
16

higher heats of adsorption. Among all carbonized PAF-1, PAF-1-450 showed the best
results for CH4 and H2 uptake at very low pressure.
Li et al. [161] have reported a similar type of modified PAFs by forming high-
temperature KOH activated carbonized PAFs. At first, the PAF-1 powder was first
dissolved into a KOH ethanol/water solution and stirred overnight. Then, after being
dried under vacuum this distilled white residue was carbonized by placing it in a quartz
tube furnace at a temperature of 5000-9000C for 1 hour. For removing excess KOH and
salts it was then purified five additional times with deionized water, ethanol and
chloroform. Its strong micropores were then confirmed by nitrogen sorption
experiments (at 77 K and 1 bar) and high-resolution transmission electron microscopy
(TEM). These unique porous carbon materials have substantial gas sorption abilities in
both low-pressure and high-pressure environments for CO2, CH4 and H2. K-PAF-1-750
has the highest CH4 storage ability at 35 bar (200 mg g-1).
1.2 Conclusion
PAFs have better chemical and physical stability than the other porous materials.
These make them prospective candidates for gas storage and separation. PAFs
synthesized by Lan et.al by multiscale simulation method via dia topology structure
were used to measure hydrogen storage performance [114]. These results show that
hydrogen sorption on PAFs mainly depend on free volume and density.. Recent results
indicate that PAF-303 and PAF-304 performed better than PAF-1 for gravimetric
hydrogen uptakes. At high pressure (100 bar) and 298 K PAF-304 reached a highest
value of 6.35wt.% gravimetric H2 uptake, which is also the highest value among all of
17

the porous materials. These studies also revealed that PAFs have great potential
application like gas storage and separation if the functional groups are introduced onto
the aromatic porous frameworks. Jiang et al. introduced polar organic groups to the
biphenyl rings of PAFs structures to investigate the selectivity of CO2 over CH4, H2
and N2 mixtures in ambient conditions [162]. Although sometimes it is difficult to
effectively synthesize these above-mentioned novel PAFs, the theoretical design and
simulation methods might introduce an effective guideline for the development of
more promising and attractive PAFs.
In this thesis, we are interested in impregnating the PAFs with lithiated fullerene for
enhancing the hydrogen uptake and use these functionalized PAFs for carbon dioxide
and methane separation by molecular simulation. We are also interested to use
fullerene impregnated PAFs for the separation of methanol and water. Molecular
simulation methods are opening up a new era for designing structures for possible
applications in gas storage and separation, carbon capture and molecular recognition.
18

Chapter 2
Introduction to Gas Storage
In this chapter we give a brief introduction to general gas storage methods (experimental
and simulation) along with hydrogen storage phenomena and prospective applications.
2. 1 Introduction
Gas storage technology is attracting significant attention because of its many important
applications. Recently, research has been focused on the storage of hydrogen for
energy applications, greenhouse or biological gas capture, such as CO2, SO2 and NO,
and hydrocarbons such as CH4 preservation and transportation. There are several
important reasons to store a gas inside a material, rather than physically inside a bottle
or tank. Firstly, more gas can be stored in a given volume of solid than in a tank at high
pressures which will increase the storage density of the gas. Secondly, it is much safer
to store a gas at high pressure inside a solid than in a tank. And thirdly, if someone
needs a small amount of gas, it is handy to store it inside a solid.
2.2 Storage method
The general criteria of gas storage is to fit a large amount of gas safely and efficiently
into a small space with a minimum increase in weight [163]. There are four general
methods for gas storage (Figure 2.1). The first method is known as the compressed
method where high pressure equipment is used to compress the gas. This method needs
19
to be carefully controlled and also needs expensive equipment for the safe storing and
release of gas [164, 165]. An alternative method is to cool the gas to its liquid phase.
This liquid method converts the gas to a highly dense and cryogenic liquid. Though
liquification can store a larger amount of gas compared to compression, it nevertheless
requires a large amount of energy as well as money to cool the gas [163, 164]. The
third method involves the reaction of the gas molecule with a bulk solid. Here the gas
is stored reversibly as a compound by forming covalent bonds between the gas and the
substrate (chemisorption method). For example, hydrogen (H2) can be stored as a metal
hydride (AlH3) or can be stored as methane (CH4) gas [166-168]. The main advantage
of this method is that one can store a large amount of gas at ambient conditions. But it
has a drawback too. This method will require a large amount of binding and breaking
energy to bind the gas with the host elements and to release the gas, respectively. The
fourth and the most promising method is the physisorption method where gas is
adsorbed into the surface through van der Waals forces.
20

Figure 2.1: Four gas storage methods [169].
2.2.1 Physisorption
The general method of physisorption is to adsorb the molecules onto a surface due to
weak van der Waals (VDW) interactions. The Lennard-Jones (L-J) function (which is
the main function in VDW calculation) is used for calculating the potential energy
between two atoms [170]. The potential energy (PE) between an atom and a surface
area can be calculated by integrating this L-J function.
𝑃𝐸𝐿−𝐽 = 4𝜋𝜌𝜖𝜎2 �15�𝜎𝑟�10−
12�𝜎𝑟�4� (2.1)
21

Here, 𝑟 is the distance between an atom and an infinite flat surface, 𝜌 is the atomic
density of the surface, 𝜎 is the kinetic diameter and 𝜖 is the well depth. This function is
comprised of repulsive and attractive forces that dominate the close and large distances
respectively (Figure 2.2).
Figure 2.2: Lennard-Jones potential energy between an atom and an infinite flat surface [169].
2.2.2 Heat of adsorption
Heat of adsorption is the energy difference between the bulk and adsorbed gas phase.
This binding strength can be enhanced by constructing the materials which have strong
interactions with the gas, overlapping energy potentials by arranging the surface and
22

by creating high curvature surfaces. Using the Clausius-Clapeyron equation derived
from the van’t Hoff equation, the heat of adsorption (∆adH) can be calculated [171] as,
∆𝑎𝑑𝐻 = −𝑅𝑇1𝑇2𝑇2 − 𝑇1
𝑙𝑛 �𝑃2𝑃1�𝜃
(2.2)
where, 𝑃1 and 𝑃2 are the gas pressure at a temperature 𝑇1 and 𝑇2 respectively for an
equal surface coverage 𝜃. 𝑅 is the universal gas constant. (∆𝑎𝑑𝐻) can be estimated
from the L-J potential energy function Eq. (2.1) calculated by Everett and Powl [172],
∆𝑎𝑑𝐻 = �𝑃𝐸𝐿𝐽∗ � + 𝛼1𝑅𝑇 (2.3)
where 𝑃𝐸𝐿𝐽∗ is the potential minimum depth between the gas molecule and the surface
and 𝛼1 is a proportionality constant (α1 ≈ 0.5). 𝛼1𝑅𝑇 is the energy contributor due to
the adsorbed molecules’ movement parallel to the surface.
2.2.3 Surface area
The physisorption based storage system performs best with an ultra high and accessible
surface area [173]. By using a kinetic approach and a simple assumption that
adsorption was limited to a monolayer, Langmuir [174] was able to describe the type I
adsorption isotherm which is mainly a monolayer adsorption (Figure 2.3). Though the
Langmuir equation best describes type I chemisorption isotherms, it often adequately
fails to describe physical adsorption and the type II-V isotherms [175] . Type II is a
multilayered isotherm and often observed in physical adsorption of gases by non-
porous solids. Type III isotherms are also observed in non-porous or macroporous
solids and it has a convex shape due to gas-solid weak interaction. Again, type IV
23

isotherm is a combination of mono and multilayer adsorption along with capillary
condensation. In addition, surface area measurements obtained from type I isotherms
are also doubtful for both chemisorption and physical adsorption. The Langmuir
equation can be expressed as,
𝜃1 =𝑁𝑁𝑚
=𝐾𝑃
1 + 𝐾𝑃 (2.4)
where, 𝑁 and 𝑁𝑚 are the number of molecules in the incomplete and complete
monolayer, 𝜃1 is the fraction of the surface occupied by the adsorbed molecules, 𝑃 is
the adsorbate pressure and 𝐾 is the equilibrium ratio of the rate of adsorption over the
rate of desorption [176].
Figure 2.3: General form of Langmuir isotherm [177].
24

In 1938, Brunauer, Emmett, and Teller extended Langmuir's kinetic theory to
multilayer adsorption. The BET theory [178] assumes that the uppermost molecules in
adsorbed layers are in dynamic equilibrium with the vapor. This means that for only
one layer of adsorbate, equilibrium exists between that layer and the vapor. If there are
two layers, both layers will be in equilibrium with the vapor and the ratio of their
volume can be expressed as,
𝑉
𝑉𝑚=
𝐶 �𝑃𝑃0�
�1 − 𝑃𝑃0� �1− 𝑃
𝑃0+ 𝐶 �𝑃𝑃0
�� , (2.5)
where, 𝑉 and 𝑉m are the adsorbed and a monolayer of adsorbed gas volume, 𝑃 and 𝑃0
are the adsorption pressure and vapor pressure respectively [179]. BET constant 𝐶 is
related to the heat of desorption ∆𝑑𝑒𝑠𝐻 and the heat of vaporization ∆𝑣𝑎𝑝𝐻 in the
following way,
𝐶 = 𝑒𝑥𝑝 �∆𝑑𝑒𝑠𝐻 − ∆𝑣𝑎𝑝𝐻
𝑅𝑇� , (2.6)
where, 𝑅 is the universal gas constant and 𝑇 is the temperature [176, 179].
2.2.4 Pore size
For calculating pore size and distribution there are currently three different methods
based on experimental isotherms. They are the t method, α - method and MP method,
and are described below.
25

2.2.4.1 t-method
If the adsorbed film thickness in a pore is the same as that on a plane surface for any value
of relative pressure, the statistical thickness t of the adsorbed multilayer film is expressed
as,
𝑡 =𝑊𝑎𝑊𝑚
𝜏 , (2.7)
where, 𝑊𝑎 and 𝑊𝑚 are the weight adsorbed at a particular relative pressure and the weight
corresponding to the BET monolayer, respectively, and 𝜏 is the thickness of one layer
calculated by the area and volume occupied by one mole of liquid nitrogen (3.54 Å), if it
were spread over a surface. The t-plot method (Figure 2.4) compares the isotherm of a
microporous material with a standard type II isotherm [180, 181]. This method determines
micropore volume and surface area based on the information of average pore size.
26

Figure 2.4: (a) Standard type-II isotherm, (b) t-plot from type-II isotherm [176].
2.2.4.2 𝜶𝒔–method
Gregg and Sing developed this method for estimating micropore volume and surface
area without assuming knowledge of the adsorbate statistical thickness. As a result, the
αs-method does not require the monolayer capacity and helps directly to compare the
test isotherm and the reference isotherm. The reference is a plot of the amount of gas
adsorbed, normalized by the amount of gas adsorbed at a fixed relative pressure
versus 𝑃/𝑃0. The value of 𝑃/𝑃0 = 0.4, and 𝛼𝑠 is is expressed as 𝑉𝑎𝑑𝑠/𝑉𝑎𝑑𝑠0.4 . As the 𝛼𝑠-
method does not consider the thickness of the adsorbent layer, it can be efficiently used
for any adsorptive gas as well as to check the BET surface area and to assess micro-
and mesoporosity [182, 183].
2.2.4.3 Micropore analysis (MP) –method
The MP-method was proposed by Mikhail, Brunauer and Bodor which is an extension
of de Boer's t- method [184]. For the MP-method we can consider the isotherm shown
in Figure 2.5 (a). If we convert the adsorbed volume 𝑉𝑎𝑑𝑠 as liquid volume, Eq. ( 2.7)
can be written as
𝑡 =𝑉𝑙𝑖𝑞𝑆
× 104 , (2.8)
where S is the total surface area and 𝑉𝑙𝑖𝑞 is the adsorbed liquid volume. For nitrogen
(N2) adsorption at 77 K, 𝑉𝑙𝑖𝑞 = 𝑉𝑎𝑑𝑠(𝑆𝑇𝑃) × 15.47. Then we can plot a 𝑉 − 𝑡 curve
with relative pressure intervals of 0.05 (Figure 2.5 (b)). From the slope of different
27

portions of the curve we can get a range of micopore surface areas varying from 792-
160 m2g-1. If there is no further decrease in the slope of the 𝑉 − 𝑡 plot, then this will
indicate that all the pores are filled.
Figure 2.5: (a) Isotherrn of N2 on silica gel at 77.3 K (b) V-t curve [184].
Pore volume can be calculated by the following equation [176],
𝑉 = 10−4(𝑆1 − 𝑆2)𝑡1 + 𝑡2
2𝑐𝑚3𝑔−1 (2.9)
For example, the slope of the linear portion of the V-t curve (Figure 2.5 (b)), from the
origin through the first four points, is 0.0792. Using Eq (2.8) this will give a micropore
surface area of 792 m2g-1 . The 2nd slope from the V-t curve is drawn tangentially to the
curve between t=4.0 and t=4.5 Å shows a slope of 0.0520. Using Eq (2.8) this will give
a micropore surface area of 520 m2g-1 . Thus, the pore volume will be
28
V = 10−4(792− 520)4.0 + 4.5
2cm3g−1 = 0.1156 cm3g−1 (3.0)
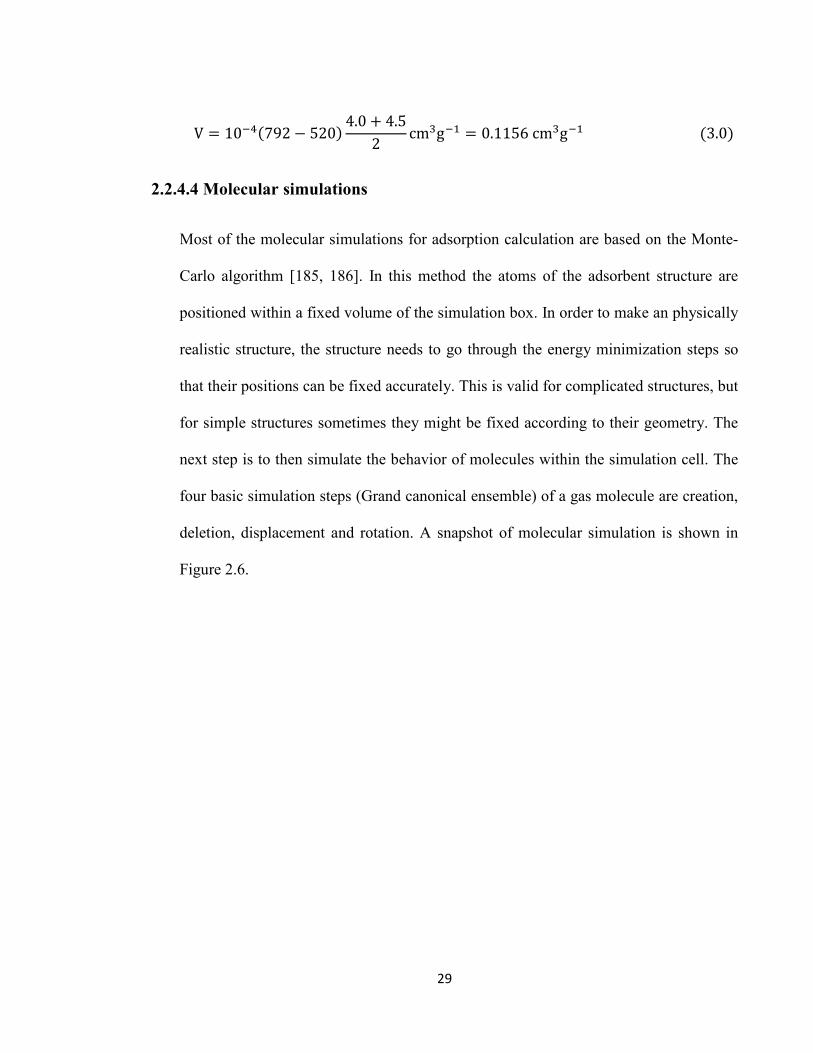
2.2.4.4 Molecular simulations
Most of the molecular simulations for adsorption calculation are based on the Monte-
Carlo algorithm [185, 186]. In this method the atoms of the adsorbent structure are
positioned within a fixed volume of the simulation box. In order to make an physically
realistic structure, the structure needs to go through the energy minimization steps so
that their positions can be fixed accurately. This is valid for complicated structures, but
for simple structures sometimes they might be fixed according to their geometry. The
next step is to then simulate the behavior of molecules within the simulation cell. The
four basic simulation steps (Grand canonical ensemble) of a gas molecule are creation,
deletion, displacement and rotation. A snapshot of molecular simulation is shown in
Figure 2.6.
29

Figure 2.6: (a) Snapshots of H2 adsorption in PAF-304 with 28 Li6C60 at 0-100 pressure
[187], (b) H2 spheres within the unit cell of a metal-organic framework at two different
pressures of 0.1 (left) and 30 (right) bar [146, 169]
Simulation is carried out by repeating these steps millions of times until equilibrium is
achieved. In a creation step, a new gas molecule is created and chosen based on the
potential energy E inside the volume of the simulation box, 𝑉. The potential energy
difference ∆𝐸 of two neighboring atoms is calculated using the Lennard-Jones
function. The details of this are explained in chapter 4. After equilibration the average
30

number of gas molecule 𝑁 is calculated. From 𝑁 we can then calculate
volumetric (𝑉𝑚) and gravimetric uptake (wt. %),
𝑉𝑚 =𝑁𝑚𝑔
𝑉 =
𝑁𝑚𝑔
𝑁𝑚𝑔 + 𝑀× 100 𝑤𝑡. % (3.1)
where 𝑚𝑔 is the molecular mass of a gas molecule and 𝑀 is the total mass of the
adsorbent structure.
Molecular simulation methods allow the prediction of the total amount of adsorbed
molecules (𝑁𝑡𝑜𝑡) within the adsorbent. Experimental techniques calculate the amount
of gas adsorption based on excess adsorption 𝑁𝑒𝑥 which is defined as the amount of
molecules that are found in excess of the amount that would be found in the void as
bulk gas phase(𝑁𝑏𝑢𝑙𝑘). Myers and Monson expressed the relationship between the total
and excess uptake [188] as,
𝑁𝑡𝑜𝑡 = 𝑁𝑒𝑥 +𝑁𝑏𝑢𝑙𝑘 (3.2)
𝑤ℎ𝑒𝑟𝑒, 𝑁𝑏𝑢𝑙𝑘 = 𝜌𝑏𝑢𝑙𝑘𝑉𝑓 (3.3)
and, 𝜌𝑏𝑢𝑙𝑘 is the bulk gas density and 𝑉𝑓 is the free volume per mass of adsorbent. 𝑉𝑓
can be calculated as,
𝑉𝑓 =1𝑀� 𝑒𝑥𝑝 [−
𝐸(𝑟)𝑘𝐵𝑇𝑉
]𝑑𝑟 (3.4)
Adsorption calculation by molecular simulation has been successfully matched with
many experimental results and hence can be used as a good predictive tool for the
31

testing of future adsorbents. Compared to experimental synthesis and testing of
materials, the simulation approach is much faster.
2.2.4.5 Ab-initio calculation
Ab-initio calculations use first principles methods for calculating adsorption isotherms
by integrating various components such as electron density, polarization and
electrostatic interactions [189]. The method considers the binding energies of the gas
molecules with the adsorbent structure. Binding energy is the energy required to
completely remove an electron from an atom or a molecule. It can also be defined as
the energy required separating an adsorbed molecule from the adsorbent surface. This
method helps to determine the particular adsorption sites suitable for the gas molecule
to occupy and also to understand certain adsorption scenarios [162, 190-201].
2.3 Nanoporous material for gas storage
Porous materials possess gas adsorption and storage properties for some of their
interesting properties. One of these properties is flexibility. Most of the inorganic
frameworks, MOFs and porous carbon materials are regarded as fairly rigid [202, 203].
Although recently, some of the MOFs named MIL-53 [204] and MIL-88 [205] [206]
and some polymers also exhibit substantial flexibility [207] for gas storage. Flexibility
controls the quantity of gas that can be stored and released under certain operating
conditions [207, 208]. Another structural characteristic feature which significantly
32

increases gas storage and adsorption ability is the accessible and available interaction
sites in the nanoporous material [68, 209-213]. The third important characteristic of
nanoporous materials for gas storage is their specific surface area, commonly derived
from either the Brunauer–Emmett–Teller (BET) equation or the Langmuir-derived
equation [214].
2.3.1 Hydrogen Storage
Hydrogen storage opens the possibility for a new world of the “hydrogen economy”
for our future fuel energy needs. The biggest challenge for the hydrogen economy is to
store hydrogen (H2) gas safely and economically. The gravimetric energy density of
hydrogen is approximately three times more than petrol and hence hydrogen fuel cells
are predicted to perform efficiently, at least double than that of internal combustion
engines. Recently, The US department of Energy (DoE) has set a target for H2 storage
capacity for mobile applications which is 5.5 wt. % or 40 g L-1 by the year 2017.
Hydrogen fuel vehicles should run a range of 480 km or 300 miles, should operate at a
certain conditions ranging from -40-85 0C, delivery pressure should be 12 bar
minimum and refueling should be quick (less than 3 min), safe and durable (1500
operational cycle life) [215-217]. However, it should be clarified that these are the
system requirements and are not considered as the targets for material storage capacity.
There are three different ways for storing hydrogen gas. The first simplified method is
to store reasonable amounts of gas per volume in a simple tank, which requires
liquefaction at very low temperatures and/or high pressures. The second method is to
store the hydrogen as a metal or nonmetal hydride chemical compound. The main
33

drawback of this method is the difficulties associated with heat management,
reversibility and kinetics for the significant energy change between the stored and the
released hydrogen [218]. The last and promising method is the physisorption method.
Zeolites [8, 219-226], COFs [66, 85-88, 227-230], MOFs [231-234], carbon materials
[235-238], organic polymers [239, 240], complex hydrides [241-246] and PAFs [114,
132, 157, 247, 248] have all been widely studied for their hydrogen adsorption
characteristics. A summary of different types of materials with their various challenges
studied for hydrogen storage are shown in Figure 2.7. It seems that hybrids are
reversible but requires high pressure and temperature. MOFs also have good
reversibility but need very low temperatures. Nanostructure materials like PAFs have
opportunities but there is a real need to do more research to use as practical materials.
34

Figure 2.7: Summary of different hydrogen storage materials and their limitations [249].
The interaction energy between adsorbed hydrogen molecules and a porous material is
less than 10 kJmol-1. Therefore, there will be no problems with adsorption and
desorption or huge heat release like hydride storage systems. However, the low
interaction energy also leads to low adsorption temperature. Most of the hydrogen
adsorption measurements are typically conducted at 77 K. This is a practical
disadvantage in certain situations. Researchers are looking forward to significantly
increasing the adsorption and storage capacity levels at or around room temperature
(273 K). Recently research has been done on storing hydrogen at room temperature [8,
250, 251]. Substantially increasing the surface area of the material might be a way to
increase the adsorption capacity [214]. Another strategy might be increasing the heat
of adsorption up to 15 kJmol-1 [252-255]. Apparently, increasing the heats of
adsorption needs higher interaction energy sites in the materials. Molecular simulation
35

can easily and efficiently calculate the interaction energy at low pressure. At high
pressure, the sites will be filled quickly and there will not be enough high energy sites
left. This gives rise to another challenge to increase the energy sites’ density to
enhance the adsorption capacity at high temperature [146].
The maximum adsorption capacity for hydrogen storage mostly depends on the surface
area rather than the chemical composition of the porous material and quite widely
varies with different nanoporous materials [171, 223, 256-260]. However, pressure
also plays an important factor to extend the maximum uptake. For high adsorption
capacity, a high pressure is required. So there is another challenge to reduce this
requirement as much as possible. At low pressure, gas adsorption is controlled by the
differences in heats of adsorption and hence low pressure uptake correlates mostly with
heats of adsorption rather than the surface area. Pores also strongly influence the
binding energy of hydrogen molecules with porous solids. Materials having small
pores with high curvature walls strongly interact with hydrogen molecules than large
diameter pore materials [146, 261, 262].
Hydrogen adsorption can also be improved by adsorbing hydrogen in molecular forms.
This will increase the interaction energy between the gas molecules and the porous
structures, and may also increase the accessible surface area of the structures by
allowing more adsorption sites for the hydrogen molecules [263-265]. Lastly,
increasing the flexibility of porous materials may also improve hydrogen storage.
Increasing the flexibility might open the structural pore diameter which might enhance
36

hydrogen adsorption by allowing adsorptives to pass through the windows and access
the pores [266].
2.3.2 Others Application of Nanoporous materials
There are some other challenging application of nanoporous materials, such as using
them for storing nitric oxide (NO), carbon monoxide (CO) and oxygen (O2) for
medical applications. For medical gas storage high uptake has already been achieved
[267-271]. Now the new goal is to achieve a robust control for the kinetics of gas
release and precisely allowing the materials to match with the preferred gas.
Another attractive application of nanoporous materials is environmental gas storage.
Among these, scientists are most likely interested in greenhouse gases like carbon
dioxide (CO2). But sulfur dioxide (SO2) and ammonia (NH3) also attract the interest of
chemists for their toxic impact on the environment. The main target here is on
synthesizing nanoporous materials with high energy interaction sites for high
adsorption capacity. Alternatively, one can apply separation technology of gases to
separate CO2 from other exhaust or flue gases. These gases can then be released for
some other commercial uses. Nanoporous materials are also useful for these separation
applications [214].
37
2.4 Summary
Gas storage in nanoporous materials is a promising area of research and needs future
development. The great challenge is to meet DoE targets for hydrogen storage
materials at or near room or cryogenic temperature and at reasonable pressures.
For hydrogen storage systems, we are still in a phase of materials discovery research.
In this thesis we are also aiming to study a new functionalized porous aromatic
material for increasing hydrogen uptake at cryogenic temperature. The field of research
on gas storage in nanoporous materials is very promising and has significant
importance for the future of storage technologies. This will be discussed in chapter 5 of
this thesis. We also aim to use this functionalized porous material as an adsorbent for
separation of water/ methanol and CO2/CH4 which will be discussed in the next
chapter.
38

Chapter 3
Introduction to Gas Separation
In this chapter we give a brief introduction to various gas separation processes and
technologies (experimental and simulation) along with separation mechanisms.
3.1 Introduction
Separation processes is defined as the transformation of a mixture of materials into
two or more products with a different composition from the original materials [272,
273]. In general, distillation can be used for separation. But if the organic
concentrations are very low or the organic compounds are thermally sensitive then
distillation is not economically suitable [274]. Alternative technologies such as
adsorbent and membrane-based separations can be more energy efficient than
traditional distillation techniques [275]. Membranes are generally diffusion-based
while adsorbents are adsorption-controlled. It is different from mixing which is
favored by the second law of thermodynamics. Sometimes components prefer to be
separated thermodynamically too. Chemical and petrochemical industries invest large
amounts of money for separation processes. It is also a major technical problem for
chemistry and other scientific disciplines. Separation techniques can be divided into
industrial separation processes [272] and laboratory separation techniques [276]. The
39

discontinuity of a solid surface makes them unsaturated and thus able to form bonds
with gas molecules while exposed to a gas. This process is known as adsorption.
Adsorption has been successfully used since the 1960s for air purification and
industrial flue gases. In 1959 the invention of synthetic zeolites or molecular sieves
opened a new era for gas separation [277]. Since then a series of developments have
been done for improving the efficiency of gas separation technologies. This chapter
will provide an inclusive summary of research on gas separation technologies.
3.2 Separation processes
3.2.1 Membrane based separation
Membrane gas separation technology has several advantages over other techniques
including compactness and light weight, low labor cost, flexible design allowing easy
expansion or operation at limited capacity, small maintenance cost, low energy
requirements and environmental friendliness [278]. High permeability and selectivity
are two important properties of a membrane that is required for gas separation
processes [279]. The classification of membranes are shown in Figure 3.1 according to
the cross section of the microstructure [278]. For industrial application, membranes are
most widely used for microfiltration, ultrafiltration, reverse osmosis, electro dialysis,
gas separation and pervaporation.
40
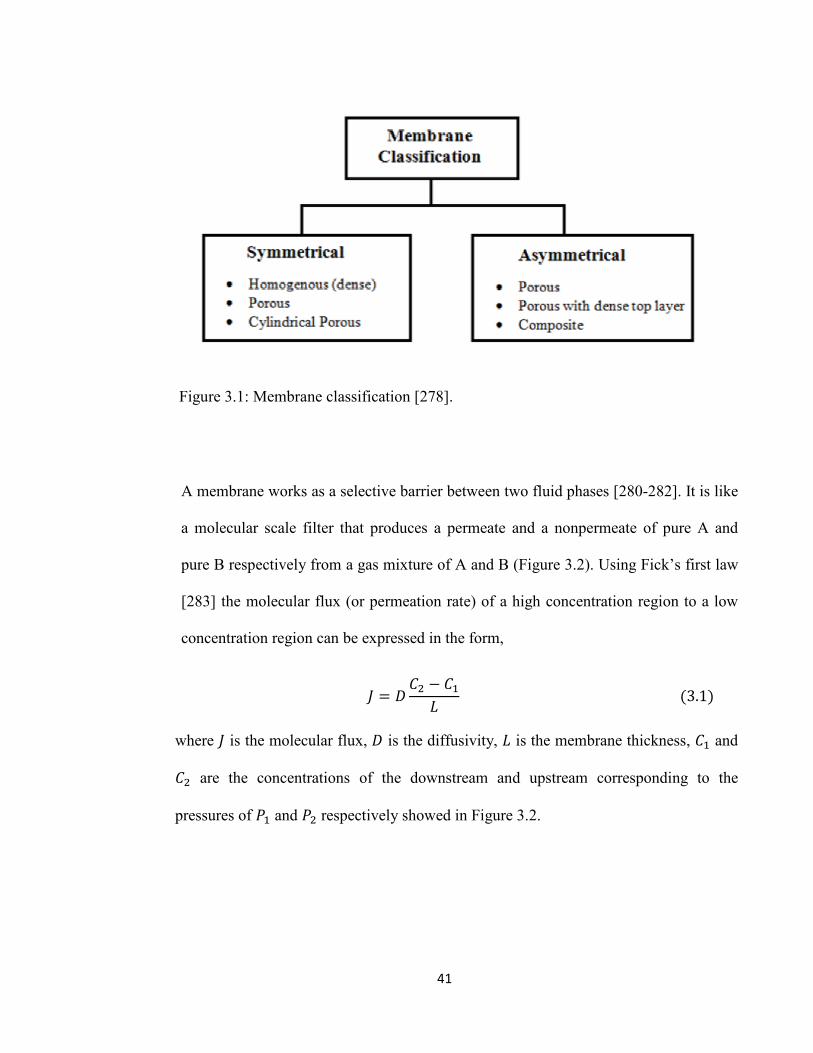
Figure 3.1: Membrane classification [278].
A membrane works as a selective barrier between two fluid phases [280-282]. It is like
a molecular scale filter that produces a permeate and a nonpermeate of pure A and
pure B respectively from a gas mixture of A and B (Figure 3.2). Using Fick’s first law
[283] the molecular flux (or permeation rate) of a high concentration region to a low
concentration region can be expressed in the form,
𝐽 = 𝐷𝐶2 − 𝐶1𝐿
(3.1)
where 𝐽 is the molecular flux, 𝐷 is the diffusivity, 𝐿 is the membrane thickness, 𝐶1 and
𝐶2 are the concentrations of the downstream and upstream corresponding to the
pressures of 𝑃1 and 𝑃2 respectively showed in Figure 3.2.
41

Figure 3.2: Gas separation membrane with a constant concentration gradient across the
membrane thickness 𝐿 [169].
The key membrane properties of interest are selectivity, permeability and durability.
Usually, gas separation processes follow a solution-diffusion mechanism. For solution-
diffusion membranes, the permeability 𝑝, is related to the flux 𝐽 in the following way,
𝑝 =𝐽𝐿
𝑝2 − 𝑝1= 𝐷 �
𝐶2 − 𝐶1𝑝2 − 𝑝1
� (3.2)
For 𝑝2 ≫ 𝑝1 and 𝐶2 ≫ 𝐶1, 𝑝 can be simplified as,
𝑝 =𝐶2𝑝2𝐷 (3.3)
The ratio of concentration over pressure can be defined as the solubility coefficient 𝑆,
𝑆 =𝐶2𝑝2
Thus Eq (3.3) can be expressed as, 𝑝 = 𝑆𝐷. (3.4)
42

Solubility 𝑆 is an equilibrium component which describes the amount of gas molecules
within the membrane and diffusivity 𝐷 is a dynamic component that describes the
mobility of the gas molecules within the membrane. If the separation ratio of a gas
molecule mixture of A and B is 𝛼𝐴𝐵�
and the permeability of molecules A and the
permeability of molecules B is denoted as 𝑝𝐴 and 𝑝𝐵, then the separation can be
characterized by,
𝛼𝐴𝐵�
=𝑝𝐴𝑝𝐵
Conventionally, there has been a tradeoff between the selectivity and the permeability
of gas mixtures. Often high selectivity membranes show less permeability and vice
versa [278].
The separation of gases using membranes follows three general transport mechanisms,
namely Knudsen-diffusion, solution-diffusion and molecular sieving [284, 285] (Figure
3.3). Among these, solution-diffusion is mostly used in commercial applications. In the
solution-diffusion mechanism, due to the difference in the concentration of two gases,
the permeants will dissolve in the membrane material and then will diffuse through the
membrane. The facilitation of the separation of gases can be achieved by selectively
adsorbing the strong concentration component of a gas mixture. Ultramicroporous
molecular sieving membranes are also gaining attention for their higher permeabilities
and selectivities over solution-diffusion membranes [286, 287]. For proper
functionalization, the molecular sieve membranes must have pore diameters in a range
between the smaller and the larger gas effective diameters that will be separated. As a
43

result, only smaller molecules can permeate and a very high separation factor can be
achieved. Therefore, a balanced combination of pore size and porosity is needed for
efficient membrane separation. For Knudsen diffusion the separation of gases depends
on pores in the barrier layer of the free space and they frequently bump into the walls
and each other, except nanotubes which can have Knudsen mechanism without barrier.
As they are smaller in diameter than the distance a molecule would travel in the gas
phase between collisions, this will create a separation [288-290]. By calculating the
square root of the ratio of the molecular weights of binary gas mixtures, the selectivity
ratio or the separation factor of Knudsen flow can be estimated. Knudsen separation is
applicable for membranes whose pore sizes are smaller than 50 nm and these separation
factors represent ideal separation factors for several gas pairs. However, due to their
low selectivities in standard applications such membranes are not generally attractive
for commercial application [284].
44

Figure 3.3: Schematic representation of membrane-based gas separation mechanisms [285].
Table 3.1 shows the varieties of applications that membranes are used for gas
separation. Membrane technology operates on selective permeation of gases. Gas
45

separation phenomena work on the principle that gases can be dissolved and then
diffused into polymeric materials. If a pressure difference can be set up on the opposing
sides of the membrane, permeation across the membrane will occur. Different porous
structure used for various types of membranes are shown in Figure 3.4. Any material
used as a membrane will separate gases to some extent, but selection of an accurate and
appropriate material is extremely important for determining the ultimate performance of
the gas separation unit.
Table 3.1: Gases involved in gas separation technologies and their application [278].
46

Figure 3.4: Different porous structure used for various types of membranes [288, 291, 292].
3.3 Adsorption based separation
Though there are several advantages associated with membrane based separation, it is
basically an energy-extensive process. As a result, there is growing interest for
exploring the alternatives for membrane technology. In adsorption separation, gas
molecules are first attracted by adsorbent materials, after which they concentrate on the
adsorbent surface, and finally isolate from the gas phase. Since 1970, new, porous,
high-surface area adsorbent materials have facilitated the diversity and scale of gas-
phase adsorption separation methods. Scientists are especially interested for
advancements in the design and adjustment of new and existing adsorbents. This will
also advance the analogous discoveries of new process methods. Hence, for new
applications of adsorbents, an effective cooperation in adsorbent design and
development and optimization in the process cycle is required. Table 3.2 shows the
47
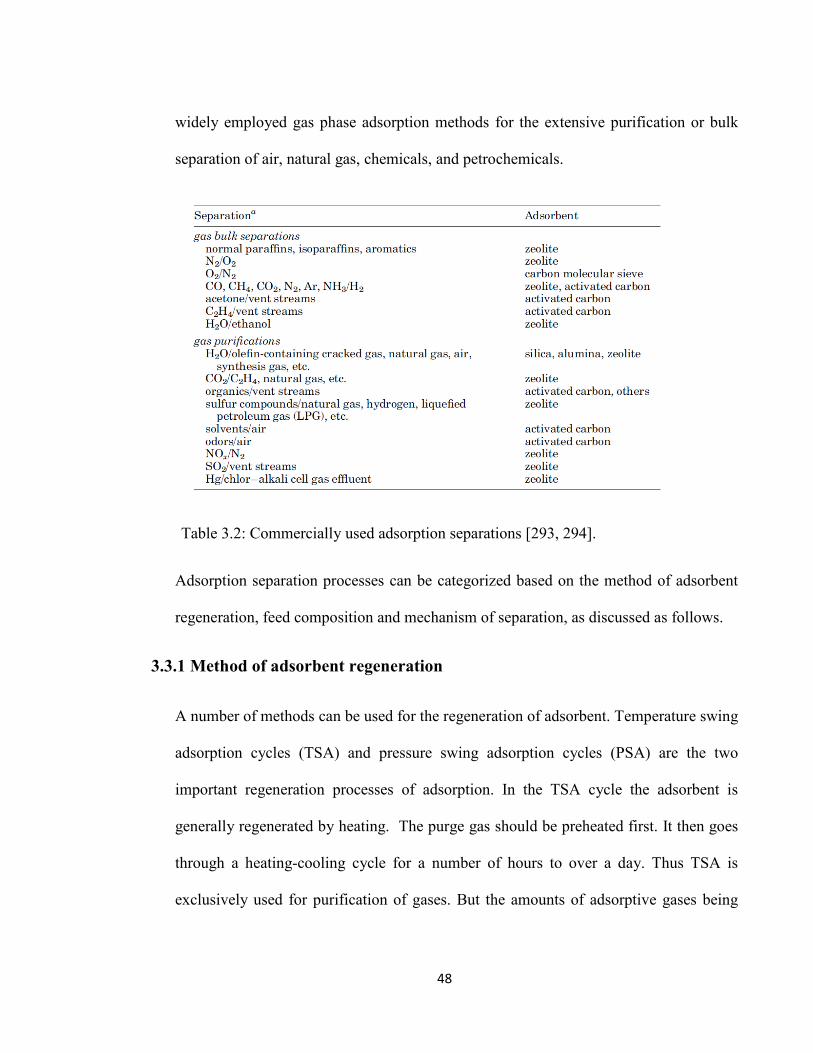
widely employed gas phase adsorption methods for the extensive purification or bulk
separation of air, natural gas, chemicals, and petrochemicals.
Table 3.2: Commercially used adsorption separations [293, 294].
Adsorption separation processes can be categorized based on the method of adsorbent
regeneration, feed composition and mechanism of separation, as discussed as follows.
3.3.1 Method of adsorbent regeneration
A number of methods can be used for the regeneration of adsorbent. Temperature swing
adsorption cycles (TSA) and pressure swing adsorption cycles (PSA) are the two
important regeneration processes of adsorption. In the TSA cycle the adsorbent is
generally regenerated by heating. The purge gas should be preheated first. It then goes
through a heating-cooling cycle for a number of hours to over a day. Thus TSA is
exclusively used for purification of gases. But the amounts of adsorptive gases being
48

processed by TSA are small. On the other hand, PSA is the most rapidly growing
regeneration process, where now the adsorbent is separated by lowering the pressure.
The amount of adsorptive gases is higher and faster than TSA as it goes through rapid
cycles, usually in minutes or seconds. The PSA cycle has two steps for regenerating the
adsorbent. In the inert-purge cycle, the adsorbent is restored by passing either a non
adsorbing or weakly adsorbing gas through the adsorber. After that, the purge gas or
desorbent adsorbs strongly by the adsorbates in the displacement-purge cycle.
3.3.2 Feed composition
Depending on the concentration of the strongly adsorbed component in the mixture, the
separation techniques can be divided into bulk separation and purification. This
differentiation is desirable because feed concentration is an important factor in selecting
the process cycle. But, there is no clear differentiation between the two categories.
According to the Keller definition, bulk separation can be defined as the point when 10
weight percent or more of the mixture is adsorbed [295]. For example, commercial
hydrogen purification process by PSA, 70% volumetric composition of H2 is used.
3.3.3 Mechanism of separation
In this method, adsorption separation is achieved by either one of three mechanisms
namely, steric, kinetic, or equilibrium effects. The steric effect is similar to the
molecular sieving effect in the membrane separation technique. As a result, only small
and properly designed molecules can diffuse into the adsorbent, ignoring other
molecules. Most micropore adsorbents follow steric separation processes. By using
49

differences in molecule diffusion rates, kinetic separation occurs. Molecular sieve
carbons are favorable candidates for kinetic separation because of the different
distributions of pore sizes. This will allow different gases to diffuse at different rates
which enhances the separation of a mixture. Commercial nitrogen generation from air
employs kinetic separation. Most adsorption processes operate on the equilibrium
adsorption of the mixture and therefore are called equilibrium separation processes.
3.4 Adsorption principles
For a particular application, the design and fabrication of adsorbents will require
modification of the structure and chemistry of the adsorbent. This can be done by
increasing the forces of one molecule to make it attractive compared to another, or, on
the basis of molecular size by modifying the pore sizes, to achieve greater access
control to the adsorbent surface. There are many technologies developed by adsorbent
manufacturers for this modification of the adsorbent that are currently available. But
they are considered patented and are not openly communicated. However, the broad
principle of adsorption is based on weak intermolecular van der Waals forces, as most
commercial applications of adsorption depend on this phenomenon.
50

3.4.1 Adsorption forces
Depending on the diverse interactions between adsorbed and adsorbent molecules, the total
potential energy 𝛷𝑇𝑜𝑡𝑎𝑙 of adsorption interaction is subdivided into three parts [296],
𝑇𝑜𝑡𝑎𝑙 𝑒𝑛𝑒𝑟𝑔𝑦 = 𝑛𝑜𝑛 𝑠𝑝𝑒𝑐𝑖𝑓𝑖𝑐 𝑐𝑜𝑛𝑡𝑟𝑖𝑏𝑢𝑡𝑖𝑜𝑛+ 𝑠𝑝𝑒𝑐𝑖𝑓𝑖𝑐 𝑐𝑜𝑛𝑡𝑟𝑖𝑏𝑢𝑡𝑖𝑜𝑛+ 𝑎𝑑𝑠𝑜𝑟𝑏𝑎𝑡𝑒 −
𝑎𝑑𝑠𝑜𝑟𝑏𝑒𝑛𝑡 𝑐𝑜𝑛𝑡𝑟𝑖𝑏𝑢𝑡𝑖𝑜𝑛 (3.5)
Here, the non specific contribution is the sum of dispersion energy 𝛷𝐷, close-range repulsion
𝛷𝑅 and polarization 𝛷𝑃 energy. Again, specific contribution is the sum of field–dipole
interaction 𝛷𝐹−𝜇 and field gradient–quadrupole interaction 𝛷𝜕𝐹−𝑄. Adsorbate–adsorbate
interactions are denoted as self-potential 𝛷𝑆𝑃. We can now express Eq (3.5) as,
𝛷𝑇𝑜𝑡𝑎𝑙 = (𝛷𝐷 +𝛷𝑅 + 𝛷𝑃) + �𝛷𝐹−𝜇 + 𝛷𝜕𝐹−𝑄�+ 𝛷𝑆𝑃 (3.6)
Whether or not specific electric charge distributes in the adsorbate molecules, the non specific
part always contributes to the total energy. Specific contributions are only important when
permanent dipole and quadrupole moments retain in adsorbate molecules. If these moments are
absent then the value of this term will be zero. Nevertheless, the adsorbate-adsorbent
contribution is the result of interactions between two adsorbate molecules. When the coverage
by adsorbate molecules is low, then this contribution approaches zero. When coverage is high,
the heat of adsorption will increase.
The sum of dispersion and repulsion energy (𝛷𝐷 + 𝛷𝑅) is also represented as the van der
Waals forces. It can be well express by the Lennard-Jones 6–12 potential equation [297, 298],
51
𝛷𝐷 + 𝛷𝑅 = 4𝜀 ��𝜎𝑟�12− �
𝜎𝑟�6� (3.7)
where 𝑟 is the intermolecular separation distance, 𝜀 is the potential well depth and 𝜎 is the finite
distance at which the inter-particle potential is zero.
The polarization energy 𝛷𝑃 is the formation of electric fields between the positively and
negatively charged nuclei and electron respectively. It can be defined as the interaction between
the electric field and the induced dipole, and can expresed as [299],
𝛷𝑃 = −12𝛼𝐄2 (3.8)
The field–dipole interaction 𝛷𝐹−𝜇 is defined as the interaction between a molecule’s
permanent dipole moment 𝜇 and the adsorbent surface electric field 𝐄 [299],
𝛷𝐹−𝜇 = −𝐸𝜇𝑐𝑜𝑠𝜃 (3.9)
where 𝜃 is the field angle. Simlarly, the field gradient–quadrupole interaction energy 𝛷𝜕𝐹−𝑄
can be expressed as the interaction between the molecule’s permanent quadrupole moment 𝑄
and the electric field gradient 𝑑𝐸/𝑑𝑅 [293, 299].
𝛷𝜕𝐹−𝑄 = −Q𝑑𝐸𝑑𝑅
(3.10)
The last contribution is the adsorbate–adsorbate self potential energy, which is the summation
of all of the above adsorbed molecules interactions energy with each other.
52

Two equal and opposite charges are separated by a distance in an electric dipole. All molecules
possess positively charged nuclei and negatively charged electrons. If a molecule is positioned
between two oppositely charged plates, the electric field will attract the positive nuclei in the
direction of the negative plate and the positive plate will attract the negetively charged
electrons. Thus an electric dipole will be created by the distortion of the molecules. Coulomb’s
law can be used for calculating the electrostatic potential of this charge distribution [298].
After removing this charge feild, the distortion will disappear, and the molecule will return to
its original situation. This electrical distortion phenomenon of the molecule is called induced
polarization and the dipole formed is called an induced dipole. This induced dipole can be
defined bt the following expression,
𝛍𝐢 = 𝛼𝐄 (3.11)
where, 𝛍𝐢 is the induced dipole moment, 𝛼 is the polarizability of the molecule and 𝐄 is the
electric field vector.
3.4.2 Isotherms and isobars
At equilibrium and constant temperature, the graphical demonstration of adsorbate loading vs
adsorbate concentration or pressure is defined as an adsorption isotherm. Similarly, at constant
adsorbate pressure the adsorbate loading vs temperature graph is known as an adsorption
isobar. At a given partial pressure and temperature of the adsorbate, the adsorbent’s maximum
adsorption capacity depends on the adsorption strength. Scientists are continually working on
accurate isotherm models for both single and multicomponent adsorption to develop a link
between isotherm data and design predictions. Most of the popular isotherm models work well
in particular circumstances for modeling adsorption behavior [29, 149, 299-306]. Some
isotherm models are also thermodynamically unreliable. Freundlich, Sips, loading ratio
53

correlation (LRC), Dubinin-Radushkevich, Toth and vacancy solution isotherm models are
some of the examples of this [29, 306, 307]. Meanwhile, Dubinin, Langmuir [174] (Eq (2.4)),
modified Langmuir isotherms and Brunauer, Emmett & Teller (BET) model (Eq (2.5)) can be
used efficiently for fitting data for a wide range of parameters. As a result, after several
modifications to make them thermodynmically consistent, these models can be used for fitting
the design parameters [308-310].
3.5 Summary
Gas separation is an important operation critical to sustain today’s energy consuming world
without further polluting the environment. Advanced study in adsorption gas separation will
further assist in optimizing the existing adsorbent material performances. Discovering advanced
adsorbent materials will also help to increase adsorption selectivity. In future, adsorption based
separation systems can be efficiently used for achieveing high degrees of purification and
lowering polluting impurity concentrations to very low levels. In this chapter fundamental gas
separation theory is briefly outlined, porous structures within various adsorption membranes are
compared and previous work in gas separation is reviewed.
With the availability of high speed computers, molecular modeling and molecular-dynamics
simulations can also help to model interaction potentials between adsorbate–adsorbent
molecules in nano, micro and meso-pore levels using statistical thermodynamic principles.
Monte Carlo simulation has been used for effectively designing new adsorbent materials like
zeolites, activted carbon, MOFs, COFs and PAFs. Commercial software like Material Studio
can be successfully used for calculating the adsorption and separation behaviour of
water/methanol mixtures and purifying natural gas from carbon dioxide gas on modified PAFs
54

materials. These topics will be discussed further in this thesis. In the following chapter we will
discuss the details of molecular simulation using the Mone Carlo method.
55

Chapter 4
Molecular Simulations
In this chapter we will briefly describe the Monte Carlo simulation method and its
implementation in the commercial Materials Studio software package.
4.1 Introduction
For studying scientific problems as a numerical virtual experiment, computer
simulations can be used as a powerful technique. Molecular dynamics is a computer
simulation technique for studying the dynamics of molecules and atoms of a particular
system in space and time [185, 186, 311, 312]. The interaction energy between the
atoms in the system can be modeled by a potential energy function. Newton’s equations
of motion are used to describe the trajectories of atoms. Using simple models with a
minimum number of parameters in simulations can reduce the computational cost. The
Lennard-Jones (L-J) potential is one of the simplest energy potentials for describing the
van der Waals interactions between molecules. The interaction potential can be
expressed as,
∅𝐿−𝐽(𝑟𝑖𝑗) = 4𝜖 ��𝜎𝑟𝑖𝑗�12
− �𝜎𝑟𝑖𝑗�6
� (4.1)
56

where, 𝜖 and 𝜎 are the potential well depth and finite distance at which the inter-atomic
potential is zero and 𝑟𝑖𝑗 is the van der Waals distance between atoms. The first term
( 𝜎𝑟𝑖𝑗
)12 represents the repulsive interaction caused by the primary repulsion and close
distances overlapping of electronic clouds. The last term ( 𝜎𝑟𝑖𝑗
)6 represents the attractive
interaction as a result of the atoms’ induced dipole-dipole moment interaction and van
der Waals forces.
After calculation of the potential energy between the atoms from the L-J potential,
Newton’s equations of motion can be used for solving velocities and positions.
According to Newton’s second equation of motion,
𝐅𝑖 = 𝑚𝑖��𝑖 (4.2)
where, 𝐅𝑖 and 𝑚𝑖 are the force and the mass of atom 𝑖 respectively, ��𝑖 is the second
order derivative of the atoms’ position vector with respect to time.
For atomistic molecular simulation and modeling the Monte-Carlo (MC) algorithm
[185, 186] has many advantages. MC methods are quite useful for simulating systems
with many coupled degrees of freedom, such as fluids, disordered materials, strongly
coupled solids, and cellular structures. In the next section we will discuss the Monte-
Carlo (MC) algorithm and it’s used in the commercial software package Materials
Studio.
57

4.2 Introduction to Methods
The Materials Studio software package provides an integrated molecular modeling
suite. It not only offers users a number of tools for building and displaying atomistic
models but also presents a large numbers of modules for performing simulations on a
range of length and time scales. For shorter time scales and length, quantum mechanical
modules can be used for calculating electronic properties. For larger length and time
scales, the modules can be divided into two groups for molecular configuration. Some
modules generate the states of a system developed in time by solving Newton’s laws
while others generate new states at random. We are particularly interested in the latter
one. The methods involved in these modules can be roughly subdivided into the
following areas:
(1) General configuration sampling method.
(2) Traditional Metropolis and biased sampling, the root of the Sorption and
Amorphous Cell applications.
(3) MC as an optimization tool.
We will briefly discuss the theory of these general approaches individually in what
follows.
58

4.3 Theory
4.3.1 MC as a configurationally sampling method
By simply exploring the phase space intersected by the coordinates describing the
system one can obtain an extensive insight into the characteristics of that system. One
of the simple examples of this is the conformer search algorithm. Here a number of
torsional angles 𝑁 is specified in an 𝑁-dimensional phase space and each point will
map to a distinct configuration of the molecule. The simplest way to explore this space
is to scan all the angles systematically. Now, if each angle range is sampled on 𝑚
points then it will generate a potentially huge number of 𝑚𝑁 configurations, thus
making the procedure expensive. Out of these typical conformations the generation of
configurations can be economically affected by producing simple sets of random angles
and then using these sets for generating simple structures.
For a point 𝚪 in a configuration space the property average 𝐴 can be expressed as an
integral over the same space,
⟨𝐴⟩ = �𝑑𝚪 𝐴(𝚪)𝜌(𝚪) (4.3)
where, 𝜌(𝚪) is the probability density normalized to unity for the configuration 𝚪 . As 𝚪
consists of many variables, this integration will be highly dimensional and expensive to
calculate by quadrature. For an integration method of order- 𝑘, the error in the integral
would be proportional to 𝑀−𝑘 𝑁⁄ , where 𝑀 = 𝑚𝑁.
59

In the MC method the average of property 𝐴 can be calculated by integrating over a
random sampling of points which is an alternative to integrating over a fixed range of
points [313],
⟨𝐴⟩ ≈∑ 𝐴(𝚪𝑖)𝜌(𝚪𝑖)𝑀𝑖=1
∑ 𝜌�𝚪𝑗�𝑀𝑗=1
(4.4)
where, 𝚪1. . . ; 𝚪𝑀 symbolize the 𝑀 number of random configurations of the system
generated by a computer. The error in such an estimation is proportional to 𝑀−1 2⁄ .
When 𝑁 > 2𝑘 and the probability density 𝜌(𝚪) is uniform, the MC method works more
efficiently than an order-𝑘 algorithm.
Generally, it is essential to weight each random configuration by its probability
density 𝜌(𝚪). By uniformly generating the configurations of molecular pairs it is
controlled. The average energy of interaction at a particular temperature is then
achieved by weighting each configuration by its probability 𝜌 at that temperature. The
main advantage of this method is that one sampling is sufficient to find the average
over the whole temperature range. But problems arise with the reweighting, as particle
density increases by atomic overlapping when molecules are distributed randomly. For
atomic overlapping the energy will be infinite as 𝜌(𝚪) = 0. As a result, the majority of
random configurations will have a negligible weight, and will not contribute to the
average contribution, making the direct MC sampling inefficient. Fortunately, by using
60

Markov chains for non-uniform sampling this problem can be solved by introducing
correlation between the samples. This will be discussed in the next section.
4.3.2 MC as importance sampling method
The aim of this method is to sample an ensemble with a particular density 𝜌(𝚪) by sequencing
the correlated samples. The sequence is the transition probability 𝑇(𝚪,𝚪ˊ), which is the
changing of state 𝚪 to another state 𝚪ˊ. If the density at step 𝑛 is 𝜌(𝚪,𝑛) and the density at step
(𝑛 + 1) is 𝜌(𝚪,𝑛 + 1) then,
𝜌(𝚪,𝑛 + 1)− 𝜌(𝚪,𝑛) = �(𝑇�𝚪ˊ,𝚪�𝜌�𝚪ˊ,𝑛� −𝚪ˊ
𝑇�𝚪,𝚪ˊ�𝜌(𝚪,𝑛)) (4.5)
For equilibrium density sampling there will be no step dependency, so 𝜌(𝚪,𝑛) = 𝜌(𝚪). Thus Eq
(4.5) becomes,
0 = �(𝑇�𝚪ˊ,𝚪�𝜌�𝚪ˊ� −𝚪ˊ
𝑇�𝚪,𝚪ˊ�𝜌(𝚪)) (4.6)
This circumstance is satisfied for detailed balance of transfer probabilities,
𝑇�𝚪,𝚪ˊ�𝑇(𝚪ˊ,𝚪) =
𝜌�𝚪ˊ�𝜌(𝚪) (4.7)
According to Metropolis et al. [314] choosing
𝑇�𝚪,𝚪ˊ� = 𝑚𝑖𝑛 �1, 𝜌�𝚪ˊ�
𝜌(𝚪)� ( 4.8) will satisfy the detailed balance. The steps
important for ensembling or the steps for increasing the density, i.e when �𝜞ˊ� > 𝜌(𝚪) , will be
61

accepted. Similarly, the steps less important for ensembling or the steps for decreasing the
density will be accepted with a lower probability.
The Canonical ensemble is an important probability density function used in molecular
simulation,
𝜌(𝚪) =𝑒𝑥𝑝(−𝛽𝐸(𝚪))
∫𝑑𝜞ˊ 𝑒𝑥𝑝(−𝛽𝐸(𝚪)) (4.9)
where, 𝐸(𝚪) is the potential energy of state 𝚪 and 𝛽 = 1 (𝑘𝐵𝑇⁄ ). Here, 𝑘𝐵 is the Boltzmann
constant and 𝑇 is the temperature. Since integration of momentum space can be calculated
analytically and sampling is not essential, kinetic energy is excluded from this definition. The
probability acceptance can be further derived from Eq (4.7) as,
𝑇�𝚪,𝚪ˊ� = �𝑒𝑥𝑝 �−𝛽�𝐸ˊ − 𝐸�� , 𝐸ˊ > 𝐸,
1 , 𝐸ˊ ≤ 𝐸, (4.10)
where, 𝐸ˊ = 𝐸(𝚪ˊ). Changing a state is generally a two-stage process. First, a step is proposed
as a trial step and then it will be either accepted or rejected. This can be expressed as,
𝑇�𝚪,𝚪ˊ� = 𝜔�𝚪,𝚪ˊ�𝛼�𝚪,𝚪ˊ� (4.11)
where, 𝜔�𝚪,𝚪ˊ� is the attempted probability and 𝛼�𝚪,𝚪ˊ� is the accepted probability. In the
traditional MC method, equal probability trials are made in either direction such that,
62

𝜔�𝚪,𝚪ˊ� = 𝜔�𝚪ˊ,𝚪�. For example, for changing the x-coordinate of an atom from A to B,
many attempts can be made by moving it from B to A and the probability of acceptance can
be read as, 𝛼�𝚪,𝚪ˊ� = 𝑚𝑖𝑛 �1, 𝜌�𝚪ˊ�
𝜌(𝚪)�
The sorption module in Materials Studio uses this same Metropolis MC approach.
For achieving a higher acceptance rate sometimes bias attempts are implemented where,
𝜔�𝚪,𝚪ˊ� ≠ 𝜔�𝚪ˊ,𝚪�In that case, more attempts can be made for configuring a higher density
or lower energy step to avoid unnecessary high energy evaluations. Interestingly, still the
original ensemble can be attained by accepting the modified probability and tracking the
bias ω. Hence,
𝛼�𝚪,𝚪ˊ� = 𝑚𝑖𝑛 ��1,𝜔�𝚪ˊ,𝚪�� �𝜔�𝚪ˊ,𝚪�� �𝜌�𝚪ˊ� 𝜌(𝚪)⁄ �� � (4.12)
The Sorption module in Materials Studio also use this same configurational bias MC
approach.
4.3.3 MC as an optimization procedure
In the optimization procedure the approximate minimum energy of the system can
also be determined by the MC method. For generating successive points in the
configuration space the Metropolis algorithm is used. Temperature is considered
63

without any physical significance and is the main parameter which controls the
calculation. Initially, the temperature will be high. So, the probability of acceptance
for new states will be high too. The whole configuration space can be explored
rapidly. As the computation proceeds further, the temperature will be progressively
lowered. Thus for the lower energy regions, the probability density will be
concentrated and will be thoroughly sampled.
4.4 Simulating Adsorption
4.4.1 Sorption
By using MC sampling, the Materials Studio Sorption module simulates a
framework–sorbate system. The framework structure of a typical unit cell or super
cell of a microporous crystal and one or more structures of sorbate molecules are
considered as the input. When providing a stationary external field to the sorbate
molecules, the rigid framework is considered. Sometimes, sorbate molecules can also
be considered as rigid forms. In that case, the system’s degrees of freedom (𝚪) can be
functionalized by the center-of-mass position (𝐑𝑖) and molecule
orientations (𝛀𝑖), 𝚪 = (𝐑1, 𝛀1, . . . ,𝐑𝑁 , 𝛀𝑁). Intramolecular torsional degrees of
freedom are also possible to specify.
Metropolis and the configurational bias MC methods are used for sampling. Both
methods can be used for sampling (a) fixed loading canonical ensemble and (b) fixed
pressure grand canonical ensemble. The fixed loading task can be described by each
64

component loading, 𝑁 = (𝑁1, . . .𝑁𝑀), whereas, fixed pressure needs the fugacities,
𝑓 = (𝑓1, . . .𝑓𝑀 ) of each component. The fugacity can be expressed as,
𝑓 = 𝑓0 𝑒𝑥𝑝�𝛽(𝜇 − 𝜇0)� (4.13)
where, 𝜇 is the chemical potential and ° denotes a reference state, like the ideal gas
state. The fugacity decreases with the partial pressure for an ideal gas.
The canonical ensemble density function is expressed by Eq (4.9). For the rigid
condition, the framework energy and sorbate molecules’ intramolecular energy are
independent of 𝚪 and thus can be ignored and combined in a constant multiplication
factor. For the grand canonical ensemble, the loading of each component 𝑁 =
(𝑁1, . . .𝑁𝑀) is also considered as additional degrees of freedom. Hence, the
probability density function can be expressed as,
𝜌(𝚪,𝑁) = 𝐶 𝐹(𝑁) 𝑒𝑥𝑝(−𝛽𝐸(𝚪)) (4.14)
where, 𝐹(𝑁) can be written as ,
𝐹(𝑁𝑖) =(𝛽𝑓𝑖𝑉)𝑁𝑖𝑁𝑖!
𝑒𝑥𝑝�−𝛽𝑁𝑖𝜇𝑖𝑛𝑡𝑟𝑎,𝑖� (4.15)
where, 𝑓𝑖 is the fugacity of component 𝑖 , 𝑉 is the constant volume of the system and
𝜇𝑖𝑛𝑡𝑟𝑎,𝑖 is the intramolecular chemical potential defined by
�−𝑘𝐵𝑇 𝑙𝑛⟨𝑒𝑥𝑝�−𝛽 𝑢𝑖𝑛𝑡𝑟𝑎,𝑖�⟩�, where, 𝑢𝑖𝑛𝑡𝑟𝑎,𝑖 is the intramolecular potential of a
molecule of component 𝑖 at constant temperature in vacuum. If torsional degrees of
65

freedom are not considered then this intramolecular potential energy is also
considered as constant and therefore can be deducted from the total energy 𝐸 in Eq
(4.14). Substituting Eq (4.14) in the acceptance rule, Eq (4.8) can be expressed as,
𝛼�𝚪,𝑁,𝚪ˊ,𝑁ˊ� = 𝑚𝑖𝑛 �1, �𝐹𝐹ˊ� 𝑒𝑥𝑝 �−𝛽�𝐸ˊ − 𝐸�� � (4.16)
The Fixed Loading module supports ‘Translation’, ‘Rotation’, ‘Regrowth’ and
‘Conformer’ steps. The translation move is the result of moving a selected sorbate
molecule’s centre-of-mass over a distance 𝛿𝑟 along an axis 𝐴. The value of 𝛿𝑟 varies
with a uniform distribution between 0 to ∆𝑡. The maximum displacement ∆𝑡 can be
specified in the input. Similarly, in the rotation move the molecule is rotated along the
centre-of-mass by an angle 𝛿𝜃 along the axis 𝐴. 𝛿𝜃 varies with a uniform angle
distribution between a minimum of −∆𝑟 to a maximum of ∆𝑟. ∆𝑟 can be fixed in the
input too. In the regrowth step, a sorbate molecule is first removed from the system,
and then reintroduced with a random orientation and position. These moves are useful
for transferring sorbate molecules between the framework pores. In the conformer
move, the sorbate input consists of multiple conformations for a group of trans
conformations. This step will attempt to exchange randomly the current conformation
by an alternative, chosen from the trajectory.
For the fixed pressure task, apart from the above steps an additional exchange step is
also considered. In this step a new sorbate is created with an exchange of deleting the
existing sorbate molecule. For creating and deleting, proper care should be taken with
an equal probability. For an empty system, deletion steps are basically rejected by
66

adding the empty state as an added sample to the ensemble average. This is an
important step for calculating low fugacity adsorption isotherms. The output file of
the sorption module consists of average loading, isosteric heat of adsorption plus the
system average total energy.
4.4.2 Configuration bias MC
The attempt rate 𝜔�𝚪,𝚪ˊ� for 𝑛 configurations in the configurational bias MC method of
Sorption is expressed as follows,
𝜔�𝚪,𝚪ˊ𝑛� =𝑤𝑛
1 𝐾∑ 𝑤𝑘𝐾𝑘=1⁄
(4.17)
where a total of 𝐾 trial configurations �𝚪ˊ1, . . . 𝚪ˊ𝐾� are generated as an alternative of
producing one trial configuration 𝚪ˊ. 𝑤𝑘 is the given weight of each configuration 𝚪ˊ𝐾.
Each configuration has a probability to be selected which is proportional to its weight.
Therefore, configurations with higher average weight (𝜔 > 1) are more likely to be
attempted. However, it is still possible, although less likely, for selecting a lower than
average weight sample configuration (𝜔 < 1).
In the bias MC method, the reverse step attempt rate 𝜔�𝚪ˊ𝑛,𝚪� is also needed for
determining the probability acceptance. This attempt rate is defined as reversing a
configuration (𝚪ˊ𝑛) into the known configuration (𝚪). As calculated before, for a given
configuration (𝚪) we only need to generate (𝐾 − 1) trial configurations for the attempt rate.
The configuarational bias method has the same Translation and Rotation step as described
above. Likewise, it also has a twist step available. This step allows choosing a torsion angle
67

∂Φ with a uniform angle distribution between a minimum of − ∆r to a maximum
of ∆𝑟.
4.4 Conclusion
Materials Studio has a wide range of modules for molecular simulation based on the
MC method. For sorption calculation these modules support a variety of force fields,
including COMPASS, pcff, cvff, Universal and Dreiding force fields. We can also
create modified new force fields by editing the existing force field and apply them to
simulations. Materials Studio has now been used successfully over more than a
decade for many different applications across a series of chemical and physical
sciences and practically every industrial division. Its improved modules can help us to
calculate adsorption uptake and also help improving material properties for gas
storage and separation applications.
68

Chapter 5
Strategies Towards Enhanced Low Pressure Volumetric
Hydrogen Storage in Nanoporous Cryo-Adsorbents
5.1 Introduction
In this chapter we introduce a new concept for hydrogen storage of porous aromatic
frameworks (PAFs) impregnated with lithium-decorated fullerenes (Li6C60). Volumetric
hydrogen capacity remains one of the most challenging criteria for on-board hydrogen
storage system requirements. The loading of Li6C60 and the effect on adsorption of
hydrogen (H2) will be investigated by molecular simulation. We will show that
incorporation of Li6C60 can enhance the volumetric capacity of H2 from 12 g/L to 44 g/L, a
260 % increase at 10 bar and 77 K. The impregnation of Li6C60 increases the heat of
adsorption and surface area at the cost of available pore volume. However, the increase in
adsorbed hydrogen outweighs any pore volume loss at optimized Li6C60 loading and
operating conditions. In addition, H2 volumetric uptake is shown to correlate with
volumetric surface area at all pressures while H2 gravimetric uptake correlates with heat of
adsorption at low pressures, surface area at moderate pressures and pore volume at high
pressures.
During the past decade, a significant amount of research has been performed on
nanoporous materials, which not only possess high surface area but also reversibly adsorb
69

or desorb hydrogen under pressure-swing and temperature-swing conditions [251, 315-
322]. They possess intrinsically high surface areas and internal volumes, and these factors
are known to enhance gas storage at cryogenic temperatures [146]. A recent report from the
U. S. Department of Energy (DoE) suggests that cryo-sorbents [323] are promising for on-
board hydrogen storage systems, although the capacity targets are yet to be met [323]. Even
though cryo-conditions are not within the DoE requirements, there is considerable research
in cryo-compressed systems to meet the DoE capacity targets [324-328]. Hydrogen has
been considered as a medium for clean energy because of its universal abundance and lack
of carbon emissions in its use. The production of hydrogen remains a challenge, although
technologies such as steam reformation of coal/oil/gas [329], fermentation of organic waste
[330], photodecomposition of water or organic compounds using bacteria [331] and
photocatalytic water splitting [332] are viable options. In order to make the hydrogen-
driven fuel cell vehicle viable, efficient, safe and economically sound hydrogen storage
systems are needed [217]. A few years ago, the U. S. DoE set a number of targets for
hydrogen storage systems including capacity requirements: 4.5 wt% or 28 g/L by the year
2010, and 5.5 wt% or 40 g/L by the year 2017 [323]. Physical adsorbents have achieved
high hydrogen capacities but usually at cryogenic temperatures. Fortunately, engineering
work has pushed the viability of cryo-compressed hydrogen into the realm of industrial
feasibility [323-328].
Designing adsorbent materials by tailoring heat of adsorption, surface area and pore
volume is an effective strategy for enhancing hydrogen capacity. Some of the leading
candidates include metal-organic frameworks (MOFs) [80, 333-337] and covalent organic
70

frameworks (3D COFs) [94, 338-341] with surface areas up to 7000 m2/g (Farha et
al.[342]) and 5172 m2/g (Babarao et al.[343]) respectively. The most important drawback
of most of the MOFs and COFs are their low chemical stability. The development of
Porous Aromatic Framework (PAF) materials provides a combination of ultra-high surface
area and high physicochemical stability.
PAFs were recently reported as a new family of ultraporous materials with BET surface
areas above 5000 m2g-1[138, 344]. Consisting of fused diamandoid tetrahedra, with pore
size distributions centered around 12 Å, these carbonaceous materials have been shown to
deliver hydrogen storage capacities of 7 wt. % at 48 bar and 77 K. These values, whilst
when compared to most materials are exceptional, are lower than what might be expected
given the large surface area, and may be attributed to the inert, non-polarised surface.
However, PAFs are extremely stable and have been previously shown to be resistant to 7
days immersion in boiling water [344]. This stability to harsh chemical environments
facilitates functionalisation of the inert PAF surface with reactive, charged moieties to
enhance gas storage capacity. For example, we recently demonstrated that pyrophoric
lithium species could be covalently bound to the PAF surface, tripling its CO2 storage
capacity without affecting the overall PAF architecture [345].
Whilst PAFs can be tailored for excellent gravimetric storage capacity, less progress has
been made in enhancing the volumetric performance, a key performance criteria for mobile
applications. The 2017 DoE target is 40 g (useable H2)/L (system). The best nanoporous
adsorbents to date can barely meet these requirements, even under an idealized scenario,
where the adsorbent packing is assumed to be perfect, all adsorbed gas useable, and the
71

weight and size of the storage system not accounted for [346, 347]. Therefore, the next
stage of development for improved hydrogen storage materials needs to focus upon
strategies to enhance volumetric storage capacity. Here, we detail the potential of one such
approach, the impregnation of PAFs with lithiated fullerenes.
Previously a concept to drastically enhance both the gravimetric and volumetric gas storage
capacity of MOFs was reported, by infusing these porous media with metallated fullerenes
[348]. This provided an additional surface within the same given volume, with metal sites
polarizing hydrogen molecules. As a result, the enthalpy of adsorption was found to
increase to 11 kJ mol-1 in concert with a drastically increased hydrogen storage capacity at
low pressures. Metallated fullerenes are extremely reactive species and, therefore require
incorporation in particularly stable porous media for this concept to be realized. The
stability of the porous media is imperative and PAFs have the function and capability
means to facilitate the isolation of native or metallated fullerenes.
It is of interest in this study to determine the optimal amount of impregnation to maximize
volumetric uptake by utilizing molecular simulation techniques. Molecular simulation has
proven to provide accurate predictions of hydrogen uptake in PAFs as shown by Lan et al.
[114]. The effect of impregnation on hydrogen uptake in MOFs has been successfully
simulated by Rao et al. [349], proving a useful route to increasing both gravimetric and
volumetric uptake. Here we follow the same procedure to investigate lithiated fullerene
impregnation within two PAFs with different pore sizes and explore the relationships
between storage performance and structure characteristics described by Frost et al. [350].
72

5.2 Models and Simulation
In this work the PAF structures were constructed following details outlined by Lan et
al.[114] The structures include PAF-30X (X=3-4), where 3 means 3D structure and X
denotes the number of phenyl rings used to replace the C-C bond. Each unit cell was
constructed using the Forcite module of the Materials Studio package with cubic periodic
boundaries of dimensions (a=b=c) 33.80 and 43.55 Å for PAF-303 and PAF-304,
respectively [351]. The pore windows for PAF-301 and PAF-302 were found to be too
small for the impregnation of Li6C60. The diameters of the largest cavity of PAF-303, and
PAF-304 were 20.8, and 28.6 Å, respectively. The atomistic representation of a) PAF-303
and b) PAF-304 impregnated with Li6C60 is shown in Figure 5.1.
Figure 5.1. Atomistic representation of a) PAF-303 and b) PAF-304 impregnated with
Li6C60. PAF unit cell highlighted in red and Li6C60 in blue (lithium) and green (carbon).
PAF-303PAF-304
Li6C60Li6C60
Li6C60@PAF-303
Li6C60@PAF-304
a) b)
73

Six lithium ions were distributed upon the five-member rings of the C60 at an approximate
distance of 2.229 Å by geometry optimization [194], forming the Li6C60. Six lithium ions
were chosen rather than 12 because it has been shown that Li6C60 is the more stable
compound [352]. The pore size distribution for the PAFs and lithiated Fullerene
impregnated PAFs has been shown in Figure 5.2. Pore size distributions were calculated for
the PAFs and lithiated fullerene impregnated PAFs using the Zeo++ package based on
Voronoi constructions [353]. The observed decrease in pore size is the effect of pore filling
with increasing lithiated fullerene loading.
74

0 10 20 30 40 50
0
1
2
3
4
5
6
Pore
size
dist
ribut
ion
Pore width(Ao)
PAF-303 4PAF-303 9PAF-303 32PAF-303
(a)
0 10 20 30 40 50
0
1
2
3
4
5
6
Pore
size
dist
ribut
ion
Pore Width (Ao)
PAF-304 4Li6C60@PAF-304 28Li6C60@PAF-304 72Li6C60@PAF-304
(b)
Figure 5.2: Pore size distribution from Voronoi construction for (a) empty PAF-303,
4Li6C60@PAF-303, 9Li6C60@PAF-303 and 32Li6C60@PAF-303 (b) empty PAF-304,
4Li6C60@PAF-304, 28Li6C60@PAF-304 and 72Li6C60@PAF-304 respectively.
A varying number n of lithiated fullerenes (n Li6C60) were randomly inserted within the
PAF unit cell followed by geometry optimization. The prediction of hydrogen uptake inside
the nLi6C60@PAF structures were calculated by the Grand Canonical Monte Carlo
75

(GCMC) routine. In this method, the sorbate structure (H2 gas) and the sorbent structure
(nLi6C60@PAF) are treated as rigid. Trial addition, deletion, translation and rotation moves
of the H2 gas molecule are repeated and accepted/rejected based on the grand canonical
ensemble at specific temperature and pressure. 2 million equilibration steps are followed by
1 million production steps ensuring that the final composition represents the state of
thermodynamic equilibrium. The gravimetric capacity is expressed as wt. % with the
relation [(mass of H2) / (mass of H2 + mass of structure)] and volumetric capacity is
expressed as units of g/L with the relation [(mass of H2) / (volume of unit cell)]. The
interaction between H2, PAF and Li6C60 was modeled by the Morse potential function
given as,
𝑈𝑖𝑗�𝑟𝑖𝑗� = 𝑈0 (𝑥2 − 2𝑥), (1.1)
where 𝑥 = 𝑒𝑥𝑝 �−𝛾2�𝑟𝑖𝑗𝑟0− 1)��.
Here the parameter 𝑈0 is the well depth, 𝑟0 is the equilibrium bond distance, 𝑟𝑖𝑗 is the
distance between the atoms i and j, and 𝛾 is the force constant. We adopt the force field
parameters that were calculated from first-principles by Han and Goddard [251] for H2-H2
interactions, Lan et al.[114] for H2-PAF interactions and Rao et al.[349] for H2-Li6C60
interactions, listed in Table 5.1. Although there is no high pressure data to test the accuracy
of the simulations, the force fields are derived from quantum calculations and therefore are
applicable at any pressure [354].
Molecular simulation results are given as total hydrogen uptake including the gas phase and
adsorbed phase contributions. Experimental results are usually reported as excess uptake
76

which is the total uptake minus the gas phase contribution. Our simulated total uptake may
be converted to excess uptake by predicting the gas phase contribution using the Peng-
Robinson equation of state [355] and the pore volume of the PAF structures.
Table 5.1: Force field parameters employed in the present work. Here, H_A denotes the
hydrogen atom in the H2 molecule, H_S denotes hydrogen in the PAF structure, C_R
denotes the resonant and C_3 denotes the tetrahedral coordinated carbon in the PAF
structure, Li denotes the lithium ion and C_C60 denotes the carbon in the fullerene.
Atom types 𝑈0 (kcal/mol) 𝑟0 (Å) 𝛾 Ref.
H_A -- H_A 0.0182 3.570 10.709 Han and Goddard
[251]
H_A -- H_S 0.0124 3.201 12.003 Lan et al.[114]
H_A -- C_R 0.0892 3.240 11.600 Lan et al.[114]
H_A -- C_3 0.0620 3.240 11.006 Lan et al.[114]
H_A -- Li 1.5970 1.994 7.940 Rao et al.[349]
H_A -- C_C60 0.1008 3.120 12.006 Rao et al.[349]
5.3 Results and Discussion
First we evaluate the effect of impregnation at low pressures up to 1 bar in Figure 5.3 for
PAF-303 and Figure 5.4 for PAF-304. The different trends between gravimetric and
77

volumetric uptake with Li6C60 loading are highlighted with arrows to emphasize the results
of this study. The significant difference is that the gravimetric uptake increasing trend
reaches a maximum while volumetric uptake continues to benefit at high Li6C60 loading.
This is a promising indication that volumetric uptake can be improved with impregnation.
The maximum gravimetric uptake of H2 at 1 bar was found to be 5.71 wt.% in PAF-304
impregnated with 28 Li6C60, that is approximately a 40 % increase compared with bare
PAF. The maximum H2 uptake for PAF-303 was found to be 5.5 wt.% with 9 Li6C60, an 80
% increase. Moreover, the maximum numbers of impregnated Li6C60 that can fit within the
PAF unit cells are 72 (or 91.73 wt.%) for PAF-304 and 32 (or 87.41 wt.%) for PAF-303,
resulting in the lowest gravimetric uptake. There are two reasons for the maximum uptake
at a particular loading. Firstly, the highest gravimetric storage capacity is due to the highest
N2 accessible surface area (m2/m3), shown in Figure 5.14. and Table 5.2. Secondly, the
mass of the material increases with loading while the volume of the material remains
constant, therefore the gravimetric uptake reaches a maximum where the benefit of uptake
is overcome with the loss of material mass, while the volumetric uptake continually
increases.
Volumetric uptake results are given in Figure 5.3 (b) for PAF-303 and Figure 5.4 (b) for
PAF-304 with various loadings of Li6C60. The maximum volumetric uptake of H2 was
39.23 g/L in PAF-304 impregnated with 72 Li6C60. For PAF-303 the maximum volumetric
H2 uptake was 39.60 g/L with 32 Li6C60. H2 uptake increases with loading of Li6C60 and in
both cases 40 g/L is almost achieved for the optimal Li6C60 loading at just 1 bar pressure
78

Figure 5.3: Total H2 uptake in PAF-303 (a) gravimetric and (b) volumetric uptake
embedded with no. of Li6C60 up to 1 bar and 77 K. Arrows indicate increased Li6C60
loading.
Per
79

Figure 5.4: Total H2 uptake in PAF-304 (a) gravimetric (b) volumetric uptake embedded
with no. of Li6C60 up to 1 bar and 77 K. Arrows indicate increased Li6C60 loading.
The next series of simulations are for higher pressures up to 100 bar, presented in Figure
5.5 for PAF-303 and Figure 5.6 for PAF-304. For gravimetric uptake, there is a critical
pressure between 1 and 10 bar where there is no benefit for having impregnated Li6C60
within the framework, as shown in Figures 5.5 (a) and 5.6 (a). It is clear for gravimetric
uptake that incorporation of Li6C60 inside the PAFs ensures a favorable environment for H2
80

molecules at low pressure but has a detrimental effect at larger pressures. These results are
attributed to the relative influence of the heat of adsorption, surface area, and pore volume
play at different pressures (vide infra).
Volumetric uptake at high pressures, on the other hand continues to improve with Li6C60
loading, as shown in Figures 5.5 (b) and 5.6 (b). The different trends between gravimetric
and volumetric uptake can be explained by the increased material mass with impregnation
while there is no increase in material volume. Therefore impregnation is an ideal strategy
for enhancing volumetric uptake.
)
81

Figure 5.5: Total H2 uptake in PAF-303 (a) gravimetric (b) and volumetric uptake
embedded with no. of Li6C60 up to 100 bar and 77 K. Arrows indicate increased Li6C60
loading.
82

Figure 5.6: Total H2 uptake in PAF-304 (a) gravimetric (b) volumetric embedded with no.
of Li6C60 up to 100 bar and 77 K. Arrows indicate increased Li6C60 loading.
As excess uptake is also of interest to compare with most experimental results, the
predicted volumetric excess and total hydrogen uptake for bare PAFs and impregnated
PAFs are given in Figure 5.7 with corresponding structural properties listed in Table 5.2. A
remarkable increase in uptake is observed for both total and excess uptake after
83

impregnation. Excess uptake deviates from total uptake at ambient pressures while total
uptake continues to increase as the gas phase density increases.
0 20 40 60 800
10
20
30
40
50
60(a)
Vol
umet
ric u
ptak
e of
H2 (
g/L)
Pressure (bar) at 77 K
in PAF-303 (Total) in PAF-303 (Excess) 9Li6C60 in PAF-303 (Total) 9Li6C60 in PAF-303 (Excess)
0 20 40 60 800
10
20
30
40
50
60
70(b)
Vol
umet
ric u
ptak
e of
H2 (
g/L)
Pressure (bar) at 77 K
in PAF-304 (Total) in PAF-304 (Excess) 28Li6C60 in PAF-304 (Total) 28Li6C60 in PAF-304 (Excess)
Figure 5.7: Total (solid symbols) and excess (open symbols) H2 volumetric uptake for (a)
PAF-303 and (b) PAF-304 with and without impregnated lithiated fullerenes (No. of Li6C60
values indicated in legend).
84

Table 5.2: The density, surface area and free volume of bare PAF and the chosen
nLi6C60@PAF that deliver the maximum uptake. The Connolly N2 accessible surface area
was calculated according to Duren et al.[356] with probe radius of 1.82 Å and the helium
accessible free volume was calculated with probe radius of 1.3 Å.
Material (unit cell) Amount of Li6C60 in PAF
(wt. %)
Mass per unit cell
(g/mol)
N2 accessible
surface area
(m2/m3)
Helium accessible
free volume
(%)
Density
(g/cm3)
PAF-303 0 3749 1144 90 0.161
PAF-303 + 9 Li6C60 64.65 10611 2032 74 0.456
PAF-304 0 4967 720 95 0.099
PAF-304 + 28 Li6C60
81.11 26314 1971 71 0.529
Snapshots of hydrogen density within the bare framework and the impregnated 28 Li6C60
framework at various pressures are given in Figure 5.8. The adsorption at low pressure is
mainly on the Li6C60 as H2 is strongly attracted to the lithium ions. Interaction strength
between H2 and Li is two orders of magnitude higher than for H2 to carbon interactions. A
contribution to the strong interaction is the delocalized anionic charge created by the Li6C60
described in earlier work by Konstas et al.[357] In addition, Li6C60 has an intrinsic surface
area of 6450 m2/g see Figure 5.9. Therefore a combination of greater surface area and
85

stronger adsorption energy leads to high adsorbed density. As expected, the H2 density
increases with increasing pressure for both materials. The most compelling insight is that
the impregnated structure contains a much higher H2 density than the bare structure. As
stated earlier, the total material mass increases significantly with Li6C60 loading while the
total material volume remains constant. Therefore the reason why the total volumetric
uptake increases with Li6C60 loading is because of the increased H2 density without an
increase in the total material volume.
Figure 5.8: Snapshots of H2 adsorption in PAF-304 without Li6C60 at 77 K and a pressure
of (a) 0 bar (b) 0.01 bar (c) 0.1 bar (d) 1 bar (e) 10 bar (f) 100 bar and with 28 Li6C60 at a
pressure of (g) 0 bar (h) 0.01 bar (i) 0.1 bar and (j) 1 bar (k) 10 bar (l) 100 bar respectively,
lowest hydrogen density highlighted in orange and highest hydrogen density highlighted in
blue.
0.01 0.1 1 10 1000
Pressure (bar)
86

Figure 5.9: BET Surface area of Li6C60 (SABET = 6450 [m2/g]) with a binding energy of
around 1.59 kcal/mol.
To further understand the effect of Li6C60 impregnation, Figure 5.10 displays the calculated
H2 volumetric versus gravimetric uptake with a varying pressure and Li6C60 loading. The
aim here is to find the right combination of pressure and/or Li6C60 loading to reach both the
prescribed DoE target region for gravimetric and volumetric uptake [323], outlined with
dashed lines. At the low pressure range (0.1-1 bar), both volumetric and gravimetric uptake
increases with the impregnation of Li6C60 for PAF-303 and PAF-304. At a medium
pressure range (10-50 bar) the volumetric uptake increases but the gravimetric uptake
decreases with Li6C60 loading. Finally, at high pressures (~100 bar), there is a concave
shape (or see-saw trade-off) with the number of Li6C60 impregnated within the PAFs, as
observed recently by Goldsmith et al.[358]. If volumetric uptake is the top priority for
energy storage, then a maximum is obtained by impregnating PAF-303 with 9 Li6C60’s and
87
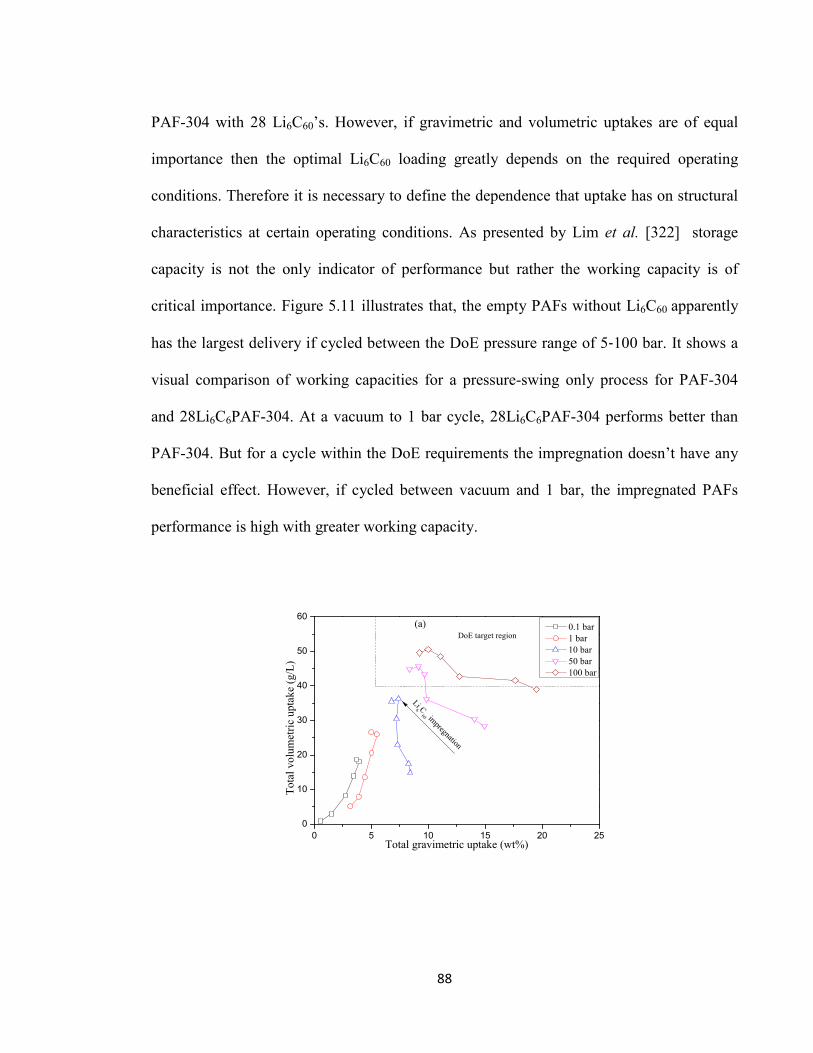
PAF-304 with 28 Li6C60’s. However, if gravimetric and volumetric uptakes are of equal
importance then the optimal Li6C60 loading greatly depends on the required operating
conditions. Therefore it is necessary to define the dependence that uptake has on structural
characteristics at certain operating conditions. As presented by Lim et al. [322] storage
capacity is not the only indicator of performance but rather the working capacity is of
critical importance. Figure 5.11 illustrates that, the empty PAFs without Li6C60 apparently
has the largest delivery if cycled between the DoE pressure range of 5‐100 bar. It shows a
visual comparison of working capacities for a pressure-swing only process for PAF-304
and 28Li6C6PAF-304. At a vacuum to 1 bar cycle, 28Li6C6PAF-304 performs better than
PAF-304. But for a cycle within the DoE requirements the impregnation doesn’t have any
beneficial effect. However, if cycled between vacuum and 1 bar, the impregnated PAFs
performance is high with greater working capacity.
0 5 10 15 20 250
10
20
30
40
50
60
DoE target region
Li6 C
60 impregnation
Tota
l vol
umet
ric u
ptak
e (g
/L)
Total gravimetric uptake (wt%)
0.1 bar 1 bar 10 bar 50 bar 100 bar
(a)
88

0 5 10 15 20 25 30
0
10
20
30
40
50
60(b)
DoE target region
Li6 C
60 impregnation
Tota
l vol
umet
ric u
ptak
e (g
/L)
Total gravimetric uptake (wt.%)
0.1 bar 1 bar 10 bar 50 bar 100 bar
Figure 5.10: Total volumetric and gravimetric hydrogen uptake with Li6C60 loading in (a)
PAF-303 and (b) PAF-304 at 77 K and various pressures.
Working C
apacity
89

Figure 5.11: Working capacity of PAF-304 and impregnated PAF-304 from (a) DoE
prescribed cycle 5-100 bar and (b) vacuum-1 bar cycle.
For a closer analysis, gravimetric and volumetric results are presented separately in Figures
5.12 and 5.13. At 1 bar, the impregnation of 9 Li6C60 loading within PAF-303 delivered a
maximum gravimetric H2 uptake. In addition, a maximum of 5.71 wt. % of gravimetric
uptake for 28 Li6C60 loading in PAF-304 has been achieved. Volumetric uptake is also
maximized at the same Li6C60 loading for pressures above 10 bar. At 10 bar the gravimetric
uptake is almost constant with increasing the number of Li6C60, while at 100 bar the uptake
is reduced with Li6C60 loading. The volumetric uptakes showed a more enduring rise
upward with the impregnation of Li6C60 at all pressures compared with the gravimetric
uptake. As a result, we can achieve a remarkable enhancement of up to 260 % of
volumetric adsorption capacity in PAF-304 at 10 bar, from 12 g/L to 44 g/L with
impregnation of Li6C60.
Working C
apacity
90

0 2 4 6 8 100
5
10
15
20
25(a)
Gra
vim
etric
upt
ake
of H
2 (w
t.%)
No. of Li6C60 in PAF-303
0.1 bar 1 bar 10 bar 50 bar 100 bar DOE target 2017
0.1 bar 1 bar 10 bar 50 bar 100 bar DOE target 2017
0 2 4 6 8 100
10
20
30
40
50
60(b)
Vol
umet
ric u
ptak
e of
H2 (g
/L)
No. of Li6C60 in PAF-303
Figure 5.12: Hydrogen a) gravimetric and b) volumetric uptake with Li6C60 loading in PAF-
303 at 77 K and various pressures.
91

0 5 10 15 20 25 300
5
10
15
20
25
30
Gra
vim
etric
upt
ake
of H
2 (wt.%
)
No. of Li6C60 in PAF-304
0.1 bar 1 bar 10 bar 50 bar 100 bar DOE target 2017
(a)
0 5 10 15 20 25 300
10
20
30
40
50
60(b)
Volu
metr
ic up
take o
f H2 (g
/L)
No. of Li6C60 in PAF-304
0.1 bar 1 bar 10 bar 50 bar 100 bar DOE target 2017
Figure 5.13: Hydrogen a) gravimetric and b) volumetric uptake with Li6C60 loading in PAF-
304 at 77 K and various pressures.
It is noteworthy that if we assume that the hydrogen storage tank is completely filled with
the ideal adsorbent, the total uptake may be compared with the DoE targets. However,
cryogenic temperature condition is not within the DoE required operating conditions. In
reality, adsorbents are usually compressed into pellets losing their intrinsic pore volume
and creating pellet-pellet gaps. Therefore, total uptake should at least be accompanied by
an estimated loss of pore volume (24 % loss according to Dailly and Piorier [359]) to
extrapolate to macro-scale system performance. In the case for PAF, the large-scale
92

packing method is yet to be determined and pore volume loss estimates are unavailable.
Nonetheless, with the current predictions one can extrapolate the results to an altered pore
volume using the structure-property relations elucidated further in the thesis.
In the interests of relating the observed trends in uptake with the structural features such as
heat of adsorption, surface area and pore volume, Figure 5.14 for gravimetric uptake and
Figure 5.15 for volumetric uptake are presented. Heat of adsorption is calculated as the
pressure-dependent isosteric heat of adsorption (see Figure 5.16 for full data). As suggested
above, correlations between gravimetric uptake and Li6C60 loading highly depend on the
pressure conditions. For gravimetric uptake, it is clear that the trend of heat of adsorption
(at 0.01 bar) with number of Li6C60 is identical to the trend in gravimetric uptake at 0.01
bar, see Figure 5.14 (a). Both PAF-303 and PAF-304 have a very similar heat of adsorption
at low loadings, between 5 and 15 kJ/mol. According to Mendoza-Corté et al.[360] and
Bhatia et al.[253] the next generation of frameworks targeting hydrogen adsorption with
high delivery amount should be at least as high as 15 kJ/mol to reach the DoE gravimetric
targets. Therefore, the kinetics of hydrogen adsorption and desorption in PAFs are expected
to be more favourable with Li6C60 impregnation.
93
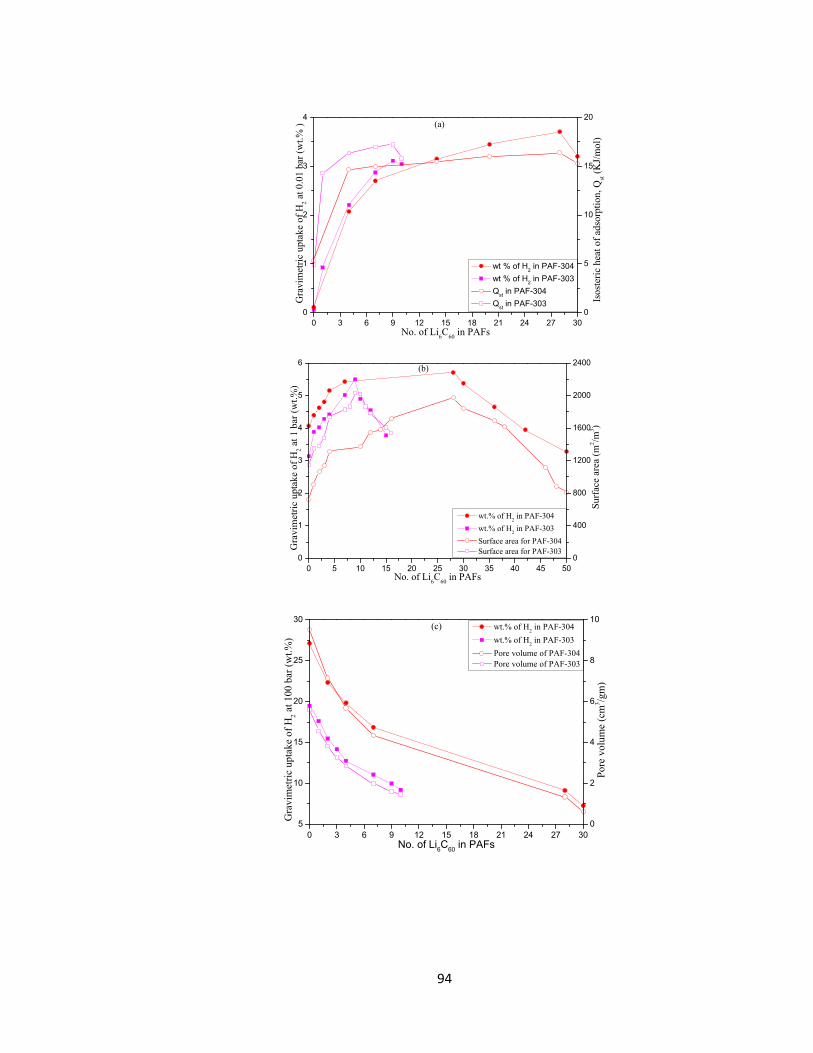
0 3 6 9 12 15 18 21 24 27 300
1
2
3
4
(a)
wt % of H2 in PAF-304 wt % of H2 in PAF-303 Qst in PAF-304 Qst in PAF-303
No. of Li6C60 in PAFs
Gra
vim
etric
upt
ake
of H
2 at 0
.01
bar (
wt.%
)0
5
10
15
20
Iso
ster
ic h
eat o
f ads
orpt
ion,
Qst (K
J/m
ol)
0 5 10 15 20 25 30 35 40 45 500
1
2
3
4
5
6 (b)
wt.% of H2 in PAF-304 wt.% of H2 in PAF-303 Surface area for PAF-304 Surface area for PAF-303
No. of Li6C60 in PAFs
Gra
vim
etric
upt
ake
of H
2 at 1
bar
(wt.%
)
0
400
800
1200
1600
2000
2400
Sur
face
are
a (m
2 /m3 )
0 3 6 9 12 15 18 21 24 27 305
10
15
20
25
30
(c) wt.% of H2 in PAF-304 wt.% of H2 in PAF-303 Pore volume of PAF-304 Pore volume of PAF-303
No. of Li6C60 in PAFs
Gra
vim
etric
upt
ake
of H
2 at 1
00 b
ar (w
t.%)
0
2
4
6
8
10
Pore
vol
ume
(cm
3 /gm
)
94

Figure 5.14: Structure-property relationships between gravimetric H2 uptake, Li6C60
loading and (a) heat of adsorption at 0.01 bar, (b) surface area at 1 bar and (c) pore volume
at 100 bar.
Furthermore, surface area correlates with gravimetric uptake at 1 bar, Figure 5.14 (b). A
maximum surface area (m2/m3) of 1971 and 2033 is achieved for PAF-304 and PAF-303,
respectively, with a corresponding no. of Li6C60 of 28 and 9. Therefore the maximum H2
uptake at this pressure is a result of maximizing surface area. It is clear that the bigger the
surface area, the higher the gravimetric uptake (in this pressure range).
Pore volume correlates with H2 uptake at 100 bar, see Figure 5.14 (c). At 100 bar, as we
impregnate more Li6C60 the pore volume decreases. This decreasing trend is also observed
in the case of gravimetric uptake at high pressure, because at high pressure the hydrogen
density is already at a maximum and therefore the available void space is critical. As a
result, we obtain excellent correlation at 100 bar.
It is worth noting that these relationships were first observed by Frost et al.[361] by varying
the ligand length of MOFs. Frost et al. also observed the effect of heat of adsorption,
surface area and pore volume at different pressures. Here we have confirmed these trends
with impregnation that can be understood as an inverse action to the ligand extension of
Frost et al., where Frost et al. increased pore volume with modification while we decrease
pore volume with modification. In addition to these structural parameters, the pore size
distribution (calculated using Zeo++[353]) shows that the large pores are gradually filled
with lithiated fullerenes creating smaller pores and wider size distributions, see Figure 5.2.
For example, the empty PAF-303 pore of 21 Å becomes filled after impregnation, creating
95

smaller pores ranging from 6 to 16 Å. This also explains the high heat of adsorption with
loading and the high uptake and low pressures.
0 4 80
10
20
30
40
50
60(a)
0.01 bar 1 bar 100 bar Surface area
No. of Li6C60 in PAFs-303
Vol
umet
ric u
ptak
e of
H2 (
g/L)
0
500
1000
1500
2000
2500
3000
Surf
ace
area
(m2 /m
3 )
0 5 10 15 20 25 300
10
20
30
40
50
60(b)
0.01 bar 1 bar 100 bar Surface area
No.of Li6C60 in PAFs-304
Vol
umet
ric u
ptak
e of
H2 (
g/L)
0
500
1000
1500
2000
2500
3000
Sur
face
are
a (m
2 /m3 )
Figure 5.15: Structure-property relationships between volumetric H2 uptake, Li6C60 loading
with surface area for (a) PAF-303 and (b) PAF-304.
96

0 20 40 60 80 100
2
4
6
8
10
12
14
16
Isos
teric
hea
t of a
dsor
ptio
n,Q
st(K
J/m
ol)
Pressure(bar)
No.of Li6C60 in PAF 0 28 0 9
Figure 5.16: Isosteric heat of adsorption, Qst with respect to pressure for PAF-303 and
PAF-304. Magenta represents PAF-303 and red represents PAF-304.
Interestingly, for volumetric uptake as shown in Figure 5.15, surface area correlates with
uptake at all pressures (ranging from 0.01 bar to 100 bar). As a general trend, the
volumetric uptake is enhanced with increased volumetric surface area for all pressures. By
impregnating the PAF with lithiated fullerenes the available surface area for hydrogen
adsorption is increased. Since the hydrogen density on the surface is much greater than in
the gas phase, there is a continual benefit from incorporating lithiated fullerenes.
Finally, we calculated the volumetric uptake of H2 in bare PAF-304 and impregnated 28
Li6C60@PAF-304 with varying temperature from 50 to 300 K, see Figure 5.17. Above the
critical temperature (33 K) H2 density increased rapidly with pressure. In the cryogenic
temperature range (50 – 150 K) the volumetric uptake increases with the impregnation of
Li6C60. At high pressure and high temperature (243 K) we found a highest uptake of 23.5
97

g/L for 28 Li6C60@PAF-304, whereas for bare PAF the value is 9.56 g/L. These results
demonstrate the benefit of impregnation across all pressures and temperatures. Results such
as these are critical for material and process optimization for industrial scale applications.
50
100
150
200
250
300
0
10
20
30
40
50
60
0
20
40
60
80
100
(a)
Hydrogen D
ensity (g/L)
Pressure (b
ar)Temperature (K)
0.0
7.0
14.0
22.9
27.9
34.9
41.9
48.8
58.8
50
100
150
200
250
300
0
10
20
30
40
50
60
0
20
40
60
80
100
(b)
Hydrogen D
ensity (g/L)
Pressure (b
ar)Temperature (K)
0.0
7.0
14.0
22.9
27.9
34.9
41.9
48.8
58.8
Figure 5.17: H2 volumetric uptake with respect to temperature and pressure for (a) bare
PAF-304 and (b) 28 Li6C60@PAF-304.
98

5.4 Conclusions
The adsorption of hydrogen within Li6C60 impregnated PAF materials have been
investigated via GCMC simulation, with the goal of reaching the DoE capacity targets for
on-board hydrogen storage at cryogenic temperature (not within DoE specifications).
Despite an apparent loss of free volume related to pore filling by lithiated fullerenes, the
adsorption capacity was increased at low pressures for gravimetric uptake and increased at
all pressures for volumetric uptake. This improvement strategy may remove the need for
high pressure vessels. The incorporation of Li6C60 in PAF-303 and PAF-304 exceeds the
2017 DoE gravimetric target at a low 1 bar and reaches the 2017 DoE volumetric target at a
pressure range of 10 – 20 bar at cryogenic conditions. Although the capacity targets seem
achievable, the operating conditions are outside of the DoE prescriptions. The idea of
incorporation of Li6C60 inside the PAF-303 and PAF-304 opens a new avenue for the
design, composition and fabrication of highly porous materials with exceptional capacity
for hydrogen storage and other applications.
99

Chapter 6
Porous Aromatic Frameworks Impregnated with Fullerenes for
Enhanced Methanol/Water Separation
6.1 Introduction
In this chapter we incorporate fullerenes (C60) within Porous Aromatic Frameworks (PAFs)
by molecular simulation techniques which remarkably enhances methanol uptake while
inhibiting water uptake. The highest selectivity of methanol over water is found to be 1540
at low pressure (1 kPa) and decreases gradually with increasing pressure. The adsorption of
water is very small compared to methanol, a useful material property for membrane and
adsorbent-based separations. Grand Canonical Monte Carlo (GCMC) simulations are
utilized to calculate the pure component and mixture adsorption isotherms. The water and
methanol mixture simulations show that water uptake is further inhibited above the pure
component results because of the dominant methanol adsorption. Molecular Dynamics
(MD) simulations confirm that water diffusivity is also inhibited by strong methanol
adsorption in the mixture. Overall this study reveals profound hydrophobicity in C60@PAF
materials and recommends C60@PAFs as suitable applicants for adsorbent and membrane-
based separations of methanol/water mixtures and other alcohol/water separation
applications.
The separation of methanol/water (CH3OH/H2O) mixtures is an important process in many
100

industrial applications. Conversion of methanol to gasoline produces a large amount of
water as a reaction byproduct which must be removed [362]. For large scale methanol
production from natural gas, water is also a byproduct from which methanol recovery
systems are required [362]. In general, distillation can be used to remove these organic
compounds from water. But if the organic concentrations are very low or the organic
compounds are thermally sensitive then distillation is not economically suitable [274].
Alternative technologies such as adsorbent and membrane-based separations can be more
energy efficient than traditional distillation techniques [275].
Pervaporation is a membrane separation process which is simple and avoids the problems
associated with traditional technologies. It can remove organic solvents from aqueous
solutions by the selective transport of the organic phase [363]. Selective transport relies on
the difference in diffusivity and solubility (or adsorption uptake) of the organic and
aqueous components within the pore network of the membrane material [275]. Another
material-based separation technology is the adsorbent-based system, whereby large
columns are filled with materials such as zeolites or activated carbons which capture a
component of the mixture as it flows through [364]. A desorption stage is then followed
with a pressure or temperature-swing. Both separation techniques require material
characteristics that are favorable for the adsorption and diffusion of one component over its
counterpart [365].
Due to their high surface areas, tunable pore sizes and stability under pressure-swing and
temperature-swing conditions, PAFs have attracted considerable interest in the last 5 years
for the adsorption and separation of gases [86, 114, 321, 366, 367].
101
Membranes are generally diffusion-based while adsorbents are adsorption-controlled.
Zheng and co-workers [368] found from their molecular dynamics simulations that the
transport of a mixture of water and methanol through hydrophobic tubes is faster than
through hydrophilic nanotubes due to a hydrogen network. Palinkas et al.[369] had used a
flexible three-site methanol model for the calculation of self-diffusivity of bulk methanol at
286 K. In addition there are some recent studies that have investigated the adsorption and
diffusion of water and alcohols in Metal-Organic Frameworks (MOFs) [370-373]. Chen et
al.[374] have investigated adsorption and separation of CH3OH/H2O by integrating
experiment and simulation for Zn(BDC)(TED)0.5, a highly hydrophobic MOF. They have
reported that H2O adsorption is vanishingly small compared to the strong adsorption of
CH3OH. The highest selectivity of CH3OH over H2O at 1 kPa is approximately 20 and
decreased with increasing pressure. Nalaparaju et al.[370] have performed MD simulation
to calculate adsorption of water and alcohols in hydrophilic and hydrophobic Zeolitic
MOFs (ZMOFs). For hydrophilic Na-rho-ZMOF framework water adsorption increases
continuously with increasing pressure and replaces alcohols competitively at high
pressures. Again, for hydrophobic ZIF-71, alcohols are selectively adsorbed at low
pressures but exceeded by water with increasing pressure.
Based on these previous studies, we propose that fullerene-impregnated PAFs are good
candidates for the separation of CH3OH/H2O mixtures and other alcohol or organic/water-
based separations, as illustrated in Figure 6.1. PAFs and fullerenes are both inherently
hydrophobic and their combination will offer the further tuning of porosity to enhance
separations. Due to the hydrophobic nature of the composite and the hydrophobic solvent
102

carbon disulfide, impregnation is feasible and the volatility of the solvent means it can be
easily removed under dynamic vacuum and thermal treatment. This has been
experimentally confirmed within our group and will be subject of a future article.
In this chapter we also aim to understand the adsorption and diffusion behavior of methanol
and water mixtures within the composite material using molecular simulation techniques.
The simulation technique to examine the adsorption and separation of the CH3OH/H2O
mixture in fullerene-impregnated PAF-30X (X=2-4) is investigated in this work. Our main
objective is to present a clear understanding of sorption behavior in these PAFs at a
molecular level. In the spirit of our previous work [187], we also aim to provide
experimental guidelines for the optimal impregnation amount of fullerenes to maximize
separation performance.
Figure 6.1: Schematic of porous aromatic frameworks formed with various ligands and
then impregnated with fullerenes.
103

6.2 Simulation Models and Methods
6.2.1 Adsorption Model
In this work the PAF structures were constructed according to Lan et al.[114] The
structures include PAF-30X (X=1-4), where 3 means 3D structure and X denotes the
number of phenyl rings used to replace the C-C bond of a diamond morphology as
described in chapter 5. Each unit cell was constructed using the Forcite module of the
Materials Studio package with cubic periodic boundaries [351]. Fullerenes (C60) were
randomly inserted within the PAF unit cell followed by geometry optimization, forming the
nC60@PAF composite. In reality, PAFs are generally amorphous systems with local order
and therefore the crystal model is a good approximation of the system. Interpenetration is
likely to occur for long ligands which are likely to exhibit similar adsorption behavior to
impregnation, though the pore shapes will be quite different.
The prediction of CH3OH and H2O uptake inside the nC60@PAF structures was calculated
by the Grand Canonical Monte Carlo (GCMC) routine. GCMC simulations were carried
out for the adsorption of mixtures and single components in the framework with a modified
Dreiding force field (Table 6.1) within the Materials Studio package [375, 376]. As a
widely used technique to simulate adsorption, GCMC allows us to relate the chemical
potentials of adsorbate in both adsorbed and bulk phases. In this method, the sorbate
structures (CH3OH and H2O) and the sorbent structure (nC60@PAF) are treated as rigid.
The rigid model has proved accurate in many MD simulation studies [377-380] and it is
suitable to reproduce the critical parameters and saturated liquid densities of alcohol [381].
104

Trial addition, deletion, translation and rotation moves of the CH3OH and H2O molecules
are repeated and accepted/rejected based on the Grand Canonical ensemble at specific
temperature and pressure. 107 trial moves were used for equilibration and another 107
moves for production steps for ensuring an accurate average.
Table 6.1: Force field parameters for the PAF and fullerene. Lorentz-Berthelot mixing rules
are implemented between the abdsorbate atoms listed here and the adsorbent atoms listed in
Table 6.2.
For H2O and CH3OH adsorption simulation in PAFs and nC60@PAFs, we only considered
the electrostatic interactions of the atoms in the H2O and CH3OH molecules and ignored
the atomic charges of the PAFs and nC60@PAFs which are found to be negligible. Yang et
al.[383] have investigated the effect of charge on PAFs for CO2 storage and separation in
Species Reference
Site 𝜎 (Å) 𝜀 𝑘𝐵⁄ (K)
PAF C_2 3.898 0.0951 [376]
C_3 3.898 0.0951
H___A 3.195 0.001
C60 𝐶_𝑅 3.431 0.07 [382]
105

PAFs. They compared their results with Babarao et al.’s data considering the atomic
charges of the PAFs [162] Their results were close to the experimental data and Babarao et
al.’s results indicating that charges are negligible. We have also tested the effect of charge
for adsorption data of an equimolar mixture of H2O and CH3OH and found there is minimal
effect (See Figure 6.10 and 6.11). Therefore, it is not necessary to consider the atomic
charges for the nanoporous materials without metal or heavy atoms.
H2O was mimicked by the three-point transferable interaction potentials (TIP3P) model
[374]. The O-H bond length was 0.9572 Å and the angle between H and O-H was 104.52°.
Previous research shows that the TIP3P model always offers accurate interaction potentials
compared to experimental values of adsorption [384-386]. TIP3P was used here because of
its simplicity, accuracy and computational efficiency. The electrostatic interaction of H2O
and CH3OH followed Coulomb’s law and the dispersion and repulsion forces were
calculated by the Lennard-Jones potential,
𝑈𝑖𝑗(𝑟) = � 4𝜀𝛼𝛽 ��𝜎𝛼𝛽𝑟𝛼𝛽
�12
− �𝜎𝛼𝛽𝑟𝛼𝛽
�6
� +𝑞𝛼𝑞𝛽
4𝜋𝜀0𝑟𝛼𝛽𝛼𝜖𝑖𝛽𝜖𝑗
(6.1)
Where 𝑈𝑖𝑗 is the internal energy, 𝑟𝛼𝛽 is the distance between two atoms, 𝜎𝛼𝛽 and 𝜀𝛼𝛽 are
collision diameter and potential well depth, respectively, and 𝑞𝛼 and 𝑞𝛽 are partial charges
located at site 𝛼 and 𝛽 respectively. The long range Coloumbic forces were handled by
Ewald summation technique for all of our calculations. Lorentz-Berthelot mixing rules has
been used to calculate the interaction between H2O and CH3OH with C60@PAFs [387]. The
106

set of parameters for the CH3OH model were adopted from the transferable potentials for
phase equilibria force field and summarized in Table 6.2 [388]. This three site model has
been used to predict a range of properties that are in good agreement with the available
experimental values [378, 381, 389-391]. The classical level of theory is used in this study
without the inclusion of quantum or polarisation effects. It is unlikely that mirror charges
will form from polarisation effects because the assigned charges are relatively weak.
6.2.2 Diffusion Model
Diffusion (or diffusivity) is predicted using a series of molecular dynamics simulations
based on Newton’s laws of motion. The same modified Dreiding force field has been
implemented as described above. For the H2O model, we have used the same TIP3P model
as described above for adsorption. The force field for CH3OH was tested at bulk phase
conditions to compare with experimental bulk diffusivity values. For non-bonded
interactions between molecules a spherical cutoff radius of 0.9 nm was used in all cases.
The amount of guest molecules and fullerenes within the material was determined from the
previous adsorption simulations. In this study the fullerenes are considered fixed during the
molecular simulation. Previous studies have suggested that the binding energy of fullerenes
within the material is strong enough to hold the fullerenes in place [392]. In the NVT
ensemble, the Nose-Hoover thermostat was used with an average temperature of 303 K at
fixed cell volume and number of atoms within a fully periodic system [393]. The molecular
dynamics time step was 1 fs for a total of 1ns, and the temperature coupling was iterated at
0.1 ps. The self-diffusion coefficient was calculated from the mean square displacement of
the particles using the Einstein relation,
107

D = �𝐫(t)− 𝐫(0)�2/6t (6.2)t→∞
lim
where r(t) denotes the position vector of a molecule at time t.
Table 6.2: Force field parameters for H2O and CH3OH [374].
Species
LJ and Coulombic potential Bond length
(Å) Bending angle
site 𝝈 (Å) 𝜺 𝒌𝑩⁄ (K) q(e)
H2O O 3.151 76.47 -0.834 𝑟𝐻−𝑂 =
0.9527
𝜃∠𝐻𝑂𝐻 =
104.52° H 0 0 +0.417
CH3OH
CH3 3.775 104.17 +0.265 𝑟𝐶𝐻3−𝑂 =
1.4246
𝑟𝑂−𝐻 =
0.9451
𝜃∠𝐶𝐻3𝑂𝐻 =
108.53° O 3.071 85.85 -0.700
H 0 0 +0.435
108

6.3 Results and Discussion
Figure 6.2 shows the single-component adsorption of H2O in (a) PAF-302, (c) PAF-303
and (e) PAF-304, and CH3OH in (b) PAF-302, (d) PAF-303 and (f) PAF-304 at 303 K. All
materials adsorb much more CH3OH than H2O. More importantly, CH3OH uptake
increases with fullerene loading while H2O uptake decreases with fullerene loading.
Therefore the incorporation of fullerenes will increase the selective ability of the
framework. The highest H2O adsorption is 0.46 mmol/g within PAF-304 with no fullerenes
because of the large amount of pore volume. In contrast, the highest CH3OH adsorption is 2
mmol/g within PAF-304 along with 104 fullerenes where organophilicity is maximized by
a large amount of hydrophobic surface area. The key to maximizing separation efficiency is
to increase both selectivity and uptake, as will be explored further in this chapter.
0 20 40 60 80 1000.00
0.05
0.10
0.15
0.20
H2O
upt
ake
(mm
ol/g
)
P(kPa)
17 C60@PAF-302 2 C60@PAF-302 1 C60@PAF-302 PAF-302
(a)
0 20 40 60 80 1000.0
0.4
0.8
1.2
CH
3OH
upt
ake
(mm
ol/g
)
P(kPa)
17 C60@PAF-302 2 C60@PAF-302 1 C60@PAF-302 PAF-302
(b)
109

0 20 40 60 80 1000.0
0.1
0.2
0.3
H2O
upt
ake
(mm
ol/g
)
P(kPa)
46 C60@PAF-303 17 C60@PAF-303 2 C60@PAF-303 1 C60@PAF-303 PAF-303
(c)
46 C60@PAF-303 17 C60@PAF-303 2 C60@PAF-303 1 C60@PAF-303 PAF-303
0 20 40 60 80 1000
1
2
3
CH
3OH
upt
ake
(mm
ol/g
)
P(kPa)
(d)
0 20 40 60 80 1000.00
0.25
0.50
H2O
upt
ake
(mm
ol/g
)
P(kPa)
104 C60@PAF-304 76 C60@PAF-304 2 C60@PAF-304 1 C60@PAF-304 PAF-304
(e)
104 C60@PAF-304 76 C60@PAF-304 2 C60@PAF-304 1 C60@PAF-304 PAF-304
0 20 40 60 80 1000
1
2
3
CH
3OH
upt
ake
(mm
ol/g
)
P(kPa)
(f)
Figure 6.2: Total adsorption of single component (a) H2O in PAF-302 (b) CH3OH in PAF-
302, (c) H2O in PAF-303 (d) CH3OH in PAF-303, (e) H2O in PAF-304 and (f) CH3OH in
PAF-304 at 303 K.
Figure 6.3 shows the equimolar adsorption of CH3OH/H2O from the simulated mixture
(50:50). Once again, CH3OH adsorption is much higher than that of H2O. The hydrophobic
structure of PAFs interacts more strongly with CH3OH. Figures 6.3a, 6.3b and 6.3c show
that the CH3OH loading increases with fullerene loading. For 1 C60@PAF-302 the highest
CH3OH adsorption is approximately 0.75 mmol/g. However, when incorporating PAF-302
110

with 17 C60’s, an optimum condition, the uptake increased to ~0.9 mmol/g. A similar
pattern of CH3OH adsorption is also observed for PAF-303 and PAF-304, when
impregnated with C60. The adsorption of CH3OH in PAF-303 and PAF-304 are 1.56 and
1.65 mmol/g respectively when incorporated with the optimum number of fullerenes,
namely 46C60@PAF-303 and 104C60@PAF-304, respectively. In these cases, the optimum
amount of fullerenes is the maximum loading, meaning that there is enough porosity to
adsorb significantly large amounts of methanol.
The mixture adsorption effect has more of a detrimental effect for H2O adsorption than for
CH3OH. CH3OH loading is approximately 1.94 mmol/g in 104 C60@PAF-304 compared to
the 1.65 mmol/g in mixture. On the other hand, there was a huge variation in H2O
adsorption for mixtures with a ~50 % decrease compared to the single-component
adsorption for all PAFs. Once again, the general trend of CH3OH adsorption is increasing
with fullerene impregnation for all PAFs. While for H2O adsorption the trend is in reversed
order i.e. fullerene impregnation inhibits adsorption. The negligible adsorption of H2O in
mixture is due to the relatively large amount CH3OH adsorption which blocks the available
adsorption sites for H2O.
111

No. of C60
in PAF-302 17 17 9 9 1 1 0 0
0 20 40 60 80 100 1200.00
0.25
0.50
0.75
1.00
mm
ol/g
P(kPa)
(a) No. of C60
in PAF-303 46 46 28 28 17 17 10 10 0 0
0 20 40 60 80 100 1200.0
0.4
0.8
1.2
1.6 (b)
mm
ol/g
P(kPa)
No. of C60
in PAF-304 104 104 76 76 46 46 29 29 0 0
0 20 40 60 80 100 1200.00
0.45
0.90
1.35
1.80 (c)
mm
ol/g
P(kPa)
Figure 6.3: Adsorption of an equimolar mixture of CH3OH/H2O at 303 K in (a) PAF-302
(b) PAF-303 and (c) PAF-304. Closed symbols are for CH3OH and open symbols are for
H2O.
The adsorption separation factor can be expressed as, 𝑆𝑖/𝑗 = (𝑥𝑖 𝑥𝑗⁄ )(𝑦𝑗 𝑦𝑖)⁄ , where 𝑥𝑖 and
𝑦𝑖 are the mole fractions of component 𝑖 in adsorbed phase and the bulk feed, respectively.
In this study, the feed molar fractions are identical and therefore the separation factor is
equal to the selectivity (= xi/xj). When comparing with other studies, the separation factors
are converted to selectivities using this relation. As shown in Figure 6.4a, the highest
selectivity of CH3OH over H2O is almost 1540, at 1 kPa for 17 C60@PAF-302. For 46
112

C60@PAF-303 and 104 C60@PAF-304 the highest selectivities are 1481 and 1432 at 1 kPa
(Figure 6.4b and 6.4c respectively). The selectivity decreased gradually with increasing
pressure. The reason behind this is the entropic effect [394]. The molecular size of H2O is
smaller than CH3OH which allows a more efficient packing into the structures at high
pressures. Meanwhile, a negligible selectivity is observed for all three bare PAFs with a
highest value of 3.18 for PAF-302 at 1 kPa. This is comparable to the theoretical non-
selective Knudsen selectivity value of 0.75. The selectivities showed a more enduring rise
upward with the impregnation of C60 at low pressure. As a result, we can achieve a
remarkable enhancement of selectivity in PAF-303 for an optimal number of fullerenes
(C60).
0 20 40 60 80 1001
10
100
1000
10000
Sele
ctiv
ity (S
CH3O
H/H
2O)
P (kPa)
No of C60 in PAF-302 0 1 2 9 17
(a)
0 20 40 60 80 100
1
10
100
1000
10000
Sele
ctiv
ity (S
CH3O
H/H
2O)
P (kPa)
No. of C60 in PAF-303 0 10 17 28 46
(b)
113

0 20 40 60 80 100
1
10
100
1000
10000
Sele
ctiv
ity (S
CH3O
H/H
2O)
P (kPa)
No. of C60 in PAF-304 0 29 46 76 104
(c)
Figure 6.4: Selectivity of an equimolar mixture of CH3OH/H2O at 303 K in (a) PAF-302
(b) PAF-303 and (c) PAF-304.
Figure 6.5 illustrates the selectivity vs CH3OH uptake which is a good indicator of
performance efficiency. The higher the selectivity, the fewer separation stages are required,
and the higher the CH3OH uptake the less material is required. Therefore an ideal material
sits in the high top right corner of this graph. It can be seen from Figure 6.3 that for all the
three PAFs, CH3OH uptake increases with pressure but at a loss of selectivity. This
phenomenon is also observed in the Robeson trade-off for polymer membranes [395],
where there are decreasing trends of gas selectivity with gas permeation. Fullerene
impregnation, however, completely breaks this trend and is capable of increasing
selectivity simultaneously with uptake. These results show that fullerene impregnation of
PAFs is a strategy for enhancing the separation efficiency of an adsorbent-based system.
We have also compared our simulated results with some of the highest CH3OH/H2O
selectivities of 1932 for ZSM-5 zeolite membrane [365], 1000 for P84 co-polyimide
membrane [396] and 20 for MOF adsorbent [374] respectively from the literature which are
114

represented by the dashed lines in Figure 6.5. These results show that our adsorption-
selective PAFs are amongst the highest performing separation materials.
0.01 0.1 1
10
100
1000
10000
C60 loading
Sele
ctiv
ity (S
CH
3OH
/H2O
)
Methanol (CH3OH) uptake (mmol/g)
No. of C60 in PAF-304 1 2 9 17
(a)
0.01 0.1 110
100
1000
10000(b)
C60 loading
Sele
ctiv
ity (S
CH3O
H/H
2O)
Methanol (CH3OH) uptake (mmol/g)
No. of C60 in PAF-303 9 10 17 28 46
0.1 1 1010
100
1000
10000 (c)
C60 loading
Sele
ctiv
ity (S
CH3O
H/H
2O)
Methanol (CH3OH) uptake (mmol/g)
No. of C60 in PAF-304 28 29 46 76 104
Figure 6.5: Selectivity vs CH3OH uptake at 303 K in (a) PAF-302 (b) PAF-303 and (c)
PAF-304, where dashed lines represent the selectivities (1932, 1000, 20) of the highest
performing materials in the literature [365, 374, 396].
We take a closer look at the adsorption behaviour within the fullerene-PAF composites
during simulation with molecular snapshots of the CH3OH/H2O mixture density in Figure
115

6.6. The highest performing materials are examined here, namely, (a) 17 C60@ PAF-302
(b) 46 C60@ PAF-303 and (c) 104 C60@ PAF-304. In every case there is a substantially
higher uptake of CH3OH over H2O, represented by the red and green dots, respectively. For
further clarification we also calculated the density of CH3OH and H2O within the pore
volume. For bare PAF-304 at 100 kPa the density of CH3OH within the pores is twice as
dense as the bulk phase (0.0854 mmol/cm3 within PAF-304, 0.04 mmol/cm3 bulk CH3OH
density) while the density of H2O within the pores is similar as the bulk phase (0.047
mmol/cm3 within PAF-304, 0.033 mmol/cm3 bulk H2O density). These values also indicate
that there are weak interactions between the H2O and bare PAF. For 104C60@PAF-304
these values are 6.8 and 0.6 mmol/cm3 respectively. Thus the hydrophobicity of the PAF
framework and the fullerene surfaces combined ensures an unfavourable environment for
the adsorption of water.
Figure 6.6: Snapshot of CH3OH/H2O adsorption uptake at 303 K and 100 kPa in (a) 17
C60@ PAF-302 (b) 46 C60@ PAF-303 and (c) 104 C60@ PAF-304, where green and red
dots are represent H2O and CH3OH density respectively.
116

At this point, the impregnated PAFs are excellent candidates for adsorbent-based
separations of methanol and water mixtures with enhanced selectivity and uptake. To
assess the feasibility of these materials for membrane-based separations, we must examine
their diffusion properties in addition to their adsorption properties [397]. In fact, a good
estimate of transport flux (permeation) is the product of adsorbent loading and diffusivity,
which is defined as the amount of molecules that pass through the material per time at a
given pressure gradient. This means that if adsorption doubles and diffusivity halves, then
the transport flux will remain constant. Therefore, we aim to maximize the transport flux of
methanol over water, by either increasing the adsorption selectivity, diffusion selectivity, or
both. Above we have observed an enormous increase in adsorption selectivity with
fullerene impregnation.
Transport properties of liquids within confined pores depend on the molecule size, the pore
size and the molecular interactions with the pore surface. Transport of mixtures is even
more complicated because of blocking effects and the mixed interactions between
components. The average number of hydrogen bonds per molecule for water and liquid
methanol is 3.50 and 2 respectively in the bulk phase [398, 399]. Within pores, these
hydrogen bonds are disrupted due to the competing interactions with the pore surface.
Hydrophobic pores such as nanotubes accelerate the diffusion of water because of the
disrupted water orientation and weak water-pore interactions. On the other hand, ultra-
small pores may confine water and inhibit the diffusion. The impregnation of PAFs with
C60, increases the hydrophobicity but also reduces the pore size.
117

The water and methanol self-diffusivities are calculated at bulk densities inside the bare
PAF structures according to the methodology outlined earlier. Water and methanol bulk
diffusivity was calculated as 5.21x10⁻⁹ and 1.97x10⁻⁹ m2/s respectively which are consistent
with the literature [398, 400, 401]. PAF-301 was incapable of hosting CH3OH at the
required densities and therefore has been omitted. In Figure 6.7, simulation results show
that the self-diffusion coefficients of both H2O and CH3OH molecules increase with the
increasing number of phenyl rings in the PAF structures. As expected, H2O diffusion is
greater in the PAF structures compared with the bulk diffusivity because of the
hydrophobicity effect within the channels as discussed earlier. Jei et al.[397] have also
reported that the transport of fluids inside the hydrophobic nanotubes is faster than fluids
inside hydrophilic nanotubes. The enhancement in diffusion is much more dominant for
H2O than CH3OH which agrees with the principle of fast transport inside hydrophobic
structures of increasing pore size. To explore the interactions and positions of CH3OH and
H2O within the PAF structures, the radial distribution function g(r) between the PAF-302
framework and the guest molecules are shown in Figure 6.8. A high peak in g(r) for
CH3OH is observed at r = 5 Å indicating a high density of CH3OH close to the PAF
surface, whereas no significant peaks exist for H2O indicating bulk-like behaviour. This
confirms that CH3OH interacts strongly with the PAF surface, forming a single adsorbed
layer, while H2O molecules interact weakly with the framework.
118

Figure 6.7: Self-diffusivity of H2O and CH3OH at 303 K in the available PAFs. Red
indicates the error in calculations.
2 4 6 8 10 12 14 16 18 20
g(r)
r(Å)
Methanol_PAF-304 Water_PAF-304
1
2
3
4
5
Figure 6.8: Radial distribution function g(r) between the PAF framework atoms and the
center of mass for CH3OH and H2O molecules during the mixed-gas molecular dynamics
simulations at 303 K.
The equimolar mixture diffusivity results of CH3OH and H2O demonstrates more complex
behaviour. Here we simulate the mixture diffusivity within the optimized C60@PAF
119

structures which exhibited high adsorption performance, namely 17 C60@PAF-302, 46
C60@PAF-303 and 104 C60@PAF-304 in Figure 6.9. There is a decrease in both CH3OH
and H2O diffusivity in the mixture system below the self-diffusivity simulated in the bulk
phase and bare PAFs. The CH3OH/H2O diffusion selectivity of the mixture is 0.06, 0.16
and 1.88 for 17 C60@PAF-302, 46 C60@PAF-303 and 104 C60@PAF-304, respectively.
Therefore the materials are more adsorption selective than diffusion selective. With the
combined effects of mixed adsorption and diffusion, a maximum flux selectivity of 2692
could be achieved which is above any reported membrane selectivity. Although higher
pressures would be required for a membrane-based operation. In summary, our calculations
predict that C60@PAF-based adsorbents and membranes would be strongly selective for
CH3OH over H2O as a result of the significant adsorption and diffusion selectivity.
0 1 2 3 4 5 60.0
0.5
1.0
1.5
2.0
104 C60PAF-304
46 C60PAF-303
Diff
usiv
ity S
elec
tivity
(SCH
3OH
/H2O
)
CH3OH diffusivity in Mixture (10-10m2/s)
17 C60PAF-302
Figure 6.9: Diffusivity selectivity versus CH3OH diffusivity in the mixture of CH3OH/H2O
at 303 K. Red indicates the error in calculations.
120

0 20 40 60 80 1000.00
0.07
0.14
0.21
0.28
0.35
mm
ol/g
Pressure (kPa)
CH3OH uptake in charge PAF-302 CH3OH uptake in uncharge PAF-302 H2O uptake in charge PAF-302 H2O uptake in uncharge PAF-302
Figure 6.10: Adsorption of an equimolar mixture of CH3OH/H2O at 303 K with PAF-302 with and without charges.
0 20 40 60 80 1000
1
2
3
4
5
Sel
ecti
vity
(SC
H3O
H/H
2O)
P (kPa)
Selectivity in charge PAF-302 Selectivity in uncharge PAF-302
Figure 6.11: Selectivity of an equimolar mixture of CH3OH/H2O at 303 K with PAF-302 with and without charges.
121

6.4 Conclusions
We have investigated the adsorption and diffusion of the CH3OH/H2O mixture by
molecular simulation in extensively hydrophobic C60@PAF structures. Despite the lack of
experimental results the simulated isotherms for pure components of CH3OH and H2O are
in good agreement with experimental results of MOF and ZIFs from the literature [374,
402]. The predicted adsorption selectivity of CH3OH over H2O is 1540 for 17 C60@PAF-
302 with an additional diffusivity selectivity of around 3000 due to the dominant CH3OH
adsorption. The hydrophobic properties of impregnated PAFs explain the negligible affinity
for H2O adsorption. The results show that the smaller pore volume of PAF-302 has a
stronger interaction with CH3OH compared to the other PAFs when impregnated with
C60’s. The high CH3OH adsorption selectivity at low pressure suggests that C60@PAF
could be successfully used for the purification of CH3OH from H2O within an adsorbent-
based separation system. Our simulations also predict that C60@PAF may have promising
properties for membrane-based separations that differentiate them in important ways from
other membrane separation technologies. As a result we can use less material for larger
selectivities (~2500) and higher production rates (~1 mmol/g), which makes them cost
effective compared to other materials.
122

Chapter 7
Porous Aromatic Frameworks Impregnated with Lithiated
Fullerenes for Natural Gas Purification
7.1 Introduction
In this chapter we computationally explore the separation of methane and carbon dioxide
using a new adsorbent consisting of lithium-decorated fullerenes (Li6C60) impregnated
within a series of porous aromatic frameworks (PAFs) of various pore sizes. Natural gas, a
lower emission alternative than its fossil fuel counterparts, requires the removal of carbon
dioxide, known as ‘sweetening’, prior to its use. The strong affinity of CO2 with the
impregnated frameworks, confirmed by density functional theory, leads to selective
adsorption over CH4. The impregnation can also double the CO2 adsorption capacity
compared to the bare PAF and increase selectivity of CO2/CH4 up to 48 for an optimum
amount of Li6C60, which is above the current industry benchmark. Overall, the study
reveals physical insights and proposes impregnated PAFs to be promising candidates for
CO2/CH4 separations for natural gas purification.
Natural gas as a vehicular fuel has a number of advantages both economically and
environmentally. Compared to other fossil fuels like gasoline or diesel, natural gas reduces
the amount of by-product of CO, CO2 and SO2 by 97, 24 and 90 % respectively [403, 404].
Natural gas contains a variable amount of methane (CH4) ranging from (27-95 %), with a
123
wide range of other components including CO2 depending on the source [405] (see world
reservoir Table 7.1). The presence of CO2 reduces the energy content of natural gas,
contributes to climate change and often leads to pipeline corrosion [403, 406]. In order to
prevent this and also to increase the commercial value of natural gas, it should meet
established purity specifications which are known as ‘pipeline-quality-methane’. To meet
this criteria the maximum amount of CO2 concentration cannot exceed 2 % [403]. In
addition, when natural gas is transported over great distances, the use of pipelines is too
expensive and inefficient, and therefore Liquefied Natural Gas (LNG) is a more efficient
form of transport [407]. In order to make LNG, the gas is cooled to cryogenic conditions.
During this process, the CO2 present can freeze and block pipeline systems which will
cause transportation issues [408]. In locations such as Germany (Central European
Pannonian basin) or South Australia (Cooper Eromanga basin) [409] this CO2
contamination exceeds 10 %. As a result it is critical to remove CO2 from natural gas for
economic, operational, safety and environmental reasons [410, 411].
124

Table 7.1: Composition of natural gas reservoirs across the world.
Reservoir CH4 C2 to C6
CO2 N2 H2 H2S He Reference
Greater Gorgon (Western Australia)
86.57-88
8-9 14-15
2-3 - - - [132, 412]
Kane (California, USA)
99.3 0.40 - 0.10 0.10 - 0.15
[413]
Sweetwater (Wyoming, USA)
75.60 1.30 2.70 20.20 - - 0.75
Newaygo (Michigan, USA)
85.50 1.60 0.40 12.40 - - 1.10
Spencer (Indiana, USA)
91.00 4.80 0.10 3.60 - - 0.14
Transylvanian Basin (Romania)
98-99 0.80 0.50 1-2 - - -
Slochteren (Netherlands)
81.30 3.50 0.80 14.40 - - -
Lacq (France) 74.00 2.00 9.00 - - 15.0 -
North German Plain
Up to 95.00
0.3-12
Up to 60.00
Up to 99.00
Up to 70.00
- -
Baden (Germany)
82.10 0.80 10.30 6.80 - - -
Groningen (Netherland)
81.30 4.9 0.90 14.30 - - - [404]
Uch 27.30 1.30 46.20 25.20 - - -
125

(Pakistan)
Uthmaniya (Saudi Arabia)
55.50 33.90 8.90 0.20 - 1.50 -
Ardjuna (Indonesia)
65.70 21.25 4.10 1.30 - - -
Pars (Iran) 89.24 3.53 3.28 1.70 - 0.66 - [414]
Waterton (Canada)
65.49 14.03 3.48 0.97 - 16.03 -
For the separation of CO2 from a CO2/CH4 mixture, various technologies are available,
such as chemical absorption [415, 416] thermal and pressure swing adsorption [417, 418],
cryogenic distillation [415] and membrane separation [419, 420]. Among these gas
separation techniques, adsorption-based separation has become a major gas separation tool
in industry due to its inherent simplicity, ease of control, and relatively low operating costs
[4, 405]. However, with the growing global demand for natural gas, separations must
become more efficient for natural gas to remain economically competitive above other
harmful fuel alternatives.
Several families of microporous materials have been considered for the selective adsorption
of CO2/CH4 mixtures such as zeolites, metal-organic frameworks, activated carbons, silica,
nanotubes and other inorganic structures [383, 406, 411, 421-424]. In industry for example,
the adsorption process has been successfully implemented across the USA for the recovery
of CH4 from landfill gases using zeolites [405, 425]. To further improve the performance of
these systems, adsorbents must adsorb more gas at higher selectivities while retaining
chemical, physical and thermal stability.
126

Porous Aromatic Frameworks (PAFs) were reported as a new family of ultra porous
materials with surface areas above 5000 m2/g, 5 times above that for zeolites and thus
capable of adsorbing copious amounts of gas. To date, most studies of adsorption in PAFs
have focused on gas storage applications, and it is known that capacities can be drastically
enhanced when the PAF surface is chemically functionalised [132, 138, 345, 426]. In
chapter 5 we considered PAFs for enhancing volumetric hydrogen storage at low pressure
[187]. Our work showed that the incorporation of lithiated fullerenes (Li6C60) in PAFs can
enhance the volumetric capacity of H2 from 12 to 44 g/L. Xuan et al.[427] have used C60
intercalated graphite for purification of CO2 from CH4 and calculated a selectivity of 8.
Here we consider PAFs impregnated with Li6C60 by enhancing volumetric surface area and
tuning the porosity for the separation of CO2 over CH4, shown schematically in Figure 7.1.
In this work, single component adsorption of CH4 and CO2 within Li6C60 impregnated
PAFs of various pore sizes at close to ambient conditions has been simulated. From the
single component isotherms, the adsorption behaviour of binary mixtures using the Ideal
Adsorbed Solution Theory (IAST) was obtained [149, 428]. Although this material may not
be economically feasible, the scientific principles underlying the performance enhancement
is of value. Structure-property relationships reveal the dominant structural characteristics
responsible for enhanced separation. Finally, performances are benchmarked with
conventional adsorbents.
127

Figure 7.1: Schematic of CO2/CH4 separation in Li6C60 impregnated PAF.
7.2 Models and Simulation
In this work the PAF structures were constructed following details outlined by Lan et al
[114] which is also described in chapters 5 and 6. Lithiated fullerenes were randomly
inserted within the PAF unit cell followed by geometry optimization.
Charges were assigned to each atom within the nLi6C60@PAF structures using Density
Functional Theory (DFT), see Figure 7.2. We followed the calculation details of Babarao et
al.[162]. DFT was implemented in DMol3 module of Materials Studio software based on
fragmental clusters[394]. The cleaved bonds of the cluster model were saturated by methyl
groups to maintain original hybridization. Double-ξ numerical polarization (DNP) with the
PW91 functional set was used in the DFT calculations. The basic principal of the DNP set
128

is that it incorporates p-type polarization into hydrogen atoms and d-type polarization into
heavier carbon atoms. The atomic charges calculated from DFT calculations were
evaluated by fitting to the electrostatic potential function using the Merz-Kollan (MK)
scheme [429, 430].
Figure 7.2: Charge assignment within the frameworks (a) PAF-302 (four types of carbon
and one type of hydrogen atom), (b) PAF-303 (eight types of carbon and two types of
hydrogen atom), (c) PAF-304 (eight types of carbon and two types of hydrogen atom) and
(d) Li6C60 (three types of carbon and one type of lithium atom).
129

The prediction of CO2 and CH4 uptake inside the nLi6C60@PAF structures were calculated
by the Grand Canonical Monte Carlo (GCMC) routine. GCMC has been used widely for
the simulated separation of CO2/CH4 mixtures [421, 424, 431-434]. CO2 was represented as
a three-site rigid molecule, and its intrinsic quadrupole moment was described by a partial
charge model. The partial charges on C and O atoms were qc = 0.576e and q0 = -0.288e,
respectively. The CO2- CO2 intermolecular interactions were modelled as a combination of
Lennard-Jones (LJ) and Coulombic potentials which is already defined in Eq.(6.1)
CH4 was represented by a united-atom model [435] with LJ potential parameters [62].
Lorentz-Berthelot mixing rules [436] were applied to calculate the interaction between
PAFs, lithium, fullerene, CO2 and CH4. The forcefields adopted were used previously and
have been compared with the experimental data, listed in Table 7.2 [318, 382, 437].
DFT calculations were performed with the Vienna Ab Initio simulation package (VASP)
[438] to calculate the CO2-PAF and CO2-Li6C60 binding energies. The projector augmented
wave (PAW) methods [439] were used to describe the core and valence electrons. The
Perdew-Burke-Ernzerhof (PBE) method [440] was used to describe electron exchange and
correlations. The DFT-D2 method [441] was applied for the long range van der waals
dispersion corrections. The Brillouin zone was sampled by centered gamma k-point mesh.
The binding energy was calculated according to the formula:
𝐸𝑏𝑖𝑛𝑑𝑖𝑛𝑔 = 𝐸𝑠𝑢𝑏𝑠𝑡𝑟𝑎𝑡𝑒+𝑔𝑎𝑠 − 𝐸𝑠𝑢𝑏𝑠𝑡𝑟𝑎𝑡𝑒− 𝐸𝑔𝑎𝑠 (7.1)
130

Table 7.2 Lennard-Jones and and Coulombic parameters. Here, CP3 and CP2 represent sp3 and
sp2 carbon atoms in all PAFs, respectively.
Species LJ and Coulombic potential Reference
Site 𝜎 (Å) 𝜀 𝑘𝐵⁄ (K) q(e)
CO2
C 2.789 29.66 +0.576 [374]
O 3.011 82.96 -0.288
CH4 C 3.73 148 0 [374]
CH4-C60 CCH4 − C60 3.5805 70.5
See Figure 7.2
[442]
CO2-C60 CCO2 − C60 3.11 32.33 [382]
OCO2 − C60 3.16 54.6
CH4-PAF
CCH4 − CP2 3.36 225.44
[443] CCH4 − CP3 3.90 80.52
CCH4 − HP 2.75 24.16
CO2-PAF CCO2 − CP2 3.8 69.44 [444]
Li-CH4 Li-CH4 2.89 59.88 [445]
131

GCMC simulations were carried out for the adsorption of single components within the
range of frameworks. As a widely used technique to simulate adsorption, GCMC allows the
comparison of adsorbate chemical potentials in both adsorbed and bulk phases. In this
method, the adsorbent structures were treated as a rigid body. 107 trial moves were used for
equilibration and another 107 moves for the production steps to calculate the average
amount of adsorbed gas molecules. In order to verify the forcefield, comparisons were
made to experimental single component CO2 isotherms [345] (Figure 7.3).
IAST has proven an effective method for predicting gas mixtures within a wide
variety of porous materials, such as zeolites [155, 421], MOFs [411, 446] and ZIFs
[424, 432, 447]. The method considers the spreading pressure of each gas upon a
uniform surface. Perez-Carbajo et al.[448] recently demonstrated that IAST could
reasonably describe the mixed adsorption of a five component mixture (CO2, CH4,
CO, N2 and H2) within a range of zeolites (FAU, MFI, MOR and DDR) up to 100
bar. Here the method was utilised to calculate the selectivity across a range of feed
composition ratios.
Li-CO2 Li-CCO2 2.4865 19.32
Li-OCO2 2.5975 32.31
132

7.3 Results and Discussion
The effect of Li6C60 impregnation upon adsorption up to 2 bar and 298 K is shown in
Figure 7.3 for CO2 and for CH4 in Figure 7.4 for (a) PAF-302, (b) PAF-303 and (c) PAF-
304. The trends are highlighted with arrows. CO2 uptake reaches a maximum at a particular
amount of Li6C60 whereas the CH4 uptake continually decreases with impregnation.
The maximum uptake of CO2 at 2 bar was found to be 15.6 mmol/g in PAF-302
impregnated with 1 Li6C60 molecules which is approximately a 100 % increase in
adsorption capacity compared to the bare PAF. The maximum CO2 uptake for PAF-303
and PAF-304 were 12 and 11.5 mmol/g with 10 Li6C60 and 27 Li6C60 respectively, which is
approximately a 98 % and 47 % increase compared to bare PAF-303 and PAF-304.
Moreover, the maximum numbers of impregnated Li6C60 that can fit within the PAF unit
cells are 6, 17 and 40 for PAF-302, PAF-303 and PAF-304, respectively.
There are two reasons for the maximum CO2 uptake at a particular loading. One reason is
that the highest N2 accessible volumetric surface area (m2/cm3) was reached at that
particular loading, shown in Figure 7.5. The second reason is that the interactions between
CO2 and Li6C60 are strong while for CH4 these interactions are negligible, shown in Figure
5. Therefore, the CO2 uptake increases with the increased surface area while CH4 uptake
does not benefit from the increased surface area and rather is inhibited by the loss in pore
volume.
The volumetric surface area was found to correlate with the CO2 uptake (Figure 7.5). Upon
impregnation of Li6C60 in all three PAFs, the surface area and the CO2 uptake both increase
133

up to a maximum level followed by a decrease with further Li6C60 loading. The maximum
volumetric surface areas of 2096, 2140 and 2109 m2/cm3 were achieved for PAF-302, PAF-
303 and PAF-304, respectively, with corresponding numbers of Li6C60 molecules of 1, 10
and 27. Therefore, the maximum CO2 uptake is a result of maximizing the volumetric
surface area with impregnation. Frost et al. [350] also observed structure-property
relationships that were pressure-dependent. These trends are confirmed here within the
medium to low range of pressures where impregnation and ligand extension allows the
control of both the surface area and pore volume.
The isosteric heat of adsorption (qst) for CO2 and CH4 is shown in Figure 7.6 (a) and (c)
respectively, and is directly related to the gas−framework interaction strength. The qst in
bare PAF-303 and PAF-304 for CO2 is in the range of 16 ~ 18 and 17 ~ 19 kJ/mol
respectively. While, for 10 Li6C60 PAF-303 and 27 Li6C60 PAF-304 this value reaches to a
maximum range of 39~41 and 41~43 kJ/mol respectively. These values are in agreement
with DFT-based calculations that predict a binding energy of 19 and 45 kJ/mol for CO2 on
PAF and Li6C60, respectively, see Figure 7.6 (b). These qst values of CO2 in impregnated
PAFs is much higher than CH4 qst values which are 17 and 18 kJ/mol for 10Li6C60 PAF-303
and 27Li6C60 PAF-304 respectively. These high differences in qst values also indicate the
promise for high selectivity of CO2 over CH4.
The Radial Distribution Function (RDF) between Li6C60 in PAF-304 and the guest
molecules is shown in Figure 7.7. A peak in g(r) for CO2 is observed at r = 4 Å indicating a
high density of CO2 close to charged Li6C60, whereas, no significant peaks exist for CH4,
indicating bulk-like gas behaviour. This confirms that CO2 interacts strongly with the
134

Li6C60 surface within the PAF, forming an adsorbed layer, while CH4 molecules interact
weakly. Considering this, an adsorbed layer which is denser than bulk gas phase will
enhance the overall uptake and will correlate directly with the available surface area. For
CH4 on the other hand, there is only bulk gas phase present which correlates with the
accessible pore volume that continually decreases with impregnation.
135
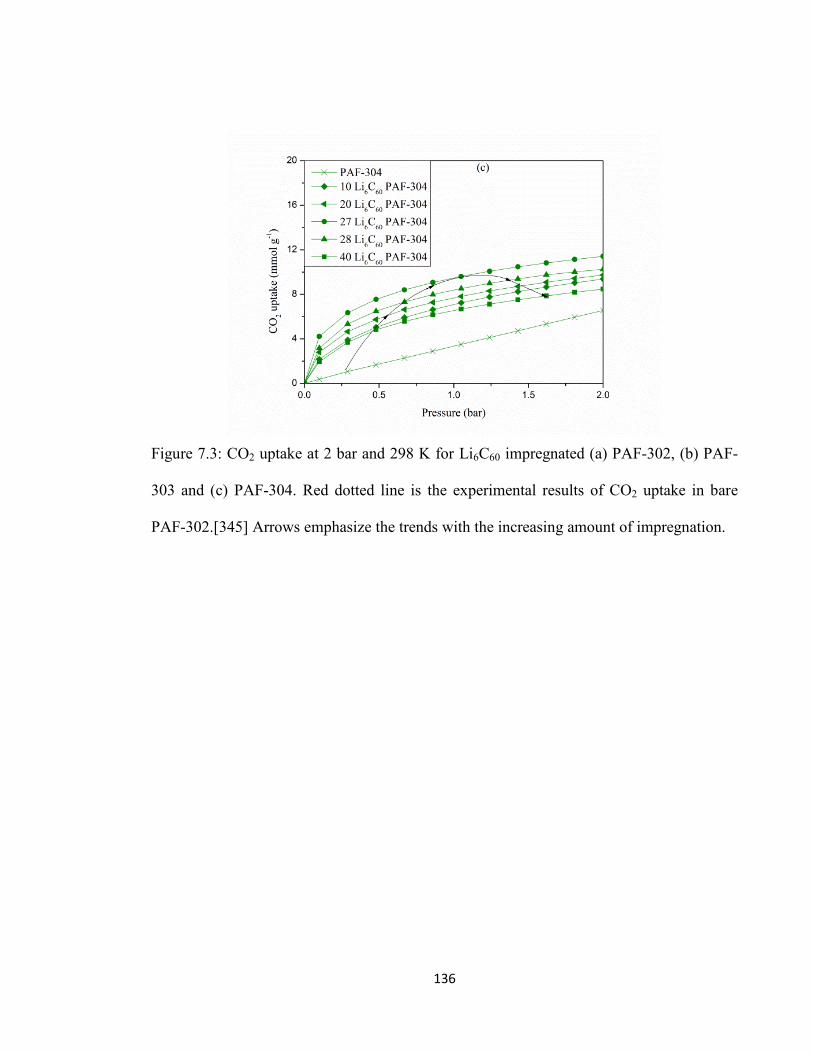
Figure 7.3: CO2 uptake at 2 bar and 298 K for Li6C60 impregnated (a) PAF-302, (b) PAF-
303 and (c) PAF-304. Red dotted line is the experimental results of CO2 uptake in bare
PAF-302.[345] Arrows emphasize the trends with the increasing amount of impregnation.
136

137

Figure 7.4: CH4 uptake at 2 bar and 298 K for Li6C60 impregnated (a) PAF-302, (b) PAF-
303 and (c) PAF-304. Arrows emphasize the trends with the increasing amount of
impregnation.
138

Figure 7.5: Structure property relationships among CO2 uptake, Li6C60 loading and
volumetric surface area at 2 bar and 298 K, Solid symbols are representing CO2 uptake in
PAFs and open symbols are representing the volumetric surface area of corresponding
PAFs.
139

Binding Energy19 kJ/mol
Binding Energy45 kJ/mol
(b)
140

Figure 7.6: (a) CO2 isosteric heats of adsorption with DFT-based binding energy values
(solid black symbols). (b) Strongest binding sites for CO2 on PAF and Li6C60 from DFT
calculations with binding energies. (c) Isosteric heats of adsorption of CH4 in bare PAFs
and impregnated PAFs.
(c)
141

Figure 7.7: Radial distribution function g(r) between the Li6C60 and the centre of mass for
CO2 and CH4 molecules.
142

0.0 0.5 1.0 1.5 2.00
5
10
15
20
25
30
Idea
l Sel
ectiv
ity (S
CO2/C
H4)
Pressure (bar)
27 Li6C60 PAF-304 10 Li6C60 PAF-303 1 Li6C60 PAF-302
Figure 7.8: Ideal selectivity of CO2/CH4 at 298 K and 2 bar.
The adsorption separation factor is defined by 𝑆𝑖/𝑗 = (𝑥𝑖 𝑥𝑗� )(𝑦𝑗 𝑦𝑖� ), where 𝑥𝑖 and 𝑦𝑖 are
the mole fraction of component 𝑖 in adsorbed phase and the bulk feed, respectively. For
ideal selectivity 𝑦𝑗𝑦𝑖� =1, and therefore, 𝑆𝑖/𝑗 = 𝑥𝑖 𝑥𝑗� . Here, the ideal gas selectivity for
CO2/CH4 was plotted against CO2 uptake in Figures 7.8 and 7.9 for pressures up to 2 bar.
This can be defined as a trade-off plot where a maximum selectivity along with a maximum
uptake is desired. The highest selectivities were observed for 27 Li6C60 PAF-304, 10 Li6C60
PAF-303 and 1 Li6C60 PAF-302. Both selectivity and uptake increased up to an optimum
number of Li6C60 loading and then decreased with further impregnation.
143

144

Figure 7.9: Ideal selectivity CO2/CH4 vs CO2 uptake at 298 K in Li6C60 impregnated (a)
PAF-302, (b) PAF-303 (c) PAF-304. Arrows emphasize the trends with the increasing
amount of impregnation.
0 2 4 6 8 1010
20
30
40
50
Selec
tivity
(SCO
2/CH 4)
CO2 uptake (mmol g-1)
50:50 40:60 30:70 20:80 10:90
(a)
145
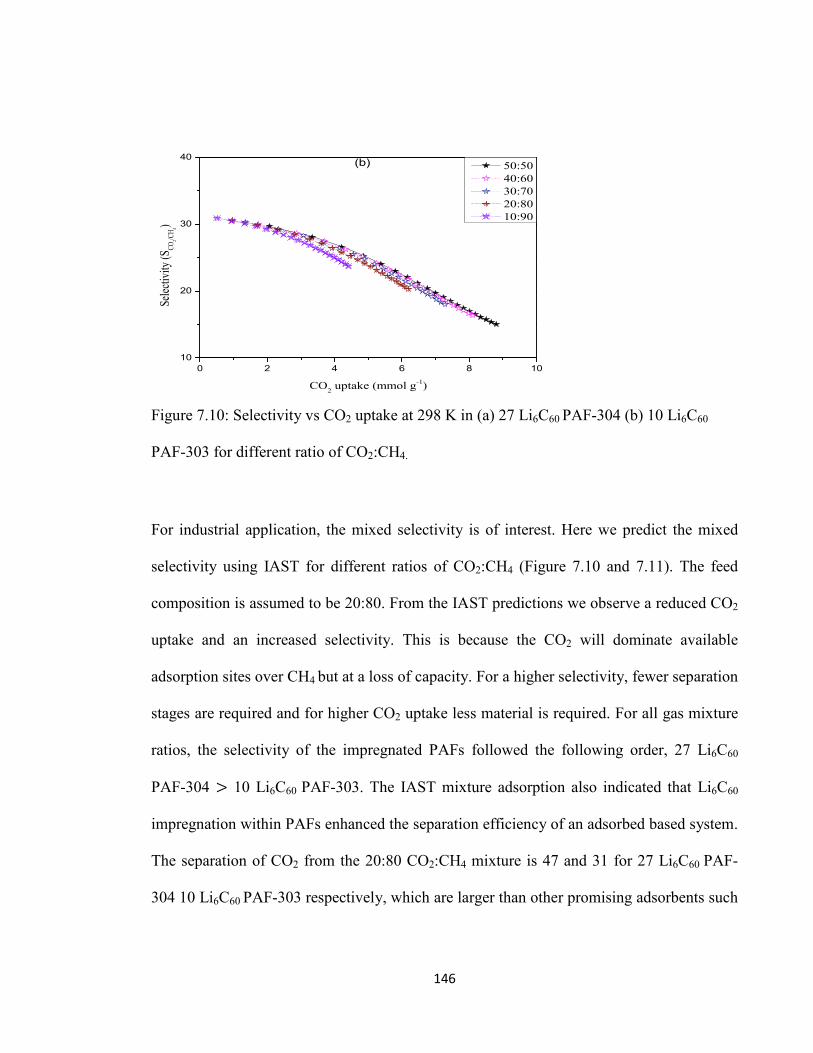
0 2 4 6 8 1010
20
30
40
Selec
tivity
(SCO
2/CH 4)
CO2 uptake (mmol g-1)
50:50 40:60 30:70 20:80 10:90
(b)
Figure 7.10: Selectivity vs CO2 uptake at 298 K in (a) 27 Li6C60 PAF-304 (b) 10 Li6C60
PAF-303 for different ratio of CO2:CH4.
For industrial application, the mixed selectivity is of interest. Here we predict the mixed
selectivity using IAST for different ratios of CO2:CH4 (Figure 7.10 and 7.11). The feed
composition is assumed to be 20:80. From the IAST predictions we observe a reduced CO2
uptake and an increased selectivity. This is because the CO2 will dominate available
adsorption sites over CH4 but at a loss of capacity. For a higher selectivity, fewer separation
stages are required and for higher CO2 uptake less material is required. For all gas mixture
ratios, the selectivity of the impregnated PAFs followed the following order, 27 Li6C60
PAF-304 > 10 Li6C60 PAF-303. The IAST mixture adsorption also indicated that Li6C60
impregnation within PAFs enhanced the separation efficiency of an adsorbed based system.
The separation of CO2 from the 20:80 CO2:CH4 mixture is 47 and 31 for 27 Li6C60 PAF-
304 10 Li6C60 PAF-303 respectively, which are larger than other promising adsorbents such
146
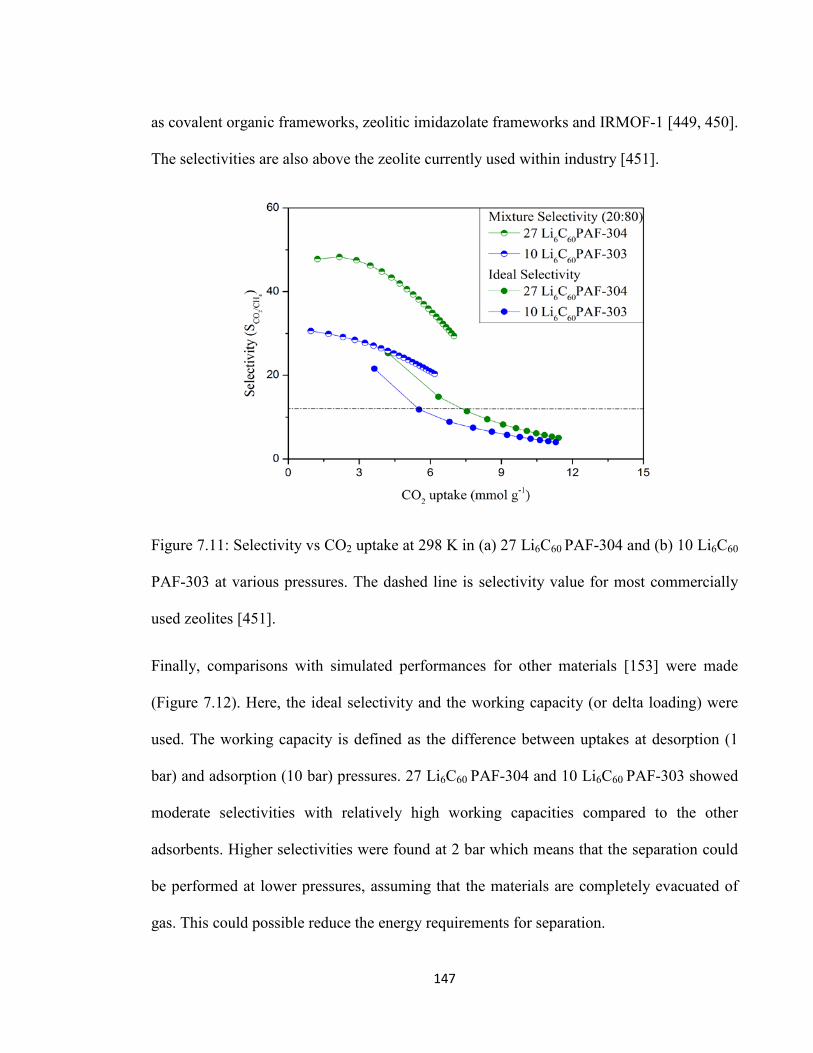
as covalent organic frameworks, zeolitic imidazolate frameworks and IRMOF-1 [449, 450].
The selectivities are also above the zeolite currently used within industry [451].
Figure 7.11: Selectivity vs CO2 uptake at 298 K in (a) 27 Li6C60 PAF-304 and (b) 10 Li6C60
PAF-303 at various pressures. The dashed line is selectivity value for most commercially
used zeolites [451].
Finally, comparisons with simulated performances for other materials [153] were made
(Figure 7.12). Here, the ideal selectivity and the working capacity (or delta loading) were
used. The working capacity is defined as the difference between uptakes at desorption (1
bar) and adsorption (10 bar) pressures. 27 Li6C60 PAF-304 and 10 Li6C60 PAF-303 showed
moderate selectivities with relatively high working capacities compared to the other
adsorbents. Higher selectivities were found at 2 bar which means that the separation could
be performed at lower pressures, assuming that the materials are completely evacuated of
gas. This could possible reduce the energy requirements for separation.
147

There is an apparent upper bound trend observed for all the adsorbents as highlighted by a
dashed line in Figure 7.11. For our materials, an increase in selectivity is associated with a
loss in working capacity. Within the membrane literature this has been correlated with the
size of the gas molecules. This may not be the case for adsorbents.
Figure 7.12: Adsorption selectivities vs. working capacity (adsorption cycle between 1 and
1 bar) for CO2/CH4 mixtures at 300 K in a variety of MOFs, zeolite and PAFs structures.
Dashed line highlights the upper bound trade-off trend.
7.4 Conclusion
The adsorption of CO2/CH4 mixtures has been investigated using molecular simulation for
Li6C60 impregnated PAF structures. The simulation isotherms for pure components of CO2
and CH4 are in good agreement with the literature [345]. The highest adsorption selectivity
148

for CO2 over CH4 is predicted as 47~48 for 27 Li6C60 PAF-304 and 30~31 for 10 Li6C60
PAF-303. The highest volumetric surface area correlated with the highest CO2/CH4
selectivity and the highest CO2 uptake at the optimal Li6C60 loading. The results show that
the available surface area within 27 Li6C60 PAF-304 and 10 Li6C60 PAF-303 offer stronger
adsorption sites for CO2 compared with CH4. The high CO2 adsorption selectivity at 2 bar
suggests that Li6C60@ PAF could be successfully used for natural gas (CH4) purification.
In comparison to other adsorbents, the impregnated PAFs showed moderate selectivities
with relatively high working capacities at standard operating conditions cycling between 1
and 10 bar. There is an apparent upper bound trade-off between selectivity and capacity
that the impregnated PAFs cannot overcome. Overall, the impregnated PAFs have tunable
surface areas and porosity to customize separation requirements.
149

Chapter 8
Conclusion and Outlook
In this chapter we draw some conclusions and suggest some future research directions.
8.1 Conclusion
In the past few decades gas storage and separation have become an important research
problem in the field of nanomaterials due to the revolutionary advancement in nanoscience
and technology. Development of this active research field is expanding rapidly, however
widespread application of nanomaterials still remains a challenge. This interest is driven by
both the desire to understand the nature of gas storage and separation in these nanoporous
materials and how to improve the properties of these materials in order to make them useful
for industrial and commercial applications.
In this thesis we have used molecular simulation to study gas capture in Porous Aromatic
Frameworks (PAFs). For this we have used the Materials Studio software package. This
software has been reliable for calculating gas adsorption in framework materials and also
has been matched with available experimental results.
150

In chapter 1, we have briefly discussed porous materials, their synthesis and use in gas
storage and separation. Comparing to other porous materials PAFs have better chemical
and physical stability. These make them prospective candidates for gas storage and
separation. These studies also revealed that PAFs have great potential application if the
functional groups are introduced onto the aromatic porous frameworks. Although
sometimes it is difficult to effectively synthesize these novel PAFs, the theoretical design
and simulation methods might introduce an effective guideline for the development of more
promising and attractive PAFs.
In chapter 2, we briefly discussed both experimental and simulated gas storage methods
along with hydrogen storage phenomena and prospective applications. Gases may be
densely stored within adsorbent materials containing porous networks in which the gases
enter and adsorb onto the available internal surface. Compressed, liquid phase,
chemisorption and physisorption are four general methods for gas storage. In our work we
generally consider physisorption gas storage where molecules are adsorbed onto a surface
of framework materials due to weak van der Waals (VDW) interactions. Heat of
adsorption, surface area and pore size are important factors for high gas adsorption. We
consider molecular simulations for adsorption calculations based on the Monte-Carlo
algorithm. Molecular simulation methods allow the prediction of the total amount of
adsorbed molecules (𝑁𝑡𝑜𝑡) within the adsorbent.
In chapter 3, we briefly introduced various gas separation processes and technologies
(experimental and simulation) along with separation mechanisms. The separation process is
defined as the transformation of a mixture of materials into two or more products with a
151

different composition from the original materials. Gas separation processes can be broadly
divided into membrane based and adsorption based separation. Though there are several
advantages associated with membrane based separation, there is growing interest for
exploring adsorption based separation processes. Our research on gas separation is also
based on the adsorption based separation process. In adsorption separation, gas molecules
are first attracted by adsorbent molecules, after which they concentrate on the adsorbent
surface, and finally isolate from the gas phase. Temperature swing adsorption cycles (TSA)
and pressure swing adsorption cycles (PSA) are the two important regeneration processes
of adsorption. For a particular application, the design and fabrication of adsorbents will
require modification of the structure and chemistry of the adsorbent. This can be done by
increasing the forces of one molecule to make it attractive compared to another, or, on the
basis of molecular size by modifying the pore sizes, to achieve greater access control to the
adsorbent surface. In chapters 6 and 7 we also tried to modified our PAF structures by
incorporating new materials in them for better adsorbent surfaces.
In chapter 4, we briefly described the Monte Carlo simulation method and its
implementation in the commercial Materials Studio software package. For atomistic
molecular simulation and modelling the Monte-Carlo (MC) algorithm is very useful for
simulating systems with many coupled degrees of freedom, such as fluids, disordered
materials, strongly coupled solids, and cellular structures. The Materials Studio software
(MS) package provides an integrated molecular modelling suite. For larger length and time
scales, the modules can generate new states at random which we are particularly interested
in. MC methods can be used in the MS package as a configurational sampling method or an
152
optimization tool. By using MC sampling, the Materials Studio Sorption module simulates
a framework–sorbate system. Metropolis and the configurational bias MC methods are used
for sampling. Both methods can be used for sampling (a) fixed loading canonical ensemble
and (b) fixed pressure grand canonical ensemble. The Fixed Loading module supports
‘Translation’, ‘Rotation’, ‘Regrowth’ and ‘Conformer’ steps. While in fixed pressure tasks,
apart from the above steps, an additional exchange step is also considered. For sorption
calculation these modules support a variety of force fields, including COMPASS, pcff,
cvff, Universal and Dreiding. We can also create modified new force fields by editing the
existing force field and apply them to simulations. Its improved modules can help us to
accurately calculate adsorption uptake and also help improve material properties for gas
storage and separation applications.
In chapter 5, we introduced a new concept for hydrogen storage of porous aromatic
frameworks (PAFs) impregnated with lithium-decorated fullerenes (Li6C60). The loading of
Li6C60 and the effect on adsorption of hydrogen (H2) was investigated by molecular
simulation. The impregnation of Li6C60 increases the heat of adsorption and surface area at
the cost of available pore volume. H2 volumetric uptake is shown to correlate with
volumetric surface area at all pressures while H2 gravimetric uptake correlates with heat of
adsorption at low pressures, surface area at moderate pressures and pore volume at high
pressures. The incorporation of Li6C60 in PAF-303 and PAF-304 exceeds the 2017 DoE
gravimetric target at a low 1 bar and reaches the 2017 DoE volumetric target at a pressure
range of 10 – 20 bar at cryogenic condition.
153

In chapter 6, we incorporate fullerenes (C60) within PAFs by GCMC techniques which
remarkably enhances methanol uptake while inhibiting water uptake. The adsorption of
water is very small compared to methanol, which is a useful material property for
membrane and adsorbent-based separations. The water and methanol mixture simulations
show that water uptake is further inhibited above the pure component results because of the
dominant methanol adsorption. We have also done Molecular Dynamics (MD) simulations
to further confirm that water diffusivity is also inhibited by strong methanol adsorption in
the mixture. Overall, we recommend C60@PAFs as suitable applicants for adsorbent and
membrane-based separations of methanol/water mixtures and other alcohol/water
separation applications.
In chapter 7, we incorporate lithium-decorated fullerenes (Li6C60) in PAF structures for
purification of natural gas. The strong affinity of CO2 with the impregnated frameworks,
confirmed by density functional theory, leads to selective adsorption over CH4. The
impregnation can also double the CO2 adsorption capacity compared to the bare PAF and
increase selectivity of CO2/CH4 up to 48 for an optimum amount of Li6C60, which is above
the current industry benchmark. Overall, the study reveals physical insights and proposes
impregnated PAFs to be promising candidates for CO2/CH4 separations for natural gas
purification.
154

8.2 Outlook
The adsorption of hydrogen within Li6C60 impregnated PAF materials have been
investigated via GCMC simulation, with the goal of reaching the DoE capacity targets for
on-board hydrogen storage systems. In this work we shed light on the cryogenic condition
but reaching the DoE target at high pressure is still an open question.
For methanol water separation we chose the TIP3P model of water. The simulation results
might slightly vary with other water models. However, due to lack of experimental data it
was not possible to compare with other water models. Therefore, the separation work with
other water models should be performed to make a more accurate conclusion. The
interaction parameters between fluids and solids might also be modified, as a small change
in them has been shown to result in a large effect on the separation of water from methanol.
For natural gas purification, we have used charged PAF frameworks. Charges were
assigned to each atom within the nLi6C60@PAF structures using Density Functional Theory
(DFT). For the methane (CH4) model we have used a united-atom model. We need further
investigation to consider a difference if an explicit atom model of CH4 is used.
Although this material may not be economically feasible, the scientific principles
underlying the performance enhancement is of value. Although, there is an apparent upper
bound trade-off between selectivity and capacity that the impregnated PAFs cannot
overcome, but still the impregnated PAFs have tunable surface areas and porosity to
customize separation requirements.
155

PAFs are a very new branch of porous materials for gas storage and separation. There is,
therefore, plenty of room for future research in understanding and modifying these
structures for other gas storage and separation and other industrial application.
156

References
[1] Davis ME. Ordered porous materials for emerging applications. Nature. 2002;417(6891):813-821. [2] Forster PM. Exploration of new transition metal based porous materials; 2005. [3] Férey G. Hybrid porous solids: Past, present, future. Chem Soc Rev. 2008;37(1):191-214. [4] Li J-R, Kuppler RJ, Zhou H-C. Selective gas adsorption and separation in metal–organic frameworks. Chem Soc Rev. 2009;38(5):1477-1504. [5] Kitagawa S, Kitaura R, Noro Si. Functional porous coordination polymers. Angew Chem Int Ed. 2004;43(18):2334-2375. [6] Furukawa H, Ko N, Go YB, Aratani N, Choi SB, Choi E, et al. Ultrahigh porosity in metal-organic frameworks. Sci. 2010;329(5990):424-428. [7] Sing KS. Reporting physisorption data for gas/solid systems with special reference to the determination of surface area and porosity (recommendations 1984). Pure and applied chemistry. 1985;57(4):603-619. [8] Rosi NL, Eckert J, Eddaoudi M, Vodak DT, Kim J, O'Keeffe M, et al. Hydrogen storage in microporous metal-organic frameworks. Sci. 2003;300(5622):1127-1129. [9] Galarneau A, Cambon H, Di Renzo F, Fajula F. True microporosity and surface area of mesoporous sba-15 silicas as a function of synthesis temperature. Langmuir. 2001;17(26):8328-8335. [10] Kitagawa H. Clamping device for cables and the like. Google Patents 1981. [11] Matranga KR, Myers AL, Glandt ED. Storage of natural gas by adsorption on activated carbon. Chemical engineering science. 1992;47(7):1569-1579. [12] Jacobs PA, Beyer HK, Valyon J. Properties of the end members in the pentasil-family of zeolites: Characterization as adsorbents. Zeolites. 1981;1(3):161-168. [13] Sircar S, Golden TC, Rao MB. Activated carbon for gas separation and storage. Carbon. 1996;34(1):1-12. [14] Leatherdale JW. Air pollution control by adsorption. Carbon Adsorption Handbook. 1978:371-387.
157
[15] Wankat PC. Large-scale adsorption and chromatography: CRC press Boca Raton, Florida; 1986. [16] Fuderer A, Rudelstorfer E. Selective adsorption process. Google Patents 1976. [17] Heimbach H, Juntgen H, Knoblauch K, Korbacher W, Munzner H, Peters W, et al. Process for the enrichment of gases. Google Patents 1977. [18] Knoblauch K, Richter E, Jüntgen H. Application of active coke in processes of so2 and nox removal from flue gases. Fuel. 1981;60(9):832-838. [19] Lu M-C, Agripa ML, Wan M-W, Dalida MLP. Removal of oxidized sulfur compounds using different types of activated carbon, aluminum oxide, and chitosan-coated bentonite. Desalination and Water Treatment. 2014;52(4-6):873-879. [20] Skår IF. Removal of triclocarban (tcc) and diethyl phthalate (dep) from greywater by adsorption onto activated carbon. 2014. [21] Jonas LA, Rehrmann JA. The rate of gas adsorption by activated carbon. Carbon. 1974;12(2):95-101. [22] Siriwardane RV, Shen M-S, Fisher EP, Poston JA. Adsorption of co2 on molecular sieves and activated carbon. Energ Fuel. 2001;15(2):279-284. [23] Mota J, Rodrigues A, Saatdjian E, Tondeur D. Dynamics of natural gas adsorption storage systems employing activated carbon. Carbon. 1997;35(9):1259-1270. [24] Chue K, Kim J, Yoo Y, Cho S, Yang R. Comparison of activated carbon and zeolite 13x for co2 recovery from flue gas by pressure swing adsorption. Ind Eng Chem Res. 1995;34(2):591-598. [25] Foster K, Fuerman R, Economy J, Larson S, Rood M. Adsorption characteristics of trace volatile organic compounds in gas streams onto activated carbon fibers. Chemistry of Materials. 1992;4(5):1068-1073. [26] Chiang Y-C, Chiang P-C, Huang C-P. Effects of pore structure and temperature on voc adsorption on activated carbon. Carbon. 2001;39(4):523-534. [27] Karanfil T, Kilduff JE. Role of granular activated carbon surface chemistry on the adsorption of organic compounds. 1. Priority pollutants. Environmental Science & Technology. 1999;33(18):3217-3224. [28] Srivastava N, Eames I. A review of adsorbents and adsorbates in solid–vapour adsorption heat pump systems. Applied Thermal Engineering. 1998;18(9):707-714.
158

[29] Ruthven DM. Principles of adsorption and adsorption processes: John Wiley & Sons; 1984. [30] Stöckel E. Synthesis of ultrahigh surface area polymer networks using tetrahedral monomers. University of Liverpool, 2011. [31] Lenza RF, Vasconcelos WL. Preparation of silica by sol-gel method using formamide. Materials Research. 2001;4(3):189-194. [32] Harris R, Wick AN. Preparation of silica gel for chromatography. Industrial & Engineering Chemistry Analytical Edition. 1946;18(4):276-276. [33] Smit B, Maesen TL. Molecular simulations of zeolites: Adsorption, diffusion, and shape selectivity. Chemical reviews. 2008;108(10):4125-4184. [34] Weitkamp J, Sing KSW, Schüth F. Handbook of porous solids: Wiley-Vch; 2002. [35] Barrer RM. Zeolites and their synthesis. Zeolites. 1981;1(3):130-140. [36] Zhdanov S. Some problems of zeolite crystallization. 1971. [37] Zhdanov SP, Khvoshchev N. Synthetic zeolites: CRC Press; 1990. [38] Barrer R, Kanellopoulos A. The sorption of ammonium chloride vapour in zeolites. Part i. Hydrogen chloride and ammonia. Journal of the Chemical Society A: Inorganic, Physical, Theoretical. 1970:765-775. [39] Meier W, Moeck H. The topology of three-dimensional 4-connected nets: Classification of zeolite framework types using coordination sequences. Journal of Solid State Chemistry. 1979;27(3):349-355. [40] Banerjee R, Phan A, Wang B, Knobler C, Furukawa H, O'Keeffe M, et al. High-throughput synthesis of zeolitic imidazolate frameworks and application to co2 capture. Science. 2008;319(5865):939-943. [41] Venna SR, Carreon MA. Highly permeable zeolite imidazolate framework-8 membranes for co2/ch4 separation. Journal of the American Chemical Society. 2009;132(1):76-78. [42] Igarashi H, Uchida H, Suzuki M, Sasaki Y, Watanabe M. Removal of carbon monoxide from hydrogen-rich fuels by selective oxidation over platinum catalyst supported on zeolite. Applied Catalysis A: General. 1997;159(1):159-169. [43] Ackley MW, Rege SU, Saxena H. Application of natural zeolites in the purification and separation of gases. Microporous Mesoporous Mater. 2003;61(1):25-42.
159

[44] Hutson ND, Rege SU, Yang RT. Mixed cation zeolites: Lixagy‐x as a superior adsorbent for air separation. AlChE J. 1999;45(4):724-734. [45] Smith A, Klosek J. A review of air separation technologies and their integration with energy conversion processes. Fuel Processing Technology. 2001;70(2):115-134. [46] Li Y, Perera S, Crittenden BD. Zeolite monoliths for air separation: Part 1: Manufacture and characterization. Chemical Engineering Research and Design. 1998;76(8):921-930. [47] Corma A. Application of zeolites in fluid catalytic cracking and related processes. Studies in surface science and catalysis. 1989;49:49-67. [48] Masuda T, Fukumoto N, Kitamura M, Mukai SR, Hashimoto K, Tanaka T, et al. Modification of pore size of mfi-type zeolite by catalytic cracking of silane and application to preparation of h< sub> 2</sub>-separating zeolite membrane. Microporous Mesoporous Mater. 2001;48(1):239-245. [49] Weitkamp J. Zeolites and catalysis. Solid State Ionics. 2000;131(1):175-188. [50] Cejka J, Corma A, Zones S. Zeolites and catalysis: Synthesis, reactions and applications: John Wiley & Sons; 2010. [51] Bhatia S. Zeolite catalysts: Principles and applications: CRC press; 1989. [52] Čejka J, Centi G, Perez-Pariente J, Roth WJ. Zeolite-based materials for novel catalytic applications: Opportunities, perspectives and open problems. Catalysis Today. 2012;179(1):2-15. [53] Bux H, Liang F, Li Y, Cravillon J, Wiebcke M, Caro Jr. Zeolitic imidazolate framework membrane with molecular sieving properties by microwave-assisted solvothermal synthesis. J Am Chem Soc. 2009;131(44):16000-16001. [54] Jacobs P, Flanigen E, Jansen J, van Bekkum H. Introduction to zeolite science and practice: Elsevier; 2001. [55] Breck DW. Zeolite molecular sieves: Krieger; 1984. [56] Reed T, Breck D. Crystalline zeolites. Ii. Crystal structure of synthetic zeolite, type a. J Am Chem Soc. 1956;78(23):5972-5977. [57] Xiubin H, Zhanbin H. Zeolite application for enhancing water infiltration and retention in loess soil. Resources, conservation and recycling. 2001;34(1):45-52.
160

[58] Kitagawa S. Metal–organic frameworks (mofs). Chem Soc Rev. 2014. [59] Li H, Eddaoudi M, O'Keeffe M, Yaghi OM. Design and synthesis of an exceptionally stable and highly porous metal-organic framework. Nature. 1999;402(6759):276-279. [60] Stock N, Biswas S. Synthesis of metal-organic frameworks (mofs): Routes to various mof topologies, morphologies, and composites. Chemical reviews. 2011;112(2):933-969. [61] Lin X, Telepeni I, Blake AJ, Dailly A, Brown CM, Simmons JM, et al. High capacity hydrogen adsorption in cu (ii) tetracarboxylate framework materials: The role of pore size, ligand functionalization, and exposed metal sites. J Am Chem Soc. 2009;131(6):2159-2171. [62] Eddaoudi M, Kim J, Rosi N, Vodak D, Wachter J, O'Keeffe M, et al. Systematic design of pore size and functionality in isoreticular mofs and their application in methane storage. Sci. 2002;295(5554):469-472. [63] Rowsell JL, Yaghi OM. Metal–organic frameworks: A new class of porous materials. Microporous Mesoporous Mater. 2004;73(1):3-14. [64] Janiak C, Vieth JK. Mofs, mils and more: Concepts, properties and applications for porous coordination networks (pcns). New Journal of Chemistry. 2010;34(11):2366-2388. [65] Zhou H-C, Long JR, Yaghi OM. Introduction to metal–organic frameworks. Chemical reviews. 2012;112(2):673-674. [66] Han SS, Mendoza-Cortés JL, Goddard Iii WA. Recent advances on simulation and theory of hydrogen storage in metal–organic frameworks and covalent organic frameworks. Chem Soc Rev. 2009;38(5):1460-1476. [67] Tranchemontagne DJ, Mendoza-Cortés JL, O’Keeffe M, Yaghi OM. Secondary building units, nets and bonding in the chemistry of metal–organic frameworks. Chem Soc Rev. 2009;38(5):1257-1283. [68] Dietzel PD, Panella B, Hirscher M, Blom R, Fjellvåg H. Hydrogen adsorption in a nickel based coordination polymer with open metal sites in the cylindrical cavities of the desolvated framework. Chem Commun. 2006(9):959-961. [69] Cavka JH, Jakobsen S, Olsbye U, Guillou N, Lamberti C, Bordiga S, et al. A new zirconium inorganic building brick forming metal organic frameworks with exceptional stability. J Am Chem Soc. 2008;130(42):13850-13851. [70] Férey G, Serre C, Mellot‐Draznieks C, Millange F, Surblé S, Dutour J, et al. A hybrid solid with giant pores prepared by a combination of targeted chemistry, simulation, and powder diffraction. Angewandte Chemie. 2004;116(46):6456-6461.
161

[71] Férey G, Mellot-Draznieks C, Serre C, Millange F, Dutour J, Surblé S, et al. A chromium terephthalate-based solid with unusually large pore volumes and surface area. Sci. 2005;309(5743):2040-2042. [72] Dan-Hardi M, Serre C, Frot T, Rozes L, Maurin G, Sanchez C, et al. A new photoactive crystalline highly porous titanium (iv) dicarboxylate. J Am Chem Soc. 2009;131(31):10857-10859. [73] Ahnfeldt T, Guillou N, Gunzelmann D, Margiolaki I, Loiseau T, Férey G, et al. [al4 (oh) 2 (och3) 4 (h2n‐bdc) 3]⋅ x h2o: A 12‐connected porous metal–organic framework with an unprecedented aluminum‐containing brick. Angewandte Chemie. 2009;121(28):5265-5268. [74] Zhang T, Lin W. Metal–organic frameworks for artificial photosynthesis and photocatalysis. Chem Soc Rev. 2014. [75] Ramaswamy P, Wong NE, Shimizu GK. Mofs as proton conductors–challenges and opportunities. Chem Soc Rev. 2014. [76] Barea E, Montoro C, Navarro JA. Toxic gas removal–metal–organic frameworks for the capture and degradation of toxic gases and vapours. Chem Soc Rev. 2014. [77] Van de Voorde B, Bueken B, Denayer J, De Vos D. Adsorptive separation on metal–organic frameworks in the liquid phase. Chem Soc Rev. 2014. [78] He Y, Zhou W, Qian G, Chen B. Methane storage in metal–organic frameworks. Chem Soc Rev. 2014. [79] Mueller U, Schubert M, Teich F, Puetter H, Schierle-Arndt K, Pastre J. Metal–organic frameworks—prospective industrial applications. J Mater Chem. 2006;16(7):626-636. [80] Ma S, Zhou H-C. Gas storage in porous metal–organic frameworks for clean energy applications. Chem Commun. 2010;46(1):44-53. [81] Farrusseng D. Metal-organic frameworks: Applications from catalysis to gas storage: John Wiley & Sons; 2011. [82] Yang H, Li J-R. Metal-organic frameworks (mofs) for co2 capture. Porous materials for carbon dioxide capture: Springer 2014, p. 79-113. [83] Cote AP, Benin AI, Ockwig NW, O'Keeffe M, Matzger AJ, Yaghi OM. Porous, crystalline, covalent organic frameworks. Sci. 2005;310(5751):1166-1170.
162

[84] Feng X, Ding X, Jiang D. Covalent organic frameworks. Chem Soc Rev. 2012;41(18):6010-6022. [85] Furukawa H, Yaghi OM. Storage of hydrogen, methane, and carbon dioxide in highly porous covalent organic frameworks for clean energy applications. J Am Chem Soc. 2009;131(25):8875-8883. [86] Han SS, Furukawa H, Yaghi OM, Goddard WA. Covalent organic frameworks as exceptional hydrogen storage materials. J Am Chem Soc. 2008;130(35):11580-11581. [87] Klontzas E, Tylianakis E, Froudakis GE. Hydrogen storage in 3d covalent organic frameworks. A multiscale theoretical investigation. J Phys Chem C. 2008;112(24):9095-9098. [88] Klontzas E, Tylianakis E, Froudakis GE. Hydrogen storage in lithium-functionalized 3-d covalent-organic framework materials. J Phys Chem C. 2009;113(50):21253-21257. [89] Srepusharawoot P, Scheicher RH, Moysés Araújo C, Blomqvist A, Pinsook U, Ahuja R. Ab initio study of molecular hydrogen adsorption in covalent organic framework-1. J Phys Chem C. 2009;113(19):8498-8504. [90] Klontzas E, Tylianakis E, Froudakis GE. Designing 3d cofs with enhanced hydrogen storage capacity. Nano Letters. 2010;10(2):452-454. [91] Assfour B, Seifert G. Hydrogen adsorption sites and energies in 2d and 3d covalent organic frameworks. Chemical Physics Letters. 2010;489(1–3):86-91. [92] Garberoglio G. Computer simulation of the adsorption of light gases in covalent organic frameworks. Langmuir. 2007;23(24):12154-12158. [93] Tylianakis E, Klontzasa E, Froudakis GE. Multi-scale theoretical investigation of hydrogen storage in covalent organic frameworks. Nanoscale, 2011 2011;3:856-869. [94] El-Kaderi HM, Hunt JR, Mendoza-Cortés JL, Côté AP, Taylor RE, O'Keeffe M, et al. Designed synthesis of 3d covalent organic frameworks. Sci. 2007;316(5822):268-272. [95] Hunt JR, Doonan CJ, LeVangie JD, Côté AP, Yaghi OM. Reticular synthesis of covalent organic borosilicate frameworks. Journal of the American Chemical Society. 2008;130(36):11872-11873. [96] Germain J, Hradil J, Fréchet JM, Svec F. High surface area nanoporous polymers for reversible hydrogen storage. Chemistry of materials. 2006;18(18):4430-4435.
163
[97] Germain J, Fréchet JM, Svec F. Nanoporous, hypercrosslinked polypyrroles: Effect of crosslinking moiety on pore size and selective gas adsorption. Chem Commun. 2009(12):1526-1528. [98] Davankov V, Tsyurupa M. Structure and properties of hypercrosslinked polystyrene—the first representative of a new class of polymer networks. Reactive Polymers. 1990;13(1):27-42. [99] Davankov V, Rogoshin S, Tsyurupa M. Macronet isoporous gels through crosslinking of dissolved polystyrene. Journal of Polymer Science: Polymer Symposia: Wiley Online Library; p. 95-101. [100] Feistel L, Popov G, Schwachula G. Branched and crosslinked polymers. 4. Crosslinking and chloromethylation of bead polystyrene. PLASTE UND KAUTSCHUK. 1983;30(10):548-549. [101] Negre M, Bartholin M, Guyot A. Autocrosslinked isoporous polystyrene resins. Die Angewandte Makromolekulare Chemie. 1979;80(1):19--30. [102] Tsyurupa MP, Davankov VA. Hypercrosslinked polymers: Basic principle of preparing the new class of polymeric materials. Reactive and Functional Polymers. 2002;53(2–3):193-203. [103] Pastukhov AV, Tsyurupa MP, Davankov VA. Hypercrosslinked polystyrene: A polymer in a non-classical physical state. Journal of Polymer Science Part B Polymer Physics. 1999;37:2324-2333. [104] Reed Jr SF. Polymeric adsorbents from macroreticular polymer beads. Google Patents 1981. [105] Bharwada UJ, Goltz HR, LaBrie RL, Norman SI, Stringfield RT. Process for decolorizing aqueous sugar solutions via adsorbent resins, and desorption of color bodies from the adsorbent resins. Google Patents 1990. [106] Dufresne P. Passing through absorber to removal impurities. Google Patents 1998. [107] Wood CD, Tan B, Trewin A, Niu H, Bradshaw D, Rosseinsky MJ, et al. Hydrogen storage in microporous hypercrosslinked organic polymer networks. Chemistry of materials. 2007;19(8):2034-2048. [108] Wood CD, Tan B, Trewin A, Su F, Rosseinsky MJ, Bradshaw D, et al. Microporous organic polymers for methane storage. Adv Mater. 2008;20(10):1916-1921.
164

[109] Martín CF, Stöckel E, Clowes R, Adams DJ, Cooper AI, Pis JJ, et al. Hypercrosslinked organic polymer networks as potential adsorbents for pre-combustion co 2 capture. J Mater Chem. 2011;21(14):5475-5483. [110] Luo Y, Li B, Wang W, Wu K, Tan B. Hypercrosslinked aromatic heterocyclic microporous polymers: A new class of highly selective co2 capturing materials. Adv Mater. 2012;24(42):5703-5707. [111] Lee J-Y, Wood CD, Bradshaw D, Rosseinsky MJ, Cooper AI. Hydrogen adsorption in microporous hypercrosslinked polymers. Chem Commun. 2006(25):2670-2672. [112] Germain J, Fréchet JM, Svec F. Hypercrosslinked polyanilines with nanoporous structure and high surface area: Potential adsorbents for hydrogen storage. J Mater Chem. 2007;17(47):4989-4997. [113] Li B, Su F, Luo H-K, Liang L, Tan B. Hypercrosslinked microporous polymer networks for effective removal of toxic metal ions from water. Microporous Mesoporous Mater. 2011;138(1):207-214. [114] Lan J, Cao D, Wang W, Ben T, Zhu G. High-capacity hydrogen storage in porous aromatic frameworks with diamond-like structure. J Phys Chem Lett. 2010;1(6):978-981. [115] Ben T, Qiu S. Carbon dioxide capture in porous aromatic frameworks. Porous materials for carbon dioxide capture: Springer 2014, p. 115-142. [116] Schlütter F, Rossel Fdr, Kivala M, Enkelmann V, Gisselbrecht J-P, Ruffieux P, et al. Π-conjugated heterotriangulene macrocycles by solution and surface-supported synthesis toward honeycomb networks. J Am Chem Soc. 2013;135(11):4550-4557. [117] Bunz UH. Poly (aryleneethynylene) s: Syntheses, properties, structures, and applications. Chemical reviews. 2000;100(4):1605-1644. [118] Sonogashira K, Tohda Y, Hagihara N. A convenient synthesis of acetylenes: Catalytic substitutions of acetylenic hydrogen with bromoalkenes, iodoarenes and bromopyridines. Tetrahedron Letters. 1975;16(50):4467-4470. [119] Trumbo D, Marvel C. Polymerization using palladium (ii) salts: Homopolymers and copolymers from phenylethynyl compounds and aromatic bromides. Journal of Polymer Science Part A: Polymer Chemistry. 1986;24(9):2311-2326. [120] Hittinger E, Kokil A, Weder C. Synthesis and characterization of cross‐linked conjugated polymer milli‐, micro‐, and nanoparticles. Angew Chem Int Ed. 2004;43(14):1808-1811.
165

[121] Mendez JD, Schroeter M, Weder C. Hyperbranched poly (p‐phenylene ethynylene) s. Macromolecular Chemistry and Physics. 2007;208(15):1625-1636. [122] Donhauser Z, Mantooth B, Kelly K, Bumm L, Monnell J, Stapleton J, et al. Conductance switching in single molecules through conformational changes. Sci. 2001;292(5525):2303-2307. [123] Zhou Q, Swager TM. Fluorescent chemosensors based on energy migration in conjugated polymers: The molecular wire approach to increased sensitivity. J Am Chem Soc. 1995;117(50):12593-12602. [124] Venkataraman D, Lee S, Zhang J, Moore JS. An organic-solid with wide channels based on hydrogen-bonding between macrocycles. 1994. [125] Zhang W, Moore JS. Shape‐persistent macrocycles: Structures and synthetic approaches from arylene and ethynylene building blocks. Angew Chem Int Ed. 2006;45(27):4416-4439. [126] Kiang Y-H, Gardner GB, Lee S, Xu Z, Lobkovsky EB. Variable pore size, variable chemical functionality, and an example of reactivity within porous phenylacetylene silver salts. J Am Chem Soc. 1999;121(36):8204-8215. [127] Ishiyama T, Itoh Y, Kitano T, Miyaura N. Synthesis of arylboronates< i> via</i> the palladium (0)-catalyzed cross-coupling reaction of tetra (alkoxo) diborons with aryl triflates. Tetrahedron letters. 1997;38(19):3447-3450. [128] Ishiyama T, Murata M, Miyaura N. Palladium (0)-catalyzed cross-coupling reaction of alkoxydiboron with haloarenes: A direct procedure for arylboronic esters. The Journal of Organic Chemistry. 1995;60(23):7508-7510. [129] Miyaura N, Yamada K, Suzuki A. A new stereospecific cross-coupling by the palladium-catalyzed reaction of 1-alkenylboranes with 1-alkenyl or 1-alkynyl halides. Tetrahedron Letters. 1979;20(36):3437-3440. [130] Miyaura N, Yanagi T, Suzuki A. The palladium-catalyzed cross-coupling reaction of phenylboronic acid with haloarenes in the presence of bases. Synthetic Communications. 1981;11(7):513-519. [131] Yamada YM, Takeda K, Takahashi H, Ikegami S. An assembled complex of palladium and non-cross-linked amphiphilic polymer: A highly active and recyclable catalyst for the suzuki-miyaura reaction. Organic letters. 2002;4(20):3371-3374. [132] Ben T, Pei C, Zhang D, Xu J, Deng F, Jing X, et al. Gas storage in porous aromatic frameworks (pafs). Energ Environ Sci. 2011;4(10):3991-3999.
166
[133] Zhang H, Xue F, Mak T, Chan KS. Enantioselectivity increases with reactivity: Electronically controlled asymmetric addition of diethylzinc to aromatic aldehydes catalyzed by a chiral pyridylphenol. The Journal of organic chemistry. 1996;61(23):8002-8003. [134] Badone D, Baroni M, Cardamone R, Ielmini A, Guzzi U. Highly efficient palladium-catalyzed boronic acid coupling reactions in water: Scope and limitations. The Journal of organic chemistry. 1997;62(21):7170-7173. [135] Casalnuovo AL, Calabrese JC. Palladium-catalyzed alkylations in aqueous media. J Am Chem Soc. 1990;112(11):4324-4330. [136] Frenette R, Friesen RW. Biaryl synthesis via suzuki coupling on a solid support. Tetrahedron letters. 1994;35(49):9177-9180. [137] Dawson R, Adams DJ, Cooper AI. Chemical tuning of co 2 sorption in robust nanoporous organic polymers. Chemical Science. 2011;2(6):1173-1177. [138] Yuan D, Lu W, Zhao D, Zhou HC. Highly stable porous polymer networks with exceptionally high gas‐uptake capacities. Adv Mater. 2011;23(32):3723-3725. [139] Yuan Y, Sun F, Ren H, Jing X, Wang W, Ma H, et al. Targeted synthesis of a porous aromatic framework with a high adsorption capacity for organic molecules. J Mater Chem. 2011;21(35):13498-13502. [140] Griffiths PR, De Haseth JA. Fourier transform infrared spectrometry: John Wiley & Sons; 2007. [141] Hennel J, Klinowski J. Magic-angle spinning: A historical perspective. In: Klinowski J, ed. New techniques in solid-state nmr: Springer Berlin Heidelberg 2005, p. 1-14. [142] McDermott AE, Polenova T. Solid state nmr studies of biopolymers: John Wiley & Sons; 2012. [143] Ben T, Ren H, Ma S, Cao D, Lan J, Jing X, et al. Targeted synthesis of a porous aromatic framework with high stability and exceptionally high surface area. Angewandte Chemie. 2009;121(50):9621-9624. [144] Ren H, Ben T, Wang E, Jing X, Xue M, Liu B, et al. Targeted synthesis of a 3d porous aromatic framework for selective sorption of benzene. Chem Commun. 2010;46(2):291-293. [145] Peng Y, Ben T, Xu J, Xue M, Jing X, Deng F, et al. A covalently-linked microporous organic-inorganic hybrid framework containing polyhedral oligomeric silsesquioxane moieties. Dalton Transactions. 2011;40(12):2720-2724.
167

[146] Frost H, Düren T, Snurr RQ. Effects of surface area, free volume, and heat of adsorption on hydrogen uptake in metal-organic frameworks. J Phys Chem B. 2006;110(19):9565-9570. [147] Metz B, Davidson O, De Coninck H, Loos M, Meyer L. Ipcc special report on carbon dioxide capture and storage. Prepared by working group iii of the intergovernmental panel on climate change. IPCC, Cambridge University Press: Cambridge, United Kingdom and New York, USA. 2005;4. [148] Lu W, Yuan D, Sculley J, Zhao D, Krishna R, Zhou H-C. Sulfonate-grafted porous polymer networks for preferential co2 adsorption at low pressure. J Am Chem Soc. 2011;133(45):18126-18129. [149] Myers A, Prausnitz JM. Thermodynamics of mixed‐gas adsorption. AlChE J. 1965;11(1):121-127. [150] Bae Y-S, Farha OK, Hupp JT, Snurr RQ. Enhancement of co 2/n 2 selectivity in a metal-organic framework by cavity modification. J Mater Chem. 2009;19(15):2131-2134. [151] Yazaydın AOzr, Benin AI, Faheem SA, Jakubczak P, Low JJ, Willis RR, et al. Enhanced co2 adsorption in metal-organic frameworks via occupation of open-metal sites by coordinated water molecules. Chemistry of Materials. 2009;21(8):1425-1430. [152] Simmons JM, Wu H, Zhou W, Yildirim T. Carbon capture in metal–organic frameworks—a comparative study. Energ Environ Sci. 2011;4(6):2177-2185. [153] Krishna R, van Baten JM. In silico screening of metal–organic frameworks in separation applications. Phys Chem Chem Phys. 2011;13(22):10593-10616. [154] Belmabkhout Y, Pirngruber G, Jolimaitre E, Methivier A. A complete experimental approach for synthesis gas separation studies using static gravimetric and column breakthrough experiments. Adsorption. 2007;13(3-4):341-349. [155] Goj A, Sholl DS, Akten ED, Kohen D. Atomistic simulations of co2 and n2 adsorption in silica zeolites: The impact of pore size and shape. J Phys Chem B. 2002;106(33):8367-8375. [156] Belmabkhout Y, Sayari A. Effect of pore expansion and amine functionalization of mesoporous silica on co2 adsorption over a wide range of conditions. Adsorption. 2009;15(3):318-328. [157] Konstas K, Taylor JW, Thornton AW, Doherty CM, Lim WX, Bastow TJ, et al. Lithiated porous aromatic frameworks with exceptional gas storage capacity. Angewandte Chemie. 2012;124(27):6743-6746.
168

[158] Li A, Lu RF, Wang Y, Wang X, Han KL, Deng WQ. Lithium‐doped conjugated microporous polymers for reversible hydrogen storage. Angew Chem Int Ed. 2010;49(19):3330-3333. [159] Lu W, Sculley JP, Yuan D, Krishna R, Wei Z, Zhou HC. Polyamine‐tethered porous polymer networks for carbon dioxide capture from flue gas. Angew Chem Int Ed. 2012;51(30):7480-7484. [160] Ben T, Li Y, Zhu L, Zhang D, Cao D, Xiang Z, et al. Selective adsorption of carbon dioxide by carbonized porous aromatic framework (paf). Energ Environ Sci. 2012;5(8):8370-8376. [161] Li Y, Ben T, Zhang B, Fu Y, Qiu S. Ultrahigh gas storage both at low and high pressures in koh-activated carbonized porous aromatic frameworks. Sci Rep. 2013;3. [162] Babarao R, Dai S, Jiang D-e. Functionalizing porous aromatic frameworks with polar organic groups for high-capacity and selective co2 separation: A molecular simulation study. Langmuir. 2011;27(7):3451-3460. [163] DeLuchi MA. Hydrogen vehicles: An evaluation of fuel storage, performance, safety, environmental impacts, and cost. International Journal of Hydrogen Energy. 1989;14(2):81-130. [164] Berry GD, Aceves SM. Onboard storage alternatives for hydrogen vehicles. Energy & fuels. 1998;12(1):49-55. [165] Cockroft C. The perth fuel cell bus trial. Apresentação realizada no WICaC. 2006. [166] Sakintuna B, Lamari-Darkrim F, Hirscher M. Metal hydride materials for solid hydrogen storage: A review. International Journal of Hydrogen Energy. 2007;32(9):1121-1140. [167] Dillon A, Heben M. Hydrogen storage using carbon adsorbents: Past, present and future. Applied Physics A. 2001;72(2):133-142. [168] Ichikawa T, Isobe S, Hanada N, Fujii H. Lithium nitride for reversible hydrogen storage. Journal of alloys and compounds. 2004;365(1):271-276. [169] Thornton AW. Mathematical modelling of gas separation and storage using advanced materials University of Wollongong Doctor of Philosophy 2009. [170] Jones JE. On the determination of molecular fields. Ii. From the equation of state of a gas. Proceedings of the Royal Society of London Series A, Containing Papers of a Mathematical and Physical Character. 1924:463-477.
169

[171] Panella B, Hirscher M, Pütter H, Müller U. Hydrogen adsorption in metal–organic frameworks: Cu‐mofs and zn‐mofs compared. Advanced Functional Materials. 2006;16(4):520-524. [172] Everett DH, Powl JC. Adsorption in slit-like and cylindrical micropores in the henry's law region. A model for the microporosity of carbons. Journal of the Chemical Society, Faraday Transactions 1: Physical Chemistry in Condensed Phases. 1976;72:619-636. [173] Chae HK, Siberio-Pérez DY, Kim J, Go Y, Eddaoudi M, Matzger AJ, et al. A route to high surface area, porosity and inclusion of large molecules in crystals. Nature. 2004;427(6974):523-527. [174] Langmuir I. The adsorption of gases on plane surfaces of glass, mica and platinum. Journal of the American Chemical society. 1918;40(9):1361-1403. [175] Adamson AW, Gast AP. Physical chemistry of surfaces. 1967, 400-408. [176] Lowell S, Shields J, Thomas M, Thommes M. Surface area analysis from the langmuir and bet theories. Characterization of porous solids and powders: Surface area, pore size and density: Springer Netherlands 2004, p. 58-81. [177] Sime RJ. The langmuir adsorption isotherm. [178] Brunauer S, Emmett PH, Teller E. Adsorption of gases in multimolecular layers. Journal of the American Chemical Society. 1938;60(2):309-319. [179] Atkins P. Physical chemistry. 6th. Oxford University Press 1998. [180] Lippens BC, De Boer J. Studies on pore systems in catalysts: V. The t method. Journal of Catalysis. 1965;4(3):319-323. [181] De Boer J, Lippens B, Linsen B, Broekhoff J, Van den Heuvel A, Osinga JT. J colloid interf. Sci 1966. [182] Gregg S, Sing K. Adsorption, surface area and porosity academic. New York. 1982:242-245. [183] Carrott P, Roberts R, Sing K. A new method for the determination of micropore size distributions. Studies in Surface Science and Catalysis. 1988;39:89-100. [184] Mikhail RS, Brunauer S, Bodor E. Investigations of a complete pore structure analysis: Ii. Analysis of four silica gels. Journal of Colloid and Interface Science. 1968;26(1):54-61.
170

[185] Allen MP, Tildesley DJ. Computer simulation of liquids. 1987. [186] Frenkel D, Smit B. Understanding molecular simulation: From algorithms to applications: Academic press; 2001. [187] Ahmed A, Thornton AW, Konstas K, Kannam SK, Babarao R, Todd BD, et al. Strategies toward enhanced low-pressure volumetric hydrogen storage in nanoporous cryoadsorbents. Langmuir. 2013;29(50):15689-15697. [188] Myers A, Monson P. Adsorption in porous materials at high pressure: Theory and experiment. Langmuir. 2002;18(26):10261-10273. [189] Martin RM. Electronic structure: Basic theory and practical methods: Cambridge university press; 2004. [190] Han SS, Goddard Iii WA. High h2 storage of hexagonal metal− organic frameworks from first-principles-based grand canonical monte carlo simulations. The Journal of Physical Chemistry C. 2008;112(35):13431-13436. [191] Aukett P, Quirke N, Riddiford S, Tennison S. Methane adsorption on microporous carbons—a comparison of experiment, theory, and simulation. Carbon. 1992;30(6):913-924. [192] Dalach P, Frost H, Snurr R, Ellis D. Enhanced hydrogen uptake and the electronic structure of lithium-doped metal− organic frameworks. The Journal of Physical Chemistry C. 2008;112(25):9278-9284. [193] Zhao J, Buldum A, Han J, Lu JP. Gas molecule adsorption in carbon nanotubes and nanotube bundles. Nanotechnology. 2002;13(2):195. [194] Sun Q, Jena P, Wang Q, Marquez M. First-principles study of hydrogen storage on li12c60. J Am Chem Soc. 2006;128(30):9741-9745. [195] Fang H, Demir H, Kamakoti P, Sholl DS. Recent developments in first-principles force fields for molecules in nanoporous materials. Journal of Materials Chemistry A. 2014;2(2):274-291. [196] Gordon PA, Saeger RB. Molecular modeling of adsorptive energy storage: Hydrogen storage in single-walled carbon nanotubes. Industrial & engineering chemistry research. 1999;38(12):4647-4655. [197] Mueller T, Ceder G. A density functional theory study of hydrogen adsorption in mof-5. The Journal of Physical Chemistry B. 2005;109(38):17974-17983.
171
[198] Han SS, Choi S-H, Goddard III WA. Zeolitic imidazolate frameworks as h2 adsorbents: Ab initio based grand canonical monte carlo simulation. The Journal of Physical Chemistry C. 2010;114(27):12039-12047. [199] Blomqvist A, Araújo CM, Srepusharawoot P, Ahuja R. Li-decorated metal–organic framework 5: A route to achieving a suitable hydrogen storage medium. Proceedings of the National Academy of Sciences. 2007;104(51):20173-20176. [200] Yang Q, Zhong C. Understanding hydrogen adsorption in metal-organic frameworks with open metal sites: A computational study. The Journal of Physical Chemistry B. 2006;110(2):655-658. [201] Yildirim T, Íñiguez J, Ciraci S. Molecular and dissociative adsorption of multiple hydrogen molecules on transition metal decorated c 60. Physical Review B. 2005;72(15):153403. [202] Bull I, Lightfoot P, Villaescusa LA, Bull LM, Gover RK, Evans JS, et al. An x-ray diffraction and mas nmr study of the thermal expansion properties of calcined siliceous ferrierite. Journal of the American Chemical Society. 2003;125(14):4342-4349. [203] Villaescusa LA, Lightfoot P, Teat SJ, Morris RE. Variable-temperature microcrystal x-ray diffraction studies of negative thermal expansion in the pure silica zeolite ifr. Journal of the American Chemical Society. 2001;123(23):5453-5459. [204] Loiseau T, Serre C, Huguenard C, Fink G, Taulelle F, Henry M, et al. A rationale for the large breathing of the porous aluminum terephthalate (mil‐53) upon hydration. Chemistry-A European Journal. 2004;10(6):1373-1382. [205] Serre C, Mellot-Draznieks C, Surblé S, Audebrand N, Filinchuk Y, Férey G. Role of solvent-host interactions that lead to very large swelling of hybrid frameworks. Science. 2007;315(5820):1828-1831. [206] Latroche M, Surblé S, Serre C, Mellot‐Draznieks C, Llewellyn PL, Lee JH, et al. Hydrogen storage in the giant‐pore metal–organic frameworks mil‐100 and mil‐101. Angewandte Chemie International Edition. 2006;45(48):8227-8231. [207] Fletcher AJ, Thomas KM, Rosseinsky MJ. Flexibility in metal-organic framework materials: Impact on sorption properties. Journal of Solid State Chemistry. 2005;178(8):2491-2510. [208] Uemura K, Matsuda R, Kitagawa S. Flexible microporous coordination polymers. Journal of Solid State Chemistry. 2005;178(8):2420-2429.
172

[209] Jeong GH, Kim Y, Seff K. Crystal structures of the no and no< sub> 2</sub> sorption complexes of fully dehydrated fully mn< sup> 2+</sup>-exchanged zeolite x (fau). Microporous and mesoporous materials. 2006;93(1):12-22. [210] Riley PE, Seff K. Crystal structures of dehydrated partially cobalt (ii)-exchanged zeolite a and of its carbon monoxide adduct. Inorganic Chemistry. 1974;13(6):1355-1360. [211] Forster PM, Eckert J, Heiken BD, Parise JB, Yoon JW, Jhung SH, et al. Adsorption of molecular hydrogen on coordinatively unsaturated ni (ii) sites in a nanoporous hybrid material. Journal of the American Chemical Society. 2006;128(51):16846-16850. [212] Welbes LL, Borovik A. Confinement of metal complexes within porous hosts: Development of functional materials for gas binding and catalysis. Accounts of chemical research. 2005;38(10):765-774. [213] Chui SS-Y, Lo SM-F, Charmant JP, Orpen AG, Williams ID. A chemically functionalizable nanoporous material [cu3 (tma) 2 (h2o) 3] n. Science. 1999;283(5405):1148-1150. [214] Morris RE, Wheatley PS. Gas storage in nanoporous materials. Angewandte Chemie International Edition. 2008;47(27):4966-4981. [215] Energy USDo. Hydrogen storage summary of annual merit review of the hydrogen storage sub-program. ; 2012. [216] Schlapbach L. Hydrogen as a fuel and its storage for mobility and transport. MRS bulletin. 2002;27(09):675-679. [217] Rowsell JL, Yaghi OM. Strategies for hydrogen storage in metal–organic frameworks. Angew Chem Int Ed. 2005;44(30):4670-4679. [218] Schlapbach L, Züttel A. Hydrogen-storage materials for mobile applications. Nature. 2001;414(6861):353-358. [219] Langmi HW, McGrady GS. Non-hydride systems of the main group elements as hydrogen storage materials. Coordination chemistry reviews. 2007;251(7):925-935. [220] Weitkamp J, Fritz M, Ernst S. Zeolites as media for hydrogen storage. International Journal of Hydrogen Energy. 1995;20(12):967-970. [221] Nishihara H, Hou P-X, Li L-X, Ito M, Uchiyama M, Kaburagi T, et al. High-pressure hydrogen storage in zeolite-templated carbon. The Journal of Physical Chemistry C. 2009;113(8):3189-3196.
173

[222] Wu H, Zhou W, Yildirim T. Hydrogen storage in a prototypical zeolitic imidazolate framework-8. Journal of the American Chemical Society. 2007;129(17):5314-5315. [223] Langmi H, Book D, Walton A, Johnson S, Al-Mamouri M, Speight J, et al. Hydrogen storage in ion-exchanged zeolites. Journal of alloys and compounds. 2005;404:637-642. [224] Masika E, Mokaya R. Exceptional gravimetric and volumetric hydrogen storage for densified zeolite templated carbons with high mechanical stability. Energy & Environmental Science. 2014;7(1):427-434. [225] Fujiwara M, Fujio Y, Sakurai H, Senoh H, Kiyobayashi T. Storage of molecular hydrogen into zsm-5 zeolite in the ambient atmosphere by the sealing of the micropore outlet. Chemical Engineering and Processing: Process Intensification. 2014;79:1-6. [226] Du X. Molecular simulation of hydrogen storage in ion-exchanged x zeolites. Advances in Materials Science and Engineering. 2014;2014. [227] Li Y, Yang RT. Hydrogen storage in metal‐organic and covalent‐organic frameworks by spillover. AIChE journal. 2008;54(1):269-279. [228] Cao D, Lan J, Wang W, Smit B. Lithium‐doped 3d covalent organic frameworks: High‐capacity hydrogen storage materials. Angewandte Chemie. 2009;121(26):4824-4827. [229] Yaghi OM, Goddard WA. A joint theory and experimental project in the synthesis and testing of porous cofs for on-board vehicular hydrogen storage: University of California-Los Angeles, Los Angeles, CA; California Institute of Technology, Pasadena, CA; 2013. [230] Ding S-Y, Wang W. Covalent organic frameworks (cofs): From design to applications. Chemical Society Reviews. 2013;42(2):548-568. [231] Nouar F, Eckert J, Eubank JF, Forster P, Eddaoudi M. Zeolite-like metal− organic frameworks (zmofs) as hydrogen storage platform: Lithium and magnesium ion-exchange and h2-(rho-zmof) interaction studies. Journal of the American Chemical Society. 2009;131(8):2864-2870. [232] Klyamkin SN, Chuvikov SV, Maletskaya NV, Kogan EV, Fedin VP, Kovalenko KA, et al. High‐pressure hydrogen storage on modified mil‐101 metal–organic framework. International Journal of Energy Research. 2014. [233] Lim DW, Chyun SA, Suh MP. Hydrogen storage in a potassium‐ion‐bound metal–organic framework incorporating crown ether struts as specific cation binding sites. Angewandte Chemie International Edition. 2014;53(30):7819-7822.
174

[234] Langmi HW, Ren J, North B, Mathe M, Bessarabov D. Hydrogen storage in metal-organic frameworks: A review. Electrochimica Acta. 2014;128:368-392. [235] Yang Z, Xia Y, Mokaya R. Enhanced hydrogen storage capacity of high surface area zeolite-like carbon materials. Journal of the American Chemical Society. 2007;129(6):1673-1679. [236] Yang Z, Xia Y, Sun X, Mokaya R. Preparation and hydrogen storage properties of zeolite-templated carbon materials nanocast via chemical vapor deposition: Effect of the zeolite template and nitrogen doping. The Journal of Physical Chemistry B. 2006;110(37):18424-18431. [237] Wang J, Senkovska I, Kaskel S, Liu Q. Chemically activated fungi-based porous carbons for hydrogen storage. Carbon. 2014;75:372-380. [238] Tylianakis E, Dimitrakakis GK, Martin-Martinez FJ, Melchor S, Dobado JA, Klontzas E, et al. Designing novel nanoporous architectures of carbon nanotubes for hydrogen storage. International Journal of Hydrogen Energy. 2014;39(18):9825-9829. [239] Germain J, Fréchet JM, Svec F. Nanoporous polymers for hydrogen storage. Small. 2009;5(10):1098-1111. [240] McKeown NB, Budd PM. Polymers of intrinsic microporosity (pims): Organic materials for membrane separations, heterogeneous catalysis and hydrogen storage. Chemical Society Reviews. 2006;35(8):675-683. [241] Orimo S-i, Nakamori Y, Eliseo JR, Züttel A, Jensen CM. Complex hydrides for hydrogen storage. Chemical Reviews. 2007;107(10):4111-4132. [242] Chen P, Xiong Z, Luo J, Lin J, Tan KL. Interaction of hydrogen with metal nitrides and imides. Nature. 2002;420(6913):302-304. [243] Gutowska A, Li L, Shin Y, Wang CM, Li XS, Linehan JC, et al. Nanoscaffold mediates hydrogen release and the reactivity of ammonia borane. Angewandte Chemie International Edition. 2005;44(23):3578-3582. [244] Berseth PA, Harter AG, Zidan R, Blomqvist A, Araújo CM, Scheicher RH, et al. Carbon nanomaterials as catalysts for hydrogen uptake and release in naalh4. Nano letters. 2009;9(4):1501-1505. [245] Paskevicius M, Sheppard DA, Buckley CE. Thermodynamic changes in mechanochemically synthesized magnesium hydride nanoparticles. Journal of the American chemical Society. 2010;132(14):5077-5083.
175

[246] Araújo CM, Li S, Ahuja R, Jena P. Vacancy-mediated hydrogen desorption in na al h 4. Physical Review B. 2005;72(16):165101. [247] Demirocak DE, Ram MK, Srinivasan SS, Goswami DY, Stefanakos EK. A novel nitrogen rich porous aromatic framework for hydrogen and carbon dioxide storage. Journal of Materials Chemistry A. 2013;1(44):13800-13806. [248] Ma H, Ren H, Zou X, Sun F, Yan Z, Cai K, et al. Novel lithium-loaded porous aromatic framework for efficient co 2 and h 2 uptake. Journal of Materials Chemistry A. 2013;1(3):752-758. [249] Jena P. Materials for hydrogen storage: Past, present, and future. J Phys Chem Lett. 2011;2(3):206-211. [250] Liu C, Fan Y, Liu M, Cong H, Cheng H, Dresselhaus MS. Hydrogen storage in single-walled carbon nanotubes at room temperature. Science. 1999;286(5442):1127-1129. [251] Han SS, Goddard WA. Lithium-doped metal-organic frameworks for reversible h2 storage at ambient temperature. J Am Chem Soc. 2007;129(27):8422-8423. [252] Gigras A, Bhatia SK, Anil Kumar AV, Myers AL. Feasibility of tailoring for high isosteric heat to improve effectiveness of hydrogen storage in carbons. Carbon. 2007;45(5):1043-1050. [253] Bhatia SK, Myers AL. Optimum conditions for adsorptive storage. Langmuir. 2006;22(4):1688-1700. [254] Dincǎ M, Dailly A, Liu Y, Brown CM, Neumann DA, Long JR. Hydrogen storage in a microporous metal−organic framework with exposed mn2+ coordination sites. Journal of the American Chemical Society. 2006;128(51):16876-16883. [255] Dincǎ M, Long JR. Strong h2 binding and selective gas adsorption within the microporous coordination solid mg3(o2c-c10h6-co2)3. Journal of the American Chemical Society. 2005;127(26):9376-9377. [256] Panella B, Hirscher M, Roth S. Hydrogen adsorption in different carbon nanostructures. Carbon. 2005;43(10):2209-2214. [257] Bénard P, Chahine R. Storage of hydrogen by physisorption on carbon and nanostructured materials. Scripta Materialia. 2007;56(10):803-808. [258] Nijkamp M, Raaymakers J, Van Dillen A, De Jong K. Hydrogen storage using physisorption–materials demands. Applied Physics A. 2001;72(5):619-623.
176

[259] Zecchina A, Bordiga S, Vitillo JG, Ricchiardi G, Lamberti C, Spoto G, et al. Liquid hydrogen in protonic chabazite. Journal of the American Chemical Society. 2005;127(17):6361-6366. [260] Kaye SS, Long JR. Hydrogen storage in the dehydrated prussian blue analogues m3 [co (cn) 6] 2 (m= mn, fe, co, ni, cu, zn). Journal of the American Chemical Society. 2005;127(18):6506-6507. [261] Hirscher M, Panella B. Hydrogen storage in metal–organic frameworks. Scripta Materialia. 2007;56(10):809-812. [262] Collins DJ, Zhou H-C. Hydrogen storage in metal–organic frameworks. Journal of materials chemistry. 2007;17(30):3154-3160. [263] Li Y, Yang FH, Yang RT. Kinetics and mechanistic model for hydrogen spillover on bridged metal−organic frameworks. The Journal of Physical Chemistry C. 2007;111(8):3405-3411. [264] Li Y, Yang RT. Significantly enhanced hydrogen storage in metal−organic frameworks via spillover. Journal of the American Chemical Society. 2005;128(3):726-727. [265] Li Y, Yang RT. Hydrogen storage in metal−organic frameworks by bridged hydrogen spillover. Journal of the American Chemical Society. 2006;128(25):8136-8137. [266] Zhao X, Xiao B, Fletcher AJ, Thomas KM, Bradshaw D, Rosseinsky MJ. Hysteretic adsorption and desorption of hydrogen by nanoporous metal-organic frameworks. Science. 2004;306(5698):1012-1015. [267] Hetrick EM, Schoenfisch MH. Reducing implant-related infections: Active release strategies. Chemical Society Reviews. 2006;35(9):780-789. [268] Hetrick EM, Prichard HL, Klitzman B, Schoenfisch MH. Reduced foreign body response at nitric oxide-releasing subcutaneous implants. Biomaterials. 2007;28(31):4571-4580. [269] Nablo BJ, Chen T-Y, Schoenfisch MH. Sol−gel derived nitric-oxide releasing materials that reduce bacterial adhesion. Journal of the American Chemical Society. 2001;123(39):9712-9713. [270] Nablo BJ, Prichard HL, Butler RD, Klitzman B, Schoenfisch MH. Inhibition of implant-associated infections via nitric oxide release. Biomaterials. 2005;26(34):6984-6990.
177

[271] Nablo BJ, Schoenfisch MH. Antibacterial properties of nitric oxide–releasing sol-gels. Journal of Biomedical Materials Research Part A. 2003;67A(4):1276-1283. [272] King CJ. Separation processes: Courier Dover Publications; 2013. [273] King CJ. Separation processes based on reversible chemical complexation. Wiley: New York 1987, p. 760-774. [274] Liu Q, Noble R, Falconer JL, Funke H. Organics/water separation by pervaporation with a zeolite membrane. J Membr Sci. 1996;117(1):163-174. [275] Wijmans J, Baker R, Athayde A. Pervaporation: Removal of organics from water and organic/organic separations. Membrane processes in separation and purification: Springer 1994, p. 283-316. [276] Karger BL, Snyder LR, Horvath C. Introduction to separation science. 1973. [277] Milton R. Us patent 2,882,243 (1959); b) rm milton, us. Patent 1959. [278] Abedini R, Nezhadmoghadam A. Application of membrane in gas separation processes: Its suitability and mechanisms. Petroleum & Coal. 2010;52(2):69-80. [279] Lin F-C, Wang D-M, Lai J-Y. Asymmetric tpx membranes with high gas flux. Journal of membrane science. 1996;110(1):25-36. [280] Winston Ho W, Sirkar KK. Membrane handbook. New York: Vannostrand re. 1992;100. [281] Mark H, Bikales N, Overberger C, Merges G. Encyclopedia of polymer science and engineering. Vol. 2. Wiley-Interscience, 605 Third Ave, New York, New York 10158, USA, 1985. 1985. [282] Pandey P, Chauhan R. Membranes for gas separation. Prog Polym Sci. 2001;26(6):853-893. [283] Fick A. V. On liquid diffusion. The London, Edinburgh, and Dublin Philosophical Magazine and Journal of Science. 1855;10(63):30-39. [284] Koros W, Fleming G. Membrane-based gas separation. J Membr Sci. 1993;83(1):1-80. [285] Baker RW, Cussler E, Eykamp W, Koros W, Riley R, Strathmann H. Membrane separation systems: Recent developments and future directions: Noyes Data Corporation Park Ridge, NJ; 1991.
178

[286] Koresh JE, Soffer A. The carbon molecular sieve membranes. General properties and the permeability of ch4/h2 mixture. Separation Science and Technology. 1987;22(2-3):973-982. [287] Way JD, Roberts DL. Hollow fiber inorganic membranes for gas separations. Separation science and technology. 1992;27(1):29-41. [288] Hinds BJ, Chopra N, Rantell T, Andrews R, Gavalas V, Bachas LG. Aligned multiwalled carbon nanotube membranes. Science. 2004;303(5654):62-65. [289] Knudsen M. Die gesetze der molekularströmung und der inneren reibungsströmung der gase durch röhren. Annalen der Physik. 1909;333(1):75-130. [290] Hwang S-T, Kammermeyer K, Weissberger A. Membranes in separations: Wiley New York; 1975. [291] Duke MC, Pas SJ, Hill AJ, Lin Y, da Costa JCD. Exposing the molecular sieving architecture of amorphous silica using positron annihilation spectroscopy. Advanced Functional Materials. 2008;18(23):3818-3826. [292] Shelekhin A, Dixon A, Ma Y. Theory of gas diffusion and permeation in inorganic molecular‐sieve membranes. AIChE Journal. 1995;41(1):58-67. [293] Yon CM, Sherman JD. Adsorption, gas separation. Kirk-Othmer Encyclopedia of Chemical Technology. 2004. [294] King C. Handbook of separation process technology. Wiley, New York. 1987. [295] Keller GE. Gas-adsorption processes: State of the art. 1983. [296] Barrer R, Vaugiian D. Trapping of inert gases in sodalite and cancrinite crystals. Journal of Physics and Chemistry of Solids. 1971;32(3):731-743. [297] Jones JE. On the determination of molecular fields. Ii. From the equation of state of a gas. Proceedings of the Royal Society of London Series A. 1924;106(738):463-477. [298] Hirschfelder JO, Curtiss CF, Bird RB. Molecular theory of gases and liquids: Wiley New York; 1954. [299] Barrer R. Zeolites and clay minerals as adsorbents and catalysts. Academic Press, London 1978. [300] Steele WA. The physical adsorption of gases on solids. Advances in Colloid and Interface Science. 1967;1(1):3-78.
179

[301] Rudziński W, Nieszporek K, Moon H, Rhee H-K. On the theoretical origin and applicability of the potential theory approach to predict mixed-gas adsorption on solid surfaces from single-gas adsorption isotherms. Chemical engineering science. 1995;50(16):2641-2660. [302] Selvam P, Bhatia SK, Sonwane CG. Recent advances in processing and characterization of periodic mesoporous mcm-41 silicate molecular sieves. Industrial & Engineering Chemistry Research. 2001;40(15):3237-3261. [303] Valenzuela DP, Myers AL. Adsorption equilibrium data handbook: Prentice Hall New Jersey; 1989. [304] Tovbin YK. The hierarchy of adsorption models for laterally interacting molecules on heterogeneous surfaces. Langmuir. 1997;13(5):979-989. [305] Yang RT. Gas separation by adsorption processes. 1986. [306] Talu O, Myers AL. Rigorous thermodynamic treatment of gas adsorption. AIChE journal. 1988;34(11):1887-1893. [307] Yon CM, Turnock PH. Multicomponent adsorption equilibria on molecular sieves. AIChE Symp Ser; p. 75-83. [308] Sundaram N. A modification of the dubinin isotherm. Langmuir. 1993;9(6):1568-1573. [309] Mathias PM, Kumar R, Moyer JD, Schork JM, Srinivasan SR, Auvil SR, et al. Correlation of multicomponent gas adsorption by the dual-site langmuir model. Application to nitrogen/oxygen adsorption on 5a-zeolite. Industrial & engineering chemistry research. 1996;35(7):2477-2483. [310] Maurer RT. Multimodel approach to mixed‐gas adsorption equilibria prediction. AIChE journal. 1997;43(2):388-397. [311] Rapaport DC. The art of molecular dynamics simulation: Cambridge university press; 2004. [312] Haile J. Molecular dynamics simulation: Elementary methods. 1992. A Wiley-Interscience Publication, New York. 1992. [313] Hammersley JM, Handscomb DC. Monte carlo methods: Springer; 1964. [314] Metropolis N, Rosenbluth AW, Rosenbluth MN, Teller AH, Teller E. Equation of state calculations by fast computing machines. The journal of chemical physics. 1953;21(6):1087-1092.
180

[315] Sumida K, Hill MR, Horike S, Dailly A, Long JR. Synthesis and hydrogen storage properties of be12(oh)12(1,3,5-benzenetribenzoate)4. J Am Chem Soc. 2009;131(42):15120-15121. [316] Belof JL, Stern AC, Space B. A predictive model of hydrogen sorption for metal− organic materials. J Phys Chem C. 2009;113(21):9316-9320. [317] Kaye SS, Dailly A, Yaghi OM, Long JR. Impact of preparation and handling on the hydrogen storage properties of zn4o (1, 4-benzenedicarboxylate) 3 (mof-5). J Am Chem Soc. 2007;129(46):14176-14177. [318] Cao D, Lan J, Wang W, Smit B. Lithium-doped 3d covalent organic frameworks: High-capacity hydrogen storage materials. Angew Chem Int Ed. 2009;121(26):4824-4827. [319] Lan J, Cao D, Wang W, Smit B. Doping of alkali, alkaline-earth, and transition metals in covalent-organic frameworks for enhancing co2 capture by first-principles calculations and molecular simulations. ACS nano. 2010;4(7):4225-4237. [320] Furukawa S-i, Nitta T. Non-equilibrium molecular dynamics simulation studies on gas permeation across carbon membranes with different pore shape composed of micro-graphite crystallites. J Membr Sci. 2000;178(1-2):107-119. [321] Zhong Z, Xiong Z, Sun L, Luo J, Chen P, Wu X, et al. Nanosized nickel (or cobalt)/graphite composites for hydrogen storage. J Phys Chem B. 2002;106(37):9507-9513. [322] Lim W-X, Thornton AW, Hill AJ, Cox BJ, Hill JM, Hill MR. High performance hydrogen storage from be-btb metal–organic framework at room temperature. Langmuir. 2013;29(27):8524-8533. [323] Hydrogen storage summary of annual merit review of the hydrogen storage sub-program: U.S. Department of Energy http://www.hydrogen.energy.gov/pdfs/review12/55568-04_storage.pdf; 2012. [324] Chakraborty A, Kumar S. Thermal management and desorption modeling of a cryo-adsorbent hydrogen storage system. International Journal of Hydrogen Energy. 2013. [325] Kumar VS, Kumar S. Generalized model development for a cryo-adsorber and 1-d results for the isobaric refueling period. International Journal of Hydrogen Energy. 2010;35(8):3598-3609. [326] Senthil Kumar V. A generalized cryo-adsorber model and 2-d refueling results. Int J Hydrogen Energ. 2011;36(23):15239-15249.
181

[327] Poirier E, Dailly A. Thermodynamic study of the adsorbed hydrogen phase in cu-based metal-organic frameworks at cryogenic temperatures. Energ Environ Sci. 2009;2(4):420-425. [328] Raymond AW, Reiter J. Modeling and testing of cryo-adsorbent hydrogen storage tanks with improved thermal isolation. AIP Conference Proceedings; p. 765. [329] Kopyscinski J, Schildhauer TJ, Biollaz S. Production of synthetic natural gas (sng) from coal and dry biomass–a technology review from 1950 to 2009. Fuel. 2010;89(8):1763-1783. [330] Wang J, Wan W. Factors influencing fermentative hydrogen production: A review. International journal of hydrogen energy. 2009;34(2):799-811. [331] Das D, Veziroglu TN. Advances in biological hydrogen production processes. Int J Hydrogen Energ. 2008;33(21):6046-6057. [332] Yu J, Qi L, Jaroniec M. Hydrogen production by photocatalytic water splitting over pt/tio2 nanosheets with exposed (001) facets. J Phys Chem C. 2010;114(30):13118-13125. [333] Akutsu H, Nagamori T. Conformational analysis of the polar head group in phosphatidylcholine bilayers: A structural change induced by cations. Biochemistry. 1991;30(18):4510-4516. [334] Collins DJ, Zhou H-C. Hydrogen storage in metal-organic frameworks. J Mater Chem. 2007;17(30):3154-3160. [335] Isaeva VI, Kustov LM. Metal-organic frameworks—new materials for hydrogen storage. Russian Journal of General Chemistry. 2007;77(4):721-739. [336] Lin X, Jia J, Hubberstey P, Schroder M, Champness NR. Hydrogen storage in metal-organic frameworks. CrystEngComm. 2007;9(6):438-448. [337] Yuan D, Zhao D, Sun D, Zhou H-C. An isoreticular series of metal–organic frameworks with dendritic hexacarboxylate ligands and exceptionally high gas-uptake capacity. Angew Chem Int Ed. 2010;49(31):5357-5361. [338] Hunt JR, Doonan CJ, LeVangie JD, Côté AP, Yaghi OM. Reticular synthesis of covalent organic borosilicate frameworks. J Am Chem Soc. 2008;130(36):11872-11873. [339] Côté AP, Benin AI, Ockwig NW, O'Keeffe M, Matzger AJ, Yaghi OM. Porous, crystalline, covalent organic frameworks. Sci. 2005;310(5751):1166-1170.
182

[340] Côté AP, El-Kaderi HM, Furukawa H, Hunt JR, Yaghi OM. Reticular synthesis of microporous and mesoporous 2d covalent organic frameworks. J Am Chem Soc. 2007;129(43):12914-12915. [341] Mendoza-Cortes JL, Goddard III WA, Furukawa H, Yaghi OM. A covalent organic framework that exceeds the doe 2015 volumetric target for h2 uptake at 298 k. J Phys Chem Lett. 2012;3(18):2671-2675. [342] Farha OK, Eryazici I, Jeong NC, Hauser BG, Wilmer CE, Sarjeant AA, et al. Metal–organic framework materials with ultrahigh surface areas: Is the sky the limit? J Am Chem Soc. 2012;134(36):15016-15021. [343] Babarao R, Jiang J. Exceptionally high co2 storage in covalent-organic frameworks: Atomistic simulation study. Energ Environ Sci. 2008;1(1):139-143. [344] Ben T, Ren H, Ma S, Cao D, Lan J, Jing X, et al. Targeted synthesis of a porous aromatic framework with high stability and exceptionally high surface area. Angew Chem Int Ed. 2009;48(50):9457-9460. [345] Konstas K, Taylor JW, Thornton AW, Doherty CM, Lim WX, Bastow TJ, et al. Lithiated porous aromatic frameworks with exceptional gas storage capacity. Angew Chem Int Ed. 2012;124(27):6743-6746. [346] Suh MP, Park HJ, Prasad TK, Lim D-W. Hydrogen storage in metal–organic frameworks. Chemical reviews. 2011;112(2):782-835. [347] Murray LJ, Dincă M, Long JR. Hydrogen storage in metal–organic frameworks. Chem Soc Rev. 2009;38(5):1294-1314. [348] Thornton AW, Nairn KM, Hill JM, Hill AJ, Hill MR. Metal− organic frameworks impregnated with magnesium-decorated fullerenes for methane and hydrogen storage. J Am Chem Soc. 2009;131(30):10662-10669. [349] Rao D, Lu R, Xiao C, Kan E, Deng K. Lithium-doped mof impregnated with lithium-coated fullerenes: A hydrogen storage route for high gravimetric and volumetric uptakes at ambient temperatures. Chem Commun. 2011;47(27):7698-7700. [350] Frost H, Duren T, Snurr RQ. Effects of surface area, free volume, and heat of adsorption on hydrogen uptake in metal-organic frameworks. J Phys Chem B. 2006;110(19):9565-9570. [351] Yang Q, Xue C, Zhong C, Chen J-F. Molecular simulation of separation of co2 from flue gases in cu-btc metal-organic framework. AlChE J. 2007;53(11):2832-2840.
183

[352] Teprovich JA, Wellons MS, Lascola R, Hwang S-J, Ward PA, Compton RN, et al. Synthesis and characterization of a lithium-doped fullerane (lix-c60-hy) for reversible hydrogen storage. Nano Lett. 2011;12(2):582-589. [353] Willems TF, Rycroft CH, Kazi M, Meza JC, Haranczyk M. Algorithms and tools for high-throughput geometry-based analysis of crystalline porous materials. Micropor Mesopor Mat. 2012;149(1):134-141. [354] Meng Z, Lu R, Rao D, Kan E, Xiao C, Deng K. Catenated metal-organic frameworks: Promising hydrogen purification materials and high hydrogen storage medium with further lithium doping. Int J Hydrogen Energ. 2013;38(23):9811-9818. [355] Peng D-Y, Robinson DB. A new two-constant equation of state. Industrial & Engineering Chemistry Fundamentals. 1976;15(1):59-64. [356] Düren T, Millange F, Férey G, Walton KS, Snurr RQ. Calculating geometric surface areas as a characterization tool for metal-organic frameworks. J Phys Chem C. 2007;111(42):15350-15356. [357] Konstas K, Taylor JW, Thornton AW, Doherty CM, Lim WX, Bastow TJ, et al. Lithiated porous aromatic frameworks with exceptional gas storage capacity. Angew Chem Int Edit. 2012;51:6639-6642. [358] Goldsmith J, Wong-Foy AG, Cafarella MJ, Siegel DJ. Theoretical limits of hydrogen storage in metal–organic frameworks: Opportunities and trade-offs. Chem Mater. 2013;25(16):3373-3382. [359] Dailly A, Poirier E. Evaluation of an industrial pilot scale densified mof-177 adsorbent as an on-board hydrogen storage medium. Energ Environ Sci. 2011;4(9):3527-3534. [360] Mendoza-Cortés JL, Han SS, Goddard III WA. High h2 uptake in li-, na-, k-metalated covalent organic frameworks and metal organic frameworks at 298 k. J Phys Chem A. 2012;116(6):1621-1631. [361] Frost H, Düren T, Snurr RQ. Effects of surface area, free volume, and heat of adsorption on hydrogen uptake in metal−organic frameworks. J Phys Chem B. 2006;110(19):9565-9570. [362] Aasberg-Petersen K, Nielsen CS, Dybkjær I, Perregaard J. Large scale methanol production from natural gas. Report: Haldor Topsoe 2008. [363] Fleming HL, Slater CS. Applications and economics. Membrane handbook: Springer 1992, p. 132-159.
184

[364] Martin N. Removal of methanol by pervaporation. Technical report: SULZER CHEMTECH 19.01.2003. [365] Tuan VA, Li S, Falconer JL, Noble RD. Separating organics from water by pervaporation with isomorphously-substituted mfi zeolite membranes. J Membr Sci. 2002;196(1):111-123. [366] Cao D, Lan J, Wang W, Smit B. Lithium-doped 3d covalent organic frameworks: High-capacity hydrogen storage materials. Angew Chem Int Ed Engl. 2009;48(26):4730-4733. [367] Kaye SS, Dailly A, Yaghi OM, Long JR. Impact of preparation and handling on the hydrogen storage properties of zn4o (1, 4-benzenedicarboxylate) 3 (mof-5). J Am Chem Soc. 2007;129(46):14176-14177. [368] Zheng J, Lennon EM, Tsao H-K, Sheng Y-J, Jiang S. Transport of a liquid water and methanol mixture through carbon nanotubes under a chemical potential gradient. J Chem Phys. 2005;122:214702. [369] Palinkas G, Hawlicka E, Heinzinger K. A molecular dynamics study of liquid methanol with a flexible three-site model. J Phys Chem. 1987;91(16):4334-4341. [370] Nalaparaju A, Zhao X, Jiang J. Molecular understanding for the adsorption of water and alcohols in hydrophilic and hydrophobic zeolitic metal− organic frameworks. J Phys Chem C. 2010;114(26):11542-11550. [371] Chen B, Ji Y, Xue M, Fronczek FR, Hurtado EJ, Mondal JU, et al. Metal− organic framework with rationally tuned micropores for selective adsorption of water over methanol. Inorganic chemistry. 2008;47(13):5543-5545. [372] James SL. Metal-organic frameworks. Chem Soc Rev. 2003;32(5):276-288. [373] de Lima GF, Mavrandonakis A, de Abreu HA, Duarte HA, Heine T. Mechanism of alcohol–water separation in metal–organic frameworks. J Phys Chem C. 2013;117(8):4124-4130. [374] Chen YF, Lee JY, Babarao R, Li J, Jiang JW. A highly hydrophobic metal−organic framework zn(bdc)(ted)0.5 for adsorption and separation of ch3oh/h2o and co2/ch4: An integrated experimental and simulation study. J Phys Chem C. 2010;114(14):6602-6609. [375] Gutierrez-Sevillano JJ, Caro-Perez A, Dubbeldam D, Calero S. Molecular simulation investigation into the performance of cu-btc metal-organic frameworks for carbon dioxide-methane separations. Phys Chem Chem Phys. 2011;13(45):20453-20460.
185

[376] Mayo SL, Olafson BD, Goddard WA. Dreiding: A generic force field for molecular simulations. J Phys Chem. 1990;94(26):8897-8909. [377] Wallqvist A. Molecular dynamics study of hydrophobic aggregation in water/methane/methanol systems. Chem Phys Lett. 1991;182(3–4):237-241. [378] Haughney M, Ferrario M, McDonald IR. Molecular-dynamics simulation of liquid methanol. J Phys Chem. 1987;91(19):4934-4940. [379] Nguyen VT, Do D, Nicholson D, Jagiello J. Effects of temperature on adsorption of methanol on graphitized thermal carbon black: A computer simulation and experimental study. J Phys ChemC. 2011;115(32):16142-16149. [380] Birkett G, Do D. Simulation study of methanol and ethanol adsorption on graphitized carbon black. Mol Simulat. 2006;32(10-11):887-899. [381] Jorgensen WL. Optimized intermolecular potential functions for liquid alcohols. The Journal of Physical Chemistry. 1986;90(7):1276-1284. [382] Martínez-Alonso A, Tascón JMD, Bottani EJ. Physical adsorption of ar and co2 on c60 fullerene. J Phys Chem B. 2000;105(1):135-139. [383] Yang Z, Peng X, Cao D. Carbon dioxide capture by pafs and an efficient strategy to fast screen porous materials for gas separation. J Phys Chem C. 2013;117(16):8353-8364. [384] Sun Y, Kollman PA. Hydrophobic solvation of methane and nonbond parameters of the tip3p water model. J Comput Chem. 1995;16(9):1164-1169. [385] Young WS, Brooks Iii CL. A reexamination of the hydrophobic effect: Exploring the role of the solvent model in computing the methane--methane potential of mean force. J Chem Phys. 1997;106(22):9265-9269. [386] Mark P, Nilsson L. Structure and dynamics of the tip3p, spc, and spc/e water models at 298 k. J Phys Chem A. 2001;105(43):9954-9960. [387] Kwak T, Mansoori G. Van der waals mixing rules for cubic equations of state. Applications for supercritical fluid extraction modelling. Chemical engineering science. 1986;41(5):1303-1309. [388] van Leeuwen ME, Smit B. Molecular simulation of the vapor-liquid coexistence curve of methanol. The Journal of Physical Chemistry. 1995;99(7):1831-1833. [389] Haughney M, Ferrario M, McDonald IR. Pair interactions and hydrogen-bond networks in models of liquid methanol. Mol Phys. 1986;58(4):849-853.
186

[390] Shevade AV, Jiang S, Gubbins KE. Adsorption of water—methanol mixtures in carbon and aluminosilicate pores: A molecular simulation study. Mol Phys. 1999;97(10):1139-1148. [391] Zhang Q, Zheng J, Shevade A, Zhang L, Gehrke SH, Heffelfinger GS, et al. Transport diffusion of liquid water and methanol through membranes. J Chem Phys. 2002;117:808. [392] Thornton AW, Nairn KM, Hill JM, Hill AJ, Hill MR. Metal-organic frameworks impregnated with magnesium-decorated fullerenes for methane and hydrogen storage. J Am Chem Soc. 2009;131(30):10662-10669. [393] Mahoney MW, Jorgensen WL. Diffusion constant of the tip5p model of liquid water. J Chem Phys. 2001;114(1):363-366. [394] Krishna R. Diffusion of binary mixtures across zeolite membranes: Entropy effects on permeation selectivity. Ind Eng Chem Res. 2001;28(3):337-346. [395] Robeson LM. The upper bound revisited. J Membr Sci. 2008;320(1–2):390-400. [396] Qiao X, Chung T-S, Pramoda K. Fabrication and characterization of btda-tdi/mdi (p84) co-polyimide membranes for the pervaporation dehydration of isopropanol. J Membr Sci. 2005;264(1):176-189. [397] Zheng J, Lennon EM, Tsao H-K, Sheng Y-J, Jiang S. Transport of a liquid water and methanol mixture through carbon nanotubes under a chemical potential gradient. J Chem Phys. 2005;122:214702. [398] Shevade AV, Jiang S, Gubbins KE. Molecular simulation study of water-methanol mixtures in activated carbon pores. Journal of Chemical Physics. 2000;113(16):6933-6942. [399] Jorgensen WL, Chandrasekhar J, Madura JD, Impey RW, Klein ML. Comparison of simple potential functions for simulating liquid water. J Chem Phys. 1983;79(2):926-935. [400] Raabe G, Sadus RJ. Molecular simulation of the vapor–liquid coexistence of mercury. J Chem Phys. 2003;119:6691. [401] Mahoney MW, Jorgensen WL. A five-site model for liquid water and the reproduction of the density anomaly by rigid, nonpolarizable potential functions. J Chem Phys. 2000;112:8910. [402] Kuhn J, Castillo-Sanchez JM, Gascon J, Calero S, Dubbeldam D, Vlugt TJH, et al. Adsorption and diffusion of water, methanol, and ethanol in all-silica dd3r: Experiments and simulation. J Phys Chem C. 2009;113(32):14290-14301.
187

[403] Cavenati S, Grande CA, Rodrigues AE. Adsorption equilibrium of methane, carbon dioxide, and nitrogen on zeolite 13x at high pressures. Journal of Chemical & Engineering Data. 2004;49(4):1095-1101. [404] Shimekit B, Mukhtar H. Natural gas purification technologies - major advances for co2 separation and future directions. Croatia: INTECH Open Access Publisher; 2012. [405] Yang RT. Gas separation by adsorption processes. London: Imperial College Press.; 1997. [406] Li Y, Chung TS, Kulprathipanja S. Novel ag+‐zeolite/polymer mixed matrix membranes with a high co2/ch4 selectivity. AlChE J. 2007;53(3):610-616. [407] Energy PG. Introduction to primus stg technology 05/03/ 2013. [408] Dortmundt D, Doshi K. Recent developments in co2 removal membrane technology. UOP LLC. 1999. [409] Krooss B, Van Bergen F, Gensterblum Y, Siemons N, Pagnier H, David P. High-pressure methane and carbon dioxide adsorption on dry and moisture-equilibrated pennsylvanian coals. Int J Coal Geol. 2002;51(2):69-92. [410] White CM, Smith DH, Jones KL, Goodman AL, Jikich SA, LaCount RB, et al. Sequestration of carbon dioxide in coal with enhanced coalbed methane recovery a review. Energ Fuel. 2005;19(3):659-724. [411] Liu B, Smit B. Comparative molecular simulation study of co2/n2 and ch4/n2 separation in zeolites and metal−organic frameworks. Langmuir. 2009;25(10):5918-5926. [412] Colombo L, Cursan M, Dell’orto L, Piccinelli C, Riboldi L. Gorgon natural gas project. Norwegian University of Science and Technology, 2010. [413] Rojey A, Jaffret C, Marshall N. Natural gas: Production, processing, transport: Editions Technip Paris,, France; 1997. [414] Hagoort J. Fundamentals of gas reservoir engineering: Elsevier; 1988. [415] Ebenezer SA, Gudmundsson J. Tracer behaviour in pipelines with deposits and analysis of natural gas pressure functions. Norwegian University of Science and Technology, Diploma Diploma, July 2006 [416] Kohl AL, Nielsen R. Gas purification: Gulf Professional Publishing; 1997. [417] Mersmann A, Kind M, Stichlmair J. Thermal separation technology: Springer; 2011.
188

[418] Kerry FG. Industrial gas handbook: Gas separation and purification: CRC Press; 2010. [419] Shekhawat D, Luebke DR, Pennline HW. A review of carbon dioxide selective membranes. Pittsburgh, PA; 2003. [420] Porter MC. Handbook of industrial membrane technology. United States: Noyes Publications; 1989. [421] Babarao R, Hu Z, Jiang J, Chempath S, Sandler SI. Storage and separation of co2 and ch4 in silicalite, c168 schwarzite, and irmof-1: A comparative study from monte carlo simulation. Langmuir. 2006;23(2):659-666. [422] Li Y, Yi H, Tang X, Li F, Yuan Q. Adsorption separation of co2/ch4 gas mixture on the commercial zeolites at atmospheric pressure. Chem Eng J. 2013;229(0):50-56. [423] Babarao R, Jiang J, Sandler SI. Molecular simulations for adsorptive separation of co2/ch4 mixture in metal-exposed, catenated, and charged metal−organic frameworks. Langmuir. 2008;25(9):5239-5247. [424] Liu B, Smit B. Molecular simulation studies of separation of co2/n2, co2/ch4, and ch4/n2 by zifs. J Phys Chem C. 2010;114(18):8515-8522. [425] Ebner AD, Ritter JA. State-of-the-art adsorption and membrane separation processes for carbon dioxide production from carbon dioxide emitting industries. Sep Sci Technol. 2009;44(6):1273-1421. [426] He L-N, Rogers RD, Su D, Tundo P, Zhang ZC. Porous materials for carbon dioxide capture: Springer; 2014. [427] Peng X, Cao D, Wang W. Computational study on purification of co2 from natural gas by c60 intercalated graphite. Ind Eng Chem Res. 2010;49(18):8787-8796. [428] Alawisi H, Li B, He Y, Arman HD, Asiri AM, Wang H, et al. A microporous metal–organic framework constructed from a new tetracarboxylic acid for selective gas separation. Crystal Growth & Design. 2014;14(5):2522-2526. [429] Besler BH, Merz KM, Kollman PA. Atomic charges derived from semiempirical methods. J Comput Chem. 1990;11(4):431-439. [430] Chirlian LE, Francl MM. Atomic charges derived from electrostatic potentials: A detailed study. J Comput Chem. 1987;8(6):894-905.
189

[431] Babarao R, Jiang J. Diffusion and separation of co2 and ch4 in silicalite, c168 schwarzite, and irmof-1: A comparative study from molecular dynamics simulation. Langmuir. 2008;24(10):5474-5484. [432] Liu J, Keskin S, Sholl DS, Johnson JK. Molecular simulations and theoretical predictions for adsorption and diffusion of ch4/h2 and co2/ch4 mixtures in zifs. J Phys Chem C. 2011;115(25):12560-12566. [433] Li W, Shi H, Zhang J. From molecules to materials: Computational design of n-containing porous aromatic frameworks for co2 capture. ChemPhysChem. 2014;15(9):1772-1778. [434] Kong L, Zou R, Bi W, Zhong R, Mu W, Liu J, et al. Selective adsorption of co2/ch4, co2/n2 within a charged metal-organic framework. Journal of Materials Chemistry A. 2014;2(42):17771-17778. [435] Ryckaert J-P, Bellemans A. Molecular dynamics of liquid alkanes. Farad Discuss Chem Soc. 1978;66:95-106. [436] KWAK TY, MANSOORI GA. Van der waals mixing rules for cubic equations of state, applications for supercritical fluid extraction modelling Chem EngSci. 1986; 41:1303-1309. [437] Mendoza-Cortés JL, Han SS, Furukawa H, Yaghi OM, Goddard III WA. Adsorption mechanism and uptake of methane in covalent organic frameworks: Theory and experiment. J Phys Chem A. 2010;114(40):10824-10833. [438] Kresse G, Furthmüller J. Efficiency of ab-initio total energy calculations for metals and semiconductors using a plane-wave basis set. Comput Mater Sci. 1996;6(1):15-50. [439] Blöchl PE. Projector augmented-wave method. Physical Review B. 1994;50(24):17953. [440] Perdew JP, Burke K, Ernzerhof M. Generalized gradient approximation made simple. Physical review letters. 1996;77(18):3865. [441] Grimme S. Semiempirical gga‐type density functional constructed with a long‐range dispersion correction. J Comput Chem. 2006;27(15):1787-1799. [442] Whitener KE. Theoretical studies of ch4 inside an open-cage fullerene: Translation−rotation coupling and thermodynamic effects. J Phys Chem A. 2010;114(45):12075-12082.
190

[443] Cossi M, Gatti G, Canti L, Tei L, Errahali M, Marchese L. Theoretical prediction of high pressure methane adsorption in porous aromatic frameworks (pafs). Langmuir. 2012;28(40):14405-14414. [444] Fraccarollo A, Canti L, Marchese L, Cossi M. Monte carlo modeling of carbon dioxide adsorption in porous aromatic frameworks. Langmuir. 2014;30(14):4147-4156. [445] Lan J, Cao D, Wang W. High uptakes of methane in li-doped 3d covalent organic frameworks. Langmuir. 2009;26(1):220-226. [446] Bae Y-S, Farha OK, Spokoyny AM, Mirkin CA, Hupp JT, Snurr RQ. Carborane-based metal-organic frameworks as highly selective sorbents for co2 over methane. Chem Commun. 2008(35):4135-4137. [447] Thornton AW, Dubbeldam D, Liu MS, Ladewig BP, Hill AJ, Hill MR. Feasibility of zeolitic imidazolate framework membranes for clean energy applications. Energ Environ Sci. 2012;5(6):7637-7646. [448] Perez-Carbajo J, Gomez-Alvarez P, Bueno-Perez R, Merkling PJ, Calero S. Optimisation of the fischer-tropsch process using zeolites for tail gas separation. Phys Chem Chem Phys. 2014;16(12):5678-5688. [449] Yang Q, Zhong C. Molecular simulation of carbon dioxide/methane/hydrogen mixture adsorption in metal-organic frameworks. J Phys Chem B. 2006;110(36):17776-17783. [450] Liu Y, Liu D, Yang Q, Zhong C, Mi J. Comparative study of separation performance of cofs and mofs for ch4/co2/h2 mixtures. Ind Eng Chem Res. 2010;49(6):2902-2906. [451] Wu X, Niknam Shahrak M, Yuan B, Deng S. Synthesis and characterization of zeolitic imidazolate framework zif-7 for co2 and ch4 separation. Microporous Mesoporous Mater. 2014;190(0):189-196.
191