molecular level processes and nanostructure evolution ... · generally accepted that the formation...
TRANSCRIPT

Molecular Level Processes and Nanostructure Evolution During theFormation of the Cubic Mesoporous Material KIT-6
Sharon Ruthstein,† Judith Schmidt,‡ Ellina Kesselman,‡ Ronit Popovitz-Biro,§
Liora Omer,†,‡ Veronica Frydman,§ Yeshayahu Talmon,‡ and Daniella Goldfarb*,†
Department of Chemical Physics and the Chemical Research Support Unit, The Weizmann Institute ofScience, RehoVot 76100, Israel, and Department of Chemical Engineering, Technion - Israel Institute of
Technology, Haifa 32000, Israel
ReceiVed September 7, 2007. ReVised Manuscript ReceiVed December 25, 2008
This study focuses on the formation mechanism of the bicontinuous cubic Ia3jd mesoporous materialKIT-6, both on the molecular and on the mesoscopic levels. KIT-6 is synthesized with Pluronic P123(PEO20PPO70PEO20), low acid concentration, and n-butanol at 40 °C. Through in situ EPR measurementson a series of spin-labeled Pluronic molecules introduced at minute quantities into the reaction mixture,changes in the hydrophobicity and the mobility of the polymer chains during the reaction were observed.In addition, to learn more on the functionality of the butanol in this synthesis, freeze-quench electronspin–echo envelope modulation (ESEEM) measurements on reaction mixtures in D2O and in butanol-d10
were preformed. The above experiments gave information on variations in the butanol location and contentin the micellar structures during the formation of KIT-6. The evolution of the solution nanostructureswas determined by cryo-TEM. Five main stages were resolved: the first two occurred during the first140 min of the reaction, where condensation of the silica oligomers takes place at the micellar/waterinterface; this induces depletion of water and butanol molecules from the core-corona interface andreduces the mobility of the ends of the Pluronic chains located at the corona-water interface. This inturn leads to a transition from spheroidal micelles to threadlike micelles and to their aggregation towardthe end of the second stage. During the third stage, precipitation (140–160 min), reorganization in themicellar structure, and a change in the relative sizes of core and corona take place. The fourth stage, thatends around 6 h, involves the formation of a hexagonal phase, through accelerated condensation of silicaoligomers in the corona, accompanied by extensive depletion of water and butanol molecules. The presenceof butanol in the micelle corona is essential in the last stage, 6–24 h, where the cubic phase is formed.We show that the addition of butanol to the reaction mixture of SBA-15 after the formation of the hexagonalphase leads to the formation of the cubic phase.
Introduction
Mesoporous materials with large pore diameter, in the rangeof 2–30 nm, are obtained using nonionic block copolymersurfactants, such as poly(ethylene oxide)-poly(propyleneoxide)-poly(ethylene oxide) (Pluronics, PEOxPPOy PEOx).1
The two-dimensional (2D)-hexagonal SBA-15 was the firstmaterial that was synthesized with Pluronic.2 It has attractedconsiderable attention because of its high structure regularity,thick inorganic walls, and excellent thermal and hydrothermalstability, its low-cost and nontoxic template, and becausethe simple and reproducible synthesis. In addition, one ofthe interesting properties of SBA-15 is the coexistence ofmeso- and micropores.3 The source of the microporosity hasbeen ascribed to PEO chains that are trapped in the silica
network during the synthesis and are removed by calcination,leaving open micropores.3–5
Mesoporous materials consisting of interconnected largecage-type pores (>5 nm), organized in a three-dimensionalnetwork, are expected to be superior to hexagonal structureswith one-dimensional channels for applications involvingselectively tuned diffusion, immobilization of large mol-ecules, or host–guest interactions in nanostructured materials.6,7
However, mesoporous materials with cubic symmetry areusually more difficult to prepare than the 2D hexagonalcounterparts, and they can be obtained only in a narrow rangeof synthesis mixture compositions.1,6,8 Recent reports indicatethat bicontinuous body-centered (Ia3jd) cubic mesostructuredsilica with large pores can be obtained using additives such
† Department of Chemical Physics, The Weizmann Institute of Science.‡ Technion - Israel Institute of Technology.§ Chemical Research Support Unit, The Weizmann Institute of Science.
(1) Zhao, D.; Huo, Q.; Feng, J.; Chmelka, B. F.; Stucky, G. D. J. Am.Chem. Soc. 1998, 120, 6024.
(2) Zhao, D.; Feng, J.; Huo, Q.; Melosh, N.; Fredrickson, G.; Chmelka,B.; Stucky, G. D. Science 1998, 279, 548.
(3) Ryoo, R.; Ko, C. H.; Kruk, M.; Antochshuk, V.; Jaroniec, M. J. Phys.Chem. B 2000, 104, 11465.
(4) Impéror-Celrc, M.; Davidson, P.; Davidson, A. J. Am. Chem. Soc.2000, 122, 11925.
(5) Ruthstein, S.; Frydman, V.; Kababya, S.; Landau, M.; Goldfarb, D.J. Phys. Chem. B. 2003, 107, 107.
(6) Alfredsson, V.; Anderson, M. W. Chem. Mater. 1996, 8, 1141.(7) Sakamoto, Y.; Kim, T-W.; Ryoo, R.; Terasaki, O. Angew. Chem., Int.
Ed. 2004, 43, 5231.(8) Voort, P. V. D.; Ravikovitch, P. I.; Jong, K. P. D.; Neimark, A. V.;
Janssen, A. H.; Benjelloun, M.; Van Bavel, E.; Cool, P.; Weckhuysen,B. M.; Vansant, E. F. Chem. Commun. 2002, 1010.
2779Chem. Mater. 2008, 20, 2779–2792
10.1021/cm7025619 CCC: $40.75 2008 American Chemical SocietyPublished on Web 03/18/2008

as inorganic salts and anionic surfactants9 with or without aswelling agent.10 Recently, Ryoo and co-workers11–13 re-ported a simple synthesis route to high-quality cubic Ia3jdsilica, using Pluronic P123 and n-butanol at low acidconditions. The advantage of this synthesis is its highreproducibility and the relatively large range of compositionsthat produce the ordered cubic phase. For a number ofsynthesis procedures of the bicontinuous cubic phase, it wasreported that variation in the relative amounts of additivescan lead to a transition from 2D hexagonal to cubicmaterial.9,10,13
Mesoporous materials are interesting also because of theirfascinating formation mechanism. In principle, the formationmechanism can be viewed at three length scales: (i) themolecular one, which involves the interaction between theorganic and the inorganic precursors and the silica poly-merization process; (ii) the mesoscopic scale, which involvesthe development of the micellar structure and the onset ofthe long-range order; and finally (iii) the macroscale whichis related to the shape/morphology of the final product. It isclear that the processes at the molecular level are the drivingforce for the mesoscale structure, but the question is howthe two scales are correlated.
Many studies that have focused on the formation mech-anism of various types of templated mesoporous materialshave been summarized in a number of reviews.14–17 Fordilute systems, where the surfactant concentration is low,such that liquid crystalline phases are not preformed, it isgenerally accepted that the formation of mesoporous materi-als occurs in two steps. The initial stage involves one of thefollowing processes: (i) preferable adsorption of silicate ionsat the micellar interface, driven either by charge matchingor hydrogen bonding,18,19 or (ii) the silicate oligomers notadsorbing at the micellar interface but instead formingsiliceous prepolymers that bind surfactant molecules in acooperative manner, resulting in the formation of newsilica-surfactant hybrid micellar aggregates.20 Most of theexperimental results are, however, more consistent with (i)than (ii).21–24 The next step involves also two possibilities:(i) Silicate adsorption leads to rearrangement of the original
micellar morphology, mainly lengthening the micelles,followed by condensation of the silicate-covered micellesinto ordered or disordered collapsed phases. (this is oftenreferred to as cooperative self-assembly mechanism 21) (ii)Alternatively, silicate adsorption does not change the mor-phology of the micelles but rather reduces the intermicellarrepulsion. This causes aggregation into larger particles andprecipitation of a disordered phase, which then may rearrangeto form an ordered phase.25,26
To account for the different phases formed, the surfactantpacking parameter, g ) υ/a0l,27,28 has been used to describethe surfactant organization in the self-assembly arrays andto predict the resulting mesostructures.1,29 υ is the chainvolume of the surfactant, a0 is the effective hydrophobic/hydrophilic interfacial area, and l is the kinetic surfactantchain length.27,28 The larger g, the lower the aggregatecurvature. g can be controlled by changing a0 through chargematching between the surfactant headgroup and the formingsilanoate in the case of charged surfactants. For nonionicsurfactants, like Pluronics, a0 is controlled via the hydrationof the PEO groups, which comprise the corona, that serveas effective headgroup.30 Another way to change g is throughthe organic chain packing. The charge-matching is mainlycontrolled by the pH, the cosurfactant concentration, and thecounteranion, whereas the organic packing is influenced bytemperature and organic additives.31
Most of the mechanistic studies reported so far havefocused on one length scale, and only a few attempts tocorrelate different length scales using different techniqueshave been reported. Examples are the application of in situ1H NMR (nuclear magnetic resonance) SAXS (small angleX-ray scattering), and TEM (transmission electron micros-copy) in the study of the formation mechanism of SBA-15by Flodström et al.26 In an earlier study we have combinedin situ continuous wave (CW) electron paramagnetic reso-nance (EPR) and freeze-quench electron spin–echo envelopemodulation (ESEEM) spectroscopy of spin probes with cryo-TEM (cryogenic-temperature TEM) in the study of theformation mechanism of SBA-15.32 Such EPR techniqueshad already been employed in the investigation of theformation of MCM-41.33–36 In these experiments molecularlevel information on the evolution of the tumbling rate of(9) Chen, D.; Li, Z.; Yu, C.; Shi, Y.; Zhang, Z.; Tu, B.; Zhao, D. Chem.
Mater. 2005, 17, 3228.(10) Chen, D.; Li, Z.; Wan, Y.; Tu, X.; Shi, Y.; Chen, Z.; Shen, W.; Yu,
C.; Tu, B.; Zhao, D. J. Mater. Chem. 2006, 16, 1511.(11) Kleitz, F.; Choi, S. H.; Ryoo, R. Chem. Commun. 2003, 2136.(12) Kleitz, F.; Liu, D.; Anilkumar, G. M.; Park, I.-S.; Solovyov, L. A.;
Shmakov, A. N.; Ryoo, R. J. Phys. Chem. B 2003, 107, 14296.(13) Kim, T.-W.; Kleitz, F.; Paul, B.; Ryoo, R. J. Am. Chem. Soc. 2005,
127, 7601.(14) Ying, J. Y.; Mehnert, C. P.; Wong, M. S. Angew. Chem., Int. Ed.
1999, 38, 56.(15) Wan, Y.; Zhao, D. Y. Chem. ReV. 2007, 107, 2821.(16) Epping, J. D.; Chmelka, B. F. Curr. Opin. Colloid Interface Sci. 2006,
11, 81.(17) Edler, K. J. Aust. J. Chem. 2005, 58, 627.(18) Huo, Q.; Margolese, D. I.; Ciesla, U.; Feng, P.; Gier, T. E.; Sieger,
P.; Leon, R.; Petroff, P.; Schüth, F.; Stucky, G. D. Nature 1994, 368,317.
(19) Tanev, P. T.; Pinnavia, T. J. Science 1995, 267, 865.(20) Frasch, J.; Lebeau, B.; Soulard, M.; Patarin, J.; Zana, R. Langmuir
2000, 16, 9049.(21) Firouzi, A.; Kumer, D.; Bull, L. M.; Besier, T.; Sieger, P.; Huo, Q.;
Walker, S. A.; Zasadzinski, A.; Glinka, C.; Nicol, J.; Margolese, D.;Stucky, G. D.; Chmelka, B. F. Science 1995, 267, 1138.
(22) Holmes, S. M.; Zholobenko, V. L.; Thursfield, A.; Plaisted, R. J.;Cundy, C. S.; Dwyer, J. J. Chem. Soc., Farady Trans. 1998, 94, 2025.
(23) Melosh, N. A.; Lipic, P.; Bates, F. S.; Wudl, F.; Stucky, G. D.;Fredrickson, G. H.; Chmelka, B. F. Macromolecules 1999, 32, 4332.
(24) Ruthstein, S.; Frydman, V.; Goldfarb, D. J. Phys. Chem. B 2004, 108,9016.
(25) Flodström, K.; Wennerström, H.; Teixeira, C. V.; Amenitsch, H.;Lindén, M.; Alfredsson, V. Langmuir 2004, 20, 10311.
(26) Flodström, K.; Wennerström, H.; Alfredsson, V. Langmuir 2004, 20,680.
(27) Israelchvili, J. N.; Mitchell, D. J.; Ninharn, B. J. Chem. Soc., FaradayTrans. 2 1976, 72, 1525.
(28) Israelchvili, J. N. Intermolecular and Surface Forces, 2nd ed.;Academic: London, 1990.
(29) Ciesla, U.; Schüth, F. Microporous Mesoporous Mater. 1999, 27, 131.(30) Kipkemboi, P.; Fogden, A.; Alfredsson, V.; Flodström, K. Langmuir
2001, 17, 5398.(31) Lin, H.-P.; Mou, C.-Y. Acc. Chem. Res. 2002, 35, 927.(32) Ruthstein, S.; Schmidt, J.; Kesselman, E.; Talmon, Y.; Goldfarb, D.
J. Am. Chem. Soc. 2006, 128, 3367.(33) Zhang, J.; Luz, Z.; Goldfarb, D. J. Phys. Chem. B 1997, 101, 7087.(34) Zhang, J.; Luz, Z.; Zimmermann, H.; Goldfarb, D. J. Phys. Chem. B
2000, 104, 279.(35) Zhang, J.; Carl, P. J.; Zimmermann, H.; Goldfarb, D. J. Phys. Chem.
B 2002, 106, 5382.
2780 Chem. Mater., Vol. 20, No. 8, 2008 Ruthstein et al.
the organic molecules and the polarity and water content oftheir close environment during the reaction was obtained.The development of the microstructures during the reactionwas studied by cryo-TEM. In cryo-TEM the supramolecularstructures in solution are observed by vitrifying a thin layerof a solution without staining or drying the sample, whichmay change the properties of the intermediates. On the basisof these studies, we suggested a model for the formation ofSBA-15.5,24,32
While a number of studies focused on the formationmechanism of SBA-155,24,26,32 less work has been done onthe formation of cubic materials formed with Pluronics. Herewe explore the formation mechanism of the cubic material,KIT-6, through in situ CW EPR and freeze-quench ESEEMmeasurements using selected Pluronic spin-labels, and cryo-TEM and freeze fracture replication (FFR) experiments, tostudy the nanostructures which formed during the reaction,before and after precipitation. On the basis of the EPR andTEM results we present a model for the formation of KIT-6, explain the role of the butanol, and compare it with thatof SBA-15 and with other reported mechanisms for cubicphases. Moreover, the results obtained lead to an alternativesynthesis procedure.
Experimental Section
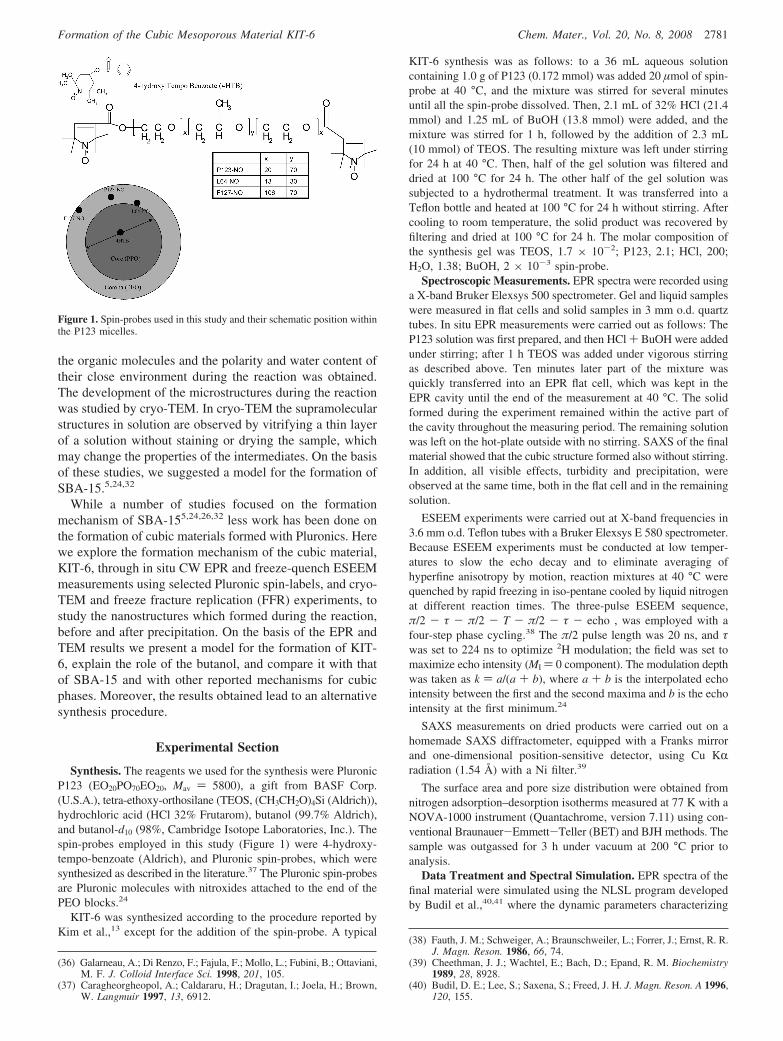
Synthesis. The reagents we used for the synthesis were PluronicP123 (EO20PO70EO20, Mav ) 5800), a gift from BASF Corp.(U.S.A.), tetra-ethoxy-orthosilane (TEOS, (CH3CH2O)4Si (Aldrich)),hydrochloric acid (HCl 32% Frutarom), butanol (99.7% Aldrich),and butanol-d10 (98%, Cambridge Isotope Laboratories, Inc.). Thespin-probes employed in this study (Figure 1) were 4-hydroxy-tempo-benzoate (Aldrich), and Pluronic spin-probes, which weresynthesized as described in the literature.37 The Pluronic spin-probesare Pluronic molecules with nitroxides attached to the end of thePEO blocks.24
KIT-6 was synthesized according to the procedure reported byKim et al.,13 except for the addition of the spin-probe. A typical
KIT-6 synthesis was as follows: to a 36 mL aqueous solutioncontaining 1.0 g of P123 (0.172 mmol) was added 20 µmol of spin-probe at 40 °C, and the mixture was stirred for several minutesuntil all the spin-probe dissolved. Then, 2.1 mL of 32% HCl (21.4mmol) and 1.25 mL of BuOH (13.8 mmol) were added, and themixture was stirred for 1 h, followed by the addition of 2.3 mL(10 mmol) of TEOS. The resulting mixture was left under stirringfor 24 h at 40 °C. Then, half of the gel solution was filtered anddried at 100 °C for 24 h. The other half of the gel solution wassubjected to a hydrothermal treatment. It was transferred into aTeflon bottle and heated at 100 °C for 24 h without stirring. Aftercooling to room temperature, the solid product was recovered byfiltering and dried at 100 °C for 24 h. The molar composition ofthe synthesis gel was TEOS, 1.7 × 10⁻²; P123, 2.1; HCl, 200;H2O, 1.38; BuOH, 2 × 10⁻³ spin-probe.
Spectroscopic Measurements. EPR spectra were recorded usinga X-band Bruker Elexsys 500 spectrometer. Gel and liquid sampleswere measured in flat cells and solid samples in 3 mm o.d. quartztubes. In situ EPR measurements were carried out as follows: TheP123 solution was first prepared, and then HCl + BuOH were addedunder stirring; after 1 h TEOS was added under vigorous stirringas described above. Ten minutes later part of the mixture wasquickly transferred into an EPR flat cell, which was kept in theEPR cavity until the end of the measurement at 40 °C. The solidformed during the experiment remained within the active part ofthe cavity throughout the measuring period. The remaining solutionwas left on the hot-plate outside with no stirring. SAXS of the finalmaterial showed that the cubic structure formed also without stirring.In addition, all visible effects, turbidity and precipitation, wereobserved at the same time, both in the flat cell and in the remainingsolution.
ESEEM experiments were carried out at X-band frequencies in3.6 mm o.d. Teflon tubes with a Bruker Elexsys E 580 spectrometer.Because ESEEM experiments must be conducted at low temper-atures to slow the echo decay and to eliminate averaging ofhyperfine anisotropy by motion, reaction mixtures at 40 °C werequenched by rapid freezing in iso-pentane cooled by liquid nitrogenat different reaction times. The three-pulse ESEEM sequence,π/2 - τ - π/2 - T - π/2 - τ - echo , was employed with afour-step phase cycling.38 The π/2 pulse length was 20 ns, and τwas set to 224 ns to optimize 2H modulation; the field was set tomaximize echo intensity (MI ) 0 component). The modulation depthwas taken as k ) a/(a + b), where a + b is the interpolated echointensity between the first and the second maxima and b is the echointensity at the first minimum.24
SAXS measurements on dried products were carried out on ahomemade SAXS diffractometer, equipped with a Franks mirrorand one-dimensional position-sensitive detector, using Cu KRradiation (1.54 Å) with a Ni filter.39
The surface area and pore size distribution were obtained fromnitrogen adsorption–desorption isotherms measured at 77 K with aNOVA-1000 instrument (Quantachrome, version 7.11) using con-ventional Braunauer-Emmett-Teller (BET) and BJH methods. Thesample was outgassed for 3 h under vacuum at 200 °C prior toanalysis.
Data Treatment and Spectral Simulation. EPR spectra of thefinal material were simulated using the NLSL program developedby Budil et al.,40,41 where the dynamic parameters characterizing
(36) Galarneau, A.; Di Renzo, F.; Fajula, F.; Mollo, L.; Fubini, B.; Ottaviani,M. F. J. Colloid Interface Sci. 1998, 201, 105.
(37) Caragheorgheopol, A.; Caldararu, H.; Dragutan, I.; Joela, H.; Brown,W. Langmuir 1997, 13, 6912.
(38) Fauth, J. M.; Schweiger, A.; Braunschweiler, L.; Forrer, J.; Ernst, R. R.J. Magn. Reson. 1986, 66, 74.
(39) Cheethman, J. J.; Wachtel, E.; Bach, D.; Epand, R. M. Biochemistry1989, 28, 8928.
(40) Budil, D. E.; Lee, S.; Saxena, S.; Freed, J. H. J. Magn. Reson. A 1996,120, 155.
Figure 1. Spin-probes used in this study and their schematic position withinthe P123 micelles.
2781Chem. Mater., Vol. 20, No. 8, 2008Formation of the Cubic Mesoporous Material KIT-6
the molecular motion are obtained by a nonlinear least-squares fitof the experimental spectrum to model calculations based on thestochastic Liouville equation. We used a Brownian diffusion modeland an axially symmetric rotational diffusion tensor, thus definingtwo rate constants, R| and R⊥ . The simulations require the principalcomponents of the g and A tensors. The principal g values ofPluronic spin-probes were assumed to be similar to the g values ofL62-NO, determined previously by recording a spectrum at Wband,5 yielding gxx ) 2.0069, gyy ) 2.0052, and gzz ) 2.0000. Thevalues Axx ) Ayy ) 0.58 mT and Azz ) 3.52 mT were determinedby fitting the rigid limit spectrum of KIT-6 with F127-NO. Weused the same hyperfine coupling for the two species observedexperimentally, because the changes in the local polarity is smallcompared to the inhomogeneous line width, and in the final materialthe differences between the two types are governed by the rotationaldiffusion rates.
The high-field component of the EPR spectra recorded duringthe reaction, was simulated using a superposition of two Lorentzianlines. From this simulation aN, the line-width and the relativeamount of each species were determined. The isotropic rotationalcorrelation time, τc (in seconds) for a spectrum characterized byone species has been calculated according to the formula:42
τc ) (6.51 × 10⁻¹⁰)∆H(0){[h(0)/h(-1)]1/2 +
[h(0)/h(1)]1/2 - 2}
where ∆H(0) is the peak-to-peak line width in Gauss of the MI )0 component, and h(-1), h(0), and h(1) are the peak to peak heightsof the M ) -1, 0, and +1 lines, respectively. For a spectrum withtwo species, τc was obtained through simulations using the programGarlic of the Easyspin software package,43 with g ) (2.0069,2.0052, 2.0000), and aN, line-width, and the relative amount of eachspecies obtained from the deconvolution of the high-field componentas described above were used as starting values.
FT of the three pulse ESEEM traces was carried out as follows:The traces were phased and normalized to 1, after which apolynomial baseline correction was preformed, followed by apodiza-tion with an exponential window and zero filling to 512 points.Finally, FT was performed, and magnitude spectra were calculatedusing cross-term averaging.44 All these manipulations were carriedout with Matlab (The Mathworks, Inc.).
Microscopy Measurements. Vitrified specimens for cryo-TEMwere prepared in a controlled environment vitrification system(CEVS). 45 All solutions were quenched from 40 °C and 100%relative humidity by plunging into liquid ethane at its freezing point.Specimens were examined in a FEI Tecnai T12 microscope,operated at 120 kV, using a Gatan Instruments 626 DH cryo-holdersystem. All specimens were observed in the microscope ap-proximately at -170 °C. Images were recorded digitally in theminimal electron dose mode by a Gatan High Resolution US1000cooled-CCD camera with the DigitalMicrograph software package.
Freeze-fracture-replication (FFR) was performed with a BAF-060 system (BalTec AG, Liechtenstein). A small drop of the samplewas placed on an electron microscopy copper grid and sandwichedbetween two gold planchettes. The sandwich was plunged into liquid
ethane at its freezing point, transferred into liquid nitrogen, andinserted into a sample fracture block, precooled by liquid nitrogen.The block was inserted into the BAF-system vacuum chamber,maintained at -160 to -170 °C, and split open to fracture the frozensample drop. The fracture surfaces were first etched at -110 °Cfor 30 s and then shadowed at a 15 ° angle with a 2 nm layer ofplatinum carbon, followed by backing with a 20 nm thick carbonlayer. The replicas were retrieved from the thawed samples, cleanedfirst in 6% hydrofluoric acid (prepared from HF 38–40%, Merck)and then in double-distilled water, mounted on TEM grids, andexamined in the FEI T12 TEM (see above) at room temperature.
TEM samples of the final KIT-6 product were prepared bydispersing the powder in 1:1 EtOH/water solution, followed by 30min of sonication. Then drops of the dispersion were deposited ona carbon/collodion-coated 300 mesh copper grid and were air-dried.The specimens were examined by Philips CM120 or FEI T12transmission electron microscope operated at 120 kV. Digital imageswere recorded by a Gatan US1000 CCD camera, and fast Fouriertransforms (FFT) of the images were calculated by DigitalMicro-graph software.
Results
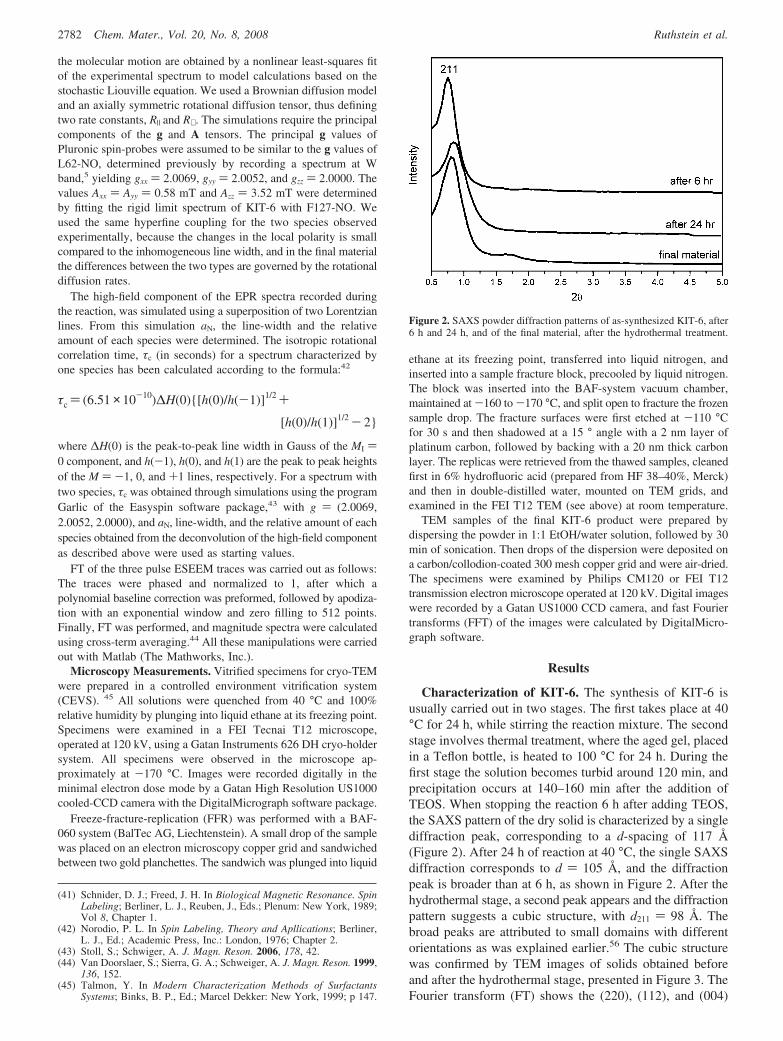
Characterization of KIT-6. The synthesis of KIT-6 isusually carried out in two stages. The first takes place at 40°C for 24 h, while stirring the reaction mixture. The secondstage involves thermal treatment, where the aged gel, placedin a Teflon bottle, is heated to 100 °C for 24 h. During thefirst stage the solution becomes turbid around 120 min, andprecipitation occurs at 140–160 min after the addition ofTEOS. When stopping the reaction 6 h after adding TEOS,the SAXS pattern of the dry solid is characterized by a singlediffraction peak, corresponding to a d-spacing of 117 Å(Figure 2). After 24 h of reaction at 40 °C, the single SAXSdiffraction corresponds to d ) 105 Å, and the diffractionpeak is broader than at 6 h, as shown in Figure 2. After thehydrothermal stage, a second peak appears and the diffractionpattern suggests a cubic structure, with d211 ) 98 Å. Thebroad peaks are attributed to small domains with differentorientations as was explained earlier.56 The cubic structurewas confirmed by TEM images of solids obtained beforeand after the hydrothermal stage, presented in Figure 3. TheFourier transform (FT) shows the (220), (112), and (004)
(41) Schnider, D. J.; Freed, J. H. In Biological Magnetic Resonance. SpinLabeling; Berliner, L. J., Reuben, J., Eds.; Plenum: New York, 1989;Vol 8, Chapter 1.
(42) Norodio, P. L. In Spin Labeling, Theory and Apllications; Berliner,L. J., Ed.; Academic Press, Inc.: London, 1976; Chapter 2.
(43) Stoll, S.; Schwiger, A. J. Magn. Reson. 2006, 178, 42.(44) Van Doorslaer, S.; Sierra, G. A.; Schweiger, A. J. Magn. Reson. 1999,
136, 152.(45) Talmon, Y. In Modern Characterization Methods of Surfactants
Systems; Binks, B. P., Ed.; Marcel Dekker: New York, 1999; p 147.
Figure 2. SAXS powder diffraction patterns of as-synthesized KIT-6, after6 h and 24 h, and of the final material, after the hydrothermal treatment.
2782 Chem. Mater., Vol. 20, No. 8, 2008 Ruthstein et al.

reflections typical of the Ia3jd cubic phase. The d-values ofthe as-synthesized material before and after hydrothermaltreatment yield a ) 24.8 and 23.6 nm, respectively, inagreement with earlier reports.11,13 These results show thatthe cubic structure is formed prior to the hydrothermal stage,although it is still not well ordered, and therefore its SAXSlacks the second peak. Nitrogen adsorption isotherm mea-sured on a calcined material after hydrothermal treatmentgave an average pore size of 87.4 Å and surface area of 598.4m2/g, in agreement with Kleitz et al.11 The addition of thespin probes to the reaction mixture did not alter the finalmaterial.
The effect of the hydrothermal stage on the final materialwas studied by EPR using different spin-probes, which arelocated at different positions in the P123 micelles, asindicated in Figure 1. The micelles have a hydrophobic core,consisting principally of the PPO block, and a hydrophiliccorona formed by the PEO segments.46 4HTB (see Figure 1)is located at the core of the micelle because of its hydro-phobic nature, and the location of the spin-labels of thePluronic spin-probes in the micelle’s corona depends on theirPEO chain length. L64-NO has the shortest PEO length andtherefore is located at the core-corona interface region,P123-NO is located in the micelle’s corona, and F127-NO,with the longest chain, is situated at the corona-waterinterface region. The positions of the spin-labels in the P123micelle were determined previously by their isotropic hy-perfine coupling (aN) and by k(2H) values from ESEEMmeasurements of micelle solutions in D2O.5 The depth ofthe 2H modulation depth (k(2H)) gives a qualitative measureto how far the spin-label is from the corona-water interface.
The spectra of the spin-probes in the dry solid before andafter the hydrothermal treatment are shown in Figure 4. Thespectrum of 4HTB before the hydrothermal treatment ischaracterized by a single mobile species. After the hydro-thermal treatment the EPR signal has disappeared due totransformation to a diamagnetic hydroxylamine in acidicsolution.47 The spectra of L64-NO and P123-NO in the drysolid obtained before hydrothermal treatment are typical of
a superposition of two species, one highly mobile and theother immobilized, whereas the spectrum of F127-NO showsonly one rigid species with Azz ) 3.35 mT. After thehydrothermal treatment the relative amount of the immo-bile species of L64-NO and P123-NO decreased and a mobilespecies appeared for F127-NO. The relative amounts of thetwo species in these samples were determined using NLSLsimulations, presented by dotted traces in Figure 4, and thebest fit parameters are listed in Table 1. The amount of themobile species after a hydrothermal treatment increased forall Pluronic spin-probes.
As observed here and also earlier for SBA-15,24 the endsof the spin-probes, depending on their PEO length, arepartitioned between micropores in the silica network (im-mobile) and the mesopores (mobile). The difference is thelarger decrease the hydrothermal treatment induced on theamount of the (immobile) species trapped in the silicanetwork for the KIT-6. This suggests 2 larger contraction ofthe silica layer, which increases the mesopore volume,leading to depletion of PEO chains from the silica network.This is in agreement with the increase in the mobility, R⊥ ,
(46) Wanka, G.; Hoffman, H.; Ulbricht, W. Macromolecules 1994, 27,4145.
(47) Rozantsev, E. G. Free Nitroxyl Radicals; Plenum Press: New York,1970.
Figure 3. TEM images of (a) dry KIT-6, before hydrothermal treatment, and of (b) calcined KIT-6, after hydrothermal treatment. The area within the largebox and in (b) is typical of [110] direction. The insets show the FFT with the assigned reflections.
Figure 4. Room temperature CW EPR spectra of the dry solid materialprepared with 4HTB, before hydrothermal treatment, and of L64-NO, P123-NO, and F127-NO before and after hydrothermal treatment (indicated inthe figure as hy). The dotted lines are simulated spectra. The dashed verticallines mark Azz features of the immobile species (modulation amplitude )1.0 G, spectrometer frequency 9.42 GHz).
2783Chem. Mater., Vol. 20, No. 8, 2008Formation of the Cubic Mesoporous Material KIT-6

of the immobile species for all spin-probes (Table 1), dueto increased volume.
EPR Measurements during the Reaction. Once the finalKIT-6 material has been characterized, we proceeded toinvestigate the formation of KIT-6 by in situ CW EPR andESEEM measurements. We used the same spin-probes,discussed in the previous section, which sense differentregions within the P123 micelle.
F127-NO. Throughout the reaction the spectrum of F127-NO is characterized by a single highly mobile species, andthe dependence of τc on the reaction time is shown in Figure5a. The P123 micelle diameter is around 10 nm,48 and itstumbling rate should be on the order of 10-6 s.25 This isseveral orders of magnitude larger than the observed τc,which is on the order of 10-10 s (see Table 2). Thus, τc isdetermined by the local motion of the nitroxide group.24,49
Because the label of F127-NO is located close to thecorona-water interface, it is sensitive to the interactionbetween the micellar interface and the forming silica, andthe changes in the mobility of the F127-NO are mostprobably associated with the condensation of the TEOShydrolysis product. Hence, it provides information regardingthe rate of formation of the silica layer. During the reactionτc increases, and four different stages, distinguished by theirslope, can be clearly identified: (a) 0–50 min, (b) 50–150min, (c) 150–350 min, and (d) t > 350 min with the largest
increase in τc occurring between 150 and 350 min. Turbidityis observed around 120 min, and precipitation occurs around150 min.
4HTB. The spectrum of 4HTB in the P123 micelles(indicated as t ) -5 min) exhibits a splitting in the highfield component, due to a distribution between two differentenvironments. The addition of butanol and acid (t )-1 min)results in only a subtle decrease in aN for both species(0.005–0.01 mT, see Table 2), indicating a slight increasein the hydrophobicity of the environment. During thereaction, the splitting of the high-field component persists,and Figure 6 shows the time dependence of the EPRspectrum of 4HTB at t ) 136–180 min. The spectra of theindividual components were resolved by simulations. Thecomponent with the lower 14N hyperfine splitting, aN, wastermed “phob”, because it is in a more hydrophobic environ-ment, and the species with the higher aN was termed “phil”(Figure 6). During the reaction, aN and τc of both speciesand their relative amount vary slightly (Figure 7a,b), but att ) 140–160 min (t ) 0 corresponds to the addition ofTEOS), when precipitation begins, considerable variationsare observed. aN (phob) decreases considerably, Rphob, therelative amount of “phob”, decreases from 0.77 at t ) 140min to 0.21 at t ) 160 min, and τc (phob) increases. aN (phil)decreases also, showing that it becomes more hydrophobic.Table 2 lists the values of aN, τc, and Rphob at t ) 0, 140,160, and 240 min (obtained from simulations of the wholespectrum), and Figure 7a,b shows the time evolution of aN
and Rphob. At 160 min a restoration toward the initial valuesbegins, reaching them at around 240 min.
(48) Ruthstein, S.; Potapov, A.; Raitsimring, A. M.; Goldfarb, D. J. Phys.Chem. B 2005, 109, 22843.
(49) Caragheorgheopol, A.; Caldararu, H.; Vasilescu, M.; Khan, A.;Angelescu, D.; Zikova, N.; Cejka, J. J. Phys. Chem. B 2004, 108,7735.
Table 1. Best-Fit Parameters Used in the Simulation Shown in Figure 4a
KIT-6, (L64-NO) KIT-6, hyb (L64-NO) KIT-6, (P123-NO) KIT-6, hy (P123-NO) KIT-6, (F127-NO) KIT-6, hy (F127-NO)
immobile/mobile immobile/mobile immobile/mobile immobile/mobile immobile immobile/mobileR⊥ 108 s-1 0.16/1.0 0.25/1.0 0.16/1.0 0.25/1.0 0.1 0.25/1.0R| × 108 s-1 0.032/1.6 0.032/1.6 0.032/1.6 0.032/1.6 0.002 0.032/1.6line-width [mT] 0.3/0.5 0.3/0.5 0.3/0.5 0.3/0.5 0.5 0.3/0.5extent of mobile species 16% 37% 14% 36% 0 30%
a The tilt angle, �, in all simulations is 40°; this value gave the best-fit. b hy corresponds to material obtained after the hydrothermal stage.
Figure 5. (a) Time evolution of τc of F127-NO during the formation of KIT-6 (40 °C). (b) Time evolution of k(2H) for 4HTB in a KIT-6 reaction mixturein D2O (top trace, solid and hollow squares correspond to two different experiments), 4HTB (solid circles), and P123-NO (two different experiments,squares and triangles) in a KIT-6 reaction mixture with butanol-d10. The circled data points correspond to t ) -1 min for 4HTB and P123-NO in a P123solution with butanol-d10 and HCl.
2784 Chem. Mater., Vol. 20, No. 8, 2008 Ruthstein et al.

Further insight into the formation of KIT-6, in particularat the earlier stages of the reaction, when the interactionbetween the silica precursors and the surfactant assembliesoccurs, was obtained from ESEEM experiments. In theseexperiments, two types of reaction mixtures were used, oneprepared in D2O and the other in H2O with deuteratedbutanol. The 2H modulation depth (k(2H)) was followed asa function of the reaction time for both types of solutions.These experiments were carried out on frozen solutions, andtherefore k(2H) is a weighted average of the two species.For 4HTB, except for t ) 140–160 min, “phob” constitutesthe majority of the sample (∼77%). The addition of BuOH+ HCl to the P123 micelles in D2O increases k(2H) from0.09 to 0.45. This huge increase is well manifested in the2H peak in the FT spectra of the ESEEM traces, presentedin Figure 8. The 1H signal corresponds to protons of thepolymer, the spin-probe, and BuOH.
There are two possible explanations for the increase ink(2H): (i) the destruction of the micelles and 4HTB dissolves
in monomers, which, however, should be associated with alarge increase in aN, which was not observed, and (ii)solvation of butanol molecules in the micelle, which increasesthe solubility of the PEO and the water content of the corona,causing its swelling. The water content in the core where4HTB is located decreases only slightly, as manifested inthe subtle decrease in aN which is affected mainly byhydrogen bonding to water molecules.50 In contrast to aN,k(2H) is sensitive to the presence of water molecules also ata longer distance, and therefore it increases considerably asthe water content close to the core/corona interface increases.
The time evolution of k(2H) of the D2O solution (t g 0),shown in Figure 5b, reveals four stages: (1) decrease betweent ) 0–20 min, (2) invariant at 20–150 min, (3) decrease at150–240 min, at a lower rate than observed in the first 20min, and (4) invariant at t > 240 min. At the precipitationtime k(2H) does not exhibit a considerable change, as mighthave been expected because of the displacement of most ofthe 4HTB molecules into the hydrophilic environment, aswas observed by CW EPR. However, at this time thehydrophobicity of both environments of 4HTB moleculesincreases, especially for the hydrophobic species, resultingin a fairly constant averaged k(2H).
The reaction mixture with butanol-d10 exhibited four stagesas well, but with some difference in the time ranges ascompared to k(2H) of the D2O solutions. These are shownin Figure 5b. The four stages are (1) decrease between t )0–50 min, (2) invariance at 50–150 min, (3) decrease at150–240 min, at a lower rate than observed in the first 50min of the reaction, and (4) invariant at t > 240 min.
In summary, the in situ CW EPR spectra of 4HTB revealedstructural reorganization of the micelles at the precipitationtime, associated with increased hydrophobicity, leading to alarge change in the partition of 4HTB between its twoenvironments. In addition, the ESEEM showed four stageswhere a significant depletion of water and butanol molecules
(50) Morrisett, J. D. In Spin Labeling, Theory and Applications; Berliner,L. J., Ed.; Academic Press, Inc.: London, 1976; Chapter 8.
Table 2. aN, τc, and Rphob of the Various Species of the Different Spin-Probes during the KIT-6 Reaction, at t ) 0 min, 140 min,160 min, and 4 ha
t ) -1 min (t) -5 min) t ) 140 min t ) 160 min t ) 4 h in water
τc × 1010 [s](phob)/(phil) (phob)/(phil) (phob)/(phil) (phob)/(phil)
4HTB 2.6/0.8 2.6/0.8 5.0/0.5 3.2/0.7 0.27 (4HT)L64-NO 3.5/1.0 3.0/1.0 3.0/1.0 3.0/1.2 1.0P123-NO 3.5/- 2.5/1.0 1.0/1.0 3.0/1.3 1.0F127-NO -/0.8 -/1.0 -/1.1 -/1.7 0.8L62-NO in SBA-15b -/2.0 2.8/2.1 2.8/2.2 2.8/2.3 1.0
aN [mT](phob)/(phil) (phob)/(phil) (phob)/(phil) (phob)/(phil)
4HTB 1.55 (1.55)/1.71 (1.72) 1.55/1.71 1.46/1.68 1.54/1.71 1.7 mT (4HT)L64-NO 1.52 (1.52)/1.59 (1.59) 1.52/1.60 1.49/1.60 1.48/1.60 1.6 mTP123-NO 1.54 (1.56)/- 1.54/1.61 1.58/1.59 1.50/1.60 1.6 mTF127-NO -/1.59 (1.59) -/1.59 -/1.59 -/1.59 1.6 mTL62-NO in SBA-15 -/1.55 1.46/1.59 1.46/1.59 1.46/1.59 1.6 mT
Rphob
4HTB 0.85 (0.85) 0.77 0.21 0.63L64-NO 0.94 (0.96) 0.83 0.73 0.7P123-NO 1.0 (1.0) 0.82 0.58 0.83L62-NO in SBA-15 0 0.45 0.45 0.45
a Data for spin-probe in water and L62-NO in SBA-15 are given as well for comparison. b Synthesized with 3 wt % P123, H3PO4, and TMOSat 50 °C.5
Figure 6. Time evolution of the EPR spectrum of 4HTB during theformation of KIT-6 at 40 °C. The dotted trace presents an example of asimulated spectrum with the parameters given in Table 2 (modulationamplitude ) 1.0 G, spectrometer frequency 9.42 GHz).
2785Chem. Mater., Vol. 20, No. 8, 2008Formation of the Cubic Mesoporous Material KIT-6

occurred after the addition of TEOS (up to approximately50 min) and after the precipitation time, between 150 and240 min.
P123-NO. At t ) 0 min, the CW spectrum shows thatP123-NO is located in a single environment, then, as thereaction progresses, part of it migrates to a more hydrophilicenvironment, first detected at t ∼ 10 min. Similar to 4HTB,
large variations occur at t ) 140–160 min (Figure 7c). Whileat t ) 140–160 min the environment of “phil” becomes morehydrophobic, that of “phob” turns more hydrophilic, oppositeto 4HTB. Moreover, at this time P123-NO is partitionedrather evenly between the two environments, and τc (phob)decreases. At t ) 240 min the system becomes invariant,reaching values which are slightly different than at t ) 0min; the environment “phob” is more hydrophobic, and alsoτc of both species decreases a little (see Table 2).
ESEEM experiments were carried out to follow the butanolcontent of the corona during the reaction. The time evolutionof k(2H) in reaction mixture with butanol-d10 (gray symbolsin Figure 5b) is similar to that of 4HTB, except for t ) 0min, where for P123-NO k(2H) ) 0.3 while for 4HTB it isk(2H) ) 0.2. This shows that the butanol prefers the coronaregion. However, after the addition of TEOS, at t ) 5 min,k(2H) ) 0.27 for both spin-probes, indicating a displacementof butanol molecules from the corona into the core-coronainterface. At t ) 5–50 min both probes experience areduction in k(2H), probably due to depletion of butanol fromboth regions. Then, up to 150 min, k(2H) stays constant forboth probes, but between 150 and 240 min, a faster averagedepletion of butanol molecules from the core and the coronais sensed by 4HTB and P123-NO. This means that butanol
Figure 7. (a) Time evolution of aN of the two species of 4HTB. (b) Time evolution of Rphob of 4HTB. (c) Time evolution of aN of the two species ofP123-NO. (d) Time evolution of aN of the two species of L64-NO. The solid and hollow symbols indicate two different experimental sets.
Figure 8. Magnitude FT-ESEEM spectra of 4HTB in 2.5 wt % P123micellar solution in D2O (gray line), before and after adding butanol withacid (dark line).
2786 Chem. Mater., Vol. 20, No. 8, 2008 Ruthstein et al.

is further displaced into the corona-water interface. From4 h up to 24 h no change is detected for both probes, andk(2H) ∼ 0.2.
In summary, similar to 4HTB the reorganization of themicelles at the precipitation time was sensed by P123-NO.The butanol preferred location is in the core/corona region,and between 150 and 240 min, after the precipitation, adepletion of butanol molecules from the corona to thecorona-water interface occurred.
L64-NO. The CW spectrum reveals two species at alltimes. While P123-NO and 4HTB are very sensitive to thereorganization that occurs at 140–160 min, L64-NO, whichhas a short PEO chain length, is indifferent to these changes.aN (phil) exhibits a very mild increase during the reaction(Figure 7d) whereas aN (phob) experiences a mild decreaseduring the first 140 min, which is accelerated between 140and 240 min. During the first 240 min a continuous reductionin Rphob is observed, and τc of both species changes slightly.
The EPR spectra of the various probes after 24 h ofreaction are in the fast motion region, showing that they turnimmobile only after drying. This was also observed in SBA-15 showing that prior to the hydrothermal stage the silica is“soft” and not fully formed.5
Cryo-TEM. The nanostructures formed in the solutionwere explored by sampling the reaction mixture of KIT-6,held at 40 °C, as a function of time. In the synthesis of KIT-6the reaction volume becomes visibly turbid about 120 min
after the addition of TEOS, and a precipitate appears around150 min. Thus the time limit of the direct-imaging cryo-TEM experiments was approximately 2 h.
Up to t ) 90 min, only spheroidal micelles are observed,as can be seen in Figure 9, for t ) 35 min. At t ) 92 min,we observe coexistence of spheroidal micelles and individual,rather short thread-like micelles (TLMs), that later aggregateinto bundles, as clearly shown at t ) 132 min. After thistime, the direct imaging cryo-TEM is not practical anymore,and we applied freeze-fracture replication (FFR). Around t) 2.5–3.5 h, the replicas show intermediate structure whichis not clear yet, but then between 4 and 6 h, a stablehexagonal structure is present, with a spacing of 11.8 ( 0.5nm, which is the same spacing obtained from the SAXS after6 h of reaction.
The observation of a hexagonal phase after precipitationsuggests that the BuOH may not be essential at the earlystage of the reaction and may be added after the hexagonalstructure has formed to generate the cubic phase. We verifiedthis using the synthesis mixture of SBA-15 with HCl,2
without adding butanol nor reducing the amount of HCl. Ina recent study, we showed by cryo-TEM that using thisprocedure, the hexagonal phase is formed after approximately20 min of reaction.32 Thus, at t ) 25 min (after theprecipitation time, 18 min) butanol was added to the solutionin a molar ratio 1:1.38 BuOH/TMOS, leaving the mixturefor 24 h at 35 °C followed by hydrothermal treatment at
Figure 9. Cryo-TEM images following the evolution of nanostructure in the liquid phase of the KIT-6 reaction mixture. Panels A-C are direct-imagingcryo-TEM micrographs; panel D shows a freeze-fracture-replication image. Only spheroidal micelles are seen after 35 min of reaction (A). Mostly spheroidalmicelles and a few TLMs (arrows) are observed after 92 min (B). Long TLMs (arrow) are seen after 132 min (C). After 238 min (D) we see a well-developed hexagonal phase: note fractures perpendicular to the long axes of the TLMs (arrow) and parallel to long axes (arrowheads).
2787Chem. Mater., Vol. 20, No. 8, 2008Formation of the Cubic Mesoporous Material KIT-6
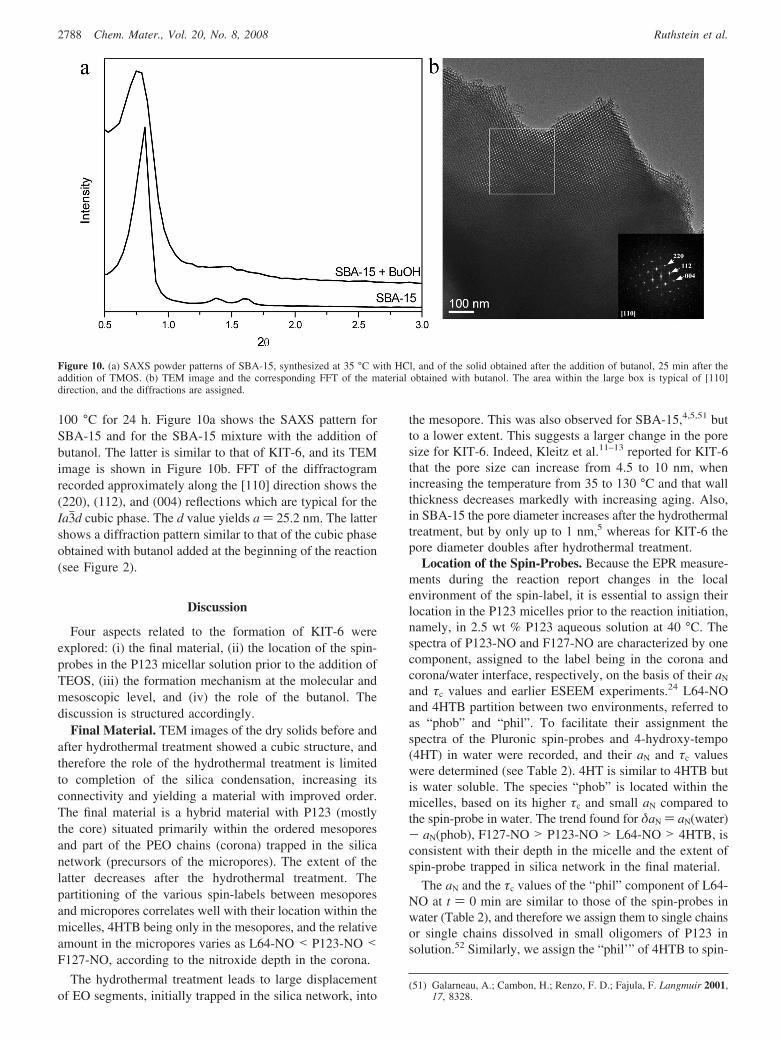
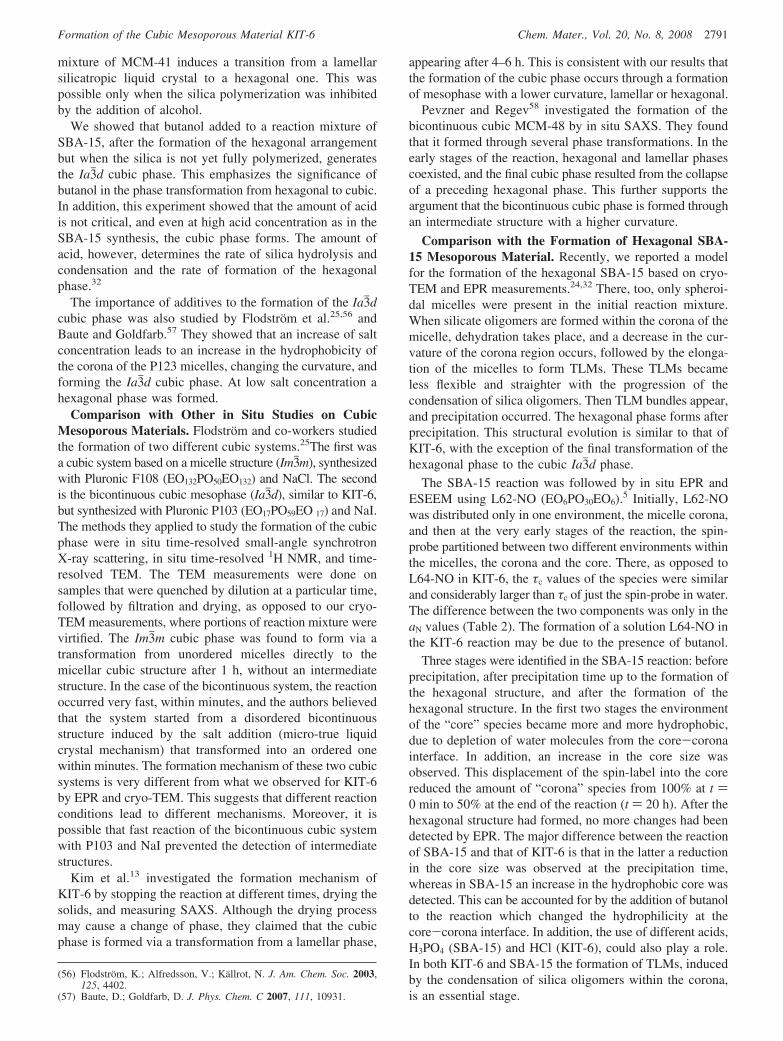
100 °C for 24 h. Figure 10a shows the SAXS pattern forSBA-15 and for the SBA-15 mixture with the addition ofbutanol. The latter is similar to that of KIT-6, and its TEMimage is shown in Figure 10b. FFT of the diffractogramrecorded approximately along the [110] direction shows the(220), (112), and (004) reflections which are typical for theIa3jd cubic phase. The d value yields a ) 25.2 nm. The lattershows a diffraction pattern similar to that of the cubic phaseobtained with butanol added at the beginning of the reaction(see Figure 2).
Discussion
Four aspects related to the formation of KIT-6 wereexplored: (i) the final material, (ii) the location of the spin-probes in the P123 micellar solution prior to the addition ofTEOS, (iii) the formation mechanism at the molecular andmesoscopic level, and (iv) the role of the butanol. Thediscussion is structured accordingly.
Final Material. TEM images of the dry solids before andafter hydrothermal treatment showed a cubic structure, andtherefore the role of the hydrothermal treatment is limitedto completion of the silica condensation, increasing itsconnectivity and yielding a material with improved order.The final material is a hybrid material with P123 (mostlythe core) situated primarily within the ordered mesoporesand part of the PEO chains (corona) trapped in the silicanetwork (precursors of the micropores). The extent of thelatter decreases after the hydrothermal treatment. Thepartitioning of the various spin-labels between mesoporesand micropores correlates well with their location within themicelles, 4HTB being only in the mesopores, and the relativeamount in the micropores varies as L64-NO < P123-NO <F127-NO, according to the nitroxide depth in the corona.
The hydrothermal treatment leads to large displacementof EO segments, initially trapped in the silica network, into
the mesopore. This was also observed for SBA-15,4,5,51 butto a lower extent. This suggests a larger change in the poresize for KIT-6. Indeed, Kleitz et al.11–13 reported for KIT-6that the pore size can increase from 4.5 to 10 nm, whenincreasing the temperature from 35 to 130 °C and that wallthickness decreases markedly with increasing aging. Also,in SBA-15 the pore diameter increases after the hydrothermaltreatment, but by only up to 1 nm,5 whereas for KIT-6 thepore diameter doubles after hydrothermal treatment.
Location of the Spin-Probes. Because the EPR measure-ments during the reaction report changes in the localenvironment of the spin-label, it is essential to assign theirlocation in the P123 micelles prior to the reaction initiation,namely, in 2.5 wt % P123 aqueous solution at 40 °C. Thespectra of P123-NO and F127-NO are characterized by onecomponent, assigned to the label being in the corona andcorona/water interface, respectively, on the basis of their aN
and τc values and earlier ESEEM experiments.24 L64-NOand 4HTB partition between two environments, referred toas “phob” and “phil”. To facilitate their assignment thespectra of the Pluronic spin-probes and 4-hydroxy-tempo(4HT) in water were recorded, and their aN and τc valueswere determined (see Table 2). 4HT is similar to 4HTB butis water soluble. The species “phob” is located within themicelles, based on its higher τc and small aN compared tothe spin-probe in water. The trend found for δaN ) aN(water)- aN(phob), F127-NO > P123-NO > L64-NO > 4HTB, isconsistent with their depth in the micelle and the extent ofspin-probe trapped in silica network in the final material.
The aN and the τc values of the “phil” component of L64-NO at t ) 0 min are similar to those of the spin-probes inwater (Table 2), and therefore we assign them to single chainsor single chains dissolved in small oligomers of P123 insolution.52 Similarly, we assign the “phil’” of 4HTB to spin-
(51) Galarneau, A.; Cambon, H.; Renzo, F. D.; Fajula, F. Langmuir 2001,17, 8328.
Figure 10. (a) SAXS powder patterns of SBA-15, synthesized at 35 °C with HCl, and of the solid obtained after the addition of butanol, 25 min after theaddition of TMOS. (b) TEM image and the corresponding FFT of the material obtained with butanol. The area within the large box is typical of [110]direction, and the diffractions are assigned.
2788 Chem. Mater., Vol. 20, No. 8, 2008 Ruthstein et al.
probes dissolved in P123 single chains or small oligomers,because 4HTB is water insoluble. This is consistent with itsτc value, which is larger than for 4HT in water but smallerthan the corresponding τc (phob). The extent of the L64-NO and 4HTB in dissolved single chains is, however, small,6% and 15%, respectively.
The addition of butanol to the P123 micellar solutioninduces penetration of butanol and water molecules into thecorona (as indicated by an increase of k(2H) in the D2Osolution), expanding the micelle, without changing signifi-cantly Rphob, aN, and τc.
To summarize, 4HTB probes the hydrophobic core of themicelles and single chains in the solution, L64-NO thecore-corona interface and single chain, P123-NO the corona,and F127-NO the corona-water interface of the micelle.Figure 11 illustrates the location of the probes in the micellarsolution.
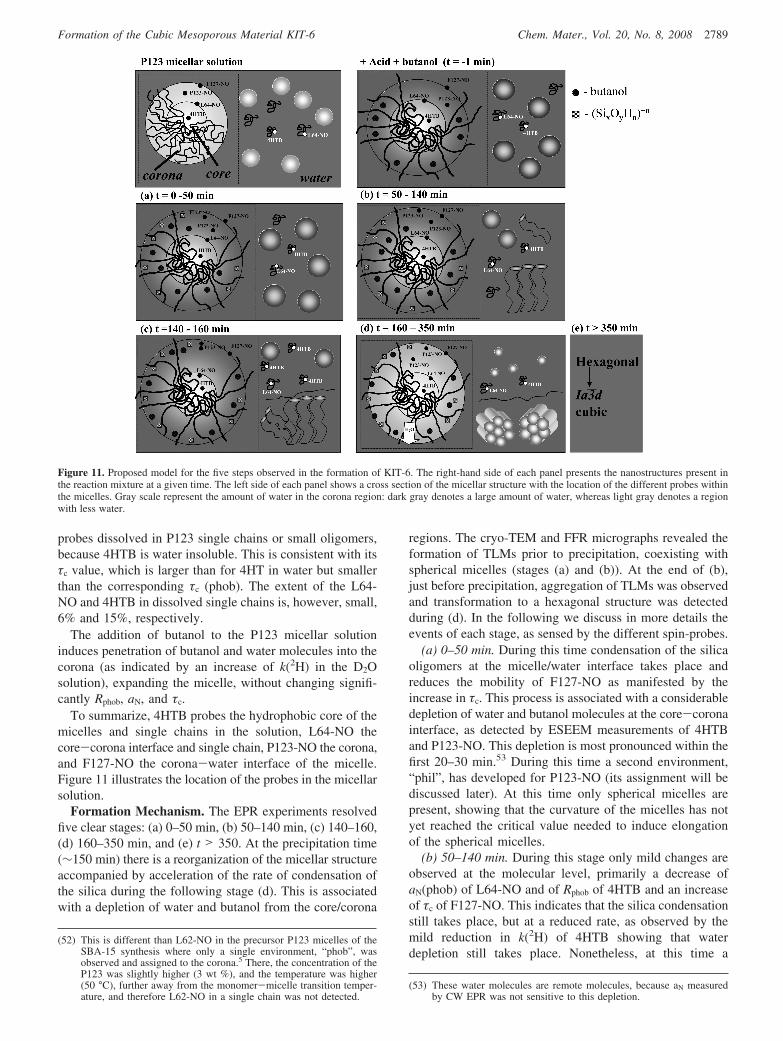
Formation Mechanism. The EPR experiments resolvedfive clear stages: (a) 0–50 min, (b) 50–140 min, (c) 140–160,(d) 160–350 min, and (e) t > 350. At the precipitation time(∼150 min) there is a reorganization of the micellar structureaccompanied by acceleration of the rate of condensation ofthe silica during the following stage (d). This is associatedwith a depletion of water and butanol from the core/corona
regions. The cryo-TEM and FFR micrographs revealed theformation of TLMs prior to precipitation, coexisting withspherical micelles (stages (a) and (b)). At the end of (b),just before precipitation, aggregation of TLMs was observedand transformation to a hexagonal structure was detectedduring (d). In the following we discuss in more details theevents of each stage, as sensed by the different spin-probes.
(a) 0–50 min. During this time condensation of the silicaoligomers at the micelle/water interface takes place andreduces the mobility of F127-NO as manifested by theincrease in τc. This process is associated with a considerabledepletion of water and butanol molecules at the core-coronainterface, as detected by ESEEM measurements of 4HTBand P123-NO. This depletion is most pronounced within thefirst 20–30 min.53 During this time a second environment,“phil”, has developed for P123-NO (its assignment will bediscussed later). At this time only spherical micelles arepresent, showing that the curvature of the micelles has notyet reached the critical value needed to induce elongationof the spherical micelles.
(b) 50–140 min. During this stage only mild changes areobserved at the molecular level, primarily a decrease ofaN(phob) of L64-NO and of Rphob of 4HTB and an increaseof τc of F127-NO. This indicates that the silica condensationstill takes place, but at a reduced rate, as observed by themild reduction in k(2H) of 4HTB showing that waterdepletion still takes place. Nonetheless, at this time a
(52) This is different than L62-NO in the precursor P123 micelles of theSBA-15 synthesis where only a single environment, “phob”, wasobserved and assigned to the corona.5 There, the concentration of theP123 was slightly higher (3 wt %), and the temperature was higher(50 °C), further away from the monomer-micelle transition temper-ature, and therefore L62-NO in a single chain was not detected.
(53) These water molecules are remote molecules, because aN measuredby CW EPR was not sensitive to this depletion.
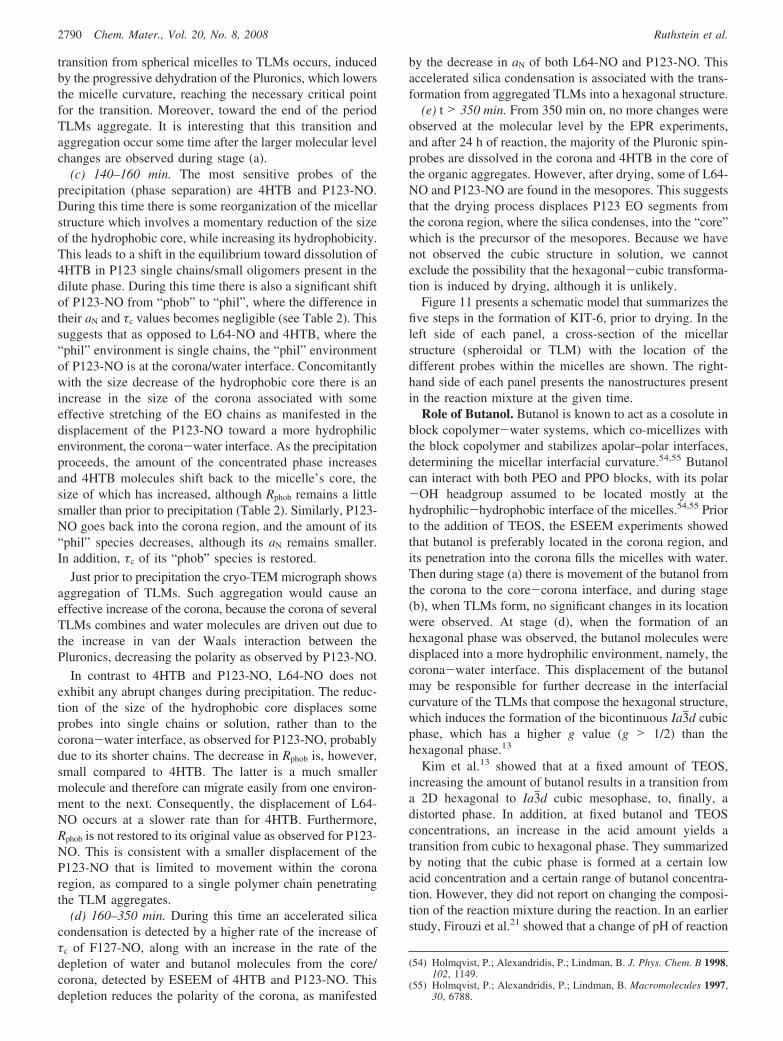
Figure 11. Proposed model for the five steps observed in the formation of KIT-6. The right-hand side of each panel presents the nanostructures present inthe reaction mixture at a given time. The left side of each panel shows a cross section of the micellar structure with the location of the different probes withinthe micelles. Gray scale represent the amount of water in the corona region: dark gray denotes a large amount of water, whereas light gray denotes a regionwith less water.
2789Chem. Mater., Vol. 20, No. 8, 2008Formation of the Cubic Mesoporous Material KIT-6
transition from spherical micelles to TLMs occurs, inducedby the progressive dehydration of the Pluronics, which lowersthe micelle curvature, reaching the necessary critical pointfor the transition. Moreover, toward the end of the periodTLMs aggregate. It is interesting that this transition andaggregation occur some time after the larger molecular levelchanges are observed during stage (a).
(c) 140–160 min. The most sensitive probes of theprecipitation (phase separation) are 4HTB and P123-NO.During this time there is some reorganization of the micellarstructure which involves a momentary reduction of the sizeof the hydrophobic core, while increasing its hydrophobicity.This leads to a shift in the equilibrium toward dissolution of4HTB in P123 single chains/small oligomers present in thedilute phase. During this time there is also a significant shiftof P123-NO from “phob” to “phil”, where the difference intheir aN and τc values becomes negligible (see Table 2). Thissuggests that as opposed to L64-NO and 4HTB, where the“phil” environment is single chains, the “phil” environmentof P123-NO is at the corona/water interface. Concomitantlywith the size decrease of the hydrophobic core there is anincrease in the size of the corona associated with someeffective stretching of the EO chains as manifested in thedisplacement of the P123-NO toward a more hydrophilicenvironment, the corona-water interface. As the precipitationproceeds, the amount of the concentrated phase increasesand 4HTB molecules shift back to the micelle’s core, thesize of which has increased, although Rphob remains a littlesmaller than prior to precipitation (Table 2). Similarly, P123-NO goes back into the corona region, and the amount of its“phil” species decreases, although its aN remains smaller.In addition, τc of its “phob” species is restored.
Just prior to precipitation the cryo-TEM micrograph showsaggregation of TLMs. Such aggregation would cause aneffective increase of the corona, because the corona of severalTLMs combines and water molecules are driven out due tothe increase in van der Waals interaction between thePluronics, decreasing the polarity as observed by P123-NO.
In contrast to 4HTB and P123-NO, L64-NO does notexhibit any abrupt changes during precipitation. The reduc-tion of the size of the hydrophobic core displaces someprobes into single chains or solution, rather than to thecorona-water interface, as observed for P123-NO, probablydue to its shorter chains. The decrease in Rphob is, however,small compared to 4HTB. The latter is a much smallermolecule and therefore can migrate easily from one environ-ment to the next. Consequently, the displacement of L64-NO occurs at a slower rate than for 4HTB. Furthermore,Rphob is not restored to its original value as observed for P123-NO. This is consistent with a smaller displacement of theP123-NO that is limited to movement within the coronaregion, as compared to a single polymer chain penetratingthe TLM aggregates.
(d) 160–350 min. During this time an accelerated silicacondensation is detected by a higher rate of the increase ofτc of F127-NO, along with an increase in the rate of thedepletion of water and butanol molecules from the core/corona, detected by ESEEM of 4HTB and P123-NO. Thisdepletion reduces the polarity of the corona, as manifested
by the decrease in aN of both L64-NO and P123-NO. Thisaccelerated silica condensation is associated with the trans-formation from aggregated TLMs into a hexagonal structure.
(e) t > 350 min. From 350 min on, no more changes wereobserved at the molecular level by the EPR experiments,and after 24 h of reaction, the majority of the Pluronic spin-probes are dissolved in the corona and 4HTB in the core ofthe organic aggregates. However, after drying, some of L64-NO and P123-NO are found in the mesopores. This suggeststhat the drying process displaces P123 EO segments fromthe corona region, where the silica condenses, into the “core”which is the precursor of the mesopores. Because we havenot observed the cubic structure in solution, we cannotexclude the possibility that the hexagonal-cubic transforma-tion is induced by drying, although it is unlikely.
Figure 11 presents a schematic model that summarizes thefive steps in the formation of KIT-6, prior to drying. In theleft side of each panel, a cross-section of the micellarstructure (spheroidal or TLM) with the location of thedifferent probes within the micelles are shown. The right-hand side of each panel presents the nanostructures presentin the reaction mixture at the given time.
Role of Butanol. Butanol is known to act as a cosolute inblock copolymer-water systems, which co-micellizes withthe block copolymer and stabilizes apolar–polar interfaces,determining the micellar interfacial curvature.54,55 Butanolcan interact with both PEO and PPO blocks, with its polar-OH headgroup assumed to be located mostly at thehydrophilic-hydrophobic interface of the micelles.54,55 Priorto the addition of TEOS, the ESEEM experiments showedthat butanol is preferably located in the corona region, andits penetration into the corona fills the micelles with water.Then during stage (a) there is movement of the butanol fromthe corona to the core-corona interface, and during stage(b), when TLMs form, no significant changes in its locationwere observed. At stage (d), when the formation of anhexagonal phase was observed, the butanol molecules weredisplaced into a more hydrophilic environment, namely, thecorona-water interface. This displacement of the butanolmay be responsible for further decrease in the interfacialcurvature of the TLMs that compose the hexagonal structure,which induces the formation of the bicontinuous Ia3jd cubicphase, which has a higher g value (g > 1/2) than thehexagonal phase.13
Kim et al.13 showed that at a fixed amount of TEOS,increasing the amount of butanol results in a transition froma 2D hexagonal to Ia3jd cubic mesophase, to, finally, adistorted phase. In addition, at fixed butanol and TEOSconcentrations, an increase in the acid amount yields atransition from cubic to hexagonal phase. They summarizedby noting that the cubic phase is formed at a certain lowacid concentration and a certain range of butanol concentra-tion. However, they did not report on changing the composi-tion of the reaction mixture during the reaction. In an earlierstudy, Firouzi et al.21 showed that a change of pH of reaction
(54) Holmqvist, P.; Alexandridis, P.; Lindman, B. J. Phys. Chem. B 1998,102, 1149.
(55) Holmqvist, P.; Alexandridis, P.; Lindman, B. Macromolecules 1997,30, 6788.
2790 Chem. Mater., Vol. 20, No. 8, 2008 Ruthstein et al.
mixture of MCM-41 induces a transition from a lamellarsilicatropic liquid crystal to a hexagonal one. This waspossible only when the silica polymerization was inhibitedby the addition of alcohol.
We showed that butanol added to a reaction mixture ofSBA-15, after the formation of the hexagonal arrangementbut when the silica is not yet fully polymerized, generatesthe Ia3jd cubic phase. This emphasizes the significance ofbutanol in the phase transformation from hexagonal to cubic.In addition, this experiment showed that the amount of acidis not critical, and even at high acid concentration as in theSBA-15 synthesis, the cubic phase forms. The amount ofacid, however, determines the rate of silica hydrolysis andcondensation and the rate of formation of the hexagonalphase.32
The importance of additives to the formation of the Ia3jdcubic phase was also studied by Flodström et al.25,56 andBaute and Goldfarb.57 They showed that an increase of saltconcentration leads to an increase in the hydrophobicity ofthe corona of the P123 micelles, changing the curvature, andforming the Ia3jd cubic phase. At low salt concentration ahexagonal phase was formed.
Comparison with Other in Situ Studies on CubicMesoporous Materials. Flodström and co-workers studiedthe formation of two different cubic systems.25The first wasa cubic system based on a micelle structure (Im3jm), synthesizedwith Pluronic F108 (EO132PO50EO132) and NaCl. The secondis the bicontinuous cubic mesophase (Ia3jd), similar to KIT-6,but synthesized with Pluronic P103 (EO17PO59EO 17) and NaI.The methods they applied to study the formation of the cubicphase were in situ time-resolved small-angle synchrotronX-ray scattering, in situ time-resolved 1H NMR, and time-resolved TEM. The TEM measurements were done onsamples that were quenched by dilution at a particular time,followed by filtration and drying, as opposed to our cryo-TEM measurements, where portions of reaction mixture werevirtified. The Im3jm cubic phase was found to form via atransformation from unordered micelles directly to themicellar cubic structure after 1 h, without an intermediatestructure. In the case of the bicontinuous system, the reactionoccurred very fast, within minutes, and the authors believedthat the system started from a disordered bicontinuousstructure induced by the salt addition (micro-true liquidcrystal mechanism) that transformed into an ordered onewithin minutes. The formation mechanism of these two cubicsystems is very different from what we observed for KIT-6by EPR and cryo-TEM. This suggests that different reactionconditions lead to different mechanisms. Moreover, it ispossible that fast reaction of the bicontinuous cubic systemwith P103 and NaI prevented the detection of intermediatestructures.
Kim et al.13 investigated the formation mechanism ofKIT-6 by stopping the reaction at different times, drying thesolids, and measuring SAXS. Although the drying processmay cause a change of phase, they claimed that the cubicphase is formed via a transformation from a lamellar phase,
appearing after 4–6 h. This is consistent with our results thatthe formation of the cubic phase occurs through a formationof mesophase with a lower curvature, lamellar or hexagonal.
Pevzner and Regev58 investigated the formation of thebicontinuous cubic MCM-48 by in situ SAXS. They foundthat it formed through several phase transformations. In theearly stages of the reaction, hexagonal and lamellar phasescoexisted, and the final cubic phase resulted from the collapseof a preceding hexagonal phase. This further supports theargument that the bicontinuous cubic phase is formed throughan intermediate structure with a higher curvature.
Comparison with the Formation of Hexagonal SBA-15 Mesoporous Material. Recently, we reported a modelfor the formation of the hexagonal SBA-15 based on cryo-TEM and EPR measurements.24,32 There, too, only spheroi-dal micelles were present in the initial reaction mixture.When silicate oligomers are formed within the corona of themicelle, dehydration takes place, and a decrease in the cur-vature of the corona region occurs, followed by the elonga-tion of the micelles to form TLMs. These TLMs becameless flexible and straighter with the progression of thecondensation of silica oligomers. Then TLM bundles appear,and precipitation occurred. The hexagonal phase forms afterprecipitation. This structural evolution is similar to that ofKIT-6, with the exception of the final transformation of thehexagonal phase to the cubic Ia3jd phase.
The SBA-15 reaction was followed by in situ EPR andESEEM using L62-NO (EO6PO30EO6).5 Initially, L62-NOwas distributed only in one environment, the micelle corona,and then at the very early stages of the reaction, the spin-probe partitioned between two different environments withinthe micelles, the corona and the core. There, as opposed toL64-NO in KIT-6, the τc values of the species were similarand considerably larger than τc of just the spin-probe in water.The difference between the two components was only in theaN values (Table 2). The formation of a solution L64-NO inthe KIT-6 reaction may be due to the presence of butanol.
Three stages were identified in the SBA-15 reaction: beforeprecipitation, after precipitation time up to the formation ofthe hexagonal structure, and after the formation of thehexagonal structure. In the first two stages the environmentof the “core” species became more and more hydrophobic,due to depletion of water molecules from the core-coronainterface. In addition, an increase in the core size wasobserved. This displacement of the spin-label into the corereduced the amount of “corona” species from 100% at t )0 min to 50% at the end of the reaction (t ) 20 h). After thehexagonal structure had formed, no more changes had beendetected by EPR. The major difference between the reactionof SBA-15 and that of KIT-6 is that in the latter a reductionin the core size was observed at the precipitation time,whereas in SBA-15 an increase in the hydrophobic core wasdetected. This can be accounted for by the addition of butanolto the reaction which changed the hydrophilicity at thecore-corona interface. In addition, the use of different acids,H3PO4 (SBA-15) and HCl (KIT-6), could also play a role.In both KIT-6 and SBA-15 the formation of TLMs, inducedby the condensation of silica oligomers within the corona,is an essential stage.
(56) Flodström, K.; Alfredsson, V.; Källrot, N. J. Am. Chem. Soc. 2003,125, 4402.
(57) Baute, D.; Goldfarb, D. J. Phys. Chem. C 2007, 111, 10931.
2791Chem. Mater., Vol. 20, No. 8, 2008Formation of the Cubic Mesoporous Material KIT-6

Conclusions
The formation mechanism of the cubic mesoporousmaterial KIT-6 was investigated on both the molecularand the mesoscale levels. The addition of butanol to theinitial micellar solution causes swelling and a surge ofwater molecules to the corona. Then, with the addition ofTEOS, five main stages were resolved. (a) 0–50 min: onlyspheroidal micelles are present, and condensation of thesilica oligomers takes place at the micellar/water interfaceand within the corona, causing a depletion of water andbutanol molecules from the core-corona interface. Thiscondensation lowers the mobility of the ends of thePluronic chains located at the corona-water interface. (b)50–140 min: the changes at the molecular level are mild,showing the continuation of water depletion, and TLMsappear. Toward the end of this period the TLMs aggregate.(c) Precipitation time (140–160 min): the core of theaggregated TLMs becomes more hydrophobic and reducedin size, while the size of the corona increases. (d) 160–350min: the silica condensation is accelerated, leading to largedepletion of water and butanol from the corona, and thecore size increases, along with a decrease in the polarityof the core and corona regions. The aggregated TLMstransformed into a hexagonal structure. (e) 6-24 h: no
changes are detected on the molecular level, and thetransition from hexagonal to cubic phase occurs.
It was further shown that butanol is not essential in theearlier stages of the reaction, and can be added after theformation of the hexagonal phase (during stage (e)). The finalmaterial is characterized by ordered mesopores and mi-cropores, where the extent of microporosity decreasesremarkably after the hydrothermal treatment.
Acknowledgment. The authors thank Mr. Ilia Kaminkerfor help in preforming the SAXS measurements. Acknowl-edgment is given to the Donors of the American ChemicalSociety Petroleum Research Fund for partial support of thisresearch. This research was supported by a grant from theMinistry of Science, Israel, awarded to S.R. D.G. holds theErich Klieger Professorial chair in Chemical Physics. Thisresearch is made possible in part by the historic generosityof the Harold Perlman Family. The cryo-TEM work wascarried out at the Harnnah and George Krumholz Laboratoryfor Advanced Microscopy, part of the Technion Project onComplex Fluids, Microstructure and Macromolecules, andsupported by a grant from the Technion Russell BerrieNanotechnology Institute (RBNI).
CM7025619
(58) Pevzner, S.; Regev, O. Microporous Mesoporous Mater. 2000, 38,38.
2792 Chem. Mater., Vol. 20, No. 8, 2008 Ruthstein et al.