molecular evidence for the inclusion of cetaceans within ... · molecular evidence for the...
TRANSCRIPT
Molecular Evidence for the Inclusion of Cetaceans within the Order Artiodactyla
Dan GrauP and Desmond G. Higgins?
*Department of Zoology, Tel Aviv University; and TEuropean Molecular Biology Laboratory
The transition in the cetaceans from terrestrial life to a fully aquatic existence is one of the most enduring evolutionary mysteries. Resolving the phylogenetic relationships between Cetacea and the other orders of eutherian mammals may provide us with important clues to the origin of whales and may help us date the evolutionary transition to aquatic life. Previous paleontological and molecular evidence has indicated that cetaceans and artiodactyls constitute a natural clade within subclass Eutheria. Our present phylogenetic analyses of protein and mitochondrial DNA sequence data indicate that cetaceans are not only intimately related to the artiodactyls; they are in fact deeply nested within the artiodactyl phylogenetic tree; i.e., they are more closely related to the members of one suborder of artiodactyls, the Ruminantia, than either ruminants or cetaceans are to members of the other two artiodactyl suborders: Suiformes and Tylopoda. On the basis of the rate of evolution of mitochondrial DNA sequences and using paleontological reference dates for calibration, we estimate that the whale lineage has branched off a pro- toruminant lineage ~50 Mya. By implication, the cetacean transition to aquatic life is inferred to be a relatively recent evolutionary event.
Introduction
The origin of the order Cetacea (whales, dolphins, and porpoises) is an enduring evolutionary mystery (see, e.g., Flower and Garson 1884), more so since their ad- aptation to an exclusively aquatic lifestyle required an unprecedented number of unique, yet coordinated, changes in many biological systems. For example, the cetaceans are unique among extant mammals in com- pletely lacking hind limbs, with the exception of an in- ternal pair of rodlike pelvic vestiges that serve as attach- ments for the corpora cavernosa of the penis. The available paleontological, morphological, embryological, and molecular evidence indicates that the Cetacea and the Artiodactyla (even-toed ungulates) are closely related to each other (Gingerich et al. 1990; Arnason et al. 199 1; Novacek 1992; Adachi et al. 1993). In particular, by using protein sequences, it has been convincingly dem- onstrated that artiodactyls and cetaceans are more closely related to each other than either is to carnivores, eden- tates, pholidotes, lagomorphs, rodents, primates, scan- dentians, dermopterans, chiropterans, insectivores, tub- ulidentates, perissodactyls, hyracoids, proboscids, and
Key words: molecular phylogeny, Artiodactyla, Ruminantia, Pe- cora, Tragulina, Suiformes, Tylopoda, Cetacea, time of divergence.
Address for correspondence and reprints: Professor Dan Graur, Department of Zoology, Tel Aviv University, Ramat Aviv 69978, Israel.
Mol. Biol. Evol. 11(3):357-364. 1994. 0 1994 by The University of Chicago. All rights reserved. 0737-4038/94/l 103-0003$02.00 .
sirenians (Czelusniak et al. 1990; Adachi et al. 1993). Similarly, remains of a middle-Eocene ( -45 Myr-old) whale exhibiting an artiodactyl-like paraxonic arrange- ment of the digits on its vestigial hind limbs (Gingerich et al. 1990; Wyss 1990) have provided paleontological evidence in support of an evolutionary connection be- tween cetaceans and artiodactyls. Analyses of large numbers of DNA sequences from a small number of orders, including one in which complete mitochondrial sequences have been used, indicate that the Camivora may be the closest order of eutherians to the Artiodactyla and the Cetacea (Li et al. 1990; Bulmer et al. 199 1; Amason and Johnson 1992).
The order Artiodactyla is traditionally divided into three suborders: Suiformes (pigs, peccaries, and hippopotamuses), Tylopoda (camels and llamas), and Ruminantia, which consists of several families and includes the bulk of extant artiodactyl species (e.g., elk, deer, giraffes, cows, goats, and sheep). In this study, we infer the phylogenetic position of the Cetacea in relation to the three artiodactyl suborders by re- constructing phylogenetic trees on the basis of protein and DNA sequences from pig (Sus scrofa), cow (Bos taurus) , camel ( Camelus dromedarius) , several ce- tacean species, and an outgroup species. We then use the rate of evolution of the DNA sequences, in con- junction with paleontological data pertaining to the
357

358 Graur and Higgins
divergence times among and within the artiodactyl suborders, to estimate the time of divergence between ruminants and cetaceans.
Material and Methods Protein and DNA Sequences
The phylogenetic position of the Cetacea was in- ferred in relationship with representatives from two ar- tiodactyl suborders and from an outgroup for a series of 5 mitochondrial DNA sequences and 11 nuclear-en- coded protein sequences. This simplifies the analysis, because only three alternative phylogenetic trees have to be compared in each case. Moreover, by analyzing only four taxa at a time, we can use a larger number of sequences than can be used if more than four taxa are analyzed simultaneously.
Protein sequences were taken from release 22 of the SWISSPROT database (Bairoch and Boeckmann 1992). Mitochondrial DNA data were derived from re- lease 3 1 of the EMBL data library (Higgins et al. 1992b) and from Tanhauser ( 1985) and Watanabe et al. ( 1986). Both protein and DNA sequences were aligned using the CLUSTAL V program (Higgins et al. 1992a). Very few alignment problems were encountered, and in such cases, the ambiguous parts, as well as positions contain- ing gaps, were removed from the analysis.
All the cetacean DNA sequences used in this study are from the finback whale, Balaenoptera physalus, the complete mitochondrial genome of which has been se- quenced (Arnason et al. 199 1) . Unfortunately, the 16s rRNA sequences could not be added to our analysis be- cause the sequence from pig that has been used in several reports (Miyamoto and Boyle 1989; Miyamoto et al. 1989; Kraus and Miyamoto 199 1; Allard et al. 1992; Kraus et al. 1992) has been neither published nor de- posited in a database. The sequences available are the genes for cytochrome b, ATPase subunit 6, nicotinamide adenine dinucleotide (NADH) dehydrogenase subunit 1, the 12s ribosomal RNA, and a composite of four transfer RNA (tRNA) sequences (Leu, Val, Phe, and Ile). The cetacean protein sequences are from minke whale (B. acurostrata), for crystallin CXA, myoglobin, pancreatic ribonuclease, and hemoglobin p; finback whale (B. physalus) , for insulin, myoglobin, neurophy- sin 2, and corticotrophin; sei whale (B. borealis), for insulin; California gray whale (Eschrichtus gibbosus), for cytochrome c; harbor porpoise (Phocoenoides pho- coena), for crystallin aA; sperm whale (Physeter cato- don), for lutropin p, glycoprotein hormone a, hemoglo- bin a, and hemoglobin p; and Atlantic bottle-nosed dolphin ( Tursiops truncatus), for hemoglobin a and he- moglobin p.
Reconstruction of Phylogenetic Trees
Three methods of phylogenetic reconstruction were used for the DNA sequences: maximum parsimony (Fitch 1977 ) , neighbor joining (Saitou and Nei 1987 ), and maximum likelihood (Felsenstein 198 1). The DNAPARS and the DNAML programs of the PHYLIP package were used to calculate the parsimony scores and the maximum-likelihood trees, respectively. Mouse, seal (Phoca vitulina, order Carnivora), or mouse and seal together were used as outgroup taxa. The results were virtually identical, and only the results using mouse as outgroup are shown. For mitochondrial sequences that have diverged from one another for more than -20 Myr, as in the present study, transitions are known to be saturated with parallel and back substitutions (Li et al. 1990; Kraus and Miyamoto 199 1; Amason and Johnson 1992; Kraus et al. 1992). The homoplastic na- ture of such transitions renders them useless as far as the resolution of the divergence events among mam- malian orders is concerned. Therefore, in the neighbor- joining and parsimony analyses, we used only transver- sions, which retain their phylogenetic usefulness for much longer periods of evolutionary times (Miyamoto and Boyle 1989; Irwin et al. 199 1).
For the protein sequences, the maximum-parsi- mony method and the PROTPARS program of the PHYLIP package, version 3.4 ( Felsenstein 1989 ) , were used to calculate the number of amino acid replacements required for each of the alternative phylogenetic trees under consideration. We used rat (Rattus norvegicus) or mouse (Mus musculus) sequences as outgroups. The appropriateness of the Rodentia as an outgroup to the orders analyzed in this study is clear from previous anal- yses (Li et al. 1990; Bulmer et al. 199 1; Amason and Johnson 1992).
Statistical Tests for the Inferred Phylogenetic Trees
The reliability of the inferred trees was tested by bootstrap resampling of parsimony and neighbor-joining trees (Felsenstein 1985a), Felsenstein’s ( 1985b) test for differences in the number of supporting informative sites, Kishino and Hasegawa’s ( 1989) test for the difference between maximum-likelihood trees, and Li’s ( 1989) test of internal branch length. For the DNA sequences, the maximum-likelihood trees were also tested by bootstrap resampling. For both Li’s test and the neighbor-joining- tree bootstrap analyses, corrections were used to com- pensate for the effect of “multiple hits.” These correc- tions were (a) from Tajima and Nei ( 1984) for trans- versional distances and (b) the “Poisson” correction for protein distances (Nei 1987, pp. 40-4 1).

Results
In figure 1 a, tree I represents the presently accepted taxonomic scheme, in which the cetaceans branched off prior to the divergence between the two artiodactyl spe- cies under consideration. Trees II and III represent the alternatives; i.e., cetaceans are phylogenetically more closely related to one of the two artiodactyl species than either artiodactyl species is to each other.
Table 1 shows the results of the cow-pig-cetacean analysis of the DNA data. By using the maximum- parsimony, neighbor-joining, or maximum-likelihood methods combined with bootstrap resampling, the same tree (II) is obtained. In the maximum-parsimony anal- ysis with mouse as outgroup, 13 1 informative transver- sions were identified. Trees I and III are supported by 38 sites each, whereas tree II is supported by 55 sites. When Felsenstein’s ( 1985b) test for differences in the number of supporting informative sites was used, the differences between the trees were found to be significant at the ~5% level. When Kishino and Hasegawa’s ( 1989) test of difference between DNA maximum-likelihood trees with a ratio of transitions/ transversions of 1 O/ 1 was used, tree II was significantly better than the tradi- tional tree I, at the 5% level. Tree III, however, could not be ruled out by this test. A range of 10 different transition / transversion ratios (between 2.0 / 1 and 15 .O / 1) were also tested for the maximum-likelihood boot-
straps and the overall DNAML test. This had almost no effect on the results. We failed to reproduce the classical tree I even once out of a total of 1,000 maximum-like- lihood bootstrap trees. By using Li’s ( 1989) test, the
Cetacean Origins 359
length of the internal branch in tree II was found to be significantly greater than zero, at the 1% level. The main reason for using such a redundant array of tests is to show that the result is independent of the method used.
It is well known that, in cases where the different evolutionary lineages evolve at markedly different rates, all methods of tree reconstruction are prone to yield erroneous trees. To discard this possibility, we calculated the transversional distances between the outgroup and the ingroup species. When the DNA sequences are taken together, the corrected distances between mouse and cow, mouse and pig, and mouse and whale are 0.116, 0.119, and 0.12 1 transversions per site, respectively, (the standard error is 0.007 in all cases). Therefore, in the rates of substitution, there are no significant differences among the lineages.
The monophyly of the order Artiodactyla is, there- fore, not supported by the DNA sequence data. Rather, whale clusters with cow to the exclusion of pig. DNA sequences from the mitochondrial D-loop (Hoelzel et al. 199 1) provide additional, albeit qualitative, support for the clustering of whale and cow to the exclusion of pig. As judged on the basis of the difficulties in aligning these sequences, the whale and bovine sequences are more similar to each other than either is to the pig se- quence. However, the rapidity with which the D-loop region evolves prevents us from producing a sensible multiple alignment between the D-loop sequences from cow, pig, whale, seal, and mouse, with the exception of a very short conserved piece ( Hoelzel et al. 199 1) con- taining no phylogenetically informative sites for a cla- distic analysis.
(W
(4
A A A \\%%% cow P/C CET OUT cow CET P/C OUT P/C CET COW OUT Ruminantia
I I
Tree I Tree II Tree III Artiodactyla
FK. 1 .--a, Three possible phylogenetic trees for cetacean (CET), cow (COW), pig or camel (P/C), and an outgroup (OUT). Tree I represents the traditional view that the artiodactyls form a natural monophyletic clade. Molecular data support tree II. b, Schematic molecular phylogenetic tree for Pecora, Tragulina, Cetacea, Suiformes, Tylopoda, Carnivora, and Rodentia. Molecular data support the inclusion of the first five taxa into the order Artiodactyla.
360 Graur and Higgins
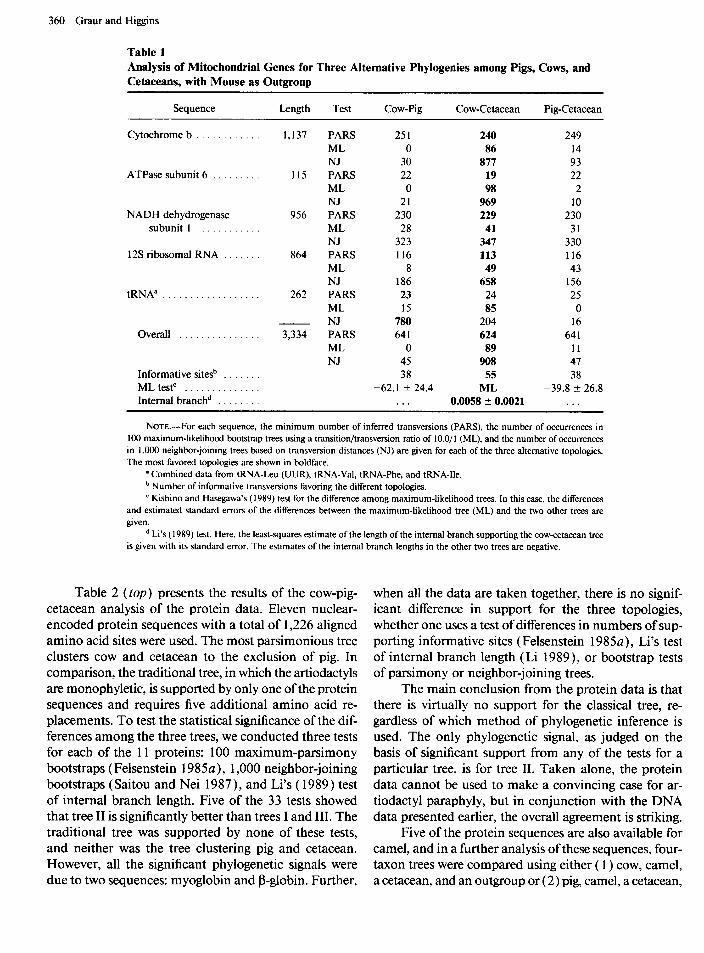
Table 1 Analysis of Mitochondrial Genes for Three Alternative Phylogenies among Pigs, Cows, and Cetaceans, with Mouse as Outgroup
Sequence Length Test Cow-Pig Cow-Cetacean Pig-Cetacean
Cytochrome b . . . . . . 1,137 PARS 251 240 249 ML 0 86 14 NJ 30 877 93
ATPase subunit 6 . . . 115 PARS 22 19 22 ML 0 98 2 NJ 21 969 10
NADH dehydrogenase 956 PARS 230 229 230 subunit 1 . . . . . . ML 28 41 31
NJ 323 347 330 12s ribosomal RNA . . 864 PARS 116 113 116
ML 8 49 43 NJ 186 658 156
tRNAa . . . . . . . . . . . . . . . . . . 262 PARS 23 24 25 ML 15 85 0 NJ 780 204 16
Overall . . . . . . . . . 3,334 PARS 641 624 641 ML 0 89 11 NJ 45 908 47
Informative sitesb . . . . . 38 55 38 ML testC . . . . . . . . . . . . -62.1 + 24.4 ML -39.8 f 26.8 Internal branchd . . . . . . . . . . . 0.0058 + 0.0021 . . .
NOTE.-For each sequence, the minimum number of inferred transversions (PARS), the number of occurrences in 100 maximum-likelihood bootstrap trees using a transition/transversion ratio of 10.0/l (ML), and the number of occurrences in 1,000 neighbor-joining trees based on transversion distances (NJ) are given for each of the three alternative topologies. The most favored topologies are shown in boldface.
’ Combined data from tRNA-Leu (UUR), tRNA-Val, tRNA-Phe, and tRNA-Ile. b Number of informative transversions favoring the different topologies. ’ Kishino and Hasegawa’s (1989) test for the difference among maximum-likelihood trees. In this case, the differences
and estimated standard errors of the differences between the maximum-likelihood tree (ML) and the two other trees are given.
d Li’s ( 1989) test. Here, the least-squares estimate of the length of the internal branch supporting the cow-cetacean tree is given with its standard error. The estimates of the internal branch lengths in the other two trees are negative.
Table 2 (top) presents the results of the cow-pig- cetacean analysis of the protein data. Eleven nuclear- encoded protein sequences with a total of 1,226 aligned amino acid sites were used. The most parsimonious tree clusters cow and cetacean to the exclusion of pig. In comparison, the traditional tree, in which the artiodactyls are monophyletic, is supported by only one of the protein sequences and requires five additional amino acid re- placements. To test the statistical significance of the dif- ferences among the three trees, we conducted three tests for each of the 11 proteins: 100 maximum-parsimony bootstraps (Felsenstein 1985a), 1,000 neighbor-joining bootstraps (Saitou and Nei 1987)) and Li’s ( 1989) test of internal branch length. Five of the 33 tests showed that tree II is significantly better than trees I and III. The traditional tree was supported by none of these tests, and neither was the tree clustering pig and cetacean. However, all the significant phylogenetic signals were due to two sequences: myoglobin and P-globin. Further,
when all the data are taken together, there is no signif- icant difference in support for the three topologies, whether one uses a test of differences in numbers of sup- porting informative sites (Felsenstein 1985a), Li’s test of internal branch length (Li 1989)) or bootstrap tests of parsimony or neighbor-joining trees.
The main conclusion from the protein data is that there is virtually no support for the classical tree, re- gardless of which method of phylogenetic inference is used. The only phylogenetic signal, as judged on the basis of significant support from any of the tests for a particular tree, is for tree II. Taken alone, the protein data cannot be used to make a convincing case for ar- tiodactyl paraphyly, but in conjunction with the DNA data presented earlier, the overall agreement is striking.
Five of the protein sequences are also available for camel, and in a further analysis of these sequences, four- taxon trees were compared using either ( 1) cow, camel, a cetacean, and an outgroup or (2) pig, camel, a cetacean,
Cetacean Origins 361
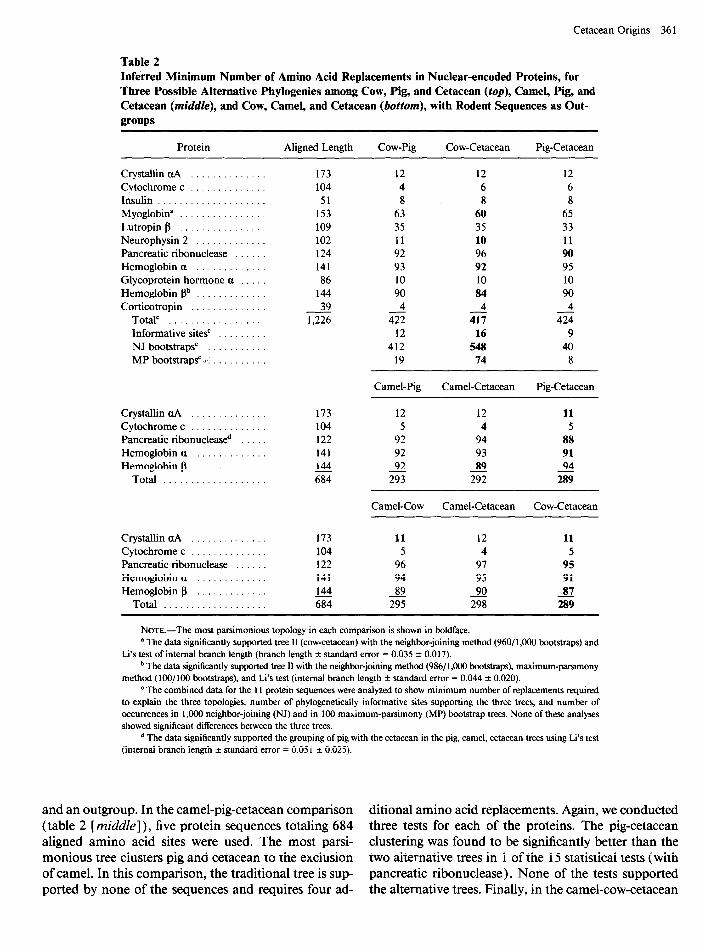
Table 2 Inferred Minimum Number of Amino Acid Replacements in Nuclear-encoded Proteins, for Three Possible Alternative Phylogenies among Cow, Pig, and Cetacean (fop), Camel, Pig, and Cetacean (middle), and Cow, Camel, and Cetacean (botiom), with Rodent Sequences as Out- groups
Protein Aligned Length Cow-Pig Cow-Cetacean Pig-Cetacean
Crystallin uA . . . . . . Cytochrome c . . . . . Insulin . . . . . . . . . . Myoglobin” . . . . . . . . . Lutropin p . . . . . . . . . . Neurophysin 2 . . . Pancreatic ribonuclease Hemoglobin a . . . . . Glycoprotein hormone a Hemoglobin pb . . . . . . Corticotropin . . . . .
Total” . . . . . . . . . . . Informative sites’ . . . NJ bootstrapsc . . . . . MP bootstrapsC r. . . . .
Crystallin uA ........ Cytochrome c ........ Pancreatic ribonucleased Hemoglobin a ....... Hemoglobin p .......
Total .............
. . . . . . . .
. . . . .
. . . . . . . . . .
. . .
. .
. . .
. . . .
. * .
. . . . .
. . .
. . .
. . .
. . . .
Crystallin uA .............. Cytochrome c .............. Pancreatic ribonuclease ...... Hemoglobin a ............. Hemoglobin p .............
Total ...................
173 104 51
153 109 102 124 141 86
144 39 1,226
173 104 122 141 144 684
173 104 122 141 144 684
12 4 8
63 35 11 92 93 10 90
4 422
12 412
19
12 6 8
60 35 10 96 92 10 84
4 417
16 548 74
12 6 8
65 33 11 90 95 10 90 4
424 9
40 8
Camel-Pig Camel-Cetacean Pig-Cetacean
12 12 11 5 4 5
92 94 88 92 93 91 92
293 89 292
94 289
Camel-Cow Camel-Cetacean Cow-Cetacean
11 12 11 5 4 5
96 97 95 94 95 91 89
295 90 87 298 289
NOTE.-The most parsimonious topology in each comparison is shown in boldface. * The data significantly supported tree II (cow-cetacean) with the neighbor-joining method (96011,000 bootstraps) and
Li’s test of internal branch length (branch length f standard error = 0.035 f 0.017). b The data significantly supported tree II with the neighbor-joining method (986/ 1,000 bootstraps), maximum-parsimony
method (lOO/lOO bootstraps), and Li’s test (internal branch length f standard error = 0.044 f 0.020). ’ The combined data for the 11 protein sequences were analyzed to show minimum number of replacements required
to explain the three topologies, number of phylogenetically informative sites supporting the three trees, and number of occurrences in 1,000 neighbor-joining (NJ) and in 100 maximum-parsimony (MP) bootstrap trees. None of these analyses showed significant differences between the three trees.
* The data significantly supported the grouping of pig with the cetacean in the pig, camel, cetacean trees using Li’s test (internal branch length -+ standard error = 0.05 1 f 0.025).
and an outgroup. In the camel-pig-cetacean comparison ditional amino acid replacements. Again, we conducted (table 2 [middle]), five protein sequences totaling 684 three tests for each of the proteins. The pig-cetacean aligned amino acid sites were used. The most parsi- clustering was found to be significantly better than the monious tree clusters pig and cetacean to the exclusion two alternative trees in 1 of the 15 statistical tests (with of camel. In this comparison, the traditional tree is sup- pancreatic ribonuclease). None of the tests supported ported by none of the sequences and requires four ad- the alternative trees. Finally, in the camel-cow-cetacean
362 Gram and Higgins
comparison (table 2 [bottom]), the most parsimonious tree identifies cow and cetacean as sister groups to the exclusion of camel. The traditional tree requires six ad- ditional replacements. In this case, however, none of the statistical tests yielded significant differences among the three trees.
We also considered cow, camel, pig, cetacean, and an outgroup species together. In this analysis, there are 15 possible phylogenetic trees. Only three of these trees are compatible with artiodactyl monophyly. The three trees, in which the artiodactyl suborders are monophy- letic, are the least parsimonious from among the 15 pos- sible trees, and each requires five to nine more amino acid replacements than the most parsimonious tree, which identifies cetacean and cow as sister taxa to the exclusion of pig and camel. Therefore, the protein anal- ysis supports our previous conclusion that the artiodac- tyls are paraphyletic. The camel lineage tentatively emerges as the earliest divergence among the ingroup taxa.
Discussion
The protein and the mitochondrial DNA data, therefore, yield congruent and complementary results, supporting tree II in figure 1 a. The most supported phy- logenetic hypothesis is the one in which the divergence between any two artiodactyl suborders predates the di- vergence between cetaceans and ruminants. Previous studies, using considerably fewer molecular data, albeit with a wider taxonomic sampling, have also detected similar arrangements of the taxa (e.g., see Goodman et al. 1985; Irwin et al. 199 1) but have dismissed the result as due to chance. What we now show, using all the avail- able molecular data, is that the arrangement is stable and statistically significant. Given the above results, we are faced with two taxonomic possibilities. Either demote the Cetacea to the rank of suborder and include it within the order Artiodactyla or else keep Cetacea as an inde- pendent order and fragment the Artiodactyla into three independent paraphyletic orders: Ruminantia, Sui- formes, and Tylopoda. For reasons of parsimony, we prefer the first possibility.
In order to pinpoint more accurately the phyloge- netic position of the Cetacea, we used a combined se- quence of the mitochondrial 12s and 16s rRNA genes from chevrotain ( Traguhs napu), a ruminant belonging to the infraorder Tragulina. The chevrotain is only dis- tantly related to the infraorder Pecora, to which cow belongs, but is still closer to cow than to pig (Kraus and Miyamoto 199 1) . The most parsimonious tree clusters cow and chevrotain to the exclusion of whale. An alter- native tree, clustering cow and whale, requires eight ad-
ditional transversions. Therefore, whale seems to have diverged from the ruminants before the divergence be- tween pecorans and tragulids. A composite schematic tree for these taxa is given in figure 1 b.
On morphological and paleontological grounds, pig and cow are estimated to have diverged - 5 5-60 Mya, whereas the divergence between Tragulus and cow is put at -45 Mya (Webb and Taylor 1980). Therefore, the divergence between cetaceans and ruminants must have occurred within this time interval. Since the DNA sequences evolve at approximately equal rates in all lin- eages, it is possible to estimate the time of divergence between cow and whale by using the divergence time between cow and pig as reference. The transversional distances between cow and pig, cow and whale, and pig and whale, are 0.08 1,0.068, and 0.084, respectively. We therefore estimate that cetaceans and ruminants diverged from each other 45-49 Mya. The same result is obtained if we use the divergence time between rodents and ar- tiodactyls (80 Mya) as reference. If our molecular in- ferences are to be trusted, then the claim that both ce- taceans and artiodactyls derive from a common early- Tertiary mesonychid stock dating back to -65 Mya (Wyss 1990) may only be correct in the technical sense of the word, to the extent that the Artiodactyla (inclusive of the Cetacea) are derived from the mesonychid con- dylarths or an allied early-Tertiary assemblage. The common ancestor of cetaceans and ruminants, and by extension the transition to aquatic life, however, must be more recent. Our 45-49-Myr estimate agrees well with the 20-25-Myr estimate for the divergence within cetaceans (Schlotterer et al. 199 1) and with the 10-l 5- Myr estimate for the divergence between baleen whales and sperm whales ( Millinkovitch et al. 1993).
We regard this and other molecular studies (e.g., Czelusniak et al. 1990; Li et al. 1990; Adkins and Ho- neycutt 199 1; Arnason et al. 199 1; Graur et al. 199 1; Mindell et al. 199 1; Arnason and Johnson 1992; Graur 1993) as tentative steps toward resolving the phyloge- netic affinities among the eutherian orders and as proof that Simpson’s ( 1945 ) view, according to which the great “burst” of mammalian radiations >65 Mya has rendered the ordinal phylogeny of eutherian mammals insoluble, is overly pessimistic. Molecular data, with their potential to supply millions of phylogenetically useful characters, may soon resolve the phylogenetic topology of the orders of mammals into a consistently bifurcating tree.
Acknowledgments
We thank Drs. Toby Gibson, Marc Godinot, and Paul Sharp for insightful comments. The help of Dr. Manolo Gouy with the statistical analyses is particularly and gratefully acknowledged. This study has been sup-
ported by the US-Israel EMBO, and the EMBL.
LITERATURE CITED
Cetacean Origins 363
Binational Foundation, the analysis using amino acid and nucleotide sequence data. Cladistics 1:171-185.
GRAUR, D. 1993. Molecular phylogeny and the higher clas- sification of eutherian mammals. Trends Ecol. Evol. 8: 14 l- 147.
ADACHI, J., Y. CAO, and M. HASEGAWA. 1993. Tempo and mode of mitochondrial DNA evolution in vertebrates at the amino acid sequence level: rapid evolution in warm- blooded vertebrates. J. Mol. Evol. 36:270-28 1.
ADKINS, R. M., and R. L. HONEYCUTT. 199 1. Molecular phy- logeny of the superorder Archonta. Proc. Natl. Acad. Sci. USA 88:10317-10321.
ALLARD, M. A., M. M. MIYAMOTO, L. JARECKI, F. KRAUS, and M. R. TENNANT . 1992. DNA systematics and evolution of the artiodactyl family Bovidae. Proc. Natl. Acad. Sci. USA 89:3972-3976.
ARNASON, U., A. GULLBERG, and B. WIDEGREN. 199 1. The complete nucleotide sequence of the mitochondrial DNA of the fin whale, Balaenoptera physalus. J. Mol. Evol. 33: 556-568.
ARNASON, U., and E. JOHNSON. 1992. The complete mito- chondrial DNA sequence of the harbor seal, Phoca vitulina. J. Mol. Evol. 34:493-505.
BAIROCH, A., and B. BOECKMANN. 1992. The SWISS-PROT protein sequence data bank. Nucleic Acids Res. 20:2019- 2022.
BULMER, M., K. H., WOLFE, and P. M. SHARP. 199 1. Syn- onymous nucleotide substitution rates in mammalian genes: implications for the molecular clock and the relationship of mammalian orders. Proc. Natl. Acad. Sci. USA 88:5974- 5978.
CZELUSNIAK, J., M. GOODMAN, B. F. KOOP, D. A. TAGLE, J. SHOSAHNI, G. BRAUNITZER, T. K. KLEINSCHMIDT, W. W. DE JONG, and G. MATSUDA . 1990. Perspectives from amino acid and nucleotide sequences on cladistic relationships among higher taxa of eutheria. Cm-r. Mammal. 2:545-572.
FELSENSTEIN, J. 198 1. Evolutionary trees from DNA se- quences: a maximum likelihood approach. J. Mol. Evol. 17:368-376.
-. 1985a. Confidence limits on phylogenies: an approach using the bootstrap. Evolution 39:783-79 1.
-. 19856. Confidence limits on phylogenies with a mo- lecular clock. Syst Zool. 34: 152-16 1.
- 1989. PHYLIP-phylogeny inference package, ver- . sion 3.4. Cladistics 5: 164- 166.
FITCH, W. M. 1977. On the problem of discovering the most parsimonious tree. Am. Nat. 111:223-257.
FLOWER, W. H., and J. G. GARSON. 1884. Catalogue of the specimens illustrating the oseology and dentition of verte- brated animals recent and extinct in the museum of the Royal College of Surgeons of England. II. Class Mammalia other than man. Royal College of Surgeons, London.
GINGERICH, P. D., B. H. SMITH, and E. L. SIMONS. 1990. Hind limbs of Eocene Basilosaurus: evidence of feet in whales. Science 249: 154- 15 7.
GOODMAN, M., J. CZELUSNIAK, and J. E. BEEBER. 1985. Phlogeny of primates and other eutherian orders: a cladistic
GRAUR, D., W. A. HIDE, and W.-H. LI. 199 1. Is the guinea- pig a rodent? Nature 351:649-652.
HIGGINS, D. G., A. J. BLEASBY, and R. FUCHS. 1992a. CLUS- TAL V: improved software for multiple sequence alignment. Comput. Appl. Biosci. 8: 189- 19 1.
HIGGINS, D. G., R. FUCHS, P. J. STOEHR, and G. N. CAMERON. 1992b. The EMBL data library. Nucleic Acids Res. 20: 207 l-2074.
HOELZEL, A. R., J. M. HANCOCK, and G. A. DOVER. 199 1. Evolution of the cetacean mitochondrial D-loop region. Mol. Biol. Evol. 8:475-493.
IRWIN, D. M., T. D. KOCHER, and A. C. WILSON. 199 1. Evo- lution of the cytochrome b gene of mammals. J. Mol. Evol. 32:128-144.
KISHINO, H., and M. HASEGAWA. 1989. Evaluation of the maximum likelihood estimate of the evolutionary tree to- pologies from DNA sequence data, and the branching order in Hominoidea. J. Mol. Evol. 29: 170-179.
KRAUS, F., L. JARECKI, M. M. MIYAMOTO, S. M. TANHAUSER, and P. J. LAIPIS. 1992. Mispairing and compensational changes during the evolution of mitochondrial ribosomal RNA. Mol. Biol. Evol. 9:770-774.
KRAUS, F., and M. M. MIYAMOTO. 199 1. Rapid cladogenesis among the pecoran ruminants: evidence from mitochon- drial DNA sequences. Syst. Zool. 40: 117- 130.
LI, W.-H. 1989. A statistical test of phylogenies estimated from sequence data. Mol. Biol. Evol. 6:424-435.
LI, W.-H., M. GOUY, P. M. SHARP, C. O’HUIGIN, and Y.-W. YANG. 1990. Molecular phylogeney of Rodentia, Lagomorpha, Primates, Artiodactyla, and Carnivora and molecular clocks. Proc. Natl. Acad. Sci. USA 87: 6703-6707.
MILLINKOVITCH, M. C., G. ORTI, and A. MEYER. 1993. Re- vised phylogeny of whales suggested by mitochondrial ri- bosomal DNA sequences. Nature 361:346-348.
MINDELL, D. P., C. W. DICK, and R. J. BAKER. 199 1. Phylogenetic relationships among megabats, microbats, and primates. Proc. Natl. Acad. Sci. USA 88:10322- 10326.
MIYAMOTO, M. M., and S. M. BOYLE. 1989. The potential importance of mitochondrial DNA sequence data to euthe- rian mammal phylogeny. Pp. 437-450 in B. FERNHOLM, K. BREMER, and H. J~RNVALL, eds. The hierarchy of life: molecules and morphology in phylogenetic analysis. Else- vier, Amsterdam.
MIYAMOTO, M. M., S. M. TANHAUSER, and P. LAIPIS. 1989. Systematic relationships in the artiodactyl tribe bovini (family Bovidae), as determined from mitochondrial DNA sequences. Syst. Zool. 38:342-349.
NEI, M. 1987. Molecular evolutionary genetics. Columbia University Press, New York.
364 Graur and Higgins
NOVACEK, M. J. 1992. Mammalian phylogeny: shaking the tree. Nature 356:121-125.
SAITOU, N., and M. NEI. 1987. The neighbor-joining method: a new method for reconstructing phylogenetic trees. Mol. Biol. Evol. 4:406-425.
SCHL~TTERER, C., B. AMOS, and D. TAUTZ. 199 1. Conser- vation of polymorphic simple sequence loci in cetacean species. Nature 354:63-65.
SIMPSON, G. G. 1945. The principles of classification and a classification of mammals. Bull. Am. Museum Nat. Hist. 85: l-350.
TAJIMA, F., and NEI, M. 1984. Estimation of evolutionary distance between nucleotide sequences. Mol. Bio. Evol. 1: 269-285.
TANHAUSER, S. M. 1985. Evolution of mitochondrial DNA: patterns and rate of change. Ph.D. dissertation, University of Florida, Gainesville.
WATANABE, T., Y. HAYASHI, J. KIMURA, Y. YASUDA, N. SAI- TOU, T. TOMITA, and N. OGASAWARA. 1986. Pig mito- chondrial DNA: polymorphism, restriction map orienta- tion, and sequence data. Biochem. Genet. 24:385-396.
WEBB, S. D., and B. E. TAYLOR. 1980. The phylogeny of homless ruminants and a description of the cranium of Archaeomeryx Am. Museum Nat. Hist. Bull. 167: 117-158.
WYSS, A. 1990. Clues to the origin of whales. Nature 347:428- 429.
PAUL M. SHARP, reviewing editor
Received July 13, 1993
Accepted October 14, 1993