molecular epidemiology of avian influenza and newcastle disease … · 2013. 10. 28. · avian...
TRANSCRIPT

This file is part of the following reference:
Desniwaty (2011) Molecular epidemiology of Avian
influenza and Newcastle disease using samples
transported without a cold chain. Masters (Research)
thesis, James Cook University.
Access to this file is available from:
http://eprints.jcu.edu.au/29965/
The author has certified to JCU that they have made a reasonable effort to gain
permission and acknowledge the owner of any third party copyright material
included in this document. If you believe that this is not the case, please contact
[email protected] and quote http://eprints.jcu.edu.au/29965/
ResearchOnline@JCU

1
MOLECULAR EPIDEMIOLOGY OF AVIAN INFLUENZA AND NEWCASTLE DISEASE USING
SAMPLES TRANSPORTED WITHOUT A COLD CHAIN
Thesis submitted by
Desniwaty
Master of Tropical Veterinary Science (by research)
In May 2011
For the degree of Master of Tropical Veterinary Science at the School of Veterinary and Biomedical Sciences,
James Cook University

i
DECLARATION
I declare that this thesis is my own work and has not been submitted in any form for
another degree or diploma at any university or other institution of tertiary education.
Information derived from the published and unpublished work of other has been
acknowledged in text and a list of references is given.
Desniwaty
May 2011
STATEMENT OF ACCESS
I, the undersigned, author of this thesis, understand that James Cook University will
make it available for the use within the University Library and, via the Australian
Digital Thesis Network, for use elsewhere. I also understand that, as an unpublished
work, a thesis has significant protection under the Copyright Act and;
I do not wish to place any further restriction on access to this work.
Desniwaty
May 2011

ii
ACKNOWLEDGMENT Firstly, I would like to express a gratitude to my supervisor, Dr. Graham Burgess for his whole supervision in my research project at School Veterinary and Biomedical Science, James Cook University. Thank you for the opportunity to work on this project, and for the support, advice and patience. Your invaluable academic supervision throughout my research has broad my knowledge not only in AI and ND diagnosis assay and samples transportation but also in time management, project planning and organisation. I sincerely thank to the Australian Development Scholarship, AusAID for their support during my study period 2006-2008. I would like to express a deep thanks to AusAID-JCU liaison officers, Alex Salvador, Cinzia Spinelli, and Katherine Eliot, who have really welcomed and cared about AusAID students, and helped me in many difficult times. I deeply thank to your generous assistance and patience. To the Australian Quarantine Inspection Services (AQIS) Canberra and Far North Queensland, I would like to express my acknowledgement particularly to Pat Boland and Ross Furphy. Thank you for supporting me to attend training about AI in AAHL-CSIRO, Geelong. I would like also to express my gratitude the AAHL-CSIRO experts for broadening my understanding in laboratory management and biosafety. My sincere acknowledgment is also addressed to researchers and staffs at School of Veterinary and Biomedical Sciences, who have supported me during my research project at JCU. I deeply appreciate to Kerry Claydon, Long Nguyen, Anthony Baker, Odwell Muzari, Kathy La Fauce, Alana Cooper, Jennifer Elliman, Stephen Garland, Karen Juntunen, Ray Layton, Ashanul Hoque, Gareth Evershed, Lauren Cook, Leigh Owen, Lee Skerratt, and Jan Smith. To other people who have supported me, John Copland, Hans Heine, Ibrahim Diallo, Bambang Pontjo Prioseoeryanto, I would like to say thank you. To my employer, the Agricultural Quarantine Agency of Indonesia (AQAI) who given me the opportunity to continue my study, I would like to express my gratitude. My deep thanks to the Director General of AQAI, Syukur Iwantoro and other AQAI officers, Budi Tri Akoso, Catur Putra Budiman, Mira Hartati, Tri Wahyuni, Farid Hermansyah, Putu Lisa, Mujiatun, and Nuryani Zainuddin. A deep gratitude is also addressed to people who have a contribution to the processed of my samples transportation. I would like to show appreciation to Agus Wiyono from Directorate General Livestock Service (DGLS), Balitvet, Pusvetma and Indonesian Institute of Sciences (LIPI). Finally, I would like to say thank you to my family and friends. Many thanks to my beloved parents, sisters and brothers, to Siska Ferawaty, Remelia Suranta, for their loving, caring and patience to support me and maintain my spirits. To, Indonesian Student Association at JCU, Dian Latifah, Gustaf, Thessy, Puji, Zainul, Lita and Tony, thank you so much for our friendship. Thank you for everybody who had invaluable contribution in my two years studying at James Cook University. God bless you all.

iii
LIST OF GENERAL ABBREVIATIONS
AI Avian Influenza
AIV AI Virus
APMV Avian Paramyxovirus
APMV-1 Avian Paramyxovirus serotype 1
ANOVA Analysis of Variance
AQIS Australian Quarantine Inspection Services
AQAI Agricultural Quarantine Agency of Indonesia
BLAST Basic local alignment search tool
BHQ Black Hole Quencher
BSA Bovine Serum Albumin
cDNA Complimentary DNA
CEK Chicken Embryo Kidney
cRNA Complimentary RNA
Ct Cycle threshold: The number of qPCR cycles taken for
a reaction to produce a fluorescent signal that is
statistically significantly above background
DBA Digestion Buffer Additive
DEPC Diethylpyrocarbonate
DTT Dithiothreitol
DNA Deoxyribonucleic acid
EDTA Ethylenediamine tetraacetic acid
EID Egg Infectious Dose
ELISA Enzyme linked immunosorbent assay
GuSCN Guanidium isothiocyanate
GnHCl Guanidine hydrochloride
HA Haemagglutinin
HPAI Highly Pathogenic AI
HPNAI Highly Pathogenic Notifiable AI
HRM High Resolution Melt
ICPI Intracerebral Pathogenicity index
IVPI Intravenous Pathogenicity Index
JCU James Cook University
LB Lysis Buffer

iv
LPAI Low Pathogenic of AI
LSDB Liquid Sample Digest Buffer
M Matrix
MDCK Madin Darby Canine Kidney
MDBK Madin Darby Bovine Kidney
MDT Mean Death Time
mRSB Modified RNA Safe Buffer
NA Neuraminidase
NC Nucleocapsid
ND Newcastle disease
NDV Newcastle disease virus
NDVs Newcastle disease viruses
NP Nucleoprotein
NTC No template control
NS Non Structural
PA Polymerase A
PB Polymerase B
PBS Phosphate buffered saline
PC6 Protein convertase 6
PCR Polymerase chain reaction
p.i. Post inoculation
qPCR Quantitative (real-time) polymerase chain reaction
RNA Ribonucleic acid
RT-PCR Reverse Transcriptase Polymerase Chain Reaction
RT-qPCR Reverse-transcriptase quantitative (real time) polymerase
chain reaction
TAE Tris-acetate ethylenediamine tetraacetic acid
TCB TE Carrier Buffer
TE Tris EDTA
Tm Melting temperature: The temperature at which half of a
DNA sample is single stranded
SA Sialic Acid
SAN Specific Antibody Negative
SARS Special Administrative Regions
SDS Sodium Dodecyl Sulphate

v
SPF Specific Pathogenic Free
STDB Solid Tissue Digest Buffer
WA Western Australia
WHO World Health Organization
vRNA Viral RNA
VBB Viral Binding Buffer

vi
LIST OF NUMERICAL UNIT ABBREVIATIONS
Bp Base pairs
Cl. Confidence limits (typically 95%)
cm Centimetre
g Relative centrifugal force
g Grams
hrs Hours
kb Kilobase
M Molar
mg Milligrams
min Minutes
ml Millilitres
ng Nanograms
RPM Revolutions per minute
sec Seconds
STDV Standard deviation
V Volts
°C Degrees Celsius
μg Micrograms
μl Microlitres

vii
ABSTRACT
Limited infrastructure in developing countries makes rapid and accurate diagnosis of Avian Influenza (AI) and Newcastle disease (ND) difficult. This project has examined a method for collecting and transporting samples that eliminates the problems associated with previous ways of managing viral outbreaks. This method, verified using Real time (quantitative) reverse transcriptase polymerase chain reaction (RT-qPCR), also overcomes quarantine restrictions between countries. An epidemiological study was then carried out using the collection and transportation method and the results of this study can be used to support further epidemiological studies of AI and ND and to standardise assays between countries. Diagnostic assays for AI and ND based on RT-qPCR have been developed and published. These assays use the deoxyribonucleic acid (DNA) binding dye, SYBR Green, or dual labelled TaqMan probes, (van Elden et al., 2001; Spackman et al., 2002; Tan et al., 2004; Ward et al., 2004; Pham et al., 2005; Payungporn et al., 2006b; Ong et al., 2007). However, SYBR Green and TaqMan probes have limitations. SYBR Green can inhibit PCR reactions because it degrades PCR products, while TaqMan probes have less sensitivity due to the specificity of the probe sequences. Therefore, a SYTO 9 RT-qPCR was developed for the AI and ND diagnosis. SYTO 9 RT-qPCR for AI virus (AIV) and ND virus (NDV) assays were successfully used. A series of new primers were evaluated and developed in these assays such as M+4100 forward and M-4220 reverse for ND detection of Class II NDVs (chicken) (Wise et al., 2004) and NDV MGB1 for ND detection of Class I NDVs (wild birds). For the AI screening test, a few pairs of primers based on the M gene were also evaluated (Ward et al., 2004; Heine et al., 2005). Subsequently, these diagnostic assays were used to evaluate sample collection and transportation without a cold chain. Further studies were also performed to evaluate the sequences of NDVs. This sequencing was intended to show the viral pathotyping and phylogenetic relationships of NDV. Primers that targeted a 343 bp Fusion sequence were designed and successfully used to amplify six Australian NDV isolates, both NDV Class I and Class II. Based on the amino acid sequence in the Fusion cleavage site, the six isolates were confirmed as low virulence of NDV. The motif of the cleavage sites were S-G-G-E-R-Q-E-R-L-V, S-G-G-E-Q-Q-G-R-L-I and S-G-G-G-K-G-R-L-I. Evaluations of suitable buffers showed that Solid Tissue Digest Buffer (STDB) and Lysis Buffer (LB) were effective buffers for sample collection and transportation. Further studies showed that there was no significant difference between these two buffers. However, viability experiments showed that the LB deactivated both AI and NDV while STDB failed to fully inactivate NDV. Therefore, the lysis buffer was chosen for further sample collection and transportation without a cold chain. A protocol for the extraction of samples collected without cold chain was evaluated. This modified protocol was successfully integrated into the nucleic purification system using a robotic device and ribonucleic acid (RNA) extraction protocol (Corbett Research, Brisbane). However, extracted and purified RNA may be degraded by ribonuclease contamination. Therefore, this project also evaluated buffers for RNA storage after extraction.

viii
Evaluation of two modified buffers, the Tris EDTA (TE) carrier buffer (TCB) and modified RNA safe buffer (mRSB), showed that both buffers can prevent RNA degradation with no significant difference in cycle threshold (Ct)-Value detected by RT-qPCR. The method of collection and transportation samples without a cold chain was applied by collecting live viruses and also viral antigens in Indonesia and transporting to Australia. Due to the time limitation, viral isolates were collected only from AI viruses representing four different regions in Indonesia (Timika, Ambon, Tanggerang, and Sukabumi). For ND commercial antigens (Balitvet and Pusvetma) were purchased. The AI and ND samples were processed using a lysis buffer in the Quarantine Agency Laboratory of Indonesia and transported to James Cook University (JCU) in Townsville, Australia. Transported AI and ND viral RNA were successfully amplified using SYTO 9 RT-qPCR. This study confirmed that not only viral RNA but also inactivated viral RNA can be preserved, transported and detected after a month of processing. This transportation also verified that viral RNA can be recovered and detected after chemical inactivation. SYTO 9 RT-qPCR and TaqMan dual labelled probed RT-qPCR assays were carried out to screen the presence of AI viruses in the transport buffer. These assays used published protocols (Ward et al., 2004; Heine et al., 2005). The assays successfully detected viral RNA. However, the TaqMan dual labelled probe assay for H5 (Heine et al., 2005) failed to detect viral RNA in the Sukabumi isolates. Further studies of Indonesian AI isolates using High Resolution Melt assay recognised at least two populations from four different regions. Normalization data demonstrated that Timika and Ambon isolates were very similar while Tanggerang and Sukabumi isolates represented different populations. These results suggest that there is continued evolution of AI viruses in Indonesia. The ability of lysis buffer to preserve AI viral RNA was confirmed by amplification of 590bp and 1370 bp products from the Haemagglutinin (HA) gene. These products were successfully sequenced demonstrating that the viral RNA transported using lysis buffer was not fragmented. As a result, a molecular epidemiology study of AI and ND isolates was successfully carried out using the samples transported without a cold chain. However, at this stage, the method of collection and transportation of samples without a cold chain has not been applied to field and clinical samples. The value of the technique would be enhanced if it could be demonstrated that it works equally well for swabs and tissues collected in the field.

ix
TABLE OF CONTENTS
MOLECULAR EPIDEMIOLOGY OF AVIAN INFLUENZA AND NEWCASTLE DISEASE USING SAMPLES TRANSPORTED WITHOUT A COLD CHAIN ................................................... 1
DECLARATION ........................................................................................................................................ I
STATEMENT OF ACCESS ..................................................................................................................... I
ACKNOWLEDGMENT ........................................................................................................................... II
LIST OF GENERAL ABBREVIATIONS ............................................................................................ III
LIST OF NUMERICAL UNIT ABBREVIATIONS ............................................................................. VI
ABSTRACT ............................................................................................................................................ VII
TABLE OF CONTENTS ......................................................................................................................... IX
LIST OF TABLES ................................................................................................................................ XIII
LIST OF FIGURES .............................................................................................................................. XIV
CHAPTER 1 ............................................................................................................................................... 1
GENERAL INTRODUCTION ................................................................................................................. 1
1.1 BACKGROUND .................................................................................................................................. 1
1.2 AIMS OF THE RESEARCH PROJECT ........................................................................................... 3
CHAPTER 2 ............................................................................................................................................... 4
LITERATURE REVIEW .......................................................................................................................... 4
2.1 AVIAN INFLUENZA DISEASE ........................................................................................................ 4
2.1.1 VIRUS OVERVIEW ............................................................................................................................ 5 2.1.2 PATHOGENESIS OF AI DISEASE ........................................................................................................ 8 2.1.3 CLINICAL SIGNS OF AVIAN INFLUENZA DISEASE ............................................................................ 11 2.1.4 EPIDEMIOLOGY OF AVIAN INFLUENZA ........................................................................................... 11
2.2 NEWCASTLE DISEASE .................................................................................................................. 13
2.2.1 VIRUS OVERVIEW .......................................................................................................................... 14 2.2.2 PATHOGENESIS OF NEWCASTLE DISEASE ....................................................................................... 15 2.2.3 CLINICAL SIGNS OF NEWCASTLE DISEASE ..................................................................................... 16 2.2.4 EPIDEMIOLOGY OF NEWCASTLE DISEASE ...................................................................................... 17
2.3 MOLECULAR EPIDEMIOLOGY AND PHYLOGENETIC OF NDVS ..................................... 19
2.4 LABORATORY DIAGNOSIS OF AVIAN INFLUENZA AND NEWCASTLE DISEASE ....... 22
2.4.1 SAMPLES FOR LABORATORY DIAGNOSIS ........................................................................................ 22 2.4.2 VIRUS AND VIRAL ANTIGEN DETECTION ........................................................................................ 22 2.4.3 HAEMAGGLUTINATION ASSAY ...................................................................................................... 23 2.4.4 SEROLOGICAL ASSAY .................................................................................................................... 23
2.4.4.1 Haemagglutination inhibition ............................................................................................... 23 2.4.4.2 Enzyme linked immunosorbent assay .................................................................................... 23
2.5 MOLECULAR OR GENOME DETECTION................................................................................. 25
2.5.1 POLYMERASE CHAIN REACTION ..................................................................................................... 25 2.5.2 REAL TIME (QUANTITATIVE) POLYMERASE CHAIN REACTION ........................................................ 27
CHAPTER 3 ............................................................................................................................................. 28
GENERAL MATERIALS AND METHODS ........................................................................................ 28
3.1 NEWCASTLE DISEASE AND AVIAN INFLUENZA VIRUSES ................................................ 28
3.1.1 ND VIRUSES .................................................................................................................................. 28 3.1.2 AVIAN INFLUENZA VIRUSES .......................................................................................................... 29
3.2 PROPAGATION OF STOCK VIRUSES ........................................................................................ 29

x
3.2.1 VIRAL CULTURE ............................................................................................................................ 29 3.2.2 HARVESTING ................................................................................................................................. 30
3.3 HAEMAGGLUTINATION TEST ................................................................................................... 30
3.3.1 PREPARATION OF 0.5% CHICKEN RED BLOOD CELLS ...................................................................... 30 3.3.2 ANTIGEN TITRATION ..................................................................................................................... 30 3.3.3 BACTERIAL CONTAMINATION DETECTION FOR QUALITY CONTROL OF STOCK VIRUSES .................. 30
3.4 CONFIRMATION OF THE PRESENCE OF NDV USING ELISA ............................................. 31
3.5 ESTIMATION OF VIRAL TITRE BY 50% EGG INFECTIOUS DOSE ................................... 31
3.6 POLYMERASE CHAIN REACTION ............................................................................................. 31
3.6.1 RNA EXTRACTION ......................................................................................................................... 31 3.6.2 PRIMERS, PROBES AND DNA BINDING DYE .................................................................................... 32 3.6.3 CONVENTIONAL PCR .................................................................................................................... 35
3.6.3.1 One step reverse transcriptase polymerase chain reaction .................................................. 35 3.6.4 PCR AMPLIFICATION ..................................................................................................................... 35 3.6.5 ANALYSIS AND PURIFICATION PCR PRODUCT ............................................................................... 35 3.6.6 EXTRACTION OF DNA FRAGMENTS ............................................................................................... 36
3.7 SEQUENCING ................................................................................................................................... 36
3.7.1. PHYLOGENETIC ANALYSIS ............................................................................................................ 36
CHAPTER 4 ............................................................................................................................................. 37
DEVELOPMENT AND EVALUATION OF REAL TIME RT-PCR ASSAYS FOR THE DETECTION OF ND VIRUSES ............................................................................................................ 37
4.1 INTRODUCTION .............................................................................................................................. 37
4.2 LITERATURE REVIEW .................................................................................................................. 37
4.3 AIMS ................................................................................................................................................... 38
4.4 MATERIALS AND METHODS ....................................................................................................... 38
4.4.1 PROPAGATION OF VIRUSES ............................................................................................................ 38
4.4.2 RNA EXTRACTION ...................................................................................................................... 39
4.4.3 PRIMER SETS .................................................................................................................................. 39 4.4.4 REVERSE TRANSCRIPTASE REAL TIME PCR ................................................................................... 39 4.4.5 CONVENTIONAL PCR .................................................................................................................... 40
4.5 RESULTS ........................................................................................................................................... 41
4.5.1 EVALUATION OF CLASS I AND CLASS II NDV PRIMERS ................................................................. 41 4.5.2 EVALUATION OF MATRIX PRIMERS FOR NDV CLASS I AND CLASS II DETECTION. ......................... 42 4.5.3 A DUPLEX ASSAY USING TWO PAIRS OF ND VIRUS MATRIX PRIMERS ............................................ 43 4.5.4 MELTING CURVE ANALYSIS OF NDV CLASS I AND CLASS II ISOLATES ......................................... 44 4.5.5 SENSITIVITY OF THE TEST .............................................................................................................. 46
4.6 DISCUSSION ..................................................................................................................................... 47
4.7 CONCLUSION ................................................................................................................................... 49
CHAPTER 5 ............................................................................................................................................. 50
MOLECULAR PHYLOGENETIC AND PATHOTYPING STUDY OF AUSTRALIAN NEWCASTLE DISEASE VIRUS ISOLATES ...................................................................................... 50
5.1 INTRODUCTION .............................................................................................................................. 50
5.2 LITERATURE REVIEW .................................................................................................................. 50
5.3 AIMS ................................................................................................................................................... 52
5.4 MATERIALS AND METHODS ....................................................................................................... 52
5.4.1 VIRUSES ........................................................................................................................................ 52 5.4.2 GENBANK SEQUENCES .................................................................................................................. 53 5.4.3 PRIMERS ........................................................................................................................................ 53 5.4.4 REVERSE TRANSCRIPTASE PCR ............................................................................................... 53

xi
5.4.5 PCR PRODUCT ANALYSIS AND PURIFICATION ................................................................................ 54 5.4.6 SEQUENCING ................................................................................................................................. 54
5.5 RESULTS ........................................................................................................................................... 54
5.5.1 ND FUSION AND MATRIX GENE DETECTION FOR CLASS I ISOLATES ............................................... 54 5.5.2 ND FUSION GENE DETECTION FOR CLASS II ISOLATES .................................................................. 55 5.5.3 SEQUENCES ANALYSIS .................................................................................................................. 56
5.6 DISCUSSION ..................................................................................................................................... 58
CHAPTER 6 ............................................................................................................................................. 59
EVALUATION OF TRANSPORT BUFFERS FOR COLLECTION AND TRANSPORTATION OF SAMPLES WITHOUT A COLD CHAIN ....................................................................................... 59
6.1 INTRODUCTION .............................................................................................................................. 59
6.2 LITERATURE REVIEW .................................................................................................................. 60
6.2.1 COLLECTION AND TRANSPORTATION OF VIRUSES WITH A COLD CHAIN ......................................... 60 6.2.2 COLLECTION AND TRANSPORTATION OF VIRUSES WITHOUT COLD CHAIN ...................................... 60 6.2.3 IMPORTANT CRITERIA FOR BUFFERS TO BE USED FOR THE COLLECTION AND TRANSPORTATION OF
SAMPLES WITHOUT A COLD CHAIN.......................................................................................................... 61 6.2.4 CHEMICAL COMPONENTS OF BUFFERS ........................................................................................... 61
6.2.4.1 Detergent and chelating agent .............................................................................................. 61 6.2.4.2 Proteolytic enzymes .............................................................................................................. 62 6.2.4.3 Chaotropic agents ................................................................................................................. 62 6.2.4.4 RNase Inactivator ................................................................................................................. 63 6.2.4.5 Carrier RNA ......................................................................................................................... 63
6.2.5 INTEGRATION OF TRANSPORT BUFFER WITH NUCLEIC ACID EXTRACTION PROTOCOL .................... 64
6.3 AIMS ................................................................................................................................................... 64
6.3.1 PILOT PROJECT .............................................................................................................................. 64 6.3.2 DEFINITIVE STUDY ........................................................................................................................ 64 6.3.3 VIRAL VIABILITY VERIFICATION .................................................................................................... 64
6.4 MATERIALS AND METHODS ....................................................................................................... 65
6.4.1 GENERAL METHODS ...................................................................................................................... 65 6.4.1.1 Viruses .................................................................................................................................. 65 6.4.1.2 Buffers ................................................................................................................................... 65 6.4.1.3 Design of the study ................................................................................................................ 66 6.4.1.4 A SYTO 9 RT-qPCR .............................................................................................................. 66
6.4.2 PILOT PROJECT .............................................................................................................................. 66 6.4.3 DEFINITIVE STUDY ........................................................................................................................ 67
6.4.3.1 Data Analysis ........................................................................................................................ 67 6.4.4 VIRAL VIABILITY VERIFICATION ................................................................................................... 68
6.5 RESULTS ........................................................................................................................................... 68
6.5.1 PILOT PROJECT .............................................................................................................................. 68 6.5.2 DEFINITIVE STUDY ........................................................................................................................ 70
6.5.2.1 Statistical Analysis ................................................................................................................ 71 6.5.3 VIRAL VIABILITY .......................................................................................................................... 74
6.6 DISCUSSION ..................................................................................................................................... 77
6.7 CONCLUSION ................................................................................................................................... 80
CHAPTER 7 ............................................................................................................................................. 81
STORAGE OF EXTRACTED VIRAL RNA ........................................................................................ 81
7.1 INTRODUCTION .............................................................................................................................. 81
7.2 LITERATURE REVIEW .................................................................................................................. 81
7.3 AIMS ................................................................................................................................................... 83
7.4 MATERIALS AND METHODS ....................................................................................................... 83
7.4.1 EXTRACTED VIRAL RNA .............................................................................................................. 83 7.4.2 BUFFERS ........................................................................................................................................ 83

xii
7.4.3 EXPERIMENTAL DESIGN ................................................................................................................. 83 7.4.4 REAL TIME (QAUNTITATIVE) RT-PCR ........................................................................................... 84 7.4.5 DATA ANALYSIS ............................................................................................................................ 84
7.5 RESULT .............................................................................................................................................. 84
7.5.1 DILUTION OF EXTRACTED VIRAL RNA’S IN TWO DIFFERENT BUFFERS .......................................... 84 7.5.2 Freeze-thawing experiment ................................................................................................ 88
7.5.3 LONG TERM STORAGE EXPERIMENT ............................................................................................... 91
7.6 DISCUSSION ..................................................................................................................................... 93
7.7 CONCLUSION ................................................................................................................................... 94
CHAPTER 8 ............................................................................................................................................. 95
COLLECTION AND TRANSPORTATION OF SAMPLES FROM INDONESIA WITHOUT A COLD CHAIN .......................................................................................................................................... 95
8.1 INTRODUCTION .............................................................................................................................. 95
8.2 LITERATURE REVIEW .................................................................................................................. 96
8.3 AIMS ................................................................................................................................................... 97
8.4 MATERIALS AND METHODS ....................................................................................................... 98
8.4.1 SAMPLES ....................................................................................................................................... 98 8.4.1 GENBANK SEQUENCES .................................................................................................................. 98 8.4.2 PERMIT CERTIFICATES ................................................................................................................... 99 8.4.3 BUFFER ......................................................................................................................................... 99 8.4.4 PROTOCOL OF SAMPLES COLLECTION IN TRANSPORT BUFFER ........................................................ 99 8.4.5 RNA EXTRACTION ....................................................................................................................... 100 8.4.6 REAL TIME (QUANTITATIVE) PCR ............................................................................................... 100
8.5 RESULTS ......................................................................................................................................... 102
8.6 DISCUSSION ................................................................................................................................... 116
8.7 CONCLUSION ................................................................................................................................. 119
CHAPTER 9 ........................................................................................................................................... 120
GENERAL DISCUSSION ..................................................................................................................... 120
CHAPTER 10 ......................................................................................................................................... 126
CONCLUSION ....................................................................................................................................... 126
APPENDIX ............................................................................................................................................. 127
REFERENCES ....................................................................................................................................... 135

xiii
LIST OF TABLES
TABLE 3.1 REFERENCE VIRUSES OF ND AND AI USED IN THIS STUDY .............................. 28
TABLE 3.2 PRIMERS AND PROBES FOR AI VIRUSES’ USED IN THIS STUDY ...................... 33
TABLE 3.3 PRIMERS AND PROBES FOR NDVS USED IN THIS STUDY ................................... 34
TABLE 6.1 VERIFICATION OF THE VIABILITY OF THE TWO VIRUSES STORED IN SOLID TISSUE DIGESTS BUFFER OR LYSIS BUFFER. STORED VIRUSES WERE INOCULATED INTO 10-DAY-OLD EMBRYONATED EGGS WHICH WERE CHECKED FOR VIABILITY AND THE ALLANTOIC FLUID SCREEN FOR HA ACTIVITY. .............................. 76
TABLE 8.1. PRIMERS FOR DIAGNOSING AIV AND NDV IN SAMPLES COLLECTED AND TRANSPORTED FROM INDONESIA. .............................................................................................. 100
TABLE 8.2. PRIMERS FOR SEQUENCING NDV AND H5 AIV ................................................... 101

xiv
LIST OF FIGURES
FIGURE 2.1. THE PHYLOGENY OF NDV BASED ON COMPLETE FUSION GENE (CZEGLEDI ET AL., 2006). ...... 20 FIGURE 2.2. GENOMIC ANALYSIS OF ND BASED ON PARTIAL F SEQUENCES (CZEGLEDI ET AL., 2006)......... 21 FIGURE 4.1 REAL TIMES PCR FOR CLASS I AND CLASS II NDV’S BASED ON M AND FUSION GENES. FOUR
SETS OF PRIMERS IN DIFFERENT TUBES WERE EVALUATED TO THE CLASS I (WA 3245, IBIS) AND
CLASS II (V4) ISOLATES. ALL PRIMERS SUCCESSFULLY AMPLIFIED THEIR RESPECTIVE TARGETS. ..... 41 FIGURE 4.2 SYTO 9 RT-QPCR FOR DETECTION OF NDVS OF CLASS I AND CLASS II USING THE WISE M
CLASS II PRIMERS (WISE ET AL., 2004) .............................................................................................. 42 FIGURE 4.3 SYTO 9 RT-QPCR FOR DETECTION OF CLASS I AND CLASS II NDV USING THE CLASS I M
PRIMERS. THE PRIMERS AMPLIFIED THE CLASS I NDV WA 3245 ISOLATES BUT FAILED TO DETECT
THE FOUR CHICKENS CLASS II NDV ISOLATES V4, FP1, AP1, AND SP3 ............................................ 43 FIGURE 4.4 FLUORESCENCE DATA OF DUPLEX SYTO 9 RT-QPCR ASSAY CLASS I AND CLASS II ND
ISOLATES. .......................................................................................................................................... 43 FIGURE 4.5 MELTING CURVE PROFILE IN DIFFERENT PRIMERS FOR DIFFERENT M AND FUSION SEQUENCE
CLASS I AND CLASS II OF NDVS. TWO CLASSES NDV’S M AND FUSION FRAGMENTS HAVE DIFFERENT
MELTING POINTS. ............................................................................................................................... 44 FIGURE 4.6 MELTI CURVE PROFILE OF CLASS I AND CLASS II NDV ISOLATES IN DUPLEX RT-QPCR ASSAY.
.......................................................................................................................................................... 45 FIGURE 4.7 MELTING CURVE PROFILE OF SYTO 9 RT-QPCR FOR CLASS II NDV’S ISOLATES USING THE M
PRIMERS (WISE ET AL., 2004). THERE WERE MINOR DIFFERENCES IN MELTING TEMPERATURE (TM V4
= 87.5; TM FP1 = 87.56), (TM AP1 = 88.34; TM SP3 = 88.14) ........................................................... 45 FIGURE 4.8 PERFORMANCE OF THE DUPLEX SYTO 9 RT-QPCR ASSAY USING TENFOLD DILUTIONS OF NDV
RNA AT A THRESHOLD 0.05. ............................................................................................................. 46 FIGURE 5.4 GEL ELECTROPHORESIS ANALYSIS OF PCR PRODUCTS OF CLASS I NDVS. M GENE WAS
AMPLIFIED USING NDV-DUCK- M2 WHILE FUSION GENE WAS AMPLIFIED USING F302 AND F596R
PRIMERS. ........................................................................................................................................... 55 FIGURE 5.5 GEL ELECTROPHORESIS ANALYSES OF THE FUSION GENE OF CLASS II ISOLATES AMPLIFIED
USING THE F343 FUSION PRIMERS ..................................................................................................... 55 FIGURE 5.6 ALIGNMENT VIEW OF THE FUSION GENE OF SIX ND ISOLATES INCLUDING THE CLASS I DUCK
ISOLATE WA 3245 AND IBIS AND CLASS II V4, AP1, FP1, AND SP3. ................................................ 56 FIGURE 5.7 AMINO ACIDS TRANSLATION OF FUSION GENE SEQUENCES OF SIX AUSTRALIAN NEWCASTLE
DISEASE VIRAL ISOLATES ................................................................................................................... 56 FIGURE 5.8 PHYLOGENETIC TREES OF NDVS IN CLASS I AND II. SEQUENCE WAS ALIGNED USING
CONTIQEXPRESS PROJECT, VECTOR NTI ADVANCED 10 (INVITROGEN). THE NEIGHBOUR-JOINING
ALGORITHM (MEGA-5) WAS USED TO GENERATE THE INITIAL TREE. THE ANALYSIS INVOLVED 38
SEQUENCES. THERE WERE A TOTAL OF 263 POSITIONS IN THE FINAL DATASET. ................................. 57 FIGURE 6.1 QUANTITATION ANALYSES OF NDV V4 RNA IN FOUR DIFFERENT BUFFERS: STDB, LB, VBB,
AND LSDB. THE DATA WAS PRODUCED FOR CYCLING A GREEN AT GAIN 5 AND THRESHOLD 0.005
WITH REACTION EFFICIENCY THRESHOLD 3%. THE QUANTITATION ANALYSIS WAS RUN ON SOFTWARE
VERSION ROTORGENE 6.0.38. THE COLOURS INDICATE THE BUFFER: 1). RED AS STDB, 2). GREEN AS
LB, 3). BLUE AS VBB AND 4).YELLOW AS LSDB. NTC STANDS FOR NO TEMPLATE CONTROL. ...... 69 FIGURE 6.2 QUANTIZATION ANALYSIS OF AI H4N4 RNA IN STDB, LB, VBB, AND LSDB BUFFERS. THE
DATA WAS ANALYSED AT A THRESHOLD 0.005 WITH REACTION EFFICIENCY THRESHOLD 3%. THE
QUANTITATION ANALYSES WAS RUN ON SOFTWARE VERSION ROTORGENE 6.0.38 WITH CHANNEL
CYCLING A GREEN AT GAIN 5. THE COLOURS INDICATE THE BUFFER: 1). RED AS STDB, 2). GREEN AS
LB, 3). BLUE AS VBB AND 4).YELLOW AS LSDB. NTC STANDS FOR NO TEMPLATE CONTROL. ...... 69 FIGURE 6.3 QUANTIZATION ANALYSIS OF VIRAL RNA V4 PROCESSED IN STDB AND LB AT 25°C AND
37°C. THE NORMAL FLUORESCENCE OF SYTO 9 WAS PERFORMED IN CYCLING A GREEN AT A GAIN 5
AND QUANTIFIED AT THRESHOLD 0.005. THE QUANTITATION ANALYSIS WAS RUN ON SOFTWARE
VERSION ROTORGENE 6.0.38. THE COLOURS INDICATE VIRAL RNAS WERE TREATED IN: 1). STDB AT
37°C (RED), 2). STDB AT 25°C (YELLOW), 3). LB AT 37°C (BLUE), 4). LB AT 25°C (GREEN) .......... 70 FIGURE 6.4 QUANTIZATION ANALYSIS OF AIV H4N4 RNA IN STDB AND LB AT (25°C AND 37°C).THE
CT-VALUES WERE ANALYSED AT A THRESHOLD 0.005, WITH EFFICIENCY THRESHOLD 3%. CYCLING
A GREEN WITH GAIN AT 5 WERE USED IN MEASURE THE AMOUNT OF NORMAL FLUORESCENCE
EMITTED BY DNA BINDING DYES SYTO9. THE COLOURS INDICATE VIRAL RNAS WERE TREATED IN: 1). STDB AT 37°C (RED), 2). STDB AT 25°C (YELLOW), 3). LB AT 37°C (BLUE), 4). LB AT 25°C
(GREEN) ............................................................................................................................................. 71 FIGURE 6.5 THE MEAN OF CT-VALUES OF NDV V4 RNA PRESERVED IN STDB AND LB ANALYSED WITH
ANOVA. SIGNIFICANCE WERE SET AT Ρ-VALUE OF <0.05 ................................................................. 71 FIGURE 6.6 THE MEAN CT VALUES OF NDV V4 RNA AT FOUR DIFFERENT TIMES ANALYSED WITH ........... 72

xv
ANOVA WITH SIGNIFICANCE AT Ρ-VALUE OF <0.05 ................................................................................... 72 FIGURE 6.7 THE MEAN OF CT-VALUE OF NDV V4 RNA IN THE TWO BUFFERS WITH A COMPARISON
BETWEEN STORAGE AT 25°C AND 37 °C. ........................................................................................... 72 FIGURE 6.8 THE MEAN OF CT-VALUE OF H4N4 VIRAL RNA PROCESSED IN TWO DIFFERENT BUFFERS, STDB
AND LB. THE DATA WERE ANALYSED USING THE KRUSKAL-WALLIS AND MANN WHITNEY TEST WITH
SIGNIFICANCE LEVEL AT Ρ-VALUE OF <0.05 ....................................................................................... 73 FIGURE 6.9 THE MEAN OF CT-VALUES OF AI H4N4 RNA PRESERVED IN STDB AND LB OVER THE FOUR
WEEKS OF THE EXPERIMENT ANALYSED WITH KRUSKAL-WALLIS AND MANN WHITNEY TESTS WITH
SIGNIFICANCE LEVEL AT Ρ-VALUE OF <0.05 ....................................................................................... 73 FIGURE 6.10 CT-VALUE MEANS OF PROCESSED VIRAL RNA V4 IN STDB AND LB AT THE TWO
TEMPERATURES. THE DATA WAS ANALYSED USING KRUSKAL-WALLIS AND MANN WHITNEY TESTS
WITH A SIGNIFICANCE LEVEL AT Ρ-VALUE OF <0.05 .......................................................................... 74 FIGURE 7.1 QUANTITATIVE ANALYSIS OF V4 NDV AND H4 AIV RNA STORED IN TWO DIFFERENT BUFFERS
.......................................................................................................................................................... 85 FIGURE 7.2 MELTING CURVE PROFILES OF UNDILUTED AND DILUTED NDV V4 AND AIV H4 RNA IN TCB
AND MRSB. THE STORED RNA IN TCB HAD A SIMILAR MELTING POINT TO THE STORED RNA IN
MRSB ................................................................................................................................................ 86 FIGURE 7.3 THE MEAN OF CT-VALUES FOR THE EXTRACTED V4 VIRAL RNA SAMPLES DILUTED IN TWO
DIFFERENT BUFFERS. THE DATA WERE ANALYSED USING UNIVARIATE ANOVA WITH SIGNIFICANCE
AT A P-VALUE < 0.05. ........................................................................................................................ 87 FIGURE 7.4 THE MEAN OF CT-VALUES FOR THE EXTRACTED AI VIRAL RNA SAMPLES DILUTED IN TWO
DIFFERENT BUFFERS ANALYSED BY UNIVARIATE ANOVA. SIGNIFICANCES WERE SET AT A P-VALUE <
0.05. .................................................................................................................................................. 87 FIGURE 7.5 QUANTITATION ANALYSIS OF DILUTED RNA OF NDV V4 STORED IN TWO DIFFERENT BUFFERS,
TCB AND MRSB WITH FREEZE THAWING EXPERIMENT. THE CT-VALUE WERE QUANTITATED AT THE
THRESHOLD 0.05 ............................................................................................................................... 88 FIGURE 7.6 THE MEAN OF CT-VALUE OF THAWING EXPERIMENT OF EXTRACTED V4 VIRAL RNA IN
DIFFERENT BUFFERS. ......................................................................................................................... 89 FIGURE 7.7 THE MEAN OF CT-VALUE OF THAWING EXPERIMENT OF EXTRACTED H4N4 VIRAL RNA IN
DIFFERENT BUFFERS WITH DIFFERENT DILUTION. THE DATA WERE ANALYSED USING UNIVARIATE
ANOVA WITH SIGNIFICANCE AT P-VALUE < 0.05. OVERALL 5× AND 10× FREEZE THAWING AT -20°C
WAS NOT SIGNIFICANTLY AFFECTING TO THE H4N4 VIRAL RNA. LOWER CT -VALUE MEANS BETTER
FLUORESCENCE SIGNAL GENERATED. ................................................................................................ 90 FIGURE 7.8 QUANTITATION ANALYSIS OF PCR PRODUCT OF VIRAL RNA V4 IN 3 AND 9 MONTHS STORAGE
AT -20°C IN DIFFERENT STORAGE BUFFERS, THE TCB AND MODIFIED MRSB. AT THRESHOLD 0.05, THE LEVEL OF FLUORESCENCE OF THE RNA STORAGE IN MRSB IS SLIGHTLY BETTER IN 10× DILUTION
COMPARED BY IN TCB. ALSO, IN 1000 × DILUTION, STORAGE IN MRSB IS MUCH BETTER THAN IN
TCB. ................................................................................................................................................. 91 FIGURE 7.9 THE MEAN OF CT-VALUE OF EXTRACTED V4 RNA STORED IN DIFFERENT BUFFERS WITH
DIFFERENT DILUTION FOR 3 MONTHS AND 9 MONTHS STORAGE. ........................................................ 92 FIGURE 7.10 THE MEAN OF CT-VALUE OF STORAGE EXTRACTED H4N4 VIRAL RNA IN DIFFERENT BUFFERS
WITH DIFFERENT DILUTION FOR 3 MONTHS AND 9 MONTHS STORAGE. THE DATA WERE ANALYSED
USING UNIVARIATE ANOVA WITH SIGNIFICANCE AT P-VALUE < 0.05.PRESERVATION IN MRSB IS
SLIGHTLY BETTER IN THE DNA AMPLIFICATION THAN IN TCB EVEN THOUGH IN PRESERVATION
EITHER IN MRSB OR TCB WERE NOT AFFECTED SIGNIFICANTLY TO THE DIFFERENT OF CT-VALUE .. 93 FIGURE 8.1 QUANTITATION ANALYSIS OF AI VIRAL RNA PERFORMED IN SYTO 9 RT-QPCR ASSAY USING
AI M PRIMERS. ................................................................................................................................ 102 FIGURE 8.2. MELTING CURVE PROFILE OF SYTO 9 RT-QPCR OF AI VIRAL RNA’S USING AI M PRIMERS103 FIGURE 8.3 QUANTITATIVE ANALYSIS BASED ON AI M TAQMAN IV DUAL LABELLED PROBE RT-QPCR
ASSAY. CT-VALUES WERE PERFORMED AT 0.005 ............................................................................. 103 FIGURE 8.4 AMPLIFICATION PROFILES OF RT-QPCR FOUR DIFFERENT BATCHES OF AI VIRAL ISOLATES
FROM INDONESIA USING THE IVA-SUBTYPE H5 TAQMAN DUAL LABELLED PROBE ASSAY ............. 104 FIGURE 8.5 QUANTITATION ANALYSES OF RT-QPCR FOUR DIFFERENT AI VIRAL ISOLATES FROM
INDONESIA USING IVA-SUBTYPE H5 TAQMAN DUAL LABELLED PROBE ASSAY (HEINE ET AL., 2005) ........................................................................................................................................................ 104
FIGURE 8.6 RT-QPCR ASSAY BASED ON SYTO 9 TO THE FOUR GROUPS OF AI ISOLATES FROM INDONESIA. RT-QPCR WERE GENERATED USING H5 PRIMERS (HEINE ET AL., 2005) .......................................... 105
FIGURE 8.7 MELTING CURVE PROFILE OF DIFFERENT LOCATIONS PROCESSED ISOLATES USING MELTING
POINT ANALYSIS AND HRM ANALYSIS. THE ANALYSIS WAS PERFORMED ON ROTOR-GENETM
3000
AND 6000 (CORBETT RESEARCH, AUSTRALIA) ................................................................................ 106 FIGURE 8.8 NORMALISED MELT CURVE OF DIFFERENT ISOLATES PERFORMED BY HRM ANALYSIS ASSAY.
THE ASSAY WAS GENERATED ON ROTOR-GENE 6000 (CORBETT RESEARCH, AUSTRALIA) USING IVA-D148H5 PRIMER .............................................................................................................................. 106

xvi
FIGURE 8.9 GENOTYPE COMPARISONS OF FOUR INDONESIAN AI VIRAL ISOLATES USING DIFFERENCE GRAPH
ANALYSIS ON HRM ASSAY WITH ISOLATES FROM TIMIKA BEING THE REFERENCE. ........................ 107 FIGURE 8.10 FLUORESCENCE DATA OF SYTO 9 RT-QPCR ASSAY OF AI VIRAL ISOLATES USING H5F3+ AND
H5R2+ PRIMERS (PAYUNGPORN ET AL., 2006B) .............................................................................. 107 FIGURE 8.11 MELTING CURVE ANALYSIS AND HRM OF THE RECENT INDONESIAN AI ISOLATES PERFORMED
BY SYTO 9 RT-QPCR ASSAY USING H5F3+ AND H5R2+ PRIMERS (PAYUNGPORN ET AL., 2006B) . 108 FIGURE 8.12 MELT PLOTS OF NORMALISED GRAPHS OF INDONESIAN AI ISOLATES PERFORMED BY HRM
ASSAY USING H5F3+ AND H5R2+ PRIMERS .................................................................................... 109 FIGURE 8.13 GENOTYPE COMPARISONS OF FOUR INDONESIAN AI VIRAL ISOLATES PERFORMED BY
DIFFERENCE GRAPH ANALYSIS ON HRM ASSAY USING H5F3+ AND H5R2+ PRIMERS WITH A TIMIKA
ISOLATE AS THE REFERENCE SEQUENCE. .......................................................................................... 109 FIGURE 8.14. QUANTIFICATION CURVES OF NDV ANTIGEN TRANSPORTED FROM INDONESIA IN
COMMERCIAL LYSIS BUFFER. THE ASSAY WAS PERFORMED USING RT-QPCR ASSAY BASED ON SYTO
9 AND THE DUPLEX PRIMERS ............................................................................................................ 110 FIGURE 8.15 MELT CURVES OF ND ANTIGEN TRANSPORTED FROM INDONESIA IN COMMERCIAL LYSIS
BUFFER. THE ASSAY WAS PERFORMED USING RT-QPCR ASSAY BASED ON SYTO-9 AND THE DUPLEX
PRIMERS .......................................................................................................................................... 110 FIGURE 8.16 AMPLIFICATION OF A 343 BP PRODUCT OF THE FUSION GENE OF INDONESIAN AND
AUSTRALIAN ISOLATES OF NDV ..................................................................................................... 111 FIGURE 8.18. PHYLOGENETIC TREES OF THE F GENE OF INACTIVATED ND SAMPLES TRANSPORTED FROM
INDONESIA. THE ANALYSIS WAS CONDUCTED IN MEGA5 INVOLVED 39 NUCLEOTIDE SEQUENCES. THERE WERE A TOTAL OF 307 POSITIONS IN THE FINAL DATASET. ................................................... 112
FIGURE 8.19 AMPLIFICATION OF 590BP OF THE H5 GENES OF AI VIRAL RNA TRANSPORTED FROM
INDONESIA. ..................................................................................................................................... 113 FIGURE 8.20 PHYLOGENETIC TREES OF 590 BP OF H5 OF AI VIRAL RNA TRANSPORTED FROM INDONESIA
THE ANALYSIS INVOLVED 27 NUCLEOTIDE SEQUENCES. A TOTAL OF 516 POSITIONS IN THE FINAL
DATASET WERE ANALYSED USING MEGA5 ..................................................................................... 114 FIGURE 8.21 MISMATCHES IN INDONESIAN SEQUENCES AND IVA-DA148H5 FORWARD PRIMER AND PROBE.
AT LEAST TWO MISMATCHES WERE IDENTIFIED UNDER THE IVA-DA148H5 FORWARD PRIMER AND
WITH THE SUKABUMI ISOLATES THERE WERE MISMATCHES UNDER THE PROBE. .............................. 115 FIGURE 8.22 AMPLIFICATION OF A 1307 OF H5 GENE OF AI VIRAL RNA’S PROCESSED AND TRANSPORTED
FROM INDONESIA ............................................................................................................................. 115 FIGURE 8.23. PHYLOGENETIC ANALYSIS OF 1307 BP OF H5 OF SUKABUMI 3 VIRAL RNA. THE ANALYSIS
INVOLVED 9 NUCLEOTIDE SEQUENCES. THERE WERE A TOTAL OF 1456 POSITIONS IN THE FINAL
DATASET CONDUCTED IN MEGA5 ................................................................................................... 116 FIGURE 8.24 AMINO ACID TRANSLATIONS OF H5 SEQUENCES OF SUKABUMI 3 VIRAL RNA ..................... 116

1
CHAPTER 1
GENERAL INTRODUCTION
1.1 Background
1. AI and ND are similar avian diseases both caused by RNA viruses. While both
diseases vary widely in pathogenicity they can produce high mortalities. A
diagnostic protocol to accurately carry out a differential diagnosis is therefore
important.
Misdiagnosis of AI as virulent ND delayed the diagnosis of an outbreak of AI in
Vietnam and Indonesia in 2005. However, accurate and reliable diagnosis is not
available in most developing countries. Many developing countries have inadequate
infrastructure and expertise to diagnose and differentiate these two diseases accurately.
Thus, efficient transportation of viruses in suspected clinical samples to overseas
reference laboratories is required to obtain a rapid and accurate diagnosis and to help
evaluate the internal laboratory quality control by comparing the results of diagnosis
assays. However, most reference laboratories are located overseas and the distance
causes delays in transportation, thus compromising viral viability.
Transporting viruses to references laboratories overseas also involves quarantine
restrictions designed to keep out exotic diseases. For example, the AQIS seeks to
prevent the introduction and establishment of major diseases such as foot and mouth
disease, AI and ND and so protect Australia’s environment, agriculture and indigenous
biodiversity. Maintaining environmental health is also essential to protect the extensive
agricultural and animal trade industry. However, quarantine delays of imported viral
samples can also mean that the viruses degrade.
Maintenance of viral viability is essential to efficient transportation. AIV and NDVs are
thermo-sensitive. Thus, due to their thermo-sensitivity, they need to be carefully
collected, stored and distributed with a suitable cold chain. Cold chains are difficult to
establish and maintain.

2
This study evaluated a series of buffers which are components of the extraction
protocols from Corbett Robotics (Prototype kits) or Sigma chemicals catalogue Number
XTR1 or XTR2.
ND and AI disease viruses can be diagnosed using conventional methods for isolating
the virus. Alternatively, the genome can be detected using RT-PCR.
PCR and RT-PCR have also been used to replace some of the gold standard cell culture
and serological assays (Mackay et al., 2002; Mackay, 2004). However, nucleic acid
detection using PCR technologies requires an appropriate method for nucleic acid
purification. In this study the transport buffers were integrated with the subsequent
extraction protocols.
Sequencing of PCR products can provide valuable phylogenetic information as well as
an indication of the presence or absence of virulence markers such as protein cleavage
sites in the genes coding for the surface viral proteins of both ND and AI viruses.
JCU has a comprehensive set of molecular diagnostic tools including an automated
nucleic acid extraction robot, a liquid handling robot and real-time PCR. Collaborative
projects with other laboratories in Australia have guaranteed that JCU has RNA from
reference viruses that can be used to standardise diagnostic assays for both AI and ND.

3
1.2 Aims of the research project
The specific aims of this research project are as follows:
1. To standardise a set of diagnostics tests based on real-time RT-PCR for AIV and
NDV.
2. To develop methods for collecting and transporting RNA viruses without the
need of a cold chain.
3. To develop methods for RNA virus storage following viral RNA purification
procedures.
4. To apply these assays to reference samples and samples collected from infected
birds in Indonesia.
5. To collect samples from outbreaks of AI or ND in Indonesia and extract their
viral RNA in a suitable buffer that will allow transport without the need for a
cold chain.
a. To demonstrate that the RNA can be used in routine diagnostic assays
b. To carry out genotyping studies on AIV and NDV samples to aid
epidemiological studies.
c. To determine the potential pathogenicity of the isolates by sequencing
protein cleavage sites.

4
CHAPTER 2
LITERATURE REVIEW
2.1 Avian Influenza Disease
AI Disease is a global problem for both wild birds and the poultry industry. This disease
is caused by AIV. These viruses are important pathogens of poultry in Southeast Asia,
African, Europe (de Jong et al., 2006); in particular, a number of AIV outbreaks have
been reported in Indonesia, China, Thailand and Vietnam (WHO, 2007). The viruses
have created an epidemic in Asia since 1996 when there was an outbreak in geese in
Guangdong, China. This outbreak resulted not only in high mortality of geese but also
in the spread of the virus throughout Guangdong province (Chen et al., 2004)
AI is not only a threat to poultry, but also to humans and there have been increasing
fears of a human pandemic since the first human was infected. The first human cases of
AI H5N1 occurred in 1997 when the viruses caused severe outbreaks in poultry in the
Hong Kong Special Administrative Regions (Hong Kong SARS). Eighteen people were
infected clinically and six deaths were reported in this outbreak. In 2002 and 2003, AI
viruses were isolated in Hong Kong in a range of wild birds and it spread to the
Republic of Korea in early December, 2003. These viruses spread and caused outbreaks
not only in South Korea but also in others countries surrounding South Korea. In this
outbreak, 35 human cases were reported and 23 deaths (Morris and Jackson, 2005).
Overall, 522 people have been infected and 314 deaths have been reported (WHO,
2007).
In Indonesia, AI disease was first reported in 2003 in several districts in Central Java.
Since then, the number of cases has been increasing and the disease is now present in
23 provinces and 151 districts and cities. The first human cases were noticed in 2005 in
Tangerang. Total infections by 2007 were 74 and 57 deaths were reported (de Jong and
Hien, 2006; WHO, 2006). However, in the early stages of the outbreak in Indonesia, the
clinical signs were confusing and this disease was diagnosed as very virulent ND before
it was confirmed as AI disease. Therefore, precise diagnostic assays for AI are required
to prevent continuing severe outbreaks.

5
2.1.1 Virus Overview
AI viruses are classified in the family Orthomyxoviridae. In this family, Influenza
viruses are classified into A, B, and C and AIV is classified as Influenza A. Influenza A
virus is differentiated from Influenza B and C because of the differences in the major
internal protein antigens: the nucleoprotein (NP) and M protein (Webster et al., 1992)
Influenza viruses are small (80 to 120 nm in diameter), negative sense, single stranded
RNA, pleomorphic, enveloped and segmented. These viruses have eight segments of
RNA which encode 10 proteins: Polymerase A, B1, B2 (PA, PB1, and PB2), HA, NP,
Neuraminidase (NA), M protein (M1 and M2) and Non structural protein (NS1 and
NS2). These proteins can be categorised as surface antigens or internal proteins
(Webster et al., 1992).
The surface antigens of influenza viruses consist of HA and NA glycoproteins. HA is
the major surface protein of the Influenza virion. This protein is embedded in the host
derived lipid bilayer and integrated with the membrane protein. HA is responsible for
binding the virion to the host cell receptor. Also, HA facilitates the fusion of the virion
envelope between the virus and the host cell. The haemagglutinin protein is translated
from RNA segment 4.
Protein translation of RNA segment 4 is followed by posttranslational processing,
namely proteolytic cleavage. In this process, the new synthesized HA is cleaved to
facilitate transportation to the cell membrane. This cleavage can be accomplished due to
the presence of host-produced trypsin-like protease. Then, the cleavage of HA results
into two subunits: HA1 and HA2 with HA1 forming the globular head on a stalk of
natured HA protein, while HA2 and also HA1 form the stalk (Webster et al., 1992).
HA cleavage is required for infectivity. HA becomes infectious when the free amino
terminus of HA2 mediates virus-cell fusion. This protein is responsible for the
neutralization by host antibodies (Thomas and Swayne, 2007). However, due to the
receptor binding cavity and the antigenic sites of the molecule, HA is the major target of
the host immune response.
Moreover, the HA antigen is subject to a very high rate of mutation due to its error
prone viral RNA polymerase (Webster et al., 1992). Thus, due to the high rate of

6
mutation, HA protein can change due to antigenic drift and so becomes unrecognisable
by the host immune cells (Thomas and Swayne, 2007).
Another surface antigen of the influenza virus virion is NA. This protein is an integral
membrane glycoprotein which is encoded and translated by RNA segment 6. This
protein cleaves sialic acid from glycoproteins or glycolipids. NA protein separates the
virions from the host cell receptors and facilitates the spread of the virus. Like HA, NA
protein is highly mutated and a target of the host immune response (Webster et al.,
1992)
The internal antigens of Influenza viruses are formed by NP, M, PA, PB1, and PB2.
These antigens are the basis of Influenza A, B and C differentiation. NP is translated
from RNA segment 5. This protein is transported into the host cell nucleus to bind and
encapsidate viral RNA. NP switches the viral RNA polymerase activity from mRNA
synthesis to cRNA and vRNA synthesized. NP is abundantly synthesized and
phosphorylated in host cells but depends on viral host restriction. This protein is also a
host cytotoxic T-cell immune response target (Webster et al., 1992).
Important internal proteins are M proteins. The M proteins, M1 and M2 form a cover
surrounding the virion nucleocapsid which is encoded and translated from RNA
segment 7 (Webster et al., 1992). The M2 is found in a small quantity in Influenza A
viruses. This protein serves as a signal for transport to the cell surface and occupies an
ion channel to regulate the internal pH of the virus. Its function as an ion channel is vital
for uncoating the virus in the early stages of replication (Webster et al., 1992; de Jong
and Hien, 2006)
Other internal proteins are RNA polymerase complexes. These polymerase complexes
consist of three polymerase proteins which are PA, PB1 and PB2. PA protein is encoded
and translated from RNA segment 3. This protein is limited in the infected cell nucleus.
PA is believed to have a role as a protein kinase or as a helix-unwinding protein.
However, the function of this protein in viral RNA synthesis is not yet known (Webster
et al., 1992).

7
The second RNA polymerase is PB1 protein and is encoded by RNA segment 2. This
protein is responsible for elongation of the primed nascent viral mRNA. PB1 also serves
as a template for cRNA and vRNA synthesis (Webster et al., 1992).
Another RNA polymerase is PB2. This protein is translated by RNA segment 1. The
PB2 provide viral RNA dependent RNA polymerase activity in the initiation process of
viral mRNA protein transcription. This protein recognises and binds the host cells
mRNA and uses it as viral mRNA transcription primers. PB2 is also believed to
synthesise the full length template cRNA and new negative sense viral RNA (vRNA).
However, the precise process by which this is done is still unknown (Webster et al.,
1992)
RNA segment 8 encodes two non-structural proteins: NS1 and NS2. These proteins play
a role in viral replication. Non-structural protein 1 occurs largely in the infected nucleus
cell while NS2 is found predominantly in the cytoplasm. Non-structural protein 1 is
collinear with vRNA while NS2 originates by splicing. These proteins are involved in
viral replication (Webster et al., 1992)
Viral RNA segments of Influenza A are located inside the viral envelope. These
segments are linked with NP and three viral polymerase subunits, PA, PB1, PB2 (de
Jong and Hien, 2006). The viral RNA segments are protected and covered by a helical
structure, Nucleocapsid (NC), associated with NP (Abed et al., 2003). RNA segments,
NP and viral RNA subunits form the Ribonucleoprotein (RNP) complex which is
important in replication and transcription (de Jong and Hien, 2006)
The surface antigens of Influenza viruses are important for pathogenicity differentiation.
HA antigens, which have 16 subtypes (H1-H16), and NA antigen with 9 subtypes (N1-
N9) create a combination and cause different types of infection. Based on pathogenicity,
Highly Pathogenic AIV is traditionally caused by H5 and H7 subtypes while other
subtypes cause a milder disease which is considered as Low Pathogenic AIV (Capua
and Alexander, 2004).
Office International des Epizootica defines AI disease as Notifiable AI (NAI). The NAI
is classified according to the virulence of the virus: the Highly Pathogenicity Notifiable
AI and Low Pathogenicity Notifiable AI (OIE, 2004). The Highly Pathogenic Notifiable

8
AI (HPNAI) viruses have an intra venous pathogenicity index (IVPI) greater than 1.2 in
4-8 week old chickens or cause 75% mortality in 4-8 week old chickens. Also, subtypes
H5 and H7 virus isolates should also be considered as potential HPNAI. These isolates
cause mortality less than 75% or IVPI less than 1.2 and have amino acids present in a
cleavage motif similar to HPNAI isolates (OIE, 2009).
As far as molecular makeup is concerned, the pathogenicity of Influenza viruses is
associated with multiple basic amino acids (arginine (R) or a lysine (K)) sequence at the
H0 cleavage site. The specific motif consisting of a series of basic amino acid sequence
at the cleavage site has been studied with motif X-X-R-X-R/K-R (X = A non basic
amino acid) or R/K-X-R/K-R. Studies of H5 viruses show that Low Pathogenic H5
viruses have the amino acid motif PQRETR*GLF while the H5 highly pathogenic
viruses have varied cleavage sites such as PQRKRKTR*GLF for the 1994/5 Mexican
isolates (H5N2), PQRKKR*GLF for Chicken/Scotland/59 isolates (H5N1) and amino
acid PQRRRKKR*GLF for Poultry/Italy/97 isolates (H5N2). Furthermore, most Low
Pathogenic AI H7 viruses have motifs of either PEIPKGR*GLF or PENPKGR*GLF,
while AI H7 with high pathogenicity have amino acid motifs of either
PEIPKKKKR*GLF, PETPKRKRKR*GLF, -PEIPKKREKR*GLF, or
PETPKRRRR*GLF. However, the amino acid sequences of Influenza virus
pathogenicity are varied in different places and different subtypes. Also, influenza
viruses’ pathogenicity is influenced by protease such as enzyme access in host cells,
whether it is trypsin like enzyme, furin or protein convertase (PC6) (Steinhauer, 1999;
Zambon, 1999; Alexander, 2000b; Ito et al., 2001; OIE, 2004)
2.1.2 Pathogenesis of AI Disease
Mechanism of AI viruses’ infection can be divided into three steps which are initiation
of infection, viral attachment and entry, viral replication, protein synthesis and new
progeny released then spread in the host cell and cause clinical signs.
Initiation of infection required accessible, susceptible and permissive cells for the
viruses at the site of infection, and the absence of or ineffective local host anti viral
immunity.
The titre of virus required to initiate infection can be influenced by many factors.
Environmental factors such as osmotic shock, pH changes and sunlight can affect viral

9
viability. Also, rapid dilution can reduce viral concentration especially infection from
contaminated water. Aerosol dispersed infection required high concentration of virus,
favourable environmental conditions and close contact. However, even though the
infection may fail due to low viral concentration, it is not known yet how many virions
are required to initiate and maintain the infection (Flint et al., 2004).
Initiation of influenza viral infection and life cycle is started when the virions attach to
the analogous receptors on host airway epithelial cells. This attachment is facilitated by
HA which recognises the host cell receptor sialic acid (SA) residue or α-sialosides on
the target cell surface. Sialic acid residue is a glycosylated oligosaccharides which are
bound to glycans through α 2, 3 or α 2, 6 linkage by sialyl transferases (Meng et al.,
2010).
There are two host species specify types of sialic acid receptor on glycosylated cell
surface molecule which will be recognised by HA antigen. These host species sialic acid
specificity are SA α 2, 6 galactose ß-1, 4-N-acetylglucosamine (SA α 2,6-Gal) or SA
α 2,3 – galactose ß-1, 3-N-acetylglucosamine (SA α 2,3-Gal). AI viruses have a
preference to bind α 2, 3- linked sialic acid while human influenza viruses strain bind
via receptor α 2, 6 linked sialic acid. However, a single amino acid mutation in the HA
can change the HA receptor specificity of avian strain from α 2, 3 linked sialic acid to
SA α 2,6-Gal (Connor et al., 1994; Thompson et al., 2006; Yamada et al., 2006).
Viral attachment is followed by viral entry into the host cell by endocytosis. This
endocytosis triggers HA cleavage due to the low pH of the endocytitic vesicle. The
cleavage facilitates insertion of the hydrophobic free amino terminus of HA2 into the
vesicular membrane. Then, the contents of the virion will be released into cell
cytoplasm (Webster et al., 1992)
The next step is viral replication and protein synthesis. This step is started when the
nucleocapsid of the parent viruses migrate into the host cell nucleus. This migration will
be associated with polymerase complexes to begin the primary transcription of mRNA.
The primary transcription will be used for viral protein translations which are
predominantly NP and NS1 in the early stage of translation. Then, the new NP and NS1
migrate to the nucleus and trigger the mRNA shift to synthesis of cRNA and vRNA
using the viral genome. This new vRNA will be encapsidated in NP within nucleus and

10
become a template for secondary transcription of viral mRNAs. Afterwards, M1, HA,
and NA protein are produced in the principal translation of infection. HA and NA
proteins are then processed and transported posttranslational to the cell surface and
integrate into cell membrane (Webster et al., 1992)
Viral replication and protein synthesis is then followed by the assembly and release of
progeny virions. The build up of M1 protein is followed by migration of nucleocapsid
out from the nucleus. Then, a viral core of nucleocapsid will be encased in M1 shell
protein and form the viral surface glycoprotein. The nucleocapsid will bud outward
through the cell membrane and enclose itself within a bubble of membrane as its own
envelope. This budding is initiated by the interaction between M1 and the cytoplasmic
domain of HA, NA or M2. Moreover, NA activity will release new progeny virions
outside of host cells (Webster et al., 1992)
Finally, the last step is virus maturation. This takes place outside the cell and requires
the cleavage of HA0 into HA1 and HA2. Cleavage of HA of AI viruses requires
proteolytic activities of host cell proteases to cleave the HA precursor protein HA0 into
HA1 and HA2. The host cell protease enzymes which are capable of this cleavage are
trypsin like enzymes, elastase, thermolysin and furin. However, these enzymes are
located in different cells which can lead to the differentiation of the viral pathogenicity.
Highly pathogenic of AI viruses are cleaved by ubiquitous or intercellular proteases
such as furin and PC6 while low pathogenic avian influenza (LPAI) viruses are cleaved
by extracellular trypsin like enzymes. Therefore the cleavage site and differences in
pathogenicity will result in differences in clinical signs (Webster et al., 1992)

11
2.1.3 Clinical signs of Avian Influenza disease
Clinical signs of AI disease depend on animal species and viral pathogenicity. Clinical
signs in birds vary from asymptomatic infections to mild respiratory disease through to
severe and fatal systemic disease. Infection with HPAI in poultry results in clinical
signs of decreased egg production; respiratory signs; extreme lacrimation; oedema of
the head, eyelid, comb, wattles, and hocks; diarrhoea; neurological symptoms and
deaths (de Jong and Hien, 2006).
Highly pathogenic AI viruses which cause sudden death frequently produce few clinical
signs. However, clinical signs of highly pathogenic AIV disease may range from sudden
death with no or little signs to more characteristic signs.
In humans, AI virus infections cause disease with similar clinical signs to seasonal flu
such as fever, malaise, nasal discharge, coughing, laryngitis and body aches. H5N1
infections cause a rapid onset of lower respiratory tract disease which may result in
pneumonia which is not responsive to antimicrobial therapy. However, the spectrum of
clinical signs in humans is broad including encephalitis, chest pain, nose and gums
bleeding and gastrointestinal signs. Infected people in Vietnam and Thailand have
expressed signs of fever, respiratory symptoms, diarrhoea, lymphopaenia, and
thrombocytopenia. Moreover, it was reported that some human cases had symptoms of
fever and gastrointestinal signs without respiratory signs. Clinical signs of pneumonia
and respiratory failure have been a feature of most of the fatal cases (Maines et al.,
2005)
2.1.4 Epidemiology of avian influenza
AI disease has been known since 19th century. This disease caused a severe and highly
contagious poultry disease in Northern Italy in 1878. In that time AI disease was known
as “fowl plaque”. Since then, fowl plaque has caused outbreaks throughout the world
particularly in 1901 to 1930. In 1901, the causative agent of fowl plaque was
demonstrated to be filterable. However, there was minimal understanding of the
aetiology of AI for more than 50 years after the first event in Northern Italy.
Since the first outbreak in Italy, AIV has caused outbreak in many places including
Asian (1957), Hong Kong (1968), Russia (1977) with different strains of AIV those are

12
H2N2, H3N2, H1N1 (Harimoto and Kawaoka, 2005). A further 12 countries suffered
outbreaks of H5 and H7 from 1997 to 2004. These outbreaks also caused millions of
birds to die. In Pakistan there were at about 3.2 million birds dying caused by infection
with influenza H7N3. These cases predominantly occurred in broilers, breeders and
layers.
AI outbreaks in many countries are caused by viruses of different pathogenicities.
Outbreaks in Europe and United States have been caused by low pathogenic AI (LPAI)
viruses. The LPAI viruses were also isolated in European countries such as Italy (1997
to 1998; 2002-2003), Northern Ireland (1998), Belgium (1999). In these countries the
LPAI H7, H5N2, H5N9 and H7N1 subtypes were identified in infections of backyard
chickens, turkey breeders and poultry breeders. The LPAI were also infected chickens
and turkeys in north America (1997 to 2004), Virginia (2002), Connecticut (2003),
Delaware and Maryland (2004), Canada (2001). However, in some countries in Europe
the LPAI has mutated to become highly pathogenic AI (HPAI). The H7N1 subtype was
confirmed as HPAI cases in Netherlands, Belgium and Germany in 2003 while in Italy,
the cases were confirmed from 1999 to 2001 (Capua and Alexander, 2004).
In Asia, there is a panzoonotic caused by H5N1 subtype. This subtype initially caused
outbreaks in geese in Guangdong. Infection of H5N1 in geese also occurred in the
People’s Republic of China in 1996. The infection then spread to Hong Kong in 1997
and H5N1 circulated in aquatic poultry in China from 1997 to 2002. In China, the
subtype H5N1 was also isolated from ducks. While H5N1 caused clinical signs with
high mortalities in poultry, the same viruses were isolated from healthy ducks in China
and geese in Vietnam (Morris and Jackson, 2005).
The H5N1 strain has caused zoonotic transmissions to humans associated with poultry
outbreaks in Asian countries such as Vietnam, Thailand, Indonesia and other East Asian
Countries. These transmissions have been happening since early 2004. In 2004, human
infection predominantly occurred in Vietnam and Thailand. However, human infections
have increased in Indonesia, China and Turkey since mid 2005. Overall the numbers of
human infections to 2008 are 382 cases with 241 are lethal cases (WHO, 2008)
Influenza A viruses has a wide range of hosts such as wild birds and domestic animals.
Wild birds are natural reservoirs of AIV. Ducks, shorebirds and geese are the common

13
wild bird species acting as natural reservoirs of AIV. AI viruses have been also
discovered in other animals such as pigs, horses, mink and marine mammals (Fouchier
et al., 2000).
As a natural reservoir of AI viruses, wild birds have a role in transmission of these
viruses. Mainly, the transmission of AI is through faeces. Then, the viruses spill over to
other birds and aquatic mammals. Migratory wild birds can transmit infection through
the faeces to domestic poultry. Also, the infection with these viruses in aquatic birds can
result in viral reassortment and pathogenic alteration posing a threat to poultry
(Zambon, 1999).
In humans, transmission of influenza viruses occurs by inhalation of or dust. The
transmission can be through direct and indirect contact onto the upper respiratory tract
or conjunctival mucosa or possibly direct immolation of small particles directly into the
lungs. Some cases have been shown to have had contact with birds up to a week before
the onset of illness. However, human to human transmissions have not yet reported
(Zambon, 2001).
2.2 Newcastle Disease
Another important viral disease in poultry industry is ND. This disease not only has a
big impact to poultry but also to other birds all over the world. This disease causes
mortality up to 100%. Similarly with AI disease, this disease is responsible for a loss of
production and deaths and there may be a need for vaccination or eradication and
quarantine programs. Newcastle disease is not a zoonosis as is AI disease. However, the
virus can spread rapidly and economic impacts can include trading restrictions and
embargoes on the infected country (Spradbrow, 1987; Alexander, 1995; Alexander,
2001).
Since ND was firstly recognised in 1926 in Jakarta, Indonesia and
Newcastle-upon-Tyne, England, this disease continues to spread in many countries.
Several panzootics have been reported with the first true panzootic being recognised at
the end of 1960 in USA. This panzootic occurred when the world poultry industry was
developing and lead to the commercialisation of poultry food production.(Alexander
et al., 2004). In Australia, this virus was firstly acknowledged in 1930. This outbreak
was controlled and Australia appeared to be free from ND viral infection until the mid-

14
60s when an avirulent strain was isolated. Subsequently similar strains were recognised
in Australia and in neighbouring countries such as New Zealand and Papua New Guinea
(Spradbrow, 1987).
ND causes a serious problem to the many countries in Asia with the disease being
endemic in Korea, India, Sri Lanka, Philippine, Malaysia and Indonesia. This is
complicated by factors such as wild birds as carriers, legal and illegal movement of
infected birds, and the strong reliance on village poultry (Spradbrow, 2001).
2.2.1 Virus Overview
ND is caused by avian Paramyxovirus type 1. This virus is assigned to the genus
Avulavirus in the subfamily Paramyxovirinae, family Paramyxoviridae, and order
Mononegalovirales (Mayo, 2002).
ND virus is a single stranded (ss), enveloped, non segmented, negative sense RNA
virus. This virus has a genome size of 15,186,15,192 or 15,198 bases (Czegledi et al.,
2006). The RNA genome of NDVs consists of six genes encoding three envelope and
three core proteins. The envelope proteins are HA-neuraminidase (HN), Fusion protein
(F), and M Protein. The core proteins of ND are RNA polymerase or large protein (L),
Phosphoprotein (P) and NC protein (NP) (Mohan et al., 2005). The genome position of
ND viral proteins from 5’ to 3’ are L, HN, F, M, P, and NP (Peeters et al., 1999; Gould
et al., 2001; Wakamatsu et al., 2006). In addition there are two proteins V and W
identified as non structural proteins (NSP) (Peeters et al., 1999; Wakamatsu et al.,
2006), 1999 #1747} generated by RNA editing of alternative mRNA of the P gene
(Huang et al., 2003).
The viral proteins of NDV have different roles throughout the replication cycle of the
virus. The F and HN proteins are two important glycoproteins for viral infectivity and
virulence. Fusion protein of NDV is related to the pathogenicity. The pathogenicity of
this virus is determined by the ability of host cellular protease to cleave the F0 protein
into disulfide-linked polypeptides F1 and F2. The HN Protein has both receptor binding
and neuraminidase functions that aid the release of the virus from the cell. Following
receptor binding the F protein allows the virus to penetrate the host cells (Peeters et al.,
1999; Kobasa et al., 2004).

15
Other proteins, NP, Phosphoprotein and Large protein are involved in replication. These
proteins use viral RNA as a template for the production of viral M-RNA, Double strand
RNA and progeny viral RNA (Romer-Oberdorfer et al., 1999)
The two additional proteins, V and W proteins play a role in determination of NDV
virulence and pathogenesis. These proteins are important to evade the action of
interferon (IFN). Moreover, the virulence of NDV is also influenced by the ability of
this virus to encode and alter the V protein being an IFN antagonist (Huang et al.,
2003).
2.2.2 Pathogenesis of Newcastle disease
The mechanism of ND infection in birds begins when the virus is exposed to the host
cells. It attaches and penetrates into host cells where it replicates. Subsequently progeny
viruses are distributed to a variety of organs. Clinical signs may indicate the damage
caused by the virus or the systemic effects of cytokines on the host
Viral attachment is mediated by the HN attaching to receptors. Fusion then is mediated
by the cleaved dimer of F1 and F2 polypeptides.
The cleavage of F0 is mediated by host cells protease and is vital for the production of
infectious particles (Aldous and Alexander, 2001). The host cell proteases required to
facilitate the F0 cleavage vary due to the amino acid sequence of the Fusion cleavage
site. The high virulent ND viruses are cleaved by ubiquitous intracellular furin-like
protease while avirulent and viruses of low virulence are cleaved by trypsin-like
enzymes which may be outside the cells (Collins et al., 1993; Aldous and Alexander,
2001).
The F, HN, and P genes have also a potential function in ND virulence. The alteration
of HN protein glycosylation sites can either increase or decrease the pathogenicity of
ND. Furthermore, V protein as a product of P gene which is rich in cystine in its
carboxyl terminal region and zincs binding domain occupy may have the action of an
interferon blocker. This antiviral cytokine acts as the first line of host defence and
inhibits viral replication and dissemination (Collins et al., 1993).

16
The replication of NDV occurs in a variety of cells. Normally, replication occurs in
respiratory and intestinal tracts and then spreads into the spleen and bone marrow and
others organs such as lungs, intestinal lymphoid tissues and CNS (Quinn et al., 2002).
The locations depend largely on the cleavage of the F0 protein. Those viruses with a
multi-basic cleavage site that is capable of being cleaved by furins are found in a wide
range of locations including respiratory tract and brain while those viruses requiring
trypsin cleavage are found predominantly in the spleen, proventriculus and the region of
the caecal tonsils.
Pathogenesis studies of viral distribution and lesion in tissue show that velogenic or
very virulent pathotypes produce severe clinical signs. These virulent pathotypes infect
multiple tissues resulting in gross and histological lesions. On the contrary, Mesogenic
and lentogenic viral pathotypes produce less prominent clinical signs. However, some
gross and histological lesions are found in infections produced by mesogenic viruses.
Also, lentogenic viruses may have minimal replication in the myocardium (Brown
et al., 1999; Wakamatsu et al., 2006).
2.2.3 Clinical signs of Newcastle disease
Chickens infected with NDV show a range of clinical signs dependent on the pathotype
of virus infecting the birds. There are three major pathotypes of ND those are
Lentogenic, Mesogenic and Velogenic (Callan et al., 1995; Aldous and Alexander,
2001; Gould et al., 2001; Wakamatsu et al., 2006). Lentogenic pathotypes are the low
virulence viruses which produce no symptoms or symptoms of mild respiratory or
enteric infection. The least pathogenic of the lentogenic viruses are considered to be
avirulent producing virtually no clinical signs (Alexander et al., 2004).
Mesogenic pathotypes have a moderate virulence. This viral pathotype is associated
with low mortality, primarily acute respiratory disease and some neurologic signs in
birds. The velogenic pathotypes have a high virulence and can also be divided into
neurotropic velogenic NDV and viscerotropic velogenic NDV. Neurotropic velogenic
NDV causes respiratory and neurologic signs with high mortality. Viscerotropic
velogenic NDV generates acute lethal infection with hemorrhagic lesion signs which are
mainly apparent in the gastrointestinal tract (Seal et al., 1998; Piacenti et al., 2006)

17
Many factors influence the variance of clinical signs of NDV infection including viral
strains, host species, the age of the host, immune status, secondary infection, and
environmental stress (Alexander et al., 2004). Sudden death is frequently observed in
birds infected with velogenic pathotypes.
Viruses that produce severe disease in chickens may be less virulent in other species of
birds (Roy et al., 1998).
Generally, clinical signs of ND are depression, diarrhoea, prostration, and oedema of
head and wattles. Also, infected poultry show clinical signs such as nervous and
respiratory signs. Torticollis and paralysis are typical of nervous disease. In addition
there may be declining egg production, termination of egg laying and death. However,
there are frequently no pathognomonic clinical signs and frequently the there are
overlapping syndromes
2.2.4 Epidemiology of Newcastle disease
ND cases firstly were reported in Newcastle-on-Tyne, England. It was reported by
Doyle when the first outbreak in the spring in 1926 occurred on the farm near to
Newcastle-upon-Tyne. In that time, ND was known as Fowl pest. Also, the cases of
NDs were reported in Java, Indonesia in March 1926. It was considered that
transportation from South East Asia to the port of Newcastle responsible for the initial
outbreaks and the introduction of NDVs into England (Alexander et al., 2004).
However, a similar outbreak was reported in Central Europe earlier before this disease
was noted. Also, there were also highly virulent viral infections appearing in other
locations in Europe at around the same time. Initially the disease was thought to be fowl
plaque or HPAI.
Highly pathogenic outbreaks of ND in Poultry had been reported in Asia and Europe in
the middle of the 20th century. Chickens and most avian species were shown to be
susceptible to this virus. However, even though other avian species have been infected
by this virus, infections with this disease rarely produce the severe clinical signs
reported in the poultry. For instance, clinical signs are infrequently reported in turkeys
and pigeons although generalised disease may develop (Spradbrow, 1999a; Alexander
et al., 2004)

18
ND has also caused problems and economic losses in village chickens in many areas.
Many countries such as Malaysia, Sri Lankan, Uganda, Nigeria, Bangladesh, Central
Africa, and Myanmar are endemic for NDV particularly in Village chickens
(Spradbrow, 1999a). In China, this disease was first described in 1946 as an endemic
disease in village chickens and required an intensive vaccination program (Liu et al.,
2003). In Vietnam, ND was reported in scavenging and backyard chickens particularly
in rural areas such as Dong Thap, SocTrang, Giang province with outbreaks reoccurring
on an annual basis (Phan et al., 2003; Quoc, 2003; Vui et al., 2003). ND is probably
endemic in all provinces of Indonesia (Darminto, 1995).
Various factors influence the persistence of NDV in village poultry. The cycle of
infection between poultry and other domestic birds such as ducks, turkeys, doves, geese
and guinea fowl maintains the virus. The role of carrier chickens is not clear. These
factors provide a reservoir for NDV (Spradbrow, 2001). Wild birds can also act as a
reservoir for NDV (Martin, 1999)
Another factor influencing viral survival is physical environment. NDVs can survive for
three months at temperatures of 20°C to 30°C and for weeks to months at tropical
temperatures. This virus has increased survival at cooler temperatures (Alexander et al.,
2004).
Transmission of NDV can be by aerosols, feed, ingestion of contaminated water and
contact with contaminated equipment. The virus may also persist in the carcases of
affected birds (Martin, 1999; Quinn et al., 2002).
In many countries, ND viruses have been isolated from wild birds. A variety of species
such as migratory waterfowl to the aquatic birds can be infected. NDVs infected double-
crested cormorants (Phalacrocorax auritus) in Scotland in the late 1940s. This infection
also occurred in Quebec in 1975 and cormorants in Western Canada spread this disease
to domestic turkeys (Alexander, 2001)
In Asia, wild birds also have a role in the spread of NDVs. Species such as Passerine
birds, waterfowl, natatorial birds particularly herons, storks, cranes and shore birds have
all been implicated (Hua et al., 2005).

19
In Australia, the first panzootics of exotic virulent NDV were identified in chickens in
1930 and 1932 in Melbourne. The disease was eliminated by a combination of slaughter
and quarantine control (Alexander et al., 1986; Gould, 2004). However, viruses of low
virulence were assumed to be still circulating among domestic poultry. The low
virulence NDV in Australian chickens was considered to be similar to duck and feral
waterfowl isolates from other countries. The second outbreak in Australia occurred in
1998. Initially, virulent NDV was recognised at Dean Park, New South Wales.
Quarantine, slaughter and vaccination policies were applied to control the spread of this
disease (Kattenbelt et al., 2006b).
NDVs have been reported in ducks. An outbreak occurred in a flock of 300 ducks in
Indonesia. The virulent viruses have been also isolated from ducks in Vietnam.
However, in Pekin ducks isolation of NDV was contaminated with AI viruses. In
Tanzania, the cases of ND were associated with chickens in the same location
(Spradbrow, 1999b)
2.3 Molecular Epidemiology and Phylogenetic of NDVs
ND or avian paramyxoviruses serotype 1 (APMV-1) are classified in the genus
Avulaviruses, family Paramyxoviridae. Avian paramyxoviruses have 9 serogroups
(APMV1-APMV9), while APMV-1 is divided into two classes with genotypes within
the class.
However, molecularly, the pathogenicity of NDV isolates was correlated with the
sequence of the cleavage site of Fusion (F) protein. This molecular correlation is
generated from the ease by which cellular proteases cleave the fusion protein. As
described previously in the Chapter 2.2.2, in apathogenic viruses the F0 can be cleaved
by trypsin-like proteolytic enzymes while the F0 precursor protein of pathogenic viruses
is cleaved by furin like enzymes (Collins et al., 1993; Ballagi-Pordany et al., 1996; de
Leeuw et al., 2003; Lee et al., 2004; Panda et al., 2004).
Phylogenetically, NDVs, described by Czegledi (Czegledi et al., 2006) have two classes
(Class I and Class II) division. This division was determined regarding to the complete
Fusion (F) and RNA polymerase (L) genes.

20
Based on Fusion (F) protein (Figure 1), Class II viruses have 9 genotypes (I-IX) with 2
different sub lineages. The first sub lineage known as ‘early NDV (<1930’s)’ have
genome size of 15.186 nt. This sublineage is comprised of genetic group I-IV and has
been identified with early NDV outbreaks in the 1930s. A second sublineage has a
longer 15.192nt genome size. This sub lineage consists of genotypes V-IX and they are
responsible for more recent outbreaks (>1960) (Czegledi et al., 2006; Kim et al., 2007a;
Kim et al., 2007b; Wu et al., 2010).
Figure 2.1. The phylogeny of NDV based on complete Fusion gene (Czegledi et al., 2006).
Class I viruses have a genome of 15.198 nt and nine genotypes are recognised (1-9)
(Kim et al., 2007a; Kim et al., 2007b; Kim et al., 2008; Liu et al., 2010). This class was
identified in wild water birds, waterfowl, shorebirds or poultry in live birds market
(Collins et al., 1998; Aldous et al., 2003; Gould et al., 2003) and also in ducks (Lee
et al., 2004; Liu et al., 2007). In contrast, Class II viruses are predominantly found in
chickens (Liu et al., 2003). However, occasionally Class I NDVs are also found in
domestic poultry while the Class II NDVs in particular genotype one are frequently
isolated from waterfowl and wild bird species
(Aldous et al., 2003; Kim et al., 2007b).

21
Figure 2.2. Genomic analysis of ND based on partial F sequences (Czegledi et al., 2006).
It can be seen on Figure 2 that genotypes II, IV and V of NDV Class II were
predominant in North America and Europe respectively while genotypes VI and VII
caused outbreaks in Middle East, Asia and Far East. The genotype VIII also emerged in
the Far East and South Africa (Herczeg et al., 1999; Czegledi et al., 2002; Huang et al.,
2004; Czegledi et al., 2006).
In Australia, NDVs have been isolated from poultry and from wild birds. The isolate
known as V4 belongs to Class II genotype I (Czegledi et al., 2006; Wu et al., 2010). In
Western Australia (WA), the isolates of NDVs were divided into two groups based on
monoclonal antibodies reactivity: V4-like (Class II NDV) and MC110-like (Class I
NDV). These isolates were found mainly in Charadriiformes and Passeriformes (V4-
like), and Charadriiformes and Anseriformes (MC110-like).

22
2.4 Laboratory Diagnosis of Avian Influenza and Newcastle Disease
Infections with AI and NDV can be confirmed by laboratory diagnostic assays
including viral isolation, antigen detection, serology, pathology, and genome detection.
2.4.1 Samples for laboratory diagnosis
Samples from dead birds include oronasal swabs, lung, kidney, intestines, spleen, brain,
liver and heart tissues. Samples from live birds consist of tracheal and cloacal swabs as
well as fresh faeces (OIE, 2004). Samples obtained from live birds should be placed in
buffer solutions such as phosphate buffered saline (PBS) with antibiotics. Then these
samples should be processed immediately or stored at 4°C to prevent autolysis and
bacterial contamination (OIE, 2004).
2.4.2 Virus and viral antigen detection
Samples from animals infected with AIV or NDV can be confirmed by culturing and
inoculating the samples into the live cells or embryonated eggs which is the gold
standard for viral detection. Cultivation can provide stock viruses for further research or
vaccine production. However, viral isolation is time consuming and requires viable
virus in the sample.
Samples can be inoculated into the allantoic cavity of 9 to 11 day embryonated specific
pathogenic free (SPF) or specific antibody negative (SAN) chicken eggs (OIE, 2004).
Some of the more virulent viruses cultivated in the allantoic cavity will kill the embryo
of SPF or SAN eggs. The cells lining the allantoic cavity contain trypsin like enzymes
and can support the growth of viruses of low virulence. The viruses that can be cleaved
by furin can invade and kill the embryo (Collins et al., 1993; Aldous and Alexander,
2001).
There are numerous cell lines have been used to replicate avian AIV and NDV such as
Madin-Darby canine kidney (MDCK) cells, Madin-Darby bovine kidney (MDBK) cells,
Chicken embryo kidney (CEK) cells and tracheal epithelial cells (Sahle et al., 2002;
Wambura et al., 2006; Zaffuto et al., 2008). It may be necessary to provide exogenous
proteases to facilitate viral protein cleavage (Sahle et al., 2002; Zaffuto et al., 2008).

23
2.4.3 Haemagglutination Assay
The growth of viruses in allantoic fluid of embryonating eggs or cell culture is
confirmed by HA. This assay is a tool for screening both AIV and NDV. The viruses
bind to the N-acetylneuraminic acid-containing proteins on mammalian and avian
erythrocytes. However, other agents such as bacteria also have haemagglutinating
proteins. Moreover, the HA assay does not only detect viable viruses. It will also detect
HA on degraded or inactivated particles. Therefore, the HA test has limitations when
used as a viral identification test (Spackman, 2008).
2.4.4 Serological assay
Serological assays can be used to determine the immune responses to these viral
infections. The most commonly used assays are haemagglutinin inhibition (HI) and
enzyme linked immunosorbent assay (ELISA).
2.4.4.1 Haemagglutination inhibition
Haemagglutination inhibition is used to classify and subtype the haemagglutinating
viruses and is applied to evaluate the antigenic relationship between viral subtypes
recognised by specific antibodies (OIE, 2004; Spackman, 2008).
The assay is based on the inhibition of haemagglutination by specific antibody. The HI
titre is the highest dilution of serum causing complete inhibition (OIE, 2004).
The assay is inexpensive compared with other assays and uses standard laboratory
equipment. Moreover, this assay is approved as a World Health Organization (WHO)
gold standard assay for AIV sub typing. However, HI requires specific antibody and
reference reagents when working with uncharacterized viruses or antibodies (Spackman,
2008).
2.4.4.2 Enzyme linked immunosorbent assay
Indirect ELISA is based on the reaction of test antibodies with specific antigens
attached to a plastic plate. Antichicken antibodies conjugated to a suitable enzyme are
detected by the addition of a suitable substrate and chromogen which results in a colour
change. This colour change can be read on a spectrophotometer (Alexander et al., 2004)

24
The specificity of indirect ELISA depends on the purity of the antigens. The presence of
contaminants may lead to poor specificity (Burgess, 1988; McCullough, 1993).
Sandwich ELISA is a configuration used to detect viral antigens. A capture antibody is
adsorbed to the plate. An indicator antibody can be conjugated to an enzyme of detected
by and antispecies antibody conjugated to the enzyme. This assay frequently uses a
polyclonal capture antibody and an unlabelled monoclonal indicator antibody detected
by an antimouse conjugate. The specificity is determined by the monoclonal antibody
(McCullough, 1993). Monoclonal antibody panels have been produced allowing this
assay to be used to type the isolates (Crowther, 1993).
Monoclonal antibodies are mainly produced using avirulent NDV isolates. Based on the
monoclonal antibodies, NDVs isolated from wild bird species can be classified into
group labelled G, L and I while NDV in water birds are largely in group H (Alexander,
1995; Ballagi-Pordany et al., 1996; Aldous et al., 2003; Czegledi et al., 2006).

25
2.5 Molecular or Genome Detection
Molecular genome detection techniques are becoming the assay of choice. They can
detect viral genome directly from animal samples and can also be used to facilitate the
genetic characterization of the isolates.
2.5.1 Polymerase chain reaction
Polymerase chain reaction is a powerful technique for the detection of viral genome. It
has the potential to have high sensitivity and is now accepted as the gold standard for
nucleic acid detection and research (Mackay et al., 2002). The principle of the assay is
the cyclical replication using polymerase enzymes (Albert et al., 2004).
However, PCR requires DNA as a template and the target viruses in this study have
RNA as their nucleic acid. Therefore, RNA viruses require a reverse transcription step
to produce single stranded complementary DNA (cDNA) through reverse transcriptase
using a specific oligonucleotide primer and viral RNA as a template (Mackay et al.,
2002; Mackay, 2004; Turner et al., 2005).
Reverse transcription polymerase chain reaction (RT-PCR) is used to detect RNA
viruses such as AIV and NDV which are negative and single stranded RNA viruses.
There are two different configurations of the RT-PCR assay. In the two step RT-PCR
configuration, the cDNA is synthesized in a different tube before performing PCR
assay. In contrast a one step RT-PCR firstly synthesises the cDNA. The reverse
transcriptase is inactivated and the polymerase is activated simultaneously and the PCR
reaction is carried out in a single tube (Pfaffl, 2004). This is rapidly becoming the assay
of choice.
Several important steps need to be considered in developing an RT-PCR protocol. The
first aspect is the RNA extraction. This needs to be an efficient process that can extract
RNA from the samples even when it's in low concentrations and eliminate contaminants
that will degrade the RNA (Pfaffl, 2004).
Another important aspect is the gene being targeted and the choice of primers. This can
have a profound effect on the efficacy of the assay (He et al., 1994). Poorly design
primers can result in mispriming and the amplification of non-specific products or the

26
formation of primer dimer (Singh and Kumar, 2001; Abd-Elsalam, 2003; Pfaffl, 2004).
The assays may be used to detect the organism, place it into appropriate genotypes and
even determine the pathogenicity of the isolates.
Matrix genes are relatively conserved and many oligonucleotide primer sets have been
used for the detection of NDV and AIV (Seal, 1995; Creelan et al., 2002; Spackman
et al., 2002; Wise et al., 2004; Spackman et al., 2005).
However, screening test using M primers are not used to differentiate genotype ND and
AI virus or to determine the pathogenicity based on the sequence of F and HA genes
respectively. Therefore, it is crucial also to develop and evaluate set of primers based on
fusion genes for NDV and haemagglutinin genes for AIV in order to confirm the
pathogenicity of those viruses (Collins et al., 1993; Collins et al., 1994; Seal, 1995;
Collins et al., 1996; King and Seal, 1998; Heine et al., 2005).

27
2.5.2 Real time (quantitative) polymerase chain reaction
Real time PCR (qPCR) is a configuration of PCR used to quantify and monitor the
accumulation of amplicon in real time. This amplicon accumulation can be monitor by
labelling the primers, oligonucleotide probes or amplicon.
qPCR is rapidly becoming the assay of choice since this method does not require an
additional electrophoresis step using agarose gel. In conventional PCR there is an
endpoint reaction which is then visualised using agarose gel electrophoresis where the
DNA is stained using an interchelating dye such as ethidium bromide. This dye can be
carcinogenic (Bustin and Nolan, 2004; Pfaffl, 2004; Bustin and Mueller, 2005).
The sensitivity of qPCR can be comparable to nested PCR without the accompanying
problems of contamination and false positive results. Nested PCR is relatively
cumbersome requiring two successive reactions with different sets of nested primers
with the PCR products being visualised in gel electrophoresis (Singh and Kumar, 2001).
Another advantage of qPCR is that a melt curve can be incorporated into the analysis.
Melting curve analysis can characterise and distinguish the amplified sequence based on
their apparent melting temperature (TM). This melting temperature is largely
determined by the base composition and the length of the PCR product (Wilhelm and
Pingoud, 2003).
The interchelating dyes SYBR Green and SYTO 9 are frequently used. They fluoresce
when they are bound to double strand DNA and allow melting curve analysis to be
carried out as the two strands come apart during the heating process (Wilhelm and
Pingoud, 2003).

28
CHAPTER 3
GENERAL MATERIALS AND METHODS
3.1 Newcastle Disease and Avian Influenza Viruses
The reference viruses use in this study are outlined in Table 3.1
Table 3.1 Reference viruses of ND and AI used in this study Virus Names, Strains, Subtypes Source
Country Institution Correspondence ND V4 Australia TropBio Pty. Ltd Dr. Jan Smith
ND FP1 Australia TropBio Pty. Ltd, Dr. Jan Smith
ND AP1 Australia TropBio Pty. Ltd,
Dr. Jan Smith
ND SP3 Australia TropBio Pty. Ltd, Dr. Jan Smith
ND WA Domestic Duck Isolate
WA3245
Australia (Mackenzie et al., 1984;
MacKenzie et al., 1985)
ND Ibis Australia Department of Primary
Industry
Dr Ibrahim Diallo
ND viral
antigen
Balitvet, Pusvetma Indonesia Balitvet, Pusvetma
AI A/chestnut
teal/Victoria/2004/H4N4
Australia The Primary Industries
Research Victoria
Dr Simone Warner
AI H11N9/STS (Sharp-tailed
Sandpiper)
Australia WHO, Parkville, Australia
A. C. Hurt (Hurt et al.,
2006)
AI H4N8 (Red Necked Stint =
RNS)
Australia WHO Parkville, Australia
A. C. Hurt (Hurt et al.,
2006)
AI Timika, Ambon Indonesia Laboratory of Indonesian Agricultural Quarantine Agency
Syukur Iwantoro, Catur
Putra Budiman
AI Tanggerang, Sukabumi Indonesia PT. BioTek Indonesia Sudirman
3.1.1 ND viruses
ND viruses in this study were obtained from two different locations which are Australia
and Indonesia. Australian strains of NDVs were attained from five different strains
which were kindly provided by TropBio Pty Ltd-JCU. Those strains are V4, FP1, AP1,

29
SP3 and the WA Domestic Duck Isolate 3245. An Ibis NDV isolate was supplied by
Dr Ibrahim Diallo DPI Brisbane.
The other strains were collected from Indonesia as inactivated RNA derived from
Balitvet and Pustvetma antigens which were processed using the transport buffer and
transported to Australia without a cold chain.
3.1.2 Avian Influenza viruses
AI viruses in this study were also attained from Australia and Indonesia. There were
five different Australian isolates of influenza viruses used in this study.
The isolate A/chestnut teal/Victoria/2004/H4N4 was kindly provide by Dr Simone
Warner, the Victorian Institute of Animal Science, Attwood and H11N9/STS (Sharp-
tailed Sandpiper = STS), H4N8 (Red Necked Stint = RNS) which were isolated from
Australian shorebirds species were provided by the WHO reference laboratory
Melbourne, Victoria.
AI viruses were collected in Indonesia. Allantoic fluid was inactivated in the transport
buffer and the RNA transported to Townsville.
These viruses were provided and processed in the Centre of Standard Testing of
Indonesian Agricultural Quarantine Agency. The viruses were collected from Ambon
and Timika outbreaks. Others samples were kindly donated by Sudirman, DVM, PT.
BioTek Indonesia Jakarta. These viruses were Tanggerang and Sukabumi. Samples
from Indonesia were suspected to be AI subtypes H5N1. All were imported subject an
AQIS permit.
3.2 Propagation of Stock Viruses
3.2.1 Viral culture
AIV and NDV were inoculated into specific pathogen free chicken eggs. Viruses were
propagated following the procedure standardised by OIE(OIE, 2004) and (Webster
et al., 2002; Spackman, 2008) using 9-11 days old embryonated eggs inoculate into the
allantoic cavity and incubated at 37C.

30
3.2.2 Harvesting
Eggs were candled daily and embryos dying within 24 hours post inoculation were
discarded. Eggs were chilled at 4C overnight or -20C for two hours then placed at 4C
for additional two hours before harvesting. Allantoic fluid was collected and centrifuged
at 1,500 g for 10 minutes and tested test for HA activity.
3.3 Haemagglutination Test
3.3.1 Preparation of 0.5% chicken red blood cells
The 0.5% chicken red blood cells were prepared as described by (Shortridge, 1982;
Spackman, 2008), OIE and CSIRO (Anonymous, 2004). Whole chicken blood was
collected from the wing vein of specific pathogen free chickens and diluted 1:4 in sterile
Elsevier’s solution (Appendix 2).
Aliquots of the cells were washed three times with phosphate buffered saline by
centrifugation at 1,500 g for 10 minutes. The packed cell volume was noted and the
cells were resuspended in PBS at a dilution of 0.5%
3.3.2 Antigen Titration
1. Serial, two-fold dilutions of the test viruses in 50 l of PBS were carried out
from columns 1 to 11 of a round bottomed microtitre plate with column 12
containing only PBS.
2. Aliquots of 50 l of 0.5% chicken erythrocytes were added to all wells and the
plates incubated at 4C for 45 to 60 minutes.
3. The plate was examined for HA by tilting the plate and observing the presence
or absence of RBC tear shaped streaming. The endpoint was the highest dilution
at which there is complete agglutination without streaming. At this dilution the
virus is said to contain 1 haemagglutination unit (HAU) per 50 l
3.3.3 Bacterial contamination detection for quality control of stock viruses
The infected allantoic fluids were tested for bacterial contamination. Samples were
streaked onto blood agar plates.

31
Allantoic fluids collected from eggs contaminated with bacteria were either filtered
through 220 nm filters or treated with antibiotic (penicillin (2000 units/ml);
streptomycin (2 mg/ml); gentamicin (50 µl/ml) and mycostatin (1000 units/ml)).
3.4 Confirmation of the presence of NDV using ELISA
Specimens of allantoic fluid containing NDV were confirmed by ELISA using strain
specific monoclonal antibodies using kits provided by TropBio Pty Ltd, JCU,
Townsville. ND antigens were screened using the “Trop-Ag NDV Screening kit
(Catalogue No 03-001-01) and typed using the Trop-Ag NDV Typing kit (Catalogue No
03-001-03) following the manufacturers recommendations.
3.5 Estimation of viral titre by 50% egg infectious dose
The titre of the viruses was estimated by inoculating SPF chicken eggs and expressed as
50% embryo infective doses (EID50) following the procedures describes by Mahy and
Young (Mahy, 1985; Young et al., 2002).
1. Serial 10 fold dilutions of stock viruses were suspended in PBS and aliquots of
100 l were inoculated into the allantoic cavity of 10 day old embryonated eggs
with 5 eggs per dilution.
2. The eggs were incubated at 35-37C for 4 days and candled every day to check
for embryo viability. Embryos dead at 24 hours were discarded. All remaining
eggs were cooled at 4C and harvested.
3. Titres were calculated using the method of Reed and Muench Method (Reed and
Muench, 1938).
3.6 Polymerase Chain Reaction
3.6.1 RNA extraction
Viral RNA from 180 µl of allantoic fluid was extracted using a Corbett X-tractor Gene
automated RNA/DNA extraction system (Corbett Robotic, Brisbane, Australia). The
protocol followed the viral RNA/DNA purification protocol beta test (CorProtocol™
No. 25101).

32
3.6.2 Primers, probes and DNA binding dye
Primers and probes were synthesised by either Sigma Genosys or Biosearch
Technologies (USA).
Where appropriate primers were designed using Vector NTI 10 (Invitrogen, Australia)
or Beacon Version 6 (Premier Biosoft International) and AlleleID 6 or primers from
published studies were used. Details are presented in Tables 3.2 and 3.3.
Lyophilized primers were suspended in 1× TE Buffer to produce a 100 µM stock
solution stored at -80°C and this was diluted tenfold in nuclease-free water to make a
10 µM working stock that was stored at-20°C.

33
Table 3.2 Primers and probes for AI viruses’ used in this study
Primer Name Sequence (5’-3’) Target sequence Position of primers
Product length References
Screening test for AI
IVA-D161M (Forward) AGATGAGYCTTCTAACCGAGGTCG AI Matrix 38 to 61 101 bp (Heine et al., 2005)
IVA-D162M (Reverse) TGCAAANACATCYTCAAGTCTCTG AI Matrix 115 to 138
IVA-Ma (FAM-Probe) FAM-TCAGGCCCCCTCAAAGCCGA-BHQ1
Ward MF AAGACCAATCCTGTCACCTCTGA AI Matrix 183 to 205 95 bp (Ward et al., 2004; Munster et al., 2005)
Ward MR CAAAGCGTCTACGCTGCAGTCC AI Matrix 256 to 277
AI-Universal AGCAAAAGCAGG AI Matrix 1 to 12 (Hoffmann et al., 2001) IVA-D148H5-F AAACAGAGAGGAAATAAGTGGAGTAAAATT AI H5 short length 1568 to 1599 121 bp (Heine et al., 2005) IVA-D148H5-R AAAGATAGACCAGCTACCATGATTGC AI H5 short length 1664 to 1689 AI sequencing
Pay H5F3+ Forward AACAGATTAGTCCTTGCGACTG AI H5 short length 1001–1021 102 bp (Payungporn et al., 2006b) Pay H5R2+ Reverse CATCTACCATTCCCTGCCATCC AI H5 short length 1124–1103

34
Table 3.3 Primers and probes for NDVs used in this study
Primer Name Sequence (5’-3’) Target sequence
Position of primers
Product length
References
Diagnostic primers
Wise-NDVM /M+ 4100 (Forward) AGTGATGTGCTCGGACCTTC NDV Chicken Matrix 811-830 120 bp (Wise et al., 2004)
Wise-NDVM / M-4220 (Reverse) CCTGAGGAGAGGCATTTGCTA NDV Chicken Matrix 911-931
NDV-MGB1-F (Forward) GGAACCGCATGTTATCCGATTG NDV Duck Matrix 891 to 915 109 bp Gene bank ID. AY626266 M
NDV-MGB1-R (Reverse) GTGTGCCAGCTTGAATGATCAC NDV Duck Matrix 979 to 1000
Cr-NDV-Ch-F (Forward) GGTGAGTCTATCCGGARGATACAAG NDV Chicken Fusion 4829 t0 4893 202 bp (Creelan et al., 2002)
Cr-NDV-Ch-F (Reverse) TCATTGGTTGCRGCAATGCTCT NDV Chicken Fusion 5008 to 5031
St-NDV-Du-M (Forward) AGGACGCTTACAACCCTCC NDV Duck Fusion 302 to 315 294 bp (Stanislawek et al., 2001)
St-NDV-Du-M (Reverse) CTGCATCTTACCTACGGCAAC NDV Duck Fusion 589 to 596
Sequencing primers NDV-Duck-M2-F CGTTTACAAGATTCCAACCGCAGC NDV Duck Matrix 555 to 578 548 bp GenBank ID. AY626266 M
NDV-Duck-M2-R GCGAGTGCTTACTTCTTGAACGGG NDV Duck Matrix 1080 to 1103 NDV-F294-F AGGACAYTGACTACTTTGCTC NDV Chicken Fusion 4799 to 4819 293 bp Consensus Chicken NDV
Sequences NDV-F294-R CTGCATCTTCCCAACTGCCAC NDV Chicken Fusion 5072 to 5092

35
3.6.3 Conventional PCR
Conventional PCR in this study included reverse transcriptase (RT) for RNA and PCR
for DNA. A variety of reagents were used Qiagen One-step RT-PCR kit (Catalogue No.
210210) while two step RT-PCR were carried out using various Fermentas, Bioline and
Qiagen kits.
3.6.3.1 One step reverse transcriptase polymerase chain reaction
Extracted viral RNA (50 to 100 ng of template RNA) was amplified using Qiagen One-
step RT-PCR kit (Catalogue No. 210210) in an Eppendorf Master Cycler using 1.5 mL
tubes and 50 µl of the reaction mix following the manufacturers’ instructions. Specific
primers were used at a concentration of 0.4 µM.
3.6.4 PCR amplification
PCR amplification of DNA produced in the one step kits was carried out in some cases
using either Fermentas polymerase or GoTaq colourless or GoTaq Green (Catalogue no.
M7121) Master Mixes (Promega).
Template DNA was amplified in an Eppendorf Master Cycler which was set up
according to the following reaction: initial denaturation step at 95°C for 2 min and 35
cycles of denaturation at 95°C for 45 sec, annealing at 5°C below the calculated melting
temperature of the primers for 45 sec, extension reaction at 72°C for 1 min and a final
extension at 72°C for 5 min.
3.6.5 Analysis and purification PCR product
All the PCR products were analysed by agarose gel electrophoresis utilising 2.5% w/v
agarose gels containing 0.5 µg/ml ethidium bromide.A100 bp plus DNA ladder
(Fermentas, USA) was used as a markers.
PCR products were visualised in InGenius LHR Gel Documentation and Analysis
system (Syngene, USA) with Gene Snap Software version 06.08.04 and Gene Tools
analysis software version 03.07.03 (Synoptic. LTD, UK).

36
3.6.6 Extraction of DNA fragments
The DNA fragments were recovered and concentrated from agarose gels using Real
GenomicsTM (Real Biotech Corporation) kit, HiYieldTM Gel/PCR DNA Extraction
(catalogue no. YDF100).
3.7 Sequencing
Purified PCR products or PCR products without purification were sent to Macrogen,
South Korea to obtain targeted sequences. PCR products were sequenced utilising the
primer pairs used to produce the amplicons.
Sequences were analysed by assembled using ContiqExpress Project, Vector NTI
Advanced 10 (Invitrogen), and Sequencher version 4.7 (Gene Codes corporation, USA).
Sequences were compared to the available GenBank sequences database using Basic
Local Alignment Search Tool (BLAST). GeneDoc and Mega 3.1 to 5 were used to
perform alignments and produce phylogenetic trees.
3.7.1. Phylogenetic analysis
Evolutionary analyses were conducted in MEGA5 (Tamura et al., 2007). The
evolutionary history was inferred using the Minimum Evolution method (Rzhetsky and
Nei, 1992). The optimal tree was shown with the sum of branch length at about
1.14919081. The percentage of replicate trees in which the associated taxa clustered
together in the bootstrap test (500 replicates) to the branches (Felsenstein, 1985). The
trees were drawn to scale, with branch lengths in the same units as those of the
evolutionary distances used to infer the phylogenetic tree. The evolutionary distances
were computed using the Maximum Composite Likelihood method (Tamura et al.,
2004) and in the units of the number of base substitutions per site. The ME trees were
searched using the Close-Neighbour-Interchange (CNI) algorithm (Kumar et al., 2008)
at a search level of 0. The Neighbour-joining algorithm (Saitou and Nei, 1987) was used
to generate the initial trees. Codon positions included were 1st+2nd+3rd+Noncoding.
All positions containing gaps and missing data were eliminated, and then phylogenetic
trees were produced.

37
CHAPTER 4
Development and evaluation of real time RT-PCR assays for the detection of ND viruses
4.1 Introduction
Assays for the detection of AIV based on detection of the M gene (Heine et al., 2007)
were previously evaluated by others at this School. It was considered that these assays
would be appropriate for screening the AI isolates to be used in the study.
It was anticipated that both Class I (duck strains) and Class II (chicken strains) of NDV
would be encountered in this project (Czegledi et al., 2006). There were several
publications describing RT-PCR assays for the Class I strains of NDV but there are only
limited published techniques for the detection of the Class 2 strains of NDV. Multiplex
assays for the simultaneous detection of these viruses had not been described at the time
this work was carried out.
4.2 Literature Review
Many primers have been used in qPCR for AIV and NDV. Pairs of primers designed by
Spackman (Spackman et al., 2002) have been widely used and modified for the
detection of AI. These primers were also modified by Heine (Heine et al., 2005) and
this modification has been widely used in Australia as a standard technique for
screening AI disease by RT-qPCR and for detection H5N1 isolates. Moreover, study of
these primers (Long, unpublished thesis) has shown that these primers can be
successfully used in SYBR green qRT-PCR (Long, 2007). However, published primer
(Ward et al., 2004) were used in this study with a SYTO 9 AI RT-PCR diagnostic
assay. Ward primer were also compared with other published primers (Heine et al.,
2005)in this study.
A variety of molecular assays for NDV have been developed with primers and probes
targeting both Class I and Class 2 viruses (Creelan et al., 2002; Stanislawek et al., 2002;
Wise et al., 2004). Assays based on these primers vary substantially in sensitivity and
specificity and in this study they were evaluated using SYTO 9 RT-qPCR.

38
A set of primers that targeted the M gene were designed and evaluated as individual
assays and in a duplex format combined with a set of primers designed by Wise (Wise
et al., 2004). These were evaluated using both Class I and Class 2 isolates which were
anticipated to be similar to those that could be isolated from wildlife in North
Queensland (Seal et al., 1998; Wise et al., 2004; Czegledi et al., 2006; Kim et al.,
2007b).
4.3 Aims
The specific aims of this project are as follows:
1. To develop a single one step RRT-PCR assay with SYTO 9 to rapidly detect
NDV
2. To develop and evaluate a duplex one step RRT-PCR assay with SYTO 9 to
rapidly detect both Class1 and Class II NDV
3. To differentiate ND virus isolates based on melting curve analysis in one step
SYTO 9 RRT-PCR
4.4 Materials and Methods
4.4.1 Propagation of viruses
ND V4, FP1, AP1, SP3; Duck isolate 3245 and ibis isolates as described in Chapter
3.1.1 and 3.1.2 were used. Viruses were propagated in embryonated eggs as described
in Chapter 3.2.
Based on the classification, the isolates used in this study belonged to Class II
genotype I (V4 and V4 like isolates: FP1, AP1, SP3) or they were Class I isolates (Duck
#3425 and Ibis).

39
4.4.2 RNA extraction
Viral RNA was extracted using a Corbett X-tractor Gene automated RNA/DNA
Extraction system (Corbett Robotic, Brisbane, Australia) as described in Chapter 3.6.1
4.4.3 Primer sets
The primers for ND were from published papers (Stanislawek et al., 2001; Creelan
et al., 2002; Wise et al., 2004) or they were designed using Vector NTI 10 (Invitrogen,
Australia) and AlleleID (Premier Biosoft). The new pair of primers NDV-Duck-M2-F
and R was designed using sequence accessed from GenBank database as described in
Table 4.1
Table 4.1 Primer sets for ND virus diagnosis targeting M gene
No Primer Sequence Position / Product
Length
Viral
Class
References
1 Wise-NDVM
/M+ 4100-F
5’-AGTGATGTGCTCGGACCTTC-3’
811-830 / 120 bp Class II (Wise et al.,
2004)
2 Wise-NDVM
/ M-4220-R
5’-CCTGAGGAGAGGCA
TTTGCTA-3’
911-931 /
120 bp
Class II (Wise et al.,
2004)
3 NDV-Duck-
M2-F
5’-CGTTTACAAGATTCC
AACCGCAGC-3’
891 to 915 / 109
bp
Class I
GenBank ID.
AY626266 M
4 NDV-Duck-
M2- R
5’-GCGAGTGCTTACTTC
TTGAACGGG-3’
979 to 1000 / 109
bp
Class I
GenBank ID.
AY626266 M
4.4.4 Reverse transcriptase real time PCR
A SYTO 9 RT-qPCR was performed in a RotorGene 3000 (Corbett Robotic, Australia).
The SuperscriptTM III Platinum® One step Quantitative RT-PCR System (Invitrogen,
catalogue no.11732-020) was used. The dye SYTO 9 was used at a concentration of
1.5µM and the primers were used at a concentration of 0.4µM
The cycling parameters were as follows 30 min at 48°C for the reverse transcriptase
step. Then, 95°C for 10 min to activate the Hot start Taq DNA Polymerase. Then, 40
cycles of 95° C for 10 sec (denaturation) and 60°C for 45 sec (primer annealing and
extension) were performed to amplify DNA.

40
The DNA was quantified using Quantization Cycling A-Green. This quantification
calculated the cycle threshold (CT-Value) of normal fluoroform. The Melting curve
analyses was performed at 72°C to 95°C. Quantization Cycling A-Green and Melt A
Green analysis was performed using Rotor-Gene 6000 Series Software series 1.7.
Initially four pairs of primers (two for M gene and two for fusion) were evaluated.
The two pair of M primers were chosen as the standard diagnostic primers. Initially they
were evaluated as single pairs of primers and then as a duplex using SYTO 9 RT-qPCR
and the products from NDV Class I and II viruses were differentiated by melt curve
analysis.
4.4.5 Conventional PCR
Conventional PCR were performed as a quality control for the SYTO RT-qPCR for
NDVs. Two steps Reverse Transcriptase was carried out in conventional PCR. The two
steps RT-PCR were generated by firstly producing cDNA followed by PCR reaction.
cDNA was produced using Fermentas RevertAidTM First Strand cDNA Synthesis kit
(catalogue no. #K1622). cDNA synthesis was carried out as described in Chapter 3.6.3.
Synthesis of cDNA was then followed by PCR performed using Fermentas PCR kit and
PCR conditions as briefly explained in Chapter 3.6.3. PCR products were analysed on
gel electrophoresis and visualised using an InGenius LHR Gel Documentation and
Analysis system (Syngene, USA) as described in Chapter 3.6.4.
DNA fragments were extracted from purified PCR products by using Real GenomicsTM
(Real Biotech Corporation) kit, HiYieldTM Gel/PCR DNA Extraction (catalogue no.
YDF100). The extraction of DNA fragments is described in Chapter 3.6.5. Where
necessary additional cycles of PCR were performed on extracted DNA fragments of
purified PCR products.
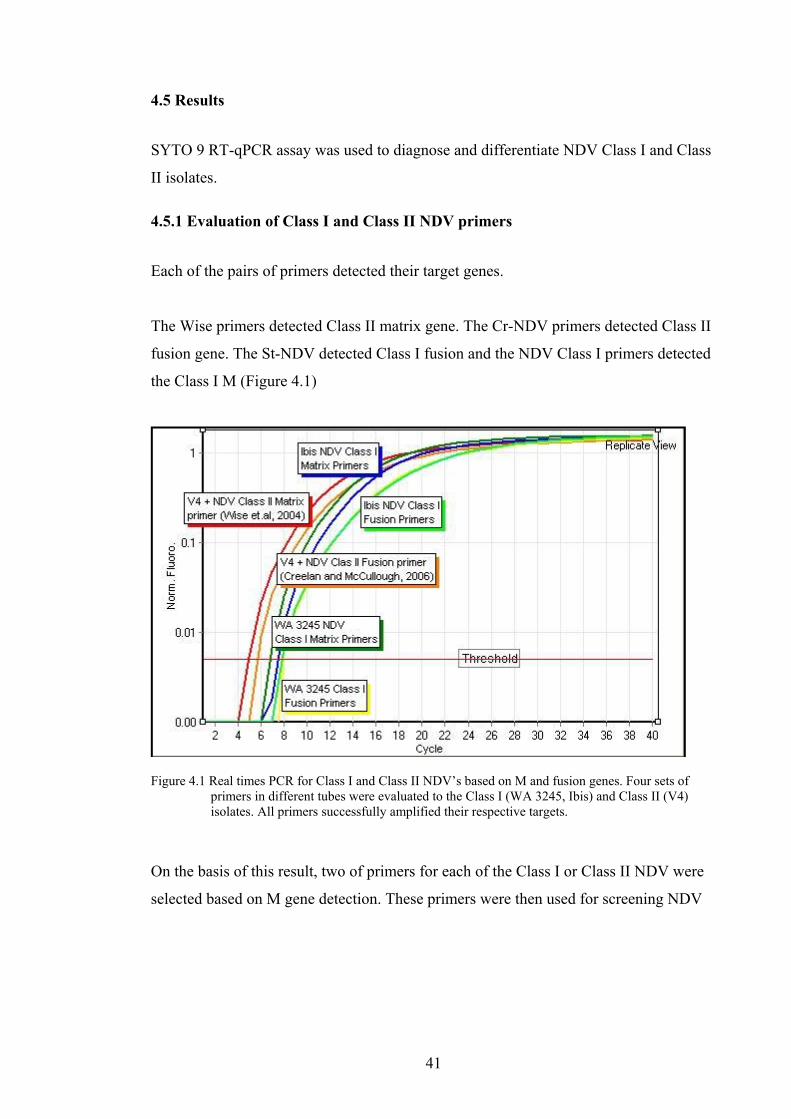
41
4.5 Results
SYTO 9 RT-qPCR assay was used to diagnose and differentiate NDV Class I and Class
II isolates.
4.5.1 Evaluation of Class I and Class II NDV primers
Each of the pairs of primers detected their target genes.
The Wise primers detected Class II matrix gene. The Cr-NDV primers detected Class II
fusion gene. The St-NDV detected Class I fusion and the NDV Class I primers detected
the Class I M (Figure 4.1)
Figure 4.1 Real times PCR for Class I and Class II NDV’s based on M and fusion genes. Four sets of
primers in different tubes were evaluated to the Class I (WA 3245, Ibis) and Class II (V4) isolates. All primers successfully amplified their respective targets.
On the basis of this result, two of primers for each of the Class I or Class II NDV were
selected based on M gene detection. These primers were then used for screening NDV

42
4.5.2 Evaluation of matrix primers for NDV Class I and Class II detection.
Evaluation of M primers was performed separately with homologous and heterologous
ND viruses.
The evaluation of the two different M primers showed that the Wise primers (Wise
et al., 2004) specifically detected the Class II genotype 1 isolates but did not amplify the
Class I NDV. The results of the SYTO 9 RT-qPCR can be seen in Figure 4.2.
Figure 4.2 SYTO 9 RT-qPCR for detection of NDVs of Class I and Class II using the Wise M
Class II primers (Wise et al., 2004)
In contrast, The Duck (#3245, Class I virus) isolate was preferentially detected with the
newly designed primers NDV-Duck-M2-F and R for ND Class I isolates. In addition,
this pair of primers failed to react NDV Class II isolates as can be seen from SYTO 9
RT-qPCR result (Figure 4.3)

43
Figure 4.3 SYTO 9 RT-qPCR for detection of Class I and Class II NDV using the Class I M
primers. The primers amplified the Class I NDV WA 3245 isolates but failed to detect the four chickens Class II NDV isolates V4, FP1, AP1, and SP3
4.5.3 A Duplex assay using two pairs of ND virus matrix primers
After successfully applying M primers in separated tubes to detect Class I and Class II,
the two pair of M primers was evaluated in a duplex configuration. This was evaluated
using tubes containing only Class II or Class I isolates as well as tubes containing a
mixture of viruses.
A single product was produced by each of the pairs of primers. The Class I viruses in
this project were WA3245 and an Ibis isolate. The Class II isolate was V4 (Figure 4.4).
Figure 4.4 Fluorescence data of duplex SYTO 9 RT-qPCR assay Class I and Class II ND
isolates.

44
4.5.4 Melting curve analysis of NDV Class I and Class II isolates
Melting curve analysis was performed and it was noted that there was a difference in
melting temperature between the amplicons produced by each of the four pairs of
primers (Figure 4.5)
NDV Class I (WA 3245) M and fusion required lower temperature to melt 50% of
dsDNA than NDV Class II. NDV Class I M genes were melted at a temperature of
±85°C while NDV Class II M melted at ±86.7°C.
Also, NDV Class I Fusion (±86.16°C) requires lower temperature than NDV Class II
Fusion (±87°C) to dissociate double stranded amplified DNA to be a single stranded.
The temperature differences, indeed, was affected by the length of sequence targets, M
or Fusion genes, in NDV Class I or Class II as can be seen on Table 4.1 and 3.3.
Figure 4.5 Melting Curve profile in different primers for different M and fusion sequence Class I and Class II of NDVs. Two classes NDV’s M and fusion fragments have different melting points.
Melt curve analysis for M genes in duplex configuration confirmed that the two classes
of NDV can be discriminated with Class II isolates represented by V4 having a higher
melting temperature than the Class I isolates (Duck WA3245 and Ibis isolate)
(Figure 4.7).
It was clear from the Figure 4.4 that different nucleotide sequence in the heterologous
M genes produces different melting points. This different melting point, indeed, were
used to differentiate Class I and Class II of NDV in single tube assay.

45
Figure 4.6 Melti curve profile of Class I and Class II NDV isolates in duplex RT-qPCR assay. However, the melt curve analysis of amplified M sequences showed that slightly
different peaks between NDV isolates in Class II could be observed. The V4 isolates
had a similar melting point to the FP1 isolates while the AP1 and SP three isolates have
a slightly higher melting curve (Figure 4.7). The result confirmed that different strains
have different melting points even though they are in the same class and genotype.
These viruses are all Class II genotype 1.
Figure 4.7 Melting curve profile of SYTO 9 RT-qPCR for Class II NDV’s isolates using the M
Primers (Wise et al., 2004). There were minor differences in melting temperature (Tm V4 = 87.5; Tm FP1 = 87.56), (Tm AP1 = 88.34; Tm SP3 = 88.14)

46
4.5.5 Sensitivity of the test
The detection of template RNA of NDV V4 with tenfold dilution showed that SYTO 9
Real time RT assay can detect the RNA viruses of V4 up to a 10-5 dilution (Figure 4.8).
No attempt was made to determine the number of copies being detected.
Figure 4.8 Performance of the duplex SYTO 9 RT-qPCR assay using tenfold dilutions of NDV
RNA at a threshold 0.05.

47
4.6 Discussion
The RT-qPCR assay is a powerful tool that can be used to detect and quantify nucleic
acids and is increasingly being used to diagnose infectious disease (Mackay, 2004;
Suarez et al., 2007). There are real advantages over the conventional two step assays as
contamination can be avoided. Therefore RT-qPCR is perhaps the assay of choice to
detect AIV and NDV genomes (Wilson, 1997; Spackman et al., 2002). However,
sensitivity and specificity of the assay can also be influenced by the choice of the
primers.
The M and F proteins are the two important antigens in NDV. The M protein is
relatively conserved and the corresponding gene is therefore a good target for
diagnostics. A study of molecular evolution of the NDV M gene in the USA has noted
86% to 95% sequence identity between different isolates of Class II viruses (Seal et al.,
2000).
The traditional target has been the fusion protein gene and this protein is the important
determinant of pathogenicity of NDV. This protein has a protein cleavage site which is
cleaved by specific cellular protease (Seal et al., 2000). The difference in virulence of
NDV isolates correlates closely with the sequence of the cleavage site (Gould et al.,
2003). Most of highly virulent ND viruses have the fusion cleavage sequence 112R/K-R-
Q-K/R-R116 whereas the viruses of low virulence have amino acid sequence in the same
region of 112G/E-K/R-Q-G/E-R116 (OIE, 2004). Therefore this study evaluated both M
and fusion primers using SYTO 9 RT-qPCR.
Previous studies aimed at developing M gene assay have successfully detected Class II
NDV isolates but failed to recognise Class I NDV isolates (Kim et al., 2007b). Further
studies of the M gene sequences accessed from GenBank showed that there is
substantial difference between Class I and Class II viruses. A divergence of 25%, with
up to six mismatches in the probe site developed for the Class II isolates (Kim et al.,
2007b). Therefore a specific Class I M-gene assay was evaluated in this study and it
successfully detected Class I NDV isolates and in a duplex format it could detect both
Class I and Class II isolates.
A review of the literature indicated that the M primer set M+4100 forward and M-4220
reverse successfully detected most genotypes of Class II NDV isolates (Wise et al.,

48
2004). When used in real time RT-PCR these primers detected the reference Class II
viruses V4, FP1, AP1, and SP3. The reference Class I viruses WA Domestic Duck
Isolate 3245 (D1) and an Ibis isolate were not detected.
The primer pair NDV-MGB1 designed in this study preferentially detected the Class I
NDV isolates. This pair of primers was designed using the published sequence
(AY626266) accessed from the GenBank database
Fusion primers for NDV chicken (Class II) (Creelan and McCullough, 2006) and Class
I viruses (Stanislawek et al., 2002) were also evaluated. The Ct-values were higher than
the corresponding results for the M primers. Therefore the M primers were chosen for
use in the SYTO 9 RT-qPCR to monitor NDV.
The duplex RT-qPCR was evaluated using two pairs of M primers in one tube of master
mix to detect both chicken and duck isolates of NDV. The two classes of virus could be
differentiated on melt curve. No loss of sensitivity or specificity was noted in this
format.
The duplex RT-qPCR for ND has the potential to save time and effort in the laboratory
and it is cost effective. There is a potential for detection of non specific products and it
is important to optimise the assay to avoid excessive amounts of primer dimer formation
(Markoulatos et al., 2002).
This assay was developed for screening wildlife infected with NDV isolates. It was
anticipated that they would be infected with either Class I viruses or Class II genotype 1
viruses. The reference viruses chosen fit into these categories. For this study other
genotypes of Class II viruses were not evaluated. However, the Class II primers had
been previously shown to detect an extensive panel of Class II isolates (Wise et al.,
2004).
Melting Curve analysis can distinguish the two classes of NDV used to evaluate this
assay. The Class II isolates had a higher melting temperature than did the Class I
isolates. Using a high resolution melt analysis it was possible to distinguish between
two subtypes of the Class II genotype 1 virus. Phylogenetic analysis confirms that V4
and FP1 cluster together and SP3 and AP1 cluster with the I2 vaccine strains (Chapter

49
5.5.3). These different melting temperatures can result from differences in sequence or
length of PCR product (Wittwer et al., 2001).
The SYTO 9 dye has advantages over SYBR green. It is a saturating dye that does not
cause inhibition of the PCR reaction It can be used in high resolution melt studies to
detect minor sequence changes (White and Potts, 2006; Eischeid, 2011).
4.7 Conclusion
A SYTO 9 RT-qPCR using two pairs of M primers in a duplex configuration is a
promising diagnostic assay for monitoring NDV infection in wildlife.

50
CHAPTER 5
MOLECULAR PHYLOGENETIC AND PATHOTYPING STUDY OF AUSTRALIAN NEWCASTLE DISEASE VIRUS
ISOLATES
5.1 Introduction
Some strains of NDV can produce serious and fatal disease in poultry flocks and
occasionally in wildlife (Seal et al., 1998; Alexander, 2000a; Lee et al., 2009)
Pathotyping can require specific assays that are cumbersome and time consuming.
Sequencing of the fusion gene and estimate of the amino acid sequence of the protease
cleavage site can correlate closely with pathogenicity (Seal et al., 1995; Seal et al.,
1998; Seal et al., 2000; Seal et al., 2002; Seal et al., 2005)
In Australia, surveillance of NDV has generated several studies (King and Seal, 1997;
Gould et al., 2001; Chare et al., 2003; Gould, 2004; Kattenbelt et al., 2005; Kattenbelt
et al., 2006 (Spradbrow, 1987; Spradbrow et al., 1995)
The phylogenetic relationship and estimated pathogenicity of the reference viruses used
in this study were determined by sequencing the F gene and predicting the sequence of
the cleavage site.
5.2 Literature review
Pathotypes of NDV have been determined using conventional methods such as Mean
Death Time (MDT), IVPI and Intracerebral pathogenicity index (ICPI). These assays
utilise inoculated embryonated chicken eggs or chicks (Aldous and Alexander, 2001;
Alexander, 2001).
ELISA based on monoclonal antibody has been also used for typing and for pathotyping
NDV isolates (Li and Zhang, 2004; Lee et al., 2006). However, there may cross
reactions with epitopes common to other members of the Avulavirus genus such as
PMV-3 (Alexander, 1990).

51
Molecular based techniques have been developed to predict the pathogenicity of NDV
isolates (Jestin and Jestin, 1991; Suarez, 2003). RT-PCR can be used to amplify the F
gene and the amino acid sequence predicted (Seal, 1995; King, 1996; Marín et al.,
1996; Seal et al., 2000; Aldous et al., 2001). Virulent isolates have the amino acid
sequence 112R/K-R-Q-K/R-R116 at C terminus of F2 protein and F (Phenylalanine) at
residue 117, the N-terminus of the F1 protein. Low virulence viruses have sequence of 112G/E-K/R-Q-G/E-R116 and L (Leucine) at residue 117 (Alexander, 1990; Alexander,
1995; Collins et al., 1996; Aldous et al., 2001; Gould et al., 2001; OIE, 2004).
Molecular biology methods have been also used to evaluate the evolution of Avian
PMV-1. Several studies have been conducted to determine evolution based on
genotypes of NDV using sequence analysis of the F gene. Toyoda has classified the 11
NDV strains isolates from 1930’s to 1970’s into 3 lineages: A, B and C (Toyoda et al.,
1989) while Collins (Collins et al., 1996) determined F sequences of Pigeon PMV-1
into 4 lineages (I to IV) and new genotypes (V). In Western Europe, Lomniczi classified
20 NDV isolates into 7 lineages (I to VII) (Lomniczi et al., 1998) while genotypes VII b
and VIII were proposed by Herczeg (Herczeg et al., 1999) for NDV in Southern Africa
and Southern Europe.
Then, Czegledi (Czegledi et al., 2006) has re-classified NDV into two classes, Class I
and Class II. NDV Class I and Class II have been divided into 9 genotypes: 1-9 (Class I)
and I-IX (Class II) (Kim et al., 2007a; Liu et al., 2010). Class I of NDV was considered
having a genomic length of 15,198 nt while NDV Class II has two sublineages with
different genomic lengths (15,192 and 15,186 nt) (Czegledi et al., 2006).
There are two major reservoirs of NDVs in nature. The first reservoir is the primordial
reservoir of NDV, the wild water bird species and the second is chickens or poultry. The
Class I viruses predominantly infect wild water bird species while the Class II viruses
predominantly genotype I infect wildlife with the remaining genotypes known as the
pathogenic viruses infecting poultry (Czegledi et al., 2006; Kim et al., 2007b; Liu et al.,
2010).
In Australia, the NDV strain V4 (Queensland V4) was isolated from chickens and has
been identified as Class II genotype I. This virus is likely to have been transmitted to

52
chickens from wildlife and it was shown to be extensively distributed throughout the
chicken population. Additional isolates of Class II NDV were reported (Kim et al.,
1978; Spradbrow et al., 1995).Ssubsequently other Australian viruses were also
recognised in water wild birds those were isolated in Victoria (VIAS 6 to 10), WA
(wa1886 and wa2116) and MOURA Qld (Moura 1 and 2) in 1992. However those other
Australian viruses were classified as NDV Class I.
Then, based on the phylogenetic and pathotyping studies performed by previous studies
(Gould et al., 2003; Czegledi et al., 2006; Kim et al., 2007a; Kim et al., 2007b; Kim
et al., 2008) , this project were conducted to sequence part of the F gene of the six
Australian NDV isolates and predict theirs phylogeny and pathotypes.
5.3 Aims
The specific aims of this project are as follows:
1. Determine the sequence of the F gene of six Australian NDV isolates used as
reference isolates in this study and compare these sequences with the published
sequences of reference viruses.
2. Predict the amino acid sequence of the cleavage site and compare with reference
viruses
5.4 Materials and Methods
5.4.1 Viruses
The ND virus isolates in this study were Class II NDV isolates (V4, FP1, AP1, SP3),
and Class I NDV isolates (WA Domestic Duck Isolate 3245 and Ibis Queensland which
were outlined in Chapters 3.1.1 and 3.1.2). These viruses were propagated as described
in Chapter 3

53
5.4.2 GenBank Sequences
ND viral sequences used in this study obtained from GenBank. The accession numbers
of the GenBank sequences can be seen in the figure of the phylogenetic tree later in this
Chapter.
5.4.3 Primers
Primers were used in this study were designed using AlleleID (Premier Biosoft)
The Fusion gene Primers for Class I isolates were based on the sequences of WA
Domestic Duck Isolate 3245 (Alexander et al., 1986) and Ibis Queensland and the
resultant sequence corresponded to sequences around the NDV F protein cleavage site,
similar to the published primers (Collins et al., 1998; Stanislawek et al., 2002). The pair
of primers was forward primer F302 (5’-AGGACGCTTACAACCCTCC-3’) and
reverse primer F596r (5’-CTGCATCTTACCTACGGCAAC-3’) resulting in a 294 bp
product.
The M gene primers for Class I were designed using aligned sequences. These
sequences were accessed from Gen Bank with accession numbers AY626266,
AY626267, AY626268, and DQ097393. These primers were forward -M2-F
5’-CGTTTACAAGATTCCAACCGCAGC-3’and reverse -M2-R
5’-GCGAGTGCTTACTTCTTGAACGGG-3’ which amplified a 549 bp product.
Amplification of F sequence of Class II isolates was performed using forward primer
F343 F 5’-CCCAAGGATAAAGAGGCGTCTGC-3’ and reverse primer
F343-R 5’-GCTGCATCTTCCCAACTGCCAC-3’ which amplified a 343 bp product.
5.4.4 Reverse transcriptase PCR
Conventional Reverse transcriptase PCR was performed using One Step RT PCR and
two step RT-PCR kits. Qiagen One Step RT-PCR (Catalogue No. 210210) was used in
one step RT-PCR. The two-step RT-PCRs used Maloney Murine Leukaemia Virus
(MMLV) Reverse Transcriptase with low RNase H activity (BioScript-Bioline
catalogue No. BIO-27036) or RevertAidTM First Strand cDNA Synthesis kit (catalogue
no. #K1622) for cDNA production while Fermentas, RBC Taq Polymerase or RBC

54
polymerase (RBC Bioscience, catalogue no. RT001) were used for PCR amplification.
The Reverse Transcriptase PCR was described in Chapter 3.6.3
5.4.5 PCR product analysis and purification
All the PCR products were analysed by agarose gel electrophoresis utilising 2.5% w/v
Agarose Standard low EEO Applichem (CAS No. 9021-36-6) as described in
Chapter 3.6.4
Purification of PCR products was performed using Real GenomicsTM (Real Biotech
Corporation) kits, HiYieldTM Gel/PCR DNA Extraction (catalogue no. YDF100) as
described in Chapter 3.6.5
5.4.6 Sequencing
The PCR products and purified PCR products were sent to Macrogen, South Korea to
attain the targeted sequences as described in Chapter 3.6.6. ContiqExpress Project,
Vector NTI Advanced 10 (Invitrogen), and Sequencher version 4.7 (Gene Codes
corporation, USA) were used to assemble the sequences. Then, Sequences were
compared to the sequences in Gen Bank database using BLAST. Sequence alignment
and phylogenetic tree was performed using GeneDoc and Mega 4
5.5 Results
5.5.1 ND Fusion and matrix gene detection for Class I isolates
A 294 bp product from the F gene of Class I viruses was amplified by the
F302 and F596r primers (Stanislawek et al., 2001) while the M gene was amplified by
the M2 primers to produce a 549 bp product (Figure 5.4)

55
Figure 5.4 Gel electrophoresis analysis of PCR products of Class I NDVs. M gene was
amplified using NDV-Duck- M2 while Fusion gene was amplified using F302 and F596r primers.
5.5.2 ND Fusion gene detection for Class II isolates
A specific 343 bp PCR products of the F gene of NDV Class II isolates was produced as
outlined in Figure 5.5. These primers also reacted with the Class I isolates. However,
the amount of PCR product appeared to be much less (Figure 5.5).
Figure 5.5 Gel electrophoresis analyses of the fusion gene of Class II isolates amplified using the F343 Fusion primers

56
5.5.3 Sequences Analysis
The analysis of the alignment of the sequences confirms that there are two distinct
groups of isolates with the Class I isolates (3245 and the Ibis) clustering together and
the Class II isolates (V4, AP1, FP1, and SP3) clustering together. Within the class two
viruses, V4 and FP1 formed a cluster with AP1 and SP3 forming the other cluster
(Figure 5.6).
Figure 5.6 Alignment view of the fusion gene of six ND isolates including the Class I Duck
Isolate WA 3245 and Ibis and Class II V4, AP1, FP1, and SP3. Analysis to the Fusion sequences around the cleavage site confirmed that all of these six
NDV isolates were lentogenic strains with motif of cleavage site of S-G-G-E-R-Q-E-R-
L-V for the Class I WA 3245 (referred to as D1) and S-G-G-E-Q-Q-G-R-for the Ibis
isolate. The Class II viruses (V4, AP1, FP1, and SP3) all had S-G-G-G-K-Q-G-R-L-I.
(Figure 5.7).
Figure 5.7 Amino acids translation of Fusion gene sequences of six Australian Newcastle
disease viral isolates A phylogenetic analysis of the F gene sequences indicates that the Australian Class I
isolates cluster with other Class I isolates and that the Class II isolates clustered in the
Class II genotype 1 cluster. Within the Australian isolates there are three separate
clusters with V4 and FP1 being in one cluster and AP1 and FP3 clustering with the I2

57
vaccine. The third clusters of Australian isolates are the pathogenic isolates or their
progenitors (Figure 5.8).
Figure 5.8 Phylogenetic trees of NDVs in Class I and II. Sequence was aligned using ContiqExpress Project, Vector NTI Advanced 10 (Invitrogen). The Neighbour-joining algorithm (MEGA-5) was used to generate the initial tree. The analysis involved 38 sequences. There were a total of 263 positions in the final dataset.
AY935498 Schofields NSW Aug 99 Virulent..
AY935490 Meridith Vic Aug 2002 Virulent..
AY935494 Mangrove Mountain Apr 99 Virulent..
AY935492 Dean Park NSW Sep 98 Virulent..
AY935493 Dean Park NSW Sep 98 Virulent..
AY935496 Somersby NSW Jul 99 Progenitor..
AY935497 Peats Ridge NSW Aug 99 Progenitor..
AY935491 Mangrove Mountain Sep 98 Progenitor..
AY935495 Somersby NSW Jul 99 Progenitor..
AY935489 NSW Jul 2001 Progenitor..
V4 F Chicken Qld As at Sep 2009..
FP1 F Chicken NSW As at Sep 2009..
AF217084 NDV Class 2 Gen 1 (V4/AUS(QLD)/66).
M24693 NDV Class 2 Gen 1 (Chicken/V4/AUS(QLD)/66).
AY935499 I2 Vaccine..
AY935500 I2 Progenitor..
AP1 F Chicken NSW As at Sep 2009..
SP3 F Chicken NSW As at Sep 2009..
M24696 NDV Class 2 Gen 2 (Chicken/LaSota/46).
AF077761 F NDV Class 2 Gen 2 (LaSota).
M24700 NDV Class 2 Gen 3 (AUS/32).
AY508514 NDV Class 2 Gen 9 (StrainF48E9).
EF201805 F NDV Class 2 Gen 3 (Mukteswar).
AY741404 F NDV Class 2 Gen 4 (Chicken/Herts/33).
AY562987 F NDV Class 2 Gen 5 (Gamefowl/US(CA)).
AF048763 NDV Class 2 Gen 8 (StrainAF2240/Malaysia).
AF378252 NDV Class 2 Gen 8 (Chicken/QH 4/85).
Z12111 NDV Class 2 Gen 6e (US(CA)).
AY390291 NDV Class 2 Gen 6 (Pigeon/PB9601).
DQ439884 NDV Class 2 Gen 6b (NDV05 027).
DQ486859 F NDV Class 2 Gen 7 (StrainGM/China).
AF358788 NDV Class 2 Gen 7 (Chicken strain/China/2000).
EF564813 NDV Class 1 Gen 4 (Green winged teal/US(AK)/98)..
EF564820 NDV Class 1 Gen 7 (Mallard/US(MD)/04)..
DQ097393 F NDV Class 1 Gen 2 (Strain DE R49/99)..
EF564831 NDV Class 1 Gen 8 (Ruddy turnstone/US(DE)/04)..
NDV 3245 (D1 WA) Class 1 Sep 2009.
Ibis 249 Class 1 Queensland 2006.
42
96
95
63
100
100
93
100
93
43
75
86
51
26
53
57
86
99
99
72
96
31
72
52
60
85
46
83
28
47
42
44
0.05
Class 1 Type virusesand reference viruses
Class 2 Genotype 1Outbreak viruses
Class 2 Genotype 1V4 cluster
Class 2 Genotype 1I2 cluster
Class 2 Type viruses

58
5.6 Discussion
Both M and F genes of the six Australian reference viruses were amplified and
sequenced. Analysis of the sequences confirmed that they were appropriate as reference
viruses representing the two Classes (1 and 2) of NDV.
The four Class II viruses which were all isolated from chickens clustered in the
genotype 1 cluster and this is suggestive that they all were derived from wildlife. It is
reasonable to speculate that they were transmitted to chickens through close contact.
Their role in respiratory diseases in chickens is not clear as they all appeared to be of
low pathogenicity. They cluster with the two vaccine viruses V4 and I2 which are
regarded as either apathogenic or lentogenic (Gould et al., 2003; Kattenbelt et al.,
2006a)

59
CHAPTER 6
EVALUATION OF TRANSPORT BUFFERS FOR COLLECTION AND TRANSPORTATION OF SAMPLES
WITHOUT A COLD CHAIN
6.1 Introduction
The investigation of AI outbreaks and NDs cases in many developing countries requires
collection of samples. These samples must be transported to nearby laboratories to
diagnose these diseases rapidly. However, obtaining good quality viable samples of
AIV and NDVs can present significant problems and challenges. Therefore, effective
sample collection and transport protocols can significantly improve the quality of the
diagnostic outcome (Webster et al., 2002).
Many developing countries have inadequate infrastructure to diagnose the diseases
accurately. Delays and misdiagnosis reduce the effectiveness of prevention and control
of AI virus outbreaks in Southeast Asia particularly in Indonesia in 2003. Improvements
to transportation of samples to diagnostic and reference laboratories are required.
However, the transportation of live viruses can be problematic as there can be loss of
viability during transit and the movement of live viruses can be subject to quarantine
restrictions. Therefore it is crucial to develop an integrated system of sample collection
and transportation that overcomes these limitations.
Transportation of samples to overseas reference laboratories faces restrictions. Some
countries do not allow the importation of infectious agents such as AI viruses. Therefore
an integrated system of sample collection and safe transport will overcome the
quarantine issues.

60
6.2 Literature Review
6.2.1 Collection and transportation of viruses with a cold chain
Viral transport media consists of isotonic solutions with protective proteins, antibiotics
and buffers to control the pH. For instance Stuart transport media, Eagle MEM, Hanks
BSS and tryptic soy broth are used for viral transport. These buffers maintain the
survival of the viruses. However, different viruses have a different stability. Long
distance of transportation and ambient temperature influence viral stability. Therefore, it
is necessary to maintain the stability and infectivity of the viruses (Johnson, 1990).
Both AIV and NDV are thermo sensitive and the viruses can deteriorate when exposed
to high temperatures. Light exposure especially UV may also affect the virus. It is
recommended that samples collected for transport to a diagnostic laboratory be stored
under refrigeration or in dry ice. This requires the establishment of a cold chain. It is
also important to transport the samples to other laboratories as speedily as possible.
However, it is difficult to maintain viral stability and infectivity in delivering samples to
distant diagnostic laboratory or overseas reference laboratories. Therefore it is crucial
that techniques to be developed that do not require a cold chain.
6.2.2 Collection and transportation of viruses without cold chain
There were many treatments to process the virus without a cold chain. For instance,
viruses can be treated with chemical solution such as -propiolactone, Binary
ethylamine, and formalin (Scodeller et al., 1984; Perrin and Morgeaux, 1995; Sagripanti
et al., 2011). Heat treatment is also a choice. This treatment is aimed to inactivate
viruses in the field samples such as blood, serum, as well as cloacal and tracheal swabs.
Viral inactivation will reduce the risk and eliminate the hazard of suspected materials
from agent of diseases such as AIV or NDVs. However, some chemical solutions can
harm the viruses. They may be harmful to humans and they may be toxic. (Johnson,
1990; King, 1991).
Diagnosing viral nucleic acid from clinical samples requires not only an appropriate
viral inactivation but also nucleic acid separation. Nucleic acid detection frequently is
inhibited by molecules in clinical samples. These molecules inhibit the enzymes which

61
are required to separate and amplify the viral nucleic acids. Indeed, it is important to
remove the nucleic acid inhibitors. This inhibitor removal can be achieved by using
appropriate extraction reagents and suitable buffers. However, even though many
commercial viral extraction kits are available nowadays, some of the kits still fail to
effectively remove the nucleic acid inhibitor and result in a poor yield of extracted
RNA. Therefore, this study evaluated suitable buffers that could be integrated with
sample collection, transportation and RNA extraction.
6.2.3 Important criteria for buffers to be used for the collection and transportation of samples without a cold chain
A suitable buffer for AIV and NDV collection and transportation has to meet specific
criteria. Firstly, the buffer should be simple and effective. Simple means that the buffer
requires no specialised or additional equipment to use the buffer. Effective means that
the buffer should be integrated in the RNA extraction protocol methods. This protocol
should be sensitive, rapid and reproducible. Secondly, the buffer should not only
preserve RNA and inhibit RNase but also inactivate the infectivity of the virus. Heat
stability is also an important criterion of a suitable buffer. Moreover, an appropriate
buffer should allow enzymatic modification for nucleic acid purification. Finally, the
risk of transmission to personnel and other samples must be small (Boom et al., 1990)
6.2.4 Chemical components of buffers
A stable buffer is produced by mixing chemical components. There are many chemical
components that have been used to stabilize the buffer including detergents, proteolytic
enzymes, chaotropic agents, RNase inhibitors, and RNA carriers
6.2.4.1 Detergent and chelating agent
Detergent can disrupt cells and separate membrane proteins off the cells. This is
achieved by interrupting the hydrophobic association and destroying the lipid bilayer
(Albert et al., 2004). One of the important detergents is Sodium Dodecyl Sulphate
(SDS). SDS solubilises and denatures proteins by disrupting the cell membrane (Clark,
2005; Turner et al., 2005). However, disrupting extracellular matrix requires chelating
agents to remove the binding components in outer membranes. These chelating agents
such as ethylene diamine tetraacetate (EDTA) chelate the Ca2+ on cell-cell adhesion to
allow the cell separation (Albert et al., 2002).

62
6.2.4.2 Proteolytic enzymes
Proteolytic enzymes are also required to support the detergent. Proteolytic enzymes may
break down proteins into their basic amino acids and in doing so will also destroy
enzymes such as RNase and DNase (Clark, 2005). Proteinase K is a commonly used
proteolytic enzyme and it is an endolytic protease which cleaves peptide bonds and
eliminates DNases and RNases. (Brown, 1995)
6.2.4.3 Chaotropic agents
Chaotropic agents are broadly used in RNA extraction. Chaotropic agents cause the
molecular structure to be disrupted and dissolved. Then, the disruption and dissolving of
proteins releases the nucleic acids. These chaotropic agents destabilize protein by
disrupting water composition and allow hydrophobic groups to dissolve (Clark, 2005).
Also, chaotropes can lyse the cells and inhibit nucleases and proteases. These agents
provide hybridization stringency to the target analyte without altering the target
chemically (Ness and Chen, 1991).
The commonly used chaotropic agent is guanidine. Guanidine is a crystal compound
with strong alkalinity due to guanine oxidation. Guanidium hydrochloride and
Guanidium isothiocyanate (GuSCN) are common chaotropic agents which have shown
to be effective in the purification and detection of RNA and DNA due to their potential
to lyse cells(Boom et al., 1990). Guanidine chloride destroys the three dimensional
structure of proteins. Guanidinium chloride or aminoformamidine chloride is the first
guanidinium salt to be used as an agent of deproteinization. However, guanidinium
chloride is not powerful enough to denature proteins and extract the intact RNA from
tissue which rich in RNase. Therefore, guanidinium isothiocyanate is used to effectively
extract RNA from RNase rich tissue (Sambrook and Russel, 2001).
Guanidinium isothiocyanate is a stronger chaotropic agent. It can also reduce and break
disulphide bonds and prevents cationic and anionic groups forming strong hydrogen
bonds (Sambrook and Russel, 2001). This chaotropic agent will not only lies the cells
but also rapidly inactive ribonucleases (Brown, 2000).

63
6.2.4.4 RNase Inactivator
RNase inactivators can inhibit the degradation of RNA by RNase and improve the
recovery of RNA from a sample (Almarza et al., 2006). Indeed, RNase inhibitor can
prevent the inevitable loss of RNA that can be associated with the disruption of cells
(Chirgwin et al., 1979).
There are many RNase inhibitors commonly used to keep the activity of RNases such as
Diethylpyrocarbonate (DEPC) and protein inhibitors of RNases. DEPC is an alkylating
agent to inactivate RNases in buffers and on glassware. Protein inhibitors of RNases
also inhibit RNases which bind tightly in the cytoplasm of virtually all mammalian
tissues. However, DEPC and Protein inhibitors of RNases not only inhibit the RNases
but also modify protein and nucleic acid or RNA (Chirgwin et al., 1979; Sambrook and
Russel, 2001). However, several manufactured sources of protein inhibitors of RNases
cannot be used in the presence of denaturants such as SDS and guanidine due to lack of
covalent complexes with RNases (Sambrook and Russel, 2001).
Another RNases inactivator is Dithiothreitol (DTT). DTT is a protective reagent for SH
groups resulting in oxidation in air and reduction of disulfide bonds in proteins. In the
presence of DTT, RNase is inhibited and ubiquitinated. DTT reduces disulfides in
MetSO-RNase and maintains the essential sulfhydryls of some ubiquitinating enzymes
which is important in causing intracellular protein degradation.(Dunten and Cohen,
1989). Also, DTT can be used with guanidine to reduce disulphide bonds (Chirgwin
et al., 1979).
6.2.4.5 Carrier RNA
The amount of purified nucleic acid attained from the nucleic acid extraction process is
important for the accuracy of the diagnosis of disease agents. Nucleic acid extraction
can be effectively carried out from diagnostic samples. However, there may only be
very low yields of RNA which can easily be degraded. The addition of carrier RNA will
provide an additional substrate for RNases and in turn stabilise the extracted RNA.

64
Many carriers have been used such as molecules, glycogen and RNA. Poly-A
RNA/Salmon sperm DNA and tRNA are commonly used. (Kishore et al., 2006).
6.2.5 Integration of transport buffer with nucleic acid extraction protocol
It is vital that the transport buffer be integrated with the RNA extraction protocol.
In this study, a range of suitable buffers that would be integrated with the nucleic
extraction protocol from Corbett Robotics (Prototype kits) or Sigma chemicals
catalogue Number XTRV, XTR1 or XTR2 was evaluated.
6.3 Aims
The specific aims of this project are divided into three parts as follows:
6.3.1 Pilot project
The pilot project aimed to evaluate four suitable buffers (Corbett Research, Australia)
and select two buffers for further evaluation.
6.3.2 Definitive study
The definitive study aimed to evaluate the two chosen buffers and compare their ability
to preserve the RNA using several replicates and statistical analysis.
6.3.3 Viral viability verification
The aim of viral viability verification is to confirm that the chosen buffers were able to
inactivate viruses and in turn ensure the safety of the transport of samples. This was
vital as the samples would need to be imported into Australia consistent with the
policies of AQIS.

65
6.4 Materials and methods
6.4.1 General Methods
6.4.1.1 Viruses
AI virus H4N4 and NDV V4 were used in this experiment. They were considered to be
representative of the target viruses. The details of these viruses are described in Chapter
3.11 and 3.1.2. The H4N4 and V4 viruses were propagated in allantoic fluid of 10-day-
old chicken embryos as described in Chapter 3.2.
6.4.1.2 Buffers
Buffers were used in this study are the commercial buffers contained in the Corbett
X-tractor pack (part no. XTR1, XTR2, and XTRV) at the time of the project produced
by Corbett Robotic, Brisbane, Australia. The evaluated buffers were solid tissue digest
buffer (STDB) (part no.Q3883, lot no 035K6168) with Digestion Buffer Additive
(DBA) (part no 3508), lysis buffer (LB) (part no. C0616, lot no 035K6045) with LB
Additive (part no Q3633), Viral Binding Buffer (VBB) constructed from Lysis buffer
plus additional ethanol (part no C0616, lot no 035K6045 and sigma part no E7023),
Liquid Sample Digest Buffer (LSDB) (part no B5810, lot no 035K6142).
STDB contained SDS, NaCl, Tris HCl, and EDTA while Digestion Buffer had
additional Proteinase K. LB contained Guanidium Thiocyanate, Tris HCl, EDTA and
Triton. Lysis buffer Additive which was composed of DTT was added to LB while
Viral Binding buffer consisted of the Lysis buffer with additional ethanol but without
DTT. The last evaluated buffer was Liquid Samples Digest buffer which contained Tris
HCl, Guanidine HCl, EDTA, Tween 20 and Triton X100.
Buffers were used this study were as described in Corbett Protocol for the Viral
RNA/DNA Purification Protocol Beta Test kit for the X-tractor GeneTM (CorProtocolTM
No.25101 Version 01), Whole Mammalian Tissue DNA Extraction Protocol X-tractor
GeneTM (CorProtocolTM No.14201 Version 04) and Universal Liquid Sample Protocol
X-tractor GeneTM (CorProtocolTM No.14104 Version 01).

66
6.4.1.3 Design of the study
Viruses in allantoic fluid were processed in the commercial buffers as described above
(Chapter 6.4.2). This laboratory experimental study used a factorial design with three
levels of factors of treatments. The first level was buffer modification. The buffer
modification was also generated with or without additional RNA carrier. The second
factor was time and the third level was temperature.
A storage experiment for sample collection and transportation was performed in two
steps. Firstly a preliminary study was carried out and this was followed by a definitive
study using two selected buffers.
The quality of buffers was evaluated by measuring the amount of viral RNA in each
sample. The assays used were an RT-PCR using SYTO-9 and expressed as Ct values.
6.4.1.4 A SYTO 9 RT-qPCR
RT-qPCR assay based on SYTO 9 was performed to determine the ability of buffers to
preserve viral RNA. Viruses preserved in the selected buffers were extracted using the
procedure described in Chapter 3.6.1. Then, an RT-qPCR assay based on SYTO 9 was
performing as described in Chapter 4.
Two sets of primers were used in the RT-qPCR assays. The NDV RT-qPCR used the
Class II M primers - forward primer 5’-AGTGATGTGCTCGGACCTTC-3’ and
5’-CCTGAGGAGAGGCATTTGCTA-3’ reverse primer (Wise et al., 2004) while the
AI H4N4 isolate was detected using AI M primers: forward primer 5’-
AAGACCAATCCTGTCACCTCTGA-3’ and
5’-CAAAGCGTCTACGCTGCAGTCC-3’ reverse primer (Ward et al., 2004). Full
information of the primers is outlined in Chapter 3.6.2
6.4.2 Pilot Project
A preliminary study was performed to eliminate the buffers which were least effective.
This study was carried out to select two buffers which appeared to be most effective in
preserving the RNA.

67
The preliminary study used three factorial levels of treatment including buffers,
temperature and times.
The first level of the treatment was the buffers. Four buffers including STDB with
Proteinase K, LB with DTT, LB with ethanol or known as VBB and Liquid Samples
Digest Buffer were used. These four buffers were evaluated with and without carrier
RNA.
The second level was temperatures. In this preliminary study, two temperatures were
chosen: room temperature (25-27°C) and 37°C.
The third and last factor was times. In this pilot project the processed allantoic fluids
containing either NDV V4 or AI H4N4 were stored for 1 day, 1 week and two weeks.
As this was a preliminary study only one replicate used for each level of treatments.
6.4.3 Definitive Study
It was noted that the carrier RNA consistently improve the stability of the stored RNA
and two buffers containing carrier RNA were chosen for the definitive study. This study
had three replicates each treatment and was extended to include a four-week
observation. The Ct-values were recorded and used a statistical analysis.
6.4.3.1 Data Analysis
Data analysis was performed in definitive study using Ct-Values of the RT-qPCR assay.
The data were generated from 16 observations with three replicates which totalled
48 data points. The data were analysed using the statistical package SPSS 14.0. The
probability of Ct-value of treatments were compared and significance was set at a
p-value of <0.05

68
6.4.4 Viral Viability Verification
The titre of the AI and ND viruses expressed as EID50 of were measured as described in
Chapter 3.5
Samples treated with the optimised buffer were inoculated into 10-day-old embryonated
SPF eggs. Potentially the buffer could also be toxic for the embryos. This was
determined by inoculating dilutions of the buffer into the allantoic cavity of 10-day-old
embryonated eggs. Buffers as well as the stored samples in buffer were diluted as
appropriate using PBS.
The embryonated eggs were incubated at 37°C and candled every day to confirm the
embryonic viability. Allantoic fluid from the inoculated eggs was harvested and
checked for HA activity and where necessary a serial passage was carried out to
determine whether the allantoic fluid contained viable virus.
6.5 Results
6.5.1 Pilot Project
Evaluation of the four Corbett buffers as described in 6.4.2 after two weeks storage is
shown in Figures 6.1 and 6.2.
The NDV RNA was best preserved in STDB and LB. The Ct values for the VBB and
Liquid Samples Digest Buffer were higher suggesting that there was a lower titre of
viral RNA (Figure 6.1). The difference is two to five cycles. Every three cycles is
equivalent to approximately a tenfold difference in RNA titre.

69
Figure 6.1 Quantitation analyses of NDV V4 RNA in four different buffers: STDB, LB, VBB, and LSDB. The data was produced for cycling A green at gain 5 and threshold 0.005 with reaction efficiency threshold 3%. The quantitation analysis was run on software version RotorGene 6.0.38. The colours indicate the buffer: 1). Red as STDB, 2). Green as LB, 3). Blue as VBB and 4).Yellow as LSDB. NTC stands for No Template Control.
Similarly, the preliminary storage experiment using AIV H4N4 resulted in better
preservation in the STDB and the LB (Figure 6.2) which is consistent with the results
obtained the NDV V4.
Figure 6.2 Quantization analysis of AI H4N4 RNA in STDB, LB, VBB, and LSDB buffers. The data was analysed at a threshold 0.005 with reaction efficiency threshold 3%. The quantitation analyses was run on software version RotorGene 6.0.38 with channel cycling A green at gain 5. The colours indicate the buffer: 1). Red as STDB, 2). Green as LB, 3). Blue as VBB and 4).Yellow as LSDB. NTC stands for No Template Control.

70
6.5.2 Definitive Study
Based on the observations in the preliminary study the two buffers STDB and LB were
evaluated.
The results of storage of NDV V4 RNA for four weeks at 25°C and 37°C are shown in
Figure 6.3. There was a rise in Ct value between the 25 °C and 37°C treatments.
However, this is still relatively small and it can be concluded that both of these buffers
were able to stabilise the NDV RNA for at least a month at 37°C.
Figure 6.3 Quantization analysis of viral RNA V4 processed in STDB and LB at 25°C and 37°C. The normal fluorescence of SYTO 9 was performed in Cycling A green at a gain 5 and quantified at threshold 0.005. The quantitation analysis was run on software version RotorGene 6.0.38. The colours indicate viral RNAs were treated in: 1). STDB at 37°C (Red), 2). STDB at 25°C (yellow), 3). LB at 37°C (blue), 4). LB at 25°C (green)
Similar results were observed in the AIV H4N4 with both buffers stabilising the viral
RNA and minor difference being observed between the two temperatures of 25°C and
37°C (Figure 6.4).

71
Figure 6.4 Quantization analysis of AIV H4N4 RNA in STDB and LB at (25°C and 37°C).The
Ct-Values were analysed at a threshold 0.005, with efficiency threshold 3%. Cycling A green with gain at 5 were used in measure the amount of normal fluorescence emitted by DNA binding dyes SYTO9. The colours indicate viral RNAs were treated in: 1). STDB at 37°C (Red), 2). STDB at 25°C (yellow), 3). LB at 37°C (blue), 4). LB at 25°C (green)
6.5.2.1 Statistical Analysis
6.5.2.1.1 Analysis of Ct-Values of PCR products of viral RNA NDV V4
Ct-Value data of PCR product of viral RNA V4 measured in RT-qPCR after storage in
the two buffers were analysed statistically using Univariate Analysis of Variance
(ANOVA). Statistical analyses of the data are shown in Figure 6.5. No significant
difference was determined that the two buffers (ρ-value = 0.836)
Figure 6.5 The mean of Ct-Values of NDV V4 RNA preserved in STDB and LB analysed with
ANOVA. Significance were set at ρ-value of <0.05 Statistical analysis to the Ct-value of RT-qPCR of NDV V4 viral RNA stored in the two
buffers at different times of storage is shown in Figure 6.6. No significant differences
CT Value of V4 viral RNA's processed in 2 buffers
6.5375
6.6014
6.466.486.5
6.526.546.566.586.6
6.626.64
Solid Tissue DigestBuffer
Lysis Buffer
Buffers
CT
Val
ue
Mean

72
were determined (ρ-value = 0.083) at 1 day, 1 week, 2 weeks and 4 weeks of storage
time.
Figure 6.6 The mean Ct values of NDV V4 RNA at four different times analysed with ANOVA with significance at ρ-value of <0.05 It can be seen from Figures 6.5 and 6.6 that the solid tissue digests buffer slightly outperformed the lysis buffer and there was a gradual decrease in titre with time. However, the differences are not significant. It can be seen also from Figure 6.5 that the two buffers have preserved viral RNA V4
effectively for four weeks. There was a gradual decline of titre with time.
Further analysis compared room temperature and 37° and there is a significant
difference in the Ct values (ρ-value = 0.021) (Figure 6.7).
Figure 6.7 The mean of Ct-Value of NDV V4 RNA in the two buffers with a comparison between storage at 25°C and 37 °C.
However, the difference in Ct-value while statistically significant was still relatively
small and the overall results suggested that both of the buffers were able to preserve the
NDV V4 RNA for at least a month and this would be sufficient to detect the viral RNA
in clinical samples.
CT Value of V4 in different times processed in 2 buffers
6.83456.698
6.3791 6.3389
5.8
6
6.2
6.4
6.6
6.8
7
1 day 7 days 14 days 28 days
Times
CT V
alue
Mean
CT Value of V4 in different temperatures processed in 2 buffers
6.7667
6.4165
66.16.26.36.46.56.66.76.86.9
7
25°C 37°C
Temperatures
CT V
alue
Mean

73
CT Value of H4N4 in different times processed in 2 buffers
8.535
9.2278 9.1227
9.6367
7.5
8
8.5
9
9.5
10
1 day 7 days 14 days 28 days
Times
CT V
alue
Mean
6.5.2.1.2 Analysis of -values of PCR product of viral RNA AI H4N4
Ct-Value data for the storage experiments of AI H4N4 viral RNA were analysed
statistically using the Kruskal-wallis and Mann Whitney Test.
A significant difference was noted for the two buffers with solid tissue digest buffer
having a significantly lower Ct value than the lysis buffer (ρ-value = 0.008)
(Figure 6.8). Further details are available in Appendix 6.4.
Figure 6.8 The mean of Ct-Value of H4N4 viral RNA processed in two different buffers, STDB and LB. The data were analysed using the Kruskal-wallis and Mann Whitney Test with significance level at ρ-value of <0.05
The data analysis indicates that the Ct-value increased over the four weeks of storage.
However, no significant differences were determined (Figure 6.9).
Figure 6.9 The mean of Ct-Values of AI H4N4 RNA preserved in STDB and LB over the four weeks of the experiment analysed with Kruskal-wallis and Mann Whitney Tests with significance level at ρ-value of <0.05
While there was an increase in Ct-value between the 25°C and 37°C observations this
difference was not significant (ρ-value = 0.087) (Figure 6.10).
CT Value of H4N4 viral RNA's processed in 2 buffers
8.6586
9.5895
7.5
8
8.5
9
9.5
10
Solid Tissue Digest Buffer Lysis Buffer
Buffers
CT V
alue
Mean

74
Figure 6.10 Ct-Value means of processed viral RNA V4 in STDB and LB at the two temperatures. The data was analysed using Kruskal-wallis and Mann Whitney Tests with a significance level at ρ-value of <0.05
It was therefore concluded that either of the buffers were capable of preserving AI RNA for up to 4 weeks at 37° with minimal loss in titre.
6.5.3 Viral Viability
Measurement of the titres of the two viruses expressed in egg infectious doses 50
indicated that at the commencement of the experiment the NDV V4 allantoic fluid
contained EID50 108.75 /ml and the AIV H4N4 had a titre of EID50 106 /ml.
Undiluted LB plus DTT killed embryos on day 1 after inoculation. Some embryos also
died after being inoculated with the10-1 dilution. Embryos inoculated with more dilute
samples remained viable. It was concluded that death of embryos inoculated with
allantoic fluid in undiluted or 10-1 dilution of lysis buffer would not be a reliable
indication of viable virus.
In contrast embryos inoculated with undiluted STDB plus Proteinase K died within
24 hours but the embryos inoculated with the 10-1 dilution all remained viable.
Embryos inoculated with NDV V4 diluted in solid tissue digests buffer in most cases
remained viable. However, passage of the allantoic fluid clearly indicated that this
buffer had failed to completely inactivate the virus.
The lysis buffer killed the embryos inoculated with undiluted buffer. All of the other
embryos remained viable and no live virus was demonstrated.
CT Value of H4N4 in different temperatures processed in 2 buffers
8.7695
9.4786
88.28.48.68.8
99.29.49.69.8
25°C 37°C
Temperatures
CT
Val
ue
Mean

75
Embryos inoculated with AIV H4N4 dilute it in solid tissue digests buffer all remained
viable and no HA was detected on serial passage.
The AIV H4N4 stored in lysis buffer killed the embryos at the first dilution and the
remainder of embryos remained viable. No live virus was demonstrated (Table 6.1).
It was concluded that while both of these buffers were able to preserve both NDV and
AIV stored for four weeks at 37°C some viable virus could be demonstrated in the solid
tissue digests buffer indicating that it failed to completely inactivate all of the virus.
Whereas LB inactivated both NDV and AIV.

76
Table 6.1 Verification of the viability of the two viruses stored in solid tissue digests buffer or lysis buffer. Stored viruses were inoculated into 10-day-old embryonated eggs which were checked for viability and the allantoic fluid screen for HA activity.
Virus Buffer Embryos after 4 days post inoculation HA test (HA titre) HA test (2nd passage)
Undiluted Diluted Undiluted Diluted Undiluted Diluted (101 ) (102) (10-1) (10-2) (10-1) (10-2)
NDV V4 STDB Dead & Live Live Live 29 to 210 210 29 to 210 29 to 210 29 to 210 29 to 210 LB Dead Live Live Neg Neg Neg Neg Neg Neg
AI H4N4 STDB Live Live Live Neg Neg Neg Neg Neg Neg LB Dead Live Live Neg Neg Neg Neg Neg Neg

77
6.6 Discussion
Integrated systems for the collection, storage, transport and extraction of viruses capable
of causing disease in domestic and wild animals are important for both developed and
developing countries. In developing countries is extremely important that these
transport systems do not require a cold chain. If samples are to be sent to reference
laboratories in developed countries it is vital that there is minimal quarantining risk for
the receiving country.
Laboratory proficiency programs are vital to maintain expertise and diagnostic
capabilities in laboratories (Gilbert and Patey, 1998). The ability to send samples
without a cold chain with minimal risk to quarantining significantly improves these
quality assurance and proficiency programs.
Preservation of RNA is much more difficult than DNA as it is more susceptible to
degradation and is very sensitive to minor changes in pH, temperature and exposure to
heavy metals. The sources of ribonucleases contamination can be exogenous and
endogenous ribonucleases. Exogenous ribonuclease contamination resulted from
careless and aseptic techniques, finger grease, airborne bacteria or fungus and dust
particles while endogenous ribonuclease resulted from cells and tissue (Sambrook and
Russel, 2001; Kudlicki et al., 2007).
The preliminary study indicated that some of the buffers were less efficient than others
at preserving the viral RNA. The LSDB and VBB appear to be less efficient than the LB
and STDB.
Guanidine hydrochloride (GnHCl) is a denaturing and solubilising agent for proteins.
GnHCl has an ability to abolish the non-covalent inter- and intramolecular interaction of
polypeptide chains. Related to this ability, guanidine hydrochloride has been also used
as a tool for determining the molecular weight of oligomeric protein subunits (Ullmann
et al., 1968). Moreover, GnHCl is able to unfold ribonuclease (Greene and Pace, 1974).
However, guanidine hydrochloride has about 2.5 fold less effectiveness on a molecular
basis than does guanidine thiocyanate as an equilibrium denaturant. (Chirgwin et al.,
78
1979). Consequently, LSDB preserved viral RNA of AI and ND less than others
buffers.
Guanidine isothiocyanate is a stronger denaturating agent compared with guanidine
hydrochloride (Chirgwin et al., 1979).
The preliminary experiment confirmed this finding and that the buffer containing
guanidine isothiocyanate appeared to be more effective at preserving the RNA than the
buffer containing guanidine hydrochloride.
The ability of guanidine isothiocyanate to preserve the viral RNA was improved in the
presence of DTT which has the ability to reduce disulphide bonds (Chirgwin et al.,
1979; Basehore, 2006). However, DTT can react with the thiocyanate anion to produce
hydrogen sulphide and a green colour (Chirgwin et al., 1979).
Ethanol and DTT can be mixed with guanidium isothiocyanate. This combination is
called Nuclease inhibitor cocktail (Kudlicki et al., 2007). The nuclease inhibitor cocktail
was presented in all four buffers in this experiment. However, the combination of
Guanidine thiocyanate, DTT and ethanol was presented in VBB. This buffer also is a
modification of LB with the addition of ethanol.
Alcohols such as ethanol can be used to precipitate DNA and protein (Chomczynski,
1993). Alcohol destabilises hydrophobic interactions between non polar residues to
destabilise proteins. Alcohol disrupts hydrogen binding between amide groups in the
secondary protein structure. Alcohol also interrupts the hydrogen bonding between side
chains in tertiary protein structure in an assortment of amino acid mixtures. However,
the addition of alcohol to aqueous solvents affects the charge state of protein. Alcohol
lowers the dielectric constant of protein and its denaturation temperatures (Velicelebi
and Sturtevant, 1979).
STDB was shown to be the best performing preservative for the viral RNA. This buffer
contains SDS which is a detergent. However, SDS has also an ability to refold protein
and prevent the complete denaturation cytochrome C by urea (Xu and Keiderling,
2004). It is also reported that several oligomeric enzymes undergo renaturation after
denaturation with SDS (Weber and Kuter, 1971).

79
It was expected that the SDS would completely remove the viral envelope from the
NDV and render the virus completely inactivated. Clearly this was not the case. Viable
NDV was recovered from the allantoic fluid indicating that this buffer had failed to
completely inactivate the virus. This indicates that STDB would not be suitable for the
importation of viral RNA into a country that is free from velogenic NDV as is Australia.
This buffer may be suitable for use within Indonesia. The presence of some residual live
virus may not be criticial. However, it would be irresponsible to use this buffer when
samples are being exported to a reference laboratory. ND virus and in particular the V4
strain is relatively thermostable being able to resist 56°C from 3 to 9 hours (Ideris et al.,
1987). Strain V4 has a heat stable haemagglutinin. The infectivity of strain V4 is
relatively heat resistant even though this virus is apathogenic in chickens (Spradbrow,
1987). This heat resistance may be important in determining the stability of the virus in
the STDB. In addition this virus grows extremely well in the allantoic cavity and the
allantoic fluid used for this experiment had a titre of 108.75 EID50.
Storage of nucleic acid without a cold chain has been studied in different ways. Several
researchers has been tried to store nucleic acid on filter papers (Panteleeff et al., 1999;
Devost and Choy, 2001; Vincek et al., 2001). ND and AI viruses have also been
collected on filter papers (Brugh et al., 1980; Wambura, 2006), formalin fixed and
paraffin-embedded (Wakamatsu et al., 2007). However, collecting viruses on filter
papers lacked sensitivity. This lack of sensitivity is a result of the small amount of virus
that can be stored on filter paper even though viral nucleic acid was identified 30 days
after collection (Perozo et al., 2006). Other studies have indicated that collection of viral
RNA onto filter papers can have a relatively poor clinical sensitivity.
The dilution of samples in lysis buffer provides an opportunity to the transport of a
relatively large amount of sample in a format that is ready to be added to an extraction
buffer and is compatible with the first stages of viral RNA extraction. Viable virus is
completely inactivated making it suitable for importation into countries free of the
disease. The stability of the samples guarantees that the inactivated RNA should not be
degraded when these samples are transported without a cold chain.

80
Therefore, lysis buffer is highly recommended to be used as transport buffer for sample
collection and transportation without a cold chain
6.7 Conclusion
Lysis buffer could be used to preserve RNA. Viable virus was completely inactivated
and a relatively large sample could be safely moved without the need for a cold chain.
These samples are compatible with the early stages of nucleic acid extraction making it
a highly desirable protocol for transporting specimens in the absence of a cold chain.

81
CHAPTER 7
STORAGE OF EXTRACTED VIRAL RNA
7.1 Introduction
Extraction and purification of nucleic acid such as RNA is a common procedure in
molecular laboratory to analyse the genome. This genome analysis can be used to
diagnose diseases such as AI and ND. However, this extracted and purified RNA can be
easily degraded and fragmented by conditions such as thawing and long term storage
(Imamura, 2000; Thompson et al., 2007).
Ribonucleic acid is more susceptible to degradation and fragmentation than is DNA as a
result of ribonuclease from both exogenous and endogenous sources. Indeed to prevent
this contamination, an effective method of RNA extraction is required. However, long
term storage and usage of extracted RNA can be affected by the physical conditions
such as temperature fluctuations in temperature as well as freeze thawing (Sambrook
and Russel, 2001; Kudlicki et al., 2007). Therefore, it is crucial to develop a system for
RNA storage that is integrated with the extraction and purification of RNA.
7.2 Literature Review
The extraction of RNA in this project was based on the use of Guanidine isothiocyanate
(Chirgwin et al., 1979; Boom et al., 1990; Chomczynski, 1993; Chomczynski and
Mackey, 1995; Chomczynski and Sacchi, 2006). Guanidine isothiocyanate has been
also widely used to extract and purify RNA from AIV and NDV (Seal, 1995; Seal et al.,
1998; Briggs et al., 2003; Collins et al., 2003; Wei et al., 2006). However, there are
limited studies devoted to the subsequent storage of the purified RNA.
Tris EDTA buffer has been used to elute purified RNA from the glass fibres (Boom
et al., 1990; Chomczynski and Sacchi, 2006; Santella, 2006) and TE buffer is also
commonly used to store DNA or RNA. This buffer contains Tris (hydroxymethyl)
aminomethane – hydrochloride (Tris-HCl) as a buffer and EDTA which is a strong
chelating agent which chelates the Ca2+, Mg2+, and other divalent metal ions. The
chelating action of EDTA is ensured by Tris-HCl to properly bind the divalent cations.
Together with Tris-HCl, chelating ability of EDTA suppresses the ion and nuclease

82
activity causing RNA and DNA degradation processes (Maes et al., 2004). However,
the presence of EDTA potentially causes a problem in PCR reactions which require
Mg2+. Therefore, it may be necessary to evaluate and compare other buffers for routine
storage of RNA.
FORMAzol® is one possible RNA storage buffer. This buffer is formulated from
purified and stabilized formamide. FORMAzol® is claimed to be superior to other
commercial formamide buffers. Moreover, this buffer can be used as an RNA
solubiliser without additional purification for two years at 4°C or -20°C without the
need to reduce the temperature to -70°C. It is claimed that FORMAzol® protects the
RNA from RNase degradation (http://www.mrcgene.com/formazol.htm (Mackey and
Chomczynski, 1996). However, the amplification yield of RNA stored in FORMAzol®
was poor. Even though RNA had not degraded, formamide in FORMAzol® had an
undesirable effect on the reverse transcriptase reaction. As a result, storing RNA in
FORMAzol® may adversely affect the PCR result (Swinson and Koban, 2005).
Another alternative is the RNA Safe Buffer. This buffer is formulated to contain
Tween 20, Sodium azide, and carrier RNA. The RNA safe buffer has been used to
conserve RNA used in interlaboratory standardisation tests. The stability of the RNA
diluted in RNA safe buffer was confirmed by a freeze thawing experiment which
resulted in no reduction in RNA titre after the RNA was subjected to freezing at -20°C
and thawing 40 times. In addition RNA diluted in RNA safe buffers was stored at 37°C
for up to 12 days with only moderate damage. This moderate damage was confirmed by
a slight increase of Ct-Value in RT-qPCR (Hoffmann et al., 2006).
In this project RNA safe buffer was evaluated and compared with TE buffer.

83
7.3 Aims
The specific aims of this project are as follows:
1. To develop methods for storage of extracted viral RNA to be intergraded with
the RNA extraction protocol using samples collected and transported without a
cold chain.
2. To carry out diagnostic assay from processed viral RNA.
7.4 Materials and Methods
7.4.1 Extracted Viral RNA
Extracted viral RNA of AI virus H4N4 and NDV V4 were used in this experiment.
These viruses were described in Chapters 3.1.1 and 3.1.2. The H4N4 and V4 viruses
were extracted using the standard procedure described in Chapter 3.6.1
Extracted viral RNA was diluted in Elution Buffer (TE buffer) (part no. C0241, lot no.
035K6044, Corbett Robotic, Australia)
7.4.2 Buffers
Two buffers i.e. TCB and mRSB were compared for the storage of viral RNAs of AIV
and NDV.
TE ×100 concentrate (Fluka Biochemika 86377) was diluted to make ×1 concentrate
TE Buffer pH approx. 8.0 at temperature 25°C. Then, 50 ng/µl carrier RNA was also
added to make the TCB.
mRSB was constructed from RNA safe buffer (Hoffmann et al., 2006). This mRSB
contained 50 ng/µl carrier RNA, 0.05% Sodium Azide and 1% Tween 20 in RNase free
water (mRSB) (Hoffmann et al., 2006).
7.4.3 Experimental design
Experimental designs were carried out using the two evaluated buffers, the TCB and
mRSB. In this study the RNA was divided into three groups namely undiluted RNA, a
10-1 dilution of RNA and a 10-3 dilution of RNA. Three groups of dilutions using two

84
different buffers were also divided into two experiments; freeze thawing and long
storage experiments.
Extracted viral RNA was further diluted with TE Carrier RNA Buffer and MRSB. The
extracted viral RNA was diluted at 10× and 1,000× dilution using these two buffers.
The two diluted extracts of viral RNA were then stored at -20°C for 3 months and
9 months.
The diluted extracted viral RNA was treated in a freeze thawing experiment in 5× and
10× freezes thawing cycles at -20°C. Every treatment in thawing and times of storage
used three replicates.
Then the RNA samples were checked using RT-qPCR
7.4.4 Real time (quantitative) RT-PCR
RT-qPCR assay was performed based on SYTO 9 RT-qPCR using a RotorGene 3000
(Corbett Research, Australia). This assay was carried out using NDV M primers (Wise
et al., 2004) for viral NDV V4 RNA and the AIV M primer set (Ward et al., 2004) were
utilised to identify viral AIV H4N4 RNA. Ct-values for the RT-qPCR were analysed
statistically.
7.4.5 Data Analysis
Data of Ct-Value of RT-qPCR assay were analysed using the statistical program SPSS
14.0. The probability of Ct-value of treatments were compared and significance were set
at a p-value of <0.05
7.5 Result
7.5.1 Dilution of extracted viral RNA’s in two different buffers
Dilutions of extracted viral RNA in two different buffers have shown that viral RNA of
NDV V4 can be identified in both TCB and mRSB.
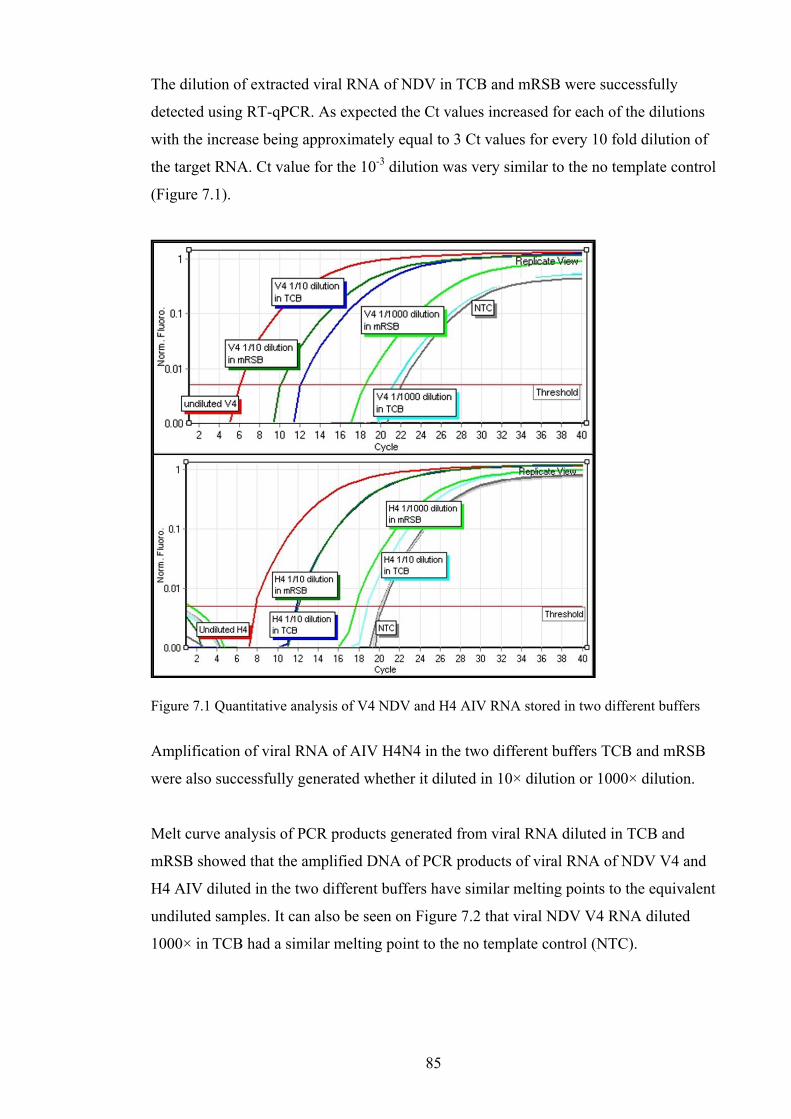
85
The dilution of extracted viral RNA of NDV in TCB and mRSB were successfully
detected using RT-qPCR. As expected the Ct values increased for each of the dilutions
with the increase being approximately equal to 3 Ct values for every 10 fold dilution of
the target RNA. Ct value for the 10-3 dilution was very similar to the no template control
(Figure 7.1).
Figure 7.1 Quantitative analysis of V4 NDV and H4 AIV RNA stored in two different buffers
Amplification of viral RNA of AIV H4N4 in the two different buffers TCB and mRSB
were also successfully generated whether it diluted in 10× dilution or 1000× dilution.
Melt curve analysis of PCR products generated from viral RNA diluted in TCB and
mRSB showed that the amplified DNA of PCR products of viral RNA of NDV V4 and
H4 AIV diluted in the two different buffers have similar melting points to the equivalent
undiluted samples. It can also be seen on Figure 7.2 that viral NDV V4 RNA diluted
1000× in TCB had a similar melting point to the no template control (NTC).

86
Figure 7.2 Melting curve profiles of undiluted and diluted NDV V4 and AIV H4 RNA in TCB
and mRSB. The stored RNA in TCB had a similar melting point to the stored RNA in mRSB
Univariate ANOVA using SPSS 16.0 of different buffers with different dilutions based
on the Ct-Value for the PCR products of V4 viral RNA showed no significant
difference between buffers. However, the different dilutions had a significant
difference. Also the interaction between buffers and dilutions were not significantly
different compared with the interaction between buffers and interaction between
dilutions.
However, even though the statistical analysis showed the insignificant difference, it can
be seen from Figure 7.3 that preservation of diluted V4 viral RNA both of 10× and
1000× dilution using mRSB (Hoffmann et al., 2006) were slightly better than using
TCB. This can be seen in Figure 7.3 that the PCR products of diluted viral RNA in
mRSB had a lower mean of Ct-Value’s than PCR products of diluted viral RNA in
TCB.

87
Figure 7.3 The mean of Ct-Values for the extracted V4 viral RNA samples diluted in two
different buffers. The data were analysed using Univariate ANOVA with significance at a p-value < 0.05.
Analysis of Ct-Value of PCR products of AI viral RNA H4N4 did not demonstrate a
significant difference between buffers. However, there was a significant difference
between the original extracted viral RNA compared with the 10× and 1000× dilutions,
negative control and NTC. Interaction between buffers and dilutions were also not
significantly different.
Figure 7.4 The mean of Ct-Values for the extracted AI viral RNA samples diluted in two different buffers analysed by Univariate ANOVA. Significances were set at a p-value < 0.05.
Mean of Ct-Value of Extracted viral RNA V4 in different dilutions of different buffers
5.9
12.2
21.3
10.3
18.9
21.9
0
5
10
15
20
25
Original Extractedviral RNA
10× dilution 1000 × dilution No TemplateControl (NTC)
Dilution
Dilution
Ct-
Val
ue
Elution Buffer TE carrier Buffer (TCB) Modif ied RNA Safe Buffer (mRSB) w ater
Mean of Ct Value of Extracted viral RNA H4N4 in different dilutions of different buffers
7.8
11.8
18.8
12
17.7
20.1
0
5
10
15
20
25
Original Extractedviral RNA
10× dilution 1000 × dilution No Template Control(NTC)
Dilution
Dilution
Ct-
Val
ue
Elution Buffer TE carrier Buffer (TCB) Modified RNA Safe Buffer (mRSB) w ater

88
It can be concluded from the treatments in two different buffers and three different
dilutions that there were no significant difference between the preservation of RNA in
either of the two buffers.
7.5.2 Freeze-thawing experiment
Freeze thawing experiments with diluted viral RNA V4 in TE Carrier RNA Buffer and
mRSB showed that extracted viral RNA was still detected after 5× and 10× freeze
thawing at -20°C. This detection was confirmed by Ct-Value performed in SYTO 9
RT-qPCR.
It can be seen from Figure 7.5 that viral RNA has slightly better preserved in mRSB
then it was in TCB. The quantitation analysis of PCR products of the extracted and
diluted viral RNA V4 after 5× and 10 × freezes thawing at -20°C can be seen in
Figure 7.5
Figure 7.5 Quantitation analysis of diluted RNA of NDV V4 stored in two different buffers, TCB and mRSB with freeze thawing experiment. The Ct-Value were quantitated at the threshold 0.05
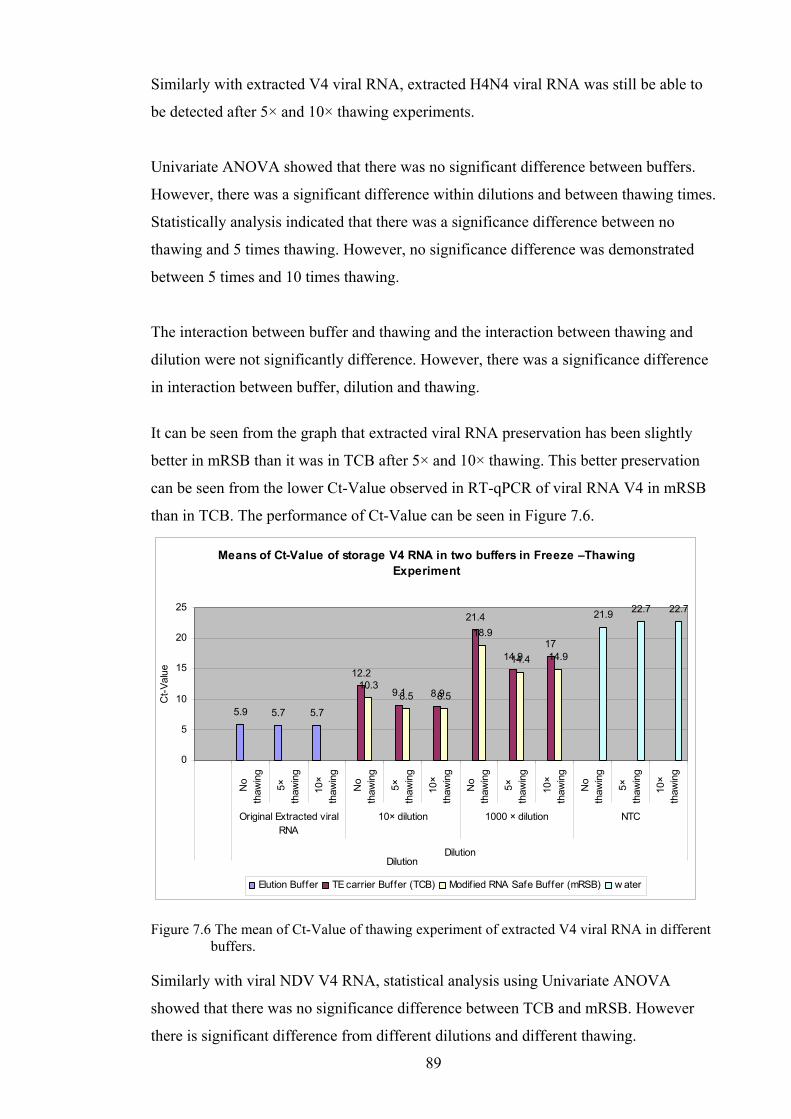
89
Similarly with extracted V4 viral RNA, extracted H4N4 viral RNA was still be able to
be detected after 5× and 10× thawing experiments.
Univariate ANOVA showed that there was no significant difference between buffers.
However, there was a significant difference within dilutions and between thawing times.
Statistically analysis indicated that there was a significance difference between no
thawing and 5 times thawing. However, no significance difference was demonstrated
between 5 times and 10 times thawing.
The interaction between buffer and thawing and the interaction between thawing and
dilution were not significantly difference. However, there was a significance difference
in interaction between buffer, dilution and thawing.
It can be seen from the graph that extracted viral RNA preservation has been slightly
better in mRSB than it was in TCB after 5× and 10× thawing. This better preservation
can be seen from the lower Ct-Value observed in RT-qPCR of viral RNA V4 in mRSB
than in TCB. The performance of Ct-Value can be seen in Figure 7.6.
Figure 7.6 The mean of Ct-Value of thawing experiment of extracted V4 viral RNA in different
buffers. Similarly with viral NDV V4 RNA, statistical analysis using Univariate ANOVA
showed that there was no significance difference between TCB and mRSB. However
there is significant difference from different dilutions and different thawing.
Means of Ct-Value of storage V4 RNA in two buffers in Freeze –Thawing Experiment
5.9 5.7 5.7
12.2
9.1 8.9
21.4
14.917
10.38.5 8.5
18.9
14.4 14.9
21.9 22.7 22.7
0
5
10
15
20
25
No
thaw
ing
5×th
awin
g
10×
thaw
ing
No
thaw
ing
5×th
awin
g
10×
thaw
ing
No
thaw
ing
5×th
awin
g
10×
thaw
ing
No
thaw
ing
5×th
awin
g
10×
thaw
ing
Original Extracted viralRNA
10× dilution 1000 × dilution NTC
DilutionDilution
Ct-
Val
ue
Elution Buffer TE carrier Buffer (TCB) Modif ied RNA Safe Buffer (mRSB) w ater

90
The interaction between buffer and thawing or buffer and dilution was not significantly
different. Also, the interaction between three factors; buffers, thawing and dilution were
not significantly different.
The mean of Ct-Value can be seen on Figure 7.7
Figure 7.7 The mean of Ct-Value of thawing experiment of extracted H4N4 viral RNA in
different buffers with different dilution. The data were analysed using Univariate ANOVA with significance at p-value < 0.05. Overall 5× and 10× freeze thawing at -20°C was not significantly affecting to the H4N4 viral RNA. Lower Ct -value means better fluorescence signal generated.
This experiment showed that a 5× and 10× freeze thawing at -20°C did not significantly
affect the H4N4 viral RNA preserved in either buffer. Also, statistically analysis
showed no significant difference between freeze thawing of H4N4 viral RNA either
preserved in TCB or preserved in mRSB.
Means of Ct-Value of storage H4N4 RNA in two buffers in Freeze –Thawing Experiment
7.8 7.5 7.5
11.8 10.9
7.6
18.917.7
19.4
12 11.1 11
17.7 17 17.3
20.1
25.3 25.3
0
5
10
15
20
25
30
No
thaw
ing
5×
thaw
ing
10×
thaw
ing
No
thaw
ing
5×
thaw
ing
10×
thaw
ing
No
thaw
ing
5×
thaw
ing
10×
thaw
ing
No
thaw
ing
5×
thaw
ing
10×
thaw
ing
Original Extracted viralRNA
10× dilution 1000 × dilution NTC
Dilution
Dilution
Ct-
Val
ue
Elution Buffer TE carrier Buffer (TCB) Modif ied RNA Safe Buffer (mRSB) w ater

91
7.5.3 Long term storage experiment
Storage experiment of V4 viral RNA showed that the M gene of V4 viral RNA and AI
H4 were still able to be detected after 3 months and 9 months storage at -20°C in TCB
and mRSB. However, it can be seen from Figures 7.8 that the 10-3 dilution of V4 RNA
in TCB was not preserved for the three and nine month storage periods.
Figure 7.8 Quantitation Analysis of PCR Product of viral RNA V4 in 3 and 9 months storage at
-20°C in different storage buffers, the TCB and modified mRSB. At threshold 0.05, the level of fluorescence of the RNA storage in mRSB is slightly better in 10× dilution compared by in TCB. Also, in 1000 × dilution, storage in mRSB is much better than in TCB.
Statistically analysis of the Ct-values for V4 RNA was significantly different within
buffers and within dilutions. However, different times of were not significantly
different.
Interaction between buffer and times was not significantly different. However,
interaction between buffer and dilution or between times and dilution were significantly
different. The interaction of all of the treatment which is buffer, times and dilution was
also significantly different (Figure 7.9).

92
Figure 7.9 The mean of Ct-Value of extracted V4 RNA stored in different buffers with different
dilution for 3 months and 9 months storage. It can be seen from Figure 7.9 that V4 RNA was preserved in long term storage with
both TCB and mRSB.
Statistically analysis to the Ct-Values determined that there was a significant difference
within buffers, within dilution and within times. Univariate ANOVA demonstrated that
elution buffer preserved H4N4 viral RNA significantly different from TCB or mRSB.
Storage of H4N4 viral RNA for 3 months was also significantly different from storage
for 9 months. Also, the interactions between buffer, times and dilution were also
significantly different (Figure 7.10).
Means of Ct-Value of storage V4 RNA in two buffers in Long storage Experiments
5.9 5 5.7
12.29.5 9.1
21.4 21.4
24.8
10.3 9 8.8
18.915.9 15.3
21.9
26.424.7
0
5
10
15
20
25
30
0 m
onth
3m
onth
s
9m
onth
s
0 m
onth
3m
onth
s
9m
onth
s
0 m
onth
3m
onth
s
9m
onth
s
0 m
onth
3m
onth
s
9m
onth
s
Original Extracted viralRNA
10× dilution 1000 × dilution NTC
Dilution
Dilution
Ct-
Val
ue
Elution Buffer TE carrier Buffer (TCB) Modif ied RNA Safe Buffer (mRSB) w ater
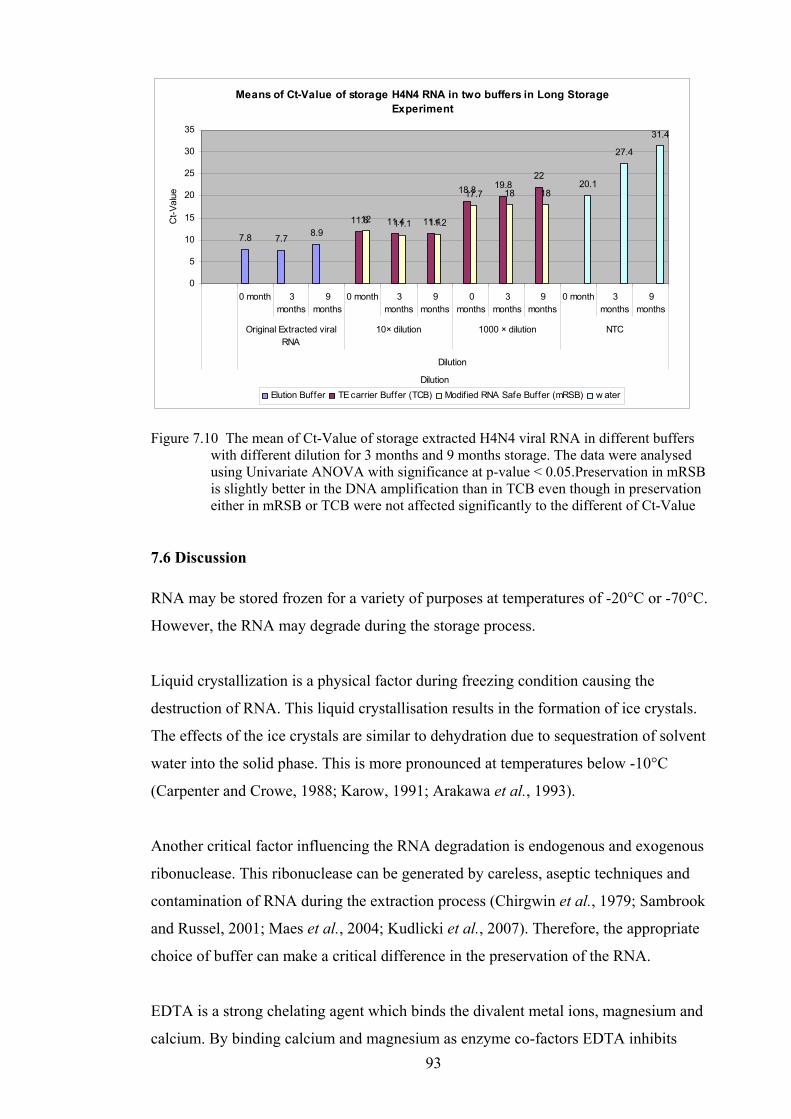
93
Figure 7.10 The mean of Ct-Value of storage extracted H4N4 viral RNA in different buffers
with different dilution for 3 months and 9 months storage. The data were analysed using Univariate ANOVA with significance at p-value < 0.05.Preservation in mRSB is slightly better in the DNA amplification than in TCB even though in preservation either in mRSB or TCB were not affected significantly to the different of Ct-Value
7.6 Discussion
RNA may be stored frozen for a variety of purposes at temperatures of -20°C or -70°C.
However, the RNA may degrade during the storage process.
Liquid crystallization is a physical factor during freezing condition causing the
destruction of RNA. This liquid crystallisation results in the formation of ice crystals.
The effects of the ice crystals are similar to dehydration due to sequestration of solvent
water into the solid phase. This is more pronounced at temperatures below -10°C
(Carpenter and Crowe, 1988; Karow, 1991; Arakawa et al., 1993).
Another critical factor influencing the RNA degradation is endogenous and exogenous
ribonuclease. This ribonuclease can be generated by careless, aseptic techniques and
contamination of RNA during the extraction process (Chirgwin et al., 1979; Sambrook
and Russel, 2001; Maes et al., 2004; Kudlicki et al., 2007). Therefore, the appropriate
choice of buffer can make a critical difference in the preservation of the RNA.
EDTA is a strong chelating agent which binds the divalent metal ions, magnesium and
calcium. By binding calcium and magnesium as enzyme co-factors EDTA inhibits
Means of Ct-Value of storage H4N4 RNA in two buffers in Long Storage Experiment
7.8 7.78.9
11.8 11.4 11.4
18.8 19.822
12 11.1 11.2
17.7 18 1820.1
27.4
31.4
0
5
10
15
20
25
30
35
0 month 3months
9months
0 month 3months
9months
0months
3months
9months
0 month 3months
9months
Original Extracted viralRNA
10× dilution 1000 × dilution NTC
Dilution
Dilution
Ct-
Val
ue
Elution Buffer TE carrier Buffer (TCB) Modif ied RNA Safe Buffer (mRSB) w ater

94
ribonuclease and prevents the degradation of RNA and is commonly used in buffers for
the dilation and preservation of RNA (Chomczynski and Sacchi, 1987; Boom et al.,
1990; Burgoyne, 1996; Maes et al., 2004; Chomczynski and Sacchi, 2006; Santella,
2006). However, chelating calcium and magnesium can produce problems in the further
PCR reactions as these divalent cations are important cofactors in the PCR.
Tween 20 is a non ionic detergent in the Tween family. The polyoxyethylene sorbitan
esters of fatty acid of the Tween family behave as surfactants by replacing lipid bilayers
in membrane proteins (Garavito and Ferguson-Miller, 2001; Arnold and Linke, 2007;
Privé, 2007). Hence this detergent can be used as a component of the buffer. It is a mild
detergent and is unlikely to interfere with the PCR reaction (Arnold and Linke, 2007).
Sodium azide is bacteriostatic and will block the action of a number of enzymes capable
of degrading the RNA. In these experiments it would appear that the addition of sodium
azide had minimal effect on the preservation of the RNA. It is likely to be of greatest
assistance when there is a possibility of bacterial contamination of the samples. This is
likely to occur in those samples that undergo multiple freeze thaw cycles as each step
has the potential to introduce contaminating bacteria.
The results obtained in this study demonstrate that the RNA was protected from
degradation by both buffers. The major difference between the two buffers is the
addition of Tween 20 and sodium azide. If the RNA samples were contaminated with
RNase enzymes prior to storage or if contamination with bacteria was introduced during
the freeze thaw process is likely that the RNA safe buffer may have provided additional
protection for the RNA.
7.7 Conclusion
The prevention RNA degradation in freeze thawing and long term storage for further
use requires an appropriate storage buffer. Therefore in this study we proved that RNA
can be stable despite freeze thawing and long term storage in either the original elution
buffer or with either of the buffers evaluated.
It is speculated that contaminated samples would be more stable in mRSB as the sodium
azide would inactivate contaminating bacteria.

95
CHAPTER 8
COLLECTION AND TRANSPORTATION OF SAMPLES FROM INDONESIA WITHOUT A COLD CHAIN
8.1 Introduction
Recent outbreaks of highly pathogenic AI virus in Indonesia have highlighted the
importance of having appropriate diagnostics and suitable transport systems to allow
responses to be based on up-to-date information on the distribution and prevalence of
viruses capable of producing diseases in animals and humans. Transportation between
laboratories in Indonesia and between Indonesia and overseas reference laboratories is
vital for appropriate decision-making.
Sharing samples will be of benefit to Indonesia as it will provide information on the
evolution of AI viruses (Fidler, 2008). However, some countries are reluctant to receive
samples that could pose a threat of importation of highly pathogenic viruses. It is
therefore vital that methods be developed for the safe transportation of nucleic acids that
would allow the identification and sequencing of viruses without posing a quarantine
threat to the importing country.
The traditional methods used to transport viruses such as AIV and NDVs or their RNA
requires an extensive cold chain. It is vital that techniques be developed to overcome the
need for the cold chain so that samples can be moved around Indonesia and delivered to
reference laboratories overseas in a simple inexpensive way. It is important that samples
can firstly be confirmed to be AIV or NDV and the RNA should be sufficiently intact
for substantial amounts of sequence data to be obtained.

96
8.2 Literature Review
Highly contagious viruses such as AIV is of concern to a number of countries and
specific conditions have been applied to the importation of material derived from this
virus. The Agricultural Department of USA requires that samples be inactivated using
chemicals such as phenol or formalin before being transported (Perozo et al., 2006).
Phenol has been confirmed to inactivate viruses and preserve nucleic acid for
amplification of RNA in RT-PCR (Jackwood et al., 1996). Also Phenol precipitation
has been used as a standard technique for viral inactivation and molecular
characterisation (Purvis et al., 2006). However, chemically inactivation of samples may
interfere with the reaction and several additional steps may need to be taken to remove
traces of phenol before PCR or RT-PCR can be carried out. Failure to do so may result
in misdiagnosis (Purvis et al., 2006).
Formalin has been also used as a fixative to allow the transport of samples. Formalin
fixed – paraffin embedded tissue are frequently used as histological specimens (Masuda
et al., 1999; Lehmann and Kreipe, 2001; Wakamatsu et al., 2007). However, nucleic
acid may be degraded and the processing of the fixed tissue may present some problems
(Coombs et al., 1999).
Moreover formalin fixed tissue is resistant to some solubilising agents such as
Proteinase K and chaotropic agents (Masuda et al., 1999). The complicated processing
restricts the use of formalin fixed tissues.
Beta-Propiolactone and Binary Ethylenediamine can be used to inactivate lipid and
non-lipid coated viruses. However these chemicals are hazardous and while they have
no effect on viral proteins they inactivate nucleic acids (King, 1991; Refaie et al., 2004).
Therefore these samples are unlikely to be useful in molecular diagnostics.
Filter paper collection and transport systems are compatible with processing of nucleic
acid (Perozo et al., 2006). However, without suitable additional treatment the nucleic
acid will degrade rapidly.

97
The lysis buffer described in Chapter 6 is a promising technique for transporting
samples throughout Indonesia and to reference laboratories. The nucleic acid should
remain stable and the viruses will be totally inactivated. The commercial lysis buffer
containing guanidinium isothiocyanate and dithiothreitol will precipitate all proteins and
inactivate both viruses and bacteria (Alberti and Fornaro, 1990; Boom et al., 1990;
Boom et al., 1991). This guanidinium viral inactivation is compatible with the further
processing of the samples for diagnosis and sequencing.
Viruses such as influenza A continue to evolve and the decision to withhold live viruses
from collaborating countries reduces the information available on the evolution of these
viruses (Fidler, 2008). Transport of inactivated viral RNA may overcome a number of
the objections to this process and supply vital information.
The simple application of melt curve analysis may allow outliers to be recognised and
these will be suitable candidates to be given priority for sequencing (White and Potts,
2006; Gundry et al., 2008).
8.3 Aims
The specific aims of this project are as follows:
1. To apply the newly developed methods for collecting and transporting RNA
viruses without the need of a cold chain assays to reference samples and samples
collected from infected birds in Indonesia.
2. To collect samples from outbreaks of AI or ND in Indonesia and suspend their
viral RNA in a suitable buffer that will allow transport without the need for a
cold chain.
3. To apply a new standardised set of diagnostics tests based on real-time PCR for
the recognition of AIV and NDV in samples collected from infected birds in
Indonesia.
4. To demonstrate that RNA fragmentation is not a problem in transported samples
from Indonesia.
5. To characterise and pathotype NDV and AIV samples transported from
Indonesia.

98
8.4 Materials and Methods
8.4.1 Samples
Samples in this study were collected in Indonesia and processed in the Centre of
Standard Testing of Agricultural Quarantine Agency of Indonesia. Then, the samples
were transported to JCU.
Samples from Indonesia included AI viruses and ND viral antigens. AI viruses were
kindly provided by the Agricultural Quarantine Agency of Indonesia (AQAI). These
viruses were collected from Ambon and Timika outbreaks and propagated in the Centre
of Standard Testing of AQAI as their stock viruses. Other samples were derived from
organs which were kindly donated by Sudirman, DVM, PT. BioTek Indonesia –Jakarta.
These organs were collected from dead chickens suspected of being infected with H5N1
AI viruses and they were propagated in 10 day embryonated SPF eggs. However, to
maintain confidentiality the source of the chickens was not divulged.
Samples for NDV RNA were purchased from Balitvet and Pusvetma. These samples
were NDV antigens which had been treated with ß-mercaptoethanol.
Both of AI viruses and NDV antigens were processed using the modified Corbett lysis
buffer and transported without a cold chain.
8.4.1 GenBank sequences
AI and ND viral isolates in this study were compared to the references sequenced
accessed from GenBank databases. The accession number of the reference sequences
can be seen on the figure of the phylogenetic tree.

99
8.4.2 Permit certificates
A full description of the samples was prepared on letterhead and signed by the
responsible scientist. An appropriate import permit was issued by the Australian
Quarantine and Inspection Service (Permit No IP7021860) while Exportation permits
were issued by the Directorate General Livestock Service (Certificate No.
632/PD.630/F.5/02/08) and Agricultural Quarantine Agency of Indonesia (Quarantine
Certificate No. 0002595 M/E/110100/20080218/002268)
Furthermore, the transportation of the samples was facilitated by a Material Transfer
Agreement between the Agricultural Quarantine Agency of Indonesia and the School of
Veterinary and Biomedical Sciences JCU.
8.4.3 Buffer
The commercial lysis buffer (part no.C0616, lot no 035K6045) containing guanidium
isothiocyanate and dithiothreitol (LB Additive, part no Q3633) was used to ensure that
the samples being imported were free from infectious organisms.
8.4.4 Protocol of samples collection in transport buffer
The viral suspensions were initially processed in Indonesia by suspending at a 1:2 ratio
of virus to lysis buffer making a 33% suspension of virus in buffer.
A total volume of 500 µl of viral suspension was added to 1,000 µl of LB and the tube
inverted to thoroughly mix the contents. Then, the entire volume of the tube was
transferred to a second tube that had an O-ring seal to ensure that there was no untreated
viral suspension in the screw cap. The outside of tube was sterilised by wiping with
70% alcohol and then the tube was sealed using parafilm. Afterwards, the tubes were
fully labelled and transferred to a second container that conforms to IATA packaging
instructions 650.
The inactivation of virus was also confirmed by inoculation into embryonated SPF eggs
in Indonesia prior to being transported to JCU in Australia.
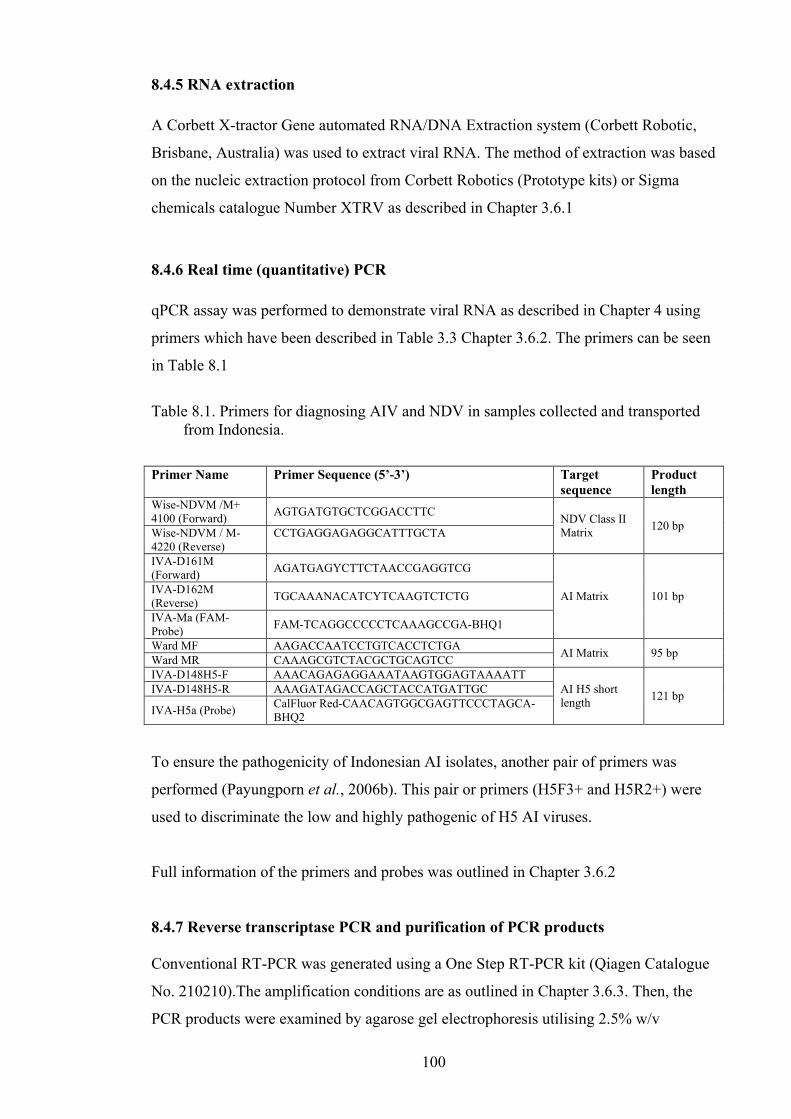
100
8.4.5 RNA extraction
A Corbett X-tractor Gene automated RNA/DNA Extraction system (Corbett Robotic,
Brisbane, Australia) was used to extract viral RNA. The method of extraction was based
on the nucleic extraction protocol from Corbett Robotics (Prototype kits) or Sigma
chemicals catalogue Number XTRV as described in Chapter 3.6.1
8.4.6 Real time (quantitative) PCR
qPCR assay was performed to demonstrate viral RNA as described in Chapter 4 using
primers which have been described in Table 3.3 Chapter 3.6.2. The primers can be seen
in Table 8.1
Table 8.1. Primers for diagnosing AIV and NDV in samples collected and transported
from Indonesia.
Primer Name Primer Sequence (5’-3’) Target sequence
Product length
Wise-NDVM /M+ 4100 (Forward)
AGTGATGTGCTCGGACCTTC NDV Class II Matrix
120 bp Wise-NDVM / M-4220 (Reverse)
CCTGAGGAGAGGCATTTGCTA
IVA-D161M (Forward)
AGATGAGYCTTCTAACCGAGGTCG
AI Matrix 101 bp IVA-D162M (Reverse)
TGCAAANACATCYTCAAGTCTCTG
IVA-Ma (FAM-Probe)
FAM-TCAGGCCCCCTCAAAGCCGA-BHQ1
Ward MF AAGACCAATCCTGTCACCTCTGA AI Matrix 95 bp
Ward MR CAAAGCGTCTACGCTGCAGTCC IVA-D148H5-F AAACAGAGAGGAAATAAGTGGAGTAAAATT
AI H5 short length
121 bp IVA-D148H5-R AAAGATAGACCAGCTACCATGATTGC
IVA-H5a (Probe) CalFluor Red-CAACAGTGGCGAGTTCCCTAGCA-BHQ2
To ensure the pathogenicity of Indonesian AI isolates, another pair of primers was
performed (Payungporn et al., 2006b). This pair or primers (H5F3+ and H5R2+) were
used to discriminate the low and highly pathogenic of H5 AI viruses.
Full information of the primers and probes was outlined in Chapter 3.6.2
8.4.7 Reverse transcriptase PCR and purification of PCR products Conventional RT-PCR was generated using a One Step RT-PCR kit (Qiagen Catalogue
No. 210210).The amplification conditions are as outlined in Chapter 3.6.3. Then, the
PCR products were examined by agarose gel electrophoresis utilising 2.5% w/v

101
Agarose Standard low EEO Applichem (CAS No. 9021-36-6) as described in
Chapter 3.6.4.
Primers were used for sequencing in this study were designed using AlleleID (Premier
Biosoft). The primers can be seen in Table 8.2
Table 8.2. Primers for sequencing NDV and H5 AIV
Primer Name Primer Sequence (5’-3’) Target sequence
Product length
H5F-GB590 TATAGAGGGAGGATGGCAGGGAATG
H5 590 bp H5R-GB590 GACCAGCTATCATGATTGCCAGTGC
H5F-GB1307 CTGGAAAAGACACACAACGGGAAGC
H5 1307 bp H5R-GB1307 AAACAACCGTTACCCAGCTCCTTTG
NDV-F343-F 5’-CCCAAGGATAAAGAGGCGTCTGC-3’ Fusion
343 bp
NDV-F343-R 5’-GCTGCATCTTCCCAACTGCCAC-3’ 343 bp
Purification of PCR products were performed using Real GenomicsTM (Real Biotech
Corporation) kit, HiYieldTM Gel/PCR DNA Extraction kits (catalogue no. YDF100) as
described in Chapter 3.6.5
8.4.8 Sequencing Purified PCR products were sent to Macrogen, South Korea to attain the targeted
sequences as described in Chapter 3.6.7.
ContiqExpress, Vector NTI Advanced 10 (Invitrogen), or Sequencher version 4.7 (Gene
Codes corporation, USA) were used to assemble the sequences. Then, comparison
between the sequences to the Gen Bank database was carried out using NCBI BLAST.
Sequence alignment was carried out using either Vector NTI or GeneDoc using the
Clustal algorithms. Phylogenetic trees were drawn using Mega 5.

102
8.5 Results
8.5.1. Screening of ND and AI viral RNA AIV and NDV materials were successfully processed using commercial lysis buffer and
transported without a cold chain.
Detection of AI viral RNA was successfully performed in RT-qPCR assay based on
SYTO 9 using AI M primer (Ward et al., 2004). The quantitation analysis of AI viral
RNA can be seen in Figure 8.1
Figure 8.1 Quantitation analysis of AI viral RNA performed in SYTO 9 RT-qPCR assay using
AI M Primers. Melt curve analysis of the M gene of the AI viruses isolates shows the different melting
points between the four different clusters of isolates namely Timika, Ambon,
Tanggerang and Sukabumi. Members of each of the groups of viruses had similar melt
temperatures and there were consistent differences between the four groups of viruses
(Figure 8.2).
Tanggerang
Sukabumi
Ambon
Timika

103
Figure 8.2. Melting Curve profile of SYTO 9 RT-qPCR of AI viral RNA’s using AI M primers Amplification of the AIV samples using the AIV M TaqMan IV dual labelled Probe
assay (Heine et al., 2005) indicates that all four groups of isolates were successfully
detected (Figure 8.3)
Figure 8.3 Quantitative analysis based on AI M TaqMan IV dual labelled Probe RT-qPCR
assay. Ct-values were performed at 0.005
An AI H5 specific TaqMan assay was performed using IVA-D148H5 reagents (Heine
et al., 2005). Three groups of isolates (Timika, Ambon and Tanggerang) reacted in this
assay. However, this assay failed to detect the Sukabumi isolates (Figures 8.4 and 8.5).
Tanggerang
Sukabumi
Ambon
Timika
Tanggerang
Sukabumi
Ambon
Timika

104
Figure 8.4 Amplification profiles of RT-qPCR four different batches of AI viral isolates from
Indonesia using the IVA-Subtype H5 TaqMan dual labelled probe assay
Figure 8.5 Quantitation analyses of RT-qPCR four different AI viral isolates from Indonesia
using IVA-Subtype H5 TaqMan dual labelled probe assay (Heine et al., 2005) As the Sukabumi isolates failed to react in the TaqMan they were then tested using the
corresponding primers and the interchelating dye SYTO9. All four groups of isolates
were amplified in this assay (Figure 8.6).
These assays indicated that all four groups of viruses were AIV H5. There were
differences in M sequence and the Sukabumi isolates were sufficiently different that
they did not bind the H5 probe used for routine identification of H5 isolates in Australia
(Heine et al., 2005).
Cycle5 10 15 20 25 30 35 40 45 50
Nor
m. F
luor
o.
-1.010
-1.210
-1.410
-1.610
-1.810
-2.010
-2.210
-2.410
-2.610
-2.810
Threshold
Tanggerang
Sukabumi
Ambon
Timika
Tanggerang
Sukabumi
Ambon
Timika

105
Figure 8.6 RT-qPCR assay based on SYTO 9 to the four groups of AI isolates from Indonesia.
RT-qPCR were generated using H5 primers (Heine et al., 2005) Melt Curve analysis of the four different groups of AI viruses suggests that there may
be some differences in sequence. When a high resolution melt curve analysis was
carried out three different clusters of profiles were recognised representing Sukabumi,
Tanggerang, with Ambon or Timika having a similar profile. There appeared to be
some variation in the profiles generated by the different groups. Up to three different
profiles were detected in the Sukabumi group (Figure 8.7). This suggests that there may
be some heterogeneity in the sequences of the H gene of these four groups of viruses.
However, the difference was better performed by running the PCR product in High
Resolution Melt (HRM) assay in Rotor-GeneTM 6000. It can be seen from the graph that
there were three different genotypes based on different melting point performed by
Sukabumi isolates. The different genotypes were also shown by Tanggerang isolates.
However, Ambon isolates had two different melting points while melting point of
Timika isolates was homologous.
This melting point analysis can be seen on Figure 8.7
Tanggerang
Sukabumi
Ambon
Timika

106
Figure 8.7 Melting curve profile of different locations processed isolates using Melting point analysis and HRM Analysis. The analysis was performed on Rotor-GeneTM 3000 and 6000 (Corbett Research, Australia)
Normalisation data of HRM has suggested three different genotypes. The profiles of the
Timika and Ambon isolates were similar while the profiles for the Tanggerang and
Sukabumi isolates were clearly different. The most divergent were the Sukabumi
isolates (Figures 8.8 and 8.9).
Figure 8.8 Normalised Melt Curve of different isolates performed by HRM Analysis assay. The
assay was generated on Rotor-Gene 6000 (Corbett Research, Australia) using IVA-D148H5 primer
High Resolution Melt
Melt Curve Analysis
High Resolution Melt
Melt Curve Analysis
Tanggerang
Sukabumi
Ambon
Timika

107
To view the difference plot, a Timika isolate was defined as a representative genotype.
This confirms that the Timika and Ambon isolates had similar profiles while the
Tanggerang and Sukabumi isolates clearly stood out as being divergent (Figure 8.9).
Figure 8.9 Genotype comparisons of four Indonesian AI viral isolates using Difference graph
analysis on HRM Assay with isolates from Timika being the reference. A real time RT-PCR assay based on SYTO 9 using H5F3+ and H5R2+ primers
(Payungporn et al., 2006b) also successful detected AI H5 in four isolates from
Indonesia. The detection performance can be seen in Figure 8.10
Figure 8.10 Fluorescence data of SYTO 9 RT-qPCR assay of AI viral isolates using H5F3+ and H5R2+ primers (Payungporn et al., 2006b)
Tanggerang
Sukabumi
Ambon
Timika
Tanggerang
Sukabumi
Ambon
Timika

108
Analysis of melting curve was shown that there was a difference in melting point for
isolates from all four different locations of Indonesian. These differences are outlined in
Figure 8.11. The high resolution melt curves suggest that while there is significant
sequence variation even within the groups of isolates there was further variation.
Figure 8.11 Melting Curve Analysis and HRM of the recent Indonesian AI isolates performed
by SYTO 9 RT-qPCR assay using H5F3+ and H5R2+ primers (Payungporn et al., 2006b)
Normalisation fluorescence data of HRM assay clearly demonstrates that the similarities
in the Timika and Ambon isolates are similar to that seen with the previous set of
primers. The Tanggerang and Sukabumi isolates clearly diverge with some variation
within the Sukabumi isolates (Figures 8.12 and 8.13).
High Resolution Melt
Melt Curve Analysis
High Resolution Melt
Melt Curve Analysis

109
Figure 8.12 Melt plots of normalised graphs of Indonesian AI isolates performed by HRM
Assay using H5F3+ and H5R2+ primers
Figure 8.13 Genotype comparisons of four Indonesian AI viral isolates performed by Difference
graph analysis on HRM Assay using H5F3+ and H5R2+ primers with a Timika isolate as the reference sequence.
Detection of processed NDV antigen using duplex primer in RT-qPCR based on SYTO
9 showed that the commercial lysis buffer not only preserved viral RNA from processed
live viruses but also from viruses inactivated with beta propiolactone. The results of
detection curves and melt curves for the ND RNA samples are shown in Figures 8.14
and 8.15
Tanggerang
Sukabumi
Ambon
Timika
Tanggerang
Sukabumi
Ambon
Timika

110
Figure 8.14. Quantification curves of NDV antigen transported from Indonesia in commercial
lysis buffer. The assay was performed using RT-qPCR assay based on SYTO 9 and the duplex primers
Figure 8.15 Melt curves of ND antigen transported from Indonesia in commercial lysis buffer.
The assay was performed using RT-qPCR assay based on SYTO-9 and the duplex primers
8.5.2. Sequencing of Newcastle Disease and AI viral RNA
Amplification of NDV cDNA was successfully carried out using the templates from
Indonesia and selected Australian isolates. A 343 bp product from the fusion gene was
amplified using NDV-F343 forward and reverse primers (Figure 8.16)

111
Figure 8.16 Amplification of a 343 bp product of the fusion gene of Indonesian and Australian
isolates of NDV Sequencing analysis of the PCR products from the NDV RNA transported from
Indonesia showed that the isolates were similar to the Australian V4 NDV isolated from
chicken isolates. The similarities and differences can be seen in Figure 8.17
Figure 8.17 Alignment of partial sequence of the F gene of NDV isolates from Indonesian vaccine viruses as well as Australian reference NDV isolates.
343 bp

112
However, it showed in Figure 8.17 that Balitvet NDV antigens have a closer
relationship to the Australian NDV V4 than Pusvetma antigens. Also, there were some
nucleotide mismatches between NDV antigens Balitvet and Pusvetma.
Comparison of Balitvet and Pusvetma NDV antigen sequences with the available
GenBank sequences showed that NDV Pusvetma aligned closely with a Japanese NDV
isolate: Japan/Ishii/62 while the NDV Balitvet was closely related to
V4/AUS/(QLD)/66. Both of these isolates are Class 2 genotype 1 viruses. This
alignment can be seen in the phylogenetic tree in Figure 8.18.
Figure 8.18. Phylogenetic trees of the F gene of Inactivated ND samples transported from Indonesia. The analysis was conducted in MEGA5 involved 39 nucleotide sequences. There were a total of 307 positions in the final dataset.
AY935499 I2 Vaccine..
AY935500 I2 Progenitor..
AP1 F Chicken NSW As at Sep 2009..
SP3 F Chicken NSW As at Sep 2009..
NDV Pusvetma NDV HA antigen - This study.
AB465607 NDV Japan-Ishii-1962.
M24693 NDV Class 2 Gen 1 (Chicken/V4/AUS(QLD)/66).
AF217084 NDV Class 2 Gen 1 (V4/AUS(QLD)/66).
V4 F Chicken V4 Qld As at Sep 2009..
FP1 F Chicken NSW As at Sep 2009..
NDV Balitvet NDV HA antigen - This study.
AY935495 Somersby NSW Jul 99 Progenitor..
AY935489 NSW Jul 2001 Progenitor..
AY935491 Mangrove Mountain Sep 98 Progenitor..
AY935497 Peats Ridge NSW Aug 99 Progenitor..
AY935496 Somersby NSW Jul 99 Progenitor..
AY935492 Dean Park NSW Sep 98 Virulent..
AY935493 Dean Park NSW Sep 98 Virulent..
AY935490 Meridith Vic Aug 2002 Virulent..
AY935494 Mangrove Mountain Apr 99 Virulent..
AY935498 Schofields NSW Aug 99 Virulent..
M24696 NDV Class 2 Gen 2 (Chicken/LaSota/46).
AF077761 F NDV Class 2 Gen 2 (LaSota).
M24700 NDV Class 2 Gen 3 (AUS/32).
AY508514 NDV Class 2 Gen 9 (StrainF48E9).
EF201805 F NDV Class 2 Gen 3 (Mukteswar).
AY741404 F NDV Class 2 Gen 4 (Chicken/Herts/33).
AY562987 F NDV Class 2 Gen 5 (Gamefowl/US(CA)).
AF048763 NDV Class 2 Gen 8 (StrainAF2240/Malaysia).
AF378252 NDV Class 2 Gen 8 (Chicken/QH 4/85).
Z12111 NDV Class 2 Gen 6e (US(CA)).
AY390291 NDV Class 2 Gen 6 (Pigeon/PB9601).
DQ439884 NDV Class 2 Gen 6b (NDV05 027).
DQ486859 F NDV Class 2 Gen 7 (StrainGM/China).
AF358788 NDV Class 2 Gen 7 (Chicken strain/China/2000).
EF564831 NDV Class 1 Gen 8 (Ruddy turnstone/US(DE)/04)..
DQ097393 F NDV Class 1 Gen 2 (Strain DE R49/99)..
EF564813 NDV Class 1 Gen 4 (Green winged teal/US(AK)/98)..
EF564820 NDV Class 1 Gen 7 (Mallard/US(MD)/04)..54
93
100
100
90
100
71
98
85
81
82
50
34
50
75
100
97
99
40
94
31
29
80
41
72
83
48
88
27
44
37
34
0.05

113
The RNA’s from the AIV samples from Indonesia were extracted and a 590 bp
sequence from each of the haemagglutinin genes was amplified using the H5-GB590
forward and reverse set of primers primer (Figure 8.19)
Figure 8.19 Amplification of 590bp of the H5 genes of AI viral RNA transported from
Indonesia. Amplification of 590bp and 1307bp fragments from the transported AI viral RNA not
only indicates that the RNA can be used for diagnostic purposes but that it is not
fragmented. These sequences could then be used to pathotype the isolates.
Sequences of amplified 590 bp H5 gene of processed AI viral RNA were analysed and
compared to and other isolates accessed from GenBank. This analysis showed that H5
sequences of the transported viral RNA’s have a similarity with other H5 sequences
submitted from Indonesian isolates.
Three different clusters were demonstrated. Tanggerang and Sukabumi isolates were
separated in two different clusters while Timika and Ambon grouped in one cluster. All
of these isolates (Timika, Ambon, Tanggerang and Sukabumi) were aligned in the clade
2.1.3 of H5N1 HPAI. The phylogenetic analysis can be seen in Figure 8.20
590 bp of H5 gene

114
Figure 8.20 Phylogenetic trees of 590 bp of H5 of AI viral RNA transported from Indonesia The analysis involved 27 nucleotide sequences. A total of 516 positions in the final dataset were analysed using MEGA5
Alignment of the diagnostic primers on the 590bp sequences of AI viruses in this study
showed that there were two mismatches identified in the Sukabumi isolates to the
forward primer (IVA-DA148H5-F) and probe (IVA-H5a) (Heine et al., 2005) These
isolates failed to react in the TaqMan PCR (Figure 8.4). However, when the primers
were used in RTPCR with SYTO 9, all of the isolates including the Sukabumi isolates
reacted. It was concluded that the mismatches under the probe were critical for
detecting these viruses (Figure 8.21).
Tangerang 1 A/Chicken/Indonesia/Tangerang 1/2007 H5N1.
Tangerang 10 A/Chicken/Indonesia/Tangerang 10/2007 H5N1.
CY019352 A/Indonesia/CDC1031/2007(H5N1) Clade 2.1.3.
CY019384 A/Indonesia/CDC1032/2007(H5N1) Clade 2.1.3.
CY019408 A/Indonesia/CDC1046/2007(H5N1) Clade 2.1.3.
CY017654 A/Indonesia/CDC940/2006(H5N1) Clade 2.1.3.
EU124205 A/Chicken/Indonesia/Lampung1631-23/2006(H5N1).
CY014457 A/Indonesia/CDC634T/2006(H5N1).
Timika 1 A/Chicken/Indonesia/Timika 1/2006 H5N1.
Timika 10 A/Chicken/Indonesia/Timika 10/2006 H5N1.
Ambon 5 A/Chicken/Indonesia/Ambon 5/2006 H5N1.
Ambon 4 A/Chicken/Indonesia/Ambon 4/2006 H5N1.
EU124160 A/Chicken/West Java/SMI-PAT/2006(H5N1).
EU124277 A/chicken/West Java/TASIKSOB/2006(H5N1).
EU146672 A/Indonesia/245H/2005(H5N1).
EU124201 A/Chicken/Indonesia/Belitung Timor1631-18/2006(H5N1).
Sukabumi 3 A/Chicken/Indonesia/Sukabumi 3/2007 H5N1.
Sukabumi 10 A/Chicken/Indonesia/Sukabumi 10/2007 H5N1.
EU146622 A/Indonesia/5/2005(H5N1) Clade 2.1.3.
EU146632 A/Indonesia/7/2005(H5N1) Clade 2.1.3.
EF473080 A/chicken/Indonesia/7/2003(H5N1) Clade 2.1.1.
EF473081 A/chicken/Indonesia/11/2003(H5N1) Clade 2.1.1.
EU146745 Influenza A virus (A/Indonesia/538H/2006(H5N1) Clade 2.1.2.
CY014280 A/Indonesia/CDC595/2006(H5N1) Clade 2.1.
AY651334 Influenza A virus (A/Viet Nam/1203/2004(H5N1)) Clade 1.
DQ100557 Influenza A virus (A/great black-headed gull/Qinghai/1/2005(H5N1)) Clade 2.2.
AF144305 Influenza A virus (A/Goose/Guangdong/1/96(H5N1)) Clade 0.
100
88
99
90
99
59
39
90
64
93
94
64
97
12
11
64
65
59
22
17
67
0.005

115
Figure 8.21 Mismatches in Indonesian sequences and IVA-DA148H5 forward primer and probe. At least two mismatches were identified under the IVA-DA148H5 forward primer and with the Sukabumi isolates there were mismatches under the probe.
Also 1307 bp PCR products were successfully amplified and sequenced from the
Sukabumi AI viral RNA transported from Indonesia. The amplified DNA can be seen in
Figure 8.22
Figure 8.22 Amplification of a 1307 of H5 gene of AI viral RNA’s processed and transported
from Indonesia
Sequencing a full length sequence (1307 bp) H5 of transported viral RNA confirmed
that RNA fragmentation was not a problem. Near full length HA sequencing was only
attempted for the Sukabumi isolates.
460 * 480 * 500 * 520 * 540 * 560
AGCAAGACTAAACAGAGAGGAAATAAGTGGAGTAAAATTGGAATCAATGGGAACTTACCAAATACTGTCAATTTATTCAACAGTGGCGAGTTCCCTAGCACTGGCGGCAAGACTAAACAGAGAGGAAATAAGTGGAGTAAAATTGGAATCAATAGGAACTTACCAAATACTGTCAATTTATTCAACAGTGGCGAGTTCCCTAGC------AGCGAGACTAAAAAGAGAGGAAATAAGTGGAGTAAAATTGGAATCAATAGGAATTTACCAAATACTGTCAATTTATTCTACAGTGGCGAGTTCCCTAGCACTGGCAGCAAGATTAAAAAGAGAGGAAATAAGCGGAGTAAAACTGGAATCAATAGGAATTTACCAAATACTGTCAATTTATTCAACAGTGGCGAGTTCCCTAGCACTGGCAGCAAGATTAAAAAGAGAGGAAATAAGCGGAGTAAAACTGGAATCAATAGGAATTTACCAAATACTGTCAATTTATTCAACAGTGGCGAGTTCCCTAGCACTGGCAGCAAGATTAAAAAGAGAGGAAATAAGTGGAGTAAAATTGGAATCAATAGGAACTTACCAAATACTGTCAATTTATTCAACAGTGGCGAGTTCCCTAGCACTGGCAGCAAGATTAAAAAGAGAAGAAATAAGTGGAGTAAAATTGGAATCAATAGGAACTTACCAAATACTGTCAATTTATTCAACAGTGGCGAGTTCCCTAGCACTGGCAGCAAGATTAAAAAGAGAGGAAATAAGTGGAGTAAAATTGGAATCAATAGGAACTTACCAAATACTGTCAATTTATTCAACAGTGGCGAGTTCCCTAGCACTGGCAGCAAGATTAAAAAGAGAGGAAATAAGTGGGGTAAAATTGGAATCAATAGGAACTTACCAAATACTGTCAATTTATTCAACAGTGGCGAGTTCCCTAGCACTGGCAGCAAGGTTAAAAAGAGAGGAAATAAGTGGGGTAAAATTGGAATCAATAGGAACTTACCAAATACTGTCAATTTATTCAACAGTAGCGAGTTCTCTAGCACTGGCAGCAAGGTTAAAAAGAGAGGAAATAAGTGGGGTAAAATTGGAATCAATAGGAACTTACCAAATACTGTCAATTTATTCAACAGTAGCGAGTTCTCTAGCACTGGCAGCAAGATTAAAAAGAGAGGAAATAAGTGGGGTAAAATTGGAATCAATAGGAACTTACCAAATACTGTCAATTTATTCAACAGTGGCGAGTTCCCTAGCACTGGCAGCAAGATTAAAAAGAGAGGAAATAAGTGGGGTAAAATTGGAATCAATAGGAACTTACCAAATACTGTCAATTTATTCAACAGTGGCGAGTTCCCTAGCACTGGCAGCAAGATTAAAAAGAGAGGAAATAAGTGGGGTAAAATTGGAATCAATAGGAACTTACCAAATACTGTCAATTTATTCAACAGTGGCGAGTTCCCTAGCACTGGCAGCAAGATTAAAAAGAGAGGAAATAAGTGGGGTAAAATTGGAATCAATAGGAACTTACCAAATACTGTCAATTTATTCAACAGTGGCGAGTTCCCTAGCACTGGCAGCAAGATTAAAAAGAGAAGAAATAAGTGGGGTAAAATTGGAATCAATAGGGACTTACCAAATACTGTCAATTTATTCAACAGTGGCGAGTTCCCTAGCACTGGCAGCAAGATTAAAAAGAGAAGAAATAAGTGGGGTAAAATTGGAATCAATAGGGACTTACCAAATACTGTCAATTTATTCAACAGTGGCGAGTTCCCTAGCACTGGCAGCAAGATTAAAAAGAGAAGAAATAAGTGGGGTAAAATTGGAATCAATAGGGACTTACCAAATACTGTCAATTTATTC---------------------------AGCAAGATTAAAAAGAGAAGAAATAAGTGGGGTAAAATTGGAATCAATAGGGACTTACCAAATACTGTCAATTTATTCAACAGTGGCGAGTTCCCTAGCACTGGCAGCAAGATTAAAAAGAGAGGAAATAAGTGGGGTAAAATTGGAATCAATAGGAACTTACCAAATACTGTCAATTTATTCAACAGTGGCGAGTTCCCTAGCACTGGCAGCAAGATTAAAAAGAGAGGAAATAAGTGGGGTAAAATTGGAATCAATAGGAACTTACCAAATACTGTCAATTTATTCAACAGTGGCGAGTTCCCTAGCACTGGCAGCAAGATTAAAAAGGGAGGAAATAAGTGGGGTAAAATTGGAATCAATAGGAACTTACCAAATACTGTCAATTTATTCAACAGTAGCGAGTTCCCTAGCACTGGCAGCAAGATTAAAAAGAGAGGAAATAAGTGGGGTAAAGTTGGAATCAATAGGAACTTACCAAATACTGTCAATTTACTCAACAGTGGCGAGTTCCCTAGCACTGGCAGCAAGATTAAAAAGAGAGGAAATAAGTGGGGTAAAGTTGGAATCAATAGGAACTTACCAAATACTGTCAATTTACTCAACAGTGGCGAGTTCCCTAGCACTGGCAGCAAGATTAAAAAGAGAGGAAATAAGTGGGGTAAAGTTGGAATCAATAGGAACTTACCAAATACTGTCAATTTACTCAACAGTGGCGAGTTCCCTAGCACTGGCAGCAAGATTAAAAAGAGAGGAAATAAGTGGGGTAAAGTTGGAATCAATAGGAACTTATCAAATACTGTCAATTTACTCAACAGTGGCGAGTTCCCTAGCACTGGCAGCAAGATTAAAAAGAGAGGAAATAAGTGGGGTAAAGTTGGAATCAATAGGAACTTATCAAATACTGTCAATTTACTCAACAGTGGCGAGTTCCCTAGCACTGGCaGCaAGatTAAAaAGaGAgGAAATAAGtGG GTAAAatTGGAATCAATaGGaAcTTAcCAAATACTGTCAATTTAtTCaacagtggcgagttccctagcactggc
: 561 : 555 : 561 : 561 : 561 : 561 : 561 : 561 : 561 : 561 : 561 : 561 : 561 : 561 : 561 : 561 : 561 : 534 : 561 : 561 : 561 : 561 : 561 : 561 : 561 : 561 : 543
AF144305 : DQ100557 : AY651334 : CY014280 : EU146745 : EF473081 : EF473080 : EU146632 : EU146622 : Sukabumi_3 : Sukabumi_1 : EU124201 : EU146672 : EU124277 : EU124160 : Timika_1 : Timika_10 : Ambon_5 : Ambon_4 : CY014457 : EU124205 : CY017654 : CY019408 : CY019384 : CY019352 : Tangerang_ : Tangerang_ :
Forward Primer Probe
1307 bp of H5 gene

116
The phylogenetic analysis indicated the similarity of Sukabumi 3 H5 sequence to the
other Indonesian H5 isolates submitted to GenBank (EU124150, EU124276,
EU124160, EU124148). This accession confirmed the similarity of H5 gene of viral
RNA Sukabumi 3 with other H5 genes submitted from H5 genes from West Java
isolates in 2006. The phylogenetic tree of H5 genes of Sukabumi 3 can be seen in
Figure 8.23
Figure 8.23. Phylogenetic analysis of 1307 bp of H5 of Sukabumi 3 viral RNA. The analysis involved 9 nucleotide sequences. There were a total of 1456 positions in the final dataset conducted in MEGA5
Moreover, the translation protein of H5 sequences of Sukabumi 3 viral RNA demonstrated that Sukabumi isolate were likely to be HPAI with the protein of cleavage site R-R-K-K-R-G-L-F (Figure 8.24)
Figure 8.24 Amino acid translations of H5 sequences of Sukabumi 3 viral RNA
8.6 Discussion
Viral isolates processed using a commercial lysis buffer were successfully consigned
from Indonesia to Australia without a cold chain. It is interesting to note that this not
only applied to the AI viral isolates but also to the NDV HA antigens that were
inactivated with Beta propiolactone
Beta propiolactone is an efficient inactivating agent for viruses such as rabies virus, ND
virus and AI virus. This reagent is utilised for vaccine production. As a viral
inactivating agent, it was anticipated that the Beta propiolactone would have at least
EU124213 Influenza A virus (A/Swan/Indonesia/Malang1631-61/2007(H5N1)
CY014457 Influenza A virus (A/Indonesia/CDC634T/2006(H5N1)
EU146809 Influenza A virus (A/Indonesia/569H/2006(H5N1)
CY014200 Influenza A virus (A/Indonesia/CDC292N/2005(H5N1)
EU124160 Influenza A virus (A/Chicken/West Java/SMI-PAT/2006(H5N1)
EU124148 Influenza A virus (A/Chicken/West Java/PWT-WIJ/2006(H5N1)
EU124276 Influenza A virus (A/chicken/West Java/SMI-CSLK-EB/2006(H5N1)
EU124150 Influenza A virus (A/Indonesia/CDC634T/2006(H5N1)
SKB3 1307 A/Chicken/Indonesia/Sukabumi3/2007 (H5N1)
68
29
69
100
72
71
0.002

117
fragmented the nucleic acid (Kubinski and Szybalski, 1975; King, 1991; Refaie et al.,
2004). However, this study indicated that the RNA could still be very effective in the
screening assay and that a PCR product of more than 300 bp could be produced for
sequencing.
Analysis of the sequences demonstrated that these two antigens were derived from
isolates that were similar to the Australian NDV chicken isolates (V4, AP1, FP1, and
SP3) and a not similar to the Australian NDV isolates WA Isolate 3245 and Ibis
Queensland-06
Avian Influenza viral isolates from four different locations in Indonesian were
successfully detected using RT-qPCR assays that utilised AI M primers (Ward et al.,
2004). This RT-qPCR assay was performed using DNA binding dye SYTO9 based on a
protocol developed and described in Chapter 4 and Chapter 6. Another RT-qPCR assay
based on a dual labelled probe for the M gene (Heine et al., 2005) also successfully
detected all transported Indonesian AI viral isolates.
An influenza A H5 assay based on an H5 dual labelled probe (Heine et al., 2005)
successfully detected the Timika, Ambon and Tanggerang isolates but failed to detect
the samples from Sukabumi.
Mismatches under the primers especially in the 5` portion of the primer can be
tolerated. However mismatches under the probe may result in the samples failing to
react. In this study the H5 primers in an RT-qPCR assay based on SYTO 9 detected all
four groups of isolates. The two base mismatch under the probe resulted in failure to
detect the Sukabumi isolates.
A second pair of H5 primers was used in an attempt to detect the isolates. These primers
were successfully used to detect H5 influenza A viruses isolates from several avian
species including chicken, duck, quail, pigeon, and open bilk stork during outbreak in
Thailand in 2004-2005 (Thontiravong et al., 2007). However, this pair of primers failed
to detect Indonesian AI isolates from four different locations. This may be related to
differences between the Thai and Indonesian isolates.

118
The rapid evolution requires the application of a range of detection and scanning assays.
The HRM assay has considerable potential for identifying changes in the genome. The
principal of high resolution melt assay is measuring subtle differences in Tm that are the
result of base changes. The assay uses relatively small amplicons (Ikuta et al., 1987;
Zhou et al., 2004; Zhou et al., 2005; Gundry et al., 2008). It is a simple assay that can
be applied to large numbers of samples to highlight differences that can warrant further
investigation.
High resolution analysis was applied to the isolates derived from four different locations
in Indonesia. Differences were subsequently reflected in the differences in the
sequences and it highlights the continued evolution of these viruses (Smith et al., 2006).
While this assay is effective in recognising changes in the isolates it is still necessary to
follow this with sequencing to determine the phylogenetic relationships and to carry out
pathotyping of the Indonesian isolates.
Sequencing of the transported AI and ND viral RNA was carried out. Sequencing of the
NDV F and AI H5 genes has indicated that fragmentations of the RNA was not a
problem when the lysis buffer was used.
Genetic analysis of the F gene the ND viral antigens showed that both NDV Balitvet
and Pusvetma fitted into Class II genotype I. The NDV Balitvet had a close relationship
to the Australian V4 and FP1 isolates while the Pusvetma sequence was similar to the
Japanese Ishii 1962 isolate.
Phylogenetic studies of the AI viral RNA demonstrated that all of the samples from
Indonesia fitted into clade 2.1.3 of H5N1 HPAI. The four groups of isolates were placed
into three different clusters. Timika and Ambon were in one cluster while Tanggerang
and Sukabumi formed two separate clusters.
Analysis of sequences of these AI viruses showed the heterogeneity of H5 sequences
between three clusters. This analysis confirmed the different sequences between AI
viruses collected in 2006 (Timika and Ambon) and in 2007 (Tanggerang and
Sukabumi). This also corresponded to an apparent change in virulence with a reduction
in clinical signs and mortality rate based on information from the field.

119
8.7 Conclusion
Collection and transportation without a cold chain was successfully achieved by
delivering ND and AI viral RNA to Australia. These isolates could be successfully
detected in the appropriate diagnostic assays. In addition the RNA did not appear to be
fragmented and could be used for generating sequences that allowed phylogenetic
studies and an estimation of the pathogenicity of the isolates. This was achieved without
the use of a cold chain.
Use of this technology could substantially enhance the effectiveness of molecular
epidemiological studies by facilitating the transfer of representative samples without the
problems associated with quarantine. There may also be a very substantial improvement
in the quality of the end results.

120
CHAPTER 9
GENERAL DISCUSSION
Sample collection and transportation without a cold chain is an important method in AI
and ND diagnosis. This method can facilitate the limited infrastructure facilities in
developing countries and also overcome the quarantine restriction between countries.
Indeed, this method can be also facilitate a rapid and reliable diagnosis as a response of
an outbreak in different areas or countries. Thus, this method can support
epidemiological surveillance programs for the early detection and warning systems for
poultry diseases.
However, collection and transportation without cold chain is not enough to support AI
and ND diagnosis. Therefore in this study investigated several steps to address the
molecular diagnosis and typing of AI and ND using samples collected and transported
without a cold chain.
The first step was reviewing or developing a set of diagnostic assay for AI and ND and
integrating them into the collection and transportation protocols.
Diagnostic assays based on real time RT PCR have been developed and published.
SYBR Green and dual labelled TaqMan probes have been widely used to diagnose AI
and ND (van Elden et al., 2001; Spackman et al., 2002; Tan et al., 2004; Ward et al.,
2004; Pham et al., 2005; Payungporn et al., 2006a; Ong et al., 2007). However, SYBR
Green and dual labelled probe have limitations. SYBR green can inhibit PCR reactions
in a dependent concentration manner caused by the degradation products of the dyes.
Whereas dual labelled probes with mismatches may fail to bind resulting in false
negative results (Wittwer et al., 2001; Monis et al., 2005; Kim et al., 2006). In this
study assays based on the interchelating dye SYTO 9 were used to augment the probe
based assays for ND and AI.
RT-qPCR assays to diagnose both Class I and Class II NDV were successfully
developed using SYTO 9. This dye has low toxicity and bright fluorescence and it can
be used in a high resolution melt configuration to differentiate primer dimer from
specific products and to type the isolates based on variations in their melting points

121
(Wittwer et al., 2001). However, assay based on SYTO 9 RT-qPCR must utilise
appropriate pairs of primers. This study designed and evaluated primers for both the M
and F genes of NDV. The M gene is relatively conserved and two pairs of M gene
primers were developed into a duplex configuration. A set of published primers
(M+4100 forward and M-4220 reverse) based on the M gene of Class II NDV was
evaluated (Wise et al., 2004). A second set (NDV MGB1) based on the GenBank
submission AY626266M was designed and evaluated for the detection of Class I NDV
isolates. The controls for these primers were a WA Duck Isolate 3245 (Alexander et al.,
1986) and Ibis Queensland. The controls for the Class II primers were V4 Queensland
and a set of similar isolates.
A SYTO 9 RT-qPCR was also successfully applied to AI viruses. A few pairs of
primers (Ward et al., 2004; Heine et al., 2005) were also evaluated by another student
using both TaqMan and SYBR Green formats (Nguyen, 2007). Therefore, in this study,
those primers were applied using SYTO 9 in RT-qPCR.
The diagnostic assays for ND were followed by sequencing of the viral isolates. This
sequencing was crucial to determine viral pathotyping and phylogenetic relationships of
ND isolates. Sequencing was based on both the M and F genes.
The F gene of NDV is an important determinant of pathogenicity. Sequencing and
estimating the amino acid sequence can determine the F0 cleavage site. The presence of
two pairs of basic amino acids is indicative of a furin cleavage site. Virulent isolates of
Class II NDV have a motif 112R/K-R-Q-K/R-R116 at the C terminus of the F2 protein
and Phenylalanine at the N terminus of the F1 protein whereas low virulence viruses
have the amino acid sequence motif 112G/E-K/R-Q-G/E-R116 and Leucine at residue 117
(Alexander, 1990; Alexander, 1995; Collins et al., 1996; Aldous and Alexander, 2001;
Gould et al., 2003; OIE, 2004).
In this study, a pair of F primers ( F302f and F596r) (Stanislawek et al., 2002), was used
to produce a 274 bp product from Class I viruses. A published pair of F primers
(Creelan and McCullough, 2006) failed to reliably produce a suitable product from the
Class II viruses. Therefore, a pair of primers was designed to produce a 343 bp product
for sequencing. These primes were designed using an aligned set of NDV Class II

122
Fusion genes and it was successfully used to sequence the V4, AP1, FP1, and
SP3isolates.
Analyses of F gene sequences of six ND isolates confirmed that the isolates represented
both classes. It was noted that V4 and FP1 clustered together while FP1 and SP3 were
more closely aligned with the I2 vaccine virus (Wang et al., 1992; Gould et al., 2003;
Kattenbelt et al., 2006a). All Class II isolates could be differentiated from the Australian
viruses responsible for recent outbreaks in chickens. However, they were all genotype 1
viruses.
The WA duck isolate 3245 had a cleavage site S-G-G-E-R-Q-E-R-L-V. The Ibis isolate
had a S-G-G-E-Q-Q-G-R-L-I while the Class II isolates V4, AP1, FP1 and SP3 had a
sequence of S-G-G-G-K-Q-G-R-L-I at the cleavage site. Therefore it was concluded
that all of the isolates used in this study had a cleavage site consistent with low
virulence.
A total of four buffers STDB, LB, VBB, and LSDB were initially evaluated in a pilot
study. These buffers contained various different chemicals including SDS, EDTA,
Proteinase K, Guanidine HCL, Guanidine Isothiocyanate, Dithiothreitol. Two buffers
were chosen for the definitive study. The solid tissue digest buffer was based on SDS
and Proteinase K while the lysis buffer contained Guanidine Isothiocyanate and
Dithiothreitol. Carrier RNA was added to both buffers.
The SDS and Proteinase K in STDB successfully preserved RNA and gave the best
performance. As a detergent, sodium dodecyl sulphate solubilises and denatures
proteins by disrupting the cell membrane. Moreover, Proteinase K in the STDB behaves
as a proteolytic enzyme which has the ability to degrade ribonuclease and purify the
nucleic acid from a cell (Brown, 1995; Albert et al., 2002; Albert et al., 2004; Clark,
2005; Turner et al., 2005; Privé, 2007). However, this buffer failed to completely
inactivate the V4 strain of NDV. Therefore, lysis buffer was chosen for further study as
samples needed to be completely inactivated to be imported under an AQIS permit.
GuSCN is used in many application of nucleic acid extraction (Chirgwin et al., 1979;
Chomczynski and Sacchi, 1987; Boom et al., 1990; Chomczynski and Mackey, 1995;
Chomczynski and Sacchi, 2006). This chaotropic agent has a powerful ability to disrupt

123
and dissolve molecular structures, destabilize proteins, lyse cells and inhibit nuclease
and protease activities (Chirgwin et al., 1979; Boom et al., 1990; Ness and Chen, 1991;
Sambrook and Russel, 2001; Clark, 2005). The addition of Dithiothreitol and carrier
RNA allowed the buffer to preserve RNA for at least one month at 37˚C with minimal
loss. This is sufficient for the transportation in the absence of a cold chain.
Both of the buffers could be readily integrated with the RNA extraction protocols using
a robotic device (Corbett Research, Brisbane).
However, extracted and purified RNA can potentially be degraded during storage or
when it is frozen and thawed. Two buffers (TCB and mRSB) containing carrier RNA
were evaluated for the storage of extracted RNA. They were evaluated for long term
storage at -20°C for nine months and for a repeated freeze and experiment with 10
successive cycles of thawing and freezing. Both buffers successfully preserved the
RNA. However, it was speculated that the mRSB which contained sodium azide would
be more likely to provide added protection for the RNA if there was aerosol bacterial
contamination during the freeze thaw steps.
The definitive study was carried out using samples collected in Indonesia. A total of
four groups of isolates of AI from outbreaks from different regions in Indonesia were
processed at the Quarantine Agency laboratory of Indonesia. In addition two samples of
NDV HA antigen was purchased from two suppliers (Balitvet and Pusvetma).in
Indonesia. The allantoic fluids and NDV antigens were added to lysis buffer and
transported to JCU, Townsville.
The AIV and NDV samples were confirmed using SYTO 9 real time RT-PCR screening
assays. In order to confirm that the RNA was not fragmented sequencing was carried
out using PCR products.
The AIV isolates were initially screened using a SYTO 9 RT-qPCR and TaqMan dual
labelled probe in RT-qPCR. Both of these assays targeted the M gene (Ward et al.,
2004; Heine et al., 2005). As these isolates were suspected to be H5N1 they were tested
with H5 primers in a TaqMan format (Heine et al., 2005) and with SYTO 9 in RT-PCR.
All of the isolates reacted in the SYTO 9 assay while the isolates from Sukabumi failed
to react in the TaqMan assay. All of the AI samples were amplified with a set of H5

124
primers that produced a 590 bp product. Selected isolates were amplified with a set of
H5 primers specifically aimed at the Sukabumi isolates to produce a 1370 bp product.
The sequencing indicated that all of the isolates were H5 in the clade 2.1.3. The Timika
and Ambon isolates formed a cluster that was separate from the Tangerang and
Sukabumi isolates. It was noted that there were mismatches under the H5 forward
diagnostic primer. This did not prevent the SYTO-9 assay from recognising the isolates.
An additional two mismatches were noted under the probe for the Sukabumi isolates
and it was concluded that these were sufficient to prevent the annealing of the probe.
The sequencing did not include the binding site for the reverse primer.
The NDV isolates were also sequenced and it was clear that they were both Class II
genotype 1 isolates. The Balitvet antigen was similar to V4-Queensland-66 while the
NDV Pusvetma was almost identical to the NDV Japan-Ishii-1962. It was anticipated
that the β propiolactone used to inactivate the antigens may degrade the RNA. A set of
F primers successfully produced a 343 bp product that allowed sequencing to be carried
out.
This component of the study demonstrated that samples could be collected in Indonesia,
transported for up to a month at room temperature and they are suitable for both use in
diagnostic assays and for sequencing studies. A product that spanned most of the H
gene of influenza was amplified.
This molecular epidemiology study of AIV and NDV was successfully carried out using
sample collection and transportation without a cold chain. However, at this stage, the
method collection and transportation has not been applied to clinical and field samples.
This is the logical extension of this work. If this can be achieved clinicians in
developing countries could collect samples and place them into suitable transport media.
They could be sent to the laboratories without a cold chain. This may decrease the
urgency of the transportation. The samples as they arrive would be compatible with the
extraction process.
The samples could be forwarded to reference laboratories that do not have to use high
security facilities to handle the imported reagents. This would facilitate the use of a

125
much wider the range of reference and collaborating laboratories and there could be
very significant cost savings.

126
CHAPTER 10
CONCLUSION
Molecular epidemiology of AIV and NDV has been successfully addressed using
sample collection and transportation without a cold chain. In this method, lysis buffer
was the preferred buffer to transport samples from one to another country.
In addition a set of diagnostic assays and sequencing tools was evaluated and buffers for
the preservation of RNA were investigated.
The end result is a safe integrated system of sample collection, processing and
transportation that does not require a cold chain. A proof of concept study was carried
out in which AI and ND viral samples were sourced from Indonesia and transported to
Australia at ambient temperatures. The extracted RNA was of high titre and
fragmentation of the RNA did not impede sequencing. It is likely that the RNA was not
fragmented.
This demonstrates the utility of this protocol. If this can be extrapolated to field samples
it has the potential to make a very valuable contribution to disease diagnosis in both
developing and developed countries

127
APPENDIX 1. Distilled water Water used in the preparation of solutions and solvents was distilled three times and was autoclaved at 68 KPa for ten minutes before use. 2. Elsevier’s Solution 8.16 g Tri-sodium citrate 0.55 g Citric acid 20.50 g Dextrose 4.20 g Sodium chloride, NaCl Dissolved in 1,000 mL distilled water and sterilized by autoclaving at 68 kPa for ten minutes. 3. Phosphate buffered saline (PBS).
a) PBS-A 8.00 g NaCl 0.2 g KCl 1.15 g Na2HPO4 0.2 g KH2PO4 1,000 mL Distilled water b) PBS-B 1.0 g MgCl2 6H2O 1.0 g CaCl2 6H2O 100 mL Distilled water Autoclaved each at 100 KPa for ten minutes. c) To make PBS: 5 mL PBS-B (500 mL) PBS-A added up to 500 mL and adjusted to pH 7.2.

128
4. Profile of RT-qPCR assay of V4 and D1 using three different primers (Chapter 4)
No Primers Isolates Mean of Ct-Value Melting Point
1 Wise-NDVM /M+ 4100(F) and M-4220R
(Wise et al., 2004)
V4 4.69 87.5
D1 (WA 3245) 22.15 -
2 Cr-NDV-Ch-F and R (Creelan et al., 2002a) V4 17.71 88
D1 (WA 3245) 21.345 -
3 NDV-MGB1-F and R (GenBank ID. AY626266 M) V4 24.68 -
D1 (WA 3245) 6.41 86.5
5. Evaluation NDV chicken and duck isolates using chicken M Primer (Chapter 4)
Primers Isolates Mean of Ct-Value Mean of Melting Point
Wise-NDVM /M+ 4100(F) and M-4220R (Wise et al., 2004)
V4 4.695 87.5 FP1 4.585 87.56 AP1 4.985 88.35 SP3 7.26 82.25 D1 22.355 -
dNTC 22.15 -

129
6. Diagnosis of NDV using Class I M Primer (Chapter 4)
Primers Isolates Mean of Ct-Value
NDV-MGB1-F and R (GenBank ID. AY626266 M)
V4 23.913 FP1 23.835 AP1 24.28 SP3 Neg D1 22.345
dNTC 6.41
7. Diagnosis of NDV using Duplex primers (Chapter 4)
Primers Isolates Mean of Ct-Value Mean of Melting Point Wise-NDVM /M+ 4100(F) and M-4220R (Wise et al., 2004) and NDV-MGB1-F and R (GenBank ID. AY626266 M)
V4 4.8267 86.67
D1 7.35 85
Ibis 6.3934 85
NTC 22.18
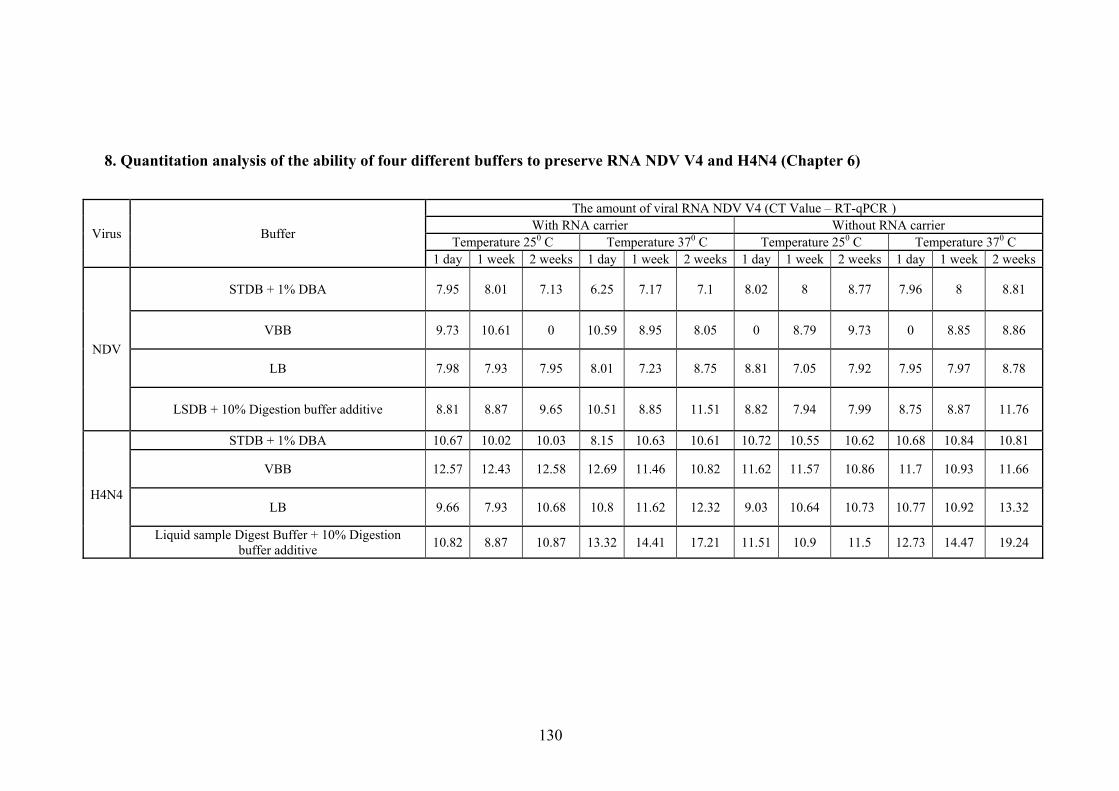
130
8. Quantitation analysis of the ability of four different buffers to preserve RNA NDV V4 and H4N4 (Chapter 6)
Virus Buffer
The amount of viral RNA NDV V4 (CT Value – RT-qPCR ) With RNA carrier Without RNA carrier
Temperature 250 C Temperature 370 C Temperature 250 C Temperature 370 C 1 day 1 week 2 weeks 1 day 1 week 2 weeks 1 day 1 week 2 weeks 1 day 1 week 2 weeks
NDV
STDB + 1% DBA 7.95 8.01 7.13 6.25 7.17 7.1 8.02 8 8.77 7.96 8 8.81
VBB 9.73 10.61 0 10.59 8.95 8.05 0 8.79 9.73 0 8.85 8.86
LB 7.98 7.93 7.95 8.01 7.23 8.75 8.81 7.05 7.92 7.95 7.97 8.78
LSDB + 10% Digestion buffer additive 8.81 8.87 9.65 10.51 8.85 11.51 8.82 7.94 7.99 8.75 8.87 11.76
H4N4
STDB + 1% DBA 10.67 10.02 10.03 8.15 10.63 10.61 10.72 10.55 10.62 10.68 10.84 10.81
VBB 12.57 12.43 12.58 12.69 11.46 10.82 11.62 11.57 10.86 11.7 10.93 11.66
LB 9.66 7.93 10.68 10.8 11.62 12.32 9.03 10.64 10.73 10.77 10.92 13.32
Liquid sample Digest Buffer + 10% Digestion buffer additive
10.82 8.87 10.87 13.32 14.41 17.21 11.51 10.9 11.5 12.73 14.47 19.24

131
9. Ct-Values of the PCR product of NDV V4 and AIV H4N4 processed in two transport buffers (Chapter 6)
Viruses Buffer
The amount of viral RNA (Mean of Ct Values – RT-qPCR).
Temperature 25°C Temperature 37°C
1 day 1 week 2 weeks 4 weeks 1 day 1 week 2 weeks 4 weeks
V4 STDB 6.69 6.68 6.84 6.42 6.38 7.17 5.99 6.26
LB 7.44 6.54 6.64 6.6 6.76 6.23 6.18 6.26
H4N4 STDB 8.12 9.11 8.08 9.06 8.48 8.78 8.87 9.04
LB 8.61 9.187 8.97 9.23 8.92 10.01 11.28 11.20

132
10. Mean of Ct-Values of viral RNA in thawing treatment using RNA storage buffers (Chapter 7)
Virus
Buffer
No thawing 5× thawing 10× thawing No
dilution 10×
dilution 1000 ×
dilution NTC No
dilution 10×
dilution 1000 ×
dilution NTC No
dilution 10×
dilution 1000 ×
dilution NTC V4 TE 5.9 12.2 21.3 20.9 5.7 9.1 14.9 22.4 5.7 8.9 14.8 22.4
Hoffmann 5.9 10.3 18.9 21.3 5.7 8.5 14.3 22.6 5.7 8.5 14.9 22.6
H4N4 TE 7.8 11.8 18.8 20.1 7.5 11.0 17.7 25.2 7.5 11.4 19.4 25.2 Hoffmann 7.8 12.0 17.7 20.2 7.5 11.1 17.0 25.4 7.5 11.0 17.3 25.4
11. The mean of Ct-Values of viral RNA in times treatment using RNA storage buffers
Viruses Buffer
The amount of viral RNA (CT Value – RT-qPCR)- V4
0 month 3 month 9 month
No dilution
10× dilution
1000 × dilution
NTC No
dilution 10×
dilution 1000 ×
dilution NTC
No dilution
10× dilution
1000 × dilution
NTC
V4
TE 5.9 12.2 21.3 20.9 5.1 9.5 21.9 24.5 5.7 9.1 24.8 22.4 Hoffmann 5.9 10.3 18.9 20.9 5.1 9.1 15.7 26.4 5.7 8.8 15.3 23.4
H4N4 TE 7.8 11.8 18.8 20.1 7.7 11.4 19.8 27.0 8.9 11.4 22.0 28.9
Hoffmann 7.8 12.0 17.7 20.2 7.7 11.6 18.0 27.5 8.9 11.2 18.0 28.8

133
12. The mean of Ct-Values, Melting point and HRM of qRT-PCR assay to the AI samples from Indonesia (Chapter 8)
No Target Sequences Primers / Probes Isolates Mean of Ct- Values Melting Points HRM 1 M AI Ward primers + SYTO 9, modified from
(Ward et al., 2004a; Munster et al., 2005) Timika (T) 6.7 84.5 Not measured Ambon (A) 5.86 84.71 Sukabumi (SKBM) 5.69 85 Tanggerang (TNG) 6.5 85.2
TaqMan AAHL primers and probes (Heine et al., 2005b) Timika (T) 11.3 Not available Not available Ambon (A) 10.5 Sukabumi (SKBM) 10.4 Tanggerang (TNG) 15.0
2 H5 TaqMan H5 AAHL primers and Fluor red and BHQ probes (Heine et al., 2005b)
Timika (T) 9.36 Not available Not available Ambon (A) 7.99 Sukabumi (SKBM) 14.64 Tanggerang (TNG) 8.44
H5 AAHL primers + SYTO 9 modified from (Heine et al., 2005b)
Timika (T) 10.30 80.8 79.23 Ambon (A) 8.39 81 79.3 Sukabumi (SKBM) 12.13 80.5 79.29 Tanggerang (TNG) 10.63 80 78.85
H5a Pay primers H5F3 and H5R2 + SYTO 9 modified from (Payungporn et al., 2006b)
Timika (T) 12.13 81.84 80.24 Ambon (A) 10.56 81.99 80.55 Sukabumi (SKBM) 9.33 82.36 80.88 Tanggerang (TNG) 10.58 82.3 81.19

134
13. The mean of Ct-Values, Melting point of qRT-PCR assay to the antigen NDV samples from Indonesia (Chapter 8)
No
Target Sequences
Primers / Probes Processed Antigen
Mean of Ct- Values
Melting Points
1 M NDV Duplex Wise-NDVM /M+ 4100F and M-4220 R (Wise et al., 2004) and NDV-MGB1 F and R (GenBank ID. AY626266 M)
NDV Antigen - Balitvet
7.42 86.30
NDV Antigen - Pusvetma
6.72 86.44

135
REFERENCES Abd-Elsalam, K.A. (2003) Bioinformatic tools and guideline for PCR primer design.
Afr. J. Biotechnol. 2 91-95
Abed, Y., Coulthart, M.B., Li, Y. and Boivin, G. (2003) Evolution of surface and nonstructural-1 genes of influenza B viruses isolated in the Province of Quebec, Canada, during the 1998-2001 period. Virus Genes 27: 125-35
Albert, B., Bray, D., Hopkins, K., Johnson, A., Lewis, J., Raff, M., Roberts, K. and Walter, P. (2004) Essential cell biology, edited by 2nd. Garland Science.
Albert, B., Johnson, A., Lewis, J., Raff, M., Roberts, K. and Walter, P. (2002) Molecular Biology of The Cell, 1463 pp, edited by 4th. Garland Science, New York.
Alberti, S. and Fornaro, M. (1990) Higher transfection efficiency of genomic DNA purified with a guanidinium thiocyanate-based procedure. Nucl. Acids Res. 18: 351-353
Aldous, E.W. and Alexander, D. (2001) Technical Review. Detection and differentiation of Newcastle disease virus (avian paramyxovirus type 1). Avian Pathol 30: 117-128
Aldous, E.W., Collins, M.S., McGoldrick, A. and Alexander, D.J. (2001) Rapid pathotyping of Newcastle disease virus (NDV) using fluorogenic probes in a PCR assay. Vet Microbiol 80: 201-12
Aldous, E.W., Mynn, J.K., Banks, J. and Alexander, D.J. (2003) A molecular epidemiological study of avian paramyxovirus type 1 (Newcastle disease virus) isolates by phylogenetic analysis of a partial nucleotide sequence of the fusion protein gene. Avian Pathol 32: 239-56
Alexander, D., Bell, J.G. and Alders, R.G. (2004) A Technology Review : Newcastle Disease with special emphasis on its effect on village chickens. FAO Animal Production and Health Paper: 1-22
Alexander, D.J. (1990) Avian Paramyxoviridae--recent developments. Vet Microbiol 23: 103-14
Alexander, D.J. (1995) The epidemiology and control of avian influenza and Newcastle disease. J Comp Pathol 112: 105-26
Alexander, D.J. (2000a) Newcastle disease and other avian paramyxoviruses. Rev Sci Tech 19: 443-62
Alexander, D.J. (2000b) A review of avian influenza in different bird species. Vet Microbiol 74: 3-13
Alexander, D.J. (2001) Gordon Memorial Lecture. Newcastle disease. Br Poult Sci 42: 5-22
Alexander, D.J., Mackenzie, J.S. and Russell, P.H. (1986) Two types of Newcastle disease viruses isolated from feral birds in western Australia detected by monoclonal antibodies. Aust Vet J 63: 365-7

136
Almarza, J., Morales, S., Rincon, L. and Brito, F. (2006) Urea as the only inactivator of RNase for extraction of total RNA from plant and animal tissues. Anal Biochem. 358: 143-145
Anonymous. (2004) Newcastle disease. OIE Manual of Diagnostic Test and Vaccines for Terrestrial Animals,
Arakawa, T., Prestrelski, S.J., Kenney, W.C. and Carpenter, J.F. (1993) Factors affecting short term and long term stabilities of proteins. Adv Drug Deliv Rev. 10: 1-28
Arnold, T. and Linke, D. (2007) Phase separation in the isolation and purification of membrane proteins. Biotechniques 43: 427-440
Ballagi-Pordany, A., Wehmann, E., Herczeg, J., Belak, S. and Lomniczi, B. (1996) Identification and grouping of Newcastle disease virus strains by restriction site analysis of a region from the F gene. Arch Virol 141: 243-61
Basehore, L.S.L., CA, US), Novoradovskaya, Natalia (San Diego, CA, US), Braman, Jeffery Carl (Carlsbad, CA, US). (2006) Combined lysis and PCR buffer, United States.
Boom, R., Sol, C.J., Heijtink, R., Wertheim-van Dillen, P.M. and van der Noordaa, J. (1991) Rapid purification of hepatitis B virus DNA from serum. J. Clin. Microbiol. 29: 1804-1811
Boom, R., Sol, C.J., Salimans, M.M., Jansen, C.L., Wertheim-van Dillen, P.M. and van der Noordaa, J. (1990) Rapid and simple method for purification of nucleic acids. J. Clin. Microbiol. 28: 495-503
Briggs, L.C., Ashton, R.M. and Metcalf, P. (2003) Development of a Highly Sensitive Screen for Influenza A in Guano and Its Application in the Search for Ancient RNA Preserved under Antarctic Adelie Penguin Colonies. Avian Dis 47: 1200-1202
Brown, C., King, D.J. and Seal, B.S. (1999) Pathogenesis of Newcastle disease in chickens experimentally infected with viruses of different virulence. Vet Pathol 36: 125-32
Brown, T. (1995) Gene Cloning, An introduction, 334 pp, edited by 3. Chapman & Hall, London.
Brown, T.A. (2000) Essential Molecular Biology. Volume One. A practical approach, 240 pp, edited by 2nd. Oxford University Press, Oxford.
Brugh, M., Erickson, G.A. and Beard, C.W. (1980) Embryonated eggs compared with fragments of chorioallantois attached to egg shell for isolation of Newcastle disease virus. Avian Dis 24: 486-92
Burgess, G.W. (1988) Basic principles of ELISA and variations in configuration. ELISA technology in diagnosis and research, edited by G.W. Burgess, Townsville.
Burgoyne, L.A. (1996) Solid medium and method for DNA storage. Flinders Technologies Pty Ltd (Bedford Park, AU), United States.
Bustin, S.A. and Mueller, R. (2005) Real-time reverse transcription PCR (qRT-PCR) and its potential use in clinical diagnosis. Clin Sci (Lond) 109: 365-79
Bustin, S.A. and Nolan, T. (2004) Pitfalls of Quantitative Real-Time Reverse-Transcription Polymerase Chain Reaction. J Biomol Tech 15: 155-166

137
Callan, R.J., Early, G., Kida, H. and Hinshaw, V.S. (1995) The appearance of H3 influenza viruses in seals. J Gen Virol 76 ( Pt 1): 199-203
Capua, I. and Alexander, D.J. (2004) Avian influenza: recent developments. Avian Pathol 33: 393-404
Carpenter, J.F. and Crowe, J.H. (1988) The Mechanism of Cryoprotection of Proteins by Solutes. Cryobiology 25: 244-255
Chen, H., Deng, G., Li, Z., Tian, G., Li, Y., Jiao, P., Zhang, L., Liu, Z., Webster, R.G. and Yu, K. (2004) The evolution of H5N1 influenza viruses in ducks in southern China. Proc Natl Acad Sci U S A 101: 10452-7
Chirgwin, J.M., Przybyla, A.E., MacDonald, R.J. and Rutter, W.J. (1979) Isolation of biologically active ribonucleic acid from sources enriched in ribonuclease. Biochemistry 18: 5294-5299
Chomczynski, P. (1993) A Reagent for the Single-Step Simultaneous Isolation of RNA, DNA and Prtoteins from Cell and Tissue Samples. BioTechniques 15: 532-535
Chomczynski, P. and Mackey, K. (1995) Substitution of Chloroform by Bromochloropropane in the Single-Step Method of RNA Isolation. Anal Biochem. 225: 163-164
Chomczynski, P. and Sacchi, N. (1987) Single-step method of RNA isolation by acid guanidinium thiocyanate-phenol-chloroform extraction. Anal Biochem. 162: 156-159
Chomczynski, P. and Sacchi, N. (2006) The single-step method of RNA isolation by acid guanidinium thiocyanate-phenol-chloroform extraction: twenty-something years on. Nat. Protocols 1: 581-585
Clark, D. (2005) Molecular Biology, Understanding the genetic revolution, edited by 1. Elseiver, Amsterdam.
Collins, M.S., Bashiruddin, J.B. and Alexander, D.J. (1993) Deduced amino acid sequences at the fusion protein cleavage site of Newcastle disease viruses showing variation in antigenicity and pathogenicity. Arch Virol 128: 363-70
Collins, M.S., Franklin, S., Strong, I., Meulemans, G. and Alexander, D.J. (1998) Antigenic and phylogenetic studies on a variant Newcastle disease virus using anti-fusion protein monoclonal antibodies and partial sequencing of the fusion protein gene. Avian Pathol 27: 90-96
Collins, M.S., Govey, S.J. and Alexander, D.J. (2003) Rapid in vitro assessment of the virulence of Newcastle disease virus isolates using the ligase chain reaction. Arch Virol 148: 1851-62
Collins, M.S., Strong, I. and Alexander, D.J. (1994) Evaluation of the molecular basis of pathogenicity of the variant Newcastle disease viruses termed "pigeon PMV-1 viruses". Arch Virol 134: 403-11
Collins, M.S., Strong, I. and Alexander, D.J. (1996) Pathogenicity and phylogenetic evaluation of the variant Newcastle disease viruses termed "pigeon PMV-1 viruses" based on the nucleotide sequence of the fusion protein gene. Arch Virol 141: 635-47
Connor, R.J., Kawaoka, Y., Webster, R.G. and Paulson, J.C. (1994) Receptor specificity in human, avian, and equine H2 and H3 influenza virus isolates. Virology 205: 17-23

138
Coombs, N.J., Gough, A.C. and Primrose, J.N. (1999) Optimisation of DNA and RNA extraction from archival formalin-fixed tissue. Nucl. Acids Res. 27: e12-
Creelan, J.L., Graham, D.A. and McCullough, S.J. (2002) Detection and differentiation of pathogenicity of avian paramyxovirus serotype 1 from field cases using one-step reverse transcriptase-polymerase chain reaction. Avian Pathol 31: 493-9
Creelan, J.L. and McCullough, S.J. (2006) Detection and differentiation of pathogenicity of avian paramyxovirus serotype 1 (APMV-1) from field cases using one-step real-time RT-PCR. Dev Biol (Basel) 126: 149-57; discussion 325-6
Crowther, J.R. (1993) The use of monoclonal antibodies in the molecular typing of animal viruses. Rev.sci.tech.Off.int.Epiz 12: 369-383
Czegledi, A., Herczeg, J., Hadjiev, G., Doumanova, L., Wehmann, E. and Lomniczi, B. (2002) The occurrence of five major Newcastle disease virus genotypes (II, IV, V, VI and VIIb) in Bulgaria between 1959 and 1996. Epidemiol Infect 129: 679-88
Czegledi, A., Ujvari, D., Somogyi, E., Wehmann, E., Werner, O. and Lomniczi, B. (2006) Third genome size category of avian paramyxovirus serotype 1 (Newcastle disease virus) and evolutionary implications. Virus Res 120: 36-48
Darminto. (1995) Diagnosis, epidemiology and control of two major avian viral respiratory diseases in Indonesia: Infectious Bronchitis and Newcastle Disease, James Cook University.
de Jong, M.D. and Hien, T.T. (2006) Avian influenza A (H5N1). J Clin Virol 35: 2-13
de Jong, M.D., Simmons, C.P., Thanh, T.T., Hien, V.M., Smith, G.J., Chau, T.N., Hoang, D.M., Chau, N.V., Khanh, T.H., Dong, V.C., Qui, P.T., Cam, B.V., Ha do, Q., Guan, Y., Peiris, J.S., Chinh, N.T., Hien, T.T. and Farrar, J. (2006) Fatal outcome of human influenza A (H5N1) is associated with high viral load and hypercytokinemia. Nat Med 12: 1203-7
de Leeuw, O.S., Hartog, L., Koch, G. and Peeters, B.P. (2003) Effect of fusion protein cleavage site mutations on virulence of Newcastle disease virus: non-virulent cleavage site mutants revert to virulence after one passage in chicken brain. J Gen Virol 84: 475-84
Devost, N.C. and Choy, F.Y. (2001) Mutation analysis of Gaucher disease using dot-blood samples on FTA(R) filter paper. American Journal of Medical Genetics 94: 417 - 420
Dunten, R.L. and Cohen, R.E. (1989) Recognition of modified forms of ribonuclease A by the ubiquitin system. J. Biol. Chem. 264: 16739-16747
Eischeid, A.C. (2011) SYTO dyes and EvaGreen outperform SYBR Green in real-time PCR. BMC Res Notes 4: 263
Felsenstein, J. (1985) Confidence Limits on Phylogenies: An Approach Using the Bootstrap. Evolution 39: 783-791
Fidler, D.P. (2008) Influenza Virus Samples, International Law, and Global Health Diplomacy. Emerg Infect Dis 14: 88-94
Flint, S.J., Enquist, L.W., Racaniello, V.R. and Skalka, A.M. (2004) Principles of Virology. Molecular Biology, Pathogenesis and Control of Animal Viruses, 918 pp. 2 ed. Principles of Virology. ASM Press, Washington.

139
Fouchier, R.A., Bestebroer, T.M., Herfst, S., Van Der Kemp, L., Rimmelzwaan, G.F. and Osterhaus, A.D. (2000) Detection of influenza A viruses from different species by PCR amplification of conserved sequences in the matrix gene. J Clin Microbiol 38: 4096-101
Garavito, R.M. and Ferguson-Miller, S. (2001) Detergents as Tools in Membrane Biochemistry. J. Biol. Chem. 276: 32403-32406
Gilbert, J. and Patey, A.L. (1998) Laboratory Proficiency Testing Programmes. Pure & Appl. Chem 70: 2309-2312
Gould, A.R. (2004) Molecular epidemiology of Newcastle disease virus In Australia.A report for the Rural Industries Research and Development Corporation Australian Government Rural Industries Research and Development Corporation. December 2004.
Gould, A.R., Hansson, E., Selleck, K., Kattenbelt, J.A., Mackenzie, M. and Della-porta, A.J. (2003) Newcastle disease virus fusion and haemagglutinin-neuraminidase gene motifs as markers for viral lineage. Avian Pathol 32: 361 - 373
Gould, A.R., Kattenbelt, J.A., Selleck, P., Hansson, E., Della-Porta, A. and Westbury, H.A. (2001) Virulent Newcastle disease in Australia: molecular epidemiological analysis of viruses isolated prior to and during the outbreaks of 1998-2000. Virus Res 77: 51-60
Greene, R.F., Jr. and Pace, C.N. (1974) Urea and Guanidine Hydrochloride Denaturation of Ribonuclease, Lysozyme, agr-Chymotrypsin, and {beta}-Lactoglobulin. J. Biol. Chem. 249: 5388-5393
Gundry, C.N., Dobrowolski, S.F., Martin, Y.R., Robbins, T.C., Nay, L.M., Boyd, N., Coyne, T., Wall, M.D., Wittwer, C.T. and Teng, D.H.F. (2008) Base-pair neutral homozygotes can be discriminated by calibrated high-resolution melting of small amplicons. Nucl. Acids Res. 36: 3401-3408
Harimoto, T. and Kawaoka, Y. (2005) Reviews. Influenza: lesson from past pandemics, warning from current incidents. Nat Rev Microbiol. 3: 591-600
He, Q., Marjamaki, M., Soini, H., Mertsola, J. and Viljanen, M. (1994) Primers are decisive for sensitivity of PCR. Biotechniques 17: 82-87.
Heine, H., Trinidad, L. and Selleck, P. (2005) Technical Report Influenza virus type A and subtype H5-specific real-time reverse transcription (RRT)-PCR for detection of Asian H5N1 isolates.Development of diagnostic capabilities for influenza H5N1 isolates Australian biosecurity Cooperative Research Centre for Emerging Infectious Disease Project 1.001R. 24 March 2005.
Heine, H.G., Trinidad, L., Selleck, P. and Lowther, S. (2007) Rapid detection of highly pathogenic avian influenza H5N1 virus by TaqMan reverse transcriptase-polymerase chain reaction. Avian Dis 51: 370-2
Herczeg, J., Wehmann, E., Bragg, R.R., Travassos Dias, P.M., Hadjiev, G., Werner, O. and Lomniczi, B. (1999) Two novel genetic groups (VIIb and VIII) responsible for recent Newcastle disease outbreaks in Southern Africa, one (VIIb) of which reached Southern Europe. Arch Virol 144: 2087-99
Hoffmann, B., Depner, K., Schirrmeier, H. and Beer, M. (2006) A universal heterologous internal control system for duplex real-time RT-PCR assays used in a detection system for pestiviruses. J Virol Methods 136: 200-209

140
Hoffmann, E., Stech, J., Guan, Y., Webster, R.G. and Perez, D.R. (2001) Universal primer set for the full-length amplification of all influenza A viruses. Arch Virol 146: 2275-89
Hua, Y.P., Chai, H.L., Yang, S.Y., Zeng, X.W. and Sun, Y. (2005) Primary survey of avian influenza virus and Newcastle disease virus infection in wild birds in some areas of Heilongjiang Province, China. J Vet Sci 6: 311-5
Huang, Y., Wan, H.Q., Liu, H.Q., Wu, Y.T. and Liu, X.F. (2004) Genomic sequence of an isolate of Newcastle disease virus isolated from an outbreak in geese: a novel six nucleotide insertion in the non-coding region of the nucleoprotein gene. Brief Report. Arch Virol 149: 1445-57
Huang, Z., Krishnamurthy, S., Panda, A. and Samal, S.K. (2003) Newcastle disease virus V protein is associated with viral pathogenesis and functions as an alpha interferon antagonist. J Virol 77: 8676-85
Hurt, A.C., Hansbro, P.M., Selleck, P., Olsen, B., Minton, C., Hampson, A.W. and Barr, I.G. (2006) Isolation of avian influenza viruses from two different transhemispheric migratory shorebird species in Australia. Arch Virol
Ideris, A., Ibrahim, L., Spradbrow, P.B. and Seng, C.H. (1987) Development of Food Pellet Newcastle Disease Vaccine. In: J.W. Copland (Ed), Newcastle Disease in Poultry : A new food pellet vaccine, pp. 20-23. Vol. 1. ACIAR, Canberra.
Ikuta, S., Takagi, K., Wallace, R.B. and Itakura, K. (1987) Dissociation kinetics of 19 base paired oligonucleotide-DNA duplexes containing different single mismatched base pairs. Nucl. Acids Res. 15: 797-811
Imamura, M.J., Itagaki, Yasuharu (JP), Tanimoto, Morimasa (JP). (2000) Method for extraction and long-term storage of RNA. SNOW BRAND MILK PROD CO LTD (JP).
Ito, T., Goto, H., Yamamoto, E., Tanaka, H., Takeuchi, M., Kuwayama, M., Kawaoka, Y. and Otsuki, K. (2001) Generation of a highly pathogenic avian influenza A virus from an avirulent field isolate by passaging in chickens. J Virol 75: 4439-43
Jackwood, D.J., Hanes, G. and Miller, S.H. (1996) Infectious Bursal Disease Viral RNA Amplification Using RT/PCR from Bursa Tissue Following Phenol: Chloroform Inactivation of the Virus. Avian Dis 40: 457-460
Jestin, V. and Jestin, A. (1991) Detection of Newcastle disease virus RNA in infected allantoic fluids by in vitro enzymatic amplification (PCR). Arch Virol 118: 151-161
Johnson, F.B. (1990) Transport of viral specimens. Clin. Microbiol. Rev. 3: 120-131
Karow, A.M. (1991) Chemical Cryoprotection of Metazoan Cells. BioScience 41: 155-160
Kattenbelt, J.A., Meers, J. and Gould, A.R. (2006a) Genome sequence of the thermostable Newcastle disease virus (strain I-2) reveals a possible phenotypic locus. Vet Microbiol 114: 134-41
Kattenbelt, J.A., Stevens, M.P. and Gould, A.R. (2006b) Sequence variation in the Newcastle disease virus genome. Virus Res 116: 168-84
Kim, L.M., Afonso, C.L. and Suarez, D.L. (2006) Effect of probe-site mismatches on detection of virulent Newcastle disease viruses using a fusion-gene real-time

141
reverse transcription polymerase chain reaction test. J Vet Diagn Invest 18: 519-28
Kim, L.M., King, D.J., Curry, P.E., Suarez, D.L., Swayne, D.E., Stallknecht, D.E., Slemons, R.D., Pedersen, J.C., Senne, D.A., Winker, K. and Afonso, C.L. (2007a) Phylogenetic Diversity among Low-Virulence Newcastle Disease Viruses from Waterfowl and Shorebirds and Comparison of Genotype Distributions to Those of Poultry-Origin Isolates. J. Virol. 81: 12641-12653
Kim, L.M., King, D.J., Guzman, H., Tesh, R.B., Travassos da Rosa, A.P., Bueno, R., Jr., Dennett, J.A. and Afonso, C.L. (2008) Biological and phylogenetic characterization of pigeon paramyxovirus serotype 1 circulating in wild North American pigeons and doves. J Clin Microbiol 46: 3303-10
Kim, L.M., King, D.J., Suarez, D.L., Wong, C.W. and Afonso, C.L. (2007b) Characterization of Class I Newcastle Disease Virus Isolates from Hong Kong Live Bird Markets and Detection Using Real-Time Reverse Transcription-PCR. J. Clin. Microbiol. 45: 1310-1314
Kim, S.J., Spradbrow, P.B. and MacKenzie, M. (1978) The isolation of lentogenic strains of Newcastle disease virus in Australia. Aust Vet J 54: 183-7
King, D.J. (1991) Evaluation of different methods of inactivation of Newcastle disease virus and avian influenza virus in egg fluids and serum. Avian Dis 35: 505-14
King, D.J. (1996) Avian paramyxovirus type 1 from pigeons: isolate characterization and pathogenicity after chicken or embryo passage of selected isolates. Avian Dis 40: 707-14
King, D.J. and Seal, B.S. (1998) Biological and molecular characterization of Newcastle disease virus (NDV) field isolates with comparisons to reference NDV strains. Avian Dis 42: 507-16
Kishore, R.H., W.R, Anderson, V.J. and Sanchez, N.A., Buoncristiani, M.R. (2006) Technical Note. Optimization of DNA Extraction from Low-Yield and degraded samples Using the BioRobot(R) EZ1 and BioRobot(R) M48. J Forensic Sci. 51: 1055-1060
Kobasa, D., Takada, A., Shinya, K., Hatta, M., Halfmann, P., Theriault, S., Suzuki, H., Nishimura, H., Mitamura, K., Sugaya, N., Usui, T., Murata, T., Maeda, Y., Watanabe, S., Suresh, M., Suzuki, T., Suzuki, Y., Feldmann, H. and Kawaoka, Y. (2004) Enhanced virulence of influenza A viruses with the haemagglutinin of the 1918 pandemic virus. Nature 431: 703-7
Kubinski, H. and Szybalski, E.H. (1975) Intermolecular linking and fragmentation of DNA by beta-propiolactone, a monoalkylating carcinogen. Chem Biol Interact 10: 41-55
Kudlicki, W.A., Winkler, M.M. and Pasloske, B.L. (2007) Nuclease Inhibitor Cocktail. In: U. Patent (Ed). Vol. 7163793. Whisenant, Ethan, USA.
Kumar, S., Nei, M., Dudley, J. and Tamura, K. (2008) MEGA: a biologist-centric software for evolutionary analysis of DNA and protein sequences. Brief Bioinform 9: 299-306
Lee, E.-K., Jeon, W.-J., Kwon, J.-H., Yang, C.-B. and Choi, K.-S. (2009) Molecular epidemiological investigation of Newcastle disease virus from domestic ducks in Korea. Vet Microbiol 134: 241-248

142
Lee, T.C., Yusoff, K., Nathan, S. and Tan, W.S. (2006) Detection of virulent Newcastle disease virus using a phage-capturing dot blot assay. J Virol Methods
Lee, Y.J., Sung, H.W., Choi, J.G., Kim, J.H. and Song, C.S. (2004) Molecular epidemiology of Newcastle disease viruses isolated in South Korea using sequencing of the fusion protein cleavage site region and phylogenetic relationships. Avian Pathol 33: 482-91
Lehmann, U. and Kreipe, H. (2001) Real-Time PCR Analysis of DNA and RNA Extracted from Formalin-Fixed and Paraffin-Embedded Biopsies. Methods 25: 409-418
Li, Y.P. and Zhang, M.F. (2004) Rapid pathotyping of Newcastle disease virus from allantoic fluid and organs of experimentally infected chickens using two novel probes. Arch Virol 149: 1231-43
Liu, H., Chen, F., Zhao, Y., Zheng, D., Li, J., Xu, T., Qi, L. and Wang, Z. (2010) Genomic characterization of the first class I Newcastle disease virus isolated from the mainland of China. Virus Genes 40: 365-371
Liu, H., Wang, Z., Wu, Y., Zheng, D., Sun, C., Bi, D., Zuo, Y. and Xu, T. (2007) Molecular epidemiological analysis of Newcastle disease virus isolated in China in 2005. J Virol Methods 140: 206-11
Liu, X.F., Wan, H.Q., Ni, X.X., Wu, Y.T. and Liu, W.B. (2003) Pathotypical and genotypical characterization of strains of Newcastle disease virus isolated from outbreaks in chicken and goose flocks in some regions of China during 1985-2001. Arch Virol 148: 1387-403
Lomniczi, B., Wehmann, E., Herczeg, J., Ballagi-Pordany, A., Kaleta, E.F., Werner, O., Meulemans, G., Jorgensen, P.H., Mante, A.P., Gielkens, A.L., Capua, I. and Damoser, J. (1998) Newcastle disease outbreaks in recent years in western Europe were caused by an old (VI) and a novel genotype (VII). Arch Virol 143: 49-64
Long, N.V. (2007) Development and Application of Molecular Diagnostics for routine monitoring of Avian Influenza. Hard Copy, James Cook University.
Mackay, I.M. (2004) Real-time PCR in the microbiology laboratory. Clin Microbiol Infect 10: 190-212
Mackay, I.M., Arden, K.E. and Nitsche, A. (2002) Real-time PCR in virology. Nucleic Acids Res 30: 1292-305
MacKenzie, J.S., Britten, D., Hinshaw, V. and Wood, J. (1985) Isolation of avian influenza and paramyxoviruses from wild birds in Western Australia. In: A.J. Della-Porta (Ed), Veterinary Viral Diseases, pp. 333-335. Academic Press, Sydney.
Mackenzie, J.S., Edwards, E.C., Holmes, R.M. and Hinshaw, V.S. (1984) Isolation of ortho- and paramyxoviruses from wild birds in Western Australia, and the characterization of novel influenza A viruses. Aust J Exp Biol Med Sci 62 ( Pt 1): 89-99
Mackey, K. and Chomczynski, P. (1996) Long-term stability of RNA isolation reagents. J NIH Res. 8: 72
Maes, P., Van Doren, E., Denys, B., Thoelen, I., Rahman, M., Vijgen, L. and Van Ranst, M. (2004) Poliovirus sampling by using sodium dodecyl sulfate/EDTA-

143
pretreated chromatography paper strips. Biochemical and Biophysical Research Communications 325: 711-715
Mahy, B.W.J. (1985) Virology a practical approach, 263 pp, edited by 2nd. IRL Press Limited, England.
Maines, T.R., Lu, X.H., Erb, S.M., Edwards, L., Guarner, J., Greer, P.W., Nguyen, D.C., Szretter, K.J., Chen, L.M., Thawatsupha, P., Chittaganpitch, M., Waicharoen, S., Nguyen, D.T., Nguyen, T., Nguyen, H.H., Kim, J.H., Hoang, L.T., Kang, C., Phuong, L.S., Lim, W., Zaki, S., Donis, R.O., Cox, N.J., Katz, J.M. and Tumpey, T.M. (2005) Avian influenza (H5N1) viruses isolated from humans in Asia in 2004 exhibit increased virulence in mammals. J Virol 79: 11788-800
Marín, M.C., Villegas, P., Bennett, J.D. and Seal, B.S. (1996) Virus Characterization and Sequence of the Fusion Protein Gene Cleavage Site of Recent Newcastle Disease Virus Field Isolates from the Southeastern United States and Puerto Rico. Avian Dis 40: 382-390
Markoulatos, P., Siafakas, N. and Moncany, M. (2002) Multiplex polymerase chain reaction: A practical approach. Journal of Clinical Laboratory Analysis 16: 47-51
Martin, P.A.J. (1999) The Epidemiology of Newcastle Disease in Village Chickens. In: P.B. Spradbrow (Ed), Newcastle Disease in Village Chickens. Control with Thermostable Oral Vaccines, 2 ed. ACIAR, Canberra.
Masuda, N., Ohnishi, T., Kawamoto, S., Monden, M. and Okubo, K. (1999) Analysis of chemical modification of RNA from formalin-fixed samples and optimization of molecular biology applications for such samples. Nucl. Acids Res. 27: 4436-4443
Mayo, M.A. (2002) A summary of taxonomic changes recently approved by ICTV. Arch Virol V147: 1655-1656
McCullough, K.C. (1993) The application of biotechnology to the diagnosis and control of animal diseases. Rev.sci.tech.Off.int.Epiz 12: 325-353
Meng, B., Marriott, A.C. and Dimmock, N.J. (2010) The receptor preference of influenza viruses. Influenza Other Respi Viruses 4: 147-53
Mohan, C.M., Dey, S. and Kumanan, K. (2005) Molecular changes of the fusion protein gene of chicken embryo fibroblast-adapted velogenic Newcastle disease virus: effect on its pathogenicity. Avian Dis 49: 56-62
Monis, P.T., Giglio, S. and Saint, C.P. (2005) Comparison of SYTO9 and SYBR Green I for real-time polymerase chain reaction and investigation of the effect of dye concentration on amplification and DNA melting curve analysis. Anal Biochem. 340: 24-34
Morris, R.S. and Jackson, R. (2005) Epidemiology of H5N1 Avian Influenza in Asia and Implications for Regional Control. Food and Agriculture Organistion, United Nations. April 2005.
Munster, V.J., Wallensten, A., Baas, C., Rimmelzwaan, G.F., Schutten, M., Olsen, B., Osterhaus, A.D. and Fouchier, R.A. (2005) Mallards and highly pathogenic avian influenza ancestral viruses, northern Europe. Emerg Infect Dis 11: 1545-51

144
Ness, J.V. and Chen, L. (1991) The use of oliodeoxynucleotide probes in chaotrope-based hybridization solutions. Nucl. Acids Res. 19: 5143-5151
Nguyen, L. (2007) Development and Application of Molecular Diagnostics For Routine Monitoring of Avian Influenza. Hard copy, James Cook University.
OIE. (2004) Avian Influenza.Manual of Diagnostic Test and Vaccines for Terrestrial Animals. 23th June.
OIE. (2009) Avian Influenza.Manual of Diagnostic Tests and Vaccines for Terrestrial Animals.
Ong, W.T., Omar, A.R., Ideris, A. and Hassan, S.S. (2007) Development of a multiplex real-time PCR assay using SYBR Green 1 chemistry for simultaneous detection and subtyping of H9N2 influenza virus type A. J Virol Methods
Panda, A., Huang, Z., Elankumaran, S., Rockemann, D.D. and Samal, S.K. (2004) Role of fusion protein cleavage site in the virulence of Newcastle disease virus. Microb Pathog 36: 1-10
Panteleeff, D.D., John, G., Nduati, R., Mbori-Ngacha, D., Richardson, B., Kreiss, J. and Overbaugh, J. (1999) Rapid Method for Screening Dried Blood Samples on Filter Paper for Human Immunodeficiency Virus Type 1 DNA. J Clin Microbiol. 37: 350 - 353
Payungporn, S., Chutinimitkul, S., Chaisingh, A., Damrongwantanapokin, S., Buranathai, C., Amonsin, A., Theamboonlers, A. and Poovorawan, Y. (2006a) Single step multiplex real-time RT-PCR for H5N1 influenza A virus detection. J Virol Methods 131: 143-7
Payungporn, S., Chutinimitkul, S., Chaisingh, A., Damrongwantanapokin, S., Nuansrichay, B., Pinyochon, W., Amonsin, A., Donis, R.O., Theamboonlers, A. and Poovorawan, Y. (2006b) Discrimination between highly pathogenic and low pathogenic H5 avian influenza A viruses. Emerg Infect Dis 12: 700-1
Peeters, B.P., de Leeuw, O.S., Koch, G. and Gielkens, A.L. (1999) Rescue of Newcastle disease virus from cloned cDNA: evidence that cleavability of the fusion protein is a major determinant for virulence. J Virol 73: 5001-9
Perozo, F., Villegas, P., Estevez, C., Alvarado, I. and Purvis, L.B. (2006) Use of FTA filter paper for the molecular detection of Newcastle disease virus. Avian Pathol 35: 93-8
Perrin, P. and Morgeaux, S. (1995) Inactivation of DNA by beta-propiolactone. Biologicals 23: 207-11
Pfaffl, M.W. (2004) Quantification strategies in real-time PCR. In: S. Bustin (Ed), A-Z of quantitative PCR. International University Line (IUL) La Jolla, CA, USA, Freising, Germany.
Pham, H.M., Konnai, S., Usui, T., Chang, K.S., Murata, S., Mase, M., Ohashi, K. and Onuma, M. (2005) Rapid detection and differentiation of Newcastle disease virus by real-time PCR with melting-curve analysis. Arch Virol
Phan, T.T., Lien, L.T.K., Hoa, N.T.L.H. and Hoang, L.T. (2003) The efficcay of heat-resistant Newcastle disease vaccine on village chickens in SocTrang province. In: J. Meers, P.B. Spradbrow and T.D. Tu (Eds), Control Newcastle disease and duck plague in village poultry. Proceeding of a workshop held at Navetco, Ho Chi, Minh City, Vietnam, 18-20 August 2003, pp. 11-14. ACIAR, Canberra.

145
Piacenti, A.M., King, D.J., Seal, B.S., Zhang, J. and Brown, C.C. (2006) Pathogenesis of Newcastle disease in commercial and specific pathogen-free turkeys experimentally infected with isolates of different virulence. Vet Pathol 43: 168-78
Privé, G.G. (2007) Detergents for the stabilization and crystallization of membrane proteins. Methods 41: 388-397
Purvis, L.B., Villegas, P. and Perozo, F. (2006) Evaluation of FTA® paper and phenol for storage, extraction and molecular characterization of infectious bursal disease virus. J Virol Methods 138: 66-69
Quinn, P.J., Markey, B.K., Carter, M.E., Donnely, W.J. and Leonard, F.C. (2002) Veterinary Microbiology and Microbial Disease. Blackwell Publishing, Great Britain.
Quoc, D.N. (2003) Newcastle disease in backyard chickens in Dong Thap province. In: J. Meers, P.B. Spradbrow and T.D. Tu (Eds), Control Newcastle disease and duck plague in village poultry. Proceeding of a workshop held at NAVETCO, Ho Chi Minh City, Vietnam, 18-20 August 2003, pp. 8-10. ACIAR, Canbera.
Reed, L.J. and Muench, H. (1938) A simple method of estimating fifty per cent endpoints. Am. J. Hyg. 27: 493-497
Refaie, F.M., Esmat, A.Y., Mohamed, A.F. and Mohamed, W.A. (2004) The effect of chemical inactivation of bovine viral diarrhea virus with beta-propiolactone and binary ethyleneimine on plasma proteins and coagulation factors. Egypt J Immunol 11: 9-20
Romer-Oberdorfer, A., Mundt, E., Mebatsion, T., Buchholz, U.J. and Mettenleiter, T.C. (1999) Generation of recombinant lentogenic Newcastle disease virus from cDNA. J Gen Virol 80 ( Pt 11): 2987-95
Roy, P., Venugopalan, A.T., Selvarangam, R. and Ramaswamy, V. (1998) Velogenic Newcastle disease virus in captive wild birds. Trop Anim Health Prod 30: 299-303
Rzhetsky, A. and Nei, M. (1992) A Simple Method for Estimating and Testing Minimum-Evolution Trees. Molecular Biology and Evolution 9: 945
Sagripanti, J.L., Hulseweh, B., Grote, G., Voss, L., Bohling, K. and Marschall, H.J. (2011) Microbial inactivation for safe and rapid diagnostics of infectious samples. Appl Environ Microbiol 77: 7289-95
Sahle, M., Burgess, W.G. and Kidanemariam, A. (2002) Multiplication of the V4 strain of Newcastle disease virus in Madin Derby bovine kidney cells. Onderstepoort J Vet Res 69: 201-6
Saitou, N. and Nei, M. (1987) The neighbor-joining method: a new method for reconstructing phylogenetic trees. Molecular Biology and Evolution 4: 406-425
Sambrook, J. and Russel, D.W. (2001) Molecular Cloning. A laboratory Manual. 3rd ed, edited by N. Irwin, 3. 3 vols. Cold spring Harbor Laboratory Press, New York.
Santella, R.M. (2006) Approaches to DNA/RNA Extraction and Whole Genome Amplification. Cancer Epidemiol Biomarkers Prev 15: 1585-1587
Scodeller, E.A., Lebendiker, M.A., Dubra, M.S., Crespo, O.A., Basarab, O., La Torre, J.L. and Vasquez, C. (1984) Inactivation of foot-and-mouth disease virus

146
vaccine strains by activation of virus-associated endonuclease. J Gen Virol 65 ( Pt 9): 1567-73
Seal, B.S. (1995) Analysis of matrix protein gene nucleotide sequence diversity among Newcastle disease virus isolates demonstrates that recent disease outbreaks are caused by viruses of psittacine origin. Virus Genes 11: 217-24
Seal, B.S., Crawford, J.M., Sellers, H.S., Locke, D.P. and King, D.J. (2002) Nucleotide sequence analysis of the Newcastle disease virus nucleocapsid protein gene and phylogenetic relationships among the Paramyxoviridae. Virus Res 83: 119-29
Seal, B.S., King, D.J. and Bennett, J.D. (1995) Characterization of Newcastle disease virus isolates by reverse transcription PCR coupled to direct nucleotide sequencing and development of sequence database for pathotype prediction and molecular epidemiological analysis. J Clin Microbiol 33: 2624-30
Seal, B.S., King, D.J., Locke, D.P., Senne, D.A. and Jackwood, M.W. (1998) Phylogenetic relationships among highly virulent Newcastle disease virus isolates obtained from exotic birds and poultry from 1989 to 1996. J Clin Microbiol 36: 1141-5
Seal, B.S., King, D.J. and Meinersmann, R.J. (2000) Molecular evolution of the Newcastle disease virus matrix protein gene and phylogenetic relationships among the paramyxoviridae. Virus Res 66: 1-11
Seal, B.S., Wise, M.G., Pedersen, J.C., Senne, D.A., Alvarez, R., Scott, M.S., King, D.J., Yu, Q. and Kapczynski, D.R. (2005) Genomic sequences of low-virulence avian paramyxovirus-1 (Newcastle disease virus) isolates obtained from live-bird markets in North America not related to commonly utilized commercial vaccine strains. Vet Microbiol 106: 7-16
Shortridge, K.F. (1982) Avian influenza A viruses of southern China and Hong Kong: ecological aspects and implications for man. Bull World Health Organ 60: 129-35
Singh, V.K. and Kumar, A. (2001) PCR Primer Design. Molecular Biology Today 2: 27-32
Smith, G.J., Naipospos, T.S., Nguyen, T.D., de Jong, M.D., Vijaykrishna, D., Usman, T.B., Hassan, S.S., Nguyen, T.V., Dao, T.V., Bui, N.A., Leung, Y.H., Cheung, C.L., Rayner, J.M., Zhang, J.X., Zhang, L.J., Poon, L.L., Li, K.S., Nguyen, V.C., Hien, T.T., Farrar, J., Webster, R.G., Chen, H., Peiris, J.S. and Guan, Y. (2006) Evolution and adaptation of H5N1 influenza virus in avian and human hosts in Indonesia and Vietnam. Virology
Spackman, E. (2008) Methods in Molecular Biology 436. Avian influenza Virus, 141 pp. 1 ed. Avian Influenza Virus, edited by J.M. Walker. Humana Press, Athens, GA.
Spackman, E., Senne, D.A., Myers, T.J., Bulaga, L.L., Garber, L.P., Perdue, M.L., Lohman, K., Daum, L.T. and Suarez, D.L. (2002) Development of a real-time reverse transcriptase PCR assay for type A influenza virus and the avian H5 and H7 hemagglutinin subtypes. J Clin Microbiol 40: 3256-60
Spackman, E., Stallknecht, D.E., Slemons, R.D., Winker, K., Suarez, D.L., Scott, M. and Swayne, D.E. (2005) Phylogenetic analyses of type A influenza genes in natural reservoir species in North America reveals genetic variation. Virus Res 114: 89-100

147
Spradbrow, P.B. (1987) Newcastle Disease Virus in Australia. In: J.W. Copland (Ed), Newcastle Disease in Poultry : A new food pellet vaccine. ACIAR, Canberra.
Spradbrow, P.B. (1999a) Newcastle disease in Village Chickens: control with thermostable oral vaccines. Proceedings of an International Workshop held in Kuala Lumpur, Malaysia 6-10 October 1991. ACIAR, Canberra.
Spradbrow, P.B. (1999b) Poultry as a Tool in Poverty Eradication and Promotion of Gender Equality., 165-173 pp. Epidemiology of Newcastle disease and the economics of its control. . DSR Forlag. Frederiksberg. , Tune, Denmark.
Spradbrow, P.B. (2001) The Epidemiology of Newcastle Disease in village Chickens, 158 pp. SADC Planning Workshop on Newcastle Disease Control in Village chickens, edited by R.G. Alders and P.B. Spradbrow. ACIAR, Canberra.
Spradbrow, P.B., MacKenzie, M. and Grimes, S.E. (1995) Recent isolates of Newcastle disease virus in Australia. Vet Microbiol 46: 21-8
Stanislawek, W.L., Meers, J., Wilks, C., Horner, G.W., Morgan, C. and Alexander, D.J. (2001) A survey for paramyxoviruses in caged birds, wild birds, and poultry in New Zealand. N Z Vet J 49: 18-23
Stanislawek, W.L., Wilks, C.R., Meers, J., Horner, G.W., Alexander, D.J., Manvell, R.J., Kattenbelt, J.A. and Gould, A.R. (2002) Avian paramyxoviruses and influenza viruses isolated from mallard ducks ( Anas platyrhynchos ) in New Zealand. Arch Virol 147: 1287-1302
Steinhauer, D.A. (1999) Role of hemagglutinin cleavage for the pathogenicity of influenza virus. Virology 258: 1-20
Suarez, D.L. (2003) The Diagnosis of Exotic Newcastle Disease Virus: Comparison of Diagnostic assays. Proceeding One Hundred amd Seventh Annual Meeting of the United states Animal Helath Association, 129-141.
Suarez, D.L., Das, A. and Ellis, E. (2007) Review of rapid molecular Diagnostic Tools for Avian Influenza Virus. Avian Dis 51: 201-208
Swinson, K. and Koban, M. (2005) FORMAzol® as an RNA storage medium: A cautionary note when performing RT-PCR. Journal of Biochemical and Biophysical Methods 63: 149-153
Tamura, K., Dudley, J., Nei, M. and Kumar, S. (2007) MEGA4: Molecular Evolutionary Genetics Analysis (MEGA) Software Version 4.0. Molecular Biology and Evolution 24: 1596-1599
Tamura, K., Nei, M. and Kumar, S. (2004) Prospects for inferring very large phylogenies by using the neighbor-joining method. Proc Natl Acad Sci U S A. 101: 11030-11035
Tan, S.W., Omar, A.R., Aini, I., Yusoff, K. and Tan, W.S. (2004) Detection of Newcastle disease virus using a SYBR Green I real time polymerase chain reaction. Acta Virol 48: 23-8
Thomas, C. and Swayne, D.E. (2007) Thermal inactivation of H5N1 high pathogenicity avian influenza virus in naturally infected chicken meat. J Food Prot 70: 674-80
Thompson, C.I., Barclay, W.S., Zambon, M.C. and Pickles, R.J. (2006) Infection of human airway epithelium by human and avian strains of influenza a virus. J Virol 80: 8060-8

148
Thompson, K., Pine, P.S., Rosenzweig, B., Turpaz, Y. and Retief, J. (2007) Characterization of the effect of sample quality on high density oligonucleotide microarray data using progressively degraded rat liver RNA. BMC Biotechnology 7: 57
Thontiravong, A., Payungporn, S., Keawcharoen, J., Chutinimitkul, S., Wattanodorn, S., Damrongwatanapokin, S., Chaisingh, A., Theamboonlers, A., Poovorawan, Y. and Oraveerakul, K. (2007) The single-step multiplex reverse transcription- polymerase chain reaction assay for detecting h5 and h7 avian influenza a viruses. Tohoku J Exp Med 211: 75-9
Toyoda, T., Sakaguchi, T., Hirota, H., Gotoh, B., Kuma, K., Miyataj, T. and Nagai, Y. (1989) Newcastle disease virus evolution: II. Lack of gene recombination in generating virulent and avirulent strains. Virology 169: 273-282
Turner, P., McLennan, A., Bates, A. and White, M. (2005) Molecular Biology, 370 pp. 3 ed. Bios Instant Notes., edited by B.D.Hames. Taylor & Francis, Leeds, UK.
Ullmann, A., Goldberg, M.E., Perrin, D. and Monod, J. (1968) Determination of molecular weight of proteins and protein subunits in the presence of 6M guanidine hydrochloride. Biochemistry 7: 261-265
van Elden, L.J., Nijhuis, M., Schipper, P., Schuurman, R. and van Loon, A.M. (2001) Simultaneous detection of influenza viruses A and B using real-time quantitative PCR. J Clin Microbiol 39: 196-200
Velicelebi, G. and Sturtevant, J.M. (1979) Thermodynamics of the denaturation of lysozyme in alcohol-water mixtures. Biochemistry 18: 1180-1186
Vincek, V., Strojny, L., Durkovic, B., Rossmanith, W. and Paton, D. (2001) Storage of bovine viral diarrhoe virus samples on filter paper detection of viral RNA by a RT-PCR method. J Virol Methods 92: 19-22
Vui, T.Q., Lohr, J.E., Son, P.H., Kyule, M.N. and Baumann, M.P.O. (2003) Antibody levels against Newcastle Disease virus in chickens in rural Vietnam. In: J. Meers, P.B. Spradbrow and T.D. Tu (Eds), Control of Newcastle disease and duck palque in village poultry. Proceeding of a workshop held at NAVETCO, Ho Chi Minh City, Vietnam, 18-20 August 2003. . Vol. 1. ACIAR, Canberra.
Wakamatsu, N., King, D.J., Seal, B.S. and Brown, C.C. (2007) Detection of newcastle disease virus RNA by reverse transcription-polymerase chain reaction using formalin-fixed, paraffin-embedded tissue and comparison with immunohistochemistry and in situ hybridization. J Vet Diagn Invest 19: 396-400
Wakamatsu, N., King, D.J., Seal, B.S., Samal, S.K. and Brown, C.C. (2006) The pathogenesis of Newcastle disease: A comparison of selected Newcastle disease virus wild-type strains and their infectious clones. Virology 353: 333-43
Wambura, P., Meers, J. and Spradbrow, P. (2006) Development of a cell culture method for quantal assay of strain I-2 of Newcastle disease virus. Vet Res Commun 30: 689-96
Wambura, P.N. (2006) Impregnation and storage of Newcastle disease virus on to filter papers and detection of viral RNA by a single tube RT-PCR assay. African Journal of Biotechnology 5: 022-024
Wang, C., Raghu, P., Morrison, T. and Peeples, M. (1992) Intracellular Processing of the Paramyxovirus F Protein: Critical Role of the Predicted Amphipathic Alpha Helix Adjacent to the Fusion Domain. J. Virol. 66: 4161-4169

149
Ward, C.L., Dempsey, M.H., Ring, C.J., Kempson, R.E., Zhang, L., Gor, D., Snowden, B.W. and Tisdale, M. (2004) Design and performance testing of quantitative real time PCR assays for influenza A and B viral load measurement. J Clin Virol 29: 179-88
Weber, K. and Kuter, D.J. (1971) Reversible Denaturation of Enzymes by Sodium Dodecyl Sulfate. J. Biol. Chem. 246: 4504-4509
Webster, R., Cox, N. and Stohr, K., eds. (2002) WHO Manual on Animal influenza Diagnosis and surveillance. Vol. 2. WHO Global Influenza Programme. Edited by R. Webster. WHO, Geneva.
Webster, R.G., Bean, W.J., Gorman, O.T., Chambers, T.M. and Kawaoka, Y. (1992) Evolution and ecology of influenza A viruses. Microbiol Rev 56: 152-79
Wei, H.L., Bai, G.R., Mweene, A.S., Zhou, Y.C., Cong, Y.L., Pu, J., Wang, S., Kida, H. and Liu, J.H. (2006) Rapid Detection of Avian Influenza Virus A and Subtype H5N1 by Single Step Multiplex Reverse Transcription-polymerase Chain Reaction. Virus Genes 32: 261-267
White, H. and Potts, G. (2006) Mutation scanning by high resolution melt analysis. Evalution of Rotor-geneTM 6000 (Corbett life science), HR-1TM and 384 well LightScannerTM (Idaho Technology).NHS Technology Assessment Natinal Genetics reference Laboratory (Wessex). Salisbury, United kingdom
WHO. (2006) Cumulative Number of Confirmed Human Cases of Avian Influenza A (H5N1) Reported to WHO. 27 December 2006.
WHO. (2007) Cumulative Number of Confirmed Human Cases of Avian Influenza A (H5N1) Reported to WHO. 27 December 2006.
WHO. (2008) Cumulative Number of Confirmed Human Cases of Avian Influenza A/(H5N1) Reported to WHO.Epidemic and Pandemic Alert and Response (EPR) WHO. Geneva
Wilhelm, J. and Pingoud, A. (2003) Real time Polymerase Chain Reaction. . ChemBioChem 4: 1120-1128
Wilson, I.G. (1997) Inhibition and facilitation of nucleic acid amplification. Appl Environ Microbiol 63: 3741-51
Wise, M.G., Suarez, D.L., Seal, B.S., Pedersen, J.C., Senne, D.A., King, D.J., Kapczynski, D.R. and Spackman, E. (2004) Development of a real-time reverse-transcription PCR for detection of newcastle disease virus RNA in clinical samples. J Clin Microbiol 42: 329-38
Wittwer, C.T., Herrmann, M.G., Gundry, C.N. and Elenitoba-Johnson, K.S.J. (2001) Real-Time Multiplex PCR Assays. Methods 25: 430-442
Wu, S., Wang, W., Yao, C., Wang, X., Hu, S., Cao, J., Wu, Y., Liu, W. and Liu, X. (2010) Genetic diversity of Newcastle disease viruses isolated from domestic poultry species in Eastern China during 2005-2008. Arch Virol
Xu, Q. and Keiderling, T.A. (2004) Effect of sodium dodecyl sulfate on folding and thermal stability of acid-denatured cytochrome c: A spectroscopic approach. Protein Sci: ps.04827604
Yamada, S., Suzuki, Y., Suzuki, T., Le, M.Q., Nidom, C.A., Sakai-Tagawa, Y., Muramoto, Y., Ito, M., Kiso, M., Horimoto, T., Shinya, K., Sawada, T., Kiso, M., Usui, T., Murata, T., Lin, Y., Hay, A., Haire, L.F., Stevens, D.J., Russell,

150
R.J., Gamblin, S.J., Skehel, J.J. and Kawaoka, Y. (2006) Haemagglutinin mutations responsible for the binding of H5N1 influenza A viruses to human-type receptors. Nature 444: 378-382
Young, M., Alders, R., Grimes, S., Spradbrow, P., Dias, P., Da Silva, A. and Lobo, Q. (2002) Controlling Newcastle Disease in village Chickens
A Laboratory Manual, 142 pp pp. ACIAR Monograph, edited by 1st, 87. Australian Agency For International Agricultural Research (ACIAR).
Zaffuto, K.M., Estevez, C.N. and Afonso, C.L. (2008) Primary chicken tracheal cell culture system for the study of infection with avian respiratory viruses. Avian Pathol 37: 25 - 31
Zambon, M.C. (1999) Epidemiology and pathogenesis of influenza. J Antimicrob Chemother 44 Suppl B: 3-9
Zambon, M.C. (2001) The pathogenesis of influenza in humans. Rev Med Virol 11: 227-41
Zhou, L., Myers, A.N., Vandersteen, J.G., Wang, L. and Wittwer, C.T. (2004) Closed-Tube Genotyping with Unlabeled Oligonucleotide Probes and a Saturating DNA Dye. Clin Chem 50: 1328-1335
Zhou, L., Wang, L., Palais, R., Pryor, R. and Wittwer, C.T. (2005) High-Resolution DNA Melting Analysis for Simultaneous Mutation Scanning and Genotyping in Solution. Clin Chem 51: 1770-1777