molecular dynamics studies of thin film...
TRANSCRIPT

MOLECULAR DYNAMICS STUDIES OF
THIN FILM NUCLEATION AND SUBSTRATE MODIFICATION
By
YANHONG HU
A DISSERTATION PRESENTED TO THE GRADUATE SCHOOL OF THE UNIVERSITY OF FLORIDA IN PARTIAL FULFILLMENT
OF THE REQUIREMENTS FOR THE DEGREE OF DOCTOR OF PHILOSOPHY
UNIVERSITY OF FLORIDA
2003

Copyright 2003
by
Yanhong Hu

This dissertation is dedicated to my family with love and gratitude.
iv
ACKNOWLEDGMENTS
First of all, I would like to thank my supervisor, Dr. Susan B. Sinnott, for her full
support during my four years study in the United States. Her scholarship and enthusiasm
always amaze me and stimulate my interest in exploring the wonderful world of
computer simulation. Her instructive guidance and openness to my ideas have made
working in her group a pleasant and learning experience. I would also like to thank the
members of my supervisory committee for their valuable help and kind support when I
have bothered them: Dr. Rolf E. Hummel, Dr. Laurie A. Gower, Dr. Elliot P. Douglas,
and Dr. Wei Shyy.
Special thanks also go to Dr. Boris Ni and Thomas Plaisted. Without them, I would
not have got started in the lab so smoothly. I also want to extend my gratitude to the
present members of the Sinnott research group for many helpful discussions and friendly
support.
I especially want to thank my husband, who has helped me persevere through
difficult times. From him, I always can find comfort and encouragement. Finally, my
heartfelt appreciation goes out to my parents, who always have confidence in me.
Without their consistent support, I simply could not have come this far.
v
TABLE OF CONTENTS Page ACKNOWLEDGMENTS ................................................................................................. iv
LIST OF TABLES............................................................................................................ vii
LIST OF FIGURES ......................................................................................................... viii
ABSTRACT....................................................................................................................... xi
CHAPTER 1 INTRODUCTION ........................................................................................................1
1.1 Molecular Dynamics Simulations...........................................................................6 1.2 Cluster Beam Deposition on Solid Substrate........................................................11
1.2.1 Thin Films from Cluster Beam Deposition ................................................11 1.2.2 Motivation and Objectives .........................................................................17
1.3 Carbon Nanotube/Polymer Composites ...............................................................20 1.3.1 Carbon Nanotubes ......................................................................................21 1.3.2 Carbon Nanotube/Polymer Composites .....................................................25 1.3.3 Motivation and Objectives .........................................................................30
1.4 Organization of the Dissertation...........................................................................31 2 COMPARISON OF O(N)/NOTB AND REBO POTENTIAL MOLECULAR
DYNAMICS SIMULATIONS...................................................................................33
2.1 Order-N Nonorthogonal Tight-Binding (O(N)/NOTB) Method ..........................35 2.2 Reactive Empirical Bond-Order (REBO) Potential..............................................37 2.3 Testing Systems ....................................................................................................40 2.4 Results and Discussion .........................................................................................42 2.5 Conclusions...........................................................................................................50
3 TEMPERATURE CONTROL METHODS...............................................................53
3.1 Methods of Interest ...............................................................................................55 3.1.1 Generalized Langevin Equation (GLEQ) Approach ..................................55 3.1.2 Berendsen Method......................................................................................57 3.1.3 Variation of GLEQ Approach and a Combined Thermostat of GLEQ
Approach and Berendsen Method....................................................................59 3.2 Testing Systems ....................................................................................................61
vi
3.3 Results and Discussion .........................................................................................62 3.4 Conclusions...........................................................................................................73
4 THIN FILM FORMATION VIA ORGANIC CLUSTER BEAM DEPOSITION ....75
4.1 Simulation Details ................................................................................................75 4.2 Results...................................................................................................................79
4.2.1 van der Waals Clusters of Ethylene............................................................79 4.2.2 Admantane Molecules ................................................................................83 4.2.3 C20 Molecules .............................................................................................87
4.3 Discussion.............................................................................................................91 4.4 Conclusions...........................................................................................................99
5 CHEMICAL MODIFICATION OF CARBON NANOTUBE/POLYMER
COMPOSITES THROUGH POLYATOMIC-ION BEAM DEPOSITION ............101
5.1 Simulation Details ..............................................................................................102 5.2 Results.................................................................................................................107
5.2.1 C3F5+ Ion Beam Deposition on CNT/PS-// Composites...........................109
5.2.2 C3F5+ Ion Beam Deposition on Pristine PS Substrates.............................113
5.2.3 C3F5+ Ion Beam Deposition on CNT/PS-⊥ Composites ..........................115
5.3 Discussion...........................................................................................................116 5.3.1 The Effect of the Incident Energy ............................................................118 5.3.2 The Effect of the Composite Structure.....................................................120 5.3.3 Comparison between Pristine Polymer Substrates and Composites ........123
5.4 Conclusions.........................................................................................................125 6 CONCLUSIONS AND BEYOND...........................................................................127
6.1 General Conclusions...........................................................................................127 6.2 Future Work........................................................................................................132
LIST OF REFERENCES.................................................................................................134
BIOGRAPHICAL SKETCH ...........................................................................................151

vii
LIST OF TABLES
Table page 2-1. Details of the hydrogen-terminated diamond (111) surfaces. ..................................41
2-2. The coordination of the carbon atoms in the film predicted by the O(N)/NOTB-MD and EMD simulations (averaged over 3 trajectories) (%)...........48
2-3. The coordination of the carbon atoms in the film predicted by the EMD simulations (averaged over 10 trajectories) (%).............................................48
2-4. The carbon connectivity of the carbon atoms in the film predicted by O(N)/NOTB-MD and EMD simulations (averaged over 3 trajectories) (%)...........50
4-1. Summary of the coordination percentage of the film carbon atoms (%) .................91
4-2. Summary of the percentage of carbon connectivity of the film carbon atoms (%) .....................................................................................................91
5-1. Summary of the results after the ion beam deposition on CNT/PS-// composites at 50 eV/ion. ......................................................................110
5-2. Summary of the results after the ion beam deposition on CNT/PS-// composites at 80 eV/ion. ......................................................................112
5-3. Summary of the results after the ion beam deposition on pristine PS substrates at 50 eV/ion and 80 eV/ion. ................................................114
5-4. Summary of the results after the ion beam deposition on CNT/PS-⊥ composites at 50 eV/ion.......................................................................116
viii
LIST OF FIGURES
Figure page 1-1. Schematic representation of periodic boundary conditions. ......................................3
1-2. Flowchart of the predictor-corrector MD.................................................................10
1-3. Possible phenomena that may occur after the deposition of energetic clusters on a solid substrate. ..........................................................................................................14
1-4. The principle of the experimental set-up for thin film formation by energetic cluster impact (ECI). ............................................................................................................15
1-5. A graphene sheet rolled into a single-walled carbon nanotube (SWNT).................21
1-6. The “rolling up” of a graphene sheet to produce carbon nanotubes of various helical structures. .........................................................................................22
1-7. A model of a capped SWNT. ...................................................................................23
1-8. A SWNT formed in the catalytic carbon arc method...............................................24
1-9. In situ straining of a CNT/PS compsite in TEM. .....................................................28
1-10. Cross-linking formed between nanotubes and adjacent shells in the case of MWNT as a result of energetic ion deposition. .....................................................................31
2-1. The percentage of incident carbon atoms that adhere to the substrate (averaged over three trajectories) versus the size of the substrate. ...................................................44
2-2. Potential energy curves calculated with O(N)/NOTB-MD and EMD methods for the three reactions.....................................................................................................45
2-3. The percentage of incident carbon atoms that adhere to the substrate (averaged over ten trajectories) versus the size of the substrate. ......................................................47
2-4. Snapshots of the thin film formed on the hydrogen terminated diamond (111) surface containing 3136 atoms. ................................................................................47
3-1. The substrate layout. (a) the impact zone; (b) the impact zone embedded in the thermostat zone. .......................................................................................................62
ix
3-2. The temporal evolution of the substrate temperature in the reference simulation and the simulations using the four temperature control methods at the incident energy of 1 eV/atom.............................................................................................................63
3-3. The temporal evolution of the substrate temperature in the simulations using the four temperature control methods at the incident energy of (a) 5 eV/atom, (b) 10 eV/atom. ........................................................................................................64
3-4. The temporal evolution of (a) the substrate temperature and (b) the kinetic energy per active atom in the simulations using the four temperature control methods at the incident energy of 20 eV/atom. ................................................................................66
3-5. The temporal evolution of (a) the substrate temperature and (b) the kinetic energy per active atom in the simulations using the four temperature control methods at the incident energy of 40 eV/atom. ................................................................................68
3-6. Snapshots of the systems using the four temperature control methods at various moments at the incident energy of 40 eV/atom........................................................70
3-7. The displacement fields from t = 0.08 ps to t = 0.24 ps in the cross section of the (111) plane using the four temperature control methods at the incident energy of 40 eV/atom. ..............................................................................................70
3-8. The temporal evolution of (a) the substrate temperature and (b) the kinetic energy per active atom in the depositions on the small substrate using the four temperature control methods at the incident energy of 40 eV/atom. ...........................................72
4-1. The arrangement of the thermostat atoms (gray) and the active atoms (black) within the substrate..............................................................................................................76
4-2. The simulation system prior to the deposition. ........................................................79
4-3. Representative snapshots from the simulations of ethylene cluster beam deposition on the hydrogen terminated diamond (111) surface.................................................80
4-4. Percentage of carbon atoms in the ethylene clusters that adhere to the surface as a function of incident angle.........................................................................................82
4-5. Molecular structure of adamantane. .........................................................................83
4-6. Representative snapshots from the simulations of adamantane molecular beam deposition on the hydrogen terminated diamond (111) surface. ..............................85
4-7. Percentage of adamantane carbon atoms that adhere to the surface as a function of incident angle. ..........................................................................................................86
4-8. Representative snapshots from the simulations of C20 molecular beam deposition on the hydrogen terminated diamond (111) surface.................................................89
x
4-9. Percentage of carbon atoms in C20 clusters that adhere to the surface as a function of incident angle. ......................................................................................................90
5-1. The composite structures before ion deposition (only parts of the systems are shown for clarity). ..................................................................................................104
5-2. The composite structures after the relaxation while before the ion deposition. ..................................................................................................105
5-3. A series of snapshots during the ion beam deposition. ..........................................108
5-4. The CNT/PS-// composites after the ion beam deposition at 50 eV/ion. ...............109
5-5. The normalized chemical bonding information of the trapped ion species after the deposition on CNT/PS-// composites at 50 eV/ion. (a) CNT/PS-//-1; (b) CNT/PS-//-2; (c) CNT/PS-//-3..........................................................................111
5-6. The CNT/PS-// composites after the depostion at 80 eV/ion. (a) CNT/PS-//-1; (b) CNT/PS-//-2; (c) CNT/PS-//-3..........................................................................112
5-7. The normalized chemical bonding information of the trapped ion species after the deposition on CNT/PS-// composites at 80 eV/ion. (a) CNT/PS-//-1; (b) CNT/PS-//-2; (c) CNT/PS-//-3..........................................................................113
5-8. The normalized chemical bonding information of the trapped ion species after the deposition on pristine PS substrates at (a) 50 eV/ion and (b) 80 eV/ion. ..............114
5-9. The CNT/PS-⊥ composites after the ion beam deposition at 50 eV/ion................115
5-10. The normalized chemical bonding information of the trapped ion species after the deposition on CNT/PS-⊥ composites at 50 eV/ion. (a) CNT/PS-⊥-1; (b) CNT/PS-⊥-2; (c) CNT/PS-⊥-3. ........................................................................117
5-11. The CNT/PS-//-3 composite structure after the deposition at 80 eV/ion generated from the repeated simulation..................................................................................120
5-12. The fraction of functionalized carbon atoms in the carbon nanotube embedded at varying depths. .......................................................................................................122
xi
Abstract of Dissertation Presented to the Graduate School of the University of Florida in Partial Fulfillment of the Requirements for the Degree of Doctor of Philosophy
MOLECULAR DYNAMICS STUDIES OF THIN FILM NUCLEATION AND SUBSTRATE MODIFICATION
By
Yanhong Hu
August 2003
Chair: Susan B. Sinnott Major Department: Materials Science and Engineering
Deposition of energetic particles on solid surfaces has found increasing application
in surface science. However, the detailed surface chemistry and relevant atomic
mechanisms are not well understood. Molecular dynamics (MD) simulations are an ideal
method to study these processes atomistically because they usually occur on short time
scales (of the order of a few picoseconds). In this dissertation, MD simulations are
performed to investigate thin film formation through organic cluster beam deposition and
chemical modification of carbon nanotube/polymer composites via polyatomic ion beam
deposition.
The interatomic forces are calculated from the reactive empirical bond-order
(REBO) potential for carbon-based systems coupled with the Lennard-Jones potentials.
The reliability of this approach is examined by comparing its predictions for ethylene-
cluster beam deposition with the results of a more accurate order-N nonorthogonal tight-

xii
binding method. The results show that the REBO potential captures the general
characters of the relevant chemistry.
The deposition processes of interest occur at room temperature; hence, appropriate
temperature control methods must be employed in the simulations. A comparison study
of four temperature control methods during the simulation of cluster deposition finds that
the generalized Langevin equation approach is sufficient for dissipation of excess system
energy if the deposition occurs on a large enough substrate at a moderate incident energy
(< 40 eV/cluster-atom). A new temperature control method has been developed for use at
higher incident energies.
In the simulations of thin film formation through organic cluster beam deposition,
the dependence of the results on the intracluster bonding, incident angle and deposition
direction is examined. Beams of ethylene clusters, adamantane molecules, and C20
molecules are thus deposited on a diamond surface with varying lateral momenta along
two different crystallographic orientations at various incident angles.
The simulations of chemical modification of carbon nanotube/polystyrene
composites via ion beam deposition predict that this process can effectively induce the
formation of cross-links between otherwise unfunctionalized nanotube and polystyrene
chains. Modification efficiency is shown to depend on the incident energy and the
composite structure. The responses of the composites to ion beam deposition are different
from the response of pristine polystyrene. The simulations detail the atomic-scale
mechanisms that are responsible for these findings.
1
CHAPTER 1 INTRODUCTION
Molecular simulation is a relatively new technique, which became known to people
only in the early 1950s. Since then, it has developed rapidly into a valuable tool in
scientific research, complementing both analytical theory and experiment. One major
application field of molecular simulations is materials science. Materials science deals
with the properties of systems of many atoms or molecules. The interactions between
these atoms or molecules determine the overall properties. Therefore, accurate
descriptions of these interactions are critical to understand the properties of the material.
When they are based on the laws of quantum mechanics, molecular simulations can
provide essentially exact estimations of the interatomic interactions by explicitly
considering the electrons and nuclei. Of course quantum mechanical calculations of
interatomic interactions are very complicated and can only be done using computers.
Such simulations involve few approximations and are usually known as ab initio or first
principles simulations. Ab initio simulations can thus be used to predict unknown
properties of a material or can be used as a test of an approximate analytical theory by
comparing the result of the simulation with the prediction from the theory.
Computational demands can be dramatically reduced if some approximations are
introduced into the description of the interatomic interactions through the use of
appropriate empirical functional forms. However, the results of such classical simulations
may contain errors. Depending on how many approximations are introduced, these
simulations are termed either semi-empirical or empirical. Between the two, empirical

2
simulations may contain more errors because more approximations are employed. In
these cases, the simulation predictions from a microscopic model should be compared
with experimental or more exact ab initio results. If the model turns out to be a good one,
then the simulation can be used to provide atomic insights and assist in the interpretation
of experimental results.
The two most important molecular simulation methods are the Monte Carlo (MC)
method and the method of molecular dynamics (MD). The MC method uses probability
laws and random numbers (hence the name “Monte Carlo”) to obtain the ensemble
average and standard deviation of a random variable via random sampling.[1] The first
MC simulation was carried out by von Neumann, Ulam, and Metropolis at the end of
World War II to study the diffusion of neutrons in fissionable material. The MC method
is a statistical method, and any problems involving random processes can essentially be
simulated via this method. Assuming the applicability of classical mechanics, MD
simulation is a deterministic method in which the system evolves according to Newton’s
equations of motion.[2] Thus, MD simulations can give full dynamical information and
can be used to study time-dependent phenomena. Both MC and MD methods have
advantages and disadvantages. Although MD is the only reliable method to study time-
dependent properties, conventional MD can only track processes for at most a few
nanoseconds. In contrast, MC method is not subject to time limits and can yield
thermodynamic properties that may not easily be obtained from MD. Depending on the
problem and properties of interest, either MC or MD, or sometimes a combination of MC
and MD, is used in an atomistic simulation.
3
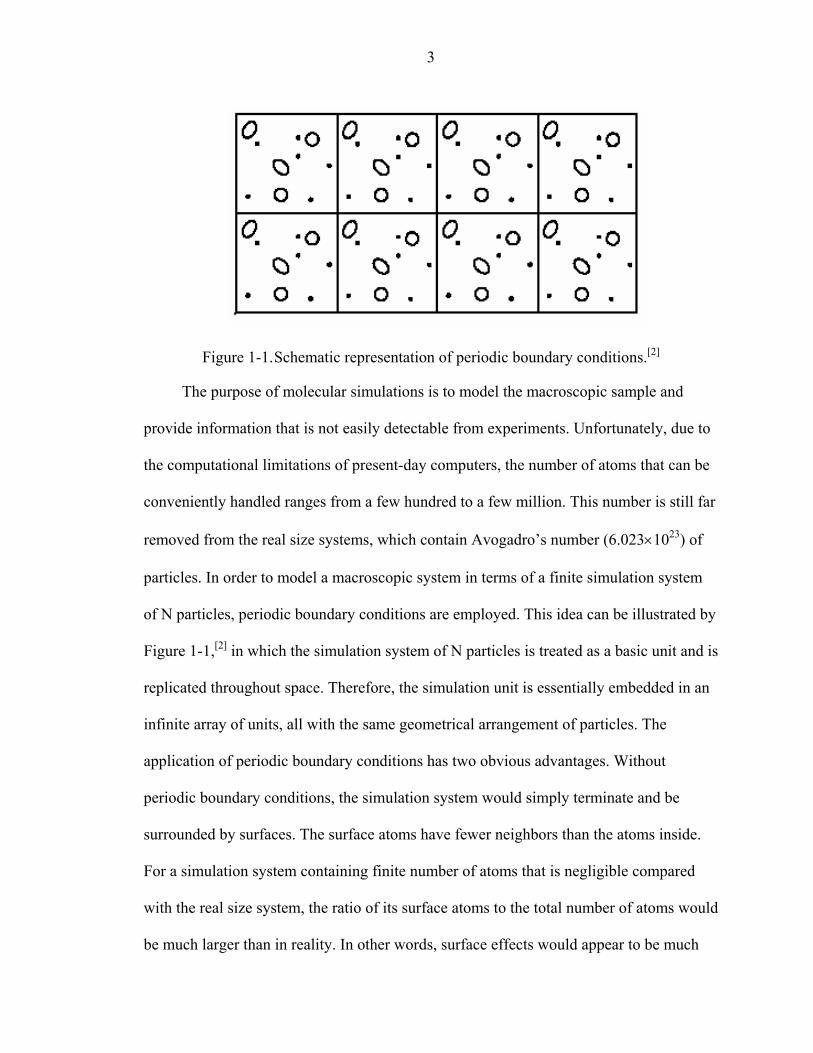
Figure 1-1. Schematic representation of periodic boundary conditions.[2]
The purpose of molecular simulations is to model the macroscopic sample and
provide information that is not easily detectable from experiments. Unfortunately, due to
the computational limitations of present-day computers, the number of atoms that can be
conveniently handled ranges from a few hundred to a few million. This number is still far
removed from the real size systems, which contain Avogadro’s number (6.023×10²³) of
particles. In order to model a macroscopic system in terms of a finite simulation system
of N particles, periodic boundary conditions are employed. This idea can be illustrated by
Figure 1-1,[2] in which the simulation system of N particles is treated as a basic unit and is
replicated throughout space. Therefore, the simulation unit is essentially embedded in an
infinite array of units, all with the same geometrical arrangement of particles. The
application of periodic boundary conditions has two obvious advantages. Without
periodic boundary conditions, the simulation system would simply terminate and be
surrounded by surfaces. The surface atoms have fewer neighbors than the atoms inside.
For a simulation system containing finite number of atoms that is negligible compared
with the real size system, the ratio of its surface atoms to the total number of atoms would
be much larger than in reality. In other words, surface effects would appear to be much

4
more important than what they should be. Thus, the first advantage of the application of
periodic boundary conditions is that the surface effects, which would otherwise be
proportional to N-1/3, are reduced to be proportional to N-1.[2, 3] Second, as the simulation
progresses, for every molecule that leaves the simulation unit, its image will enter
through the opposite face. Thus, the volume and the density of the simulation unit can be
maintained throughout the simulation. Although the use of periodic boundary conditions
has been proved to be surprisingly effective and successful, it should be noted that such
boundary conditions may lead to correlations not present in the real system.[2] The point
is that the basic simulation unit should be large enough so that those correlations will not
introduce spurious effects.[4]
In molecular simulations, the key is the calculation of the interactions between the
particles, which, in principle, should include not only the interactions between the
particles contained in the simulation system, but also all the interactions between the
particles and their images once the periodic boundary conditions are employed. Even if
empirical functions are used to model these interactions, the computational load is still
impractically high. Under circumstances like these, appropriate cutoff distances ( cr )
should be used to truncate the interactions between the particles. This means that the
effects of the particles beyond a certain cutoff distance are ignored. While this
simplification certainly will introduce error into the calculation, the error can be made
arbitrarily small by choosing a large enough cr .[2] The introduction of the cutoff distance
is especially meaningful for short-range interactions such as covalent bonding, where
interactions between neighboring particles dominate.

5
Although the use of a cutoff distance saves tremendous computational time, a
significant amount of CPU time is still spent calculating the distance between the
particles at every step. In order to reduce the unnecessary labor, for instance, in
calculating the distance between two particles that are obviously too far apart to interact
every time, a “neighbor list” table is constructed, which was an idea first introduced by
Verlet.[5] The table stores each particle’s neighbors and is updated only at predetermined
time intervals. The neighbors include all the particles that are within a certain distance r
(> cr ) from each particle. The program updates the neighbor list table only when
considerable displacements beyond r occur. With the introduction of the neighbor list
table, the calculation of the interaction energy between the particles now can be
performed by only scanning through the particles listed in the table instead of scanning
through all the particles. Depending on the problem that needs to be solved, some
modified “neighbor list” techniques that update the table more efficiently have been
reported.[6, 7]
Many processes are carried out experimentally at constant temperatures. In order to
model these processes, the temperature of the simulation system should be controlled.
This is achieved by employing thermostat atoms. Thermostat atoms have special
constraints such as extra frictional forces placed upon them, and evolve differently from
the other ordinary atoms as the simulation progresses. The function of these thermostat
atoms is to remove extra energy from the simulation system or to compensate for a loss
of energy, depending on which is necessary to maintain the system temperature. There
have been several algorithms proposed for temperature control, such as the velocity
6
rescaling scheme, the Nosé-Hoover method, and the generalized Langevin equation
approach.
In this dissertation, thin film nucleation through organic cluster beam deposition
and chemical functionalization of carbon nanotube/polymer composites via polyatomic
ion beam deposition are investigated using molecular simulations. Since the phenomena
of interest are time-dependent and both deposition processes are rapid enough that they
occur within a few picoseconds (10-12 seconds), molecular dynamics simulations are used
in both cases.
1.1 Molecular Dynamics Simulations
In classical mechanics, Newton’s second law states that in order to make a body of
mass m undergo an acceleration a, a force F is required that is equal to the product of the
mass times the acceleration:
aF m= (1-1)
This equation can also be expressed in terms of the position vector r of the body as
2
2
dtdm rF = (1-2)
This is the basis of molecular dynamics (MD). Knowing the force F, based on
Equation (1-2), we can thus study the trajectory of each particle in space and investigate
the time-dependent properties. The problem is how to calculate the force. From the
principle of conservation of energy, we know that the kinetic energy ( 2
21 vm ) and the
potential energy (U) of the body can vary, but their sum (ε ) is a constant.
ε=+Um 2
21 v (1-3)
In terms of r, equation (1-3) can be expressed as

7
ε=+Udtdm 2)(
21 r (1-4)
Differentiating both sides of Equation (1-4) with respect to time, we find
0])(21[ 2 =+U
dtdm
dtd r
and so
02
2
=+⋅dt
dUdtd
dtdm rr
This can be rewritten as follows because potential energy is a function of the position
U(r):
02
2
=⋅∇+⋅dtdU
dtd
dtdm rrr
Therefore, we get
Udtdm −∇=2
2r
Referring back to the Newton’s second law (Equation (1-2)), the left side of the above
equation is the force. Thus, the force can be calculated from the potential energy:
U−∇=F (1-5)
The potential energy, as stated before, can be obtained using either empirical potential
energy expressions, semi-empirical methods, or exact ab initio approaches. In MD
simulations, the calculations of the potential energy and force are the most time-
consuming parts. Once the force is obtained, Equation (1-2) can be integrated to follow
the time evolution of the atoms in response to the applied forces.
In practice, numerical integrations instead of algebraic solutions to Equation (1-2)
are performed. There are several numerical methods for integrating Newton’s equations,
8
including the Verlet algorithm, the leapfrog algorithm and the predictor-corrector
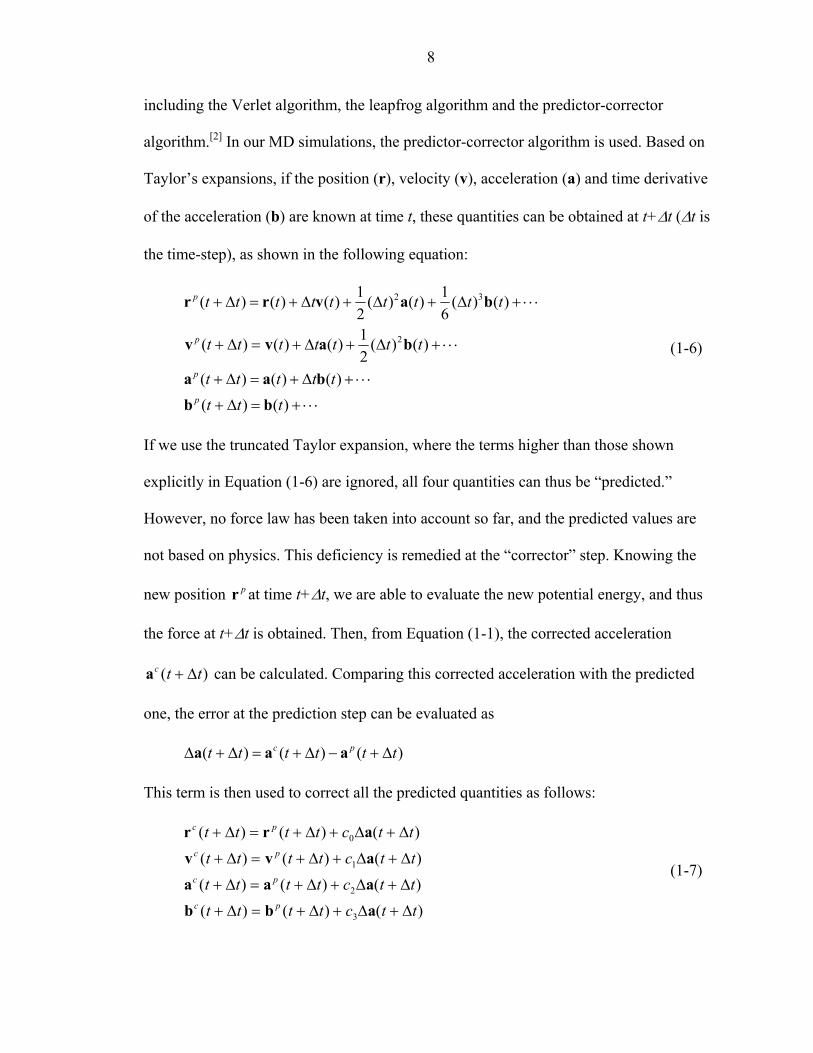
algorithm.[2] In our MD simulations, the predictor-corrector algorithm is used. Based on
Taylor’s expansions, if the position (r), velocity (v), acceleration (a) and time derivative
of the acceleration (b) are known at time t, these quantities can be obtained at t+∆t (∆t is
the time-step), as shown in the following equation:
⋅⋅⋅+=∆+
⋅⋅⋅+∆+=∆+
⋅⋅⋅+∆+∆+=∆+
⋅⋅⋅+∆+∆+∆+=∆+
)()()()()(
)()(21)()()(
)()(61)()(
21)()()(
2
32
tttttttt
ttttttt
ttttttttt
p
p
p
p
bbbaa
bavv
bavrr
(1-6)
If we use the truncated Taylor expansion, where the terms higher than those shown
explicitly in Equation (1-6) are ignored, all four quantities can thus be “predicted.”
However, no force law has been taken into account so far, and the predicted values are
not based on physics. This deficiency is remedied at the “corrector” step. Knowing the
new position pr at time t+∆t, we are able to evaluate the new potential energy, and thus
the force at t+∆t is obtained. Then, from Equation (1-1), the corrected acceleration
)( ttc ∆+a can be calculated. Comparing this corrected acceleration with the predicted
one, the error at the prediction step can be evaluated as
)()()( tttttt pc ∆+−∆+=∆+∆ aaa
This term is then used to correct all the predicted quantities as follows:
)()()()()()()()()(
)()()(
3
2
1
0
ttcttttttcttttttctttt
ttctttt
pc
pc
pc
pc
∆+∆+∆+=∆+
∆+∆+∆+=∆+
∆+∆+∆+=∆+
∆+∆+∆+=∆+
abbaaaavv
arr
(1-7)

9
These values are now better approximations to the true quantities, and are used to
predict the quantities in the next iteration. The corrector constants ic are chosen to yield
an optimal compromise between the accuracy and the stability of the algorithm.[2] Gear
discussed the best choice for these constants, which depends on the order of the
differential equations and of the Taylor series.[8] These constants are fixed for a given
order algorithm. For instance, the one we use is a third-order Nordsieck predictor-
corrector algorithm, and the values for ic are ,61
0 =c ,65
1 =c ,12 =c and 31
3 =c . Figure
1-2 schematically shows the predictor-corrector MD procedures used in the simulations
described in this dissertation.
In MD simulations, short time-steps are required to yield reliable results. There are
at least two reasons for this. One is due to the quick motion of the atoms (for example,
the time-scale of atomic vibrations is typically 10-13 s[9]). In order to capture atomic
motions accurately, as MD simulations desire to do, the time-step must be much smaller
than the frequency of the atomic motions. The second reason is that, from the integration
point of view, a small ∆t is necessary to achieve the predictions calculated in Equation (1-
6) as accurate as possible. Usually, time-steps on the order of a femtosecond (10-15 s) are
used. Unfortunately, such short time-steps make the modeling of processes that occur on
time-scales larger than a few nanoseconds out of the reach of conventional MD
simulations on present-day computers.
MD simulations can generate atomistic information such as atomic positions and
velocities. Via statistical mechanics, this atomistic information can be related to
macroscopic quantities such as pressure, temperature, heat capacities, etc. Therefore, MD

10
Figure 1-2. Flowchart of the predictor-corrector MD.
simulations can be used to study these thermodynamic properties as well as time-
dependent (kinetic) phenomena. The first MD simulation was done by Alder and
Wainwright to study the dynamics of an assembly of hard spheres.[10, 11] Their studies
provide many important insights concerning the behavior of simple liquids. The first MD
simulation of a real material was carried out by Gibson et al. to model radiation damage
in crystalline Cu.[12] In 1964, Rahman performed the first MD simulation using a realistic
potential for liquid argon.[13] Since then, MD simulations have been widely used in
Start
System Initialization
Predictor
Potential Energy &Force Calculation
Corrector
Data Output
Time out?
End
Yes
No
11
studying solids, liquids, gases, simple and complex hydrodynamic flows, shock waves,
deformation and fracture of materials, chemistry in solutions, conformational changes of
proteins, etc. MD simulations also find application in experimental procedures such as X-
ray crystallography, NMR structure determination, and inelastic neutron scattering.[14]
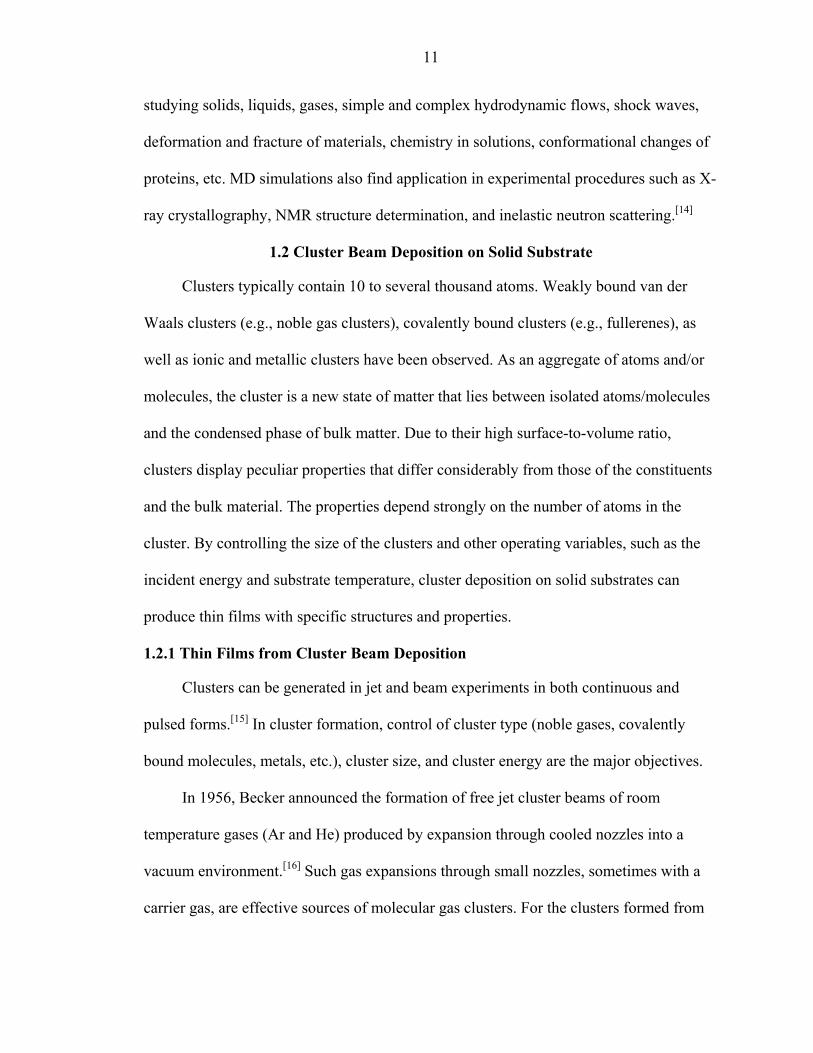
1.2 Cluster Beam Deposition on Solid Substrate
Clusters typically contain 10 to several thousand atoms. Weakly bound van der
Waals clusters (e.g., noble gas clusters), covalently bound clusters (e.g., fullerenes), as
well as ionic and metallic clusters have been observed. As an aggregate of atoms and/or
molecules, the cluster is a new state of matter that lies between isolated atoms/molecules
and the condensed phase of bulk matter. Due to their high surface-to-volume ratio,
clusters display peculiar properties that differ considerably from those of the constituents
and the bulk material. The properties depend strongly on the number of atoms in the
cluster. By controlling the size of the clusters and other operating variables, such as the
incident energy and substrate temperature, cluster deposition on solid substrates can
produce thin films with specific structures and properties.
1.2.1 Thin Films from Cluster Beam Deposition
Clusters can be generated in jet and beam experiments in both continuous and
pulsed forms.[15] In cluster formation, control of cluster type (noble gases, covalently
bound molecules, metals, etc.), cluster size, and cluster energy are the major objectives.
In 1956, Becker announced the formation of free jet cluster beams of room
temperature gases (Ar and He) produced by expansion through cooled nozzles into a
vacuum environment.[16] Such gas expansions through small nozzles, sometimes with a
carrier gas, are effective sources of molecular gas clusters. For the clusters formed from

12
these gas expansion sources, the control of pressure and temperature of the stagnation gas
helps to control the cluster size.
Another category of cluster sources, gas aggregation sources, are reported to be
particularly suitable for production of metal clusters of up to thousands of atoms.[17-19]
Briefly, metal vapor is first produced by either thermal evaporation[18] or sputter
discharge.[19] The vapor is then projected into a condensation cell filled with cold rare
gas. The supersaturated vapor then nucleates and coalesces to form clusters, the size of
which is controlled by adjusting the carrier gas flow.
Laser vaporization source is especially suitable for generating cluster beams of
refractory materials.[15] Laser ablation of solids produces plasma via the localized heating
induced in the material. By rapid quenching of the plasma, clusters can be produced. This
technique was originally used by Smalley (as cited in “Milani and Iannotta[15]”) and led to
the discovery of fullerenes C60 and C70 in a molecular beam experiment in which laser
vaporized graphite was seeded and expanded in helium.[20] The size of the clusters
generated from the laser vaporization sources is determined by controlling the mean
residence time of the plasma-gas mixture.[21, 22]
Ionized clusters are usually generated by electron impact after cluster formation.
Photon ionization of clusters, for instance, by UV lasers, is also reported.[15] The purpose
of ionization the clusters is to achieve easy manipulation and detection of the cluster
energy using electromagnetic fields. As far as the effect of ionization on the deposition
results is concerned, ionized clusters are widely assumed to behave in a similar manner to
neutral clusters due to the low charge carried in each cluster.[23] The deposition of size-
and energy-selected clusters is the ultimate goal for the synthesis of nanocrystalline

13
materials with tailored properties. Although the deposition of size-selected clusters in
bulk quantities is still in development, controlled deposition of clusters to study cluster-
surface and cluster-cluster interactions in the sub-monolayer regime have been realized
using mass/energy filters.[15]
The past three decades have witnessed an exciting development in thin film
production through energetic cluster-surface collisions using methods such as ionized
cluster beam deposition (ICBD),[24-32] energetic cluster impact (ECI),[19] and low-energy
cluster beam deposition (LECBD).[22, 33, 34] The whole collision process occurs rather
rapidly, typically within a few picoseconds.[35] Thin film formation from energetic cluster
beam deposition has several advantages over traditional atomic ion beam deposition.[19,
23] These include a high, transient concentration of energy and mass that is deposited in a
very localized region of the surface, resulting in conditions of extreme temperature and
pressure under which novel chemical reactions may happen.[28, 36, 37] In addition, compact,
smooth and strongly adhering thin films can easily be made on low temperature
substrates. Since the charge/atom ratio of ionized clusters is very low, space-charge
problems are negligible. Another intriguing feature of energetic cluster beam deposition
is that the surface modification effect is restricted to a very shallow region of the
substrate, avoiding significant property changes to the bulk material. Revealed by MD
simulations, the reason is the collective “plunger” effect of a number of cluster atoms
interacting with the same substrate atom at the same time.[38]
When the deposition occurs at high incident energy (in the range of keV per
cluster), the clusters will experience dramatic morphological changes upon impact. A
variety of outcomes are possible, including scattering of cluster fragments, sputtering of
14
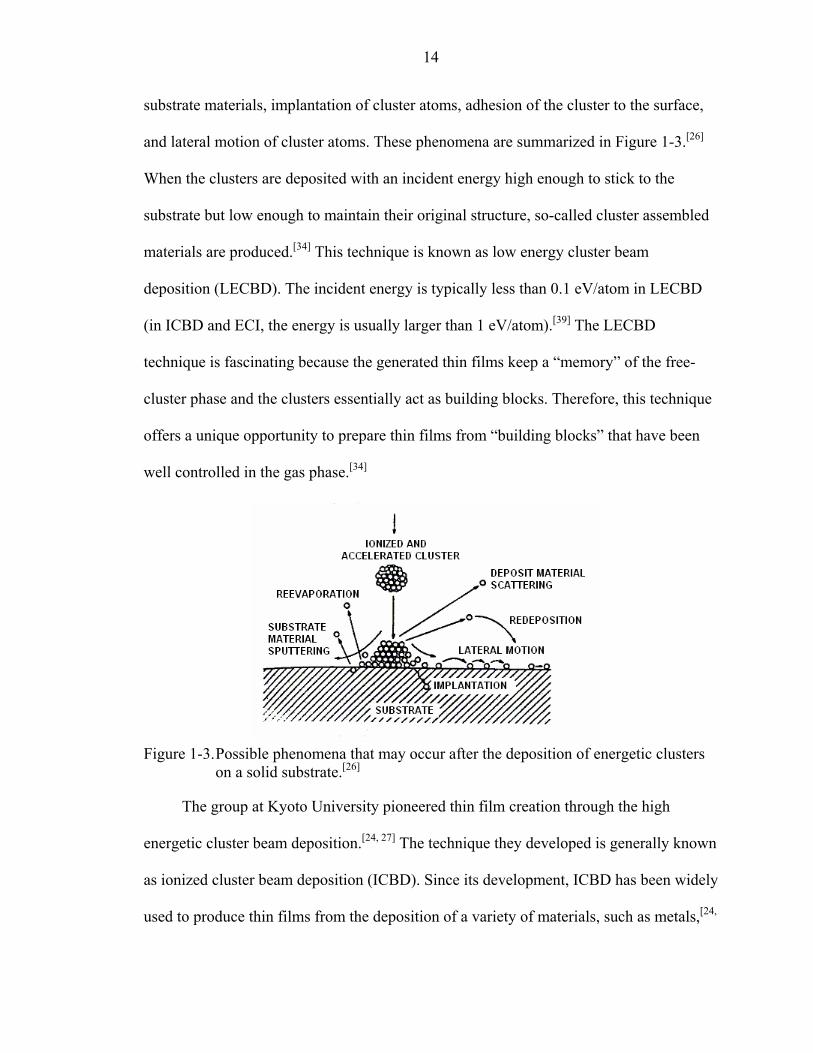
substrate materials, implantation of cluster atoms, adhesion of the cluster to the surface,
and lateral motion of cluster atoms. These phenomena are summarized in Figure 1-3.[26]
When the clusters are deposited with an incident energy high enough to stick to the
substrate but low enough to maintain their original structure, so-called cluster assembled
materials are produced.[34] This technique is known as low energy cluster beam
deposition (LECBD). The incident energy is typically less than 0.1 eV/atom in LECBD
(in ICBD and ECI, the energy is usually larger than 1 eV/atom).[39] The LECBD
technique is fascinating because the generated thin films keep a “memory” of the free-
cluster phase and the clusters essentially act as building blocks. Therefore, this technique
offers a unique opportunity to prepare thin films from “building blocks” that have been
well controlled in the gas phase.[34]
Figure 1-3. Possible phenomena that may occur after the deposition of energetic clusters on a solid substrate.[26]
The group at Kyoto University pioneered thin film creation through the high
energetic cluster beam deposition.[24, 27] The technique they developed is generally known
as ionized cluster beam deposition (ICBD). Since its development, ICBD has been widely
used to produce thin films from the deposition of a variety of materials, such as metals,[24,

15
26] nitrides,[31] semiconductors,[24, 32] and organic materials.[25, 28-30] However, theoretical
calculations show that standard ICBD conditions do not favor the formation of
clusters.[15] Experimentally, it was claimed that small clusters of up to 25 atoms might
exist in the clusters produced from a typical ICBD sources, but there was no or a very
small fraction of large clusters.[26, 40, 41]
Figure 1-4. The principle of the experimental set-up for thin film formation by energetic cluster impact (ECI).[19] C1 and C2: magnetron cathods; A1, A2 and A3: apertures (the region between A1 and A2 is the condension zone, which can be cooled by liquid N2); H: heater; R: crystal microbalance; S: substrate holder; TOF: time-of-flight mass spectrometer to measure the cluster size.
Energetic cluster impact (ECI) is a technique developed by Haberland’s group in
Freiburg.[19, 42] Figure 1-4 demonstrates the experimental set-up of thin film deposition by
ECI.[19] The size of the clusters formed ranges from 50 to more than 106 atoms per
cluster. What is unusual in this technique is that a large percentage (30-80%) of these
clusters has already been ionized; therefore, no additional electron ionization step is
necessary. The cause for this simultaneous ionization is the use of the magnetron
cathodes (C1 and C2 in Figure 1-4), which not only help to generate vapor by sputtering,
but also ionize the clusters by the afterglow from the sputter discharge. Thin films from

16
the deposition of metal (Mo, Cu, Al, and stainless steel) and SiO2 on Si and glass
substrates at room temperature using ECI have been reported so far.[19, 42] The incident
energy of the clusters is shown to be critical in determining the quality of the resultant
film.
In the past 30 years, a large amount of effort has been spent in understanding thin
film deposition from cluster-solid collisions. Although phenomenological models derived
from experimental observations can explain some of the relationships between deposition
conditions (incident energy, cluster size, and substrate temperature) and the resulting film
properties and structures, a deep enough understanding and, even more importantly, the
ability to predict how a change in deposition conditions leads to a change in thin film
properties, still remain as a longstanding challenge. This challenge has resulted in the
exploration of computer simulation, which has been proved to be a predictive as well as
explanatory tool in many cases. Among the various simulation techniques that may be
used, MD simulation is especially well suited to study the energetic deposition of clusters
because this process typically occurs within a few picoseconds. MD simulations allow
one to view the atomic motions and alter conditions of the system that may not be easily
varied experimentally. Therefore, simulations can provide valuable information about the
atomic mechanisms responsible for the resulting properties and structures. An added
feature of MD simulations is that quantities comparable to experimental results can be
obtained, especially after the breakthrough development of atomic scale experimental
techniques, such as atomic force microscopy (AFM) and scanning tunneling microscopy
(STM).

17
The first MD simulation of cluster-surface collisions was made by Müller with a
two-dimensional model using Lennard-Jones potentials.[43] Albeit simple, his simulations
disclosed the important role played by the cluster energy per atom in the quality of the
thin film. Following Müller’s lead, researchers around the world, including those who
developed the experimental cluster deposition techniques, performed a variety of MD
simulations, sometimes in combination with experimental work. The nucleation and
growth of the thin films,[44-49] evolution of clusters after impact,[35, 44, 46, 50-57] defect
formation in the substrates,[46-48, 58-61] and film morphology,[42, 62-64] have been examined
and documented. These MD simulations provide atomic scale insights into the effects of
cluster energy,[47, 48, 65-73] cluster size,[67, 74] and substrate temperature[67, 75-77] on the
resultant film structures and properties. As expected, these investigations further people’s
understanding of the underlying reaction mechanisms [36, 53, 59, 78, 79] as well as the thin
film nucleation[44, 46, 49, 80, 81] and defect formation mechanisms.[59] Together with the
experimental studies, these MD simulations help to provide a comprehensive picture of
cluster-solid interactions.
1.2.2 Motivation and Objectives
Among various thin films, organic thin films are technologically important
especially in electronic and optical device applications. For example, organic
electroluminescent (EL) devices can produce a strong light emission with a direct current
of relatively low voltage.[82] Additionally, deposition of organic materials can make
diamond-like carbon films,[83-86] which have many characteristics of bulk diamond
including extreme hardness and high thermal conductivity.
Conventional solvent-free methods to make organic thin films include physical
vapor deposition (PVD) and chemical vapor deposition (CVD).[82-88] Nevertheless, these
18
methods are not effective at achieving crystalline structures in the deposited films, and
hence, the desired properties are not obtained.[30] Energetic cluster beam deposition,
however, appears to be successful in this respect.[30] In fact, polyethylene thin films with
a structure close to the single crystalline polyethylene,[25] tetraphenylporphine thin films
with preferential crystal orientation,[28] and anthracene thin films with superior
photoluminescent and electroluminescent properties[25] have been reported using
energetic cluster beam depositions. The researchers at Charles University found that
cluster beam deposition could produce phthalocyanine thin films with structures and
properties ranging from those of evaporated films to the plasma polymerized samples.[29]
These studies indicate that cluster beam deposition is indeed a versatile and promising
technique to prepare organic thin films for functional devices.
Despite the impressive experimental work in organic thin film formation through
energetic cluster-solid collisions, there is little fundamental understanding of the reaction
and film nucleation mechanisms that occur during organic cluster deposition. These
problems can be addressed in MD simulations. Although a large amount of simulation
work has been carried out to study cluster-solid collisions as mentioned before, most deal
with metallic clusters[35, 42, 46-48, 52, 54, 56, 57, 60, 62, 64, 71-73, 77, 80, 81] or noble gas clusters.[43-45,
50, 51, 53, 61, 66, 78, 79, 89, 90] MD simulations of the deposition of fullerene molecules, i.e.,
carbon clusters, have also been reported.[36, 63, 65, 66, 70, 75, 91-94]
For the last six years, the Sinnott group has used MD simulations to study the
deposition of organic clusters on diamond surfaces.[95-105] The clusters that have been
considered include organic molecular clusters of ethane,[95] ethylene,[95, 96, 100, 101]
acetylene,[95-100] and adamantane.[102] Both single cluster deposition and cluster beam

19
deposition have been examined. The simulations show that due to the deposition-induced
high system temperature and pressure, numerous addition reactions may occur among the
incident molecules and between the impact cluster and the surface when the incident
energy is within 3 eV/molecule of the binding energy of a single cluster molecule.[95]
This prediction is supported by the experimental work of Lyktey et al., who showed that
polyethylene could be made from energetic collisions of molecular clusters of ethylene in
the gas phase;[106] and Sakashita et al., who reported that solid-state polyacetylene was
produced under high pressure.[107] These simulation studies have also addressed the
dependence of film nucleation and growth on deposition conditions such as molecular
reactivity,[95, 100] cluster size,[99, 101] incident energy,[95, 96, 102] impact frequency,[97] surface
reactivity,[98, 100] and surface temperature.[100, 101] The formation of craters on the surface
has been considered as well. These craters were found to be able to activate some surface
atoms and promote the adhesion of clusters. These simulation results are in agreement
with the reported cluster beam deposition experiments for making organic thin films.[25,
28, 30]
Varying the angle of incident particles has pronounced effects on the growing film
morphology and properties. This has been shown in both simulations[64, 108-112] and
experiments.[113-118] For instance, in vacuum evaporation, the oblique incidence of vapor
atoms is found to result in thin films with anisotropy in various macroscopic properties,
such as magnetic properties, electrical resistance, optical and mechanical properties.[119]
In atomic ion beam deposition, the non-perpendicular incidence leads to non-local
shadowing, which is the source of the resulting porous and columnar growth
morphology.[108, 113, 114] The incident angle of atomic ion beams is also found to influence
20
thin film composition,[110, 115] surface-trapping probability,[117] and kinetic energy
distribution of the sputtering surface fragments.[116] Deposition of energetic cluster beams
also shows that the surface smoothing effect[64, 111, 118] and the sputtering effect[118] are
strongly affected by incident angle.
Although extensive simulations have been done by the Sinnott group in
investigating the deposition of organic clusters, the effect of incident angle has not been
considered previously. Therefore, one of the objectives of the study reported in this
dissertation is to investigate angle effects on the deposition of organic clusters. Since a
crystalline substrate is used in the simulations, film nucleation and growth at oblique
deposition angles may have crystallographic orientation dependence, which is another
factor examined here. One of our previous studies investigated the deposition of an
adamantane cluster beam, while all the rest focused on clusters where the constituent
molecules were weakly bonded through van der Waals interactions. In this dissertation,
clusters with different types of chemical bonding holding the incident particles together
are considered. It is the intention of this study to provide a more complete description of
thin film nucleation and growth from energetic organic cluster beam depositions.
1.3 Carbon Nanotube/Polymer Composites
Carbon nanotubes posses unique structural, electrical, and thermal properties.[120-
129] Recent developments in the synthesis of carbon nanotubes have improved both their
quality and quantity.[130-133] These advances have paved the way for the expected new
material applications of carbon nanotubes. Particular effort has been spent in making
nanocomposites using these quasi-one-dimensional nanostructures as reinforcement to
capitalize on their extraordinary mechanical properties on a macroscopic scale.
21
1.3.1 Carbon Nanotubes
Carbon nanotubes, also known as tubular fullerenes, consist of sp2-bonded carbon
atoms. They were first reported in 1991 by Sumio Iijima[134] who was studying the
material deposited on the cathode during the arc-evaporation synthesis of fullerenes.[135]
Depending on the conditions under which they are produced, carbon nanotubes can
assemble either as multi-layered co-axial tubes (multiwalled nanotubes, MWNTs) or as
single-layer tubes (single-walled nanotubes, SWNTs). Each layer of the carbon nanotube
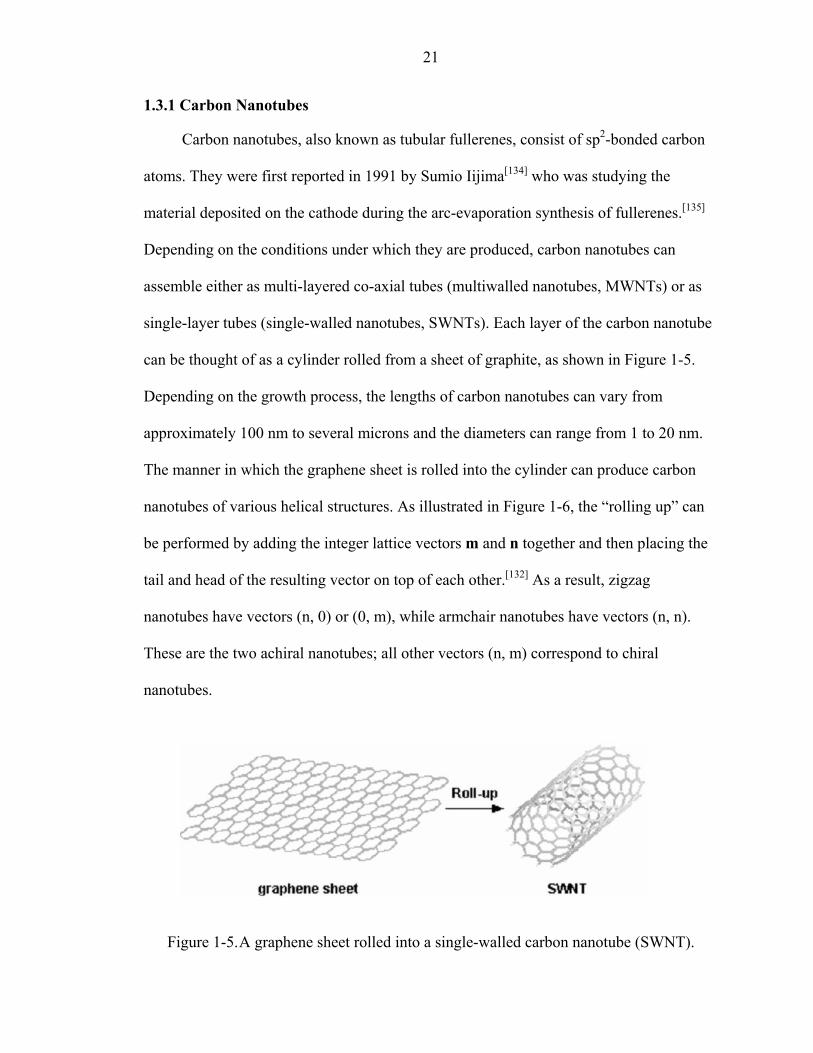
can be thought of as a cylinder rolled from a sheet of graphite, as shown in Figure 1-5.
Depending on the growth process, the lengths of carbon nanotubes can vary from
approximately 100 nm to several microns and the diameters can range from 1 to 20 nm.
The manner in which the graphene sheet is rolled into the cylinder can produce carbon
nanotubes of various helical structures. As illustrated in Figure 1-6, the “rolling up” can
be performed by adding the integer lattice vectors m and n together and then placing the
tail and head of the resulting vector on top of each other.[132] As a result, zigzag
nanotubes have vectors (n, 0) or (0, m), while armchair nanotubes have vectors (n, n).
These are the two achiral nanotubes; all other vectors (n, m) correspond to chiral
nanotubes.
Figure 1-5. A graphene sheet rolled into a single-walled carbon nanotube (SWNT).

22
Figure 1-6. The “rolling up” of a graphene sheet to produce carbon nanotubes of various helical structures.[132]
The three most common methods to produce carbon nanotubes are the arc, laser,
and chemical vapor deposition techniques. The standard carbon arc-evaporation method
can make carbon nanotubes in large quantities by carefully choosing the type and
pressure of the gas surrounding the arc, and the cooling of the electrodes and the
chamber.[136, 137] However, in this way, only MWNTs are produced. By introducing metal
catalysts such as Co, Fe, or Ni into the carbon arc, significant quantities of SWNTs are
formed.[138, 139] In 1996, Smalley’s group found an alternative way to prepare SWNTs.[130]
It involved the laser vaporization of graphite and resulted in a high yield of SWNTs.
These tubes tended to form aligned bundles (ropes) and had unusually uniform diameters
(~1.4 nm). Chemical vapor deposition (CVD) provides more controllable routes to
produce nanotubes with defined properties.[132] The general nanotube growth mechanism
in a CVD process involves the dissociation of hydrocarbon molecules (such as C2H2,
23
C2H4, xylene, benzene, toluene, etc.)[132] catalyzed by transition metal, and dissolution
and saturation of carbon atoms in the metal nanoparticle.[133]
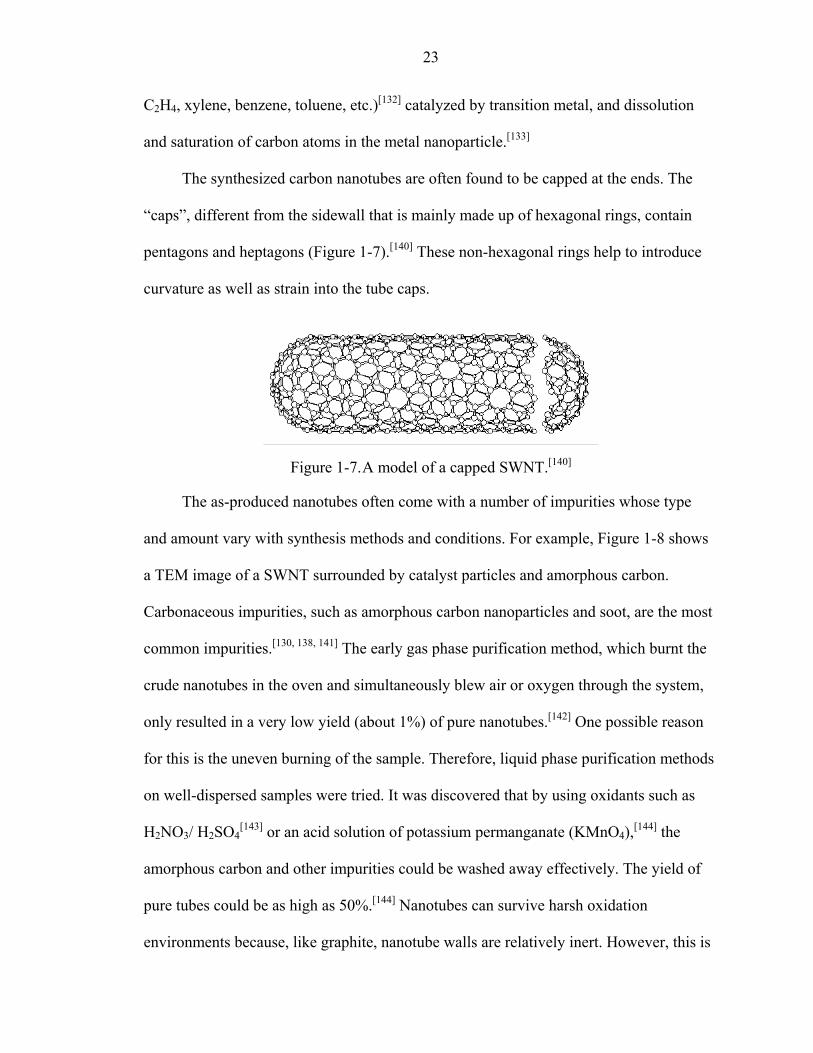
The synthesized carbon nanotubes are often found to be capped at the ends. The
“caps”, different from the sidewall that is mainly made up of hexagonal rings, contain
pentagons and heptagons (Figure 1-7).[140] These non-hexagonal rings help to introduce
curvature as well as strain into the tube caps.
Figure 1-7. A model of a capped SWNT.[140]
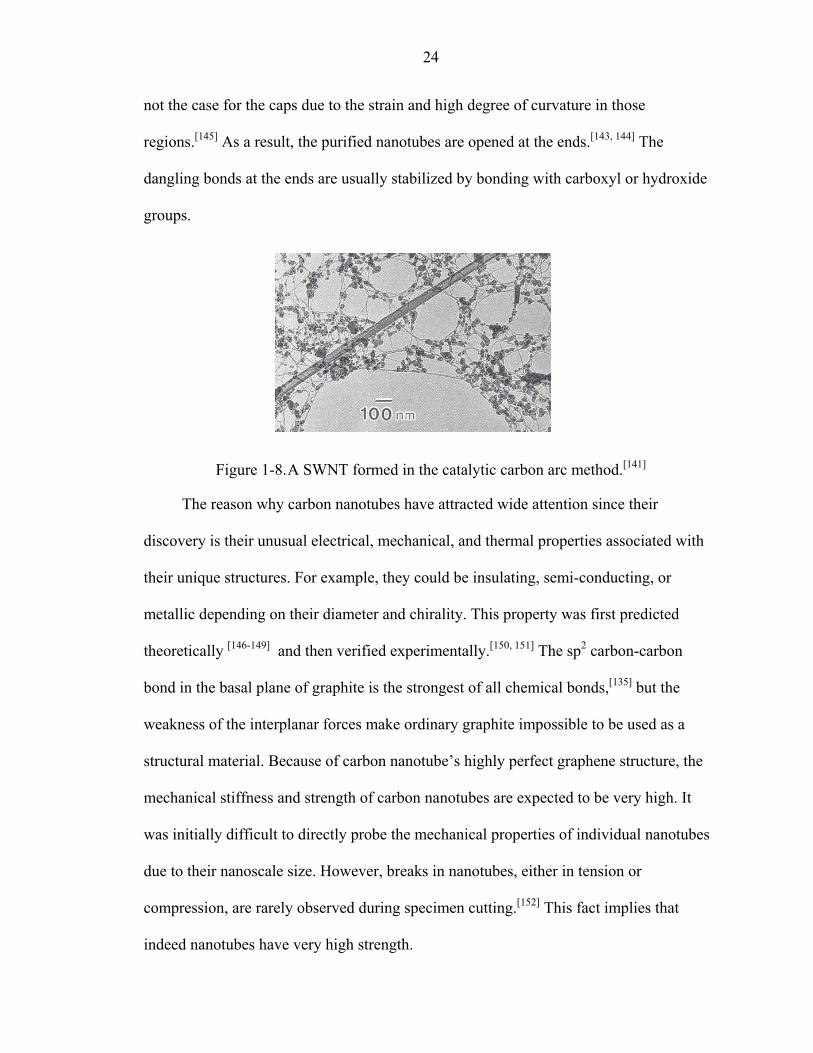
The as-produced nanotubes often come with a number of impurities whose type
and amount vary with synthesis methods and conditions. For example, Figure 1-8 shows
a TEM image of a SWNT surrounded by catalyst particles and amorphous carbon.
Carbonaceous impurities, such as amorphous carbon nanoparticles and soot, are the most
common impurities.[130, 138, 141] The early gas phase purification method, which burnt the
crude nanotubes in the oven and simultaneously blew air or oxygen through the system,
only resulted in a very low yield (about 1%) of pure nanotubes.[142] One possible reason
for this is the uneven burning of the sample. Therefore, liquid phase purification methods
on well-dispersed samples were tried. It was discovered that by using oxidants such as
H2NO3/ H2SO4[143] or an acid solution of potassium permanganate (KMnO4),[144] the
amorphous carbon and other impurities could be washed away effectively. The yield of
pure tubes could be as high as 50%.[144] Nanotubes can survive harsh oxidation
environments because, like graphite, nanotube walls are relatively inert. However, this is
24
not the case for the caps due to the strain and high degree of curvature in those
regions.[145] As a result, the purified nanotubes are opened at the ends.[143, 144] The
dangling bonds at the ends are usually stabilized by bonding with carboxyl or hydroxide
groups.
Figure 1-8. A SWNT formed in the catalytic carbon arc method.[141]
The reason why carbon nanotubes have attracted wide attention since their
discovery is their unusual electrical, mechanical, and thermal properties associated with
their unique structures. For example, they could be insulating, semi-conducting, or
metallic depending on their diameter and chirality. This property was first predicted
theoretically [146-149] and then verified experimentally.[150, 151] The sp2 carbon-carbon
bond in the basal plane of graphite is the strongest of all chemical bonds,[135] but the
weakness of the interplanar forces make ordinary graphite impossible to be used as a
structural material. Because of carbon nanotube’s highly perfect graphene structure, the
mechanical stiffness and strength of carbon nanotubes are expected to be very high. It
was initially difficult to directly probe the mechanical properties of individual nanotubes
due to their nanoscale size. However, breaks in nanotubes, either in tension or
compression, are rarely observed during specimen cutting.[152] This fact implies that
indeed nanotubes have very high strength.
25
Theoretical calculations of the mechanical properties of SWNTs suggest that the
Young’s modulus should be close to the in-plane elastic modulus of graphite (1.06
TPa).[153] The strength of MWNTs will be limited by the ease with which each layer
slides with respect to the other. In the last few years, a number of experimental
measurements of the Young’s modulus of nanotubes using TEM[128] or AFM[154]
techniques have been reported. The average results from these experiments suggest
values for Young’s modulus of individual nanotube around 1 TPa, in good agreement
with the theoretical predictions.
It is known that carbon fiber reinforced composites are often stronger than steel,
but much lighter. Because of this, they are used to replace metals in many applications,
from parts for airplanes and space shuttles to sports utilities. Carbon nanotubes have been
proposed as the ultimate carbon fibers[135] and are considered excellent reinforcing fibers
for the new generation of high performance nanocomposites.
1.3.2 Carbon Nanotube/Polymer Composites
There has been considerable effort devoted to studying nanotube/polymer
composites.[152, 155-175] Investigations of nanotube/metal composites[176] and
nanotube/ceramic composites[177] have also been reported. It is found that the nanotubes
do stiffen the composites,[163, 169, 170, 173, 177] change the electronic structure of the
polymer,[159] improve the conductivity of the composites,[155, 169, 172, 175] and in some cases
retard the onset of thermal degradation[170, 175] and protect the polymer from
photodegradation.[158]
The successful application of carbon nanotubes, especially as structural
reinforcement in polymer composites, depends on the ability to transfer load from the
matrix to the nanotubes.[164] Effective load transfer requires strong interfacial interaction

26
between the matrix and the nanotubes.[154] Without special surface treatment, some work
on the carbon nanotube/polymer composites suggested strong adhesion between the
matrix and the nanotubes, while others showed the opposite.
Wagner et al. reported the observation of multiple nanotube fragmentation under
tensile stresses using a nanotube-containing thin polyurethane film cured under a UV
lamp.[160] Similar fragmentation tests are routinely performed to study the fiber-matrix
stress transfer ability in fiber-reinforced composites. Thus, their observation proved a
rather good load transfer between the nanotube and the polymer. It was suggested that the
strong nanotube-polyurethane interface arose from the possible chemical bonds formed
through a photo-induced “2+2” cycloaddition, a mechanism as demonstrated in C60
photopolymerization.[178] The same group also studied nanotube/epoxy composites and
nanotube fragmentation was again observed.[166] A recent study of carbon
nanotube/carbon fiber hybrid composites suggested the presence of carbon nanotubes at
the carbon fiber/epoxy interface improved the interfacial shear strength of the
composites, which also supports good adhesion between the nanotube and the polymer
matrix.[179] The microscopic and spectroscopic study of carbon nanotube/poly(m-
phenylenevinylene-co-2,5-dioctyloxy-p-phenylenevinylene) (PmPV) composites showed
excellent wetting of the nanotubes by the polymer, again demonstrating considerable
interactions between the nanotube and the polymer.[157] The study of carbon
nanotube/poly(phenylacetylenes) (CNT/PPAs) by Tang et al. was very interesting in that
the nanotubes were found to be helically wrapped by the PPA chains.[158] The wrapping
process was believed to result from the strong π⋅⋅⋅−≡ HC hydrogen bonds formed
27
between the polymer with terminal alkyne groups ( HCRC −≡ ) and the nanotube that is
rich in π electrons.
However, an earlier study of carbon nanotube/epoxy composites indicated weak
interfacial bonding between the tubes and the matrix.[152] Schadler and co-workers
studied the load transfer in carbon nanotube/epoxy composites in both tension and
compression. By monitoring the shift of the second-order Raman peak at 2700 cm-1
which is sensitive to the applied strain, they concluded that the load transfer in
compression was effective while in tension it was poor, as demonstrated by a significant
shift in compression and non-shift in tension.[161]
Other work gave mixed results on this topic.[167, 171-173] For example, an
investigation of the fracture surface of carbon nanotube/polyhydroxyaminoether
composites[171] showed that, in most cases, the polymer adhered to the nanotube.
However, in contrast to Wagner’s studies,[160, 166] no broken carbon nanotubes were
observed at the fracture surface, which indicated that the load transfer from polymer to
nanotube was not sufficient to fracture the nanotubes. In studying carbon
nanotube/polystyrene (CNT/PS) composites, Qian et al.[173] found effective load transfer
from the matrix to the nanotube by comparing the measured composite modulus with the
calculated value assuming there were strong bonds between the two phases. However,
when they were watching crack nucleation and propagation using in situ TEM, the
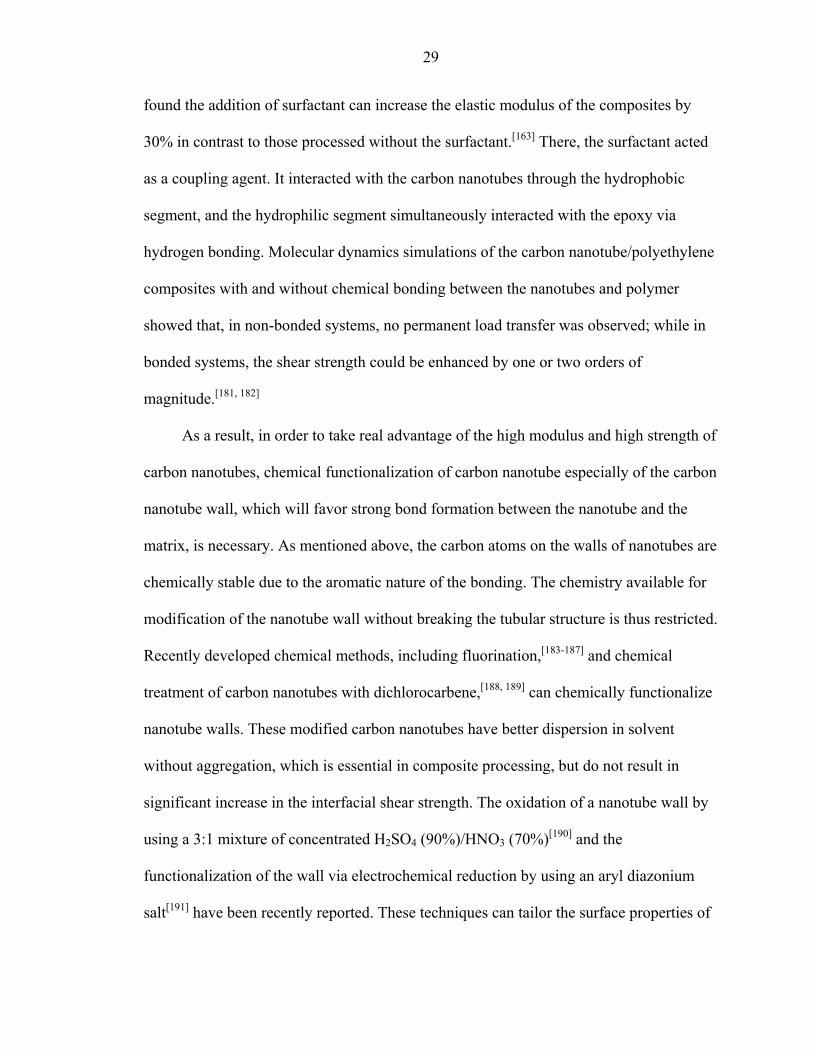
composites failed through nanotube pullout (Figure 1-9), a phenomenon that occurs when
there is poor adhesion between the reinforcement and the matrix.
Based on these experimental results, computer simulations were carried out to
study the nanotube/polymer interface, trying to reveal the underlying mechanisms that are

28
Figure 1-9. In situ straining of a CNT/PS compsite in TEM.[173]
important for reinforcement of the matrix. The molecular mechanics simulations and
elasticity calculations of the interfacial characteristics of a carbon nanotube/polystyrene
composite indicated that, in the absence of atomic bonding, the interfacial load transfer
ability came from electrostatic and van der Waals interactions, deformation induced by
these interactions, and stress arising from mismatch in the coefficient of thermal
expansion.[174] A molecular dynamics simulation of carbon nanotube pullout from a
polyethylene matrix[180] suggested that the interfacial friction model based on a critical
force could be used to describe the entire process of nanotube pullout. In this study, 0.1
nN was predicted to be this critical force for composites with only van der Waals
interactions between the nanotube and the matrix.
In composites, a high interfacial shear stress between the fiber and the matrix
guarantees good load transfer. Typically, the introduction of mechanical interlocking and
the formation of strong bonds, such as covalent or hydrogen bonds, between the
reinforcements and the matrix will increase the interfacial shear stress. Between the two,
the second method is much more effective. It is also applicable to carbon nanotube
containing nanocomposites. In making carbon nanotube/epoxy composites, Gong et al.
500 nm
29
found the addition of surfactant can increase the elastic modulus of the composites by
30% in contrast to those processed without the surfactant.[163] There, the surfactant acted
as a coupling agent. It interacted with the carbon nanotubes through the hydrophobic
segment, and the hydrophilic segment simultaneously interacted with the epoxy via
hydrogen bonding. Molecular dynamics simulations of the carbon nanotube/polyethylene
composites with and without chemical bonding between the nanotubes and polymer
showed that, in non-bonded systems, no permanent load transfer was observed; while in
bonded systems, the shear strength could be enhanced by one or two orders of
magnitude.[181, 182]
As a result, in order to take real advantage of the high modulus and high strength of
carbon nanotubes, chemical functionalization of carbon nanotube especially of the carbon
nanotube wall, which will favor strong bond formation between the nanotube and the
matrix, is necessary. As mentioned above, the carbon atoms on the walls of nanotubes are
chemically stable due to the aromatic nature of the bonding. The chemistry available for
modification of the nanotube wall without breaking the tubular structure is thus restricted.
Recently developed chemical methods, including fluorination,[183-187] and chemical
treatment of carbon nanotubes with dichlorocarbene,[188, 189] can chemically functionalize
nanotube walls. These modified carbon nanotubes have better dispersion in solvent
without aggregation, which is essential in composite processing, but do not result in
significant increase in the interfacial shear strength. The oxidation of a nanotube wall by
using a 3:1 mixture of concentrated H2SO4 (90%)/HNO3 (70%)[190] and the
functionalization of the wall via electrochemical reduction by using an aryl diazonium
salt[191] have been recently reported. These techniques can tailor the surface properties of
30
a carbon nanotube to be favorable to form chemical bonds during nanotube composite
processing. A combined computational and experimental study indicated that the local
reactivity of the nanotube walls could be enhanced by the introduction of local
conformational strain, such as “kinks” resulting from bending and “ridges” resulting from
torsional strain.[145] This so-called “kinky chemistry” is quite interesting because of its
possibility to selectively functionalize the sidewall.
1.3.3 Motivation and Objectives
Since the discovery of carbon nanotubes, TEM has been the most frequently used
technique to study their structure. When using TEM, people noticed the evolution of
carbon nanotubes under the irradiation of an electron beam.[192] Electron irradiation of
carbon nanotubes can result in the formation of various atomic scale defects in the
nanotube walls.[192-194] Besides, electron irradiation can cause nanotubes to shrink in
diameter[193] or merge with other nanotubes through bond breaking and reformation.[195,
196] In other words, electron irradiation can activate the otherwise inert nanotube wall.
Similar findings have been seen in simulations and experiments of the ion irradiation[197-
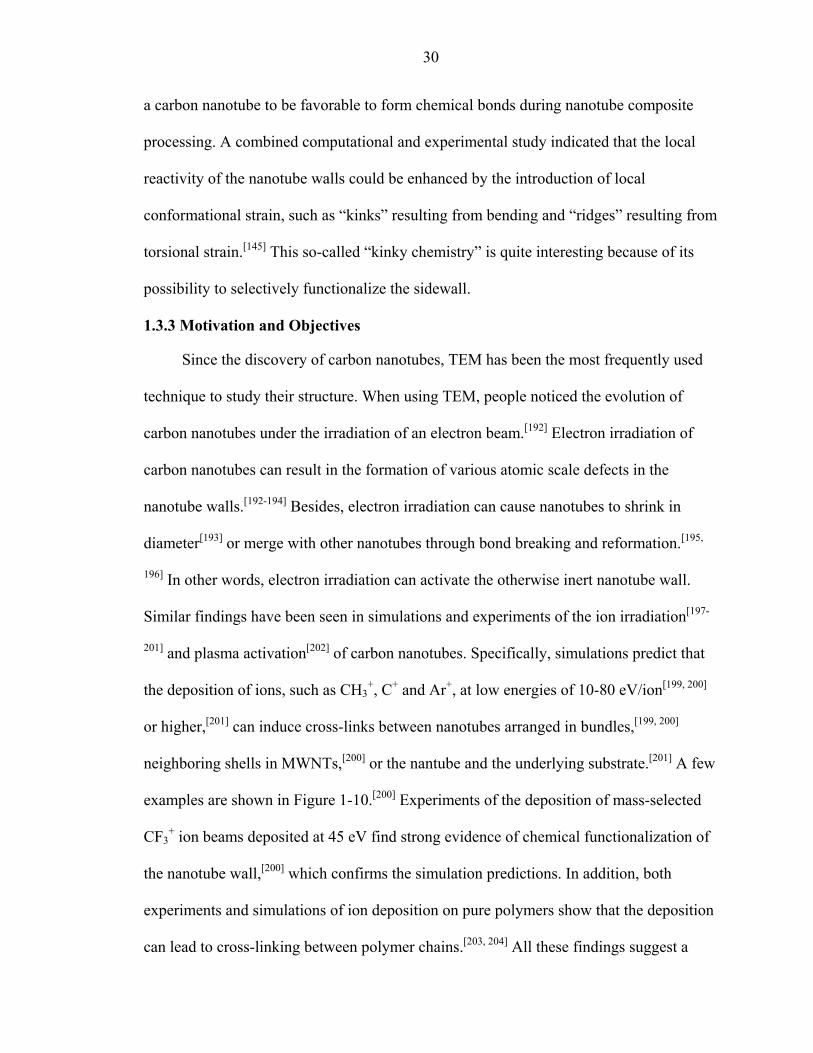
201] and plasma activation[202] of carbon nanotubes. Specifically, simulations predict that
the deposition of ions, such as CH3+, C+ and Ar+, at low energies of 10-80 eV/ion[199, 200]
or higher,[201] can induce cross-links between nanotubes arranged in bundles,[199, 200]
neighboring shells in MWNTs,[200] or the nantube and the underlying substrate.[201] A few
examples are shown in Figure 1-10.[200] Experiments of the deposition of mass-selected
CF3+ ion beams deposited at 45 eV find strong evidence of chemical functionalization of
the nanotube wall,[200] which confirms the simulation predictions. In addition, both
experiments and simulations of ion deposition on pure polymers show that the deposition
can lead to cross-linking between polymer chains.[203, 204] All these findings suggest a

31
possible novel approach that carbon nanotube/polymer composites could be chemically
functionalized to form covalent bond at the interface without first treating the tubes
and/or exposing them to strong acidic or the other harsh chemical environments as
described before.
Figure 1-10. Cross-linking formed between nanotubes and adjacent shells in the case of MWNT as a result of energetic ion deposition.[200]
In this dissertation, molecular dynamics simulations are used to explore the
modification of a carbon nanotube/polystyrene composite through the deposition of a
beam of polyatomic ions of C3F5+. One objective is to determine if polyatomic ion beam
deposition is a suitable approach to induce covalent cross-links between otherwise
unfunctionalized nanotubes and the polymer matrix. The second objective of this study is
to examine the effects of the incident energy and the nanotube/polymer geometry. The
third objective is to determine how the presence of the nanotube in the polymer affects
the outcome of the polyatomic ion beam deposition relative to deposition on a pristine
polymer substrate.
1.4 Organization of the Dissertation
The use of empirical potential energy functions to describe the interatomic
interactions may not be as quantitatively accurate as ab initio or semi-empirical methods

32
due to the approximations introduced and parameter fitting. But, they have obvious
advantages over semi-empirical and ab initio methods, especially when large systems and
long timescales are desired. In this dissertation, the reactive empirical bond order
(REBO) potential for carbon-based covalent systems is used to describe the short-range
covalent bonding. In order to test the accuracy of the REBO potential, in Chapter 2, the
simulation results using the REBO potential and a semi-empirical tight-binding scheme
are first compared. Since in experiments, both the cluster beam deposition and
polyatomic ion beam deposition usually occur at room temperature, a proper temperature
control algorithm should be employed in the simulations. Chapter 3 thus describes
several temperature control methods. Their efficiency specifically in dealing with the
deposition systems is presented. Chapter 4 reports the MD simulation results for thin film
nucleation via organic cluster beam depositions. Chapter 5 presents the MD simulations
of chemical modification of carbon nanotube/polymer composites through polyatomic
ion beam deposition. Finally, the overall conclusions of this work are given in Chapter 6.

33
CHAPTER 2 COMPARISON OF O(N)/NOTB AND REBO POTENTIAL MOLECULAR
DYNAMICS SIMULATIONS
In modeling a many-body system, it is essential to find an appropriate method to
calculate the interatomic energies and forces. These interactions can be considered using
ab initio calculations, semi-empirical methods, or empirical function expressions. In ab
initio calculations, all the electrons are treated explicitly and quantum mechanically.
Thus, they give the most exact results but are the most computationally demanding. Ab
initio calculations are usually limited to modeling small systems containing several
hundred atoms. Semi-empirical methods explicitly consider the contribution of some of
the electrons (generally some of or all of the valence electrons), which is usually denoted
as the band structure energy; the contributions of the other electrons are taken into
account via various mathematical expressions fitted to experimental data or first principle
(ab initio) results. Because of their semi-empirical character, these methods usually give
fairly accurate results while the computational workload is comparatively small, and
relatively large-scale simulations (~ 5,000 atoms) are possible. Empirical potential
functions are further simplified mathematical expressions that do not explicitly consider
any electron contributions, but model the interatomic forces from the interactions of
electrons and nuclei by appropriate parameter fitting reasonably well.[205] Due to their
great computational efficiency, empirical potential functions have obvious advantages for
large systems (more than several thousand atoms) and long simulation times, although
34
the results may be subject to errors that can arise from the assumed functional forms and
parameter fitting.[205]
The order-N nonorthogonal tight-binding (O(N)/NOTB) method of Wu and
Jayanthi[206] is a semi-empirical approach that explicitly incorporates the band structure
energy. This scheme has been successfully applied to study a wide range of problems
associated with nanostructures, including the initial stage of growth of Si/Si(001),[207]
carbon nanotubes,[208] and Si nanoclusters.[209] The reactive empirical bond-order (REBO)
potential is a refinement of the Abell-Tersoff potential and was parameterized by Brenner
et al. initially for hydrocarbons.[210, 211] Due to its flexibility to allow bond breaking and
reforming with appropriate changes in atomic hybridization, the REBO potential gives
structural predictions for diamond surface reconstruction consistent with ab initio
studies.[212, 213] It has found extensive uses in modeling other structures and processes as
well, such as chemical processes in reactive hydrocarbon systems,[95, 214-217] properties of
fullerenes and carbon nanotubes,[145, 218-225] and mechanical processes associated with
indentation, friction and compression.[225-230] An extended REBO potential for Si-Si, Si-C
and Si-H interactions has also been reported to reproduce ab initio predictions and/or
experimental results of the equilibrium structures and binding energies for C-Si-H
systems reasonably well.[231-234] Despite all these successful applications, as is the case
with most empirical potentials, there are cases where the results from the REBO potential
lack the quantitative accuracy even while the qualitative predictions are correct.[235-237]
In this work, simulation results from the O(N)/NOTB method and the REBO
potential are compared and contrasted. The process investigated is the collision of
hydrocarbon clusters on diamond surfaces. This process usually occurs on the time scale
35
of a few picoseconds (ps) if the collision happens at hyperthermal (1-500 eV) or higher
energies. Molecular dynamics (MD) simulations are thus well suited to study this
process. For convenience, the MD simulation using the REBO potential is denoted as
empirical MD (EMD), and the one using the O(N)/NOTB method is O(N)/NOTB-MD.
The purpose of this work is to check both the qualitative and quantitative predictions
from the REBO potential against the results from the O(N)/NOTB method, and thus to
obtain a better knowledge of the reliability of the REBO potential.
2.1 Order-N Nonorthogonal Tight-Binding (O(N)/NOTB) Method
In the semi-empirical tight-binding scheme, the total energy of a system can be
written as[238]:
repbstot UUU += (2-1)
where bsU is the band structure energy that considers the electronic contributions to the
atomic forces. repU is a pair wise repulsive term, which considers the effects of the
overlap interactions and the possible charge transfer that are neglected in bsU . repU can be
expressed as a sum of suitable empirical two-body potentials ( )( ijrΦ ):
∑∑Φ=i j
ijrep rU )( (2-2)
where ijr is the distance between the ith and jth atom. )( ijrΦ is obtained by parameter
fitting.
In the O(N)/NOTB approach of Jayanthi et al.,[206] the band structure energy is
expressed as:
∑∑ ==βα
αββαλ
λ ρji
ijjiocc
bs HEU,
,,)(
22 (2-3)
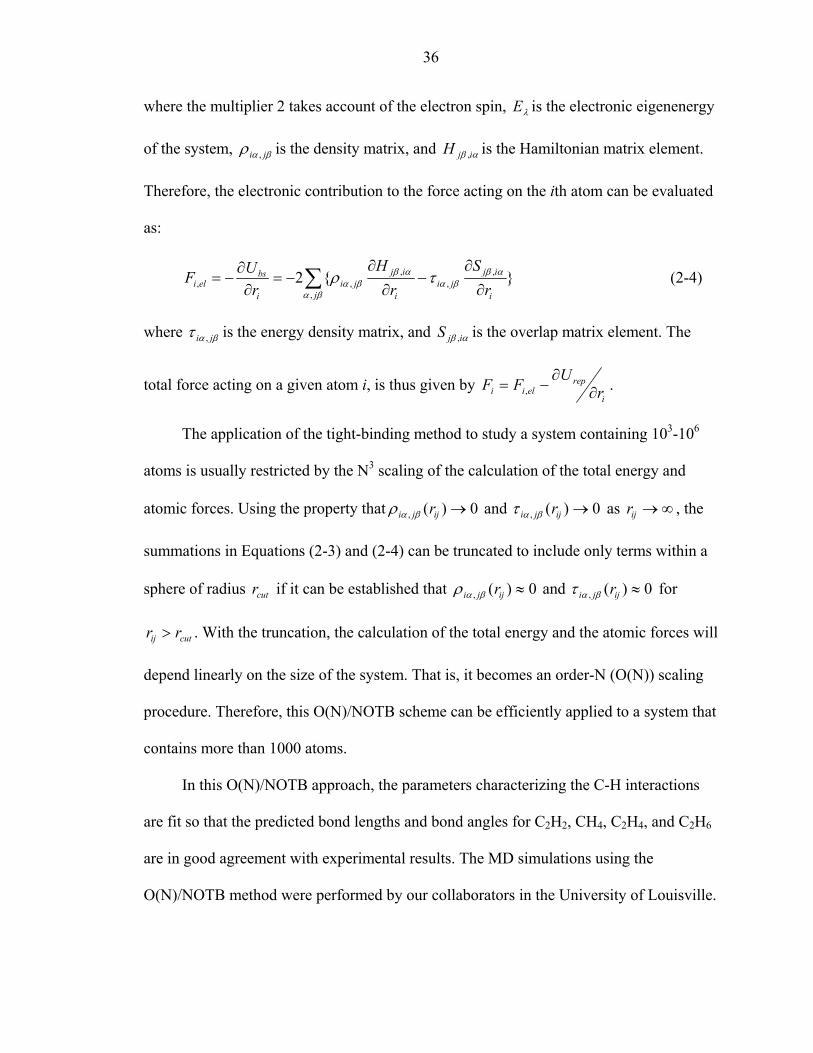
36
where the multiplier 2 takes account of the electron spin, λE is the electronic eigenenergy
of the system, βαρ ji , is the density matrix, and αβ ijH , is the Hamiltonian matrix element.
Therefore, the electronic contribution to the force acting on the ith atom can be evaluated
as:
∑ ∂∂
−∂
∂−=
∂∂
−=βα
αββα
αββα τρ
j i
ijji
i
ijji
i
bseli r
Sr
Hr
UF,
,,
,,, }{2 (2-4)
where βατ ji , is the energy density matrix, and αβ ijS , is the overlap matrix element. The
total force acting on a given atom i, is thus given by i
repelii r
UFF ∂∂
−= , .
The application of the tight-binding method to study a system containing 103-106
atoms is usually restricted by the N3 scaling of the calculation of the total energy and
atomic forces. Using the property that 0)(, →ijji rβαρ and 0)(, →ijji rβατ as ∞→ijr , the
summations in Equations (2-3) and (2-4) can be truncated to include only terms within a
sphere of radius cutr if it can be established that 0)(, ≈ijji rβαρ and 0)(, ≈ijji rβατ for
cutij rr > . With the truncation, the calculation of the total energy and the atomic forces will
depend linearly on the size of the system. That is, it becomes an order-N (O(N)) scaling
procedure. Therefore, this O(N)/NOTB scheme can be efficiently applied to a system that
contains more than 1000 atoms.
In this O(N)/NOTB approach, the parameters characterizing the C-H interactions
are fit so that the predicted bond lengths and bond angles for C2H2, CH4, C2H4, and C2H6
are in good agreement with experimental results. The MD simulations using the
O(N)/NOTB method were performed by our collaborators in the University of Louisville.

37
2.2 Reactive Empirical Bond-Order (REBO) Potential
The general analytic bond-order potential energy formalism was originally
introduced by Abell,[239] in which he showed that the chemical binding energy bU can be
simply expressed as a sum over nearest neighbors:
∑∑>
−=i ij
ijAijijRb rVbrVU)(
)]()([ (2-5)
The functions )(rVR and )(rVA are pair-additive terms that describe the interatomic
repulsions and attractions, respectively. The term ijb is a bond-order term between atoms
i and j. A practical implementation of Abell’s bond-order formalism was first developed
by Tersoff for group IV elements.[240, 241] By introducing analytic parameterized forms for
the bond order term, the Tersoff potential can accurately treat silicon, germanium and
their alloys, but is less reliable for carbon.[213]
Carbon is a very unique element in that it has a variety of different types of C-C
bonding with very different energies and bond lengths, which results in a large variety of
polymorphic forms, such as diamond, graphite, fullerene, and various amorphous
phases.[242] The Tersoff potential does not distinguish the chemical character of the
bond;[213] therefore, it cannot describe processes involving a change of bonding
characters, such as surface reconstruction and chemical reactions, very well. In 1990, the
reactive empirical bond-order (REBO) potential for describing solid-state carbon and
hydrocarbon molecules was reported by Brenner.[210] In this potential, nonlocal terms,
which properly account for the chemical bonding changes based on the change of
neighboring atoms, are added to the Tersoff potential. Consequently, the REBO potential
allows for bond formation and breaking with appropriate changes in atomic
hybridization, which is crucial for realistic treatment of such processes as chemical

38
reactions. Thanks to the development of the REBO potential, it is now possible to model
simple organic chemical reactions within an empirical scheme. However, in the first
generation REBO potential, the terms describing the pair interactions in Equation (2-5)
were found to be too restrictive to simultaneously fit equilibrium distances, bond
energies, and force constants for carbon-carbon bonds. What is more, both terms go to
finite values as the distance between atoms decreases, which limit the possibility of
modeling processes such as energetic atomic collisions. Therefore, the second generation
REBO potential, using improved analytic functions for interatomic interactions and an
expanded fitting database, was developed.[211] The forces associated with rotation about
dihedral angles for carbon-carbon double bonds, as well as angular interactions
associated with hydrogen centers, have also been included. In this study, the second
generation REBO potential[211] is used.
The analytic terms describing the pair interactions in Equation (2-5) in the second
generation REBO potential are written as:
rcR Aer
QrfrV α−+= )1)(()( (2-6)
∑ −=n
rn
cA
neBrfrV β)()( (2-7)
The function for the repulsive interactions (Equation (2-6)) goes to infinity as the
interatomic distance (r) approaches zero, and the attractive term (Equation (2-7)) has
sufficient flexibility to simultaneously fit the bond properties. The variables Q, A, α, B
and β are all parameters that are fit to experimental or ab initio data for both hydrocarbon
molecules and solid-state carbon, and are adjusted using a standard fitting routine. The

39
function )(rf c limits the range of the covalent interactions. For carbon, the value of
)(rf c will be one for nearest neighbors and zero for all other interatomic distances.
The bond-order term in the second generation REBO potential is written as the sum
of terms:
ππσπσijjiijij bbbb ++= −− ][
21 (2-8)
Values for the functions πσ −ijb and πσ −
jib depend on the local coordination and bond angles
for atoms i and j. The dependence on bond angles is necessary to accurately model elastic
properties and defect energies. The function πijb is further expressed as a sum of two
terms:
DHij
RC
ijij bb +=∏π (2-9)
where the value of the first term depends on whether a bond between atoms i and j has
radical character and is part of a conjugated system. The value of the second term
depends on the dihedral angle for carbon-carbon double bonds.
Within a single expression, as introduced by Abell (Equation (2-5)), the revised
REBO potential accurately reflects the bond energies, bond lengths and force constants
for carbon-carbon bonds. It has produced an improved fit to radical energies, conjugated
π bonding properties, and diamond surface properties. It also gives a reasonable
description of diamond, graphitic and hybrid diamond-graphitic structures.[243]
The REBO potential describes short-range covalent interactions. In order to take
into account long-range van der Waals molecular interactions, Lennard-Jones (LJ) 6-12
potential can be coupled with the REBO potential. Thus, the combined expression to
calculate the binding energy between atoms i and j is:
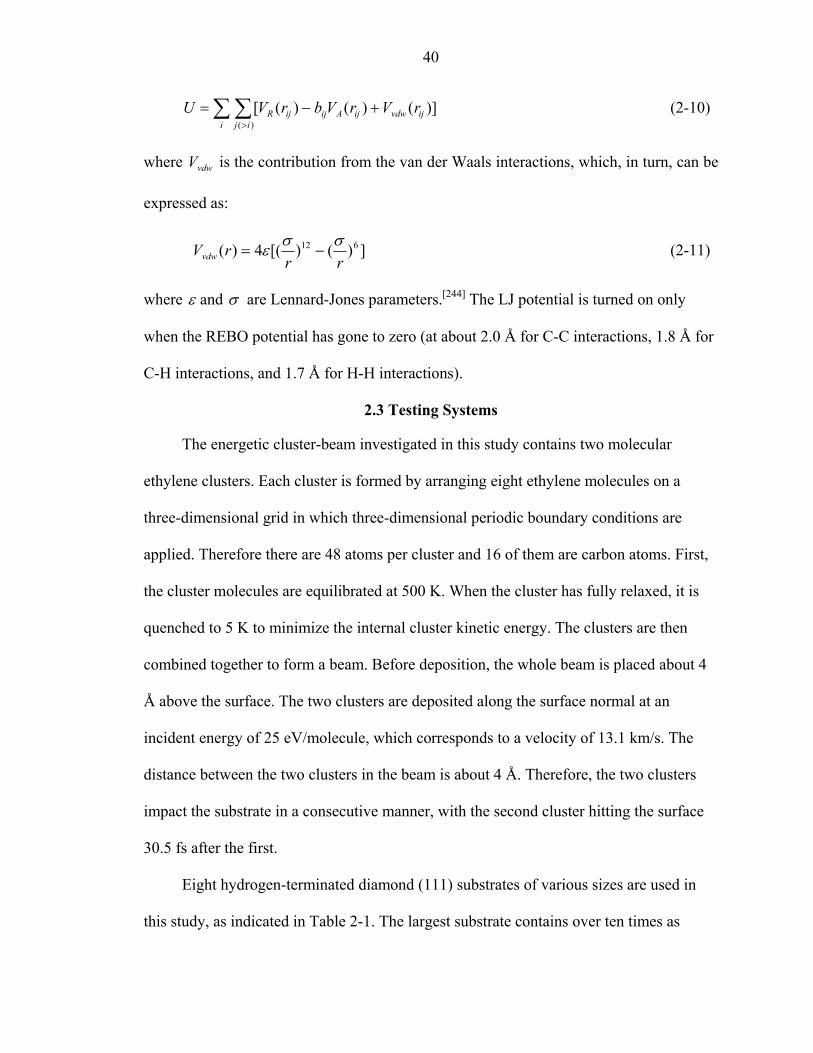
40
∑∑>
+−=i ij
ijvdwijAijijR rVrVbrVU)(
)]()()([ (2-10)
where vdwV is the contribution from the van der Waals interactions, which, in turn, can be
expressed as:
])()[(4)( 612
rrrVvdw
σσε −= (2-11)
where ε and σ are Lennard-Jones parameters.[244] The LJ potential is turned on only
when the REBO potential has gone to zero (at about 2.0 Å for C-C interactions, 1.8 Å for
C-H interactions, and 1.7 Å for H-H interactions).
2.3 Testing Systems
The energetic cluster-beam investigated in this study contains two molecular
ethylene clusters. Each cluster is formed by arranging eight ethylene molecules on a
three-dimensional grid in which three-dimensional periodic boundary conditions are
applied. Therefore there are 48 atoms per cluster and 16 of them are carbon atoms. First,
the cluster molecules are equilibrated at 500 K. When the cluster has fully relaxed, it is
quenched to 5 K to minimize the internal cluster kinetic energy. The clusters are then
combined together to form a beam. Before deposition, the whole beam is placed about 4
Å above the surface. The two clusters are deposited along the surface normal at an
incident energy of 25 eV/molecule, which corresponds to a velocity of 13.1 km/s. The
distance between the two clusters in the beam is about 4 Å. Therefore, the two clusters
impact the substrate in a consecutive manner, with the second cluster hitting the surface
30.5 fs after the first.
Eight hydrogen-terminated diamond (111) substrates of various sizes are used in
this study, as indicated in Table 2-1. The largest substrate contains over ten times as
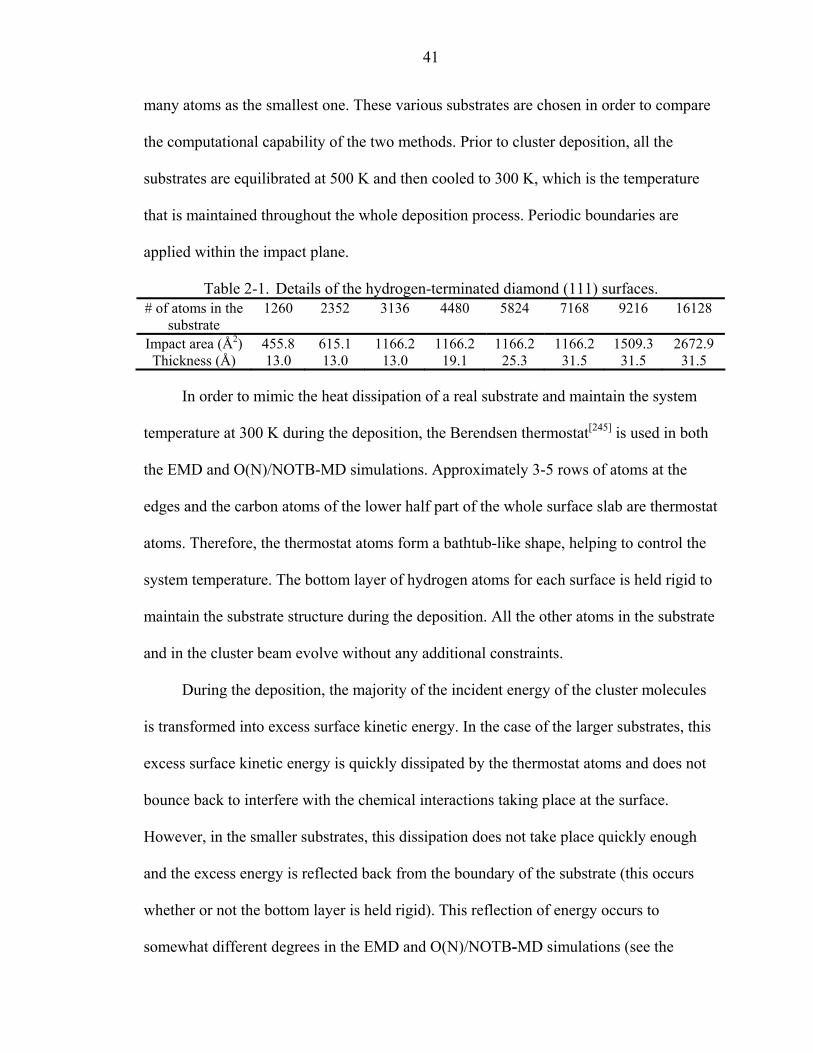
41
many atoms as the smallest one. These various substrates are chosen in order to compare
the computational capability of the two methods. Prior to cluster deposition, all the
substrates are equilibrated at 500 K and then cooled to 300 K, which is the temperature
that is maintained throughout the whole deposition process. Periodic boundaries are
applied within the impact plane.
Table 2-1. Details of the hydrogen-terminated diamond (111) surfaces. # of atoms in the
substrate 1260 2352 3136 4480 5824 7168 9216 16128
Impact area (Å2) 455.8 615.1 1166.2 1166.2 1166.2 1166.2 1509.3 2672.9 Thickness (Å) 13.0 13.0 13.0 19.1 25.3 31.5 31.5 31.5
In order to mimic the heat dissipation of a real substrate and maintain the system
temperature at 300 K during the deposition, the Berendsen thermostat[245] is used in both
the EMD and O(N)/NOTB-MD simulations. Approximately 3-5 rows of atoms at the
edges and the carbon atoms of the lower half part of the whole surface slab are thermostat
atoms. Therefore, the thermostat atoms form a bathtub-like shape, helping to control the
system temperature. The bottom layer of hydrogen atoms for each surface is held rigid to
maintain the substrate structure during the deposition. All the other atoms in the substrate
and in the cluster beam evolve without any additional constraints.
During the deposition, the majority of the incident energy of the cluster molecules
is transformed into excess surface kinetic energy. In the case of the larger substrates, this
excess surface kinetic energy is quickly dissipated by the thermostat atoms and does not
bounce back to interfere with the chemical interactions taking place at the surface.
However, in the smaller substrates, this dissipation does not take place quickly enough
and the excess energy is reflected back from the boundary of the substrate (this occurs
whether or not the bottom layer is held rigid). This reflection of energy occurs to
somewhat different degrees in the EMD and O(N)/NOTB-MD simulations (see the
42
discussion below). As the point of this study is the comparison of the predictions of these
two methods, this reflection of energy does not detract from our objective as long as the
results of the deposition on a same surface are compared.
For statistical purposes, several trajectories are performed for each surface and the
results are averaged. In the case of the O(N)/NOTB-MD simulations, three trajectories
are run for each of the three smallest surfaces (1260, 2352 and 3136 atoms/surface). In
the case of the EMD simulations, the same three trajectories are run on the same three
surfaces so that the EMD and O(N)/NOTB-MD results may be compared. In addition,
since the EMD method is much faster than the O(N)/NOTB-MD method and more
trajectories lead to better statistical representation of the results, ten trajectories total were
run for each of the eight surfaces considered.
The time step is 0.2 fs. The simulations run for at least 1 ps with the clusters
impacting on the surface during the first 0.16 ps and the film relaxing thereafter. Each
O(N)/NOTB-MD simulation typically required 12 nodes of an IBM RS/6000 SP2
supercomputer (with 48 CPUs) and ran for about 4 days, while each EMD simulation
typically ran for a few hours (the largest simulations ran about one day) on a Compaq
Alpha64 workstation.
2.4 Results and Discussion
When the molecular clusters come into contact with the surface, numerous
chemical reactions occur among the cluster molecules and between the cluster and the
substrate, resulting in hydrocarbon thin film nucleation and growth. Both the
O(N)/NOTB-MD and EMD methods predict that when the clusters impact the substrate
with the short time lag of 30.5 fs, many more of the carbon atoms in the film are from the
first incident cluster. Furthermore, both methods predict that within a given cluster, more
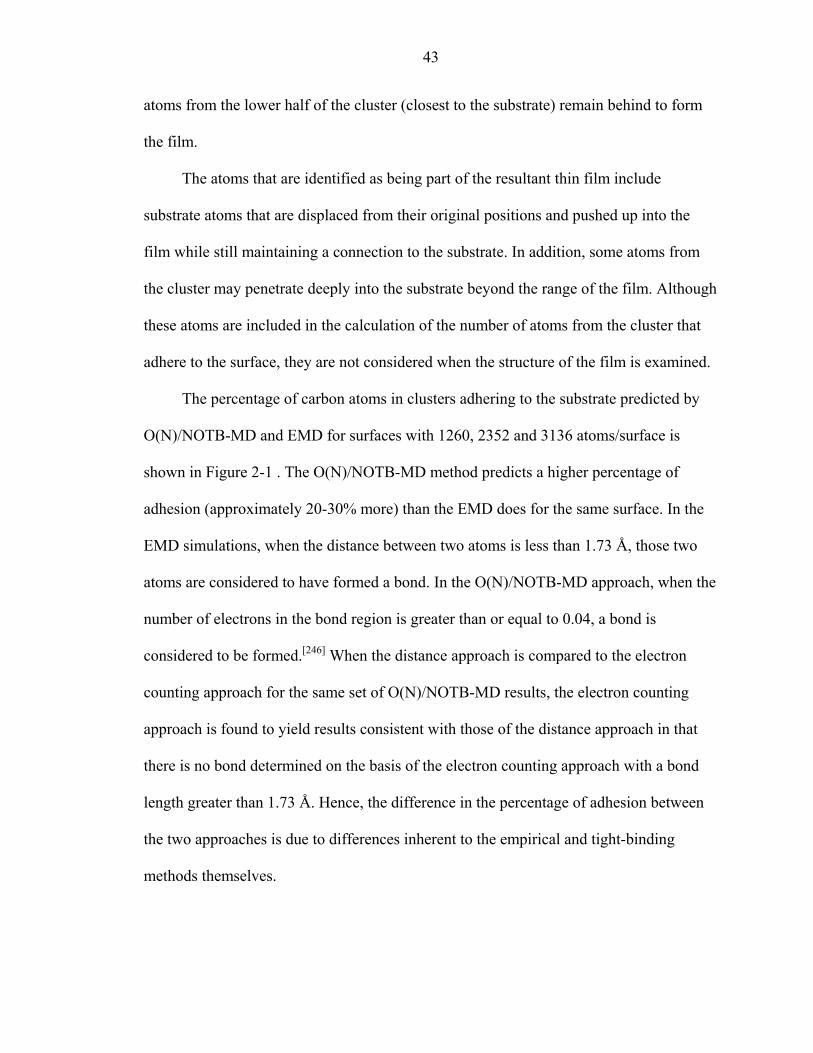
43
atoms from the lower half of the cluster (closest to the substrate) remain behind to form
the film.
The atoms that are identified as being part of the resultant thin film include
substrate atoms that are displaced from their original positions and pushed up into the
film while still maintaining a connection to the substrate. In addition, some atoms from
the cluster may penetrate deeply into the substrate beyond the range of the film. Although
these atoms are included in the calculation of the number of atoms from the cluster that
adhere to the surface, they are not considered when the structure of the film is examined.
The percentage of carbon atoms in clusters adhering to the substrate predicted by
O(N)/NOTB-MD and EMD for surfaces with 1260, 2352 and 3136 atoms/surface is
shown in Figure 2-1 . The O(N)/NOTB-MD method predicts a higher percentage of
adhesion (approximately 20-30% more) than the EMD does for the same surface. In the
EMD simulations, when the distance between two atoms is less than 1.73 Å, those two
atoms are considered to have formed a bond. In the O(N)/NOTB-MD approach, when the
number of electrons in the bond region is greater than or equal to 0.04, a bond is
considered to be formed.[246] When the distance approach is compared to the electron
counting approach for the same set of O(N)/NOTB-MD results, the electron counting
approach is found to yield results consistent with those of the distance approach in that
there is no bond determined on the basis of the electron counting approach with a bond
length greater than 1.73 Å. Hence, the difference in the percentage of adhesion between
the two approaches is due to differences inherent to the empirical and tight-binding
methods themselves.
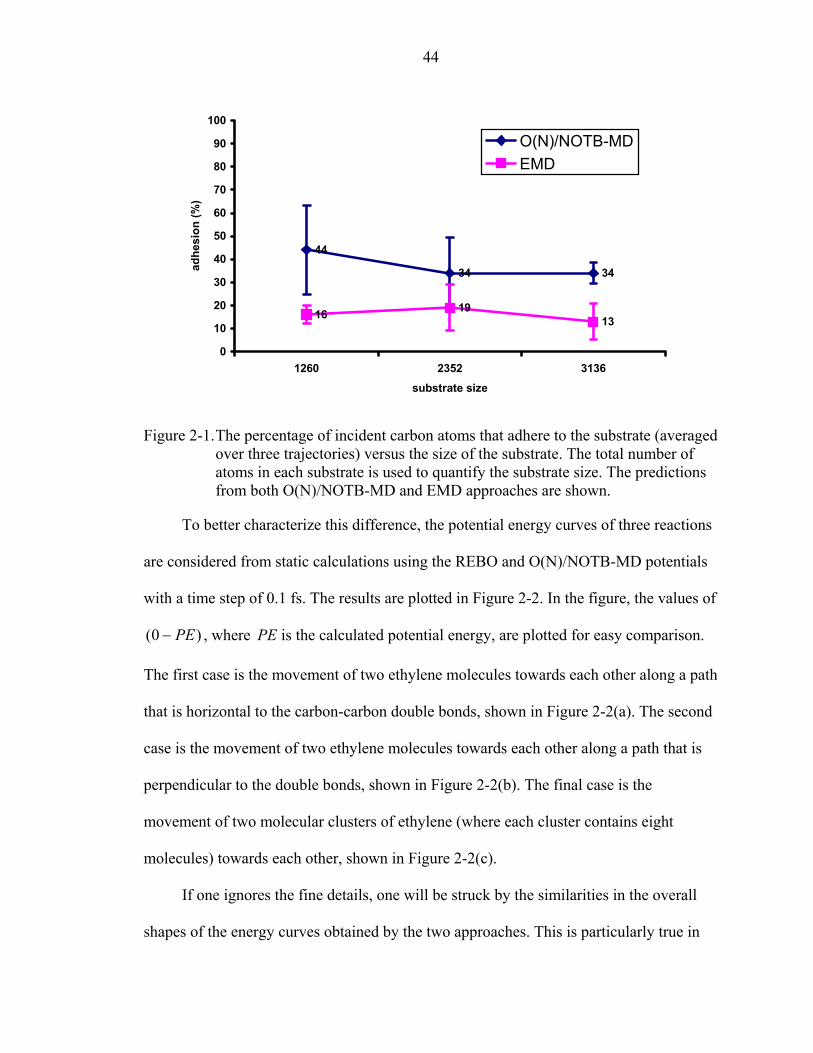
44
Figure 2-1. The percentage of incident carbon atoms that adhere to the substrate (averaged over three trajectories) versus the size of the substrate. The total number of atoms in each substrate is used to quantify the substrate size. The predictions from both O(N)/NOTB-MD and EMD approaches are shown.
To better characterize this difference, the potential energy curves of three reactions
are considered from static calculations using the REBO and O(N)/NOTB-MD potentials
with a time step of 0.1 fs. The results are plotted in Figure 2-2. In the figure, the values of
)0( PE− , where PE is the calculated potential energy, are plotted for easy comparison.
The first case is the movement of two ethylene molecules towards each other along a path
that is horizontal to the carbon-carbon double bonds, shown in Figure 2-2(a). The second
case is the movement of two ethylene molecules towards each other along a path that is
perpendicular to the double bonds, shown in Figure 2-2(b). The final case is the
movement of two molecular clusters of ethylene (where each cluster contains eight
molecules) towards each other, shown in Figure 2-2(c).
If one ignores the fine details, one will be struck by the similarities in the overall
shapes of the energy curves obtained by the two approaches. This is particularly true in
44
34 34
16 1913
0
10
20
30
40
50
60
70
80
90
100
1260 2352 3136
substrate size
adhe
sion
(%)
O(N)/NOTB-MDEMD
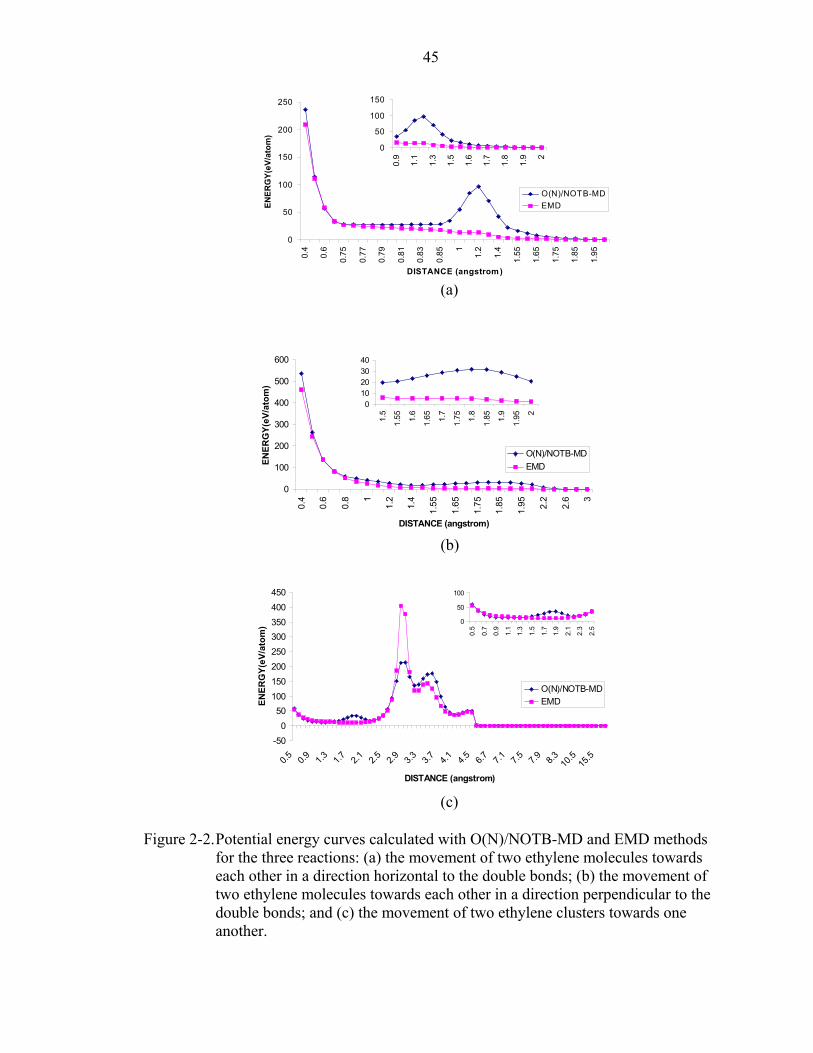
45
Figure 2-2. Potential energy curves calculated with O(N)/NOTB-MD and EMD methods for the three reactions: (a) the movement of two ethylene molecules towards each other in a direction horizontal to the double bonds; (b) the movement of two ethylene molecules towards each other in a direction perpendicular to the double bonds; and (c) the movement of two ethylene clusters towards one another.
(a)
(b)
(c)
0
50
100
150
200
250
0.4
0.6
0.75
0.77
0.79
0.81
0.83
0.85 1
1.2
1.4
1.55
1.65
1.75
1.85
1.95
DISTANCE (angstrom)EN
ERG
Y(eV
/ato
m)
O(N)/NOTB-MDEMD
0
50
100
150
0.9
1.1
1.3
1.5
1.6
1.7
1.8
1.9 2
0
100
200
300
400
500
600
0.4
0.6
0.8 1
1.2
1.4
1.55
1.65
1.75
1.85
1.95 2.2
2.6 3
DISTANCE (angstrom)
ENER
GY(
eV/a
tom
)
O(N)/NOTB-MDEMD
010203040
1.5
1.55 1.
6
1.65 1.
7
1.75 1.
8
1.85 1.
9
1.95 2
-500
50100150200250300350400450
0.5 0.9 1.3 1.7 2.1 2.5 2.9 3.3 3.7 4.1 4.5 6.7 7.1 7.5 7.9 8.3 10.5
15.5
DISTANCE (angstrom)
ENER
GY(
eV/a
tom
)
O(N)/NOTB-MDEMD
0
50
100
0.5
0.7
0.9
1.1
1.3
1.5
1.7
1.9
2.1
2.3
2.5
46
the third case where the energy curves between two molecular clusters of ethylene
obtained by the two methods have remarkably similar shapes. However, there are also
crucial differences between the energy curves obtained by the two methods. From Figure
2-2, it can be seen that, in all three cases, there are regions of separation close to the C-C
bond length where the energy obtained by the NOTB Hamiltonian is less than that
obtained by the REBO potential (see the insert in Figure 2-2(c)). The similarities of the
energy curves obtained by the two methods are indications that the REBO potential has
indeed captured the general characters of carbon-based chemistry. But the differences
show that the NOTB Hamiltonian predicts a more attractive interaction and in general a
lower potential barrier in the region of bond-breaking and bond formation than the REBO
potential. Therefore, the REBO potential may not be sufficiently flexible to describe all
the relevant processes of bond breaking and bond forming in cluster-beam deposition,
thus leading to a lower percentage of adhesion.
As shown in Figure 2-1, when the substrate size changes, both the O(N)/NOTB-
MD and EMD simulations predict that the adhesion percentage is approximately
constant. When 10 trajectories of EMD simulations are averaged for each of the eight
substrates, the results also display little variation in the adhesion percentage with the
changing substrate (see Figure 2-3). The factors contributing to the deviation in the
adhesion percentage include changes in the precise impact sites on the surfaces, thermal
fluctuations, and changes in the elastic collisions among the cluster molecules, in addition
to the effect of the reflected energy from the boundary in the case of the smaller
substrates.
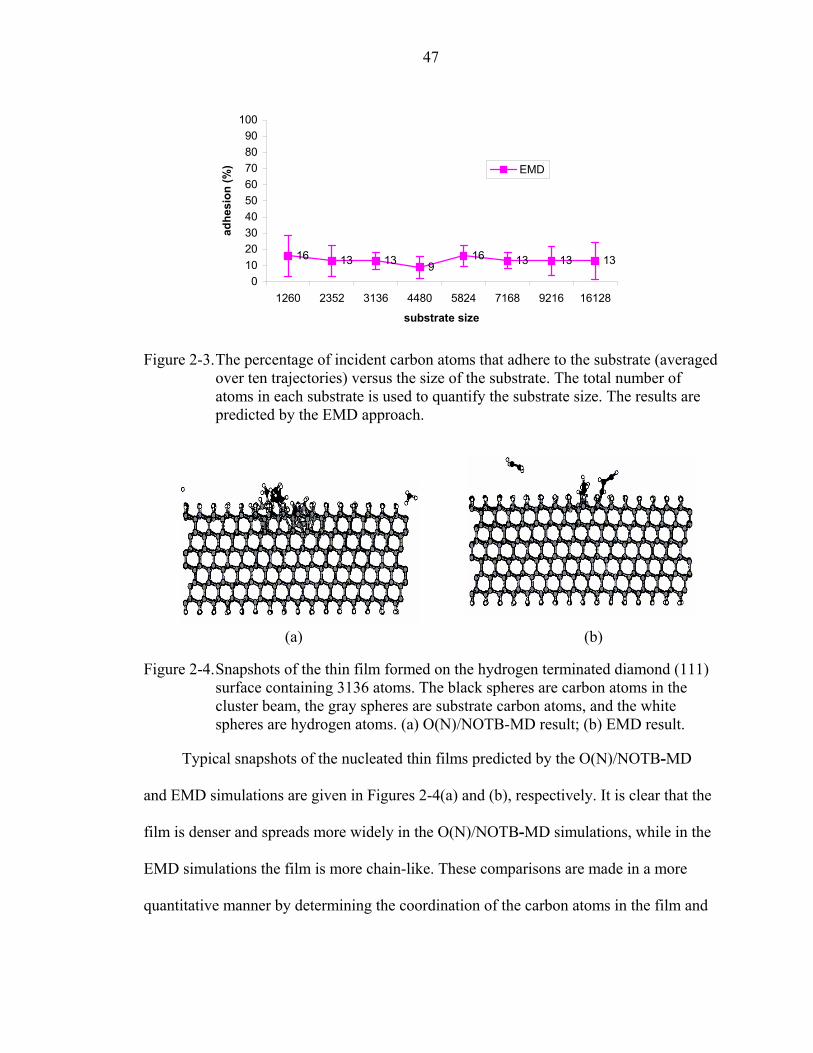
47
Figure 2-3. The percentage of incident carbon atoms that adhere to the substrate (averaged over ten trajectories) versus the size of the substrate. The total number of atoms in each substrate is used to quantify the substrate size. The results are predicted by the EMD approach.
Figure 2-4. Snapshots of the thin film formed on the hydrogen terminated diamond (111) surface containing 3136 atoms. The black spheres are carbon atoms in the cluster beam, the gray spheres are substrate carbon atoms, and the white spheres are hydrogen atoms. (a) O(N)/NOTB-MD result; (b) EMD result.
Typical snapshots of the nucleated thin films predicted by the O(N)/NOTB-MD
and EMD simulations are given in Figures 2-4(a) and (b), respectively. It is clear that the
film is denser and spreads more widely in the O(N)/NOTB-MD simulations, while in the
EMD simulations the film is more chain-like. These comparisons are made in a more
quantitative manner by determining the coordination of the carbon atoms in the film and
16 13 13 916 13 13 13
0102030405060708090
100
1260 2352 3136 4480 5824 7168 9216 16128
substrate size
adhe
sion
(%) EMD
(a) (b)
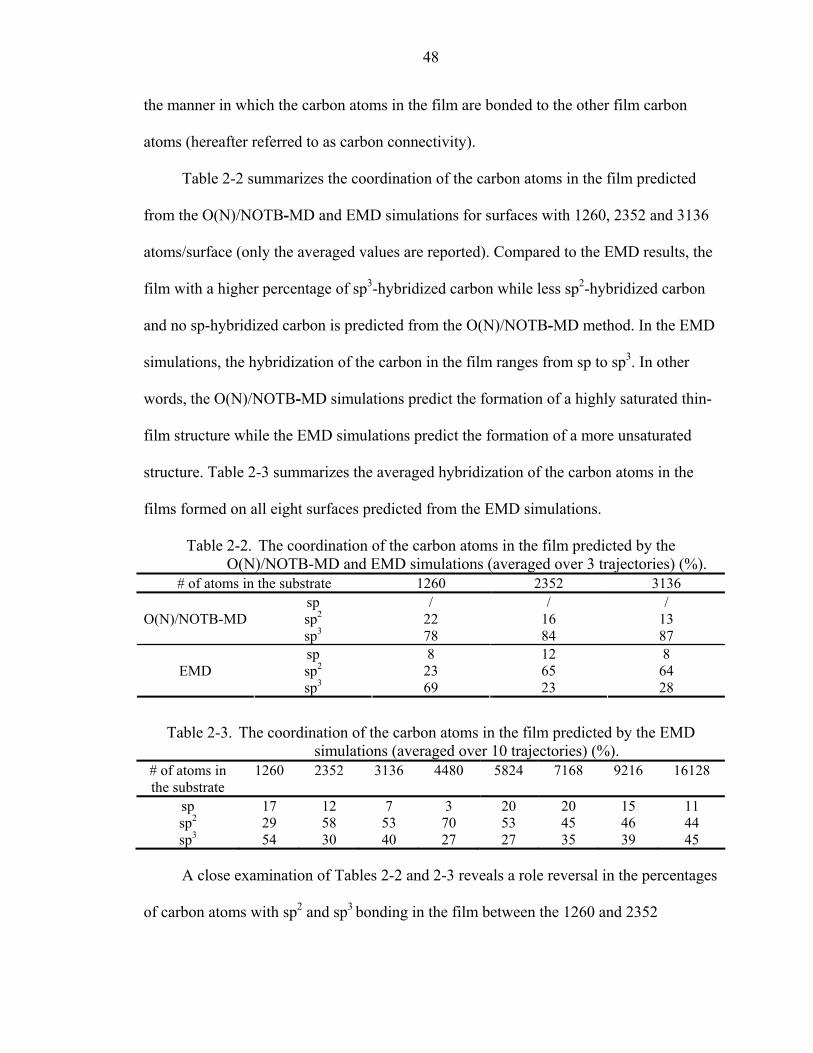
48
the manner in which the carbon atoms in the film are bonded to the other film carbon
atoms (hereafter referred to as carbon connectivity).
Table 2-2 summarizes the coordination of the carbon atoms in the film predicted
from the O(N)/NOTB-MD and EMD simulations for surfaces with 1260, 2352 and 3136
atoms/surface (only the averaged values are reported). Compared to the EMD results, the
film with a higher percentage of sp3-hybridized carbon while less sp2-hybridized carbon
and no sp-hybridized carbon is predicted from the O(N)/NOTB-MD method. In the EMD
simulations, the hybridization of the carbon in the film ranges from sp to sp3. In other
words, the O(N)/NOTB-MD simulations predict the formation of a highly saturated thin-
film structure while the EMD simulations predict the formation of a more unsaturated
structure. Table 2-3 summarizes the averaged hybridization of the carbon atoms in the
films formed on all eight surfaces predicted from the EMD simulations.
Table 2-2. The coordination of the carbon atoms in the film predicted by the O(N)/NOTB-MD and EMD simulations (averaged over 3 trajectories) (%).
# of atoms in the substrate 1260 2352 3136 sp / / / sp2 22 16 13
O(N)/NOTB-MD
sp3 78 84 87 sp 8 12 8 sp2 23 65 64
EMD
sp3 69 23 28
Table 2-3. The coordination of the carbon atoms in the film predicted by the EMD simulations (averaged over 10 trajectories) (%).
# of atoms in the substrate
1260 2352 3136 4480 5824 7168 9216 16128
sp 17 12 7 3 20 20 15 11 sp2 29 58 53 70 53 45 46 44 sp3 54 30 40 27 27 35 39 45
A close examination of Tables 2-2 and 2-3 reveals a role reversal in the percentages
of carbon atoms with sp2 and sp3 bonding in the film between the 1260 and 2352
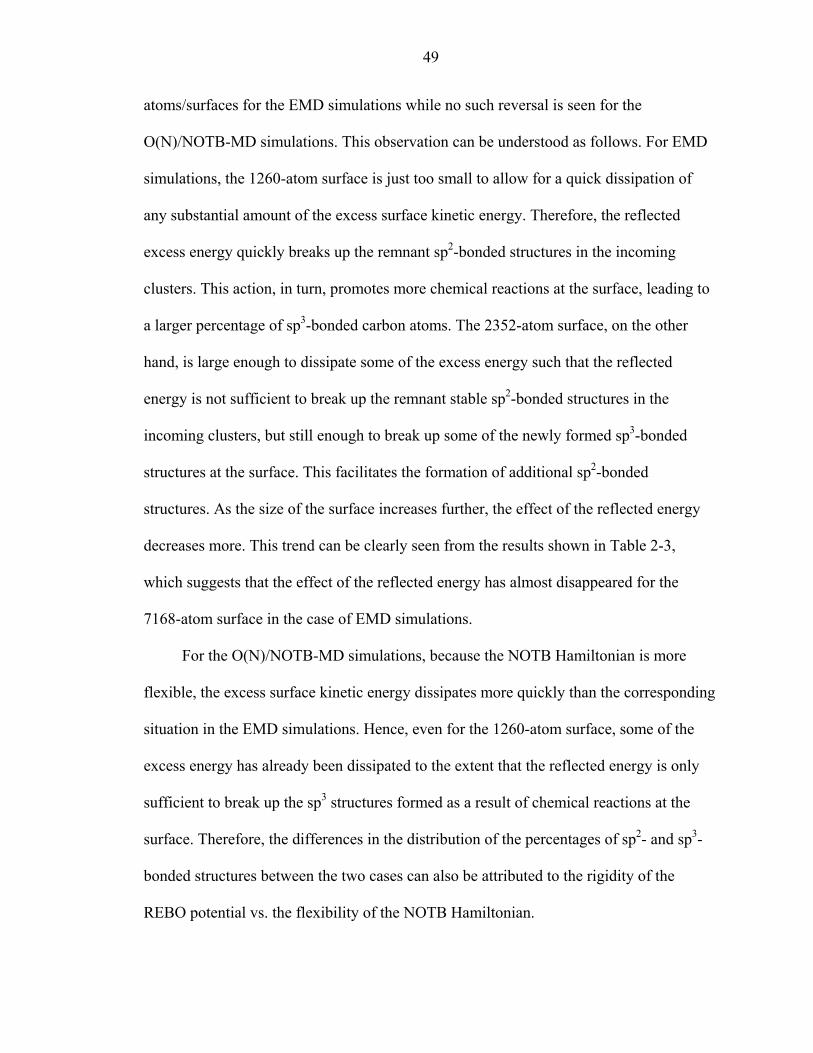
49
atoms/surfaces for the EMD simulations while no such reversal is seen for the
O(N)/NOTB-MD simulations. This observation can be understood as follows. For EMD
simulations, the 1260-atom surface is just too small to allow for a quick dissipation of
any substantial amount of the excess surface kinetic energy. Therefore, the reflected
excess energy quickly breaks up the remnant sp2-bonded structures in the incoming
clusters. This action, in turn, promotes more chemical reactions at the surface, leading to
a larger percentage of sp3-bonded carbon atoms. The 2352-atom surface, on the other
hand, is large enough to dissipate some of the excess energy such that the reflected
energy is not sufficient to break up the remnant stable sp2-bonded structures in the
incoming clusters, but still enough to break up some of the newly formed sp3-bonded
structures at the surface. This facilitates the formation of additional sp2-bonded
structures. As the size of the surface increases further, the effect of the reflected energy
decreases more. This trend can be clearly seen from the results shown in Table 2-3,
which suggests that the effect of the reflected energy has almost disappeared for the
7168-atom surface in the case of EMD simulations.
For the O(N)/NOTB-MD simulations, because the NOTB Hamiltonian is more
flexible, the excess surface kinetic energy dissipates more quickly than the corresponding
situation in the EMD simulations. Hence, even for the 1260-atom surface, some of the
excess energy has already been dissipated to the extent that the reflected energy is only
sufficient to break up the sp3 structures formed as a result of chemical reactions at the
surface. Therefore, the differences in the distribution of the percentages of sp2- and sp3-
bonded structures between the two cases can also be attributed to the rigidity of the
REBO potential vs. the flexibility of the NOTB Hamiltonian.

50
The carbon connectivity within the nucleated films predicted by the O(N)/NOTB-
MD and EMD simulations for surfaces with 1260, 2352 and 3136 atoms/surface is shown
in Table 2-4 (only the averages are given). In the table, C1 stands for the percentage of
carbon atoms connected to one other carbon atom, C2 stands for the percentage of carbon
atoms connected to two other carbon atoms, and so on. Therefore, the summation of C1
and C2 indicates the percentage of carbon atoms bonded in a linear structure, while C3
and C4 indicate the percentage of carbon atoms connected in the branched and networked
structure, respectively. For each surface, the carbon connectivity within the film predicted
by O(N)/NOTB-MD is different from what is predicted by the EMD simulations. In
general, O(N)/NOTB-MD predicts more branched or networked structures and less linear
structure than the EMD simulations. When both the coordination and the carbon
connectivity of the film carbon atoms are considered, the O(N)/NOTB-MD method is
found to predict the formation of a more diamond-like thin film while the EMD
simulations predict a more linear unsaturated polymer-like thin film.
Table 2-4. The carbon connectivity of the carbon atoms in the film predicted by O(N)/NOTB-MD and EMD simulations (averaged over 3 trajectories) (%).
# of atoms in the surface 1260 2352 3136 C1 30 29 42 C2 46 37 29 C3 22 34 25
O(N)/NOTB-
MD C4 2 / 4 C1 49 30 46 C2 37 65 54
EMD
C3 14 5 /
2.5 Conclusions
The simulation results for ethylene molecular cluster deposition predicted by
O(N)/NOTB-MD and EMD using REBO potential are compared. The results of these
two methods do not agree perfectly well with each other, especially the quantitative

51
predictions. For instance, the structures of the resultant thin films are significantly
different from one another. Nevertheless, the qualitative predictions are comparable. For
example, both methods predict thin-film nucleation through rapid chemical reactions and
most of the atoms in the nucleated thin film are from those incident clusters closest to the
substrate.
This comparison study shows that the REBO potential has indeed captured the
general characters of carbon-based chemistry. However, the differences in the predictions
from the two methods indicate that as compared to the NOTB Hamiltonian, the REBO
potential is more rigid, and hence may not be sufficiently flexible to describe all the
relevant processes of bond breaking and bond forming. A key point is that NOTB
Hamiltonian predicts a more attractive interaction and in general a lower repulsive barrier
than the REBO potential. These results and conclusions appear in Reference [247].[247]
In modeling thin film deposition of amorphous carbons, Jäger and Albe observed
that the REBO potential predicted a structure with lower sp3 content than the
experimental results. But when the cutoff distance (2 Å for C-C interactions in REBO
potential) was slightly increased, a structure with realistic density and sp3 content could
be produced.[236] The study of H-atom association with diamond surfaces by Hase and co-
workers also pointed out that, the major reason of the quantitative inaccuracy of REBO
potential was the potential’s shorter range. But, within the REBO potential cutoff, the
predicted results agree very well with the ab initio calculations.[235] Therefore, in the case
of energetic collisions, if the incident energy is high enough to bring the particles into
close contact (well within the potential cutoff) prior to any reaction, the predictions from
the REBO potential should be reliable.
52
In this dissertation, the incident energies used in the following simulations of
organic molecular cluster beam deposition and polyatomic ion beam depositions are
much higher. The REBO potential’s shorter range is thus not of significant concern. In
addition, the systems considered contain more than 10,000 atoms. Although
O(N)/NOTB-MD is a more accurate method, it is more computationally expensive than
the EMD method for a surface of a given size. It is practically impossible for a simulation
of a system that consists of more than 10,000 atoms by using the NOTB method within a
reasonable period of time. Empirical potential is necessary to study the collective
phenomena of many atoms or for long times at an atomic scale. Therefore, the second
generation REBO potential is used in the following simulations to consider the short-
ranged interatomic interactions, and the predictions are believed to be at least
qualitatively accurate.

53
CHAPTER 3 TEMPERATURE CONTROL METHODS
Energetic particle deposition is a process that involves a flux of energy into or out
of a system. In addition, complex and rapid chemical reactions may occur between the
incident particles and the substrate atoms, which lead to big changes in the system
energy. These energy changes are reflected in variations in system temperature.
Experimentally, particle deposition is usually carried out at specific temperatures to
obtain the desired properties. Furthermore, macroscopic substrates dissipate the excess
energy from the deposition process through, for example, lattice vibrations through the
extended lattice.
To model such processes atomistically, molecular dynamics simulations can be
performed in a canonical ensemble, where the number of particles, temperature, and
volume are held constant. Periodic boundary conditions are often used in these
simulations to mimic an infinite or semi-infinite system with just a few thousand atoms
and to keep the volume constant. Sometimes, certain amounts of boundary atoms need to
be fixed to keep the structure of the simulation system from reconstructing. However,
these boundary conditions can result in the nonphysical reflection of energy from the
boundary, which will then produce spurious effects on the simulation results. Therefore,
the simulations make use of methods that can allow some atoms to effectively absorb all
the extra energy pumped into a system (including any reflected energy) and thus
successfully control the system temperature in a physically reasonable manner.
Simulations that implement these methods are called constant temperature simulations.[2]

54
Temperature is a thermodynamic quantity. For a system containing N particles, the
temperature can be related to the average kinetic energy ( K ) of the system through the
principle of equipartition of energy, which states that every degree of freedom has an
average energy of 2TkB associated with it.[248] That is,
221 2 TkN
mK BfN
ii == ∑ v (3-1)
where fN is the number of degrees of freedom, Bk is the Boltzmann constant, and T is
the thermodynamic temperature. Similarly, the instantaneous kinetic temperature can be
defined as
Bfins kN
KT 2= (3-2)
The average of the instantaneous kinetic temperature is equal to the thermodynamic
temperature.
Since the temperature is related to the kinetic energy, in order to control the
temperature, the velocities of the particles in the simulation system must be adjusted. One
way to do this is to directly rescale the velocity of each particle, as shown in Equation (3-
3):
insold
new
TT
=
2
vv (3-3)
where newv is the rescaled velocity, and oldv is the velocity before the rescaling.
Although this method, called the velocity rescaling method, is very simple and adds (or
subtracts) energy to (or from) the system efficiently, it is important to recognize that it
actually keeps the kinetic energy constant, which is not equivalent to the condition of
55
constant temperature. At thermal equilibrium, both kinetic energy (instantaneous kinetic
temperature) and potential energy fluctuate. Therefore, the direct velocity rescaling
method is somewhat coarse and far removed from the way energy is actually dissipated.[2]
Better and more realistic constant temperature schemes have been proposed.
Among these schemes, the generalized Langevin equation (GLEQ) approach,[249]
Berendsen method,[245] and Nosé-Hoover thermostat[250-253] are the most widely used. In
all these schemes, the velocities of the particles are adjusted to maintain the system
temperature at a constant value.
Simulation systems generally consist of an impact zone, where atoms move only in
response to normal Newtonian dynamics, that is embedded in a thermostat zone, where
the velocities of the atoms are modified using the temperature control schemes. The
thermostat zone not only acts as a heat reservoir but is also used as a cushion to absorb
any reflected energy waves.
In this study, both the GLEQ approach and the Berendsen method are used in the
thermostat zone in constant temperature MD simulations of cluster deposition on
surfaces. A variation of the regular GLEQ approach and a combined thermostat of the
GLEQ and Berendsen methods are also tested. The goal of this work is to determine
which thermostat method is the best for use in MD simulations of energetic particle
deposition on surfaces to realistically control the temperature and reduce the amplitude of
reflected waves from the boundaries of the simulation unit cell edges.
3.1 Methods of Interest
3.1.1 Generalized Langevin Equation (GLEQ) Approach
The generalized Langevin equation (GLEQ) approach proposed by Adelman and
Doll[249] is developed from generalized Brownian motion theory. It models solid lattices
56
at finite temperature using the methods of stochastic theory. In this approach, the
molecular system of interest can be thought of as being embedded in a “solvent” that
imposes the desired temperature; the molecules are regarded as solutes. The solvent
affects the solute through the addition of two terms to the normal Newtonian equation of
motion: one is the frictional force and the other is the random force.
The frictional force takes account of the frictional drag from the solvent as the
solute moves. Since friction opposes motion, this force is usually taken to be proportional
to the velocity of the particle but of opposite sign:
)()( ttfriction vF β−= (3-4)
The proportionality constant, β, is called the friction constant. Using the Debye solid
model, β can be simply expressed as
Dπωβ61
= (3-5)
where Dω is the Debye frequency. The Debye frequency is related to the experimentally
measurable Debye temperature DT by
hDB
DTk
=ω (3-6)
The random collisions between the solute and the solvent is controlled by the
random force, R(t). This random force is assumed to have no relation to the particle
velocity and position, and is often taken to follow a Gaussian distribution with a zero
mean and a variance 2σ given by[217]
tTkm B
∆=
βσ 22 (3-7)
57
where T is the desired temperature, and t∆ is the time step. This random force is balanced
with the frictional force to maintain the temperature.[217]
Therefore, the equation of motion for a “solute” particle is
)()()()( ttttm RvFa +−= β (3-8)
which is called the Langevin equation of motion. Following the Langevin equation of
motion instead of Newton’s second law, the velocity of the system particle is thus
gradually modified to bring the instantaneous kinetic temperature closer to the desired
temperature. The GLEQ approach is a proportional control algorithm that changes the
temperature exponentially as a function of β and the initial conditions.[254] This approach
often gives a good representation of energy relaxation in surface scattering
simulations.[249] It also satisfactorily describes heat dissipation at boundaries and has been
found to be best suited for thin film deposition processes.[254]
In practice, some other expressions for the frictional force and random force can be
selected to better describe the physical condition of the system.[254] However, the
expressions mentioned above are the simplest, and hence, the most computationally
efficient. In simulations where the thermostat zone is far away form the zone of interest,
the results using these expressions have proven to be reliable.[217] In this study, the GLEQ
approach using the expressions described above for the frictional force and random force
is chosen to control the simulation temperature.
3.1.2 Berendsen Method
Before the introduction of the Berendsen method, it is worthwhile to first mention
the Andersen method. The Anderson method of temperature control was proposed in
1980.[255] This method can be thought of as a system that is coupled to a thermal bath

58
held at the desired temperature. The coupling is simulated by random “collisions” of
system particles with thermal bath particles. After each collision, the velocity of the
randomly chosen system particle is reset to a new value that is randomly drawn from the
Maxwell-Boltzmann distribution corresponding to the desired temperature. In practice,
the frequency of random collisions is usually chosen such that the decay rate of energy
fluctuations in the simulation is comparable to that in a system of the same size
embedded in an infinite thermal bath. This method is simple and consistent with a
canonical ensemble, but it introduces drastic change to the system dynamics. It is
therefore not appropriate to use the Andersen method to study dynamical properties
although it is appropriate to study static properties such as density or pressure.[2]
A more practical approach is the Berendsen method.[245] Just as in the Anderson
method, the system is coupled to an imaginary external thermal bath held at a fixed
temperature T. However, the exchange of thermal energy between the system and the
thermal bath is much gentler. Instead of drastically resetting the velocity of the particle to
a new value, the velocity of the particle is gradually scaled by multiplying it by a factor λ
given by
21
)1(1
−
∆+=
insT TTt
τλ (3-9)
where t∆ is the time step, and Tτ is the time constant of the coupling. In this way, the
velocities of the particles are adjusted such that the instantaneous kinetic temperature insT
approaches the desired temperature T.
The strength of the coupling between the system and the thermal bath can be
controlled by using an appropriate coupling time constant. If a quick temperature control
59
is desired, a small coupling time constant can be chosen. Consequently, the value of λ
will be big and the change of the velocity will be drastic. On the other hand, if a weak
coupling is needed to minimize the disturbance of the system, a large value can be
assigned to the coupling time constant. In the evaluation of their own method,[245]
Berendsen et al. concluded that static average properties were not significantly affected
by the coupling time constant, but the dynamic properties were strongly dependent on the
choice of the coupling time constant. Their testing showed that reliable dynamic
properties could be derived if the coupling time constant was above 0.1 ps.
The Berendsen method is very flexible in that the coupling time constant can easily
be varied to suit the needs of a given application. The biggest advantage of the Berendsen
method over the Anderson method is that it gently modifies the velocities, and therefore,
the change of the system dynamics is not so dramatic. However, caution must be taken
when using the Berendsen method because it does not rigorously reproduce the canonical
ensemble, and thus the distribution generated from this method is wrong although the
averages are usually correct.
The Berendsen method implemented in our simulations is the one used by our
collaborators at the University of Louisville. Based on their simulation experience, the
ratio of T
tτ
∆ in Equation (3-9) is set to be 0.1 because it gives the best compromise
between ideal temperature control and disturbance of the physical behavior of the system.
3.1.3 Variation of GLEQ Approach and a Combined Thermostat of GLEQ Approach and Berendsen Method
In their MD simulations of energetic particle beam deposition, Haberland et al.
claimed that the regular GLEQ approach was not good enough to reduce the artificial
effects caused by the reflected waves from the boundary of the simulation box.[256] Their
60
system contained heavy clusters of more than 500 metal atoms per cluster, and the
incident energy was typically in the keV range.[42, 64, 73, 256-258] They suggested an
improved method in which the original thermostat atoms were replaced by fewer, heavier
atoms.[256] This allows one to choose a large thermostat zone without losing
computational efficiency. Therefore, the backscattering of the elastic wave could be
sufficiently delayed. In addition, the atoms at the boundary of the impact zone and the
replacing thermostat zone are damped relative to the motion of their neighbors. This is an
efficient damping mechanism, especially for the high frequency part of the reflected
wave.[256] However, the replacing thermostat lattice should have the same elastic
properties as the bulk and match the lattice structure of the impact zone. This is relatively
easy to achieve for FCC materials but nontrivial for materials with other lattice structures.
Although Haberland’s modified GLEQ approach is presently restricted to FCC
materials, it works well at damping the motion and energy of the atoms at the boundary
between the impact zone and the thermostat zone. This improvement can be readily
included in the conventional GLEQ approach. In this study, a modified GLEQ approach,
called the MGLEQ method, that includes extra damping for those boundary atoms and is
applicable to systems of any crystal structure, is discussed. It is also rigorously tested to
assess its effectiveness to both control the system temperature and reduce the amplitude
of reflected energy waves.
Comparing the GLEQ approach with the Berendsen method, the GLEQ approach
makes more physical sense and modifies atomic velocities more gently. Nevertheless, the
GLEQ approach involves extra calculations of forces; therefore it is slightly more
complicated and time-consuming than the Berendsen method. In this work, a combined
61
thermostat scheme of the GLEQ approach and the Berendsen method (hereafter denoted
as BnG) is applied to the thermostat atoms as well. The combination is realized by
dividing the original thermostat zone into two smaller zones: the one that directly borders
the impact zone has the GLEQ scheme applied to it while the other has the Berensen
scheme applied to it. Testing is done to assess whether this combined method combines
the advantages of these two methods.
3.2 Testing Systems
The deposition of a single C20 molecule on a hydrogen-terminated diamond (111)
substrate at room temperature (300 K) is considered as a test of these four thermostat
schemes. The initial distance between the depositing carbon cluster and the substrate is
around 4 Å and the C20 is deposited along the surface normal. The substrate contains an
impact zone of atoms that is 2.4 nm × 2.4 nm × 1.0 nm. This impact zone is embedded in
a thermostat zone of atoms with four walls that are 1.0 nm thick and a bottom layer that is
1.6 nm deep, as schematically illustrated in Figure 3-1. The dimensions of the whole
substrate are therefore 3.4 nm × 3.4 nm × 2.6 nm. The number of atoms contained in the
impact zone and the thermostat zone is 1,280 and 4,320, respectively. The bottom
hydrogen layer is fixed to keep the substrate from reconstructing or moving.
Various incident energies (1 eV/atom, 5 eV/atom, 10 eV/atom, 20 eV/atom and 40
eV/atom) are considered. The REBO potential[211] coupled with long-range Lennard-
Jones (LJ) potentials[2] is used to calculate the interatomic forces for the atoms in the
cluster and in the impact zone. These atoms are denoted as active atoms. The velocities of
the atoms in the thermostat zone are modified using the four temperature control schemes
described in Section 3.1 to adjust the energy flow within the system. These atoms are
therefore called thermostat atoms.
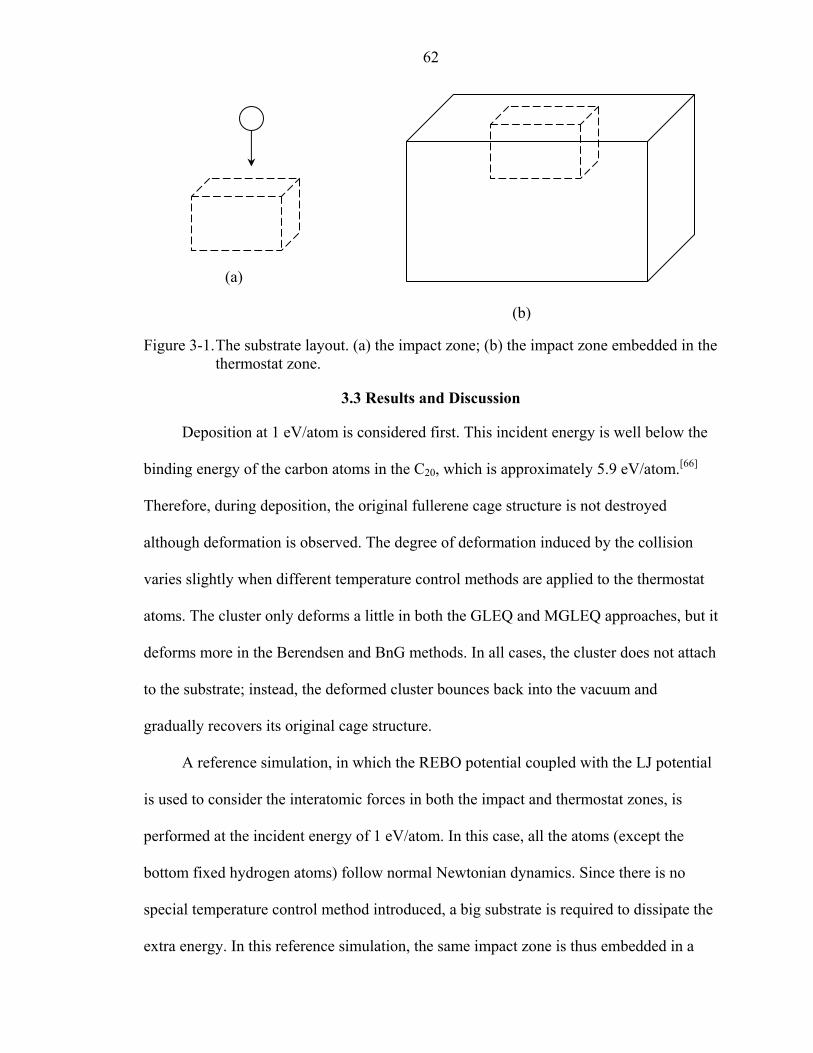
62
Figure 3-1. The substrate layout. (a) the impact zone; (b) the impact zone embedded in the thermostat zone.
3.3 Results and Discussion
Deposition at 1 eV/atom is considered first. This incident energy is well below the
binding energy of the carbon atoms in the C20, which is approximately 5.9 eV/atom.[66]
Therefore, during deposition, the original fullerene cage structure is not destroyed
although deformation is observed. The degree of deformation induced by the collision
varies slightly when different temperature control methods are applied to the thermostat
atoms. The cluster only deforms a little in both the GLEQ and MGLEQ approaches, but it
deforms more in the Berendsen and BnG methods. In all cases, the cluster does not attach
to the substrate; instead, the deformed cluster bounces back into the vacuum and
gradually recovers its original cage structure.
A reference simulation, in which the REBO potential coupled with the LJ potential
is used to consider the interatomic forces in both the impact and thermostat zones, is
performed at the incident energy of 1 eV/atom. In this case, all the atoms (except the
bottom fixed hydrogen atoms) follow normal Newtonian dynamics. Since there is no
special temperature control method introduced, a big substrate is required to dissipate the
extra energy. In this reference simulation, the same impact zone is thus embedded in a
(b)
(a)
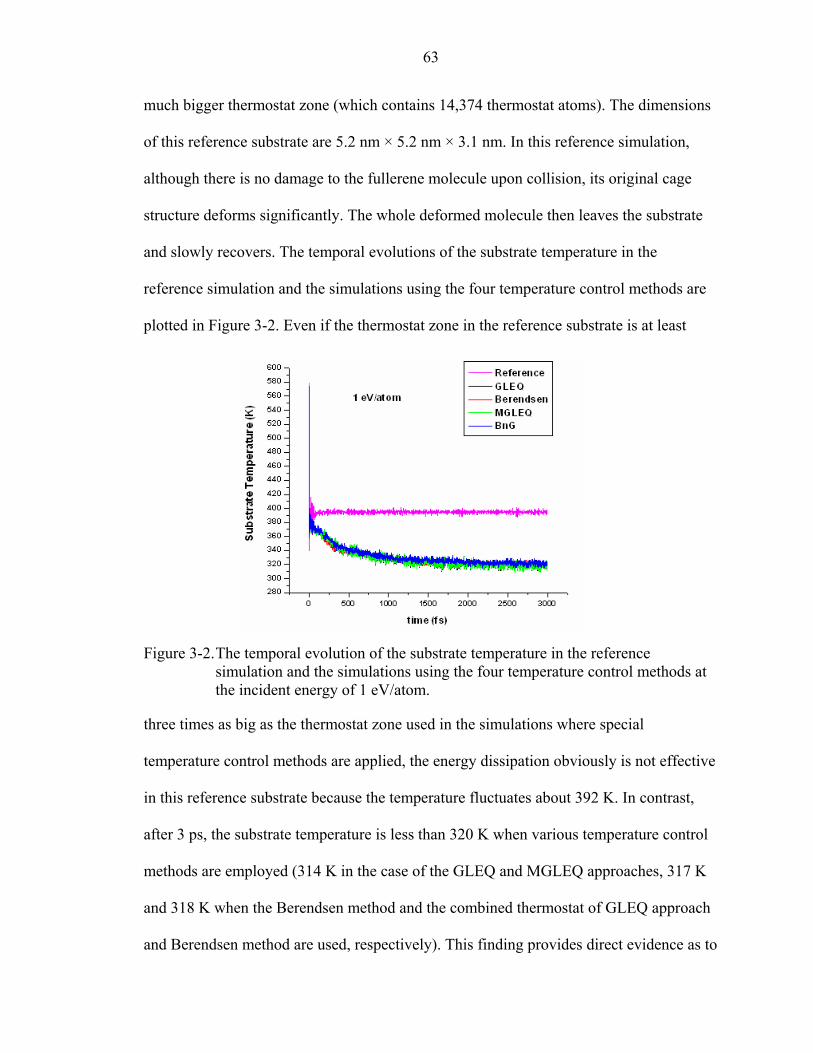
63
much bigger thermostat zone (which contains 14,374 thermostat atoms). The dimensions
of this reference substrate are 5.2 nm × 5.2 nm × 3.1 nm. In this reference simulation,
although there is no damage to the fullerene molecule upon collision, its original cage
structure deforms significantly. The whole deformed molecule then leaves the substrate
and slowly recovers. The temporal evolutions of the substrate temperature in the
reference simulation and the simulations using the four temperature control methods are
plotted in Figure 3-2. Even if the thermostat zone in the reference substrate is at least
Figure 3-2. The temporal evolution of the substrate temperature in the reference simulation and the simulations using the four temperature control methods at the incident energy of 1 eV/atom.
three times as big as the thermostat zone used in the simulations where special
temperature control methods are applied, the energy dissipation obviously is not effective
in this reference substrate because the temperature fluctuates about 392 K. In contrast,
after 3 ps, the substrate temperature is less than 320 K when various temperature control
methods are employed (314 K in the case of the GLEQ and MGLEQ approaches, 317 K
and 318 K when the Berendsen method and the combined thermostat of GLEQ approach
and Berendsen method are used, respectively). This finding provides direct evidence as to
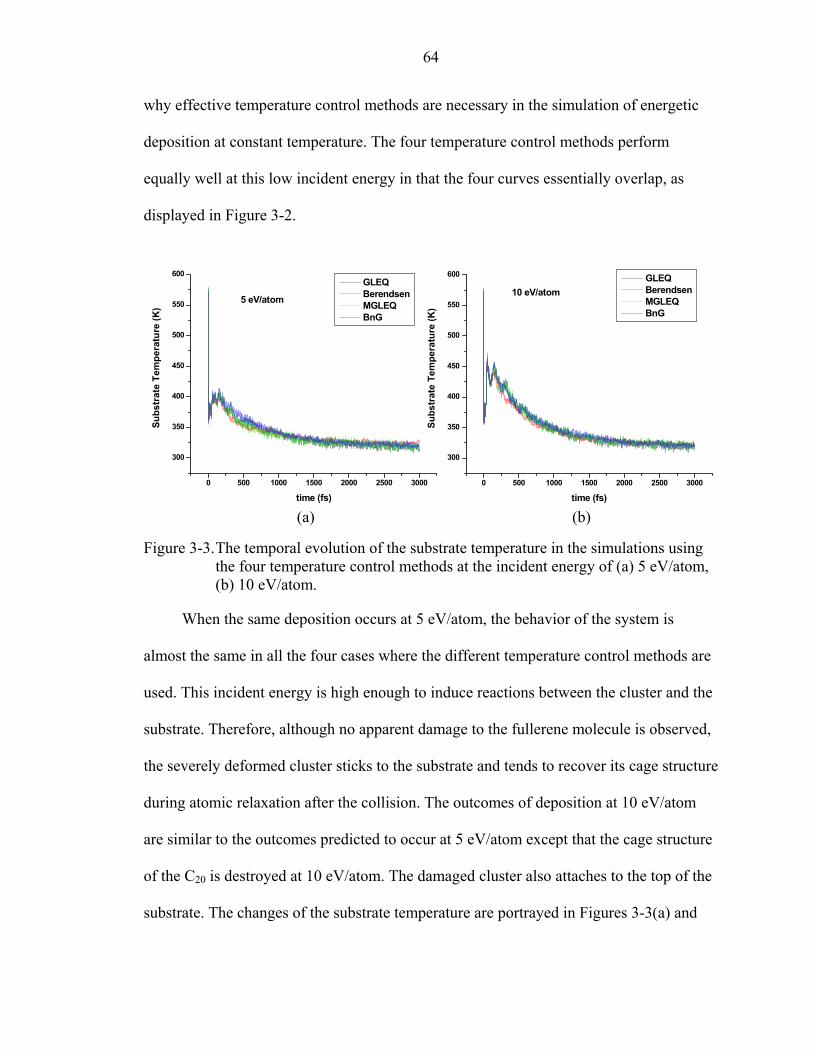
64
why effective temperature control methods are necessary in the simulation of energetic
deposition at constant temperature. The four temperature control methods perform
equally well at this low incident energy in that the four curves essentially overlap, as
displayed in Figure 3-2.
Figure 3-3. The temporal evolution of the substrate temperature in the simulations using the four temperature control methods at the incident energy of (a) 5 eV/atom, (b) 10 eV/atom.
When the same deposition occurs at 5 eV/atom, the behavior of the system is
almost the same in all the four cases where the different temperature control methods are
used. This incident energy is high enough to induce reactions between the cluster and the
substrate. Therefore, although no apparent damage to the fullerene molecule is observed,
the severely deformed cluster sticks to the substrate and tends to recover its cage structure
during atomic relaxation after the collision. The outcomes of deposition at 10 eV/atom
are similar to the outcomes predicted to occur at 5 eV/atom except that the cage structure
of the C20 is destroyed at 10 eV/atom. The damaged cluster also attaches to the top of the
substrate. The changes of the substrate temperature are portrayed in Figures 3-3(a) and
0 500 1000 1500 2000 2500 3000
300
350
400
450
500
550
600
Subs
trat
e Te
mpe
ratu
re (K
)
time (fs)
GLEQ Berendsen MGLEQ BnG
5 eV/atom
0 500 1000 1500 2000 2500 3000
300
350
400
450
500
550
600
Subs
trat
e Te
mpe
ratu
re (K
)
time (fs)
GLEQ Berendsen MGLEQ BnG
10 eV/atom
(a) (b)
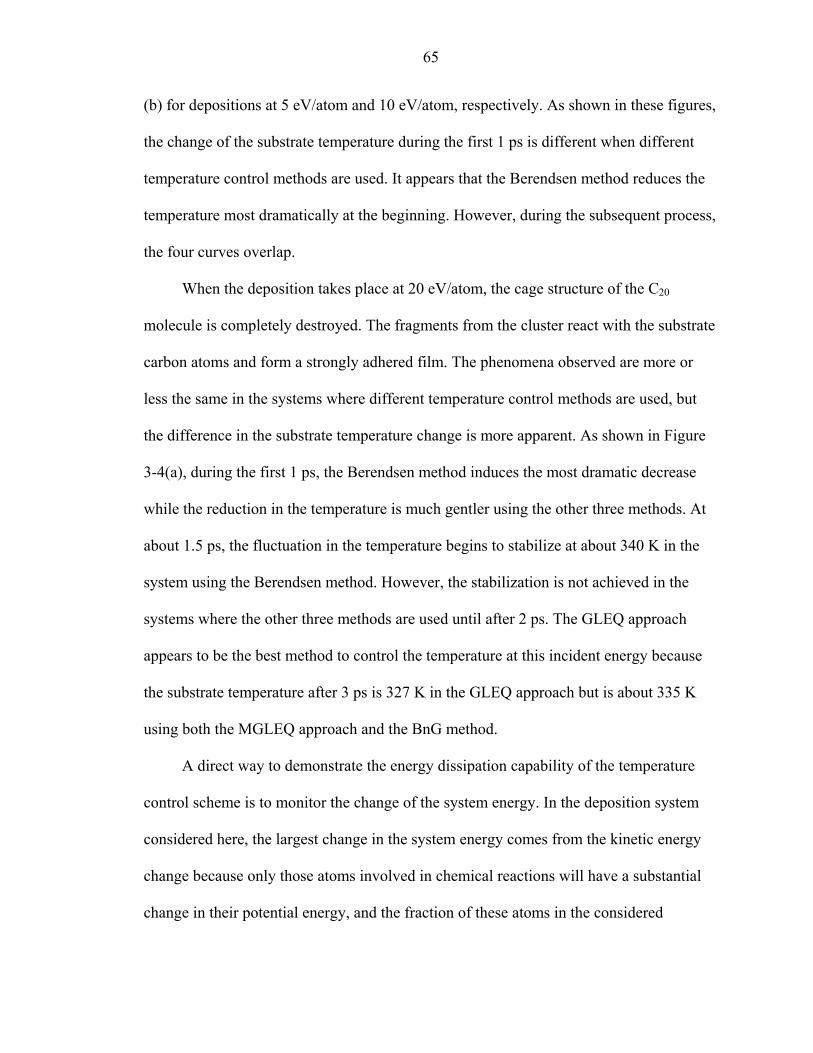
65
(b) for depositions at 5 eV/atom and 10 eV/atom, respectively. As shown in these figures,
the change of the substrate temperature during the first 1 ps is different when different
temperature control methods are used. It appears that the Berendsen method reduces the
temperature most dramatically at the beginning. However, during the subsequent process,
the four curves overlap.
When the deposition takes place at 20 eV/atom, the cage structure of the C20
molecule is completely destroyed. The fragments from the cluster react with the substrate
carbon atoms and form a strongly adhered film. The phenomena observed are more or
less the same in the systems where different temperature control methods are used, but
the difference in the substrate temperature change is more apparent. As shown in Figure
3-4(a), during the first 1 ps, the Berendsen method induces the most dramatic decrease
while the reduction in the temperature is much gentler using the other three methods. At
about 1.5 ps, the fluctuation in the temperature begins to stabilize at about 340 K in the
system using the Berendsen method. However, the stabilization is not achieved in the
systems where the other three methods are used until after 2 ps. The GLEQ approach
appears to be the best method to control the temperature at this incident energy because
the substrate temperature after 3 ps is 327 K in the GLEQ approach but is about 335 K
using both the MGLEQ approach and the BnG method.
A direct way to demonstrate the energy dissipation capability of the temperature
control scheme is to monitor the change of the system energy. In the deposition system
considered here, the largest change in the system energy comes from the kinetic energy
change because only those atoms involved in chemical reactions will have a substantial
change in their potential energy, and the fraction of these atoms in the considered
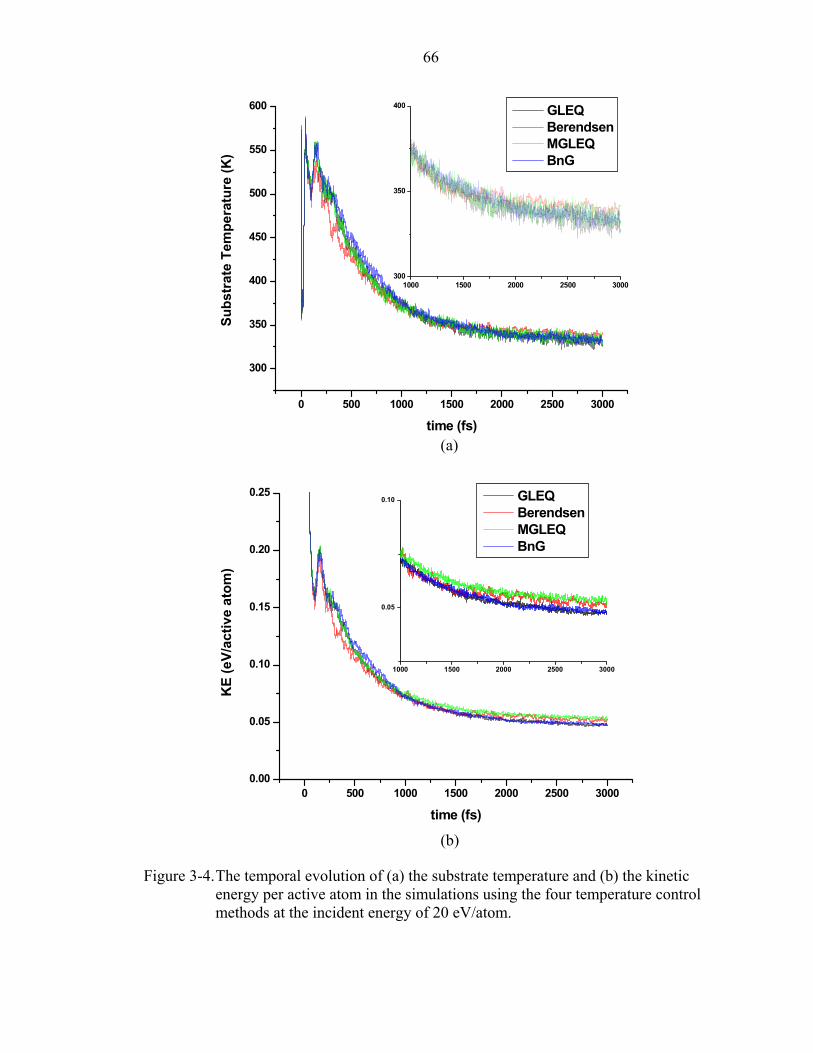
66
Figure 3-4. The temporal evolution of (a) the substrate temperature and (b) the kinetic energy per active atom in the simulations using the four temperature control methods at the incident energy of 20 eV/atom.
0 500 1000 1500 2000 2500 30000.00
0.05
0.10
0.15
0.20
0.25
1000 1500 2000 2500 3000
0.05
0.10
KE
(eV/
activ
e at
om)
time (fs)
GLEQ Berendsen MGLEQ BnG
(a)
(b)
0 500 1000 1500 2000 2500 3000
300
350
400
450
500
550
600
1000 1500 2000 2500 3000300
350
400
Subs
trat
e Te
mpe
ratu
re (K
)
time (fs)
GLEQ Berendsen MGLEQ BnG
67
deposition system is very small. Therefore, the change of the kinetic energy can represent
the change of the whole system energy. Figure 3-4(b) gives the temporal variations of the
kinetic energy per active atom for deposition at an incident energy of 20 eV/atom. This
figure better separates the four curves corresponding to each temperature control method
than the temporal evolution of the substrate temperature. As clearly shown in Figure 3-
4(b), before the relaxation starts (at about 1 ps), the Berendsen method dissipates the
extra energy most quickly, and the combined thermostat of the GLEQ approach and the
Berendsen method dissipates the energy most slowly. The curves generated from the
GLEQ and MGLEQ approaches overlap at this early stage. However, at the relaxation
stage, the curve of the GLEQ approach begins to separate from the curve of the MGLEQ
approach. Apparently, the MGLEQ approach does not reduce the energy as much as the
GLEQ approach under this deposition condition. While the average kinetic energy
fluctuates about 0.06 eV/atom in the Berendsen method after 1.5 ps, this quantity
continues to drop in both the GLEQ approach and BnG method. At 3 ps when the
simulation stops, the GLEQ approach and the combined thermostat appear to have
performed the best at removing the excess energy in the system.
Although the GLEQ approach is the best among the four methods for energy
dissipation and temperature control at 20 eV/atom, it becomes the worst at a higher
incident energy of 40 eV/atom. As demonstrated in Figure 3-5, both the final substrate
temperature and the average kinetic energy per active atom are the highest in the system
where the GLEQ approach is used. The performance of the Berendsen method is not
satisfactory either. The best method in this case is the combined thermostat of the GLEQ
approach and the Berendsen method, which results in the lowest substrate temperature
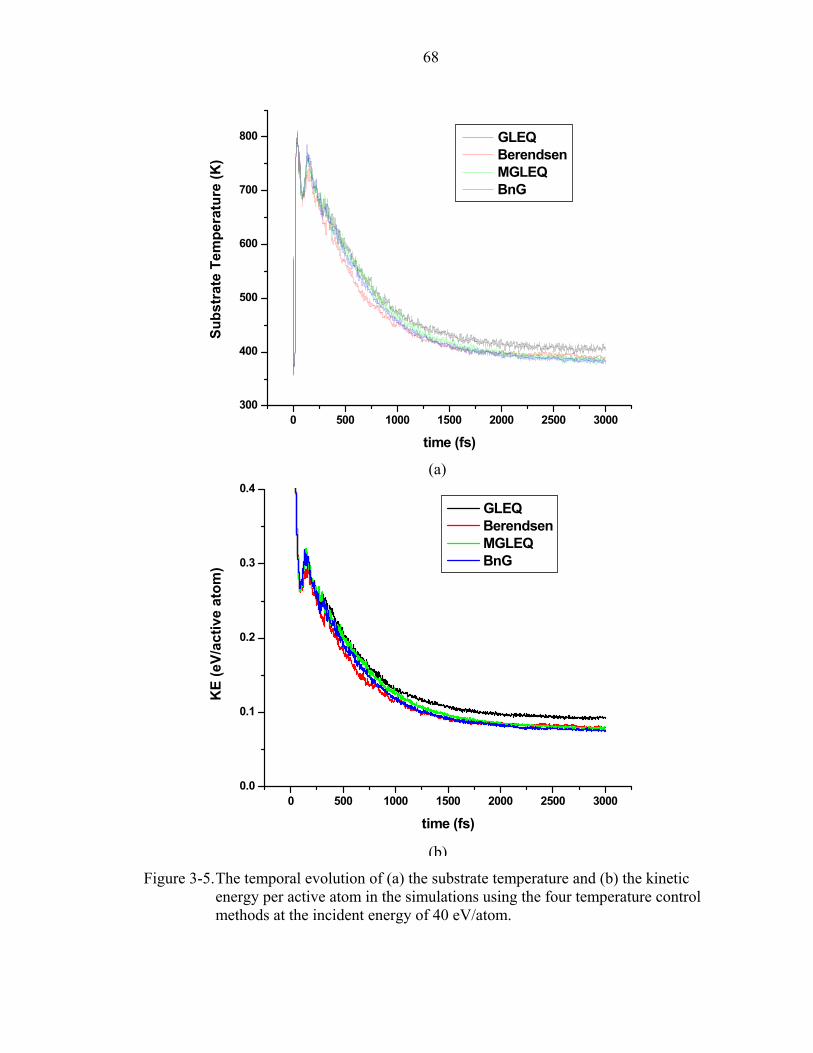
68
Figure 3-5. The temporal evolution of (a) the substrate temperature and (b) the kinetic
energy per active atom in the simulations using the four temperature control methods at the incident energy of 40 eV/atom.
0 500 1000 1500 2000 2500 3000300
400
500
600
700
800
Subs
trat
e Te
mpe
ratu
re (K
)
time (fs)
GLEQ Berendsen MGLEQ BnG
0 500 1000 1500 2000 2500 30000.0
0.1
0.2
0.3
0.4
KE
(eV/
activ
e at
om)
time (fs)
GLEQ Berendsen MGLEQ BnG
(a)
(b)
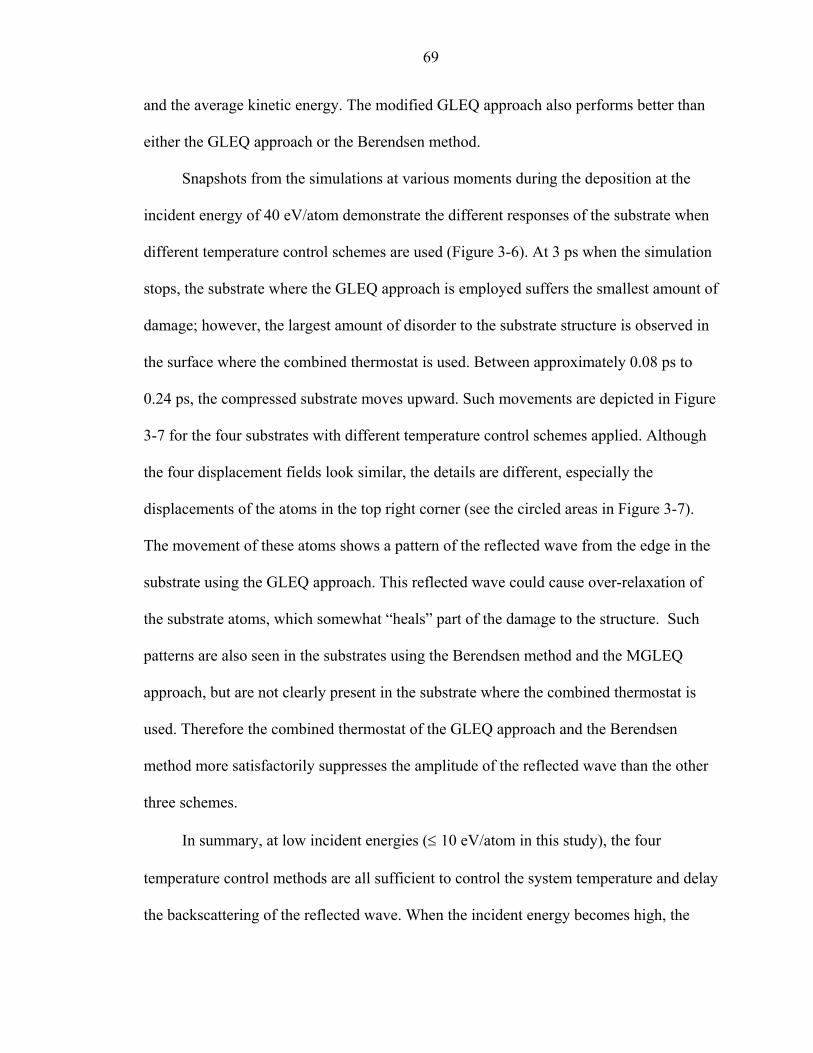
69
and the average kinetic energy. The modified GLEQ approach also performs better than
either the GLEQ approach or the Berendsen method.
Snapshots from the simulations at various moments during the deposition at the
incident energy of 40 eV/atom demonstrate the different responses of the substrate when
different temperature control schemes are used (Figure 3-6). At 3 ps when the simulation
stops, the substrate where the GLEQ approach is employed suffers the smallest amount of
damage; however, the largest amount of disorder to the substrate structure is observed in
the surface where the combined thermostat is used. Between approximately 0.08 ps to
0.24 ps, the compressed substrate moves upward. Such movements are depicted in Figure
3-7 for the four substrates with different temperature control schemes applied. Although
the four displacement fields look similar, the details are different, especially the
displacements of the atoms in the top right corner (see the circled areas in Figure 3-7).
The movement of these atoms shows a pattern of the reflected wave from the edge in the
substrate using the GLEQ approach. This reflected wave could cause over-relaxation of
the substrate atoms, which somewhat “heals” part of the damage to the structure. Such
patterns are also seen in the substrates using the Berendsen method and the MGLEQ
approach, but are not clearly present in the substrate where the combined thermostat is
used. Therefore the combined thermostat of the GLEQ approach and the Berendsen
method more satisfactorily suppresses the amplitude of the reflected wave than the other
three schemes.
In summary, at low incident energies (≤ 10 eV/atom in this study), the four
temperature control methods are all sufficient to control the system temperature and delay
the backscattering of the reflected wave. When the incident energy becomes high, the

70
Figure 3-6. Snapshots of the systems using the four temperature control methods at
various moments at the incident energy of 40 eV/atom.
Figure 3-7. The displacement fields from t = 0.08 ps to t = 0.24 ps in the cross section of the (111) plane using the four temperature control methods at the incident energy of 40 eV/atom. (a) GLEQ approach, (b) Berendsen method, (c) modified GLEQ approach, and (d) the combined thermostat of the GLEQ approach and the Berendsen method.
GLEQ Berendsen MGLEQ BnG
t = 0.08 ps
t = 0.24 ps
t = 3 ps
(a) (b)
(c) (d)
71
different performance of the four methods becomes apparent. This difference results from
their different abilities to absorb energetic waves propagating through the system at
various frequencies. The Berendsen method reduces the energy quickly at the early stage
of the process, and quickly brings the system to equilibrium. But the Berendsen method is
not as efficient at absorbing enough of the reflected wave when the incident energy is
high, which results in a relatively high temperature and energy when the system reaches
the equilibrium state. At moderate incident energies (for example, 20 eV/atom), the
GLEQ approach is still capable of dissipating the extra energy. Nevertheless, it fails at
higher incident energy. This result is consistent with Haberland’s conclusion as
mentioned in Section 3.1.3.[256]
The modified GLEQ approach that introduces extra damping at the boundary atoms
between the impact zone and the thermostat zone does indeed improve the capability of
the system to control the temperature as well as absorb the reflected wave when the
incident energy is high. The combined thermostat of the GLEQ approach and the
Berendsen method removes the excess energy in the most gradual manner, and the
system is usually the slowest one to reach the equilibrium. But, this simple combination
is superior to either the GLEQ approach or the Berendsen method, especially at a high
incident energy if enough time is allowed for the relaxation. This can be explained as
follows. The velocity adjustment algorithm in the GLEQ approach is different from that
in the Berendsen method. The frequency range of the energetic wave that could be
effectively absorbed by the GLEQ approach is therefore different from the Berendsen
method. When the cluster collides with the substrate at a high incident energy, the range
of the resultant energy wave frequency is wider, which may cover both the effective

72
ranges of the GLEQ approach and the Berendsen method. Therefore, when neither the
GLEQ approach nor the Berendsen method is able to completely absorb the reflected
wave, their combination can do much better.
However, if the substrate size is too small relative to the incident energy, none of
the temperature control schemes will work well enough to remove the extra energy. In
this study, a small substrate with dimensions of 2.8 nm × 2.8 nm × 1.3 nm is also
considered in the deposition at 40 eV/atom. The number of active atoms and thermostat
atoms contained in this substrate are about 31 of those in the substrate considered above.
Both the temporal evolution of the substrate temperature (Figure 3-8(a)) and the average
kinetic energy per active atom (Figure 3-8(b)) are essentially the same in the
Figure 3-8. The temporal evolution of (a) the substrate temperature and (b) the kinetic energy per active atom in the depositions on the small substrate using the four temperature control methods at the incident energy of 40 eV/atom.
systems where the four temperature control schemes are used. As given in Figure 3-8(a),
the substrate temperature finally fluctuates at about 520 K, which is too much higher than
the desired temperature. After 1.5 ps, the system appears to reach equilibrium and
0 1000 2000 3000 4000 5000 6000200
400
600
800
1000
1200
Subs
trat
e Te
mpe
ratu
re (K
)
time (fs)
GLEQ Berendsen MGLEQ BnG
0 1000 2000 3000 4000 5000 60000.0
0.2
0.4
0.6
KE
(eV/
activ
e at
om)
time (fs)
GLEQ Berendsen MGLEQ BnG
(a) (b)

73
extended relaxation does not help to reduce the temperature and the energy, which
indicates the reflected wave bouncing back and forth within the system.
3.4 Conclusions
In deposition experiments, the temperature of the substrate experiences a thermal
spike when the incident particles collide with the substrate particles. The heat is then
conducted away from the site of the collision quite quickly through the substrate, causing
the temperature to drop exponentially.[254] Appropriate temperature control methods,
which can effectively dissipate extra energy in a system, are thus necessary to model such
processes. The dissipation of extra energy not only helps to control the temperature but
also absorbs the artificial reflected wave. In this chapter, four temperature control
methods are used to model energetic cluster deposition on a solid substrate, which is a
stringent test of temperature control methods. These methods include the GLEQ
approach, the Berendsen method, a variation of the GLEQ approach where extra damping
is introduced to the boundary atoms between the impact zone and the thermostat zone,
and a combined thermostat of the GLEQ approach and the Berendsen method.
The performance of the temperature control methods depends on the incident
energy and the substrate size. No matter which method is chosen, a large enough
substrate is first required to realistically model the deposition process. The Berendsen
method is very effective at removing excess energy at the early stage; however, the
resultant equilibrium properties are not always the best. The GLEQ approach using the
Debye solid model performs well if the incident energy is not too high. At a high incident
energy, the modified GLEQ approach is better than the regular GLEQ algorithm due to
the extra damping. Surprisingly but not unexpectedly, the simple combination of the
GLEQ approach and the Berendsen method appears to be successful at controlling the
74
system temperature when either the GLEQ approach or the Berendsen method fails at a
high incident energy.
It should be recognized that there is no realistic counterpart to the thermostat atoms
because they do not obey Newton’s second law. The number of thermostat atoms should
be large enough to bring the system temperature to the desired value. But in order to get
reliable simulation predictions, the thermostat zone should be far away from the area
where the processes of interest occur. This requires the impact zone, where the atoms
follow the normal Newtonian dynamics, to be large enough to be realistic while
remaining within the limitations of the available computer system. The following
simulations model the deposition of particles at moderate incident energies. Each incident
particle contains less than 50 atoms whose atomic number is less than 10. In these
simulations, the substrate with appropriate size and arrangement of the impact zone and
the thermostat zone is first determined depending on the incident energy and the size of
the incident particle. The GLEQ approach is chosen because this approach is good
enough to handle the deposition of small particles at moderate incident energies and it
realistically describes the exponential decrease of the substrate temperature.[254]
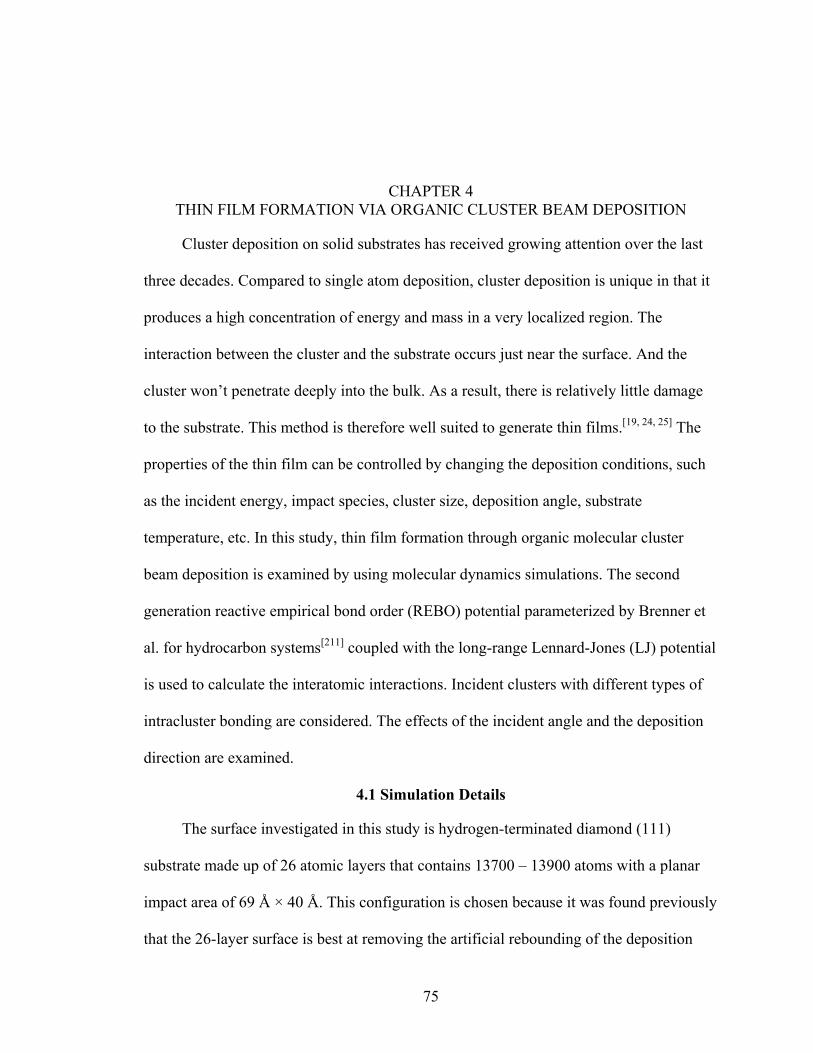
75
CHAPTER 4 THIN FILM FORMATION VIA ORGANIC CLUSTER BEAM DEPOSITION
Cluster deposition on solid substrates has received growing attention over the last
three decades. Compared to single atom deposition, cluster deposition is unique in that it
produces a high concentration of energy and mass in a very localized region. The
interaction between the cluster and the substrate occurs just near the surface. And the
cluster won’t penetrate deeply into the bulk. As a result, there is relatively little damage
to the substrate. This method is therefore well suited to generate thin films.[19, 24, 25] The
properties of the thin film can be controlled by changing the deposition conditions, such
as the incident energy, impact species, cluster size, deposition angle, substrate
temperature, etc. In this study, thin film formation through organic molecular cluster
beam deposition is examined by using molecular dynamics simulations. The second
generation reactive empirical bond order (REBO) potential parameterized by Brenner et
al. for hydrocarbon systems[211] coupled with the long-range Lennard-Jones (LJ) potential
is used to calculate the interatomic interactions. Incident clusters with different types of
intracluster bonding are considered. The effects of the incident angle and the deposition
direction are examined.
4.1 Simulation Details
The surface investigated in this study is hydrogen-terminated diamond (111)
substrate made up of 26 atomic layers that contains 13700 – 13900 atoms with a planar
impact area of 69 Å × 40 Å. This configuration is chosen because it was found previously
that the 26-layer surface is best at removing the artificial rebounding of the deposition

76
energy and preventing it from interfering with the reactions occurring at the surface at the
highest incident energy considered.[102] Two-dimensional periodic boundary conditions
are applied within the impact plane to mimic a semi-infinite system. The bottom
hydrogen layer is fixed. The next six carbon layers and 5 to 6 rows of atoms on the slab
edges have Langevin frictional forces and random forces applied. That is, the GLEQ
approach is used to dissipate the extra heat accumulated on the surface upon deposition,
and at the same time, to prevent the reflection of the impact energy from the edges of the
slab. The remaining surface atoms and all the cluster beam atoms are active atoms, which
are free to move in response to the applied forces without any constraints. Figure 4-1
shows the arrangement of the thermostat atoms and the active atoms in the substrate.
Before the deposition, the surface is equilibrated at 500 K to achieve a relaxed structure
with optimized atomic configurations, and then cooled to the simulation temperature of
300 K.
Figure 4-1. The arrangement of the thermostat atoms (gray) and the active atoms (black) within the substrate. The top and bottom spheres in the side view are hydrogen atoms.
Side view
Top view
77
Three cluster beams with different types of intracluster bonding are examined in
this study. These are a van der Waals cluster beam of ethylene (C2H4) molecules, a beam
of adamantane (C10H16) molecules, and a beam of fullerene molecules (C20). In thin film
formation through energetic cluster deposition, cluster size is a very important factor. In
contrast to the metallic cluster deposition, our previous simulations of thin film formation
via organic cluster deposition predicted that smaller clusters of a few tens of atoms
produced thin films more efficiently than large clusters of several hundred atoms.[99] This
prediction is consistent with the experimental fact that in ICBD technique, which is a
successful method to produce organic thin films,[25, 28-30] only small clusters prevail.[26, 40,
41] Therefore, in this study, the van der Waals cluster beam of ethylene contains 8
ethylene molecules per cluster; the beams of adamantane and C20 each contain one
molecule per cluster. Although the number of atoms contained in each cluster in these
three beams is quite different (48 for ethylene, 26 for adamantane, and 20 for C20), all the
individual clusters are roughly the same size and contain comparable amounts of carbon
(16 C atoms for ethylene, 10 C atoms for adamantane, and 20 C atoms for C20). Each of
the three beams contains 20 clusters. All the beams are created through the repetition of a
single cluster that has been equilibrated at 500 K and quenched to 5 K to minimize the
internal kinetic energy of the cluster. Then 20 of the clusters are repeated in random
translational and angular orientations so that they will not impact the surface with the
same orientation or at the same point on the surface. Prior to deposition, each beam is
placed about 4 Å above the surface; the distance between two consecutive clusters is also
around 4 Å. This distance is chosen because it is long enough that the individual clusters
78
do not interact with one another in the beam and yet the deposition process is not too
slow in these demanding computational studies.
This study is designed to compare the formation of thin films from cluster beams
with different types of intracluster bonding, and to gain a better understanding of the
effects of incident angle and impact direction. Therefore, depositions at angles of 0º, 15º,
45º and 60º from the surface normal for all the three incident species are considered.
When the beam impacts the surface at an angle θ , the total impact momentum ( totalρ ),
which is related to the total energy ( totalE ), can be divided into two none-zero
components: the component normal to the surface ( normalρ ), which corresponds to normalE
(= θ2costotalE ); and the component parallel to the surface ( lateralρ ), which corresponds to
lateralE (= θ2sintotalE ). When θ changes while totalρ and totalE are fixed, both the normal
and lateral components vary with angle. Consequently, two sets of deposition energies
are considered one where totalE is constant at 400 eV/cluster while the ratio of normalρ
to lateralρ decreases with increasing angle; and another where totalρ and totalE change but
normalρ is constant (corresponding to a constant energy of 400 eV/cluster normal to the
surface).
Deposition with lateralρ along the ]211[−−
and ]101[−
crystallographic orientations are
investigated. The deposition system is schematically shown in Figure 4-2. For statistical
purpose, five trajectories are carried out for each set of deposition conditions for each
incident species. The averaged results are reported. All the simulations run for about 3 ps
with 0.2 fs as the time step. The deposition occurs during the first 1 ps followed by the
complete relaxation of the system during the next 2 ps.
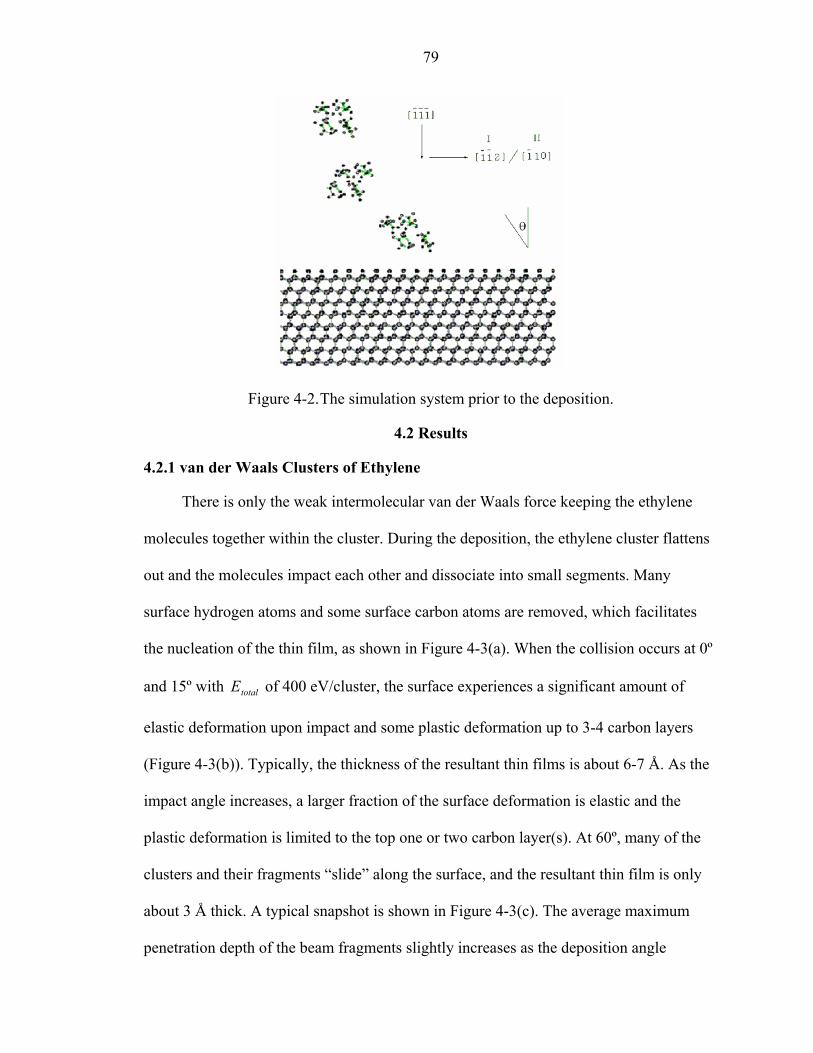
79
Figure 4-2. The simulation system prior to the deposition.
4.2 Results
4.2.1 van der Waals Clusters of Ethylene
There is only the weak intermolecular van der Waals force keeping the ethylene
molecules together within the cluster. During the deposition, the ethylene cluster flattens
out and the molecules impact each other and dissociate into small segments. Many
surface hydrogen atoms and some surface carbon atoms are removed, which facilitates
the nucleation of the thin film, as shown in Figure 4-3(a). When the collision occurs at 0º
and 15º with totalE of 400 eV/cluster, the surface experiences a significant amount of
elastic deformation upon impact and some plastic deformation up to 3-4 carbon layers
(Figure 4-3(b)). Typically, the thickness of the resultant thin films is about 6-7 Å. As the
impact angle increases, a larger fraction of the surface deformation is elastic and the
plastic deformation is limited to the top one or two carbon layer(s). At 60º, many of the
clusters and their fragments “slide” along the surface, and the resultant thin film is only
about 3 Å thick. A typical snapshot is shown in Figure 4-3(c). The average maximum
penetration depth of the beam fragments slightly increases as the deposition angle
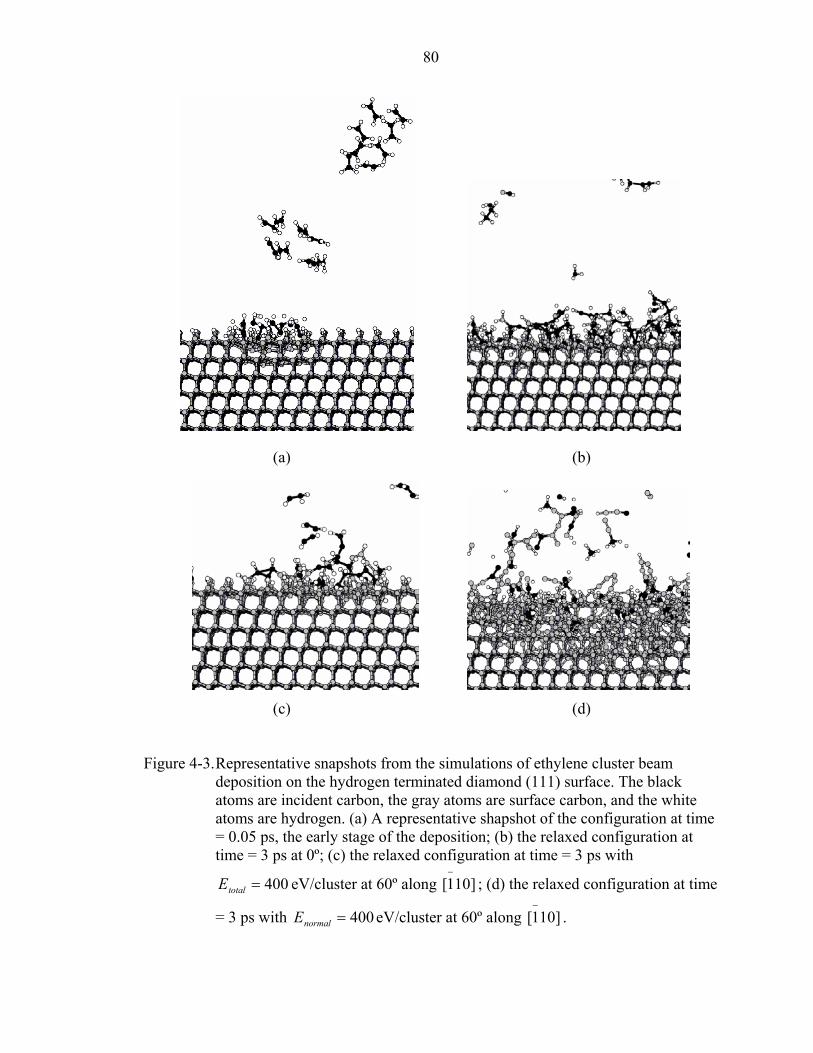
80
Figure 4-3. Representative snapshots from the simulations of ethylene cluster beam deposition on the hydrogen terminated diamond (111) surface. The black atoms are incident carbon, the gray atoms are surface carbon, and the white atoms are hydrogen. (a) A representative shapshot of the configuration at time = 0.05 ps, the early stage of the deposition; (b) the relaxed configuration at time = 3 ps at 0º; (c) the relaxed configuration at time = 3 ps with
400=totalE eV/cluster at 60º along ]101[−
; (d) the relaxed configuration at time
= 3 ps with 400=normalE eV/cluster at 60º along ]101[−
.
(a) (b)
(c) (d)

81
decreases. But at all the incident angles, the penetration depth is about 1 Å.
Approximately 1% of the surface atoms are sputtered for all the angles considered.
When the deposition occurs with constant normal momentum equivalent to the
normal incident energy of 400 eV/cluster, severe permanent disorder of the surface is
predicted to occur, especially at large angle impacts (compare Figure 4-3(c) vs. Figure 4-
3(d)). In addition, many more surface carbon atoms are pushed toward the surface region
and become part of the film. The film thickness is about 7 Å at all angles. The average
maximum penetration depth of the beam fragments increases as the angle increases (from
about 0.7 Å at 15º to about 2.7 Å at 60º). The amount of surface sputtering also increases
with the angle, from about 0.7% at 15º to about 4.0% at 60º.
Figure 4-4 summarizes the percentage of the carbon atoms from the incident
ethylene clusters that adhere to the surface at various incident angles. When the
depositions occur with totalE of 400 eV/cluster, the amount of adhesion decreases
monotonically as the incident angle increases, although the result at 15º is about the same
as the normal impacts when the standard deviation is considered. This suggests the
deposition with high impact momentum normal to the surface would facilitate thin film
nucleation. When the cluster beam is directed to the substrate with a constant normal
impact momentum (corresponding to normalE = 400 eV/cluster), the adhesion percentage is
about the same for the 0º, 15º and 45º depositions. However, at 60º, the amount of the
nucleated thin film is still lower than those smaller angle depositions, although the
decrease is not so dramatic as when 400=totalE eV/cluster. In fact, if the deposition
results at normalE = 400 eV/cluster are compared with the results at 400=totalE eV/cluster,
one can see that the amount of adhesion increases significantly in the case of normalE =
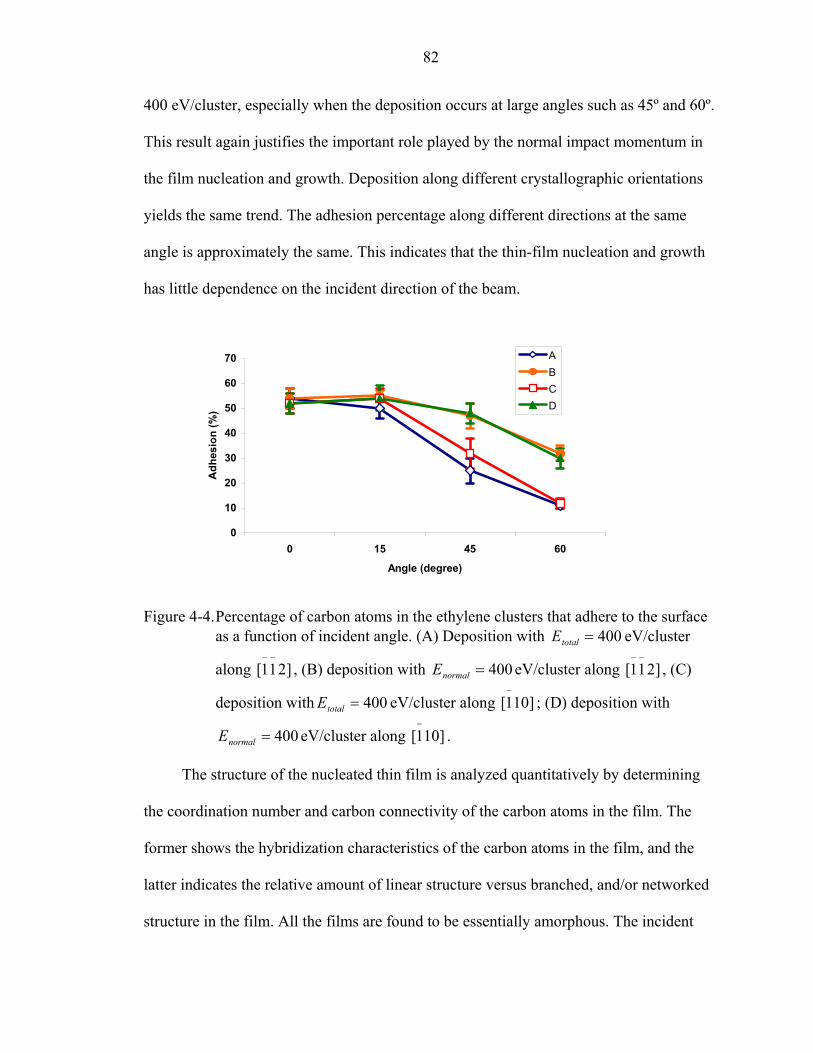
82
400 eV/cluster, especially when the deposition occurs at large angles such as 45º and 60º.
This result again justifies the important role played by the normal impact momentum in
the film nucleation and growth. Deposition along different crystallographic orientations
yields the same trend. The adhesion percentage along different directions at the same
angle is approximately the same. This indicates that the thin-film nucleation and growth
has little dependence on the incident direction of the beam.
Figure 4-4. Percentage of carbon atoms in the ethylene clusters that adhere to the surface as a function of incident angle. (A) Deposition with 400=totalE eV/cluster
along ]211[−−
, (B) deposition with 400=normalE eV/cluster along ]211[−−
, (C)
deposition with 400=totalE eV/cluster along ]101[−
; (D) deposition with
400=normalE eV/cluster along ]101[−
.
The structure of the nucleated thin film is analyzed quantitatively by determining
the coordination number and carbon connectivity of the carbon atoms in the film. The
former shows the hybridization characteristics of the carbon atoms in the film, and the
latter indicates the relative amount of linear structure versus branched, and/or networked
structure in the film. All the films are found to be essentially amorphous. The incident
0
10
20
30
40
50
60
70
0 15 45 60
Angle (degree)
Adh
esio
n (%
)
ABCD
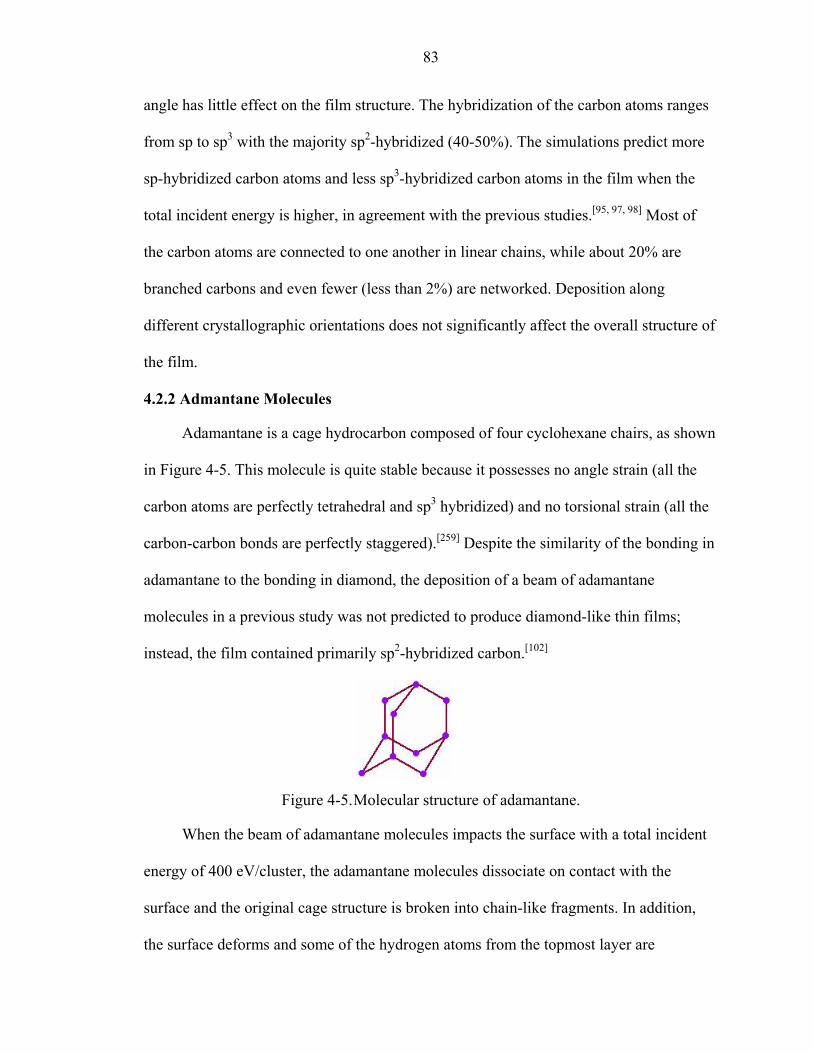
83
angle has little effect on the film structure. The hybridization of the carbon atoms ranges
from sp to sp3 with the majority sp2-hybridized (40-50%). The simulations predict more
sp-hybridized carbon atoms and less sp3-hybridized carbon atoms in the film when the
total incident energy is higher, in agreement with the previous studies.[95, 97, 98] Most of
the carbon atoms are connected to one another in linear chains, while about 20% are
branched carbons and even fewer (less than 2%) are networked. Deposition along
different crystallographic orientations does not significantly affect the overall structure of
the film.
4.2.2 Admantane Molecules
Adamantane is a cage hydrocarbon composed of four cyclohexane chairs, as shown
in Figure 4-5. This molecule is quite stable because it possesses no angle strain (all the
carbon atoms are perfectly tetrahedral and sp3 hybridized) and no torsional strain (all the
carbon-carbon bonds are perfectly staggered).[259] Despite the similarity of the bonding in
adamantane to the bonding in diamond, the deposition of a beam of adamantane
molecules in a previous study was not predicted to produce diamond-like thin films;
instead, the film contained primarily sp2-hybridized carbon.[102]
Figure 4-5. Molecular structure of adamantane.
When the beam of adamantane molecules impacts the surface with a total incident
energy of 400 eV/cluster, the adamantane molecules dissociate on contact with the
surface and the original cage structure is broken into chain-like fragments. In addition,
the surface deforms and some of the hydrogen atoms from the topmost layer are

84
displaced, leaving nucleation sites for the fragments to attach to the surface, as shown in
Figure 4-6(a). As the incident angle increases, the surface experiences less deformation,
and longer chains survive. Nevertheless, no cage structures remain after deposition at any
of the angles considered. Representative snapshots of the resultant thin film are shown in
Figure 4-6(b) and (c). The resultant thin films are typically about 4-7 Å thick. Atoms
from the cluster beam can travel approximately 1 Å into the surface, with the deposition
processes at 0º and 15º resulting in slightly deeper penetrations than the deposition
processes at 45º and 60º. About 1% of the original surface atoms are knocked out of the
surface. This sputtering effect is slightly greater at large incident angles because of the
high lateral impact momentum associated with the large angle deposition.
As is the case for the ethylene cluster beam, when the adamantane is deposited with
a constant normal momentum that corresponds to the normal incident energy of 400
eV/cluster, the surface is damaged more severely as the incident angle increases (Figure
4-6(d)), and large numbers of surface atoms are sputtered out of the surface. The cage
structure of the adamantane molecules is destroyed during deposition, either from the
initial impact with the surface or from gas-phase collisions with the sputtered fragments
leaving the surface. The latter is not seen for depositions with total incident energy of 400
eV/cluster. The molecules consequently break into short chains that contain 2-3 carbon
atoms and various numbers of hydrogen. Some of these chains stick to the surface and
some scatter away. However, as the deposition process continues, these short chains can
react with one another to form longer chains. The resultant thin film is about 7-11 Å,
which is significantly thicker than the film formed when the total incident energy is 400
eV/cluster.

85
Figure 4-6. Representative snapshots from the simulations of adamantane molecular beam deposition on the hydrogen terminated diamond (111) surface. The same color scheme as in Figure 4-2 applies. (a) A representative shapshot of the configuration at time = 0.05 ps; (b) the relaxed configuration at time = 3 ps at 0º; (c) the relaxed configuration at time = 3 ps with 400=totalE eV/cluster at
60º along ]101[−
; (d) the relaxed configuration at time = 3 ps with
400=normalE eV/cluster at 60º along ]101[−
.
(a) (b)
(c) (d)

86
Figure 4-7. Percentage of adamantane carbon atoms that adhere to the surface as a function of incident angle. (A) deposition with 400=totalE eV/cluster along
]211[−−
, (B) deposition with 400=normalE eV/cluster along ]211[−−
, (C)
deposition with 400=totalE eV/cluster along ]101[−
; (D) deposition with
400=normalE eV/cluster along ]101[−
.
The percentage of carbon atoms from the adamantane molecules that remain
chemisorbed to the surface at various incident angles is shown in Figure 4-7. As what
happens in the deposition of ethylene clusters, the amount of adhesion decreases as the
incident angle increases, while 15º impacts are as efficient to produce thin films as the
normal impacts. However, as indicated in Figure 4-7, the amount of adhesion at 45º when
the deposition occurs with 400=totalE eV/cluster is comparable to what happens when
the deposition occurs with 400=normalE eV/cluster. This is in contrast to the significant
increase in the amount of adhesion predicted for the ethylene cluster beam deposition at
45º when the beam is deposited with 400=normalE eV/cluster (see Figure 4-4). Finally,
the deposition of adamantane molecules along different crystallographic orientations does
01020304050
60708090
100
0 15 45 60
Angle (degree)
Adh
esio
n (%
)
ABCD
87
not result in noticeable differences in the adhesion percentage, in agreement with the
results predicted from the ethylene cluster deposition.
As seen in our previous study,[102] the bonding in the film resulted from the
adamantane deposition is predominantly sp2-hybridized (40%-60%) and no more than
15% of the carbon atoms remain sp3 hybridized. About 70%-80% of the carbon atoms are
connected to one another in a linear fashion, 30%-20% are branched, and less than 3%
are networked. Again, the film structure shows little dependence on either the incident
angle or the crystallographic orientation.
4.2.3 C20 Molecules
C20 with a cage structure is the smallest member in the fullerene family. It has no
hexagons but 12 pentagonal faces. Its surface thus has high curvature, which severely
bends and strains the bonds between the carbon atoms. Besides the fullerene structure,
both experimental and theoretical work has shown that several other structures for C20
exist, such as linear structure (chain), monocyclic and/or bicyclic rings, graphitic sheet,
and corrannulene structure (bowl).[260-265] However, different theoretical calculations give
contradictory results as to the energetic stability of these isomers. Quantum Monte Carlo
calculations suggest that bowl and ring isomers are more energetically stable than
fullerene structure.[260, 261] Quantum molecular dynamics simulations,[262] coupled cluster
calculations,[263] and density functional calculations with local spin density and gradient-
corrected approximations[264] predict the fullerene structure is the minimum energy
configuration. However, experimental measurements show that the fullerene structure of
C20 is not favored under the conditions of experiments. The major reason lies in the
complicated experimental conditions, for example, high temperatures and charge
states.[264, 265] The bonding in C20 fullerene is unique in that it is sp2 hybridized with π-

88
bonding that is so distorted that it is nearly sp3 hybridized. Several groups have studied
the deposition of fullerene on surfaces[36, 63, 65, 66, 70, 75, 91-94, 112, 266] and find that it can be
used as a precursor of thin film growth.
In our simulations, the C20 cage flattens and breaks into fragments such as rings and
chains when it hits the surface (see Figure 4-8(a)). As is the case in the depositions of
both ethylene molecular beam and adamantane beam, during the deposition of C20 beam,
the surface also deforms with the degree of deformation depending on the cluster energy
and incident angle. For example, when the deposition occurs with the total incident
energy of 400 eV/cluster, at 0º and 15º, elastic deformation can reach the 13th surface
carbon layer, while plastic deformation remains up to the 5th surface carbon layers, as
shown in Figure 4-8(b). When the incident angle is 45º or 60º, elastic deformation
reaches only the 8th carbon layer while plastic deformation only reaches the 3rd carbon
layer, as shown in Figure 4-8(c). However, when the deposition occurs at high incident
energy, which, in this study, corresponds to the case where the beam is deposited to the
surface at a constant normal momentum equivalent to a normal incident energy of 400
eV/cluster, significant permanent surface deformation appears at large incident angles
(compare Figure 4-8(c) with Figure 4-8(d)).
During the depositions with the total incident energy of 400 eV/cluster, chain-like
fragments that contain 5-6 carbon atoms form, and few surface carbon atoms are knocked
loose. The resultant thin film is about 6-10 Å thick. In addition, the film fragments often
have more than one tethering points to the surface, giving the film strong adhesion to the
diamond. Atoms from the C20 penetrate about 1 Å into the surface and around 1% of the
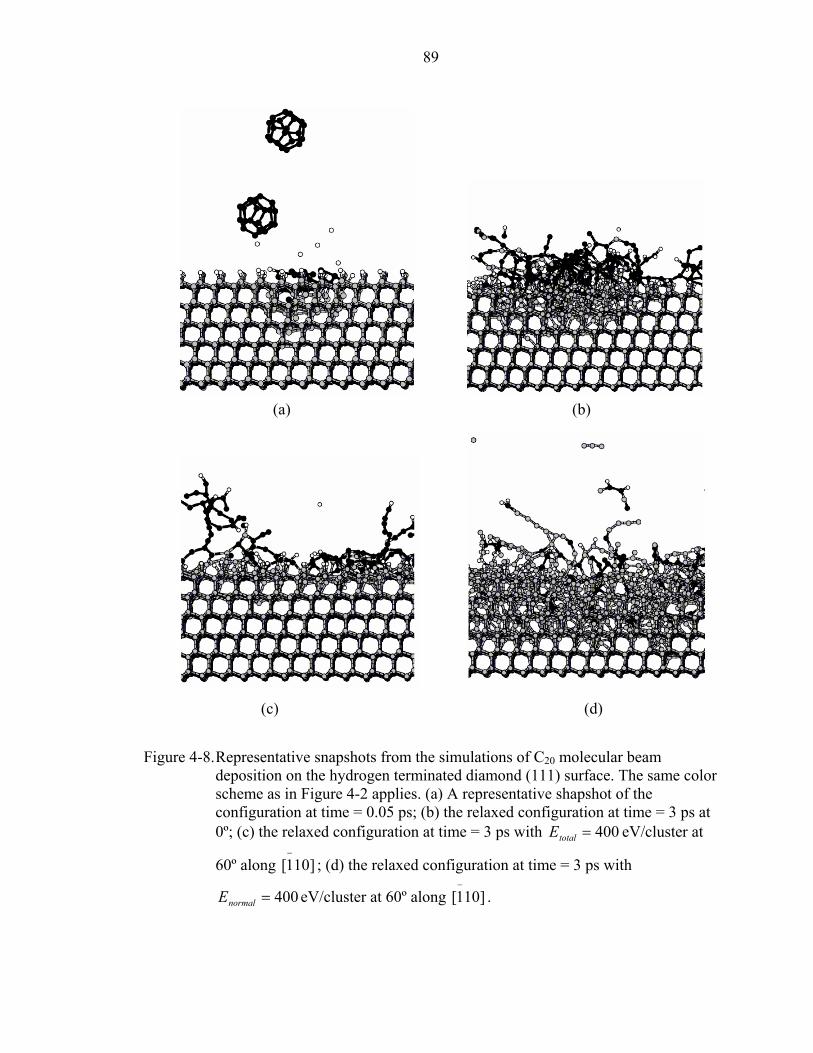
89
Figure 4-8. Representative snapshots from the simulations of C20 molecular beam deposition on the hydrogen terminated diamond (111) surface. The same color scheme as in Figure 4-2 applies. (a) A representative shapshot of the configuration at time = 0.05 ps; (b) the relaxed configuration at time = 3 ps at 0º; (c) the relaxed configuration at time = 3 ps with 400=totalE eV/cluster at
60º along ]101[−
; (d) the relaxed configuration at time = 3 ps with
400=normalE eV/cluster at 60º along ]101[−
.
(a) (b)
(c) (d)
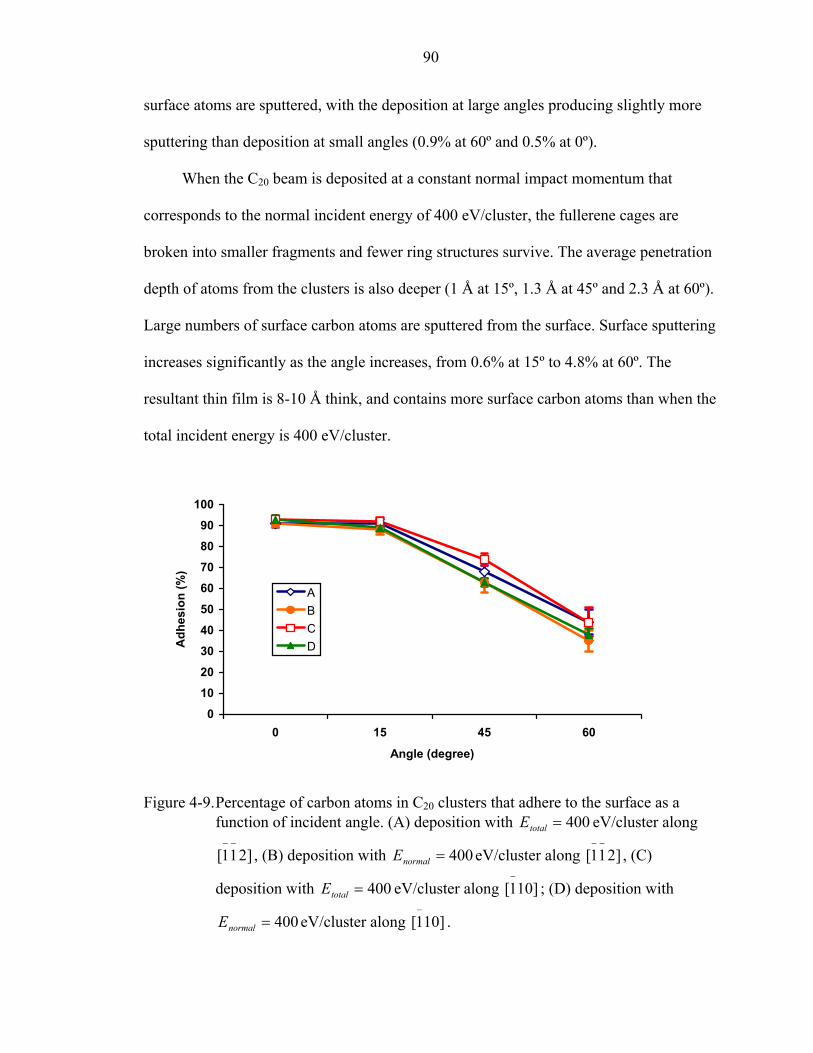
90
surface atoms are sputtered, with the deposition at large angles producing slightly more
sputtering than deposition at small angles (0.9% at 60º and 0.5% at 0º).
When the C20 beam is deposited at a constant normal impact momentum that
corresponds to the normal incident energy of 400 eV/cluster, the fullerene cages are
broken into smaller fragments and fewer ring structures survive. The average penetration
depth of atoms from the clusters is also deeper (1 Å at 15º, 1.3 Å at 45º and 2.3 Å at 60º).
Large numbers of surface carbon atoms are sputtered from the surface. Surface sputtering
increases significantly as the angle increases, from 0.6% at 15º to 4.8% at 60º. The
resultant thin film is 8-10 Å think, and contains more surface carbon atoms than when the
total incident energy is 400 eV/cluster.
Figure 4-9. Percentage of carbon atoms in C20 clusters that adhere to the surface as a function of incident angle. (A) deposition with 400=totalE eV/cluster along
]211[−−
, (B) deposition with 400=normalE eV/cluster along ]211[−−
, (C)
deposition with 400=totalE eV/cluster along ]101[−
; (D) deposition with
400=normalE eV/cluster along ]101[−
.
0
10
20
30
40
50
60
70
80
90
100
0 15 45 60
Angle (degree)
Adh
esio
n (%
)
ABCD

91
The amount of carbon atoms from the C20 molecular beam adhered to the surface
resulting in the thin film formation decreases as the incident angle increases, as shown in
Figure 4-9. The results show no significant dependence on crystallographic orientation,
and the 15º depositions always generate similar results to the normal angle depositions.
Additionally, the amount of adhesion is relatively insensitive to cluster energy at all the
incident angles considered.
The coordination number and carbon connectivity of the film carbon atoms are also
examined. The results show that the film contains 40%-50% sp2 hybridized carbon and
30%-50% sp hybridized carbon. Less than 10% are sp3-hybridized. The carbon atoms are
mainly connected in a linear manner (50%-70%), a significant number (50%-30%) are
branched, and no more than 4% are networked. These results as well as those for the
depositions of ethylene clusters and adamantane molecules are summarized in Tables 4-1
and 4-2.
Table 4-1. Summary of the coordination percentage of the film carbon atoms (%) Incident species 1 neighbour sp sp2 sp3 Ethylene cluster < 15 20-40 40-50 10-30
Adamantane < 14 30-50 40-60 < 15 C20 < 15 30-50 40-50 < 10
Table 4-2. Summary of the percentage of carbon connectivity of the film carbon atoms (%)
Incident species Linear Branched Networked Ethylene cluster 80-90 10-20 < 2
Adamantane 70-80 20-30 < 3 C20 50-70 30-50 < 4
4.3 Discussion
During the deposition, about 60%-80% of the clusters’ kinetic energy is
transformed into surface kinetic energy, and more than 90% of the excess surface kinetic
energy is dissipated through the Langevin thermostat atoms in the surface.[95, 97, 98, 100] The
92
effectiveness of the application of the Langevin thermostat is crucial for the realistic
dissipation of the excess surface kinetic energy and is therefore closely examined in this
study. The averaged temperature of the surface Langevin atoms and the non-thermostat
atoms is measured separately after the relaxation. Among the three incident species, C20
deposition results in the highest surface temperature because it has the most localized
energy accumulation, which makes the transfer of incident energy to the surrounding
substrate atoms the least efficient. But as expected, for all the three species, the average
temperature of the surface Langevin atoms is about 300 K (the simulation temperature),
while the temperature of the non-thermostat atoms is slightly higher than 300 K.
Therefore, the current system set-up is effective enough to maintain the system
temperature as required for all the three incident cluster beams.
Although the three cluster beams used in this study are quite different from one
another, their deposition results share some significant similarities. In all cases, the
deposition process destroys the original structure of the cluster, regardless of the type of
bonding holding the cluster together. Both adamantane and C20 disintegrate into chains or
rings. This finding for C20 differs from the results of some other studies,[91, 94] which
predict that its cage structure can either survive after surface impact or recover during the
following relaxation. This is because the incident energy used here is at least two times
higher than the molecular binding energy of the C20 (which is about 118 eV/molecule)
while the energy considered in those studies is much lower.
Despite the rigid nature of the diamond, the substrate experiences various degrees
of damage depending on the incident energy and the incident angle. The depth of the
damage to the surface varies from 2 Å to 8 Å, which indicates that the deposition process
93
modifies only a shallow region of the surface. When the deposition takes place at a total
incident energy of 400 eV/cluster, the damage to the surface decreases with increasing
incident angle because of the large component of momentum normal to the surface at
small angles. However, when the normal impact momentum is kept constant, which
corresponds to an energy of 400 eV/cluster normal to the surface, the damage to the
surface is more severe at large angles, especially in the lateral direction, because of the
large lateral component of the impact momentum that breaks a large number of surface
bonds.
Surface sputtering is predicted to occur in all the simulations and the lateral
momentum component is a major factor in controlling the sputtering effect. For instance,
in the depositions at a constant total impact momentum, which is equivalent to a total
incident energy of 400 eV/cluster, more surface atoms are sputtered at large incident
angles where the lateral impact momentum is large. In cases where the impact
momentum normal to the surface are held constant, the sputtering of surface atoms at
large angles (45º and 60º) is about 2-4 times the sputtering of surface atoms at small
angles (0º and 15º) because the lateral component of the impact momentum increases
significantly with increasing angle.
Deposition of single-atomic ion beam can only result in smooth thin film at oblique
angles.[267] While in cluster beam deposition, Yamamda et al. reported the substrate
roughness increased monotonically with increasing incident angle.[118, 268] However, the
depositions of all the three cluster beams in this study show little dependence of the
smoothing effect on the incident angle. In fact, the resultant thin film thickness is about
3-7 Å from the deposition of ethylene molecular clusters, 4-7 Å from adamantane
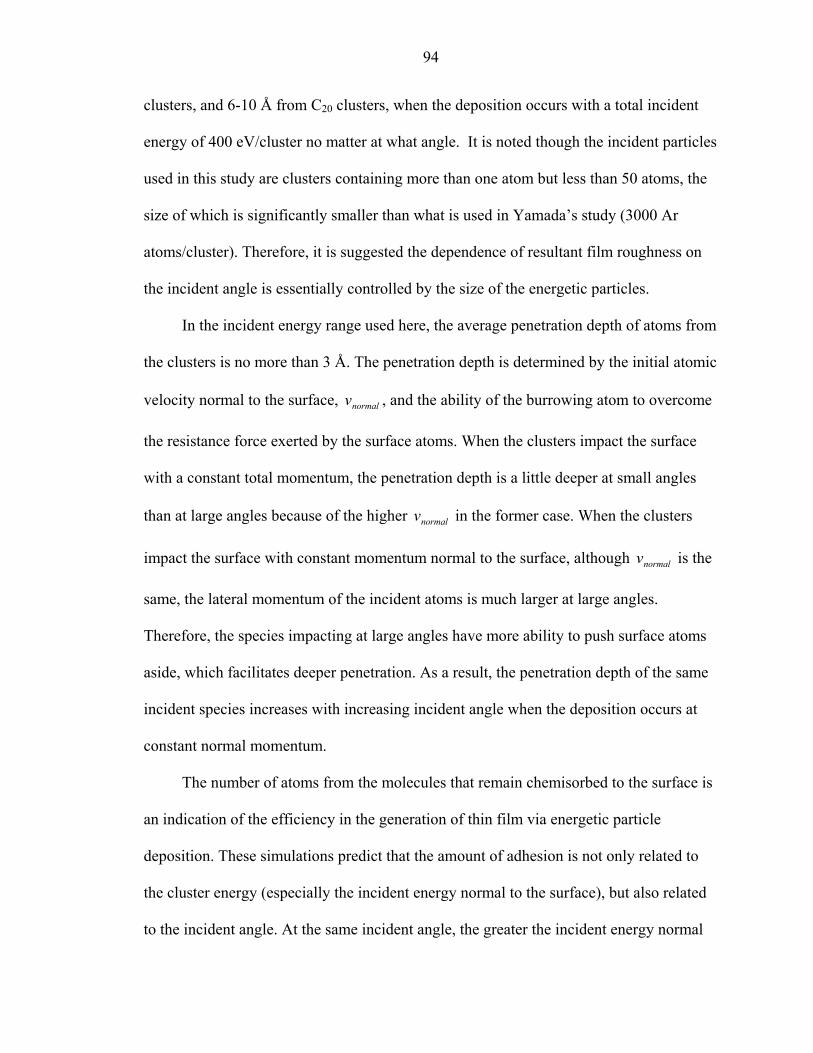
94
clusters, and 6-10 Å from C20 clusters, when the deposition occurs with a total incident
energy of 400 eV/cluster no matter at what angle. It is noted though the incident particles
used in this study are clusters containing more than one atom but less than 50 atoms, the
size of which is significantly smaller than what is used in Yamada’s study (3000 Ar
atoms/cluster). Therefore, it is suggested the dependence of resultant film roughness on
the incident angle is essentially controlled by the size of the energetic particles.
In the incident energy range used here, the average penetration depth of atoms from
the clusters is no more than 3 Å. The penetration depth is determined by the initial atomic
velocity normal to the surface, normalv , and the ability of the burrowing atom to overcome
the resistance force exerted by the surface atoms. When the clusters impact the surface
with a constant total momentum, the penetration depth is a little deeper at small angles
than at large angles because of the higher normalv in the former case. When the clusters
impact the surface with constant momentum normal to the surface, although normalv is the
same, the lateral momentum of the incident atoms is much larger at large angles.
Therefore, the species impacting at large angles have more ability to push surface atoms
aside, which facilitates deeper penetration. As a result, the penetration depth of the same
incident species increases with increasing incident angle when the deposition occurs at
constant normal momentum.
The number of atoms from the molecules that remain chemisorbed to the surface is
an indication of the efficiency in the generation of thin film via energetic particle
deposition. These simulations predict that the amount of adhesion is not only related to
the cluster energy (especially the incident energy normal to the surface), but also related
to the incident angle. At the same incident angle, the greater the incident energy normal

95
to the surface, the greater the amount of thin-film adhesion. All the three beams
considered in this study show a general trend of decreasing adhesion with increasing
deposition angles. Nevertheless, the thin film generation results for small angles (θ ≤ 15º)
are nearly the same as the thin film generation results of normal-angle deposition.
Despite the differences in the original structures of the three clusters, the films that
result from their deposition are similar to one another. They consist primarily of sp2-
hybridized carbon, and most of the carbon atoms in the film are connected to each other
in a linear fashion (see Table 4-1 and Table 4-2). This is in agreement with the
experimental studies that find the film properties are not affected by the specific structure
of the incident species.[75] This can be attributed to the high incident energy used here and
in those experimental studies. When the clusters are deposited on solid surface at high
enough energy, the strong collision between the cluster and the surface can lead to a
complete destruction of the original cluster structure and only the highly energetic atoms
and radicals survive. Therefore, it is the properties of these energetic atoms and radicals,
not the properties of the original clusters, that will determine the structure of the resultant
thin film.
There are also important differences in the results of the depositions of ethylene
cluster, adamantane, and C20 beams. These differences arise from the different
compositions and intracluster interactions of these three incident species, as well as the
different interactions between the incident cluster and the surface. For example, both the
deposition of the ethylene cluster beam and adamantane beam generate film containing
large amounts (60%-70%) of hydrogen, while the film that results from the deposition of
the C20 beam is more like an amorphous carbon film, and only 40%-50% is hydrogen
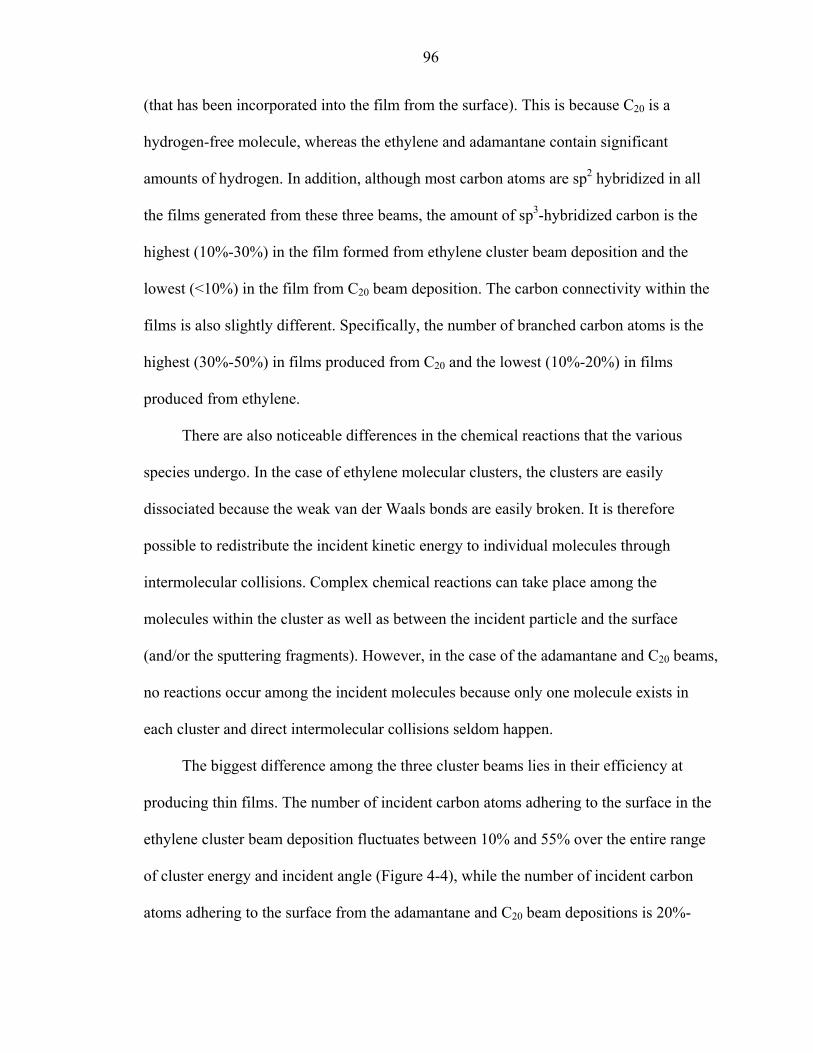
96
(that has been incorporated into the film from the surface). This is because C20 is a
hydrogen-free molecule, whereas the ethylene and adamantane contain significant
amounts of hydrogen. In addition, although most carbon atoms are sp2 hybridized in all
the films generated from these three beams, the amount of sp3-hybridized carbon is the
highest (10%-30%) in the film formed from ethylene cluster beam deposition and the
lowest (<10%) in the film from C20 beam deposition. The carbon connectivity within the
films is also slightly different. Specifically, the number of branched carbon atoms is the
highest (30%-50%) in films produced from C20 and the lowest (10%-20%) in films
produced from ethylene.
There are also noticeable differences in the chemical reactions that the various
species undergo. In the case of ethylene molecular clusters, the clusters are easily
dissociated because the weak van der Waals bonds are easily broken. It is therefore
possible to redistribute the incident kinetic energy to individual molecules through
intermolecular collisions. Complex chemical reactions can take place among the
molecules within the cluster as well as between the incident particle and the surface
(and/or the sputtering fragments). However, in the case of the adamantane and C20 beams,
no reactions occur among the incident molecules because only one molecule exists in
each cluster and direct intermolecular collisions seldom happen.
The biggest difference among the three cluster beams lies in their efficiency at
producing thin films. The number of incident carbon atoms adhering to the surface in the
ethylene cluster beam deposition fluctuates between 10% and 55% over the entire range
of cluster energy and incident angle (Figure 4-4), while the number of incident carbon
atoms adhering to the surface from the adamantane and C20 beam depositions is 20%-
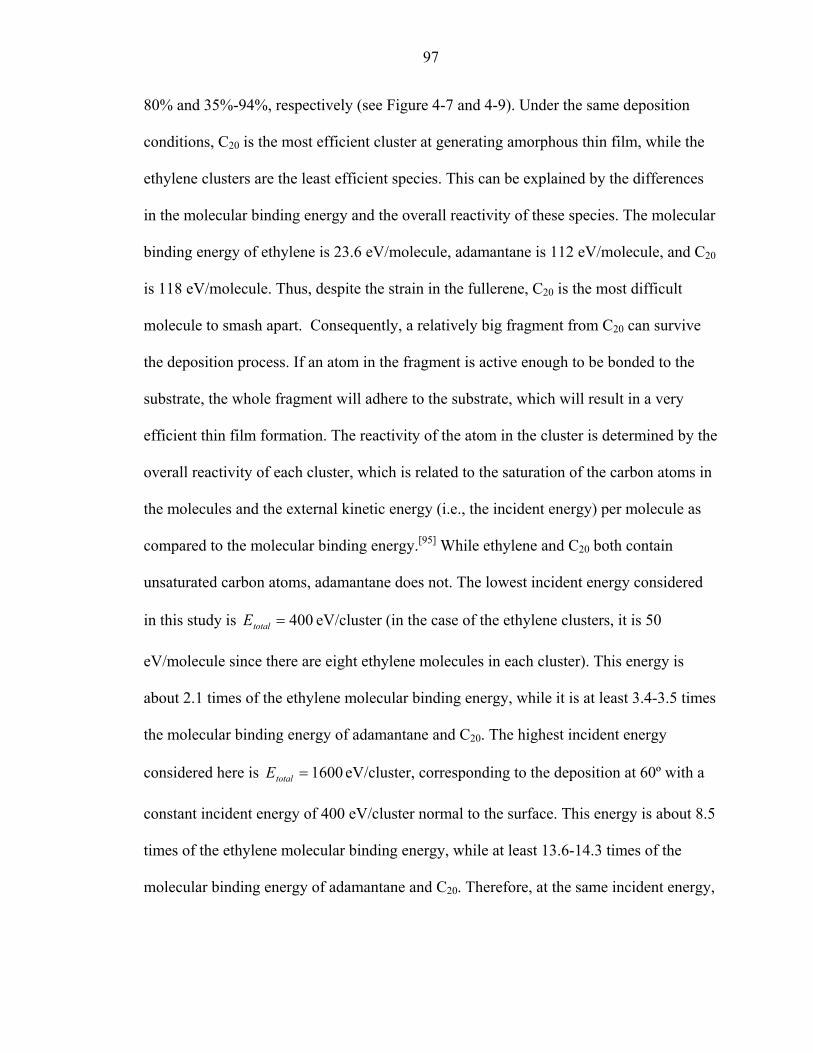
97
80% and 35%-94%, respectively (see Figure 4-7 and 4-9). Under the same deposition
conditions, C20 is the most efficient cluster at generating amorphous thin film, while the
ethylene clusters are the least efficient species. This can be explained by the differences
in the molecular binding energy and the overall reactivity of these species. The molecular
binding energy of ethylene is 23.6 eV/molecule, adamantane is 112 eV/molecule, and C20
is 118 eV/molecule. Thus, despite the strain in the fullerene, C20 is the most difficult
molecule to smash apart. Consequently, a relatively big fragment from C20 can survive
the deposition process. If an atom in the fragment is active enough to be bonded to the
substrate, the whole fragment will adhere to the substrate, which will result in a very
efficient thin film formation. The reactivity of the atom in the cluster is determined by the
overall reactivity of each cluster, which is related to the saturation of the carbon atoms in
the molecules and the external kinetic energy (i.e., the incident energy) per molecule as
compared to the molecular binding energy.[95] While ethylene and C20 both contain
unsaturated carbon atoms, adamantane does not. The lowest incident energy considered
in this study is 400=totalE eV/cluster (in the case of the ethylene clusters, it is 50
eV/molecule since there are eight ethylene molecules in each cluster). This energy is
about 2.1 times of the ethylene molecular binding energy, while it is at least 3.4-3.5 times
the molecular binding energy of adamantane and C20. The highest incident energy
considered here is 1600=totalE eV/cluster, corresponding to the deposition at 60º with a
constant incident energy of 400 eV/cluster normal to the surface. This energy is about 8.5
times of the ethylene molecular binding energy, while at least 13.6-14.3 times of the
molecular binding energy of adamantane and C20. Therefore, at the same incident energy,

98
the atom in C20 appears to be the most reactive atom. In other words, C20 is the most
efficient species for thin film generation.
More differences can be found by studying the change of the adhesion percentage
with the incident angle and energy. When the incident energy normal to the surface is 400
eV/cluster, the total incident energy is about 428 eV/cluster at 15º, 800 eV/cluster at 45º
and 1600 eV/cluster at 60º. So the energy considered for 15º depositions does not change
a lot (400 eV/cluster vs. 428 eV/cluster). That is why all three species show similar
amounts of adhesion at 15º when the depositions occur at the two sets of deposition
energies. However, the total incident energy is enhanced dramatically at 45º and 60º
when the energy is kept at 400 eV/cluster normal to the surface. At these large angles, as
expected, ethylene cluster beams produce significantly higher adhesion when the incident
energy is higher (see Figure 4-4) because the ethylene atoms are more reactive at high
energy. However, adamantane beams do not show such an increase at 45º, but do have an
improvement in the adhesion at 60º when the deposition occurs at an incident energy of
400 eV/cluster normal to the surface (Figure 4-7). While at both 45º and 60º, C20 beams
generate comparable amount of adhesion at the two sets of incident energies considered,
as shown in Figure 4-9. One possible explanation is that if the external kinetic energy is
already high enough to break the molecule(s) in the cluster when it is converted into
internal kinetic energy upon deposition, the increase in external kinetic energy won’t help
to improve the overall reactivity of the cluster molecule(s) even more. Therefore, the
number of reactions and the amount of adhesion will not increase. In other words, there
exists an optimal incident energy that will result in the highest overall reactivity of the
cluster molecule, which in turn will result in the greatest amount of adhesion. From the

99
results of this study, this optimal incident energy depends on not only the species but also
the incident angle.
The simulations of Tang et al. predicted a strong dependence of the deposition
result on the initial orientation of the incident species in the C60-surface collisions.[112]
The solid surface they used is a structureless wall. Thus, this orientation dependence was
expected to persist or even intensify when a structured surface was used. While in our
study, the depositions of all the three cluster beams on the diamond (111) surface along
different orientations result in thin films that are not significantly different from one
another. However, this result is not considered to be contrary to Tang’s conclusion,
because the species used here are deposited in a beam of twenty randomly oriented
clusters, whereas Tang et al. deposited only one C60 molecule at a time. Therefore, in our
simulations, any possible orientation effects due to the structure of the incident species
have been averaged out.
4.4 Conclusions
Classical molecular dynamics simulations have been used to examine the thin film
formation through the deposition of cluster beams of ethylene, adamantane, and C20 on
hydrogen-terminated diamond (111) surface. These results have been reported
recently.[269, 270] In summary, during the deposition, the incident species undergo rapid
chemical reactions that lead to thin-film formation and surface sputtering. C20 is the most
reactive species among the three, and therefore, the C20 beam is found to be most
efficient at producing thin film. The molecular cluster beam of ethylene is the least
efficient species. The resultant thin film is essentially amorphous with the majority of
carbon atoms sp2-hybridized and connected in a linear manner. Despite the differences in
the chemical bonding in the three incident clusters, the structure of the resultant thin film

100
is predicted to be similar. The effects of incident angle and the incident energy are also
documented. In general, increasing the angle causes the amount of thin film nucleation to
decrease. However, the incident angle doesn’t affect the film structure. Deposition along
various crystallographic orientations is not found to have significant effect on the results.
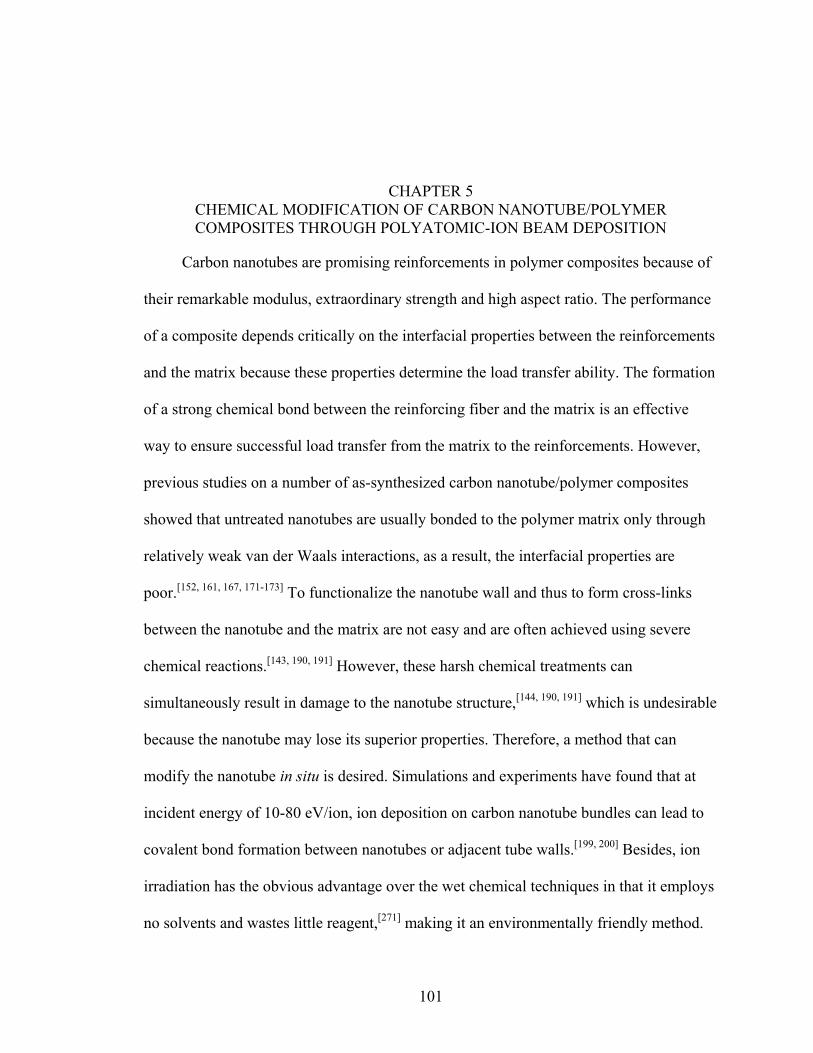
101
CHAPTER 5 CHEMICAL MODIFICATION OF CARBON NANOTUBE/POLYMER COMPOSITES THROUGH POLYATOMIC-ION BEAM DEPOSITION
Carbon nanotubes are promising reinforcements in polymer composites because of
their remarkable modulus, extraordinary strength and high aspect ratio. The performance
of a composite depends critically on the interfacial properties between the reinforcements
and the matrix because these properties determine the load transfer ability. The formation
of a strong chemical bond between the reinforcing fiber and the matrix is an effective
way to ensure successful load transfer from the matrix to the reinforcements. However,
previous studies on a number of as-synthesized carbon nanotube/polymer composites
showed that untreated nanotubes are usually bonded to the polymer matrix only through
relatively weak van der Waals interactions, as a result, the interfacial properties are
poor.[152, 161, 167, 171-173] To functionalize the nanotube wall and thus to form cross-links
between the nanotube and the matrix are not easy and are often achieved using severe
chemical reactions.[143, 190, 191] However, these harsh chemical treatments can
simultaneously result in damage to the nanotube structure,[144, 190, 191] which is undesirable
because the nanotube may lose its superior properties. Therefore, a method that can
modify the nanotube in situ is desired. Simulations and experiments have found that at
incident energy of 10-80 eV/ion, ion deposition on carbon nanotube bundles can lead to
covalent bond formation between nanotubes or adjacent tube walls.[199, 200] Besides, ion
irradiation has the obvious advantage over the wet chemical techniques in that it employs
no solvents and wastes little reagent,[271] making it an environmentally friendly method.

102
These previous investigations suggest that ion irradiation of the carbon nanotube-
containing composites would be a possible way to form strong chemical bond between
the tubes and matrix without pretreating the nanotubes. Therefore, molecular dynamics
simulations are used in this study to examine the in situ chemical modification of carbon
nanotube/polystyrene composites through the deposition of an energetic C3F5+ beam at
room temperature (300 K).
5.1 Simulation Details
The second generation many-body reactive empirical bond order (REBO) potential
developed from Abell-Tersoff potential and parameterized by Brenner et al. for
hydrocarbon systems[211] and Sinnott et al. for C-F-H systems[272] is used to describe the
intramolecular interactions in the ions, nanotubes, polymer chains, and cross-links. The
long-range van der Waals interactions are considered by coupling the short-ranged REBO
potential with the Lennard-Jones (LJ) potential.[2] REBO potential does not allow for
charging of the atoms. Instead, the potential treats the ions as neutral radicals, as is
traditionally done in classical MD simulations with empirical potentials.[4] It is
recognized that charge may influence the chemical reactions that occur on deposition.
However, it should also be noted that in experiments, the ions would be rapidly
neutralized as they approach the substrate due to the existence of background gas or the
use of the electron current to avoid ion beam induced charging of the substrate.[271, 273]
This is believed to be especially true for hyperthermal (1-500 eV) and higher incident ion
energies.[271] This approach has been applied to model the related processes of ion
bombardment of polymer surfaces[274, 275] and carbon nanotube bundles[199, 200] with
considerable success.

103
The polymer matrix considered is polystyrene (PS) because it is among the
polymers used to make nanotube/polymer composites in experiments[172, 173] due to its
well-known properties, structural simplicity, and good processability.[172] A (10, 10)
SWNT is embedded in the polymer. This nanotube has a diameter of approximately 1.4
nm, the diameter of a typical nanotube synthesized in the laser-vaporization of
graphite.[130] The (10, 10) SWNTs are also believed to be the predominant constituents of
nanotube ropes produced by the electric arc technique using a catalyst.[131]
A 3.0 nm long carbon nanotube (CNT) is introduced into the polymer matrix at the
center but is embedded at varying depths. The polymer chains are parallel to the nanotube
axis, as shown in Figure 5-1(a). This type of composite structure is made by replacing an
appropriate number of polymer chains with the nanotube. The system contains 480
carbon atoms in the nanotube, and 59-60 polystyrene chains. The physical dimensions of
the composite substrate are 8.0 nm × 5.7 nm × 3.0 nm. Periodic boundary conditions are
applied only in the direction of the nanotube axis, which is also the direction of polymer
chains. Thus, this model mimics an infinitely long CNT embedded in long chains of PS.
In order to determine the possible influence of the nanotube on the ion beam deposition
results, a pristine PS substrate of the same dimensions is used.
Another nanotube reinforced composite structure with the polymer chains
perpendicular to the nanotube axis (Figure 5-1(b)) is also considered. This type of
composite structure is made by replacing a number of polymer segments with the
nanotube. The physical dimensions are 5.3 nm × 5.7 nm × 4.6 nm. This system contains a
4.6 nm long nanotube with 840 carbon atoms, and 88 PS chains. Both the nanotube and
the polymer chains are infinitely long with periodic boundary conditions applied in both

104
directions of the nanotube axis and the polymer chains. For simplicity, hereafter, the
composite structure with the nanotube parallel to the polymer chains is denoted as
CNT/PS-//, and the structure with the nanotube perpendicular to the polymer chains is
CNT/PS-⊥.
Figure 5-1. The composite structures before ion deposition (only parts of the systems are shown for clarity). (a) Carbon nanotube axis parallel to the polymer chains (CNT/PS-//); (b) Carbon nanotube axis perpendicular to the polymer chains (CNT/PS-⊥).
As displayed in Figure 5-1, the simulations performed here model the ideal
situations where the polystyrene matrix has a crystalline structure. It should be noted that
amorphous PS other than crystalline PS is most often used experimentally. Therefore,
random orientations of the CNT relative to the polymer chains are expected in real
experiments. The two orientations considered in this simulation study thus only represent
two simple cases out of the numerous situations. It is expected that reasonable predictions
would be derived for an amorphous polymer matrix from the results of the deposition on
these two CNT-containing composite structures.
For each composite structure, the carbon nanotube is surrounded by the matrix at
varying depths to examine the dependence of the modification effects on the location of
the nanotube relative to the top of the surface. Three cases are considered. The shallowest
(a) (b)
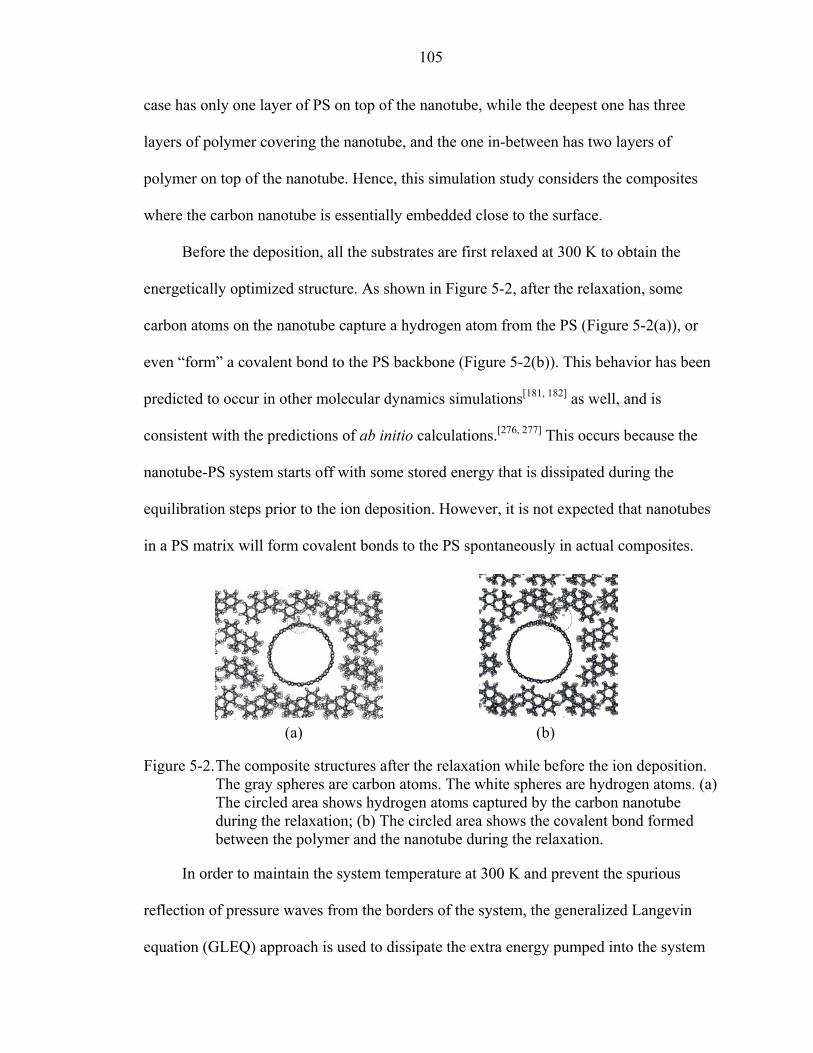
105
case has only one layer of PS on top of the nanotube, while the deepest one has three
layers of polymer covering the nanotube, and the one in-between has two layers of
polymer on top of the nanotube. Hence, this simulation study considers the composites
where the carbon nanotube is essentially embedded close to the surface.
Before the deposition, all the substrates are first relaxed at 300 K to obtain the
energetically optimized structure. As shown in Figure 5-2, after the relaxation, some
carbon atoms on the nanotube capture a hydrogen atom from the PS (Figure 5-2(a)), or
even “form” a covalent bond to the PS backbone (Figure 5-2(b)). This behavior has been
predicted to occur in other molecular dynamics simulations[181, 182] as well, and is
consistent with the predictions of ab initio calculations.[276, 277] This occurs because the
nanotube-PS system starts off with some stored energy that is dissipated during the
equilibration steps prior to the ion deposition. However, it is not expected that nanotubes
in a PS matrix will form covalent bonds to the PS spontaneously in actual composites.
Figure 5-2. The composite structures after the relaxation while before the ion deposition. The gray spheres are carbon atoms. The white spheres are hydrogen atoms. (a) The circled area shows hydrogen atoms captured by the carbon nanotube during the relaxation; (b) The circled area shows the covalent bond formed between the polymer and the nanotube during the relaxation.
In order to maintain the system temperature at 300 K and prevent the spurious
reflection of pressure waves from the borders of the system, the generalized Langevin
equation (GLEQ) approach is used to dissipate the extra energy pumped into the system
(a) (b)
106
after the deposition. That is, about two layers of the polymer from the bottom and the
atoms within 5-12 Å from the four slab edges have Langevin frictional force and the
associated random force applied. The other substrate atoms and the atoms in the ions do
not have any constraints and will be treated according to the interactomic potentials
described above.
Polyatomic ion deposition can transfer a relatively large concentration of atoms and
energy to a very localized region of the surface in a manner that is analogous to the
deposition of energetic clusters. Hence, it has higher efficiency to selectively modify the
surface region than single-atom ion deposition. Due to the technological importance of
surface fluorination, fluorocarbon ions are widely used to modify various substrates. The
C3F5+ ion is among the most prevalent ion species generated from many fluorocarbon
feed gases.[278-280] Therefore, in this simulation study, the ion beam containing 50 C3F5+
ions is considered. The C3F5+ ion has several isomers. A combined experimental and
simulation study on the effect of the C3F5+ ion structure during the ion deposition of
polymeric thin films suggested that most of the C3F5+ ions are at the ground state
structure, which is [CF2-CF-CF2]+.[274] Therefore, this ground state structure of C3F5+ is
used in our simulations. The ions are deposited on the substrate at random positions along
the surface normal because the normal impact leads to the most reactive collisions.[281] In
order to effectively functionalize the carbon nanotube, the ion beam is focused on the
area where the carbon nanoutube is embedded. Two incident energies of 50 eV/ion and
80 eV/ion are considered. Depending on the incident energy, there is a 2-3 ps time
interval between the impacts of any two consecutive depositing ions. In this way, the
substrate is allowed to equilibrate between deposition events, and thus well maintain the

107
system temperature. After the entire ion beam is deposited, the whole system is
equilibrated at a higher temperature of 400 K to accelerate the relaxation of the substrate
and allow the post-deposition reactions to happen.[274] Then the system is cooled back to
300 K until a steady state is reached. Throughout the whole simulations, 0.2 fs is used as
the time step.
5.2 Results
As the ion deposition process progresses, some incident ions dissociate into smaller
fragments (ion fragmentation) upon impact or react with each other. Some ions or ion
fragments react with the polymer chains, and some react with the embedded carbon
nanotube. These are called ion implantation. Other ions or ion fragments get trapped
within the polymer matrix but do not form bonds with the PS carbon atoms on the time
scales of these simulations. During the relaxation, some initially trapped ions or ion
fragments will diffuse out of the substrate and scatter away from the surface, especially at
a higher temperature.
Some polymer atoms are sputtered away by the incident ion, leaving an active spot
behind either to react with the ion or ion fragment, or, more importantly, to form cross-
links to the nanotube or between polymer chains. The original crystalline polymer
structure becomes amorphous. During the ion deposition, the carbon nanotube
experiences elastic deformation due to the ion impacts but then recovers its initial shape
during the equilibration, which can be explained by the remarkable flexibility of the
carbon nanotube in the direction perpendicular to the tube axis. Cross-links are predicted
to form between the polymer backbone and the nanotube either directly or through an
ion/ion fragment, depending on the incident energy and the composite structure. A typical
series of events is illustrated in Figure 5-3.

108
Figure 5-3. A series of snapshots during the ion beam deposition. (a) At time = 0.4 ps, the depostion of the first ion causes the covalent bond formed between the nanotube and the polymer (see the circled area); (b) At time = 2.2 ps, the deposition of the second ion has broken the covalent bond formed before (see the circled area); (c) At time = 2.4 ps, the covalent bond has formed again (see the circled area) and the ions are pushed away by the recovery of the carbon nanotube; (d) At time = 26.4 ps, an incident ion has hit right on the carbon nanotube and caused significant deformation of the nanotube; (e) At time = 26.6 ps, the ion is pushed away into the matrix by the rebounding action of the nanotube. (Black spheres are carbon atoms in the ion, dark gray spheres are fluorine atoms in the ion, light gray spheres are carbon atoms in the substrate, and white spheres are hydrogen atoms in the PS. The same color scheme is applied throughout this whole chapter.)
(a) (b) (c)
(d) (e)

109
5.2.1 C3F5+ Ion Beam Deposition on CNT/PS-// Composites
At the incident energy of 50 eV/ion, the simulations predict the carbon nanotube is
chemically functionalized after the deposition when there is only one layer of polymer
covering the embedded nanotube, as demonstrated in Figure 5-4(a). Covalent bonds are
formed between the nanotube and the polymer matrix. In addition, chemical adsorption of
some fluorine atoms and ions or ion fragments on the nanotube wall occurs. In the other
two cases where the nanotube is buried deeper, however, neither the formation of new
covalent bond between the polymer and the nanotube nor the implantation of ion or ion
fragments on the tube wall is observed, as shown in Figure 5-4(b) and (c). Nevertheless,
in all the three cases, the ion beam deposition leads to disorder within the PS matrix and
creating cross-links between PS chains near the surface.
Figure 5-4. The CNT/PS-// composites after the ion beam deposition at 50 eV/ion. (a) The substrate with one layer of polymer on top of the nanotube. (b) The substrate with two layers of polymer on top of the nanotube. (c) The substrate with three layers of polymer on top of the nanotube. (Compare this structure with Figure 5-2(b), where it shows the corresponding structure of CNT/PS-//-3 before the deposition, no new functionalization effects are shown after the depostion.)
Table 5-1 summarizes the results after the deposition of the 50 C3F5+ ions on these
CNT/PS-// composites at the incident energy of 50 eV/ion. In the table, the three
(a) (b) (c)

110
composite substrates are denoted as CNT/PS-//-1, CNT/PS-//-2 and CNT/PS-//-3,
referring to the composite with one, two and three layer(s) of polymer covering the
nanotube, respectively. As shown in the table, the substrate etching is almost negligible in
all the three cases. All the substrate etching comes from the polymer. No atom from the
embedded carbon nanotube is lost during the deposition. More than half of the incident
ions are scattered back into the vacuum after the deposition. However, among the trapped
C3F5+ ions, the amount of the intact ions, i.e., the ion still maintains its ground state
structure after the deposition, increases slightly with the increasing depth of the
embedded carbon nanotube. The average penetration depth ( d ) of the incident ions is
around 2 nm, and is more or less the same for all the three composites.
Table 5-1. Summary of the results after the ion beam deposition on CNT/PS-// composites at 50 eV/ion.
Functionalization of CNT Substrate etching
(# of C/ion)
Trapped C atoms from
ion (%)
# of intact C3F5
+ Chemical
adsorption of ion species
Cross-links between PS and CNT
d (nm)
CNT/PS-//-1 0.3 49.3 7 Yes Yes 1.8 CNT/PS-//-2 0.1 42.0 11 No No 1.9 CNT/PS-//-3 0.2 40.1 12 No No 2.2
Figure 5-5 demonstrates the chemical bonding status of those trapped ion and ion
fragments. This is of interest because it gives detailed information on the dissociation
reaction of the ions and how the ion or ion fragments react with each other or the
substrate atoms. This information can be compared with experimental XPS (X-ray
photoelectron spectroscopy) spectrum, which is usually used in surface science to
determine chemical composition and detect the change of the chemical environment of
the atom. As shown in these figures, the predominant ion species after the deposition at
50 eV/ion is C3F5, and most of the ion species remain unbonded.

111
Figure 5-5. The normalized chemical bonding information of the trapped ion species after the deposition on CNT/PS-// composites at 50 eV/ion. (a) CNT/PS-//-1; (b) CNT/PS-//-2; (c) CNT/PS-//-3.
Consistent with the results of ion irradiation of carbon nanotube bundles,[199, 200]
more significant chemical modification of the nanotube in the composites occurs at a
high incident energy of 80 eV/ion. The nanotube in CNT/PS-//-1 is the most easily
functionalized. More covalent bonds are formed between the nanotube and PS matrix,
and more ion species are chemically adsorbed than at 50 eV/ion, as shown in Figure 5-
6(a). At 80 eV/ion, both cross-link formation and the implantation of ion species on the
nanotube wall are observed in the composite where the nanotube is buried with two
C3F5 C2F2-3 CF2 F Others0
5
10
15
20
25
30
35
40
45
2.9
2.9
2.8
%
ion species
unbonded bonded to PS bonded to CNT
20.0
20.0
2.8
11.48.6
5.7
14.3
8.6
C3F5 C2F2-3 CF2 F Others0
5
10
15
20
25
30
35
40
45
50
%
ion species
unbonded bonded to PS bonded to CNT
37.9
10.4
6.93.5
3.413.8
24.1
C3F5 C2F2-3 CF2 F Others0
10
20
30
40
50
60
3.8
3.8
%
ion species
unbonded bonded to PS
46.3
11.5
3.87.8
11.5
11.5
(a) (b)
(c)

112
layers of polymer on top of it, as shown in Figure 5-6(b). Although no new bond is
created between the nanotube and the PS, the nanotube in CNT/PS-//-3 has captured a
fluorine atom (Figure 5-6(c)), which also demonstrates an improvement in the
functionalization efficiency at a high incident energy.
Figure 5-6. The CNT/PS-// composites after the depostion at 80 eV/ion. (a) CNT/PS-//-1; (b) CNT/PS-//-2; (c) CNT/PS-//-3.
Table 5-2. Summary of the results after the ion beam deposition on CNT/PS-// composites at 80 eV/ion.
Functionalization of CNT Substrate etching
(# of C/ion)
Trapped C atoms from
ion (%)
# of intact C3F5
+ Chemical
adsorption of ion species
Cross-links between PS and CNT
d (nm)
CNT/PS-//-1 1.2 37.3 4 Yes Yes 2.5 CNT/PS-//-2 1.2 38.7 1 Yes Yes 2.9 CNT/PS-//-3 1.3 54.7 5 Yes No 3.3
The results after the ion deposition at 80 eV/ion on CNT/PS-// composites are
summarized in Table 5-2. As compared with the results at 50 eV/ion (Table 5-1), the
substrate etching of the polymer matrix is an order of magnititude higher; the average
penetration depth of the ion is larger; while the number of intact C3F5+ ions is much less;
the percentage of the trapped ions is lower for both CNT/PS-//-1 and CNT/PS-//-2
composites at this high incident energy but not for the CNT/PS-//-3 composite. At 80
eV/ion, the predominent trapped ion species in all the three composites is CF2 instead of
C3F5, and more ion species are bonded to either the polymer chains or the nanotube, as
(a) (b) (c)
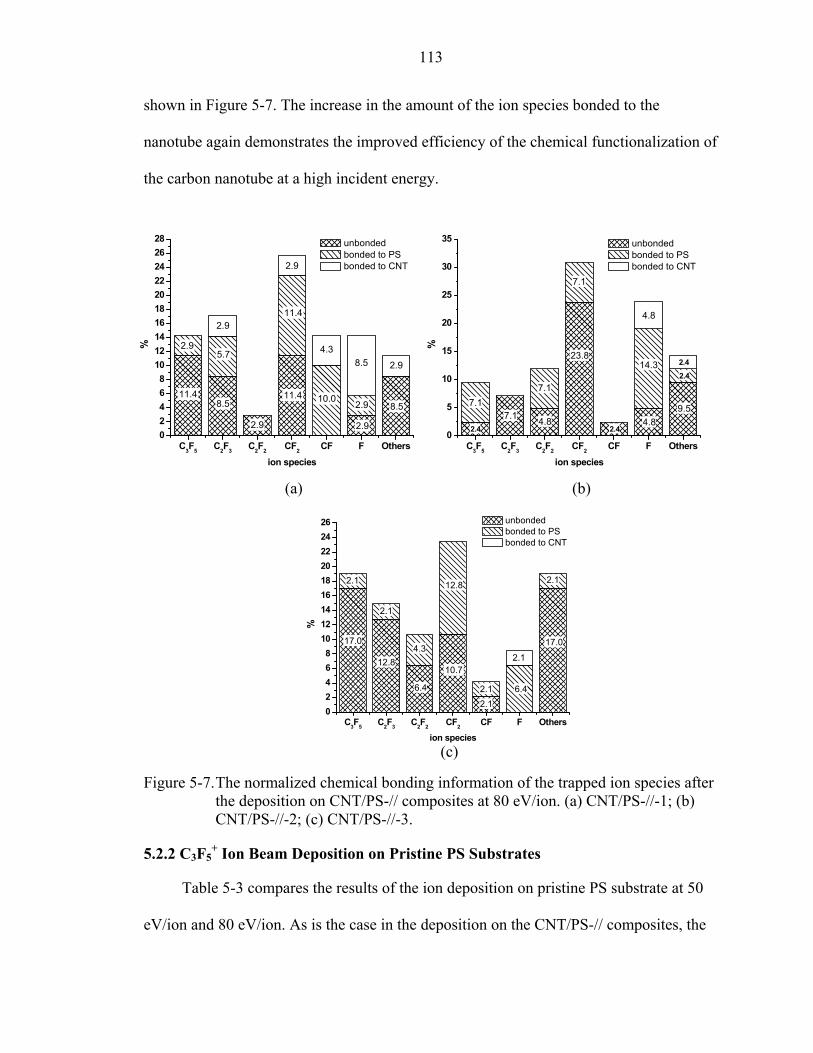
113
shown in Figure 5-7. The increase in the amount of the ion species bonded to the
nanotube again demonstrates the improved efficiency of the chemical functionalization of
the carbon nanotube at a high incident energy.
Figure 5-7. The normalized chemical bonding information of the trapped ion species after the deposition on CNT/PS-// composites at 80 eV/ion. (a) CNT/PS-//-1; (b) CNT/PS-//-2; (c) CNT/PS-//-3.
5.2.2 C3F5+ Ion Beam Deposition on Pristine PS Substrates
Table 5-3 compares the results of the ion deposition on pristine PS substrate at 50
eV/ion and 80 eV/ion. As is the case in the deposition on the CNT/PS-// composites, the
C3F5 C2F3 C2F2 CF2 CF F Others02468
10121416182022242628
8.5
2.9
2.9
%
ion species
unbonded bonded to PS bonded to CNT
11.4
2.9
8.5
5.7
2.9
2.9
11.4
11.4
2.9
10.0
4.38.5
2.9
(a) (b)
(c)
C3F5 C2F3 C2F2 CF2 CF F Others02468
101214161820222426
2.16.4
2.112.8
2.1
2.1
2.1
17.0
%
ion species
unbonded bonded to PS bonded to CNT
17.0
2.1
12.84.3
6.4
10.7
C3F5 C2F3 C2F2 CF2 CF F Others0
5
10
15
20
25
30
35
2.4
2.4
2.4
4.8
4.8
7.1
7.1
7.1
%
ion species
unbonded bonded to PS bonded to CNT
2.4
7.1
4.8
23.814.3
9.5

114
substrate etching effect is much higher and the ion can go deep at a high incident energy,
however, the number of intact ions and the amount of trapped incident ions are less. This
agrees with the increased reactivity of the incident ions at a high energy.
Table 5-3. Summary of the results after the ion beam deposition on pristine PS substrates at 50 eV/ion and 80 eV/ion.
Substrate etching (# of C/ion)
Trapped C atoms from ion (%)
# of intact C3F5
+ d
(nm) 50 eV/ion 0 63.3 13 2.1 80 eV/ion 2.0 40.7 3 2.8
In order to compare with the deposition results of the composites, the bonding
status of the trapped ion species within the pristine PS substrates is also analyzed, as
summarized in Figure 5-8. In agreement with what happens in the composites, at 50
eV/ion, the majority of the ion species is C3F5, and most of the ions or ion fragments
remain unbonded. In contrast, at a high energy of 80 eV/ion, the major ion species is CF2,
and the amount of bonded ion species increases.
Figure 5-8. The normalized chemical bonding information of the trapped ion species after the deposition on pristine PS substrates at (a) 50 eV/ion and (b) 80 eV/ion.
C3F5 C2F2-3 CF2 F Others0
5
10
15
20
25
30
35
40
45
50
17.57.5
%
ion species
unbonded bonded to PS
32.5
12.5
7.52.5
20.0
C3F5 C2F3 C2F2 CF2 CF F Others0
5
10
15
20
25
30
35
7.02.3
2.3
7.0
7.0
7.0
%
ion species
unbonded bonded to PS
7.0
2.3
25.6
4.7
11.6
16.2
(a) (b)

115
5.2.3 C3F5+ Ion Beam Deposition on CNT/PS-⊥ Composites∗
Figure 5-9. The CNT/PS-⊥ composites after the ion beam deposition at 50 eV/ion. (a) The substrate with one layer of polymer on top of the nanotube (CNT/PS-⊥-1). (b) The substrate with two layers of polymer on top of the nanotube (CNT/PS-⊥-2). (c) The substrate with three layers of polymer on top of the nanotube (CNT/PS-⊥-3).
As shown in Figure 5-1, there is more room around the embedded carbon nanotube
in the CNT/PS-⊥ composite structure than in the CNT/PS-// structure. Therefore, after
ion beam deposition on the CNT/PS-⊥ composite, the incident ions can gather around the
nanotube without being pushed back into the matrix once they pass through the polymer
layers, as indicated in Figure 5-9. It is the easiest for the carbon atoms in the nanotube to
react with the incident ions when there is only one layer of polymer covering the
nanotube (CNT/PS-⊥-1), which is analogous to what is predicted to occur for the
CNT/PS-// composites. At the incident energy of 50 eV/ion, although multiple
chemisorption of ion species on the carbon nanotube is predicted to occur in both
CNT/PS-⊥-1 and CNT/PS-⊥-2 composites, as demonstrated in Figure 5-9(a) and (b),
respectively, no covalent bond between the nanotube and the polymer matrix is predicted
to form between the nanotube and the polymer matrix. No sign of chemical
∗ Only the depositions at 50 eV/ion on CNT/PS-⊥ composites have been studied so far.
(a) (b) (c)
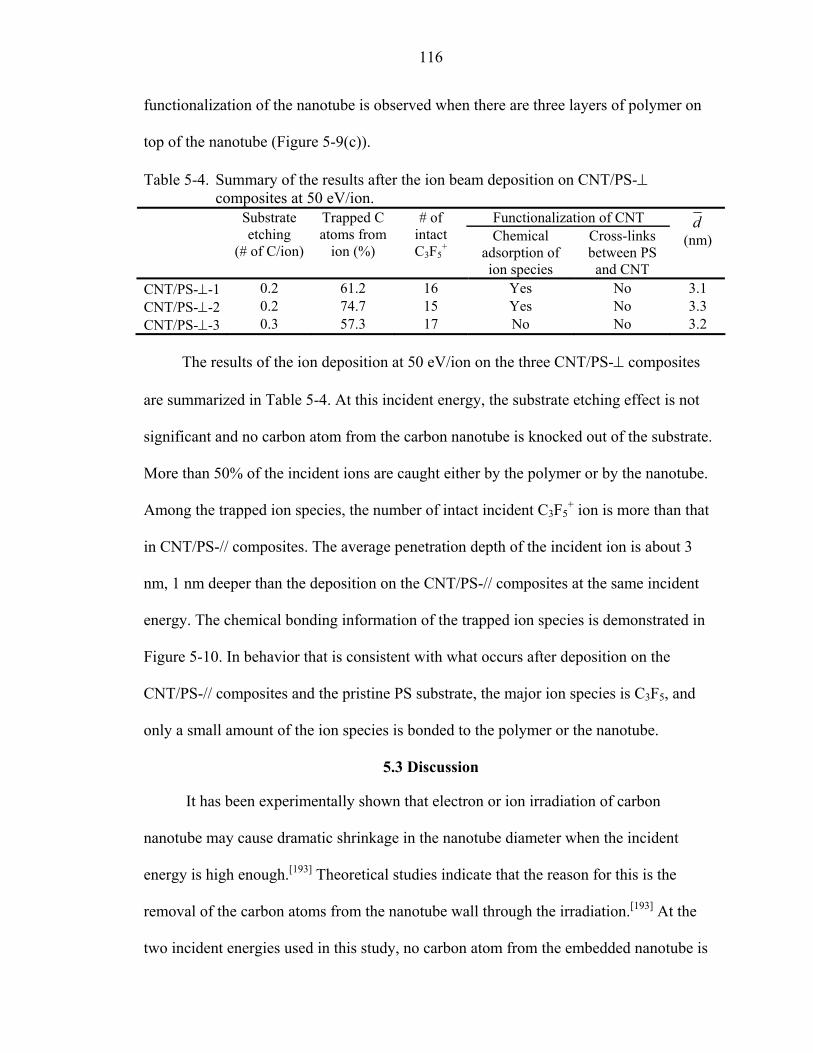
116
functionalization of the nanotube is observed when there are three layers of polymer on
top of the nanotube (Figure 5-9(c)).
Table 5-4. Summary of the results after the ion beam deposition on CNT/PS-⊥ composites at 50 eV/ion.
Functionalization of CNT Substrate etching
(# of C/ion)
Trapped C atoms from
ion (%)
# of intact C3F5
+ Chemical
adsorption of ion species
Cross-links between PS and CNT
d (nm)
CNT/PS-⊥-1 0.2 61.2 16 Yes No 3.1 CNT/PS-⊥-2 0.2 74.7 15 Yes No 3.3 CNT/PS-⊥-3 0.3 57.3 17 No No 3.2
The results of the ion deposition at 50 eV/ion on the three CNT/PS-⊥ composites
are summarized in Table 5-4. At this incident energy, the substrate etching effect is not
significant and no carbon atom from the carbon nanotube is knocked out of the substrate.
More than 50% of the incident ions are caught either by the polymer or by the nanotube.
Among the trapped ion species, the number of intact incident C3F5+ ion is more than that
in CNT/PS-// composites. The average penetration depth of the incident ion is about 3
nm, 1 nm deeper than the deposition on the CNT/PS-// composites at the same incident
energy. The chemical bonding information of the trapped ion species is demonstrated in
Figure 5-10. In behavior that is consistent with what occurs after deposition on the
CNT/PS-// composites and the pristine PS substrate, the major ion species is C3F5, and
only a small amount of the ion species is bonded to the polymer or the nanotube.
5.3 Discussion
It has been experimentally shown that electron or ion irradiation of carbon
nanotube may cause dramatic shrinkage in the nanotube diameter when the incident
energy is high enough.[193] Theoretical studies indicate that the reason for this is the
removal of the carbon atoms from the nanotube wall through the irradiation.[193] At the
two incident energies used in this study, no carbon atom from the embedded nanotube is
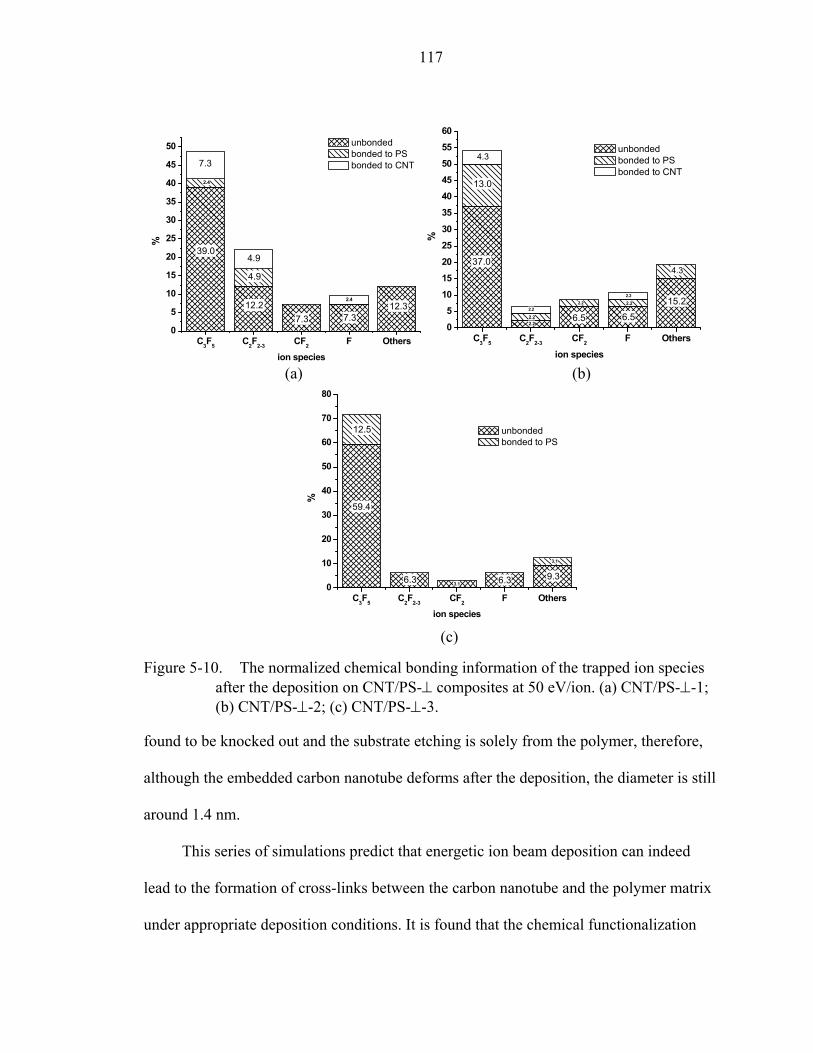
117
Figure 5-10. The normalized chemical bonding information of the trapped ion species after the deposition on CNT/PS-⊥ composites at 50 eV/ion. (a) CNT/PS-⊥-1; (b) CNT/PS-⊥-2; (c) CNT/PS-⊥-3.
found to be knocked out and the substrate etching is solely from the polymer, therefore,
although the embedded carbon nanotube deforms after the deposition, the diameter is still
around 1.4 nm.
This series of simulations predict that energetic ion beam deposition can indeed
lead to the formation of cross-links between the carbon nanotube and the polymer matrix
under appropriate deposition conditions. It is found that the chemical functionalization
C3F5 C2F2-3 CF2 F Others0
10
20
30
40
50
60
70
80
3.1
3.19.36.36.3
12.5
%
ion species
unbonded bonded to PS
59.4
C3F5 C2F2-3 CF2 F Others0
5
10
15
20
25
30
35
40
45
50
4.9
12.37.37.3
2.4
%
ion species
unbonded bonded to PS bonded to CNT
39.0
2.4
7.3
12.2
4.9
C3F5 C2F2-3 CF2 F Others0
510
15
20
25
30
35
4045
50
55
60
2.22.2
4.3
2.2
2.22.2
2.215.2
6.5
%
ion species
unbonded bonded to PS bonded to CNT
4.3
13.0
37.0
6.5
(b) (a)
(c)
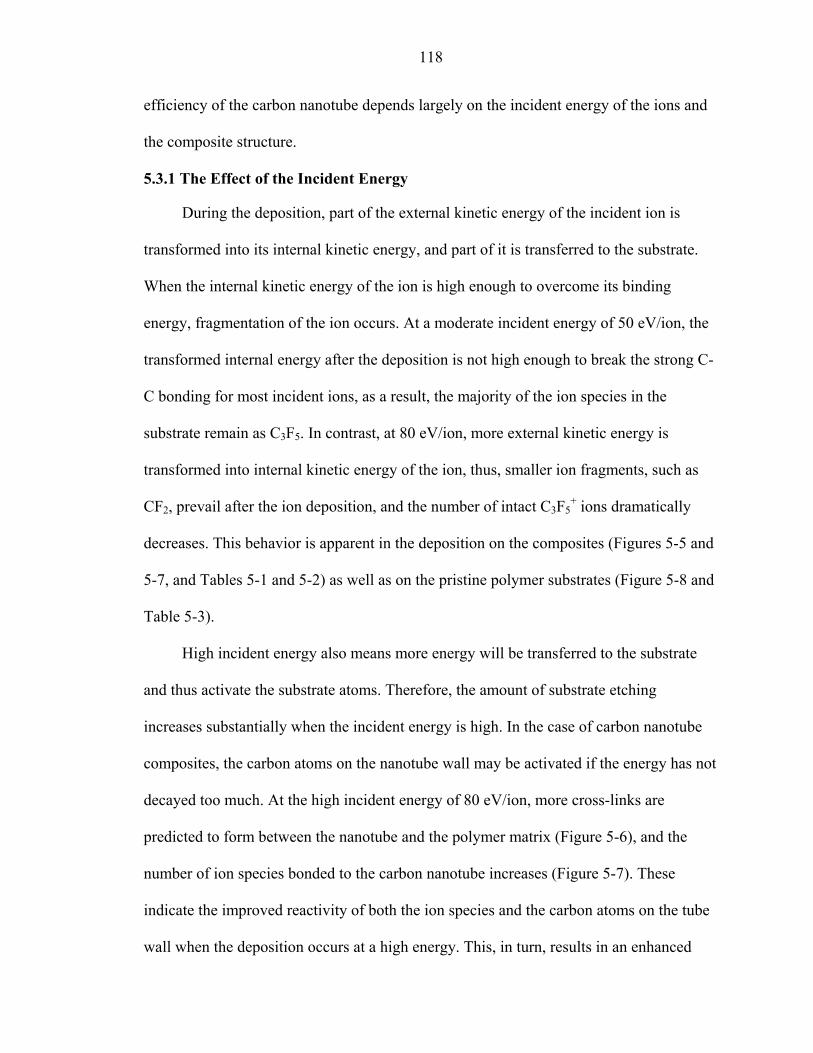
118
efficiency of the carbon nanotube depends largely on the incident energy of the ions and
the composite structure.
5.3.1 The Effect of the Incident Energy
During the deposition, part of the external kinetic energy of the incident ion is
transformed into its internal kinetic energy, and part of it is transferred to the substrate.
When the internal kinetic energy of the ion is high enough to overcome its binding
energy, fragmentation of the ion occurs. At a moderate incident energy of 50 eV/ion, the
transformed internal energy after the deposition is not high enough to break the strong C-
C bonding for most incident ions, as a result, the majority of the ion species in the
substrate remain as C3F5. In contrast, at 80 eV/ion, more external kinetic energy is
transformed into internal kinetic energy of the ion, thus, smaller ion fragments, such as
CF2, prevail after the ion deposition, and the number of intact C3F5+ ions dramatically
decreases. This behavior is apparent in the deposition on the composites (Figures 5-5 and
5-7, and Tables 5-1 and 5-2) as well as on the pristine polymer substrates (Figure 5-8 and
Table 5-3).
High incident energy also means more energy will be transferred to the substrate
and thus activate the substrate atoms. Therefore, the amount of substrate etching
increases substantially when the incident energy is high. In the case of carbon nanotube
composites, the carbon atoms on the nanotube wall may be activated if the energy has not
decayed too much. At the high incident energy of 80 eV/ion, more cross-links are
predicted to form between the nanotube and the polymer matrix (Figure 5-6), and the
number of ion species bonded to the carbon nanotube increases (Figure 5-7). These
indicate the improved reactivity of both the ion species and the carbon atoms on the tube
wall when the deposition occurs at a high energy. This, in turn, results in an enhanced
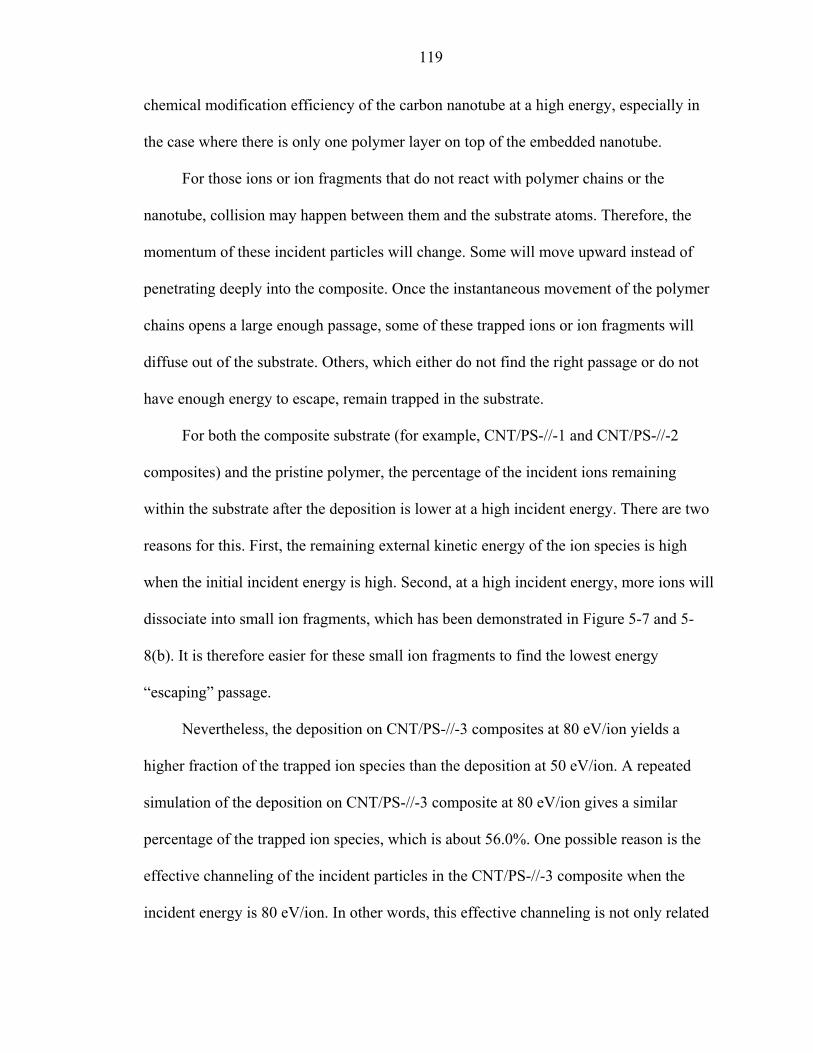
119
chemical modification efficiency of the carbon nanotube at a high energy, especially in
the case where there is only one polymer layer on top of the embedded nanotube.
For those ions or ion fragments that do not react with polymer chains or the
nanotube, collision may happen between them and the substrate atoms. Therefore, the
momentum of these incident particles will change. Some will move upward instead of
penetrating deeply into the composite. Once the instantaneous movement of the polymer
chains opens a large enough passage, some of these trapped ions or ion fragments will
diffuse out of the substrate. Others, which either do not find the right passage or do not
have enough energy to escape, remain trapped in the substrate.
For both the composite substrate (for example, CNT/PS-//-1 and CNT/PS-//-2
composites) and the pristine polymer, the percentage of the incident ions remaining
within the substrate after the deposition is lower at a high incident energy. There are two
reasons for this. First, the remaining external kinetic energy of the ion species is high
when the initial incident energy is high. Second, at a high incident energy, more ions will
dissociate into small ion fragments, which has been demonstrated in Figure 5-7 and 5-
8(b). It is therefore easier for these small ion fragments to find the lowest energy
“escaping” passage.
Nevertheless, the deposition on CNT/PS-//-3 composites at 80 eV/ion yields a
higher fraction of the trapped ion species than the deposition at 50 eV/ion. A repeated
simulation of the deposition on CNT/PS-//-3 composite at 80 eV/ion gives a similar
percentage of the trapped ion species, which is about 56.0%. One possible reason is the
effective channeling of the incident particles in the CNT/PS-//-3 composite when the
incident energy is 80 eV/ion. In other words, this effective channeling is not only related
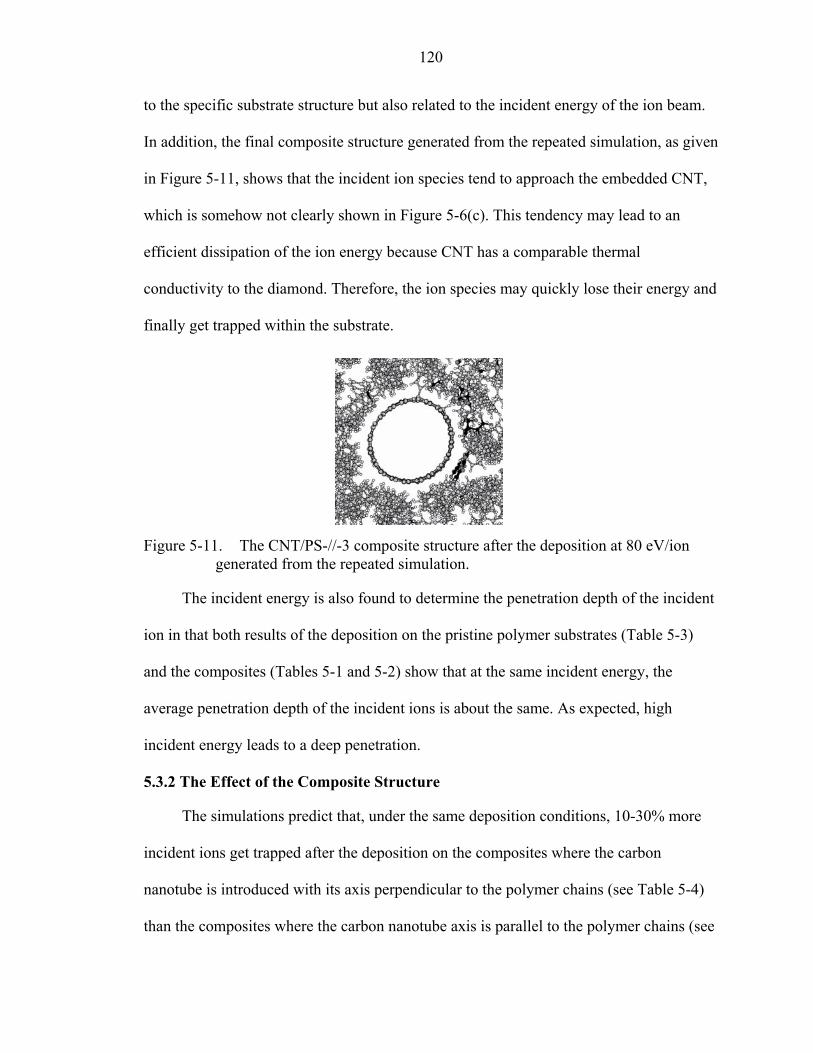
120
to the specific substrate structure but also related to the incident energy of the ion beam.
In addition, the final composite structure generated from the repeated simulation, as given
in Figure 5-11, shows that the incident ion species tend to approach the embedded CNT,
which is somehow not clearly shown in Figure 5-6(c). This tendency may lead to an
efficient dissipation of the ion energy because CNT has a comparable thermal
conductivity to the diamond. Therefore, the ion species may quickly lose their energy and
finally get trapped within the substrate.
Figure 5-11. The CNT/PS-//-3 composite structure after the deposition at 80 eV/ion generated from the repeated simulation.
The incident energy is also found to determine the penetration depth of the incident
ion in that both results of the deposition on the pristine polymer substrates (Table 5-3)
and the composites (Tables 5-1 and 5-2) show that at the same incident energy, the
average penetration depth of the incident ions is about the same. As expected, high
incident energy leads to a deep penetration.
5.3.2 The Effect of the Composite Structure
The simulations predict that, under the same deposition conditions, 10-30% more
incident ions get trapped after the deposition on the composites where the carbon
nanotube is introduced with its axis perpendicular to the polymer chains (see Table 5-4)
than the composites where the carbon nanotube axis is parallel to the polymer chains (see
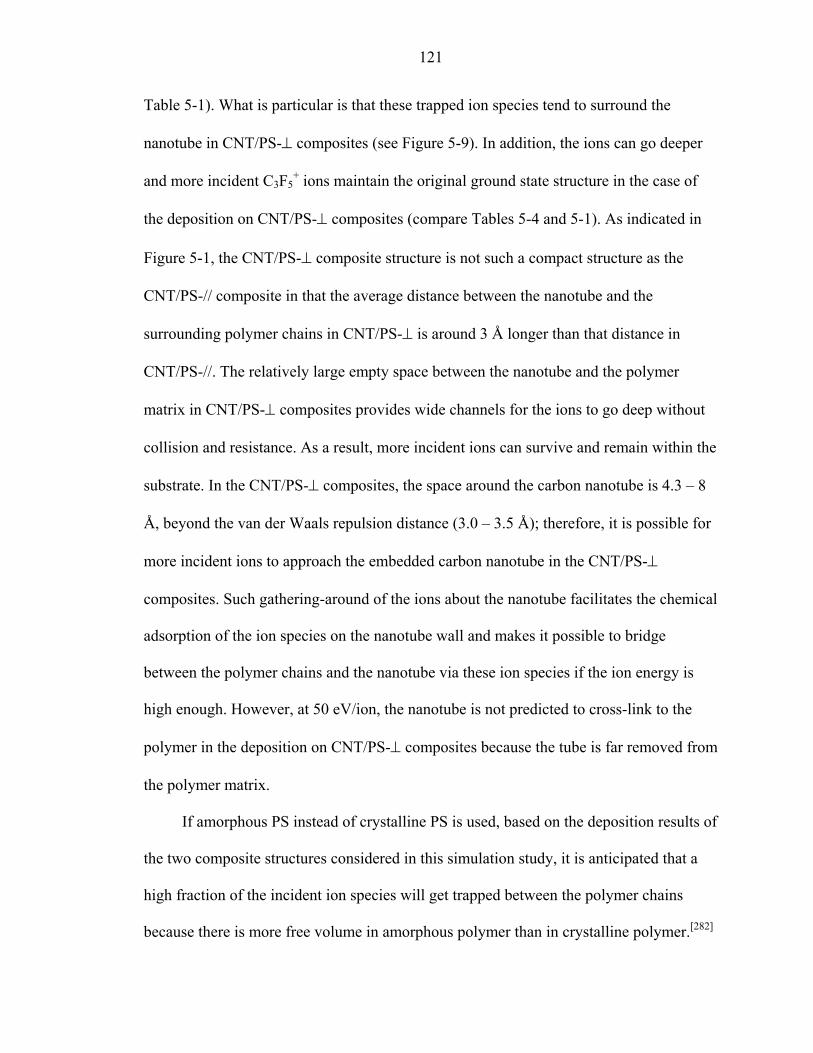
121
Table 5-1). What is particular is that these trapped ion species tend to surround the
nanotube in CNT/PS-⊥ composites (see Figure 5-9). In addition, the ions can go deeper
and more incident C3F5+ ions maintain the original ground state structure in the case of
the deposition on CNT/PS-⊥ composites (compare Tables 5-4 and 5-1). As indicated in
Figure 5-1, the CNT/PS-⊥ composite structure is not such a compact structure as the
CNT/PS-// composite in that the average distance between the nanotube and the
surrounding polymer chains in CNT/PS-⊥ is around 3 Å longer than that distance in
CNT/PS-//. The relatively large empty space between the nanotube and the polymer
matrix in CNT/PS-⊥ composites provides wide channels for the ions to go deep without
collision and resistance. As a result, more incident ions can survive and remain within the
substrate. In the CNT/PS-⊥ composites, the space around the carbon nanotube is 4.3 – 8
Å, beyond the van der Waals repulsion distance (3.0 – 3.5 Å); therefore, it is possible for
more incident ions to approach the embedded carbon nanotube in the CNT/PS-⊥
composites. Such gathering-around of the ions about the nanotube facilitates the chemical
adsorption of the ion species on the nanotube wall and makes it possible to bridge
between the polymer chains and the nanotube via these ion species if the ion energy is
high enough. However, at 50 eV/ion, the nanotube is not predicted to cross-link to the
polymer in the deposition on CNT/PS-⊥ composites because the tube is far removed from
the polymer matrix.
If amorphous PS instead of crystalline PS is used, based on the deposition results of
the two composite structures considered in this simulation study, it is anticipated that a
high fraction of the incident ion species will get trapped between the polymer chains
because there is more free volume in amorphous polymer than in crystalline polymer.[282]

122
On the other hand, the large empty space around the embedded nanotube as shown in
Figure 5-1 may be filled with polymer chains if the polymer matrix is amorphous. In
other words, the embedded CNT could be close to the surrounding polymer; therefore, it
might become even more likely to induce the formation of cross-links between the
nanotube and the amorphous polymer matrix after the ion beam deposition.
The depositions on composites with the carbon nanotube embedded at varying
depths show a clear dependence of the functionalization efficiency on the location of the
nanotube within the matrix relative to the top of the surface. Figure 5-12 plots the fraction
of the functionalized carbon atoms on the carbon nanotube wall as a function of the depth
under various deposition conditions. Obviously, it is difficult to modify the carbon
nanotube when it is buried deep within the matrix because of the rapid energy decay.
Figure 5-12. The fraction of functionalized carbon atoms in the carbon nanotube embedded at varying depths.
In this study, once the carbon atom on the nanotube wall gets functionalized, it
typically changes from sp2 hybridization to sp3 hybridization either from the attachment
6 8 10 12 14 16 18 20 22 24 26
0.00.20.40.60.81.01.21.41.61.82.02.22.42.6
CNT/PS- at 50 eV/ion
CNT/PS-// at 50 eV/ion
func
tiona
lized
car
bon
atom
sin
CN
T (%
)
depth (angstrom)
CNT/PS-// at 80 eV/ion

123
of ion species or by forming cross-links to the polymer chains. Although there is no
damage to the nanotube wall, such as the creation of vacancy, predicted at the energy
level used here, the change of the hybridization does introduce local deformation since
the local bond length changes from 0.14 nm to 0.15 nm[200] and the bond angle
approaches the tetrahedral angle.[243] It is of concern that such “defects” on the tube wall
may destroy the desirable mechanical properties of the carbon nanotube to be used as the
reinforcement. A previous computational work by Garg and Sinnott showed that if the
fraction of the rehybridized carbon atoms in a (10,10) tube is about 5.2%, the
functionalization would decrease the stiffness of the nanotube by 15%.[223] However, if
the introduction of the functionalized carbon is less than 1%, the change in tensile
strength of the nanotube is negligible.[182] Unfortunately, it is still an open question as to
the upper limit of rehybridized carbon atoms that would not induce a significant
reduction in the mechanical properties of carbon nanotube. The highest functionalization
probability given in Figure 5-12 is about 2.5%, but in most cases, the fraction is less than
1%. Therefore, it is expected that the functionalized carbon nanotube obtained after the
ion beam deposition in this study still possesses its remarkable mechanical properties.
5.3.3 Comparison between Pristine Polymer Substrates and Composites
A recent experimental study has compared the surface modification of CNT/PAN
(polyacrylonitrile) composite films and pure PAN films by proton beam
bombardment.[283] This study indicated that the introduction of CNT would influence
both the chemical and structural modifications induced by the proton. Similar results are
obtained from our simulations of ion beam bombardment on CNT/PS composites and
pristine PS substrates. Due to the presence of the carbon nanotube, some phenomena that
occur in the composites are different from what happens in the pristine polymer, although
124
ion depositions on pristine PS substrates and the composites also display similar
behavior, such as the strong dependence of the modification efficiency on the incident
energy.
As summarized in Tables 5-1, 5-2 and 5-3, if the deposition results of CNT/PS-//
composites and pristine PS substrates are compared, the overall trapped ion percentage is
found to be lower in the carbon nanotube composites than in the pristine polymer at the
same incident energy: 10-20% lower in the case of the deposition at 50 eV/ion and ~5%
lower in the case of the deposition at 80 eV/ion (except the CNT/PS-//-3 composite). In
the CNT/PS-// composites, several polymer chains are replaced by the CNT. Although
small ion species can find room between the polymer chains, as what happens in the
pristine polymer substrates, their capability to penetrate into the CNT is limited if the
incident energy is not high enough. In fact, at both 50 eV/ion and 80 eV/ion, no ion or ion
fragment is found inside of the CNT in this study. Therefore, the replacement of the
polymer chains by the nanotube practically excludes a considerable area for possible ion
penetration, which results in a lower percentage of trapped ions in the composites.
However, it is noted that the depositions on CNT/PS-⊥ composites at 50 eV/ion actually
have comparable trapped ion percentages to the pristine polymer substrate. As discussed
in Section 5.3.2, the reason is the channeling effect due to the available space around the
CNT in CNT/PS-⊥ composite structure, which essentially compensates for the excluded
area enclosed by the CNT.
As the simulations indicate, all the substrate etching comes from the top several
layers of polymer. Although the substrate etching depends mainly on the incident energy,
the presence of carbon nanotube is also found to affect this property especially at a

125
relatively high incident energy. As indicated in Table 5-2 and Table 5-3, at 80 eV/ion, the
amount of the substrate etching in the pristine polymer substrate is about 1.7 times as
much as that in the CNT/PS-// composites. The lower substrate etching in the composites
can find explanations from the remarkable thermal properties of the carbon nanotube.
The high thermal conductivity of the carbon nanotube facilitates the effective dissipation
of the energy; consequently, fewer substrate atoms in the composites will gain high
enough energy to sputter away from the surface.
5.4 Conclusions
In composite materials, cross-links between the reinforcements and the matrix will
improve the load transfer capability between these two phases. This computational study
has demonstrated that when the reinforcing carbon nanotube is embedded close to the
surface, polyatomic ion beam deposition at incident energies of 50-80 eV/ion can induce
the formation of cross-links between the otherwise unfunctionalized carbon nanotube and
the polymer matrix without too much damage to the original composite structure. It thus
encourages experimental trials using the energetic ion beam deposition or related
techniques to effectively harness the outstanding mechanical properties of the carbon
nanotube to produce high-performance composite materials. However, due to the rapid
energy decay within the substrate, this technique may only be effective at surface
modification. The simulations predict the favorable conditions for efficient chemical
functionalization of the carbon nanotube, such as high incident energy and compact
composite structure in which the reinforcing carbon nanotube is close enough to the
matrix. It has also shown that the response of a carbon nanotube/PS composite to ion
beam deposition is different from the response of a pristine PS substrate. The simulations
126
reveal the atomic-scale mechanisms that are responsible for these differences. Part of
these results have been reported in Reference [284].[284]
Since this simulation study is highly computationally intensive, only one trajectory
has been carried out for most substrates. It is recognized that the reported quantitative
results may lack the statistical reliability, however, the qualitative predictions, which are
the major focus of this study, are believed to be correct.
127
CHAPTER 6 CONCLUSIONS AND BEYOND
6.1 General Conclusions
The collision of energetic particles and solid surfaces is one of the most interesting
topics in the area of particle-surface interactions. Such techniques include plasma
deposition, laser ablation, chemical vapor deposition, cluster beam deposition, and ion
beam deposition. Depending on the deposition conditions, a wide range of phenomena
can be found, such as implantation, fragmentation, surface sputtering, surface cleaning,
phase transition, and, more significantly, impact-induced chemical reactions within the
incident species as well as between the incident particle and the surface. Such techniques
are widely used to generate thin films and have also found promising application in
surface modification. Undoubtedly, experimental studies in this field have improved our
understanding of how the changes in deposition method, starting material, and impact
conditions influence the results. However, the atomistic mechanisms of the process are
not easily obtained from the experimental data and there is much that is not well
understood about the process of thin film nucleation and surface modification. In this
respect, molecular dynamics simulations provide a powerful and complementary tool to
the experimental findings. Particle-surface collisions are especially suitable for study by
MD simulations because this process typically occurs within a few picoseconds.
In this dissertation, thin film formation through the deposition of organic cluster
beams and the impact induced chemical functionalization of carbon nanotube/polystyrene
composites via polyatomic ion beam deposition are investigated using MD simulations.

128
In the simulations, the interatomic forces are calculated from the reactive empirical
bond-order (REBO) potential coupled with the long-range Lennard-Jones potential. The
REBO potential allows covalent bond breaking and reforming with associated changes in
atomic hybridization. This is crucial for a realistic treatment of organic chemical
reactions in an empirical approach. The REBO potential has been shown to be quite good
at characterizing reactive processes involving thousands of atoms, but it is not able to
describe processes that depend on the explicit and self-consistent inclusion of electrons.
These elements, however, are considered in the tight-binding approach, which thus gives
more accurate quantitative results than the empirical schemes. In order to obtain a better
knowledge of the reliability of the REBO potential to describe the energetic particle-
surface collisions, the deposition of hydrocarbon clusters on diamond surfaces is first
modeled using both the REBO potential and the order-N nonorthogonal tight-binding
(O(N)/NOTB) method of Jayanthi, Wu, et al. The quantitative results of these two
methods do not agree perfectly well with each other. The differences in the predictions
indicate that as compared to the NOTB Hamiltonian, the REBO potential predicts a
higher repulsive barrier, and hence may not be sufficiently flexible to describe all the
relevant processes of bond-breaking and bond-forming. However, the qualitative
predictions are comparable. Therefore, this comparison study shows that the REBO
potential does indeed capture the general characters of carbon-based chemistry.
For constant temperature simulations, appropriate temperature control methods that
can effectively dissipate the extra energy must be incorporated in the simulation. One
specific role played by these temperature control methods in modeling particle-surface
collisions is to absorb the wave reflected from the boundary of the simulation system. In
129
this dissertation, four temperature control methods are investigated in simulations of
carbon cluster deposition. These four methods are the generalized Langevin equation
(GLEQ) approach, the Berendsen method, a modified GLEQ approach where an extra
damping mechanism is introduced, and a combined thermostat of the GLEQ approach
and the Berendsen method. The temperature control capability and the effectiveness to
reduce the amplitude of the reflected wave of these methods are compared and discussed.
Among the four, the Berendsen method is effective at removing the excess energy at the
early stage but the resultant equilibrium properties are not always optimum. It is found
that the realistic performances of these methods depend on the cluster incident energy
and the substrate size in the simulation. If the substrate is big enough and the incident
energy is not too high, the GLEQ approach is sufficient for removal of excess energy.
However, the modified GLEQ approach and the combined thermostat perform better than
the regular GLEQ approach and the Berendsen method when the incident energy is high.
Collisions between clusters and solid surfaces can produce high quality thin films
with various predetermined properties when the deposition conditions are carefully
chosen. Our group has previously used MD simulations to examine the deposition of
organic molecular clusters of ethane, ethylene, acetylene, and adamantane on diamond
surfaces.[95-105] The chemical reactions among the incident molecules and between the
impact cluster and the surface have been studied. Film nucleation and growth have been
shown to depend on deposition conditions such as molecular reactivity,[95, 96, 100, 102]
cluster size,[101] incident energy,[95, 96, 102] impact frequency,[97] surface reactivity,[98, 100]
and surface temperature.[100, 101] In this dissertation, MD simulations using the REBO
potential are performed to build on the previous studies and investigate thin film
130
generation from the deposition of beams of organic clusters with different intracluster
bondings. The cluster beams considered include a molecular cluster beam of ethylene
held together by van der Waals interactions, a beam of adamantane molecules held
together by pure sp3 covalent bonds, and a beam of C20 fullerenes held together by sp2
covalent bonds with distorted p-orbitals. In addition, the effects of cluster incident angle
and deposition direction are investigated. Therefore, depositions at various angles and
lateral momenta along two different crystallographic orientations are considered. The C20
is found to be the most efficient species at producing an amorphous thin film. Despite the
differences in the chemical bonding within the three incident clusters, the structures of
the resultant thin films are predicted to be similar. Deposition at a large incident angle
reduces the efficiency of thin film formation. However, the incident angle does not affect
the resultant thin film structure. Furthermore, deposition along different crystallographic
orientations is not found to have significant influence on the simulation results due to the
randomization of the clusters within the beam in both translational and angular
orientations.
Since the discovery of carbon nanotubes in the early 1990s, active research has
been carried out on this new type of materials because of their unique mechanical and
electrical properties. There has been considerable effort spent to incorporate carbon
nanotubes into polymer matrix to make use of their extraordinary modulus and resistance
to brittle failure. But when as-synthesized nanotubes are used, the composites fail through
nanotube pullout due to poor adhesion between the nanotube and polymer matrix.[164, 171,
173] However, nanotubes that are chemically functionalized adhere more strongly to the
polymer matrix because of efficient load-transfer through covalent bonds between the
131
polymer and the nanotube.[181, 182] Both experimental and computational studies have
found that energetic deposition of polyatomic ions can lead to covalent bond formation
between nanotubes or adjacent tube walls.[199, 200, 285] Therefore, in the present work,
chemical functionalization of carbon nanotube/polystyrene composite via polyatomic ion
beam deposition at incident energies of 50-80 eV/ion is investigated using MD
simulations. The simulation results show that this approach is suitable for inducing
covalent cross-links between otherwise unfunctionalized nanotube and a polymer matrix
to toughen the composite. High incident energy and compact composite structures are
predicted to be best for effective chemical functionalization of the nanotube. The
simulations also show that the introduction of carbon nanotubes will influence both the
chemical and structural modifications induced by the ion beam when the deposition
results of the composites and pure polystyrene substrates are compared. Most
importantly, the simulations reveal the likely atomistic mechanisms responsible for these
findings.
These MD simulation studies provide valuable information about the types of
chemical reactions that occur upon deposition, detail the atomistic mechanisms
responsible for these reactions, and reveal the dependence of the chemical reactions and
products on a number of factors including deposition species, incident angle, impact
energy, substrate structure, etc. These studies provide an enhanced understanding of the
particle-surface interactions and the processing of materials through cluster and/or ion
beam deposition. The predictions could lead to improvements in thin film generation and
material modification techniques that are used to manufacture and design a variety of
products, from microelectronic devices to medical implants. The simulation results of the

132
deposition on carbon nanotube/polystyrene composites could have important implications
for the production of lightweight, high-strength nanocomposites with improved load-
bearing capabilities.
6.2 Future Work
Throughout this whole dissertation, many of our motivating questions have been
answered affirmatively. MD simulations can successfully keep track of the short time
scale processes that occur during cluster-surface reactions. However, some subsequent
events (for example, thermally activated atomic migration and surface diffusion), which
are very important in determining thin film growth and equilibrium structure, may not be
rapid enough to be captured by conventional MD simulations. A previous study
investigated the subsequent structural relaxation of the resultant thin film by performing
geometry relaxation through energy minimization for some representative thin-film
fragments.[101] In this study, it was found that the structures of the fragments only
changed slightly from the relaxed structure predicted in the MD simulations. However, to
single out the thin-film fragments has introduced significant simplifications that may not
represent the situation where those fragments are connected to the remaining structure.
Besides, in order to model the entire deposition process, most MD simulations (including
the simulations reported in this dissertation) use deposition rates that are typically 8-11
orders of magnitude higher than the experimental deposition rates.[286] Consequently, if
the employed thermostat is not effective enough at removing extra energy from the
system, the collisions of consecutive incident particles may affect each other directly in
ways that they would not at a low deposition rate.
In order to solve all these problems, a hybrid simulation as presented by Jacobsen
et al.[287] for metal systems could be used. In this hybrid simulation, MD simulation

133
methods are combined with MC (Monte Carlo) simulation methods. In this way, the short
time scale collision events can be modeled using MD simulations while, the long time
scale events between the collisions, such as surface diffusion and structure relaxation, can
be simulated using MC simulation methods. This hybrid simulation method is time
consuming, but it allows for a more realistic simulation of the collision at a realistic
deposition rate and can predict a more precisely relaxed structure after the deposition.
Another intriguing method is the temperature-accelerated dynamics (TAD)
developed by Sørensen and Voter.[288] This method is based on harmonic transition state
theory and is a combination of conventional molecular dynamics and statistical
mechanics. The main idea behind this method is to study the thermally activated behavior
of the system by performing an MD simulation at a higher temperature rather than at
ordinary temperatures. Therefore, the rate of the activated processes can be raised and
become accessible to the simulation. Of course, raising the temperature may also induce
transitions that may not occur at the ordinary temperatures. Such temperature-induced
bias is corrected by only allowing those transitions that should take place at the ordinary
temperature to occur. In this way, the accessible time scale is extended by orders of
magnitude while the correct dynamics is still maintained.
Simulations that can model the deposition process at an experimental deposition
rate and simultaneously address the questions such as atomic migration and surface
diffusion will give direct insight into the whole experimental process and provide a more
complete picture. Hence, the advanced methods mentioned above are certainly promising
and worth the further exploration and extension to covalently bonded materials.

134
LIST OF REFERENCES
[1] A. Haghighat, Monte Carlo Methods (Department of Nuclear and Radiological Engineering, University of Florida, Fall 2002).
[2] D. Frenkel and B. Smit, Understanding Molecular Simulation: From Algorithms to Applications (Academic Press, San Diego, CA, 1996).
[3] A. Hinchliffe, Modelling Molecular Structures (John Wiley & Sons, Inc., New York, NY, 2000).
[4] B. A. Helmer and D. B. Graves, J. Vac. Sci. Technol. A 16, 3502-3514 (1998).
[5] L. Verlet, Phy. Rev. 159, 98-103 (1967).
[6] C. C. Fang, V. Prasad, and F. Jones, J. Vac. Sci. Technol. A 11, 2778-2789 (1993).
[7] H. Bekker, E. J. Dijkstra, M. K. R. Renardus, and H. J. C. Berendsen, Mol. Simul. 14, 137-151 (1995).
[8] C. W. Gear, Numerical Initial Value Problems in Ordinary Differential Equations (Prentice-Hall, Englewood Cliffs, NJ, 1971).
[9] J. B. Adams, Z. Y. Wang, and Y. H. Li, Thin Solid Films 365, 201-210 (2000).
[10] B. J. Alder and T. E. Wainwright, J. Chem. Phys. 27, 1208-1209 (1957).
[11] B. J. Alder and T. E. Wainwright, J. Chem. Phys. 31, 459-466 (1959).
[12] J. B. Gibson, A. N. Goland, M. Milgram, and G. H. Vineyard, Phy. Rev. 120, 1229-1253 (1960).
[13] A. Rahman, Phy. Rev. 136, A405-A411 (1964).
[14] K. Binder (Ed.), Monte Carlo and Molecular Dynamics Simulations in Polymer Science (Oxford University Press, Inc., New York, 1995).
[15] P. Milani and S. Iannotta (Ed.), Cluster Beam Synthesis of Nanostructured Materials (Springer-Verlag, Berlin, Heidelberg, 1999).

135
[16] E. W. Becker, Z. Phys. D 3, 101-107 (1986).
[17] C. G. Granqvist and R. A. Buhrman, J. Appl. Phys. 47, 2200-2219 (1976).
[18] S. H. Baker, S. C. Thornton, A. M. Keen, T. I. Preston, C. Norris, K. W. Edmonds, and C. Binns, Rev. Sci. Instrum. 68, 1853-1857 (1997).
[19] H. Haberland, M. Karrais, M. Mall, and Y. Thurner, J. Vac. Sci. Technol. A 10, 3266-3271 (1992).
[20] R. Campargue (Ed.), Atomic and Molecular Beams: The State of the Art 2000 (Springer-Verlag, Berlin, Heidelberg, 2001).
[21] J. R. Heath, Y. Liu, S. C. Obrien, Q. L. Zhang, R. F. Curl, F. K. Tittel, and R. E. Smalley, J. Chem. Phys. 83, 5520-5526 (1985).
[22] V. Paillard, P. Melinon, V. Dupuis, A. Perez, J. P. Perez, G. Guiraud, J. Fornazero, and G. Panczer, Phys. Rev. B 49, 11433-11439 (1994).
[23] W. L. Brown and M. Sosnowski, Nucl. Instr. and Meth. B 102, 305-311 (1995).
[24] T. Takagi, I. Yamada, and A. Sasaki, Thin Solid Films 39, 207-217 (1976).
[25] H. Usui, I. Yamada, and T. Takagi, J. Vac. Sci. Technol. A 4, 52-60 (1986).
[26] W. L. Brown, M. F. Jarrold, R. L. McEachern, M. Sosnowski, G. Takaoka, H. Usui, and I. Yamada, Nucl. Instr. and Meth. B 59, 182-189 (1991).
[27] T. Takagi, Ionized Cluster Beam Deposition and Epitaxy (Noyes, Park Ridge, NJ, 1988).
[28] I. Yamada, H. Usui, A. Yamada, H. Sugiyama, R. Machida, M. Kitamura, Y. Nagase, and Y. Inoue, Nucl. Instr. and Meth. B 59, 219-224 (1991).
[29] A. Fejfar and H. Biederman, Int. J. Electron. 73, 1051-1053 (1992).
[30] H. J. Gao, Z. Q. Xue, K. Z. Wang, Q. D. Wu, and S. Pang, Appl. Phys. Lett. 68, 2192-2194 (1996).
[31] J. Q. Xie, Y. Zheng, and J. Y. Feng, Nucl. Instr. and Meth. B 122, 239-243 (1997).
[32] K. Kondo, H. Sano, and K. Sato, Thin Solid Films 326, 83-87 (1998).
136
[33] P. Melinon, B. Prevel, V. Dupuis, A. Perez, B. Champagnon, M. Boudeulle, Y. Guyot, M. Broyer, P. Dugourd, and M. Pellarin, Mater. Sci. Eng. A 217-218, 69-73 (1996).
[34] A. Perez, P. Melinon, V. Dupuis, P. Jensen, B. Prevel, J. Tuaillon, L. Bardotti, C. Martet, M. Treilleux, M. Broyer, M. Pellarin, J. L. Vaille, B. Palpant, and J. Lerme, J. Phys. D 30, 709-721 (1997).
[35] Y. Yamamura, I. Yamada, and T. Takagi, Nucl. Instr. and Meth. B 37-8, 902-905 (1989).
[36] E. E. B. Campbell and I. V. Hertel, Nucl. Instr. and Meth. B 112, 48-54 (1996).
[37] T. Raz and R. D. Levine, J. Phys. Chem. 99, 7495-7506 (1995).
[38] G. Q. Xu, S. L. Bernasek, and J. C. Tully, J. Chem. Phys. 88, 3376-3384 (1988).
[39] P. Jensen, Rev. Mod. Phys. 71, 1695-1735 (1999).
[40] R. L. McEachern, W. L. Brown, M. F. Jarrold, M. Sosnowski, G. Takaoka, H. Usui, and I. Yamada, J. Vac. Sci. Technol. A 9, 3105-3112 (1991).
[41] D. Turner and H. Shanks, J. Appl. Phys. 70, 5385-5400 (1991).
[42] H. Haberland, Z. Insepov, M. Karrais, M. Mall, M. Moseler, and Y. Thurner, Nucl. Instr. and Meth. B 80-1, 1320-1323 (1993).
[43] K. H. Muller, J. Appl. Phys. 61, 2516-2521 (1987).
[44] C. L. Cleveland and U. Landman, Science 257, 355-361 (1992).
[45] I. Yamada, Nucl. Instr. and Meth. B 112, 242-247 (1996).
[46] H. Hsieh and R. S. Averback, Phys. Rev. B 42, 5365-5368 (1990).
[47] R. Lee, Z. Pan, and Y. Ho, Phys. Rev. B 53, 4156-4161 (1996).
[48] R. W. Lee, Z. Y. Pan, and M. Hou, Nucl. Instr. and Meth. B 115, 536-539 (1996).
[49] H. Mizuseki, Y. Jin, Y. Kawazoe, and L. T. Wille, J. Appl. Phys. 87, 6561-6563 (2000).
[50] G. Q. Xu, R. J. Holland, S. L. Bernasek, and J. C. Tully, J. Chem. Phys. 90, 3831-3837 (1989).
137
[51] J. A. Niesse, J. N. Beauregard, and H. R. Mayne, J. Phys. Chem. 98, 8600-8605 (1994).
[52] S. J. Carroll, R. E. Palmer, P. A. Mulheran, S. Hobday, and R. Smith, Appl. Phys. A A67, 613-619 (1998).
[53] I. Schek, T. Raz, R. D. Levine, and J. Jortner, J. Chem. Phys. 101, 8596-8605 (1994).
[54] G. Vandoni, C. Felix, and C. Massobrio, Phys. Rev. B 54, 1553-1556 (1996).
[55] H. Yasumatsu, A. Terasaki, and T. Kondow, J. Chem. Phys. 106, 3806-3812 (1997).
[56] S. J. Carroll, S. G. Hall, R. E. Palmer, and R. Smith, Phys. Rev. Lett. 81, 3715-3718 (1998).
[57] J. Oviedo, J. F. Sanz, N. Lopez, and F. Illas, J. Phys. Chem. B 104, 4342-4348 (2000).
[58] M. Ghaly, K. Nordlund, and R. S. Averback, Philos. Mag. A 79, 795-820 (1999).
[59] S. Ramalingam, E. S. Aydil, and D. Maroudas, J. Vac. Sci. Technol. B 19, 634-644 (2001).
[60] C. Massobrio and B. Nacer, Z. Phys. D 40, 526-529 (1997).
[61] T. Aoki, J. Matsuo, Z. Insepov, and I. Yamada, Nucl. Instr. and Meth. B 121, 49-52 (1997).
[62] C. L. Kelchner and A. E. DePristo, Nanostruct. Mater. 8, 253-268 (1997).
[63] D. Donadio, L. Colombo, P. Milani, and G. Benedek, Phys. Rev. Lett. 83, 776-779 (1999).
[64] M. Moseler, O. Rattunde, J. Nordiek, and H. Haberland, Nucl. Instr. and Meth. B 164, 522-536 (2000).
[65] Z. Y. Pan, J. Xie, and Z. Y. Man, Nucl. Instr. and Meth. B 135, 346-349 (1998).
[66] H. P. Cheng, J. Chem. Phys. 111, 7583-7592 (1999).
[67] R. Biswas, G. S. Grest, and C. M. Soukoulis, Phys. Rev. B 38, 8154-8162 (1988).
[68] V. S. Kharlamov, E. E. Zhurkin, and M. Hou, Nucl. Instr. and Meth. B 193, 538-543 (2002).

138
[69] H. W. Lu, J. Q. Xie, and J. Y. Feng, Nucl. Instr. and Meth. B 170, 71-78 (2000).
[70] W. J. Zhu, Z. Y. Pan, Y. K. Ho, and Y. X. Wang, J. Appl. Phys. 88, 6836-6841 (2000).
[71] C. Massobrio, J. Phys. Chem. B 102, 4374-4379 (1998).
[72] H. J. Kang, M. W. Lee, J. H. Kim, and C. N. Whang, Nucl. Instr. and Meth. B 121, 53-57 (1997).
[73] H. Haberland, Z. Insepov, and M. Moseler, Phys. Rev. B 51, 11061-11067 (1995).
[74] K. Hongo, H. Mizuseki, Y. Kawazoe, and L. T. Wille, J. Crys. Growth 236, 429-433 (2002).
[75] H. Gaber, H. G. Busmann, R. Hiss, I. V. Hertel, H. Romberg, J. Fink, F. Bruder, and R. Brenn, J. Phys. Chem. 97, 8244-8249 (1993).
[76] J. L. Xu and J. Y. Feng, J. Crys. Growth 240, 407-414 (2002).
[77] F. J. Resende and B. V. Costa, Surf. Sci. 481, 54-66 (2001).
[78] N. C. Blais and J. R. Stine, J. Chem. Phys. 93, 7914-7922 (1990).
[79] H. P. Kaukonen, U. Landman, and C. L. Cleveland, J. Chem. Phys. 95, 4997-5013 (1991).
[80] B. Nacer, C. Massobrio, and C. Felix, Phys. Rev. B 56, 10590-10595 (1997).
[81] Y. Yamamura, Nucl. Instr. and Meth. B 45, 707-713 (1990).
[82] M. Tamada, H. Koshikawa, and H. Omichi, Thin Solid Films 293, 113-116 (1997).
[83] R. Kuschnereit, P. Hess, D. Albert, and W. Kulisch, Thin Solid Films 312, 66-72 (1998).
[84] R. Ramesham, S. Best, M. F. Rose, and M. Crumpler, J. Mater. Sci. 32, 1029-1038 (1997).
[85] B. H. Besler, W. L. Hase, and K. C. Hass, J. Phys. Chem. 96, 9369-9376 (1992).
[86] L. Ponsonnet, C. Donnet, K. Varlot, J. M. Martin, A. Grill, and V. Patel, Thin Solid Films 319, 97-100 (1998).
139
[87] M. Tamada, H. Omichi, and N. Okui, Thin Solid Films 268, 18-21 (1995).
[88] M. Tamada, H. Koshikawa, F. Hosoi, T. Suwa, H. Usui, A. Kosaka, and H. Sato, Polymer 40, 3061-3067 (1999).
[89] Z. Insepov and I. Yamada, Nucl. Instr. and Meth. B 112, 16-22 (1996).
[90] I. Yamada and J. Matsuo, Mat. Res. Soc. Symp. Proc. 396, 149-155 (1996).
[91] Z. Y. Man, Z. Y. Pan, Y. K. Ho, and W. J. Zhu, Eur. Phys. J. D 7, 595-599 (1999).
[92] R. C. Mowrey, D. W. Brenner, B. I. Dunlap, J. W. Mintmire, and C. T. White, J. Phys. Chem. 95, 7138-7142 (1991).
[93] M. Hillenkamp, J. Pfister, M. M. Kappes, and R. P. Webb, J. Chem. Phys. 111, 10303-10313 (1999).
[94] X. Z. Ke, Z. Y. Zhu, F. S. Zhang, F. Wang, and Z. X. Wang, Chem. Phys. Lett. 313, 40-44 (1999).
[95] L. F. Qi and S. B. Sinnott, J. Phys. Chem. B 101, 6883-6890 (1997).
[96] L. Qi and S. B. Sinnott, in Application of Accelerators in Research and Industry: Proceedings of the Fourteenth International Conference, AIP Conference Proceedings 392 (American Institute of Physics Press, Woodbury, NY, 1997), p. 487-490.
[97] L. F. Qi and S. B. Sinnott, Surf. Sci. 398, 195-202 (1998).
[98] L. F. Qi and S. B. Sinnott, J. Vac. Sci. Technol. A 16, 1293-1296 (1998).
[99] L. F. Qi and S. B. Sinnott, Nucl. Instr. and Meth. B 140, 39-46 (1998).
[100] L. F. Qi, W. L. Young, and S. B. Sinnott, Surf. Sci. 426, 83-91 (1999).
[101] T. A. Plaisted, B. Ni, J. D. Zahrt, and S. B. Sinnott, Thin Solid Films 381, 73-83 (2001).
[102] T. A. Plaisted and S. B. Sinnott, J. Vac. Sci. Technol. A 19, 262-266 (2001).
[103] L. Qi and S. B. Sinnott, in Thin Films-Structure and Morphology, MRS Symposia Proceedings No. 441 (Materials Research Society, Pittsburgh, PA, 1997), p. 515-520.
140
[104] T. A. Plaisted, J. D. Zahrt, W. L. Young, L. Qi, and S. B. Sinnott, in Applications of Accelerators in Research and Industry: Proceedings of the Fifteenth International Conference, AIP Conference Proceedings 475 (American Institute of Physics Press, Woodbury, NY, 1999), p. 387-390.
[105] S. B. Sinnott, L. Qi, O. A. Shenderova, and D. W. Brenner, in Advances in Classical Trajectory Methods: Molecular Dynamics of Clusters, Surfaces, Liquids, and Interfaces, edited by W. Hase (JAI Press, Inc., Stamford, CT, 1999), Vol. IV, p. 1-26.
[106] M. Y. M. Lyktey, T. Rycroft, and J. F. Garvey, J. Phys. Chem. 100, 6427-6433 (1996).
[107] M. Sakashita, H. Yamawaki, and K. Aoki, J. Phys. Chem. 100, 9943-9947 (1996).
[108] S. W. Levine, J. R. Engstrom, and P. Clancy, Surf. Sci. 401, 112-123 (1998).
[109] T. Ohashi, K. Miyake, and K. Ohashi, Nucl. Instr. and Meth. B 121, 40-43 (1997).
[110] B. Degroote, A. Vantomme, H. Pattyn, K. Vanormelingen, and M. Hou, Phys. Rev. B 65, art. no.-195402 (2002).
[111] F. J. Palacios, M. P. Iniguez, M. J. Lopez, and J. A. Alonso, Phys. Rev. B 62, 16031-16039 (2000).
[112] Q. H. Tang, K. Runge, H. P. Cheng, and F. E. Harris, J. Phys. Chem. A 106, 893-896 (2002).
[113] A. G. Dirks and H. J. Leamy, Thin Solid Films 47, 219-233 (1977).
[114] P. Meakin and J. Krug, Phys. Rev. A 46, 3390-3399 (1992).
[115] Y. Kataoka and K. Wittmaack, Surf. Sci. 424, 299-310 (1999).
[116] A. Delcorte, X. Vanden Eynde, P. Bertrand, and D. F. Reich, Nucl. Instr. and Meth. B 157, 138-143 (1999).
[117] A. C. Lavery, C. E. Sosolik, and B. H. Cooper, Phys. Rev. B 62, 16126-16137 (2000).
[118] H. Kitani, N. Toyoda, J. Matsuo, and I. Yamada, Nucl. Instr. and Meth. B 121, 489-492 (1997).
[119] L. Abelmann and C. Lodder, Thin Solid Films 305, 1-21 (1997).

141
[120] S. Iijima, C. Brabec, A. Maiti, and J. Bernholc, J. Chem. Phys. 104, 2089-2092 (1996).
[121] P. Lambin, A. Fonseca, J. P. Vigneron, J. B. Nagy, and A. A. Lucas, Chem. Phys. Lett. 245, 85-89 (1995).
[122] J. W. Mintmire and C. T. White, Synth. Met. 77, 231-234 (1996).
[123] J. Hone, M. Whitney, and A. Zettl, Synth. Met. 103, 2498-2499 (1999).
[124] J. W. Che, T. Cagin, and W. A. Goddard, Nanotechnology 11, 65-69 (2000).
[125] R. S. Ruoff and D. C. Lorents, Carbon 33, 925-930 (1995).
[126] P. Poncharal, Z. L. Wang, D. Ugarte, and W. A. de Heer, Science 283, 1513-1516 (1999).
[127] J. W. Mintmire and C. T. White, Carbon 33, 893-902 (1995).
[128] M. M. J. Treacy, T. W. Ebbesen, and J. M. Gibson, Nature 381, 678-680 (1996).
[129] E. W. Wong, P. E. Sheehan, and C. M. Lieber, Science 277, 1971-1975 (1997).
[130] A. Thess, R. Lee, P. Nikolaev, H. J. Dai, P. Petit, J. Robert, C. H. Xu, Y. H. Lee, S. G. Kim, A. G. Rinzler, D. T. Colbert, G. E. Scuseria, D. Tomanek, J. E. Fischer, and R. E. Smalley, Science 273, 483-487 (1996).
[131] C. Journet, W. K. Maser, P. Bernier, A. Loiseau, M. L. delaChapelle, S. Lefrant, P. Deniard, R. Lee, and J. E. Fischer, Nature 388, 756-758 (1997).
[132] S. B. Sinnott and R. Andrews, Crit. Rev. Solid State Mat. Sci. 26, 145-249 (2001).
[133] H. Dai, in Carbon Nanotubes: Synthesis, Structure, Properties, and Applications, edited by M. S. Drsselhaus, G. Dresselhaus and P. Avouris (Springer-Verlag, Berlin, Heidelberg, 2001), p. 29-53.
[134] S. Iijima, Nature 354, 56-58 (1991).
[135] P. J. F. Harris, Carbon Nanotubes and Related Structures: New materials for the Twenty-first Century (Cambridge University Press, Cambridge, 1999).
[136] T. W. Ebbesen and P. M. Ajayan, Nature 358, 220-222 (1992).
[137] T. W. Ebbesen, H. Hiura, J. Fujita, Y. Ochiai, S. Matsui, and K. Tanigaki, Chem. Phys. Lett. 209, 83-90 (1993).

142
[138] S. Iijima and T. Ichihashi, Nature 363, 603-605 (1993).
[139] D. S. Bethune, C. H. Kiang, M. S. Devries, G. Gorman, R. Savoy, J. Vazquez, and R. Beyers, Nature 363, 605-607 (1993).
[140] M.S.Dresselhaus, G. Dresselhaus, and P. C. Eklund, Science of Fullerenes and Carbon Nanotubes (Academic Press, New York, 1996).
[141] T. W. Ebbesen, in Carbon Nanotubes: Preparation and Properties, edited by T. W. Ebbesen (CRC Press, Boca Raton, FL, 1997), p. 139-162.
[142] T. W. Ebbesen, P. M. Ajayan, H. Hiura, and K. Tanigaki, Nature 367, 519-519 (1994).
[143] J. Liu, A. G. Rinzler, H. J. Dai, J. H. Hafner, R. K. Bradley, P. J. Boul, A. Lu, T. Iverson, K. Shelimov, C. B. Huffman, F. Rodriguez-Macias, Y. S. Shon, T. R. Lee, D. T. Colbert, and R. E. Smalley, Science 280, 1253-1256 (1998).
[144] H. Hiura, T. W. Ebbesen, and K. Tanigaki, Adv. Mater. 7, 275-276 (1995).
[145] D. Srivastava, D. W. Brenner, J. D. Schall, K. D. Ausman, M. F. Yu, and R. S. Ruoff, J. Phys. Chem. B 103, 4330-4337 (1999).
[146] J. W. Mintmire, B. I. Dunlap, and C. T. White, Phys. Rev. Lett. 68, 631-634 (1992).
[147] N. Hamada, S. Sawada, and A. Oshiyama, Phys. Rev. Lett. 68, 1579-1581 (1992).
[148] R. A. Jishi, M. S. Dresselhaus, and G. Dresselhaus, Phys. Rev. B 48, 11385-11389 (1993).
[149] R. Saito, M. Fujita, G. Dresselhaus, and M. S. Dresselhaus, Appl. Phys. Lett. 60, 2204-2206 (1992).
[150] J. W. G. Wildoer, L. C. Venema, A. G. Rinzler, R. E. Smalley, and C. Dekker, Nature 391, 59-62 (1998).
[151] T. W. Odom, J. L. Huang, P. Kim, and C. M. Lieber, Nature 391, 62-64 (1998).
[152] P. M. Ajayan, O. Stephan, C. Colliex, and D. Trauth, Science 265, 1212-1214 (1994).
[153] B. I. Yakobson, C. J. Brabec, and J. Bernholc, Phys. Rev. Lett. 76, 2511-2514 (1996).

143
[154] J. P. Salvetat, J. M. Bonard, N. H. Thomson, A. J. Kulik, L. Forro, W. Benoit, and L. Zuppiroli, Appl. Phys. A 69, 255-260 (1999).
[155] J. Sandler, M. S. P. Shaffer, T. Prasse, W. Bauhofer, K. Schulte, and A. H. Windle, Polymer 40, 5967-5971 (1999).
[156] I. Alexandrou, E. Kymakis, and G. A. J. Amaratunga, Appl. Phys. Lett. 80, 1435-1437 (2002).
[157] B. McCarthy, J. N. Coleman, R. Czerw, A. B. Dalton, M. in het Panhius, A. Maiti, A. Drury, P. Bernier, J. B. Nagy, B. Lahr, H. J. Byrne, D. L. Carroll, and W. J. Blau, J. Phys. Chem. B 106, 2210-2216 (2002).
[158] B. Z. Tang and H. Y. Xu, Macromolecules 32, 2569-2576 (1999).
[159] B. McCarthy, J. N. Coleman, R. Czerw, A. B. Dalton, H. J. Byrne, D. Tekleab, P. Iyer, P. M. Ajayan, W. J. Blau, and D. L. Carroll, Nanotechnology 12, 187-190 (2001).
[160] H. D. Wagner, O. Lourie, Y. Feldman, and R. Tenne, Appl. Phys. Lett. 72, 188-190 (1998).
[161] L. S. Schadler, S. C. Giannaris, and P. M. Ajayan, Appl. Phys. Lett. 73, 3842-3844 (1998).
[162] O. Lourie, D. M. Cox, and H. D. Wagner, Phys. Rev. Lett. 81, 1638-1641 (1998).
[163] X. Y. Gong, J. Liu, S. Baskaran, R. D. Voise, and J. S. Young, Chem. Mater. 12, 1049-1052 (2000).
[164] P. M. Ajayan, L. S. Schadler, C. Giannaris, and A. Rubio, Adv. Mater. 12, 750-753 (2000).
[165] O. Lourie, H. D. Wagner, Y. G. Zhang, and S. Iijima, Adv. Mater. 11, 931-934 (1999).
[166] O. Lourie and H. D. Wagner, Compos. Sci. Technol. 59, 975-977 (1999).
[167] L. Jin, C. Bower, and O. Zhou, Appl. Phys. Lett. 73, 1197-1199 (1998).
[168] C. Stephan, T. P. Nguyen, M. L. de la Chapelle, S. Lefrant, C. Journet, and P. Bernier, Synth. Met. 108, 139-149 (2000).
[169] R. Haggenmueller, H. H. Gommans, A. G. Rinzler, J. E. Fischer, and K. I. Winey, Chem. Phys. Lett. 330, 219-225 (2000).

144
[170] M. S. P. Shaffer and A. H. Windle, Adv. Mater. 11, 937-941 (1999).
[171] C. Bower, R. Rosen, L. Jin, J. Han, and O. Zhou, Appl. Phys. Lett. 74, 3317-3319 (1999).
[172] B. Safadi, R. Andrews, and E. A. Grulke, J. Appl. Polym. Sci. 84, 2660-2669 (2002).
[173] D. Qian, E. C. Dickey, R. Andrews, and T. Rantell, Appl. Phys. Lett. 76, 2868-2870 (2000).
[174] K. Liao and S. Li, Appl. Phys. Lett. 79, 4225-4227 (2001).
[175] B. H. Chang, Z. Q. Liu, L. F. Sun, D. S. Tang, W. Y. Zhou, G. Wang, L. X. Qian, S. S. Xie, J. H. Fen, and M. X. Wan, J. Low Temp. Phys. 119, 41-48 (2000).
[176] S. R. Dong, J. P. Tu, and X. B. Zhang, Mater. Sci. Eng. A 313, 83-87 (2001).
[177] G. L. Hwang and K. C. Hwang, J. Mater. Chem. 11, 1722-1725 (2001).
[178] A. M. Rao, P. Zhou, K. A. Wang, G. T. Hager, J. M. Holden, Y. Wang, W. T. Lee, X. X. Bi, P. C. Eklund, D. S. Cornett, M. A. Duncan, and I. J. Amster, Science 259, 955-957 (1993).
[179] E. T. Thostenson, W. Z. Li, D. Z. Wang, Z. F. Ren, and T. W. Chou, J. Appl. Phys. 91, 6034-6037 (2002).
[180] S. J. V. Frankland and V. M. Harik, Surf. Sci. 525, L103-L108 (2003).
[181] S. J. V. Frankland, A. Caglar, D. W. Brenner, and M. Griebel, Mat. Res. Soc. Symp. Proc. 633, A14.17.11-A14.17.15 (2001).
[182] S. J. V. Frankland, A. Caglar, D. W. Brenner, and M. Griebel, J. Phys. Chem. B 106, 3046-3048 (2002).
[183] E. T. Mickelson, C. B. Huffman, A. G. Rinzler, R. E. Smalley, R. H. Hauge, and J. L. Margrave, Chem. Phys. Lett. 296, 188-194 (1998).
[184] P. R. Marcoux, J. Schreiber, P. Batail, S. Lefrant, J. Renouard, G. Jacob, D. Albertini, and J. Y. Mevellec, Phys. Chem. Chem. Phys. 4, 2278-2285 (2002).
[185] H. Touhara, J. Inahara, T. Mizuno, Y. Yokoyama, S. Okanao, K. Yanagiuch, I. Mukopadhyay, S. Kawasaki, F. Okino, and H. Shirai, J. Fluorine Chem. 114, 181-188 (2002).
145
[186] K. H. An, J. G. Heo, K. G. Jeon, D. Bae, C. S. Jo, C. W. Yang, C. Y. Park, Y. H. Lee, Y. S. Lee, and Y. S. Chung, Appl. Phys. Lett. 80, 4235-4237 (2002).
[187] K. F. Kelly, I. W. Chiang, E. T. Mickelson, R. H. Hauge, J. L. Margrave, X. Wang, G. E. Scuseria, C. Radloff, and N. J. Halas, Chem. Phys. Lett. 313, 445-450 (1999).
[188] J. Chen, M. A. Hamon, H. Hu, Y. S. Chen, A. M. Rao, P. C. Eklund, and R. C. Haddon, Science 282, 95-98 (1998).
[189] W. H. Lee, S. J. Kim, W. J. Lee, J. G. Lee, R. C. Haddon, and P. J. Reucroft, Appl. Surf. Sci. 181, 121-127 (2001).
[190] T. Saito, K. Matsushige, and K. Tanaka, Physica B 323, 280-283 (2002).
[191] M. Knez, M. Sumser, A. M. Bittner, C. Wege, H. Jeske, S. Kooi, M. Burghard, and K. Kern, J. Electroanal.Chem. 522, 70-74 (2002).
[192] C. H. Kiang, W. A. Goddard, R. Beyers, and D. S. Bethune, J. Phys. Chem. 100, 3749-3752 (1996).
[193] P. M. Ajayan, V. Ravikumar, and J. C. Charlier, Phys. Rev. Lett. 81, 1437-1440 (1998).
[194] F. Beuneu, C. l'Huillier, J. P. Salvetat, J. M. Bonard, and L. Forro, Phys. Rev. B 59, 5945-5949 (1999).
[195] M. Terrones, H. Terrones, F. Banhart, J. C. Charlier, and P. M. Ajayan, Science 288, 1226-1229 (2000).
[196] F. Banhart, Nano Lett. 1, 329-332 (2001).
[197] A. V. Krasheninnikov, K. Nordlund, M. Sirvio, E. Salonen, and J. Keinonen, Phys. Rev. B 63, art. no.-245405 (2001).
[198] E. Salonen, A. V. Krasheninnikov, and K. Nordlund, Nucl. Instr. and Meth. B 193, 603-608 (2002).
[199] B. Ni and S. B. Sinnott, Phys. Rev. B 61, R16343-R16346 (2000).
[200] B. Ni, R. Andrews, D. Jacques, Q. Dali, M. B. J. Wijesundara, C. Yongsoo, L. Hanley, and S. B. Sinnott, J. Phys. Chem. B 105, 12719-12725 (2001).
[201] A. V. Krasheninnikov, K. Nordlund, and J. Keinonen, Phys. Rev. B 65, art. no.-165423 (2002).
146
[202] Q. D. Chen, L. M. Dai, M. Gao, S. M. Huang, and A. Mau, J. Phys. Chem. B 105, 618-622 (2001).
[203] E. H. Lee, G. R. Rao, and L. K. Mansur, Mater. Sci. Forum 248-249, 135-146 (1997).
[204] D. W. Brenner, O. A. Shendrova, and C. B. Parker, Mat. Res. Soc. Symp. Proc. 438, 491-498 (1997).
[205] D. W. Brenner, Phys. Status Solidi B 217, 23-40 (2000).
[206] C. S. Jayanthi, S. Y. Wu, J. Cocks, N. S. Luo, Z. L. Xie, M. Menon, and G. Yang, Phys. Rev. B 57, 3799-3802 (1998).
[207] S. D. Liu, C. S. Jayanthi, S. Y. Wu, X. R. Qin, Z. Y. Zhang, and M. G. Lagally, Phys. Rev. B 61, 4421-4424 (2000).
[208] T. W. Tombler, C. W. Zhou, L. Alexseyev, J. Kong, H. J. Dai, L. Lei, C. S. Jayanthi, M. J. Tang, and S. Y. Wu, Nature 405, 769-772 (2000).
[209] L. Liu, C. S. Jayanthi, and S. Y. Wu, J. Appl. Phys. 90, 4143-4151 (2001).
[210] D. W. Brenner, Phys. Rev. B 42, 9458-9471 (1990).
[211] D. W. Brenner, O. A. Shenderova, J. A. Harrison, S. J. Stuart, B. Ni, and S. B. Sinnott, J. Phys.: Condes. Matter 14, 783-802 (2002).
[212] A. V. Petukhov, D. Passerone, F. Ercolessi, E. Tosatti, and A. Fasolino, Phys. Rev. B 61, 10590-10593 (2000).
[213] A. V. Petukhov and A. Fasolino, Phys. Status Solidi A 181, 109-114 (2000).
[214] D. R. Alfonso, S. E. Ulloa, and D. W. Brenner, Phys. Rev. B 49, 4948-4953 (1994).
[215] R. S. Taylor and B. J. Garrison, Int. J. Mass Spectrom. Ion Processes 143, 225-233 (1995).
[216] R. S. Taylor and B. J. Garrison, Langmuir 11, 1220-1228 (1995).
[217] B. J. Garrison, P. B. S. Kodali, and D. Srivastava, Chem. Rev. 96, 1327-1341 (1996).
[218] D. W. Brenner, J. A. Harrison, C. T. White, and R. J. Colton, Thin Solid Films 206, 220-223 (1991).

147
[219] D. H. Robertson, D. W. Brenner, and C. T. White, J. Phys. Chem. 96, 6133-6135 (1992).
[220] D. H. Robertson, D. W. Brenner, and C. T. White, J. Phys. Chem. 99, 15721-15724 (1995).
[221] S. B. Sinnott, O. A. Shenderova, C. T. White, and D. W. Brenner, Carbon 36, 1-9 (1998).
[222] J. A. Harrison, S. J. Stuart, D. H. Robertson, and C. T. White, J. Phys. Chem. B 101, 9682-9685 (1997).
[223] A. Garg and S. B. Sinnott, Chem. Phys. Lett. 295, 273-278 (1998).
[224] A. Garg, J. Han, and S. B. Sinnott, Phys. Rev. Lett. 81, 2260-2263 (1998).
[225] A. B. Tutein, S. J. Stuart, and J. A. Harrison, J. Phys. Chem. B 103, 11357-11365 (1999).
[226] S. B. Sinnott, R. J. Colton, C. T. White, O. A. Shenderova, D. W. Brenner, and J. A. Harrison, J. Vac. Sci. Technol. A 15, 936-940 (1997).
[227] J. A. Harrison, R. J. Colton, C. T. White, and D. W. Brenner, Wear 168, 127-133 (1993).
[228] J. A. Harrison, C. T. White, R. J. Colton, and D. W. Brenner, Thin Solid Films 260, 205-211 (1995).
[229] S. B. Sinnott, R. J. Colton, C. T. White, and D. W. Brenner, Surf. Sci. 316, L1055-L1060 (1994).
[230] B. Ni, S. B. Sinnott, P. T. Mikulski, and J. A. Harrison, Phys. Rev. Lett. 88, art. no.-205505 (2002).
[231] J. Z. Que, M. W. Radny, and P. V. Smith, Phys. Rev. B 60, 8686-8694 (1999).
[232] J. Z. Que, M. W. Radny, P. V. Smith, and A. J. Dyson, Surf. Sci. 444, 123-139 (2000).
[233] J. Z. Que, M. W. Radny, and P. V. Smith, Surf. Sci. 444, 140-155 (2000).
[234] S. R. Schofield, M. W. Radny, and P. V. Smith, Phys. Rev. B 62, 10199-10206 (2000).
[235] P. De Sainte Clare, K. Son, W. L. Hase, and D. W. Brenner, J. Am. Chem. Soc. 100, 1761-1766 (1996).
148
[236] H. U. Jager and K. Albe, J. Appl. Phys. 88, 1129-1135 (2000).
[237] R. Smith, K. Beardmore, and J. Belbruno, J. Chem. Phys. 111, 9227-9232 (1999).
[238] L. Colombo, Comp. Mater. Sci. 12, 278-287 (1998).
[239] G. C. Abell, Phys. Rev. B 31, 6184-6196 (1985).
[240] J. Tersoff, Phys. Rev. Lett. 56, 632-635 (1986).
[241] J. Tersoff, Phys. Rev. B 39, 5566-5568 (1989).
[242] W. D. Callister, Jr., Materials Science and Engineering: An Introduction (John Wiley & Sons, Inc, New York, NY, 1999).
[243] D. W. Brenner, O. A. Shenderova, D. A. Areshkin, J. D. Schall, and S. J. V. Frankland, Comp. Model. Eng. Sci. 3, 643-673 (2002).
[244] M. P. Allen and D. J. Tildesley, Computer Simulation of Liquids (Clarendon Press, Oxford, 1987).
[245] H. J. C. Berendsen, J. P. M. Postma, W. F. Vangunsteren, A. Dinola, and J. R. Haak, J. Chem. Phys. 81, 3684-3690 (1984).
[246] D. R. Alfonso, S. Y. Wu, C. S. Jayanthi, and E. Kaxiras, Phys. Rev. B 59, 7745-7750 (1999).
[247] Y. H. Hu, S. G. Shen, L. Liu, C. S. Jayanthi, S. Y. Wu, and S. B. Sinnott, J. Chem. Phys. 116, 6738-6744 (2002).
[248] R. T. Dehoff, Thermodynamics in Materials Science (McGraw-Hill, Inc., 1993).
[249] S. A. Adelman and J. D. Doll, J. Chem. Phys. 64, 2375-2388 (1976).
[250] S. Nose, Mol. Phys. 52, 255-268 (1984).
[251] S. Nose, J. Chem. Phys. 81, 511-519 (1984).
[252] W. G. Hoover, Phys. Rev. A 31, 1695-1697 (1985).
[253] G. J. Martyna, M. L. Klein, and M. Tuckerman, J. Chem. Phys. 97, 2635-2643 (1992).
149
[254] C. C. Fang, V. Prasad, R. V. Joshi, F. Jones, and J. J. Hsieh, in Thin Films: Modeling of Film Deposition for Microelectronic Applications, edited by S. Rossnagel (Academic Press, Inc., San Diego, CA, 1996), Vol. 22, p. 117-173.
[255] H. C. Andersen, J. Chem. Phys. 72, 2384-2393 (1980).
[256] M. Moseler, J. Nordiek, and H. Haberland, Phys. Rev. B 56, 15439-15445 (1997).
[257] H. Haberland, M. Moseler, Y. Qiang, O. Rattunde, T. Reiners, and Y. Thurner, Surf. Rev. Lett. 3, 887-890 (1996).
[258] M. Moseler, J. Nordiek, O. Rattunde, and H. Haberland, Radiat. Eff. Defects Solids 142, 39-50 (1997).
[259] R. C. Fort Jr., Adamantane: The Chemistry of Diamond Molecules (Marcel Dekker, New York, 1976).
[260] P. R. C. Kent, M. D. Towler, R. J. Needs, and G. Rajagopal, Phys. Rev. B 62, 15394-15397 (2000).
[261] J. C. Grossman, L. Mitas, and K. Raghavachari, Phys. Rev. Lett. 75, 3870-3873 (1995).
[262] C. J. Brabec, E. B. Anderson, B. N. Davidson, S. A. Kajihara, Q. M. Zhang, J. Bernholc, and D. Tomanek, Phys. Rev. B 46, 7326-7328 (1992).
[263] E. J. Bylaska, P. R. Taylor, R. Kawai, and J. H. Weare, J. Phys. Chem. 100, 6966-6972 (1996).
[264] R. O. Jones and G. Seifert, Phys. Rev. Lett. 79, 443-446 (1997).
[265] G. Vonhelden, M. T. Hsu, P. R. Kemper, and M. T. Bowers, J. Chem. Phys. 95, 3835-3837 (1991).
[266] P. Weis, J. Rockenberger, R. D. Beck, and M. M. Kappes, J. Chem. Phys. 104, 3629-3637 (1996).
[267] R. M. Bradley and J. M. E. Harper, J. Vac. Sci. Technol. A 6, 2390-2395 (1988).
[268] Z. Insepov and I. Yamada, Nucl. Instr. and Meth. B 121, 44-48 (1997).
[269] Y. H. Hu and S. B. Sinnott, Nucl. Instr. and Meth. B 195, 329-338 (2002).
[270] Y. H. Hu and S. B. Sinnott, Surf. Sci. 526, 230-242 (2003).
[271] L. Hanley and S. B. Sinnott, Surf. Sci. 500, 500-522 (2002).
150
[272] I. Jang and S. B. Sinnott, (In preparation).
[273] E. T. Ada, O. Kornienko, and L. Hanley, J. Phys. Chem. B 102, 3959-3966 (1998).
[274] M. B. J. Wijesundara, Y. Ji, B. Ni, S. B. Sinnott, and L. Hanley, J. Appl. Phys. 88, 5004-5016 (2000).
[275] M. B. J. Wijesundara, L. Hanley, B. Ni, and S. B. Sinnott, Proc. Natl. Acad. Sci. U. S. A. 97, 23-27 (2000).
[276] C. W. Bauschlicher, Chem. Phys. Lett. 322, 237-241 (2000).
[277] C. W. Bauschlicher, Nano Lett. 1, 223-226 (2001).
[278] M. Horie, J. Vac. Sci. Technol. A 13, 2490-2497 (1995).
[279] W. W. Stoffels, E. Stoffels, and K. Tachibana, J. Vac. Sci. Technol. A 16, 87-95 (1998).
[280] W. Schwarzenbach, G. Cunge, and J. P. Booth, J. Appl. Phys. 85, 7562-7568 (1999).
[281] I. Jang, B. Ni, and S. B. Sinnott, J. Vac. Sci. Technol. A 20, 564-568 (2002).
[282] L. H. Sperling, Introduction to Physical Polymer Science (Wiley-Interscience, New York, NY, 1992).
[283] C. Pirlot, Z. Mekhalif, A. Fonseca, J. B. Nagy, G. Demortier, and J. Delhalle, Chem. Phys. Lett. 372, 595-602 (2003).
[284] Y. Hu and S. B. Sinnott, Compos. Sci. Technol. (in press).
[285] B. Ni and S. B. Sinnott, in Applications of Accelerators in Research and Industry: Proceedings of the Sixteenth International Conference, AIP Conference Proceedings 576 (American Institute of Physics Press, Melville, NY, 2001), p. 959-962.
[286] J. A. Sprague, F. Montalenti, B. P. Uberuaga, J. D. Kress, and A. F. Voter, Phys. Rev. B 66, art. no.-205415 (2002).
[287] J. Jacobsen, B. H. Cooper, and J. P. Sethna, Phys. Rev. B 58, 15847-15865 (1998).
[288] M. R. Sorensen and A. F. Voter, J. Chem. Phys. 112, 9599-9606 (2000).

151
BIOGRAPHICAL SKETCH
Yanhong Hu was born on November 28, 1972, in Shanghai, P. R. China. Her father
is an engineer, and her mother is an accountant. She grew up in Wuxi, a beautiful city
near Shanghai. After her graduation from high school in 1991, she enrolled in the East
China University of Science and Technology. During her freshman and sophomore years,
she became interested in materials science and engineering, which led her to choose the
College of Materials and major in polymer science and engineering. After she graduated
with a bachelor’s degree in 1995, she continued her graduate study in the same university
and majored in polymer processing. Three years later, she graduated with her master’s
degree and worked in Shanghai Huayi (Group) Company as an engineer. In 1999, she
was admitted to the Ph.D program in the Department of Chemical and Materials
Engineering at the University of Kentucky and joined Dr. Sinnott’s group. In 2000, she
transferred to the University of Florida and was admitted to the Department of Materials
Science and Engineering, to continue work on her Ph.D degree.