molecular and evolutionary analysis of cyanobacterial
TRANSCRIPT

UNF Digital Commons
UNF Graduate Theses and Dissertations Student Scholarship
2018
Molecular and Evolutionary Analysis ofCyanobacterial Taxonomic MethodsChelsea Denise VillanuevaUniversity of North Florida
This Master's Thesis is brought to you for free and open access by theStudent Scholarship at UNF Digital Commons. It has been accepted forinclusion in UNF Graduate Theses and Dissertations by an authorizedadministrator of UNF Digital Commons. For more information, pleasecontact Digital Projects.© 2018 All Rights Reserved
Suggested CitationVillanueva, Chelsea Denise, "Molecular and Evolutionary Analysis of Cyanobacterial Taxonomic Methods" (2018). UNF GraduateTheses and Dissertations. 810.https://digitalcommons.unf.edu/etd/810

MOLECULAR AND EVOLUTIONARY ANALYSIS OF CYANOBACTERIAL
TAXONOMIC METHODS
Chelsea D. Villanueva
MASTER’S THESIS
PRESENTED TO THE FACULTY OF THE
UNIVERSITY OF NORTH FLORIDA
IN CANDIDACY FOR THE DEGREE
OF MASTER OF SCIENCE
RECOMMENDED FOR ACCEPTANCE BY
THE DEPARTMENT OF BIOLOGY
Advisor: Dale A. Casamatta
April 2018

i
CERTIFICATE OF APPROVAL The thesis “Title” submitted by CDV Approved by the thesis committee: Date _____________________________ ___________________
Dr. Dale Casamatta
Committee Chair Person
______________________________ ____________________
Dr. Anthony Rossi
______________________________ _____________________
Dr. Judith Ochrietor
______________________________ ____________________
Mrs. Amy Keagy
Accepted for the Department:
_______________________________ _______________________
Dr. Cliff Ross, Chairperson
Accepted for the College of Arts and Sciences:
________________________________ ________________________
Dr. George Rainbolt
Dean
Accepted for the University:
___________________________________ _________________________
Dr. John Kantner
Dean of the Graduate School

ii
Acknowledgements
I would like to acknowledge the support of my committee members. Dr. Judith Ochrietor
offered unfailing support with many questions regarding cloning and sequencing techniques, as
well as much help with troubleshooting those same techniques. Dr. Tony Rossi recommended
many of the statistical approaches used in the third chapter of this thesis. Amy Keagy fostered
perspective, to find the balance between this thesis project and my other responsibilities in the
Department of Biology. Dr. Dale Casamatta provided four years of encouragement, advice,
guidance, and patience, and whose support formed the basis for this thesis and my entire
graduate career. I would also like to acknowledge my children for their support, especially for
every time a child knocked on my door to which my first response was “I’m working. Go ask
Papa.” I would like to thank my husband for all the dinners I didn’t cook, all the floors I didn’t
sweep, and all the walks I did not take the dog on because I was staring a screen looking for
patterns in the letters. Lastly, I would like to thank my lab mates for all their help and friendship.
Having a great place to work is the first step to doing good work.
iii
TABLE OF CONTENTS
TITLE PAGE
CERTIFICATE OF APPROVAL ........................................................................................ i ACKNOWLEDGEMENTS ................................................................................................ ii
TABLE OF CONTENTS ................................................................................................... iii LIST OF FIGURES ........................................................................................................... iv
LIST OF TABLES ............................................................................................................ vii ABSTRACT ..................................................................................................................... viii
INTRODUCTION ............................................................................................................. ix CHAPTER 1 ....................................................................................................................... 1
TITLE PAGE ...................................................................................................................... 1 ABSTRACT ........................................................................................................................ 2 INTRODUCTION ................................................................................................................. 2 METHODS ......................................................................................................................... 4 RESULTS ........................................................................................................................... 6 DISCUSSION .................................................................................................................... 21
CHAPTER 2 ..................................................................................................................... 26 TITLE PAGE .................................................................................................................... 26 ABSTRACT ...................................................................................................................... 27 INTRODUCTION ............................................................................................................... 28 METHODS ....................................................................................................................... 29 RESULTS ......................................................................................................................... 31 DISCUSSION .................................................................................................................... 51
CHAPTER 3 ..................................................................................................................... 55
TITLE PAGE .................................................................................................................... 55 ABSTRACT ...................................................................................................................... 56 INTRODUCTION ............................................................................................................... 57 METHODS ....................................................................................................................... 64 RESULTS & DISCUSSION ................................................................................................. 65 RECOMMENDATIONS ...................................................................................................... 74 CONCLUSION .................................................................................................................. 79
CONCLUSIONS .............................................................................................................. 81
LITERATURE CITED ..................................................................................................... 82 CURRICULUM VITA ..................................................................................................... 93

iv
List of Figures Figure 1.1 Photomicrographic plate of Brasilonema lichenoides sp. nov. (A-B) Freshly isolated cultures exhibit a thick, brownish-orange colored sheath subsequently lost in culture. False branching is common with abundant intercalary heterocytes. (C-D) Cultures (>3 weeks old) lost the sheath coloration and hormogonia were more prevalent with evident heteropolarity (tapering) and frequent necridic cells. Scale bars = 10 µm……………………………………………..……7 Figure 1.2 Photomicrographic plate of Chroococcidiopsis epilithica sp. nov. Note the presence of both baeocytes and nanocytes. Cultures also produced many extracellular vesicles of unknown function. Scale bars = 10 µm. ………………………………………………………….…...…….9 Figure 1.3 Maximum Likelihood tree of 16S rDNA gene sequence data for B. lichenoides. Numbers above the nodes represent Maximum Likelihood bootstrap values, while numbers below are from Maximum Parsimony. The new taxon is in bold………………………………10 Figure 1.4 Maximum Likelihood tree of 16S rDNA gene sequence data for C. epilithica. Numbers above the nodes represent Maximum Likelihood bootstrap values, while numbers below are from Maximum Parsimony. The new taxon is in bold…………………………........12 Figure 1.5 D-stem of the 16S-23S ITS region for Brasilonema lichenoides and the closest taxa containing available ITS data. A) B. lichenoides CDV clone 2, B) B. angustatum HA4787-MV1 B2/p1h, C) B. angustatum HA4787-MV1 B2/p1f, D) B. octagenarum HA4786-MV1 B7A/p4 ……………………………………………………………………………………………..…….14 Figure 1.6 D-stem of the 16S-23S ITS region for C. epilithica and taxa that are phylogenetically related. A) C. epilithica, B) C. thermalis PCC7203, C) C. sp. SAG2025, D) C. sp. UFS-A4UI-NPMV4-B4 clone B4....................................................................................................................16 Figure 1.7 Line drawing of Brasilonema lichenoides sp. nov. Scale bar = 10 µm........................18 Figure 1.8 Line drawing of Chroococcidiopsis epilithica sp. nov. Scale bar = 10 µm.................20 Figure 2.1 Maximum likelihood tree of B. geniculosa and the closest relatives based on 16S rRNA gene sequences. Numbers above the line represent ML values, numbers below MP........32 Figure 2.2 Maximum likelihood tree of C. dumas and the closest relatives based on 16S rRNA gene sequences. Numbers above the line represent ML values, numbers below MP..................33 Figure 2.3 D1-D1’ helices for B. geniculosus and closet relatives for which ITS sequence data is available a) B. geniculosus HWSC4C Clone IIA, b) B. geniculosus HWSC4C Clone IIB, c) B. lichenoides clone 5A, d) B. sp. RKST-3291 clone MB, e) B. sp. RKST-322 clone C1, f) B. sp. RKST-322 clone c2, g) B. octogenarum HA4186-MV1 clone b7a+p4, h) B. angustatum HA4187-MV1 clone b2+p1f, i) B. angustatum HA4187-MV1 clone b2+p1h............................35

v
Figure 2.4 Box B helices for B. geniculosus and closet relatives for which ITS sequence data is available a) B. geniculosus HWSC4C Clone IIA, b) B. geniculosus HWSC4C Clone IIB, c) B. lichenoides clone 5A, d) B. sp. RKST-3291 clone MB, e) B. sp. RKST-322 clone C1, f) B. sp. RKST-322 clone c2, g) B. octogenarum HA4186-MV1 clone b7a+p4, h) B. angustatum HA4187-MV1 clone b2+p1f, i) B. angustatum HA4187-MV1 clone b2+p1h............................37 Figure 2.5 V3 helices for B. geniculosus and closet relatives for which ITS sequence data is available. a) B. geniculosus HWSC4C Clone IIA, b) B. geniculosus HWSC4C Clone IIB, c) B. geniculosus HWSC4C Clone IIB second helix, d) B. geniculosus HWSC4C Clone IIB third helix, e) B. lichenoides clone 5A, f) B. sp. RKST-3291 clone MB, g) B. sp. RKST-322 clone C1, h) B. sp. RKST-322 clone c2, i) B. octogenarum HA4186-MV1 clone b7a+p4, j) B. angustatum HA4187-MV1 clone b2+p1f, k) B. angustatum HA4187-MV1 clone b2+p1h...........................39 Figure 2.6 D1-D1’ helices for C. dumas and closet relatives for which ITS sequence data is available. a) C. dumas HWSC1B clone A, b) C. dumas HWSC1B clone B, c) C. sp. SEV5-4-c5 clone operon 1, d) C. sp. SEV5-4-c5 clone operon II, e) C. sp. HA4395-MV3 clone B3-4+P5e, f) C. sp. HA4283-MV5 clone p11B, g) C. sp. HA4283-MV5 clone p11D, h) C. sp. HA4283-MV5 clone p11A, i) C. sp. HA4186-MV5 clone B2+P10ab.................................................................41 Figure 2.7 Box B helices for C. dumas and closet relatives for which ITS sequence data is available. a) C. dumas HWSC1B clone A, b) C. dumas HWSC1B clone B, c) C. sp. SEV5-4-c5 clone operon 1, d) C. sp. SEV5-4-c5 clone operon II, e) C. sp. HA4395-MV3 clone B3-4+P5e, f) C. sp. HA4283-MV5 clone p11B, g) C. sp. HA4283-MV5 clone p11D, h) C. sp. HA4283-MV5 clone p11A, i) C. sp. HA4186-MV5 clone B2+P10ab..................................................................42 Figure 2.8 V3 helices for C. dumas and closet relatives for which ITS sequence data is available. a) C. dumas HWSC1B clone A, b) C. dumas HWSC1B clone B, c) C. sp. SEV5-4-c5 clone operon 1, d) C. sp. SEV5-4-c5 clone operon II, e) C. sp. HA4395-MV3 clone B3-4+P5e, f) C. sp. HA4283-MV5 clone p11B, g) C. sp. HA4283-MV5 clone p11D, h) C. sp. HA4283-MV5 clone p11A, i) C. sp. HA4186-MV5 clone B2+P10ab...........................................................................44 Figure 2.9 Brasilonema geniculosis sp. nov., morphological variability and developmental stages. (cs) closed sheath, (os) opened sheath, (ps) purple sheath, (te) tapering end. Scale bars 10 µm..................................................................................................................................................46 Figure 2.10 Calothrix dumas sp. nov., morphological variability and developmental stages. (h) hormogonium, (hd) heteropolar development of hormogonium, (htc-b) basal heterocyte, (htc-i) intercalary heterocytes, (mg) microchaetoid growth, (nc) necridic cell, (s) sheath, (sb) scytonematoid branching. Scale bar 10 µm...................................................................................48 Figure 3.1 The 16S-23S rRNA operon in all bacteria, consisting of the promoter region, 16S gene, Intergenic Transcribed Spacer (ITS) region, 23S gene, 5S gene, and terminator sequence. Denoting the location of the ITS within the operon and the conserved domains of the ITS region flanked by the 16S and 23S genes.................................................................................................62

vi
Figure 3.2 Of 224 the 16S-23S ITS sequences (denoted as having a full or partial ITS) acquired from Genbank, the percentages of Full, Partial, and Unusable ITS regions………………..........66 Figure 3.3 Percentage of 207 ITS sequences with both Ile and Ala tRNA genes, no tRNA genes, or one tRNA within the ITS………………………………………………………………...........67 Figure 3.4 Individual conserved domains within the ITS for 216 usable ITS sequences for domains D1-D1’ helix, D2, & D3, and 207 usable sequences for the remaining domains...........68 Figure 3.5 All D1-D1ʹ helices, folded secondary structures, predicted using Mfold, for the Nostocaceae………………………………...................................................................................69 Figure 3.6 All D1-D1ʹ helices, folded secondary structures, predicted using Mfold, for the Tolypothricaceae...........................................................................................................................70 Figure 3.7 All Box B helices, folded secondary structures, predicted using Mfold, for the Nostocaceae………………………………...................................................................................71 Figure 3.8 Box B helices, folded secondary structures, predicted using Mfold, for the Tolypothricaceae...........................................................................................................................72 Figure 3.9 Unweighted maximum-likelihood (ML) phylogenetic analysis, comparing only ITS sequences for taxa with multiple operon sequences available within two Nostocales clades, Nostoc and Brasilonema, with an Oscillatoriaceaen outgroup, computed using MEGA 7, with bootstrap support obtained from 1,000 pseudo-replicate data sets. Clades of operons marked with either both (B), neither (N), or one (1) tRNA marked on the phylogeny. ....................................73 Figure 3.10 Standardized nomenclature for helical secondary structures of ITS operons as presented in Boyer et al. (2001) and visualized using a common motif of D1-D1’ helices marked with nucleotide numbers................................................................................................................75 Figure 3.11 Possible ITS operon variants within a single genome following ancient duplication events and variable selective pressures…………………………………………………...……...76 Figure 3.12 Consensus helical structural motifs identified from consensus multiple operons sequences.......................................................................................................................................77 Figure 3.13 Forced pairing of a single base pair (nucleotides 7 and 78) to produce a D1-D1’ helix more likely to occur (with more negative delta G free energy) and a more typical helix motif....79

vii
List of Tables Table 1.1 Similarity matrix based on the 16S rRNA gene sequence data from B. lichenoides sp. nov. and sister taxa.........................................................................................................................11 Table 1.2 Similarity matrix based on the 16S rRNA gene sequence data from C. epilithica and sister taxa.......................................................................................................................................13 Table 1.3 Comparing nucleotide lengths of conserved ITS domains for B. lichenoides sp. nov. and closest relatives that have available ITS data..........................................................................15 Table 1.4 Comparing conserved ITS domains for C. epilithica sp. nov. and closest relatives that have available ITS data..................................................................................................................17 Supplemental Table 1 Relevant physical data from cemetery tombstone sample collections......25 Supplemental Table 2 Comparative morphology of B. lichenoides and other members of the genus Brasilonema.........................................................................................................................25 Table 2.1 Comparing lengths in nucleotides of conserved ITS domains for B. geniculosus sp. nov. and closest relatives with available ITS data.........................................................................34 Table 2.2 Comparing lengths in nucleotides of conserved ITS domains for C. dumas sp. nov. and closest relatives with available ITS data........................................................................................40 Table 3.1 Results from Tajima's Neutrality Tests calculated for individual conserved domains within the ITS................................................................................................................................73

viii
Abstract
Cyanobacteria are a group of photo-oxygenic bacteria found in nearly every ecosystem,
but much cyanobacterial diversity, in various habitats, has yet to be explored. Cyanobacteria are
often conspicuous components of photosynthetic flora, providing significant carbon and nitrogen
inputs to surrounding systems. As possible primary colonizers of stone substrates not native to
this region, cyanobacteria isolated from headstones may provide biogeographically informative
data. An exploratory study of lichen-dominated microbial consortia, growing on headstones, was
conducted to isolate and identify novel microaerophytic cyanobacteria, and resulted in the
establishment of four novel cyanobacterial taxa. Phylogenetic analyses of photobionts in one
tripartite lichen revealed two novel taxa: Brasilonema lichenoides and Chroococcidiopsis
lichenoides. Using a total evidence approach, analyzing ecology, morphology, ITS structure,
and molecular data two additional taxa were described: Brasilonema geniculosus and Calothrix
dumas. Analysis of secondary structures of the Internal Transcribed Spacer (ITS) regions of the
16S-23S operon in cyanobacteria are commonly used in cyanobacterial taxonomy studies and
were applied to the identification of the new taxa in this study. However, the relationship
between ITS structures, hairpin loops (helices) in a region of non-coding DNA, has not been
thoroughly evaluated. The 16S-23S operon is one of many in prokaryotes with multiple copies
and there is evidence that operons may vary due to differential selective pressures or drift. A
study was undertaken analyzing ITS operons from 224 previously published cyanobacterial taxa
for domain inclusion and exclusion, intragenomic heterogeneity of ITS operons, and the possible
relevance of variable selective pressures affecting individual domains. Analysis revealed highly
variable ITS domain inclusion even in complete sequences, as well as high variation between
domains containing two or no tRNA sequences. Recommendations were made to standardize

ix
ITS analysis in the future to account for this possible variation. Further study is required to
statistically demonstrate to what extent ITS secondary structures correlate with taxonomy.
General Introduction to the Cyanobacteria
Cyanobacteria are a group of photo-oxygenic bacteria found in nearly every ecosystem.
Cyanobacteria are often conspicuous components of the photosynthetic microbial flora and
provide significant carbon and nitrogen inputs to surrounding systems. Traditionally classified
by morphological features, the advent and employment of modern molecular methods (e.g., the
16S rDNA gene sequence) has facilitated a much greater examination of the alpha-level
biodiversity in this clade (e.g., Casamatta et al. 2005; Perkerson et al. 2011). While the
cyanobacterial components of some habitats (e.g., planktonic) have been well characterized,
many others (e.g., terrestrial or subaerial) have been woefully understudied. In addition, the
majority of cyanobacteria described have been from temperate regions, with only very recent,
scant attention turned to less commonly sampled ecoregions (e.g., tropical, subtropical, polar).
However, these recent investigations have produced numerous new genera in marine (e.g.,
Roseofilum, Casamatta et al. 2012), tropical (e.g., Brasilonema, Fiore et al. 2007) and terrestrial
(e.g., Calochaete, Hauer et al. 2014) habitats.
The first taxonomic arrangements for cyanobacteria were suggested in the late nineteenth
century (Gomont 1892; Bornet & Flahault 1886-1888). In the twentieth century Frémy (1929)
and Geitler (1932) advocated only three orders of cyanobacteria, though Geitler later expanded
that to four orders (Geitler 1942). Rippka et al. (1979) expanded this scheme to include five
subsections of cyanobacteria, a system which formed the basis of most cyanobacterial taxonomy
until recently, and was the basis for the cyanobacterial section of Bergey’s Manual of Systematic
x
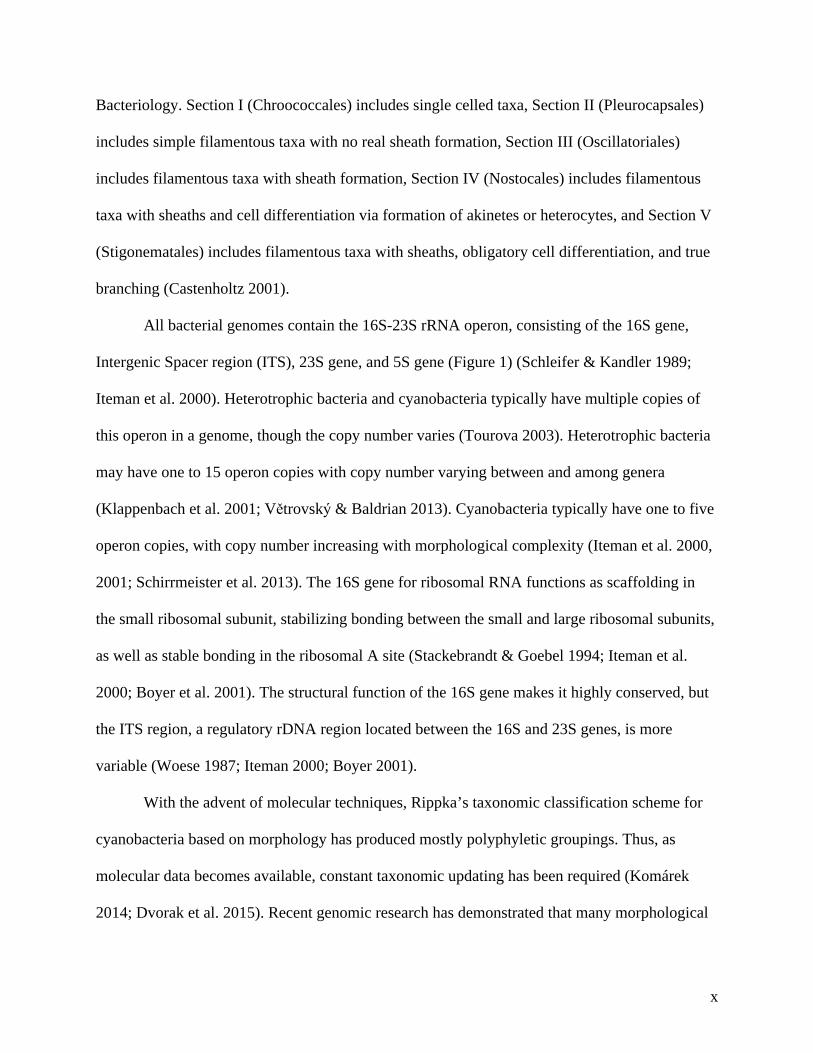
Bacteriology. Section I (Chroococcales) includes single celled taxa, Section II (Pleurocapsales)
includes simple filamentous taxa with no real sheath formation, Section III (Oscillatoriales)
includes filamentous taxa with sheath formation, Section IV (Nostocales) includes filamentous
taxa with sheaths and cell differentiation via formation of akinetes or heterocytes, and Section V
(Stigonematales) includes filamentous taxa with sheaths, obligatory cell differentiation, and true
branching (Castenholtz 2001).
All bacterial genomes contain the 16S-23S rRNA operon, consisting of the 16S gene,
Intergenic Spacer region (ITS), 23S gene, and 5S gene (Figure 1) (Schleifer & Kandler 1989;
Iteman et al. 2000). Heterotrophic bacteria and cyanobacteria typically have multiple copies of
this operon in a genome, though the copy number varies (Tourova 2003). Heterotrophic bacteria
may have one to 15 operon copies with copy number varying between and among genera
(Klappenbach et al. 2001; Větrovský & Baldrian 2013). Cyanobacteria typically have one to five
operon copies, with copy number increasing with morphological complexity (Iteman et al. 2000,
2001; Schirrmeister et al. 2013). The 16S gene for ribosomal RNA functions as scaffolding in
the small ribosomal subunit, stabilizing bonding between the small and large ribosomal subunits,
as well as stable bonding in the ribosomal A site (Stackebrandt & Goebel 1994; Iteman et al.
2000; Boyer et al. 2001). The structural function of the 16S gene makes it highly conserved, but
the ITS region, a regulatory rDNA region located between the 16S and 23S genes, is more
variable (Woese 1987; Iteman 2000; Boyer 2001).
With the advent of molecular techniques, Rippka’s taxonomic classification scheme for
cyanobacteria based on morphology has produced mostly polyphyletic groupings. Thus, as
molecular data becomes available, constant taxonomic updating has been required (Komárek
2014; Dvorak et al. 2015). Recent genomic research has demonstrated that many morphological
xi
traits classically used to classify cyanobacteria (e.g., multicellularity, baeocyte formation,
presence of akinetes, tapering, polarity, branching patterns) developed in several separate lines,
and were subsequently lost in some lineages (Schirrmeister 2011; Komárek 2013, Shih et al.
2013). Phylogenies constructed using taxa included in classic morphology-based taxonomy are
often polyphyletic because morphology does not always accurately represent evolutionary
relationships. This has led to three very different proposed methodologies for revision of
cyanobacterial taxonomy coming from different research camps (Komárek 2014).
One camp of researchers has been suggesting that the number of cyanobacterial taxa must
be dramatically reduced to simplify the taxonomic system (Drouet & Daily 1956; Drouet 1973,
1978, 1981; Bourrelly 1970; Otsuka et al. 2001). To the contrary, a second camp of researchers
has recommended bifurcation of polyphyletic groups of both genera and species until all
taxonomic units are monophyletic (Anagnostidis & Komárek 1985; Casamatta et al. 2005;
Johansen & Casamatta 2005; Rehakova et al. 2007; Siegesmund et al. 2008; Perkerson et al.
2011). Lastly it has been suggested that no further taxonomic changes should be implemented at
all until a great deal more molecular data is collected by researchers (Hoffman 2005). Komárek
(2014) recommended a new taxonomic system that reflects true evolutionary relationships by
attaining monophyletic groups with exiguous but evidently monophyletic genera that contain
fewer, more closely related species (proposal number two). Over fifty new genera were
described between 2000 and 2014, and the new taxonomy presented by Komárek (2014)
attempts to incorporate all those with good taxonomic standing.
The monophyletic species concept sensu Johansen and Casamatta (2005) derived from a
polyphasic approach has been proposed as the standard for cyanobacterial systematics (e.g.,
Komárek et al. 2014; Komárek, 2016), which requires the description of an apomorphy, along

xii
with ecology and molecular data, to test phylogenetic hypotheses. If a new strain of
cyanobacteria has <98% sequence similarity to previously described taxa, some habitat or
ecological incongruity, and a documented apomorphy, the case can be made to designate the new
strain as a novel species (Johansen & Casamatta 2005). Komárek’s (2014, 2016) system reflects
true evolutionary relationships by erecting monophyletic groups with exiguous but evidently
monophyletic genera that contain fewer, more closely related species.
Describing and elucidating cyanobacterial species, however, can be problematic, even
with genetic data. Morphological plasticity and cryptic diversity often mask how akin or
divergent various taxa are, stifling attempts to clarify cyanobacterial systematics with genetics
(Casamatta et al. 2003; Komárek et al. 2013; Dvořák et al. 2015). Traditionally, non-planctonic
cyanobacterial ecology has been woefully understudied, with only recent forays into non-lentic
ecologies just beginning, leaving the habitat ranges of many taxa to be revised (Dvořák et al.
2015). Altogether, this means that most cyanobacterial phylogenies remain unresolved (Dvořák
et al. 2015; Komárek 2016).
The 16S rDNA gene, however, has recently been shown to lack resolving power at the
species level for prokaryotes (Konstantinidis et al. 2006; Goris et al. 2007). The level of 16S
rRNA gene sequence similarity that corresponds to the accepted average nucleotide identity
(ANI) threshold for prokaryotic species identification has been calculated as 98.65% (Kim et al.
2014). There have been instances where well differentiated populations of phenotypically
different cyanobacteria had identical 16S and ITS sequences, though they varied considerably at
six nitrogen metabolism loci (Miller et al. 2006). Other potential molecular markers have been
suggested for use in prokaryotic taxonomy, such as the rpoB, nifD, psbA, rbcL genes (Case et al.
2007; Singh et al. 2014; Dvořák et al. 2014). Concatenation of the 16S marker data with other

xiii
molecular markers, collectively known as multilocus sequence analysis (MLSA), has become
common in molecular studies to address the taxonomic shortfalls of the 16S rRNA gene (Singh
et al. 2014; Wilmotte et al. 2017). However, a robust multilocus phylogenetic analysis of 23
coding genes, across eight cyanobacterial orders, showed that when compared to 16S rRNA
phylogenies, only minor differences were noted. This supported the continued use of the 16S
marker while confirming that the 16S lacks resolving power beyond the generic level (Mares
2017).
Without the use of morphological characters to act as apomorphies, and with the lack of
species level resolution in common molecular markers, differences in ITS secondary structures
have developed into a common taxonomic tool to describe new species (Iteman et al. 2001,
2002; Boyer et al. 2001; Johansen et al. 2005, 2011, 2013). Iteman (2000, 2002) pioneered the
use of ITS, previously identified as regulatory RNA in other prokaryotes though less highly
conserved than the 16S gene, with restriction fragment length polymorphisms of ITS amplicons
used to distinguish closely related taxa. Later works by Johansen et al. (e.g., 2005, 2011, 2013)
demonstrated how ITS secondary structures, obtained by folding conserved hairpin loop domains
within the ITS, could be used to delineate cryptic species, and were thus a powerful tool when
applied to phylogenetic studies. ITS secondary structures have become commonly used when
describing novel cyanobacterial taxa for the last decade (Johansen 2013; Komárek 2013; Engene
et al. 2015; Suradkar et al. 2017). However, protocols for ITS analysis have not been
standardized, and thus nomenclature and presentation of folded structures vary from author to
author (Johansen 2013; Komárek 2013; Engene et al. 2015; Suradkar et al. 2017).
Morphological plasticity and cryptic diversity have stifled attempts to clarify the
cyanobacterial taxonomies constructed using morphology, which has been partially ameliorated

xiv
with molecular techniques. Primary producers in most aquatic habitats, cyanobacteria are also
ubiquitous in terrestrial habitats, and range from tropical to polar climates around the globe
(Holland 1977; Rehakova et al. 2007). Frequently encountered in soils or biocrusts,
cyanobacteria are often present due to their capabilities of fixing atmospheric nitrogen, resisting
the harmful impacts of UV light, and their ability to enter a quiescent state during times of
environmental stress (Adams 2000; Flechtner et al. 2002). Few researchers actively categorize
new cyanobacterial taxa in the United States, and fewer still in the southeast. Phylogenetic
surveys of cyanobacteria using molecular techniques are still crucial to developing accurate
cyanobacterial taxonomy, but studies must begin to focus on ecological considerations as well
(Komárek 2014).
The goal of this research was to identify novel cyanobacterial taxa while clarifying
enigmatic evolutionary relationships between cyanobacterial taxonomy and ITS secondary
structures across all orders of cyanobacteria. This project surveyed lichenized and free-living
terrestrial cyanobacteria growing on headstones from the H. Warren Smith cemetery in
Jacksonville Beach, Florida. Biocrust samples collected from headstones were used for routine
cultural studies, and isolated cyanobacteria were identified via 16S-23S rDNA gene sequencing,
and closest related taxa analyzed morphologically and using folded ITS secondary structures.
Previously published (Genbank) sequence data was analyzed by comparing the secondary
structures of highly conserved ITS regions by creating a compendium of folded structures across
all four major cyanobacterial lineages. Additionally, ITS sequences from 224 samples sourced
from Genbank were analyzed by calculating relative sequence partiality as well as the inclusion
of individual conserved regions. This research accomplished two important things. First, the
survey of novel taxa provided data that aided in the revision of cyanobacterial systematics.

xv
Further, it described some endemic taxa from an under-represented region of the country.
Second, compiling a comprehensive data set of folded ITS secondary structures provided a
framework of comparable structures for use in future taxonomic studies. From this,
recommendations for standardization of these structures and associated nomenclature were
proposed.
The results of this work have been submitted as three separate publications, with each
publication corresponding to a chapter of this thesis. The first chapter has been published, while
the remaining two chapters have been submitted at the time this thesis completion. Chapter one
describes two novel cyanobacteria from a single tripartite lichen association. Chapter two
describes two novel cyanobacteria from two separate lichen associations. Chapter three is a
review of the state of ITS analysis standardization, with recommendations for these analyses in
the future.

1
Chapter 1: Brasilonema lichenoides sp. nov. and Chroococcidiopsis lichenoides sp. nov.
(Cyanobacteria): two novel cyanobacterial constituents isolated from a tripartite lichen of
headstones1
Chelsea D. Villanueva, Department of Biology, University of North Florida, Jacksonville,
Florida, 32224, USA
Petr Hašler, Department of Botany, Faculty of Sciences, Palacký University Olomouc,
Šlechtitelů 27, CZ-771 46 Olomouc, Czech Republic
Petr Dvořák, Department of Botany, Faculty of Sciences, Palacký University Olomouc,
Šlechtitelů 27, CZ-771 46 Olomouc, Czech Republic
Aloisie Poulíčková, Department of Botany, Faculty of Sciences, Palacký University Olomouc,
Šlechtitelů 27, CZ-771 46 Olomouc, Czech Republic
Dale A. Casamatta2, Department of Biology, University of North Florida, Jacksonville, Florida,
32224, USA; [email protected], phone: 904-620-1936, fax: 904-620-3885
1 Date of submission and acceptance: December 4, 2017
2 Corresponding author

2
Abstract
Cyanolichens are an assemblage of fungi and cyanobacteria from diverse, cosmopolitan habitats.
Typically composed of a single species of cyanobacterium, with or without another eukaryotic
alga, here we present two novel cyanobionts isolated from an undescribed tripartite lichen. This
endolithic lichen was isolated from a granite cemetery tombstone from Jacksonville, Florida, and
contains two potentially nitrogen-fixing cyanobionts. Employing a total evidence approach, we
characterized the cyanobionts using molecular (the 16S rDNA and ITS gene region),
morphological, and ecological data. Phylogenetic analyses revealed two novel taxa:
Brasilonema lichenoides and Chroococcidiopsis lichenoides, both of which fell within well
supported clades. To our knowledge, this represents the first instance of a tripartite lichen with
two cyanobacterial and no eukaryotic members. These types of lichens may well represent an
unexplored reservoir of cyanobacterial diversity. The specific epithets are proposed under the
provisions of the International Code of Nomenclature for Algae, Fungi, and Plants.
Key words: 16S rDNA gene, 16S-23S ITS, biodiversity, cyanolichen, taxonomy
Introduction
Cyanobacteria are a group of photooxygenic prokaryotes, and amongst the most
important primary producers on Earth. Much of the basic biodiversity of this group is poorly
understood, and many habitats have been only cursorily explored for their cyanobacterial
members (Dvořák et al. 2015b). Ubiquitous in nearly all known aquatic habitats, they are also
common components of numerous terrestrial environments (e.g., Holland 1977; Řeháková et al.
2007). Frequently encountered in soils, cyanobacteria are often present due to their capabilities

3
of fixing atmospheric nitrogen, resisting the harmful impacts of UV light, and their ability to
enter a quiescent state during times of environmental stress (Adams 2000; Flechtner et al. 2002).
Cyanobacteria are often also integral components of symbiotic relationships, such as with
mosses, angiosperms, and cycads (Rai 1990).
Lichen are composed of an algal or cyanobacterial photobiont incorporated into the body
of a fungi, with distribution patterns often reflecting algal climate and substrate preference
(Sanders 2001; Peksa and Škaloud 2011). A single fungal symbiont may envelope and direct the
growth of multiple photosynthetic endosymbionts, while hosting bacterial symbionts living on
fungal surfaces and in intercellular spaces (Grube and Berg 2009; Bjelland et al. 2011; Muggia et
al. 2013; Dal Grande et al. 2014). The fungal host, or mycobiont, provides a stable habitat for the
photosynthetic member and in exchange, the photobiont provides fixed carbon and, in the case of
cyanolichens, fixed atmospheric nitrogen (Sanders 2001). Recently, it has been noted that many
common lichens also contain basidomycete yeasts, although their role is currently under study
(Spribille et al. 2016). Cyanolichens, or lichens containing a cyanobacterial member, are
common components of epilithic and epiphytic habitats throughout the world (Rikkinen 2002).
Epilithic lichen populations inhabit stone surfaces, often directly on top of endolithic populations
living just within stone, but may host distinct microbial consortia (McNamara and Mitchell 2005;
McNamara et al. 2006).
Cyanobacteria photobionts of lichen biocrusts are often studied from a stone
biodeterioration perspective, less so as a source of cyanobacterial diversity (Crispim and
Gaylarde 2005). The cyanobacterial member of a lichen is typically filamentous and heterocyte
forming (e.g., Nostoc, Calothrix), putatively contributing carbon and nitrogenous compounds
(Rai et al. 2002). Other cyanolichens may be coccoid forms that fix nitrogen (e.g.,

4
Chroococcidiopsis, Gloeocapsa), filamentous forms without nitrogen fixing capabilities (e.g.,
Oscillatoria, Pseudanabaena, or involved in tripartite interactions with eukaryotic algae (e.g.,
Trentepolia) (Henskens et al. 2012; Pérez-Ortega et al. 2012). In this paper, we describe two
novel cyanobacteria isolated from a tripartite lichen containing no eukaryotic algal symbionts, a
new species of a filamentous, nitrogen fixing cyanobacterium (Brasilonema lichenoides) and a
new coccoid species (Chroococcidiopsis lichenoides) inhabiting granite headstones (Jacksonville
Beach, FL, USA).
Methods
Sampling Site
Isolates were obtained from H. Warren Smith cemetery (Jacksonville Beach, FL, USA).
Six individual headstones were sampled, which provided three to five epilithic and five
endolithic samples each. Epilithic samples were teased from headstones using a sterile scalpel
and transported in 1.5 mL micro centrifuge tubes. Endolithic samples were collected using non-
destructive, sterile tape sampling techniques (Cutler et al. 2012). Irradiance was measured at
each collection site using a basic quantum meter (Apogee Instrument Inc., Logan UT) and the
age and type of stone, the condition of the stone, the presence of effluents or nearby plant
growth, as well as the class and color of dominant lichen growth forms, and any color change of
growth after wetting was recorded (Supplemental Table 1).
Culturing
Microthallus samples were used to inoculate cultures to isolate photosymbionts.
Cyanobacterial isolates were cultured in liquid Z8 medium (Staub 1961) with the addition of 10

5
µL (1x) fungicide (Amphotericin, Cell Grow Virginia). Cultures were kept on a desktop, at
ambient conditions (23 °C, ca. 12:12 light:dark photoperiod). In addition, cultures were grown
on nitrogen free Z8 medium to test for nitrogen fixation. Thallus dissection was not possible due
to the small size.
Morphological assessment
Morphology of the strains was analyzed via light microscopy (Zeiss AxioImager,
objectives EC Plan–Neofluar 40×/1.3 N.A., oil immersion, DIC; Plan–Apochromat 100×/1.4
N.A., oil immersion, DIC). Images were taken with a high-resolution camera (AxioCam HRc
13MPx). Pictures were processed using with Zeiss AxioVision software (version 4.9.1.). During
morphological evaluation of natural samples and strains, the following characters were assessed:
cell shape, cell dimensions, type of cell reproduction, sheaths, and granulation of cells.
Measurements were performed on 100 cells of both natural and culture materials.
Molecular Techniques
DNA from cyanobacterial isolates was extracted with the PowerSoil™ DNA Kit from
0.25g of culture samples (Mo Bio Laboratories Inc., Carlsbad, CA). DNA quality was checked
on an ethidium bromide stained 1.5% agarose gel.
PCR amplification of the partial 16S rDNA and the whole 16S–23S ITS was performed
using primers forward 27F (5’–AGAGTTTGATCCTGGCTCAG–3’), and reverse B23S (5‘–
CTTCGCCTCTGTGTGCCTAGG –3’) previously described in Lane (1991). The 50 µl PCR
reaction contained: 27 µl sterile water, 1 µl of each primer (0.01 mM concentration), 20 µl PCR
Master Mix (Promega, Madison, WI) and 1 µl template DNA (50 ng/µl) and PCR amplification

6
proceeded as detailed in Casamatta et al. (2005). Amplified rDNA was cloned into pGEM® T
Vector System I and JM-109 High Efficiency Competent Cells (Promega, Madison, WI) and
cultured using carbenicillin infused LB media. Plasmid DNA was purified from eight replicate
transformed competent cell colonies per isolate, using QIAprep® Spin Miniprep Kits (QIAGEN,
Hilden, Germany). Sequencing of cDNA libraries from two operons of varying size was
performed by Eurofins Genomics (MWG Operon Inc., Louisville, KY).
A BLAST search (http://blast.ncbi.nlm.nih.gov/Blast.cgi) was used to obtain closely
related taxa. New 16S sequences were combined with sequences from GenBank having ≥93%
sequence similarity via BLAST searches. For both phylogenetic trees, sequences were aligned
together using the ClustalX web interface (Thompson et al. 1997) and manually checked and
edited using Maclade v.4.06 (Maddison and Maddison 2000). The GTR+I+gamma model was
selected using MEGA7: Molecular Evolutionary Genetics Analysis version 7.0 for bigger
datasets (Kumar et al. 2016). An unweighted maximum-parsimony (MP) and maximum-
likelihood (ML) analyses were carried out using MEGA 7 (Kumar et al. 2016), and bootstrap
support was obtained from 1,000 pseudoreplicate data sets.
The 16S-23S ITS region (ca. 800 bp) was analyzed by determining secondary structure of
the following conserved domains: D1-D1’ helix, Box-B helix, and the V3 helix. Secondary
structures of specific ITS motifs were predicted using comparative analysis combined with
confirmation in Mfold (Zuker 2003).
Results
Morphological assessment

7
Brasilonema was similar to other species, but with several distinctions. First, this strain
appeared brownish-orange when initially isolated, but subsequently lost in culture (Fig. 1.1).

8
Figure 1.1 Photomicrographic plate of Brasilonema lichenoides sp. nov. (A) Natural sample of filaments ensheathed by brownish sheaths, tolypotrichoid false branching at heterocytes (HTC). (B) Freshly isolated strain exhibits a thick, colorless sheath, (NC) necridic cells. This is in contrast to most Brasilonema which display a purple color. (C) Formation of false branching after trichome disintegration. (D-F) Hormogonia formation in apical parts of filaments surrounded by widened and layered mucilaginous sheath (>3 weeks old). Scale bars = 10 µm.
Second, B. lichenoides cells were discoid with very infrequent vacuolization and
developed inclusion bodies in culture. Third, heterocytes were rounded and never squared or
rectangular (Fig. 1.1). Fourth, B. lichenoides exhibited rare heteropolar filaments. Fifth, B.
lichenoides possessed undulated trichomes (Suppl. Table 2).
The new species of Chroococcidiopsis was morphologically similar to other taxa, but
with the simultaneous production of both baeocytes and nanocytes (Fig. 1.2). Further, strains
produced copious amounts of extracellular vesicles in culture (Fig. 1.2).

9
Figure 1.2 Photomicrographic plate of Chroococcidiopsis epilithica sp. nov. Note the presence of both A) baeocytes and B) nanocytes. Cultures also produced C) many extracellular vesicles of unknown function. Scale bars = 10 µm.
A
B
C

10
Molecular assessment
For both new taxa, both ML and MP trees were constructed, which yielded similar
topologies. A total of 70 taxa (ca. 1400 bp) were used in the construction of each tree, which
was subsequently winnowed down to a smaller set of OTUs, including all available species
sequences, for assessment in the respective genera.
Brasilonema sp. nov.
Both the winnowed ML and MP trees yielded similar topologies and thus only the ML
tree is included employing all available Brasilonema strains plus 14 sister taxa (Fig. 3).
Figure 3. Maximum Likelihood tree of 16S rDNA gene sequence data for B. lichenoides. Numbers above the nodes represent Maximum Likelihood bootstrap values, while numbers below are from Maximum Parsimony. The new taxon is in bold.

11
Brasilonema is a well-supported, monophyletic clade and the closest relative of our strain
was B. roberti-lamii (Bourrelly) Sant‘Anna et al. (85 and 90% support, respectively), which was
isolated from central Mexico. The new taxon shared between 98.5-98.7% sequence similarity to
the closest relatives, and 95.1% similarity with B. bromeliae Fiore et al., the type (Table 1.1).
Chroococcidiopsis sp. nov.
The new isolate fell within a highly supported (91%) clade containing other
Chroococcidiopsis taxa (Fig. 1.4).
Table 1.1 Similarity matrix based on the 16S rRNA gene sequence data from B. lichenoides sp. nov. and sister taxa.
1 2 3 4 5 6 7 8 9 10 11 12 13 14 15 16 17 1. B. lichenoides sp. nov. 2. B. octagenarum EF150855 98.7 3. Brasilonema sp. KR137602 98.7 99.5 4. Brasilonema sp. KT731163 98.7 99.4 99.4 5. Brasilonema sp. KR137603 98.5 99.9 99.4 99.4 6. Brasilonema sp. KR137581 98.4 99.8 99.3 99.3 99.9 7. B. roberti-lamii GQ443308 98.5 99.0 99.1 99.0 99.0 98.9 8. Brasilonema sp. KR137587 98.4 98.7 98.7 98.6 98.6 98.6 98.8 9. B. terrestre NR116034 96.7 97.7 97.6 97.6 97.7 97.6 97.1 98.0 10. Brasilonema sp. KJ636963 97.7 98.4 98.2 98.1 98.2 98.2 98.1 97.9 98.2 11. Brasilonema sp. EF117246 96.6 97.1 97.1 97.1 97.0 96.9 97.0 97.4 97.3 97.9 12. B. bromeliae NR115807 95.1 96.6 96.5 96.4 96.4 96.4 95.9 97.0 97.4 97.6 99.4 13. B. tolantongensis NR118308 97.8 98.5 98.2 98.3 98.4 98.3 98.0 97.7 98.1 99.9 97.7 97.4 14. B. octagenarum EF150854 98.7 100.0 99.5 99.4 99.9 99.8 99.0 98.7 97.7 98.4 97.1 96.5 98.5 15. Symphyonema sp. AJ544084 92.8 93.8 93.6 93.4 93.9 93.8 93.7 93.9 93.8 93.1 93.9 93.6 93.6 93.8 16. S. hyalinum AF334700 94.3 95.1 94.8 94.7 95.0 94.9 94.4 94.1 93.8 93.9 93.7 93.3 93.8 95.1 96.7 17. Calothrix sp. AM230697 87.1 88.2 88.1 87.7 87.9 87.8 88.4 88.1 88.9 88.9 88.5 88.4 89.2 88.0 90.3 89.3 18. Rivularia sp. AM230677 89.7 91.0 91.1 90.8 90.9 90.9 90.8 90.9 91.4 91.6 91.0 89.9 91.7 90.8 91.1 91.4 90.0

12
Figure 1.4 Maximum Likelihood tree of 16S rDNA gene sequence data for C. epilithica. Numbers above the nodes represent Maximum Likelihood bootstrap values, while numbers below are from Maximum Parsimony. The new taxon is in bold.
Myxosarcina sp. LEGE 06146 (HQ832897.1)Myxosarcina sp. BDU 60881 (GU186892.1)
Chroococcidiopsis sp. CCMP1489 (AJ344556.1)Xenococcus sp. PCC7307 (AB074510.1)
Pleurocapsa sp. PCC7319 (AB039006.1)Pleurocapsa sp. OU_12 (GQ162221.1)
Pleurocapsa minor SAG 4.99 (AJ344564.1)Pleurocapsa sp. CALU 1126 (DQ293994.1)Chroococcidiopsis sp. LEGE 06174 (HQ832924.1)
Dermocarpella incrassata SAG 29.84 (AJ344559.1)Dermocarpella sp. PCC 7326 (Z82807.1)
Myxosarcina sp. PCC 7312 (AJ344561.1)Pleurocapsa sp. PCC 7314 (AB074511.1)
Pleurocapsa sp. PCC 7516 (X78681.1)Stanieria sp. PCC7301 (AB039009.1)
Myxosarcina sp. PCC 7325 (AJ344562.1)Stanieria sp. CrN-P11 (DQ072926.1)
Dermocarpella (3 OTUs)
Pleurocapsa sp. SCyano22 (DQ058854.1)Xenococcus sp. HSC23 (EF150798.1)
Myxosarcina sp. CrN/V-P3 (DQ072931.1)Xenococcus sp. Pc66 (DQ058888.1)
Chroococcidiopsis sp. PCC 6712 (AJ344557.1)
Xenococcus (3 OTUs)
Stanieria (5 OTUs)
Pleurocapsa (2 OTUs)
Xenococcus sp. CR_34M (EF545618.1)Xenococcus sp. CR_15M (EF545606.1)
Chroococcus (5 OTUs)
Chroococcidiopsis sp. UFS -A4UI -NPMV4-B4 (KC525099.1)Chroococcidiopsis sp. (AJ34?)Chroococcidiopsis sp. B B 7 9 . 2, SAG 2 0 2 3 (AJ344552.1)
Chroococcidiopsis thermalis CHAB1690 (JX494785.1)Chroococcidiopsis thermalis SAG 42.79 (KM020000.1)Chroococcidiopsis sp. BB96.1, SAG 2 0 2 6 (AJ344555.1)
Chroococcidiopsis sp. CC2 (DQ914864.2)Chroococcidiopsis sp. CC3 (DQ914865.2)
Chroococcidiopsis sp. BB82.3, SAG 2024 (AJ344553.1)Chroococcidiopsis sp. SAG 2025 (AM709635.1)
Chroococcidiopsis epilithica sp. nov.Chroococcidiopsis thermalis PCC 7203 (NR_102464.1)
Chroococcidiopsis sp. 9E -07 (FR798923.1)Chroococcidiopsis cubana SAG 39.79 (AJ344558.1)Chroococcidiopsis thermalis P C C 7 2 0 3 (AB039005.1)Chroococcidiopsis sp. PCC 8201 (JF810081.1)Chroococcidiopsis sp. CCMP2728 (JF810075.1)
Gloeobacter violaceus strain PCC 7421 (NR_074282.1)
76
90
74
100
97
77
99
98
99
99
100
99
87
91
81
95
95
77
9796
0.05

13
Specifically, C. cubana Komárek & Hindák SAG39.79, isolated from a soil sample in
Cuba, numerous C. thermalis Geitler (e.g., CCAP 1423/1 from Roman baths in the United
Kingdom, SAG 42.79 from German soils), and assorted Chroococcidiopsis spp. (e.g., PCC8201
from mineral springs in Cuba and CCMP2728 from Pennsylvania, USA) fell within this clade.
The closest relative to our strain was C. thermalis PCC7203, isolated initially from soil near
Greifswald, Germany. The new taxon shared between 98.4-99.7 sequence similarity to the
closest relatives in the genus Chroococcidiopsis (Table 1.2).
ITS assessment
Brasilonema
Several sister taxa with available ITS regions were selected to examine the secondary
folding structures of the D1-D1' helix. The new taxon, for example, was most similar to B.
octogenarum, with an A-C side bulge off the initial stem loop and shared the exact same terminal
loop, with two nucleotide changes midstem, constraining the side bulge (Fig. 1.5a,d).
Table 1.2 Similarity matrix based on the 16S rRNA gene sequence data from C. epilithica and sister taxa.
1 2 3 4 5 6 7 8 9 1. C. cubana SAG 39.79 AJ344558 2. C. cubana SAG 39.79 JF810082 98.4 3. C. thermalis CCAP 1423/1 JX316763 99.4 98.3 4. C. thermalis CHAB 1690 JX494785 99.7 93.4 90.0 5. C. sp. CCMEE29 JF810080 99.6 89.1 99.3 90.1 6. Chroococcopsis gigantea SAG 12.99 KM019987 88.1 89.5 87.4 88.4 88.4 7. Myxosarcina sp. PCC7325 AJ344562 85.2 86.4 84.5 86.5 85.4 90.8 8. Xenococcus sp. AB074510 84.8 86.1 84.2 85.3 84.3 90.4 93.1 9. C. thermalis PCC7203 FJ805841 99.6 91.4 99.7 91.5 100 89.5 85.3 86.4 10. C. epilithica sp. nov. 98.3 97.1 97.9 99.1 98.1 86.8 83.3 84.0 98.2

14
Figure 1.5 D-stem of the 16S-23S ITS region for Brasilonema lichenoides and the closest taxa containing available ITS data. A) B. lichenoides CDV clone 2, B) B. angustatum HA4787-MV1 B2/p1h, C) B. angustatum HA4787-MV1 B2/p1f, D) B. octagenarum HA4786-MV1 B7A/p4.
The new taxon did not contain any tRNAs, similar to other Brasilonema isolates, e.g., B.
angustatum Vaccarino & Johansen HQ847566 and B. octagenarum Aguiar et al. HQ847562
(although other Brasilonema isolates do have tRNAs). The D1-D1' length was the same as the
other Brasilonema that lacked tRNAs (67 bp), as were three other regions (Table 3).
Output of sir_graph (©)mfold_util 4.7
Created Tue Jan 10 14:53:38 2017
dG = -17.00 [Initially -17.00] lichenoidesG
A
C
C
C
A
C
U
U
U
U
G
A
G
U
U
A
G
U
U
A
G
A
A
A
CA
CU U
A
G
U
U
A
A
U
A
A
C
U
AA
U
AA
C
U
C
A
A
A
A
G C CA
UCCC
GA
G
G
U
C5’ 3’
10
20
30
40
50
60
Output of sir_graph (©)mfold_util 4.7
Created Wed Jan 11 09:37:18 2017
dG = -21.90 [Initially -21.90] HQ847567G
A
C
C
C
G
C
U
U
U
U
G
A
A
U
U
U
G
U
G
C
U
C
A
A
C
A
G
U
U
UG
CA
A
A
A
A
C
U
G
A
U
G
A
G
U
GA
A
UC
A
A
A AAAC
U
C
A
A
A
A
G
U CA
U
CC
C
G
A
G
G
U
C5’ 3’
10
20
3040
50
60
70
Output of sir_graph (©)mfold_util 4.7
Created Wed Jan 11 10:11:17 2017
dG = -21.80 [Initially -21.80] HQ847566G
A
C
C
C
G
C
U
U
U
U
C
A
G
U
U
A
GCU
A
GA A
U
C
A
G
U
U
A
G
UU
A
G
U
A
A
C
U
G
A
U
A
A
C
U
G
A
A
G
A
G
C U AU
CCC
AA
G
G
U
C5’ 3’
10
20
30
40
50
60
Output of sir_graph (©)mfold_util 4.7
Created Wed Jan 11 10:02:33 2017
dG = -14.70 [Initially -14.70] HQ847562G
A
C
C
C
A
C
U
U
U
U
G
A
G
A
U
A
G
U
U
A
G
A
A
A
CA
CU U
A
G
U
U
A
A
U
A
G
C
U
A GUAA
C
U
C
G
A
A
A
G C UA
UCCC
GA
G
G
U
C5’ 3’
10
20
30
40
50
60
A B DC

15
Table 1.3 Comparing nucleotide lengths of conserved ITS domains for B. lichenoides sp. nov. and closest relatives that have available ITS data.
Strain
Leader
D1-D
1' Helix
spacer+D2+spacer
D3+spacer
tRN
A Ile gene
spacer+V2+spacer
tRN
A A
la gene
Spacer
Box-B
+spacer
Box A
D4+spacer
V3+ITS end (partial)
B. lichenoides CDV strain 1 10 67 38 138 48 11 19 57
B. angustatum HQ847567 10 79 38 11 74 60 73 126 49 11 19 110
B. angustatum HQ847566 10 67 38 129 49 11 19 110
B. octagenarum HQ847562 10 67 38 139 47 11 19 108
While the size of the sequence for the B. angustatum with the tRNAs was larger as it
contained the sequence, the new taxon was closer to B. octogenarum in terms of overall length
(139 v. 138) compared to either B. angustatum (126 and 129 bp, respectively).
Chroococcidiopsis
The new taxon was structurally identical to the closely related C. thermalis PCC7203,
with the only difference being the presence of a UUU segment at the terminal tip in our taxon
and single nucleotide substitution (G to a C) immediately above the second internal loop, below
the A- side bulge (Fig. 1.6a,b).

16
Figure 1.6. D-stem of the 16S-23S ITS region for C. epilithica and taxa that are phylogenetically related. A) C. epilithica, B) C. thermalis PCC7203, C) C. sp. SAG2025, D) C. sp. UFS-A4UI-NPMV4-B4 clone B4.
A close relative, C. thermalis PCC7203 which formed a sister clade to the majority of
other Chroococcidiopsis, showed a similar folding pattern, but with distinct single nucleotide
mutations (Fig. 1.6c). Another Chroococcidiopsis, C. sp. SAG2025, which fell within this clade,
had a very different structure (Fig. 1.6d). Two other outgroup taxa from the sister clade (Fig.
1.6e,f) were markedly different in ITS structure, with corresponding differences in overall
conserved segment lengths (Table 1.4).
Output of sir_graph (©)mfold_util 4.7
Created Wed Jan 25 11:10:13 2017
dG = -34.70 [Initially -34.70] 17Jan25-11-10-12G
A
C
C
A
A
C
U
U
C
A
G
U
A
A
C
C
A
G
UA
G
A
G
A
G
U
GA
C
C
G
G
U
G
C
C
G
A
U
UG U
A
U
C
G
G
C
A
A
A
G
G
C
A
C
U A AC
AC
CA
AG
C
U
G
G
A
A
A
C
U
G
A
G
G A CA
UCC
CG
AG
G
U
C5’ 3’
10
20
30
40
50
60
70
80
90
Output of sir_graph (©)mfold_util 4.7
Created Wed Jan 25 11:59:28 2017
dG = -16.40 [Initially -16.40] 17Jan25-11-59-27G
A
C
C
U
A
C
CU
A
A
C
U
C
A
AA
A
C
G
A
CA
A
A
A
G
U
U
A
AU C
A
A
A
UC
U
A
G
U
C
G
A
U
U
G
A
G
U
U
G
G
U
C AU
C
CCA
A
G
G
U
C5’ 3’
10
20
30
40
50
60
Output of sir_graph (©)mfold_util 4.7
Created Mon Feb 13 12:29:59 2017
dG = -31.30 [Initially -31.30] 17Feb13-12-29-58G
A
C
C
A
A
C
U
U
C
A
G
U
A
A
C
C
A
G
UA
G
A
G
A
G
U
GA
U
C
G
G
U
G
C
C
G
A
U
UU U
A
U
C
G
G
C
A
A
G
G
G
C
A
C
U A AC
AA
CA
AG
C
U
G
G
A
A
A
C
U
G
A
G
G A CA
UCC
CG
AG
G
U
C5’ 3’
10
20
30
40
50
60
70
80
90
Output of sir_graph (©)mfold_util 4.7
Created Mon Feb 13 12:47:47 2017
dG = -20.80 [Initially -20.80] 17Feb13-12-47-46G
A
C
C
A
A
C
U
U
C
A
G
U
A
A
C
C
A
G
UAA
CC
A
G
CG
AC
C
A
G
C
G
A
C
CA
G
UA
AG
A
U
G CG
U
C
A
C
G
G
U A
CU
G
C
C
G
GA
C
A
A
G
A
G
C
U
G
G
A
A
A
C
U
G
A
G
G A UA
UCC
CG
AG
G
U
C5’ 3’
10
20
30
40
50
60
70
80
90A B C D

17
Table 1.4 Comparing conserved ITS domains for C. epilithica sp. nov. and closest relatives that have available ITS data.
Strain
Leader
D1-D
1' Helix
spacer+D2+spacer
D3+spacer
tRN
A Ile gene
spacer+V2+spacer
tRN
A A
la gene
Spacer
Box-B
+spacer
Box A
D4+spacer
V3+ITS end (partial)
C. epilithica 8 93 57 23 74 48 106 11 35
C. thermalis FJ805841 8 93 57 23 74 48 106 11 57
C. thermalis NR112108 8 93 52 28 74 48 106 11 57
C. sp. AM709635 8 97 52 28 74 40 108 11 59
C. sp. KC525099 9 67 37 97 101 11 87
Description of new taxon
Brasilonema lichenoides Villanueva et al. sp. nov.
Description: Culture (Fig. 1.7): Colonies initially isolated from lichens and consisting of
interwoven filaments that occasionally stood erect from the substrate. Trichomes straight, bent,
or undulated inside the sheath, constricted at cross walls. Sheaths brown-orange (fresh isolates)
to colorless (culture), distinct, firm, becoming thin and colorless or disappearing in culture, up to
2.5 µm wide, seldom layered at the basal part near the false branching. Filaments straight or bent,
typically non-tapering (very infrequently heteropolar towards the end), false branched.
Meristematic zones if present usually short and located near the apical or basal parts. Cells
flattened or barrel-shaped, green to blue-green with peripheral chromatoplasm and central
nucleoplasm, frequently granulated in culture, typically non-vacuolated, 4.1 ±0.9 wide (avg. ±
STD) × 9.1 ±0.7 µm long, apical cells rounded. Heterocytes common, intercalary, occasionally
18
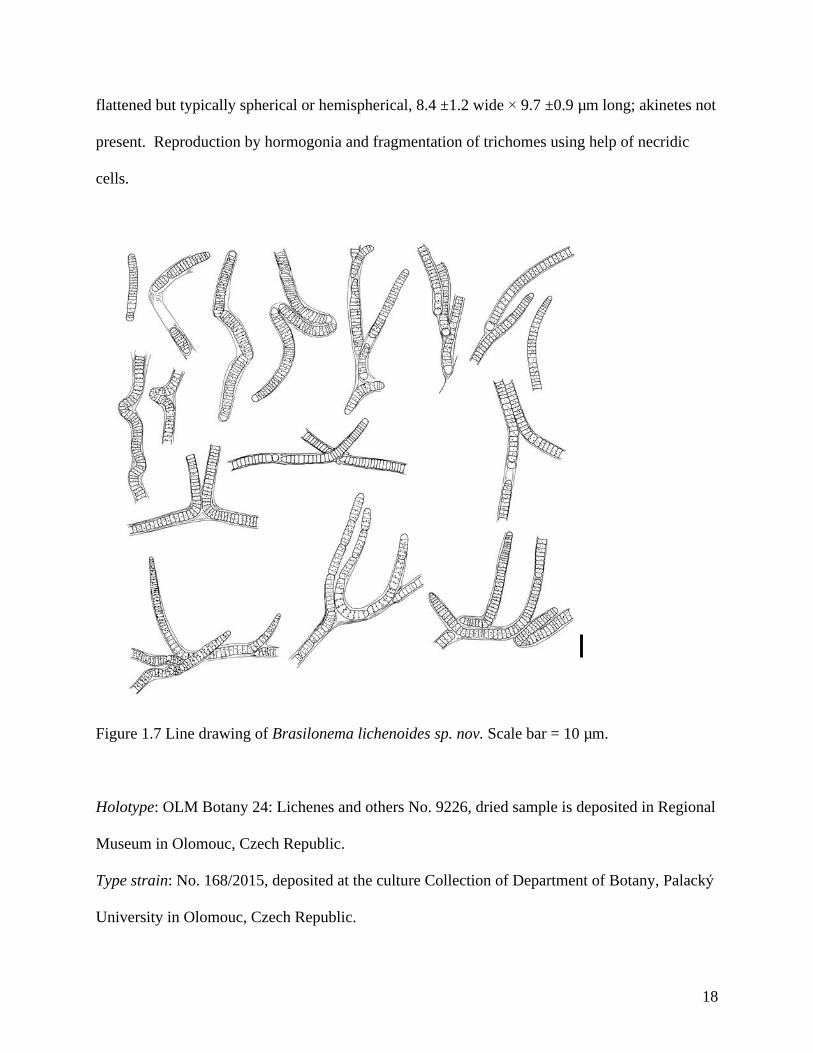
flattened but typically spherical or hemispherical, 8.4 ±1.2 wide × 9.7 ±0.9 µm long; akinetes not
present. Reproduction by hormogonia and fragmentation of trichomes using help of necridic
cells.
Figure 1.7 Line drawing of Brasilonema lichenoides sp. nov. Scale bar = 10 µm.
Holotype: OLM Botany 24: Lichenes and others No. 9226, dried sample is deposited in Regional
Museum in Olomouc, Czech Republic.
Type strain: No. 168/2015, deposited at the culture Collection of Department of Botany, Palacký
University in Olomouc, Czech Republic.
19
Type locality: Marble tombstones from the H. Warren Smith Cemetery, Jacksonville Beach,
Florida, USA (GPS: 30.2890° N, 81.4071° W).
Genbank accession numbers: MF423720 (16S rRNA) and MF423719 (ITS region)
Etymology: Name is based on habitat of isolation as a cyanobiont of a tripartite lichen.
Habitat: Growing in consortia as a lichen on cemetery tombstones.
Chroococcidiopsis lichenoides Villanueva et al. sp. nov.
Description: Culture (Fig. 8): Thallus microscopic to macroscopic, colonies usually spherical or
hemispherical, 31.4 ±4.2 (avg. ± STD) × 26.1 ±5.6 µm, aggregated into thin greenish layer.
Mucilaginous envelopes thin, firm, and colorless. Cells variable in shape from almost spherical,
oval to irregular, 4.7 ±0.79 wide × 3.3 ±0.5 µm long, bright green or grey-green, densely and
irregularly aggregated inside the colony into sarcinoid packages. Reproduction by growth and
fragmentation of colonies into subcolonies, by gelatinization and splitting of envelopes and
liberation of cells and small oval or irregular baeocytes 3.1 ±0.62 × 2.2 ±0.3 µm.

20
Figure 1.8 Line drawing of Chroococcidiopsis epilithica sp. nov. Scale bar = 10 µm.
Holotype: Holotype OLM Botany 24: Lichenes and others No. 9227, dried sample is deposited in
Regional Museum in Olomouc, Czech Republic.
Type strain: No. 165/2015, deposited at the culture collection of Department of Botany, Palacký
University in Olomouc, Czech Republic.
Type locality: H. Warren Smith Cemetery, Jacksonville Beach, Florida, USA (GPS:
30°17'20.2"N 81°24'24.9"W).
Genbank accession numbers: MF423482 (16S rRNA) and MF423720 (ITS region)
Etymology: Name is based on habitat of isolation as a cyanobiont of a tripartite lichen.
Habitat: Growing in consortia as a lichen on cemetery tombstones.

21
Discussion
Most cyanobionts are capable of nitrogen fixation (Rai 2002). Cyanobionts may be
filamentous or unicellular, with the former employing heterocytes and the later using micro-
anaerobic zones to fix atmospheric nitrogen. In the sampled lichen, we note the presence of both
forms, which were each capable of growth on nitrogen-free medium. However, it cannot
absolutely determine if they both fix nitrogen in situ, as has been noted elsewhere (Rai 2002).
Likewise, the potential role of associated bacteria cannot be discount. It is important to note that
cyanobionts may exhibit phenotypic variability between lichenized and free-living states (e.g.,
Casamatta et al. 2006), and was also noted in this study.
Brasilonema lichenoides sp. nov. is the first Brasilonema species isolated from a lichen
thallus. The type species B. bromeliae is a member of the Scytonemataceae isolated from
subaerophytic habitats in tropical and subtropical Brazil (Fiore et al. 2007). Several aerophytic,
epiphytic, and epilithic Brasilonema species have been isolated from Hawaii, central Mexico,
and Brazil (Aguiar et al. 2008, Vaccarino et al. 2012, Becerra-Absalón et al. 2013, Rodarte et al.
2014). Brasilonema lichenoides was most closely related to B. roberti-lamii, and both strains
were growing epilithically in warm humid climates (Rodarte et al. 2014). One of the defining
features of Brasilonema is the presence of vacuole-like structures (actually free-spaces within
protoplasts surrounded by thylakoids; Fiore et al. 2007), but the new strain did not exhibit such
vacuolization. Our strain did exhibit both “C” and “J” shaped trichomes, similar to our closest
relative, B. roberti-lammi (Rodartel et al. 2014). While Brasilonema is described as non-
attenuated, our new taxon did exhibit rare heteropolarity. Further, we note that the images of B.
angustatum show a similar degree of filament heteropolarity and J-shaped trichomes to the new

22
taxon (Fig. 2, sensu Vaccarino and Johansen 2012). The new strain represents a unique taxon
based on ecology (photobiont), morphology, and molecular (16S) data.
Chroococcidiopsis is a widely distributed genus of cyanobacteria, often found in xeric
habitats with high UV light levels (Dor et al. 1991). They may be found in freshwater, marine,
and subaerial habitats (Cumbers and Rothschild 2014). Notoriously difficult to phylogenetically
elucidate based solely on morphological characters (e.g., Norris and Castenholz 2006), this genus
traditionally belongs to subsection II (Pleurocapsales) of the cyanobacteria (Rippka et al. 2001,
Wilmotte and Herdman 2001), which includes cyanobacteria which produce baeocytes.
However, recent work by Komárek et al. (2014) have transferred this clade to the
Chroococcidiopsidales ordo nov. due to baeocyte formation coupled with cell division in three
planes. Chroococcidiopsis rarely show their typical mode of reproduction while lichenized, even
if they would typically do so in a free-living or cultured state (Friedel and Büdel 1996). The new
strain clearly showed baeocyte formation and division in three planes in culture (Fig. 3). Further,
results of 16S rDNA sequence data and ITS secondary folding patterns showed that this strain
fell within the “Chroococcidiopsis” sensu stricto clade with high bootstrap support. However,
the new isolate did not match any morphological description or ecology (e.g., tripartite lichens of
headstones in Florida) of any currently circumscribed species. Büdel and Henssen (1983) note
similar strains isolated as phycobionts from the lichen family Lichinaceae, but their isolates were
of different sizes, different baeocyte arrangements, or different sheath production.
Chroococcidiopsis lichenoides forms individual spherical colonies or clusters resembling
sarcinoid packages. Colonies fragment and continue their growth or produce small spherical,
oval, or irregular baeocytes. Shape, colony structure, and symbiotic mode of life are specific for
this species.

23
Species concepts within the cyanobacteria are subject to much debate (Dvořák et al.
2015b). Given the dearth of morphological features from which to choose, coupled with issues
related to both phenotypic plasticity and cryptic diversity, describing and elucidating
cyanobacterial species may be problematic (Dvořák et al. 2015, Dvořák et al. 2017, Strunecký et
al. 2017). The monophyletic species concept sensu Johansen and Casamatta (2005) has been
proposed as the standard for cyanobacterial systematics (e.g., Komárek 2013), which requires the
description of an autapomorphy to test phylogenetic hypotheses. The new strain was only 98%
similar to C. thermalis, the closest relative based on 16S sequence data. It is proposed that the
morphological disjunction, unique ecological setting, 16S sequence dissimilarity, and difference
in ITS sequence justifies the erection of a new taxon.
All lichens contain at least a single photobiont, and only ca. 10% of all lichens contain
cyanobacteria as their primary photobiont (Friedel and Büdel 1996). The majority of tripartite
lichens (those with two photosynthetic members) contain a single cyanobacterial photobiont and
a green alga (Tschermak-Woess 1988). In these cases, the cyanobacterial component is
sequestered into a separate region of the thallus, the cephalodia. The novel cyanobionts were not
separated into cephalodia, but rather loosely organized into the thallus of the endolithic lichen.
Headstones represent an interesting substrate to explore algal diversity and colonization.
The sampled headstones were all >50 years old, and provide a stable (e.g., no history of
headstone cleaning or preservation) environment for primary colonization. This is also an
intriguing habitat to examine patterns of long-distance cyanobacterial dispersal. Many lichens
contain photobionts with cosmopolitan distribution (Chua et al. 2012), and some cyanolichen
guilds share similar cyanobionts (Rikken 2002). However, it remains unclear if the new taxa
have broad or limited distribution as more sampling is needed. Tombstones are also interesting

24
habitats to answer questions relating to ecological succession and facilitation of microbial
communities.
Acknowledgements
The lead author thanks Gordon Rakita for an introduction to the exciting world of cemetery
tombstone preservation. The authors gratefully acknowledge financial support from the
Department of Biology (UNF), the Coastal Biology Flagship program (UNF), and the Internal
Grant Agency of Palacký University in Olomouc No. PrF-2017-001.

25
Supplemental Table 1: Relevant physical data from cemetery tombstone sample collections.
Sample site
Stone type
Age of stone (yrs)
Surface integrity
Irradiance (µmol·m-
2·sec-1)
Canopy cover
Effluents present
Soil deposition
Aspects showing growth
Aspects sampled
Lichen forms sampled
1 Granite 41 Pitting 44 + - - North North Foliose, leprose
2 Granite 41 Pitting 30 + - + All aspects North, East, & Top
Foliose, crustose
3 Granite 38 Pitting 80 + - - North, East, & West
North, East, & West
Leprose, crustose
4 Granite 38 Pitting 65 + + - North and West
North & West
Foliose, crustose
5 Granite 42 Intact 46 + + - All aspects North, West & Top
Leprose, crustose
6 Marble 61 Intact 26 + - - All aspects East, West, & Top
Foliose, crustose
Supplemental Table 2. Comparative morphology of B. lichenoides and other members of the genus Brasilonema.
B. lichenoides 8-12Brown-orange to colorless
Abundant single & geminate
Straight, bent, or undulated
Constricted at cross walls
Rarely hetropolar
Green to blue green Discoid 2-4
Flattened, round or hemispherical Intercalary
Endolithic lichen
B. roberti-lamyii12-18 ColorlessRare Tolypothricoid Cylindrical
Not or indistinctly constricted at cross walls Filaments isopolar Isodiametric
Discoid to cylindrical Aerophytic
B. angustatum 9.8 - 18 ColorlessAbundant single & geminate
Constricted at cross walls
Filaments isopolar, branches heteropolar
Brownish or purple grey Isodiametric 3-9 Elongated Intercalary
Terrestrial, epiphytic
B. bromeliae 10-21
Colorless to yellowish brown Rare Cylindrical
Slightly constricted
Not attenuated toward the end
Blue, gray, olive or brownish violet green 1.8-16
Discoid to cylindrical Intercalary
Small pools, on wooden substartes
B. terrestre 12-17
Colorless to yellowish brown Coeleodesmoid Cylindrical
Not constricted at cross walls
Grayish green to blue green
Isodiametric, shorter toward the end
Barrell shaped to cylindrical
Subaerophytic on concrete
B. ornatum 20-23 ColorlessVery rare branching Cylindrical
Distinctly constricted
Not attenuated toward the end
Dark blue green Discoid Discoid
Subaerophytic on bark, possibly lichenized
B. epidendron 12-14 ColorlessVery rare branching Cylindrical
Not constricted at cross walls
Not attenuated toward the end
Bright blue green
Isodiametric, cylindrical or shortened
Barrell shaped to cylindrical
Subaerophytic on bark
B. octegenarum9.8 - 18.5 Colorless
Rare Tolypothricoid, Scytonematoid Cylindrical
Not constricted at cross walls Isopolar
Olive green or brownish-violet Cylindrical 1.5- 13.3
Discoid or cylindrical
Basal or intercalary Epiphytic
Filament Width (µm) Sheath Color
Heterocyte ShapeFalse Branching HabitatCell Shape
Heterocyte PositionTapering
Cell Length (µm)Cell Color
Trichome shape Trichomes

26
Chapter 2: Descriptions of Brasilonema geniculosus and Calothrix dumas (Nostocales,
Cyanobacteria): two new taxa isolated from cemetery tombstones.
CHELSEA D. VILLANUEVA1, ALYSSA D. GARVEY1, PETR HAŠLER2, PETR DVOŘÁK2,
ALOISIE POULÍČKOVÁ2, ALYSON R. NORWICH & DALE A. CASAMATTA1,*
1 Department of Biology, University of North Florida, Jacksonville, Florida, 32224, USA
2 Department of Botany, Faculty of Sciences, Palacký University Olomouc, Šlechtitelů 27, CZ-
771 46 Olomouc, Czech Republic
* Author for correspondence: [email protected], phone: 904-620-1936, fax: 904-620-3885
1 Date of submission and acceptance: March 21, 2018

27
Abstract
Cyanobacteria are common members of epilithic communities, contributing fixed carbon and
nitrogen products, providing UV light shielding pigments, helping to retain water, and in general
stabilizing particles. Conversely, biofouling by cyanobacteria is of great concern in the U.S. and
abroad. The epilithic growth of cyanobacteria on cultural monuments has been long noted, yet
the basic systematics and diversity of these organisms is poorly understood. This paper
describes two novel cyanobacteria isolated from cemetery tombstones from Jacksonville, Florida
(USA). Using a total evidence approach of ecology, morphology, ITS structure, and molecular
data we present two taxa new to science: Brasilonema geniculosus and Calothrix dumas. We
note that tombstones represent an intriguing habitat for sampling cyanobacteria due to their
ubiquity, stability, and cultural importance.
Keywords: biodiversity, systematics, 16S-23S ITS secondary structure

28
Introduction
The last decade has seen an explosion in the number of novel cyanobacterial taxa as researchers
have begun to unravel the systematic relationships of this lineage. Previous impediments to
describing novel cyanobacterial diversity, such as a lack of clear species concepts, elusive
character sets, and restricted habitat sampling have all been addressed and ameliorative
endeavors undertaken (e.g., Johansen & Casamatta 2005; Dvořák et al. 2015). New assessments
of family level characters (Komárek et al. 2016), coupled with new investigations into
traditionally understudied habitats (e.g., sub-aerial samples and lichen associated cyanobionts),
have facilitated work on alpha-level cyanobacterial diversity.
One potentially rich source of novel cyanobacteria is from stone substrata. These unique
taxa may be free-living (e.g., Geitleria sensu Kilgore et al. 2018) or in complex consortia with
other microbes, such as lichens (e.g., Villanueva et al. 2018). Uher (2008) notes that humidity
and microclimate might influence the vertical distribution of cyanobacteria on tombstone
substrates in a central European cemetery. Subaerial cyanobacteria are common components of
epilithic communities contributing to carbon and nitrogen fixation, water retention, and habitat
facilitation (Casamatta et al. 2002, Lopez-Bautista et al. 2007). Conversely, biofouling of
monuments by cyanobacteria is a world-wide issue, impacting both efforts at historic
preservation and being economically burdensome (Bellazza et al. 2003). del los Ríos et al.
(2002) note that cyanobacteria may actually draw ions out of the substrate leading to
biomineralization and subsequent deterioration. Cyanobacteria may thrive in subaerial
environments due to their ability to form biofilms (Adhikary et al. 2015), which in turn may lead
to accelerated weathering of substrata from acid production (Gaylarde & Morton 1999), although
29
potential ameliorative impacts from the cyanobacterial community on these habitats have been
proposed (Carter & Viles 2003).
In this paper we present to novel cyanobacteria isolated from lichen dominated consortia
from cemetery tombstones in Jacksonville, FL, USA: Brasilonema geniculosus and Calothrix
dumas. The specific epithets are proposed under the provisions of the International Code of
Nomenclature for Algae, Fungi, and Plants.
Methods
Sampling Site
Isolates were obtained from H. Warren Smith cemetery (Jacksonville Beach, FL, USA, collected
in May 2013 from ca. 45-76 cm above ground). Six individual headstones were sampled, which
provided five epilithic samples each. Epilithic samples were teased from headstones using a
sterile scalpel and transported in 1.5 mL micro centrifuge tubes. Irradiance was measured at
each collection site using a basic quantum meter (Apogee Instrument Inc., Logan UT) and the
age and type of stone, the condition of the stone, the presence of effluents or nearby plant
growth, as well as the class and color of dominant lichen growth forms, and any color change of
growth after wetting was recorded (Table 1).
Culturing
Scraped samples were used to inoculate cultures to isolate cyanobacteria and grown in liquid Z8
medium (Staub 1961) with the addition of 10 µL (1x) fungicide (Amphotericin, Cell Grow
Virginia). Cultures were kept on a desktop, at ambient conditions (23 °C, ca. 12:12 light:dark
photoperiod). In addition, cultures were grown in nitrogen free medium to test for the
production of heterocytes.
30
Morphological assessment
Morphology of the strains was analyzed via light microscopy (Zeiss AxioImager, objectives EC
Plan–Neofluar 40×/1.3 N.A., oil immersion, DIC; Plan–Apochromat 100×/1.4 N.A., oil
immersion, DIC). Images were taken with a high resolution camera (AxioCam D512 12MPx).
Pictures were processed using with Zeiss AxioVision software (version 4.9.1.). During
morphological evaluation of natural samples and strains, the following characters were assessed:
cell shape, cell dimensions, reproduction, sheaths, and granulation of cells. Measurements were
performed on 100 cells of both natural and culture materials.
Molecular Techniques
DNA was extracted with the PowerSoil™ DNA Kit from 0.25g of culture samples (Mo Bio
Laboratories Inc., Carlsbad, CA). DNA quality and consistence was checked on ethidium
bromide stained 1.5% agarose gel.
PCR amplification of the partial 16S rDNA and the whole 16S–23S ITS was performed
using primers forward 8F (5´–AGTTGATCCTGGC–3´), and reverse B23S (5´–
CTTCGCCTCTGTGTGCCTAGG –3´) previously described in Osorio-Santos et al. (2014). The
50 µl PCR reaction contained: 19 µl sterile water, 2 µl of each primer (0.01 mM concentration),
25 µl PCR Master Mix (Promega, Madison, WI) and 2 µl template DNA (50 ng/µl) and PCR
amplification proceeded as detailed in Villanueva et al. (2018). Amplified rDNA was cloned
into pGEM® T Vector System I and JM-109 High Efficiency Competent Cells (Promega,
Madison, WI) and cultured using carbenicillin infused LB media. Plasmid DNA was purified
from eight replicate transformed competent cell colonies per isolate, using QIAprep® Spin
Miniprep Kits (QIAGEN, Hilden, Germany). Sequencing of cDNA libraries from two operons of
varying size was performed by Eurofins Genomics (MWG Operon Inc., Louisville, KY).

31
A BLAST search (http://blast.ncbi.nlm.nih.gov/Blast.cgi) was used to obtain closely
related taxa. Our 16S sequences were combined with sequences from GenBank having ≥93%
sequence similarity via BLAST searches. For both phylogenetic trees, sequences were aligned
and the T3K+I+gamma model was selected using MEGA7: Molecular Evolutionary Genetics
Analysis version 7.0 for bigger datasets (Kumar et al. 2016). An unweighted maximum-
parsimony (MP) and maximum-likelihood (ML) analyses were carried out using MEGA 7
(Kumar et al. 2016), and bootstrap support was obtained from 1,000 pseudoreplicate data sets.
The 16S-23S ITS region (ca. 800 bp) was analyzed by determining secondary structure of
the following conserved domains: D1-D1’ helix, Box-B helix, and the V3 helix. Secondary
structures of specific ITS motifs were predicted using comparative analysis combined with
confirmation in Mfold (Zuker 2003).
Results
Molecular phylogenies
Our newly isolated strain of Brasilonema Fiore et al. (2007: 794) fell out in a highly
supported (97%) clade with all other Brasilonema strains (Fig. 2.1). The new strain in particular
fell within a modestly supported clade (77%) with aerophytic B. robert-lamii Sant'Anna & J.
Komárek ex Bourrelly (2011: 56) isolates and B. sp. CENA 347, isolated from leaves of
Avicennia schaueriana Stapf & Leechman ex Moldenke (1939: 336) from Brazil (Fig 2.1).

32
Figure 2.1 Maximum likelihood tree of B. geniculosus and the closest relatives based on 16S rRNA gene sequences. Numbers above the line represent ML values, numbers below MP.
The newly isolated Calothrix Agardh ex Bornet & Flahault (1886: 345) fell within the
highly supported (99%) clade containing a mixture of soil and freshwater strains more distantly
related to either of the marine clades (Fig. 2.2). Further, it fell into a highly supported clade
(99%) sister to a strain of Calothrix sp. isolated as a member of a Nostoc commune Vaucher ex
Bornet & Flahault (1888: 181) crust from Japanese soils (Fig. 2.2).
Brasilonema octagenarum UFV-OR1 (EF150855.1)
Brasilonema octagenarum UFV-E1 (EF150854.1)
Scytonema sp. (KM019951)
Brasilonema octagenarum HA4186-MV1 clone B7A+p4 (HQ847562.1)
Brasilonema sp. RKST-322 clone C1 (KU161678.1)
Brasilonema sp. RKST-322 clone c2 (KU161677.1)
Brasilonema sp. CENA382 (KR137603.1)
Brasilonema sp. CENA360 (KR137581.1)
Brasilonema sp. CENA381 (KR137602.1)
Brasilonema sp. RKST-3291 clone MB (KU161679.1)
Brasilonema lichenoides (accession)
Brasilonema roberti-lamyii Los manatiales1 (GQ443308.1)
Brasilonema sp. CENA347 (KT731163.1)
Brasilonema geniculosus sp. nov. HWSC1-2A
Brasilonema geniculosus sp. nov. HWSC1-2B
Brasilonema sp. CENA361 (KR137582.1)
Brasilonema sp. CENA366 (KR137587.1)
Brasilonema angustatum HA4187-MV1 clone B2+p1H (HQ847567.1)
Brasilonema angustatum HA4187-MV1 clone B2 +p1F (HQ847566.1)
Brasilonema sp. NQAIF325 (KJ636963.1)
Brasilonema tolantongensis Tolantongo (JN676147.1)
Brasilonema sp. CENA114 (EF117246.1)
Brasilonema bromeliae SPC951 (DQ486055.1)
Brasilonema terrestre CENA116 (NR_116034.1)
Brasilonema burkei HA4348-LM4 clone 38B (KU161664.1)
Brasilonema burkei HA4348-LM4 clone 38D (KU161665.1)
Brasilonema burkei HA4348-LM4 clone 38A (KU161663.1)
Scytonema sp. HA4185-MV1 clone p2 (HQ847565.1)
Scytonema/ Symphonema 5 OTUs
Scytonema crispum U55-MK38 (HF911526.1)
Scytonema stuposum P13-MK35 (HF911527.1)
Fischerella 2 OTUs
Calothrix 3 OTUs
Calothrix/ Rivularia 5 OTUs
Gloeobacter violaceus PCC 7421 (NR_074282.1)
100
100
99
99
100
97
80
100
97
99
78
81
86
77
0.02
92
79
99
92
100
95
100
100
99
96
100

33
Figure 2.2 Maximum likelihood tree of C. dumas and the closest relatives based on 16S rRNA gene sequences. Numbers above the line represent ML values, numbers below MP.
Calothrix sp. MU27 UAM-315 (EU009152.1)
Calothrix sp. TJ12 UAM-372 (EU009154.1)
Calothrix sp. SAG 38.79 (KM019958.1)
Calohrix sp. UAM-373 (HM751855.1)
Calothrix scopulorum SAG 36.79 (KM019957.1)
Calothrix parietina 2T10 (FR798917.1)
Calothrix sp.HA4395-MV3 clone B3-4 + p5E (HQ847571.1)
Calothrix sp. HA4395-MV3 clone B3-4 + p5F (HQ847572.1)
Calothrix brevissima Ind9 (HM573459.1)
Calothrix sp. PCC 7714 (AJ133164.1)
Calothrix sp. GYEco1001 (KT232077.1)
Calothrix sp. HA4186-MV5 clone B2 + p10D (HQ847581.1)
Nostoc sp. CAWBG77 (JX088107.1)
Calothrix sp.HA4186-MV5 clone B2 + p10AB (HQ847580.1)
Calothrix sp. CENA127 (KP835531.1)
Calothrix sp. HA4283-MV5 clone p11B (HQ847574.1)
Calothrix sp. HA4283-MV5 clone p11A (HQ847573.1)
Calothrix sp. HA4283-MV5 clone p11D (HQ847579.1)
Calothrix desertica SERB 5 (KM982554.1)
Calothrix desertica PCC 7102 (AM230699.1)
Calothrix sp. RN41 (KP681563.1)
Calothrix dumas sp. nov. HWSC4C clone A
Calothrix dumas sp. nov. HWSC4C clone B
Calothrix sp. YK-03 (AB694930.1)
Calothrix desertica KSU-AQIQ-13 (LN997862.1)
Calothrix sp. SEV5-4-C5 clone operon 2 (KT336447.1)
Calothrix sp. SEV5-4-C5 clone operon 1 (KT336446.1)
Calothrix sp. PCC 7103 (AM230700.1)
Calothrix sp. PCC 7103 isolate DBSU 24 (FJ661010.1)
Calothrix parietina CCAP 1410/10 (HF678479.1)
Calothrix parietina clone 144-1A + 159-4 (AF334695.1)
Calothrix parietina 144-1B + 159-4 (AF334696.1)
Calothrix sp. SEV5-4-C5 clone operon 3 (KT336448.1)
Calothrix sp. HK-06 (AB694935.1)
Calothrix sp. DCC D253 (X99213.1)
Calothrix sp. PCC 7715 (KM019959.1)
Rivularia sp. IAM M-261 (AB325536.1)
Calothrix sp. PCC 7715 (AM230701.1)
Rivularia sp. MU24 UAM-305 (EU009149.1)
Rivularia sp. VP4-08 (FR798919.1)
Calothrix sp. NQAIF310 (KJ636964.1)
Calothrix elsteri CCALA 953 (NR_117190.1)
Calothrix sp. CAL3361 (AM230697.1)
Calothrix sp. PCC 6303 (KM019954.1)
Calothrix parietina CCAP 1410/11 (HE974991.1)
Calothrix sp. XP11C (AM230698.1)
Calothrix sp. BIR LS5 (AM230686.1)
Calothrix sp. BECID4 (AM230690.1)
Calothrix sp. BECID6 (AM230691.1)
Calothrix sp. AHLA9 (AM230694.1)
Calothrix sp. HA4860-CV1 clone operon 1 (KT336444.1)
Calothrix sp. BECID33 (AM230683.1)
Calothrix sp. UKK3412 (AM230681.1)
Calothrix sp. BECID16 (AM230682.1)
Calothrix sp. BECID1 (AM230680.1)
Macrocheate 10 OTUs
Calothrix sp. UAM 374 (HM751856.1)
Calothrix/Nostocales/Camptylonemopsis 6 OTUs
KU291459Chroo
Gloeobacter violaceus strain PCC 7421 NR074282
99
99
99
99
99
95
79
73
72
92
99
99
99
99
99
95
99
92
99
88
94
88
74
0.02
9999
99
89
99

34
ITS folding patterns
We recovered two operons for B. geniculosus. One operon contains two tRNAs while the
second had no tRNAs (Table 2.1). Brasilonema geniculosus clone IIA showed a similar pattern
of ITS domain lengths to other Brasilonema strains which also included two tRNAs. The
difference came in the length of the spacer region between the tRNAs (Table 2). Brasilonema
geniculosus clone IIB displayed a similar pattern to other strains lacking tRNAs, with the
exception that the V3 and ITS end domains were ca. four times longer than any other recovered
known Brasilonema sequences at 228 nucleotides (Table 2.1).
The D1-D1’ helix for B. geniculosus was distinct from other Brasilonema strains, but
most similar to B. angustatum M.A. Vaccarino & J.R. Johansen (Fig. 2.3). The helix of the first
operon was 91 nucleotides long, while the helix of the second operon was 67 nucleotides in
length. The helices of the two operons were less alike than their closest relative, B. lichenoides
Table 2.1 Comparing lengths in nucleotides of conserved ITS domains for B. geniculosus sp. nov. and closest relatives with available ITS data.
Strain
Leader
D1-D
1' Helix
spacer+D2+spacer
D3+spacer
tRN
A Ile gene
spacer+V2+spacer
tRN
A A
la gene
Spacer
Box-B
+spacer
Box A
D4+spacer
V3+ITS end (partial)
B. geniculosus sp. nov. clone 2A 8 91 38 11 74 78 73 136 48 11 21 60
B. geniculosus sp. nov. clone 2B 8 67 38 138 48 11 21 228
B. lichenoides 5A 8 67 38 138 48 11 21 55
B. sp. RKST-3291 clone MB 8 105 38 11 74 91 73 134 48 11 21 63
B. sp. RKST-322 clone C1 8 67 38 139 47 11 21 61
B. sp. RKST-322 clone c2 8 102 38 11 74 84 73 133 47 11 21 73
B. octagenarum HA4186-MV1 clone B7A+p4 1 67 38 139 47 11 21 61
B. angustatum HA4187-MV1 clone B2+p1F 8 67 38 129 49 11 21 72
B. angustatum HA4187-MV1 clone B2+p1H 8 79 38 11 74 60 73 126 49 11 21 67

35
Villanueva et Casamatta, which also had no tRNAs (Fig. 2.3). It must be noted that there were
significant differences between the two, with two insertions, one deletion, and five nucleotide
point mutations. The first operon was not similar to any other taxon of Brasilonema for which
there was ITS sequence data available.
Figure 2.3 D1-D1’ helices for B. geniculosus and closet relatives for which ITS sequence data is available a) B. geniculosus HWSC4C Clone IIA, b) B. geniculosus HWSC4C Clone IIB, c) B. lichenoides clone 5A, d) B. sp. RKST-3291 clone MB, e) B. sp. RKST-322 clone C1, f) B. sp.
Output of sir_graph (©)mfold_util 4.7
Created Tue Nov 28 10:37:54 2017
dG = -19.40 [Initially -19.40] 17Nov28-10-37-53G
A
C
C
C
A
A
A
U
C
G
A
U
U
CA
A
A
A
G
UC
A
A
A
A
A
U
C
A
A
A
A
U
U
C
UC
A
AA C
A
G
G
A
A
U
U
U
G
G
A
U
U
U A UC
AUA
UA
A
C
U
U
U
G
A
A
U
U
G
A
U
U
U UA
UCCC
GA
G
G
U
C5’ 3’
10
20
30
40
50
60
70
80
90
Output of sir_graph (©)mfold_util 4.7
Created Tue Nov 28 10:39:09 2017
dG = -15.40 [Initially -15.40] 17Nov28-10-39-08G
A
C
C
C
A
C
U
U
U
U
G
A
G
U
U
AG
U
U
A
G
A
A
G
CA
G
U
UA A
U
U
A
G
U
A
A
C
U
G
A
U
A
A
C
U
C
A
A
G
A
G C CA
UCCC
GA
G
G
U
C5’ 3’
10
20
30
40
50
60
Output of sir_graph (©)mfold_util 4.7
Created Tue Nov 28 10:50:47 2017
dG = -25.40 [Initially -25.40] 17Nov28-10-50-45G
A
C
C
C
G
A
CU
C
A
A
U
U
CA
A
A
A
G
U
U
A
A
A
A
U
U
C
A
A
AG
U
U
C
A
A
A
A
G
CA
A
G
AA A
G
A
G
U
U
U
U
U
G
G
AAA
U
U
U
G
G
A
U
U
U C UUAGA
AA
A
C
U
U
U
G
A
A
U
U
G
G
U
U UU
A
UCC
C
G
A
G
G
U
C5’ 3’
20
40
60
80
100
Output of sir_graph (©)mfold_util 4.7
Created Mon Dec 4 09:51:46 2017
dG = -17.00 [Initially -17.00] 17Dec04-09-51-45G
A
C
C
C
A
C
U
U
U
U
G
A
G
U
U
A
G
U
U
A
G
A
A
A
CA
CU U
A
G
U
U
A
A
U
A
A
C
U
AA
U
AA
C
U
C
A
A
A
A
G C CA
UCC
CG
AG
G
U
C5’ 3’
10
20
30
40
50
60
Output of sir_graph (©)mfold_util 4.7
Created Mon Dec 4 20:33:47 2017
dG = -15.00 [Initially -15.00] 17Dec04-20-33-46G
A
C
C
C
A
C
U
U
U
U
G
A
G
A
U
A
G
U
U
A
G
A
A
A
CA
GU U
A
G
U
U
A
A
U
A
G
C
U
A GUAA
C
U
C
A
A
A
A
G C UA
UCC
CG
AG
G
U
C5’ 3’
10
20
30
40
50
60
Output of sir_graph (©)mfold_util 4.7
Created Fri Jun 10 14:53:09 2016
dG = -14.70 [Initially -14.70] 16Jun10-14-53-08G
A
C
C
C
A
C
U
U
U
U
G
A
G
A
U
A
G
U
U
A
G
A
A
A
CA
CU U
A
G
U
U
A
A
U
A
G
C
U
A GUAA
C
U
C
G
A
A
A
G C UA
UCCC
GA
G
G
U
C5’ 3’
10
20
30
40
50
60
Output of sir_graph (©)mfold_util 4.7
Created Fri Jun 10 14:57:44 2016
dG = -21.80 [Initially -21.80] 16Jun10-14-57-43G
A
C
C
C
G
C
U
U
U
U
C
A
G
U
U
A
GCU
A
GA A
U
C
A
G
U
U
A
G
UU
A
G
U
A
A
C
U
G
A
U
A
A
C
U
G
A
A
G
A
G
C U AU
CCC
AA
G
G
U
C5’ 3’
10
20
30
40
50
60
Output of sir_graph (©)mfold_util 4.7
Created Fri Jun 10 14:49:59 2016
dG = -21.90 [Initially -21.90] 16Jun10-14-49-58G
A
C
C
C
G
C
U
U
U
U
G
A
A
U
U
U
G
U
G
C
U
C
A
A
C
A
G
U
U
UG
CA
A
A
A
A
C
U
G
A
U
G
A
G
U
GA
A
UC
A
A
A AAAC
U
C
A
A
A
A
G
U CA
U
CC
C
G
A
G
G
U
C5’ 3’
10
20
3040
50
60
70
Output of sir_graph (©)mfold_util 4.7
Created Mon Dec 4 20:42:52 2017
dG = -22.30 [Initially -22.30] 17Dec04-20-42-51G
A
C
C
C
G
A
CU
C
A
A
U
U
CA
A
A
A
G
UA
A
A
A
A
U
U
C
A
A
A
G
U
U
C
A
A
A
A
A
CA
A
GA
A AG
A
G
U
U
U
U
U
G
G
AAA
U
U
UA
G
A
A
U
UA
UA
AA
A
C
U
U
U
G
A
A
U
U
G
G
U
U UU
A
UCC
C
G
A
G
G
U
C5’ 3’
20
40
60
80
100
a b c d e
f g h i

36
RKST-322 clone c2, g) B. octogenarum HA4186-MV1 clone b7a+p4, h) B. angustatum HA4187-MV1 clone b2+p1f, i) B. angustatum HA4187-MV1 clone b2+p1h.
The structural motif of the Box B helix for B. geniculosus clone IIA was identical to
other strains, but with nucleotide substations in the terminal bulge (Fig. 2.4). B. geniculosus
clone IIB, however, was the only Box B helix with a single nucleotide unilateral bulge to the left
instead of the right (Fig. 2.4b), also with variability in the nucleotide sequences of the terminal
bulge, but with the same number of nucleotides in each.

37
Figure 2.4 Box B helices for B. geniculosus and closet relatives for which ITS sequence data is available a) B. geniculosus HWSC4C Clone IIA, b) B. geniculosus HWSC4C Clone IIB, c) B. lichenoides clone 5A, d) B. sp. RKST-3291 clone MB, e) B. sp. RKST-322 clone C1, f) B. sp. RKST-322 clone c2, g) B. octogenarum HA4186-MV1 clone b7a+p4, h) B. angustatum HA4187-MV1 clone b2+p1f, i) B. angustatum HA4187-MV1 clone b2+p1h.
Output of sir_graph (©)mfold_util 4.7
Created Mon Dec 4 20:49:57 2017
dG = -12.20 [Initially -12.20] 17Dec04-20-49-56C
A
G
C
A
U
C
U
U
G
U
G
A
G
A UA
A
A
G
C
A
A
G
A
A
U
G
C
U
G5’ 3’
10
20
30
Output of sir_graph (©)mfold_util 4.7
Created Mon Dec 4 20:51:17 2017
dG = -8.20 [Initially -8.20] 17Dec04-20-51-16C
A
G
C
A
U
C
U
U
G
U
G
A
A
GA U
A
A
G
C
A
U
G
A
A
U
G
C
U
G5’ 3’
10
20
30
Output of sir_graph (©)mfold_util 4.7
Created Mon Dec 4 20:49:16 2017
dG = -12.20 [Initially -12.20] 17Dec04-20-49-15C
A
G
C
A
U
C
U
U
G
U
G
A
G
C CA
A
A
G
C
A
A
G
A
A
U
G
C
U
G5’ 3’
10
20
30
Output of sir_graph (©)mfold_util 4.7
Created Mon Dec 4 20:53:27 2017
dG = -12.20 [Initially -12.20] 17Dec04-20-53-26C
A
G
C
A
U
C
U
U
G
U
G
A
G
C AA
A
A
G
C
A
A
G
A
A
U
G
C
U
G5’ 3’
10
20
30
Output of sir_graph (©)mfold_util 4.7
Created Mon Dec 4 20:55:23 2017
dG = -11.90 [Initially -11.90] 17Dec04-20-55-23C
A
G
C
A
U
C
U
U
G
U
G
A
UA U
A
A
G
C
A
A
G
A
A
U
G
C
U
G5’ 3’
10
20
3’
Output of sir_graph (©)mfold_util 4.7
Created Mon Dec 4 20:57:11 2017
dG = -11.90 [Initially -11.90] 17Dec04-20-57-10C
A
G
C
A
U
C
U
U
G
U
G
A
UA U
A
A
G
C
A
A
G
A
A
U
G
C
U
G5’ 3’
10
20
3’
Output of sir_graph (©)mfold_util 4.7
Created Mon Dec 4 20:58:02 2017
dG = -11.90 [Initially -11.90] 17Dec04-20-58-01C
A
G
C
A
U
C
U
U
G
U
G
A
UA U
A
A
G
C
A
A
G
A
A
U
G
C
U
G5’ 3’
10
20
3’
Output of sir_graph (©)mfold_util 4.7
Created Mon Dec 4 21:01:19 2017
dG = -12.20 [Initially -12.20] 17Dec04-21-01-18C
A
G
C
A
U
C
U
U
G
U
G
A
U
A GA
A
A
G
C
A
A
G
A
A
U
G
C
U
G5’ 3’
10
20
30
Output of sir_graph (©)mfold_util 4.7
Created Mon Dec 4 20:58:53 2017
dG = -12.20 [Initially -12.20] 17Dec04-20-58-52C
A
G
C
A
U
C
U
U
G
U
G
A
U
A GA
A
A
G
C
A
A
G
A
A
U
G
C
U
G5’ 3’
10
20
30
a b c d e
g f h i

38
Three V3 helices were identified for B. geniculosus clone IIB (Fig. 2.5), which had a
large insert in the V3 and spacer region upstream from the 23S gene. The first V3 helix
identified in B. geniculosus IIB had a nearly identical structure as B. geniculosus IIA, but with
two additional nucleotides paired in the basal clamp (Fig. 2.5a,b). Brasilonema geniculosus was
most similar to B. angustatum in terms of motif and nucleotides. The second and tertiary motifs
(Fig. 2.5c,d) were radically different than all other taxa, and different from each other.

39
Figure 2.5 V3 helices for B. geniculosus and closet relatives for which ITS sequence data is available. a) B. geniculosus HWSC4C Clone IIA, b) B. geniculosus HWSC4C Clone IIB, c) B. geniculosus HWSC4C Clone IIB second helix, d) B. geniculosus HWSC4C Clone IIB third helix, e) B. lichenoides clone 5A, f) B. sp. RKST-3291 clone MB, g) B. sp. RKST-322 clone C1, h) B. sp. RKST-322 clone c2, i) B. octogenarum HA4186-MV1 clone b7a+p4, j) B. angustatum HA4187-MV1 clone b2+p1f, k) B. angustatum HA4187-MV1 clone b2+p1h.
Output of sir_graph (©)mfold_util 4.7
Created Mon Dec 4 21:35:39 2017
dG = -8.40 [Initially -8.40] 17Dec04-21-35-39
U
U
G
U
C
A
G
G
U
A
G
U
U
A
A
C
UA
U
CA
A CA
A
C
A
G
U
U
A
A
CAC
UC
C
A
A
A
C
A
A
5’ 3’
10
20
30
40
Output of sir_graph (©)mfold_util 4.7
Created Tue Dec 5 09:51:57 2017
dG = -7.80 [Initially -7.80] 17Dec05-09-51-56
U
G
U
C
A
G
G
U
A
G
U
U
A
A
C
UA
U
CA
A CA
A
C
A
G
U
U
A
A
CAC
UC
C
A
A
G
C
A
5’ 3’
10
20
30
40
Output of sir_graph (©)mfold_util 4.7
Created Mon Dec 4 21:51:05 2017
dG = -20.10 [Initially -19.60] 17Dec04-21-51-04A
U
G
G
U
G
G
AU
A C
C
U
U
G
G
C
A
C
A
CA
G
A
G
G
U
G
A
A
G AA
U
C
A
C
U
A
G
U
GCG
G
C
C
GC
C
U
GC
A
G
G
U
C
G
A
C
C
A
U5’ 3’
10
20
30
40
50
60
Output of sir_graph (©)mfold_util 4.7
Created Mon Dec 4 21:53:06 2017
dG = -10.40 [Initially -10.40] 17Dec04-21-53-05
U
U
G
G
A
U
G
C
A
U
U
A
G
A
AU
G
UG U
U
U
U
U
C
U
A U
AG
U
G
U
C
A
U
C
U
A
A
5’ 3’
10
20
30
3’
Output of sir_graph (©)mfold_util 4.7
Created Tue Dec 5 09:49:21 2017
dG = -2.30 [Initially -1.80] 17Dec05-09-49-19U
G
U
C
A
G
G
U
A
G
U
U A
A
C
U
A
U
U
A
A
C
A5’3’
10
20
Output of sir_graph (©)mfold_util 4.7
Created Tue Dec 5 09:54:26 2017
dG = -10.50 [Initially -10.50] 17Dec05-09-54-25
U
G
U
C
A
G
GU
A
G
U
U
A
A
C
U
G
U
U
AU U
C
A
C
A
G
U
U
A
AA
A
C
UC
C
A
A
G
C
A
5’ 3’
10
20
30
40
Output of sir_graph (©)mfold_util 4.7
Created Mon Dec 4 22:18:07 2017
dG = -10.70 [Initially -10.70] 17Dec04-22-18-05
U
G
U
C
A
G
GU
A
G
U
U
A
A
C
U
G
U
U
UA
U
A
A
C
A
G
U
U
A
AA
A
C
UC
C
A
A
G
C
A
5’ 3’
10
20
30
40
Output of sir_graph (©)mfold_util 4.7
Created Tue Dec 5 09:57:02 2017
dG = -10.70 [Initially -10.70] 17Dec05-09-57-01
U
G
U
C
A
G
GU
A
G
U
U
A
A
C
U
G
U
U
UA
U
A
A
C
A
G
U
U
A
AA
A
C
UC
C
A
A
G
C
A
5’ 3’
10
20
30
40
Output of sir_graph (©)mfold_util 4.7
Created Tue Dec 5 09:58:15 2017
dG = -10.70 [Initially -10.70] 17Dec05-09-58-14
U
G
U
C
A
G
GU
A
G
U
U
A
A
C
U
G
U
U
AU
U
A
A
C
A
G
U
U
A
AA
A
C
UC
C
A
A
G
C
A
5’ 3’
10
20
30
40
Output of sir_graph (©)mfold_util 4.7
Created Tue Dec 5 10:00:02 2017
dG = -7.80 [Initially -7.80] 17Dec05-10-00-01
U
G
U
C
A
G
G
U
A
G
U
U
A
A
C
UA
U
CA
A CA
A
C
A
G
U
U
A
A
CAC
UC
C
A
A
G
C
A
5’ 3’
10
20
30
40
Output of sir_graph (©)mfold_util 4.7
Created Tue Dec 5 09:59:11 2017
dG = -7.80 [Initially -7.80] 17Dec05-09-59-10
U
G
U
C
A
G
G
U
A
G
U
U
A
A
C
UA
U
CA
A CA
A
C
A
G
U
U
A
A
CAC
UC
C
A
A
G
C
A
5’ 3’
10
20
30
40
a b d c e f
g i h j k

40
We recovered two operons for C. dumas, both of which contain two tRNAs but with
variable inserts between the tRNAs (Table 2.3). C. dumas clone A had only 11 nucleotides in
the spacer between tRNA genes, while clone B had 77 nucleotides and a variable V2 helix.
The D1-D1’ helix for C. dumas was distinct from other Calothrix strains (Fig. 2.6).
Clone I had a secondary, internal unilateral bulge of six nucleotides, which differed in
orientation from other strains (Fig. 2.6a). Clone II had a distinct unilateral bulge directly
opposite the basal unilateral bulge, not seen in any other taxa.
Table 2.3 Comparing lengths in nucleotides of conserved ITS domains for C. dumas sp. nov. and closest relatives with available ITS data.
Strain
Leader
D1-D
1' Helix
spacer+D2+spacer
D3+spacer
tRN
A Ile gene
spacer+V2+spacer
tRN
A A
la gene
Spacer
Box-B
+spacer
Box A
D4+spacer
V3+ITS end (partial)
C. dumas HWSC4 clone A 8 97 37 11 74 11 73 63 54 11 25 86
C. dumas HWSC4 clone B 8 100 39 11 74 77 73 89 44 11 23 85
C. sp. SEV5-4-C5 clone operon 1 8 71 76 52 11 20 97
C. sp. SEV5-4-C5 clone operon 2 8 66 76 52 11 20 97
C. sp. HA4283-MV5 clone p11D 8 98 66 67 11 20 97
C. sp. HA4283-MV5 clone p11A 8 98 38 11 74 79 73 63 53 11 20 80
C. sp. HA4283-MV5 clone p11B 8 98 80 53 11 20 97
C. sp. HA4186-MV5 clone B2+p10AB 8 65 74 51 11 20 88
C. sp. HA4395-MV3 clone B3-4+p5E 8 98 38 11 74 94 73 64 52 11 20 85

41
Figure 2.6 D1-D1’ helices for C. dumas and closet relatives for which ITS sequence data is available. a) C. dumas HWSC1B clone A, b) C. dumas HWSC1B clone B, c) C. sp. SEV5-4-c5 clone operon 1, d) C. sp. SEV5-4-c5 clone operon II, e) C. sp. HA4395-MV3 clone B3-4+P5e, f) C. sp. HA4283-MV5 clone p11B, g) C. sp. HA4283-MV5 clone p11D, h) C. sp. HA4283-MV5 clone p11A, i) C. sp. HA4186-MV5 clone B2+P10ab.
Output of sir_graph (©)mfold_util 4.7
Created Thu Jun 2 11:08:48 2016
dG = -23.80 [Initially -23.80] 16Jun02-11-08-47G
A
C
C
U
A
C
C
C
A
U
U
U
U
A
G
A
U
U
GUG
A
AU
U
U
U
UG
A
A
A
A
U
C
G
A
U
U
G
U
G
A
G
A
A
UU
A
A
U
C
U
C
A
A
A
U
C
G
A
U
U
G
A
A
A
A
A
A
A
U
C
U
A
A
A
AU
U
G
U
G
U
C AU
U
CCU
A
G
G
U
C5’ 3’
10
20
30
40
50
60
70
80
90
Output of sir_graph (©)mfold_util 4.7
Created Sat Nov 4 15:30:40 2017
dG = -17.10 [Initially -17.10] 17Nov04-15-30-39G
A
C
C
U
A
A
A
U
C
A
A
G
UAA
AAA
G
A
A
C
C
A
A
G
U
A
A
A
A
A
G
U
A
A
A
A
A
G
AA
A
G
AG A A
A
A
A
U
C
U
U
U
U
G
A
C
U
U
U
UG
AU
UU
U
U
G
A
G
U
U
U
U
G
A
C
U
U
A
A
U GU
AUCC
CG
A
G
G
U
C5’ 3’
10
20
30
40
50
60
70
80
90
3’
Output of sir_graph (©)mfold_util 4.7
Created Thu Jun 2 19:00:39 2016
dG = -28.00 [Initially -28.00] 16Jun02-19-00-37G
A
C
C
U
A
CC
C
A
U
U
U
U
A
G
A
U
U
U
U
G
G
A
U
U
U
U
A
G
A
U
U
U
U
G
G
A
U
U
G
AA
A
G
A
U
C
G
A
G
A
A
U
U
U
A
A
A
A
U
U
U
G
A
G
A AU
G
AAG
U
C
U
A
G
A
A
UA
G
U
G
U
C AU
U
CCU
A
G
G
U
C5’ 3’
10
20
30
40
50
60
70
80
90
Output of sir_graph (©)mfold_util 4.7
Created Mon Dec 4 17:20:00 2017
dG = -22.30 [Initially -22.30] 17Dec04-17-19-59G
A
C
C
U
A
C
CC
A
A
C
U
U
G
U
U
G
UA
A
U
A
C
G
U
A
C
U
UC
A
G
U
A
C
G
U
A A AAGA
AG
C
A
A
C
A
A
GA
A
G
G
U
CA U
C
A
CCU
A
G
G
U
C5’ 3’
10
20
30
40
50
60
70
Output of sir_graph (©)mfold_util 4.7
Created Thu Jun 2 18:52:02 2016
dG = -15.20 [Initially -15.20] 16Jun02-18-52-01G
A
C
C
U
A
C
CC
A
A
C
U
U
G
U
U
GA
U
U
G
U
A
CU
UU A
G
U
A
C U GA
AAAA
CC
A
A
C
A
A
GA
A
G
G
U
CA U
C
A
CCU
A
G
G
U
C5’ 3’
10
20
30
40
50
60
Output of sir_graph (©)mfold_util 4.7
Created Thu Jun 2 18:36:23 2016
dG = -24.30 [Initially -24.30] 16Jun02-18-36-22G
A
C
C
U
A
CC
C
A
U
U
U
U
A
G
A
U
UG
U
A
A
A
U
U
U
U
G
G
A
U
U
U
U
G
G
A
U
U
U
UU
U
G AA
U
A
G
A
A
U
C
U
A
A
A
G
U
C
G
G
A
A
A
UA
A
A
A
A
A
U
C
C
A
A
A
A
UA
G
U
G
U
C AU
U
CCU
A
G
G
U
C5’ 3’
10
20
30
40
50
60
70
80
90
Output of sir_graph (©)mfold_util 4.7
Created Thu Jun 2 18:43:14 2016
dG = -24.30 [Initially -24.30] 16Jun02-18-43-13G
A
C
C
U
A
CC
C
A
U
U
U
U
A
G
A
U
UG
U
A
A
A
U
U
U
U
G
G
A
U
U
U
U
G
G
A
U
U
U
UU
U
G AA
U
A
G
A
A
U
C
U
A
A
A
A
U
C
G
G
A
A
A
UA
A
A
A
A
A
U
C
C
A
A
A
A
UA
G
U
G
U
C AU
U
CCU
A
G
G
U
C5’ 3’
10
20
30
40
50
60
70
80
90
Output of sir_graph (©)mfold_util 4.7
Created Mon Dec 4 18:01:44 2017
dG = -29.20 [Initially -29.20] 17Dec04-18-01-43G
A
C
C
U
A
C
C
C
A
U
U
U
U
A
G
A
U
UG
U
A
A
A
U
U
U
U
G
G
A
U
U
U
U
G
G
A
U
U
U
UU
U
G AA
U
A
G
A
G
U
C
U
A
A
A
A
U
C
G
G
A
A
A
UC
A
A
A
A
A
U
C
U
A
A
A
A
U A GU
GUCAU
UC
CU
A
G
G
U
C5’ 3’
10
20
30
40
50
60
70
80
90
Output of sir_graph (©)mfold_util 4.7
Created Thu Jun 2 18:56:26 2016
dG = -17.10 [Initially -17.10] 16Jun02-18-56-25G
A
C
C
U
A
C
CC
A
A
C
U
U
G
UA
A
G
U
U
G
U
A
CU
UC G
G
U
A
C
U GA
U
AAA
G
C
U
G
C
A
A
G
A
G
G
U
CA U
U
A
CCU
A
G
G
U
C5’ 3’
10
20
30
40
50
60
a c b d
e f g i h

42
The structural motif of the Box B helix for C. dumas clone I had two internal, bilateral
bulges, while there are only single bilateral bulges in clone II (Fig. 2.7a,b).
Figure 2.7 Box B helices for C. dumas and closet relatives for which ITS sequence data is available. a) C. dumas HWSC1B clone A, b) C. dumas HWSC1B clone B, c) C. sp. SEV5-4-c5 clone operon 1, d) C. sp. SEV5-4-c5 clone operon II, e) C. sp. HA4395-MV3 clone B3-4+P5e, f)
Output of sir_graph (©)mfold_util 4.7
Created Mon Dec 4 18:27:11 2017
dG = -11.50 [Initially -11.50] 17Dec04-18-27-10C
A
G
C
A
A
C
U
G
A
A
G
U
U
A
G
U
A A
U
C
U
A
A
C
U
G
A
G
C
C
U
G
C
U
G5’ 3’
10
20
30
Output of sir_graph (©)mfold_util 4.7
Created Mon Dec 4 18:28:50 2017
dG = -9.30 [Initially -9.30] 17Dec04-18-28-50C
A
G
C
A
A
C
A
U
G
G
C
A
AU
U
G
G
U
C
A
G
A
C
U
G
C
U
G5’ 3’
10 20
Output of sir_graph (©)mfold_util 4.7
Created Mon Dec 4 18:49:54 2017
dG = -8.60 [Initially -8.60] 17Dec04-18-49-53C
A
G
C
AA
C
U
A
A
A
G
U
U
A
U
U
G A
U
A
U
A
A
C
U
C
A
G
C
C
U
G
C
U
G5’ 3’
10
20
30
Output of sir_graph (©)mfold_util 4.7
Created Mon Dec 4 18:48:24 2017
dG = -8.60 [Initially -8.60] 17Dec04-18-48-23C
A
G
C
AA
C
U
A
A
A
G
U
U
A
U
U
G A
U
A
U
A
A
C
U
A
A
G
C
C
U
G
C
U
G5’ 3’
10
20
30
Output of sir_graph (©)mfold_util 4.7
Created Mon Dec 4 18:47:34 2017
dG = -9.70 [Initially -9.70] 17Dec04-18-47-33C
A
G
C
A
A
C
U
U
C
C
G
U
U
A
U
U
A A
G
A
U
A
A
C
G
C
A
G
C
C
U
G
C
U
G5’ 3’
10
20
30
Output of sir_graph (©)mfold_util 4.7
Created Mon Dec 4 18:29:40 2017
dG = -8.00 [Initially -8.00] 17Dec04-18-29-39C
A
G
C
AA
C
U
A
A
A
G
U
U
A
G
U
G AU
A
U
A
A
C
U
A
A
G
C
C
U
G
C
U
G5’ 3’
10
20
30
Output of sir_graph (©)mfold_util 4.7
Created Mon Dec 4 18:53:24 2017
dG = -6.30 [Initially -5.80] 17Dec04-18-53-22A
G
C
A
GAU
AU
A
C
A
G
A
C
AG
CA
A
C
U
A
AA G
U
U
A
G
UG
AU
A
U
A
A
C
U
A
AG
CC
U
G
C
U5’ 3’
10
20
30
40
Output of sir_graph (©)mfold_util 4.7
Created Mon Dec 4 18:52:09 2017
dG = -9.70 [Initially -9.70] 17Dec04-18-52-08C
A
G
C
A
A
C
U
U
C
C
G
U
U
A
U
U
U A
G
A
U
A
A
C
G
C
A
G
C
C
U
G
C
U
G5’ 3’
10
20
30
Output of sir_graph (©)mfold_util 4.7
Created Mon Dec 4 18:51:08 2017
dG = -8.90 [Initially -8.90] 17Dec04-18-51-07C
A
G
C
A
A
C
U
A
A
A
G
U
U
A
A
AA
C
U
U
A
A
C
U
U
A
G
C
C
U
G
C
U
G5’ 3’
10
20
30
a b c e d
g f i h

43
C. sp. HA4283-MV5 clone p11B, g) C. sp. HA4283-MV5 clone p11D, h) C. sp. HA4283-MV5 clone p11A, i) C. sp. HA4186-MV5 clone B2+P10ab.
The V3 helices were different between the two clones (Fig. 2.8a,b). Clone I mostly
closely resembled Calothrix sp. SEV4-5-c5 while clone II shared no common motif with any
other folded motifs. Both of the basal clamps, though, were extended (e.g., seven and eight
nucleotides vs. four to five for all others, Fig. 2.8).

44
Figure 2.8 V3 helices for C. dumas and closet relatives for which ITS sequence data is available. a) C. dumas HWSC1B clone A, b) C. dumas HWSC1B clone B, c) C. sp. SEV5-4-c5 clone operon 1, d) C. sp. SEV5-4-c5 clone operon II, e) C. sp. HA4395-MV3 clone B3-4+P5e, f) C. sp. HA4283-MV5 clone p11B, g) C. sp. HA4283-MV5 clone p11D, h) C. sp. HA4283-MV5 clone p11A, i) C. sp. HA4186-MV5 clone B2+P10ab.
Output of sir_graph (©)mfold_util 4.7
Created Mon Dec 4 19:16:20 2017
dG = -17.10 [Initially -17.10] 17Dec04-19-16-19C
A
G
C
A
A
G
U
GA
A
A
U
CG
U
A
A
C
A
A
U
U
A
C
U
U
C
A
G
U
AA U
U
A
C
U
A
A
A
G
U
A
A
U
U
G
A
A
A
CU
A
A
A
CC
A
C
U
C
G
U
U
G5’ 3’
10
20
30
40
50
60
Output of sir_graph (©)mfold_util 4.7
Created Mon Dec 4 19:23:33 2017
dG = -14.70 [Initially -14.20] 17Dec04-19-23-31U
A
G
A
C
A
CA
G
A
C
A
U
UG
U
AA
G
A
A
A
U
C
A
G
AG U
G
A
U
G
A
U
U
U
C
A
A
A
A
A
U
G
A
A
A
G
U
G
U
U
U
G5’ 3’
10
20
30
40
50
Output of sir_graph (©)mfold_util 4.7
Created Mon Dec 4 19:41:55 2017
dG = -19.40 [Initially -19.40] 17Dec04-19-41-54G
U
A
G
G
C
A
G
U
A
A
C
U
G
C
A
U
UG
U
U
C
G
U
A
U
U
A
A
U
U
A
C
UU G
A
G
U
A
A
U
U
A
A
U
A
U
G
U
A
A
A
U
A
C
A
G
G
A
A
U
U
G
AA
U
U
A
C5’ 3’
10
20
30
40
50
60
3’
Output of sir_graph (©)mfold_util 4.7
Created Mon Dec 4 19:40:26 2017
dG = -19.40 [Initially -19.40] 17Dec04-19-40-26G
U
A
G
G
C
A
G
U
A
A
C
U
G
C
A
U
UG
U
U
C
G
U
A
U
U
A
A
U
U
A
C
UU G
A
G
U
A
A
U
U
A
A
U
A
U
G
U
A
A
A
U
A
C
A
G
G
A
A
U
U
G
AA
U
U
A
C5’ 3’
10
20
30
40
50
60
3’
Output of sir_graph (©)mfold_util 4.7
Created Mon Dec 4 19:37:29 2017
dG = -16.20 [Initially -16.20] 17Dec04-19-37-28G
U
A
G
G
C
A
G
U
A
A
C
C
G
U
C
G
U
A
A
U
A
A
U
U
A
C
UU G
A
G
U
A
A
U
U
A
A
A
G
C
A
A
C
G
G
G
U
A
U
U
G
AA
U
U
A
C5’ 3’
10
20
30
40
50
Output of sir_graph (©)mfold_util 4.7
Created Mon Dec 4 19:30:31 2017
dG = -12.30 [Initially -12.30] 17Dec04-19-30-30G
U
A
G
G
C
A
G
U
A
A
C
C
G
U
A
U
U
G
A
G
U
U
U
A
A
U
U
A
C
U
A AA
G
U
A
A
U
U
AUU
A
CA
AAA
AA
G
GC
A
C
G
G
G
U
A
U
U
G
AA
U
U
A
C5’ 3’
10
20
30
40
50
60
3’
Output of sir_graph (©)mfold_util 4.7
Created Mon Dec 4 19:47:01 2017
dG = -18.30 [Initially -18.30] 17Dec04-19-47-00G
U
A
G
G
C
A
G
U
A
A
C
C
G
U
G
U
U
G
A
G
U
U
U
A
A
U
U
A
C
U
A AA
G
U
A
A
U
U
AUU
A
C AA
AAA
AG
G
C
A
C
G
G
G
U
A
U
U
G
AA
U
U
A
C5’ 3’
10
20
30
40
50
60
3’
Output of sir_graph (©)mfold_util 4.7
Created Mon Dec 4 19:45:30 2017
dG = -17.10 [Initially -17.10] 17Dec04-19-45-29G
U
A
G
G
C
A
G
U
A
A
C
U
G
U
A
A
U
A
A
U
U
A
C
UU U
A
G
U
A
A
U
U
G
U
U
A
U
G
G
G
U
A
U
U
G
GA
U
U
A
C5’ 3’
10
20
30
40
50
Output of sir_graph (©)mfold_util 4.7
Created Mon Dec 4 19:43:50 2017
dG = -18.50 [Initially -18.50] 17Dec04-19-43-49G
U
A
G
G
C
A
G
U
A
A
C
C
G
U
U
A
U
CC
U
A
A
U
U
A
C
G
CG A
G
C
G
U
A
A
UG
A
U
G
A
A
A
A
C
G
G
G
U
A
U
U
G
AA
U
U
A
C5’ 3’
10
20
30
40
50
60
a b c d e
f g h i

45
Morphological assessments
The newly described B. geniculosus is morphologically similar to other species in the
genus (Fig. 2.9). Brasilonema geniculosus differs from the type species, B. bromeliae, in
trichome width, color of sheath, and only rarely slightly attenuated trichomes. Brasilonema
tolantongensis Becerra-Absalón & Montejano (shares similar cell dimensions and purple-
brownish color), and both species are capable of producing external pigments which may be
released under stress. However, they differ in trichome attenuation. The closest relative in terms
of 16S sequence identity, B. roberti-lamii, differed in fascicular arrangement (e.g., erect
fascicles), sheath characteristics (B. robert-lamii possessed infirm, occasionally lamellated
sheaths), and heterocytes (B. robert-lamii possessed single, intercalary heterocytes, while B.
geniculosus occasionally exhibited paired heterocytes).
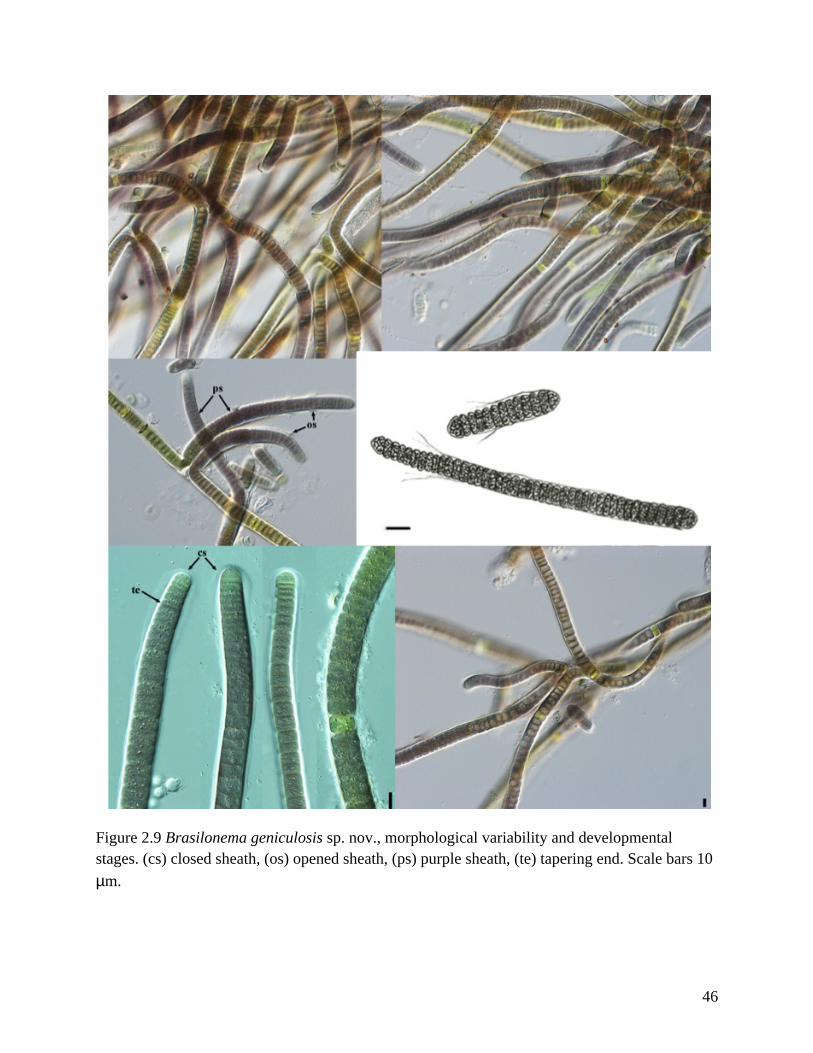
46
Figure 2.9 Brasilonema geniculosis sp. nov., morphological variability and developmental stages. (cs) closed sheath, (os) opened sheath, (ps) purple sheath, (te) tapering end. Scale bars 10 µm.

47
The newly described taxon, C. dumas, possessed a highly knotted growth form with
intertwined trichomes and undulating filament growth within the trichome (Fig. 2.10). Calothrix
dumas forms numerous types of branches, including scytonematoid, tolypotrichoid
(Microchaete-like), and rivulariacean (Fig. 2.10). Calothrix dumas is morphologically similar to
other taxa in Calothrix but can be uniquely identified based on a combination of characters (see
discussion).

48
Figure 2.10 Calothrix dumas sp. nov., morphological variability and developmental stages. (h) hormogonium, (hd) heteropolar development of hormogonium, (htc-b) basal heterocyte, (htc-i) intercalary heterocytes, (mg) microchaetoid growth, (nc) necridic cell, (s) sheath, (sb) scytonematoid branching. Scale bar 10 µm.

49
Description of new taxon
Brasilonema geniculosus Villanueva et Casamatta
Description: Thallus macroscopic, purple-brown in nature (and culture), growing in mats on
granite substrate. Filaments often in fascicles, straight or bent, slightly tapering, false branched.
Sheaths purple-brown (fresh isolates and in culture, later colorless), distinct, firm, up to 3.5 µm
wide, seldom layered at the basal part near the false branching. Trichomes straight, bent,
constricted at cross walls. Cells usually flattened to almost isodiametric, green to blue-green or
brownish with peripheral chromatoplasm and central nucleoplasm, frequently granulated, highly
vacuolated, 3.2-8.6 µm long × 12.1-20.2 µm wide, apical cells rounded without calyptra.
Heterocytes common, intercalary single or in pairs, occasionally flattened but typically square to
hemispherical, 5.7-10.1 µm long × 16.7-18.2 µm wide, akinetes not present. Reproduction by
hormogonia and fragmentation of trichomes via necridic cells. Meristematic zones if present
usually short and located near the apices.
Holotype: OL-100180 (Herbarium at the Department of Botany, Faculty of Science, Palacký
University), micrograph from culture Fig. 2.9.
Type strain: No. UPOC 151/2014, deposited at the culture Collection of Department of Botany,
Palacký University in Olomouc, Czech Republic.
Type locality: Granite tombstones from the H. Warren Smith Cemetery, Jacksonville Beach,
Florida, USA (GPS: 30.2890° N, 81.4071° W).
Genbank accession numbers: MG674086 (16S rRNA and ITS for clone IIA) and MG674085
(16S rRNA and ITS for clone IIB)
Etymology: Name is based on knotted growth form (geniculatus (L.) = knotty, jointed).
Habitat: Growing in a lichen-dominated consortium on cemetery tombstones.

50
Calothrix dumas Villanueva et Casamatta
Description: Thallus macroscopic, blue-green, in mats on granite substrates. Filaments straight or
bent, solitary or in dense clusters, variable false branched (scytonematoid, tolypotrichoid as well
as rivulariacean solitary branching). Sheathscolorless (in culture and as fresh samples), distinct,
firm, up to 3.5 µm wide, seldom layered at the basal part near the false branching, opened and
layered at the apical part. Trichomes straight, bent, or undulated inside the sheath, constricted at
cross walls, slightly tapering at the ends. Cells green to blue-green, flattened or barrel-shaped,
frequently granulated, non-vacuolated, 3-4.5 µm long × 9-10.5 µm wide at basal part, 2-3.5 µm
long × 6.5-7.1 µm wide at the apical part, apical cells rounded or conical. Heterocytes common,
typically spherical or hemispherical, 5.1-5.4 µm long × 7.8-8.9 µm wide, often basal, sometimes
developing intercalary in pairs before trichome breakage and formation of heteropolar
arrangement of trichomes, akinetes not present. Reproduction by hormogonia and fragmentation
of trichomes using help of necridic cells. Meristematic zones if present usually short and located
near the apical or basal parts.
Holotype: OL-100181 (Herbarium at the Department of Botany, Faculty of Science, Palacký
University), micrograph from culture Fig 2.10.
Type strain: No. UPOC 168/2015, deposited at the culture Collection of Department of Botany,
Palacký University in Olomouc, Czech Republic.
Type locality: Granite tombstones from the H. Warren Smith Cemetery, Jacksonville Beach,
Florida, USA (GPS: 30.2890° N, 81.4071° W).
Genbank accession numbers: MG674088 (16S rRNA and ITS for cloneA) and MG674087 (16S
rRNA and ITS for cloneB)

51
Etymology: Name is based on the tufted appearance of the colonies (dumas (L.) = thorn-bush,
bramble).
Habitat: Growing in lichen dominated consortia on cemetery tombstones.
Discussion
Recently exploration of aerophytic cyanobacteria has yielded a bounty of new taxa (e.g.,
Vilanueva et al. 2018, Alverenga et al. 2016, Hentschke et al. 2016, Sherwood et al. 2015).
Aerophytic and aquatic cyanobacterial populations often share similar morphologies and the
cyanobacteria as a lineage may be rife with convergent morphological features (Dvorák et al.
2014). However, ecological and molecular data is useful for revealing cryptic taxa. Further,
recent employment of ITS data (both sequence and folding patterns) has allowed researchers to
untangle the phylogenetic relationships amongst the cyanobacteria, even in cryptic lineages (e.g.,
Buch et al. 2017, Genuário et al. 2015). It is this approach that we employed in the erection of
our two new taxa from cemetery tombstones.
Brasilonema was erected to describe a collection of strains isolated primarily from
tropical habitats, and includes taxa traditionally included in Scytonema (Fiore et al. 2007).
Perhaps common in tropical and subtropical habitats, molecular analyses have confirmed the
well-supported molecular position of this genus (Sant’Anna et al. 2011). Characterized by
macroscopic, fasiculated colonies consisting of (mostly) reddish filaments with false branching,
vacuolized cells (typically), and (typically) aerophytic or sub-aerophytic habitats, this genus has
been found in tropical habitats (e.g., Fiore et al. 2007), Hawaii (Vaccarino & Johansen 2012),
southern Europe, and as a member of a tripartite lichen from Florida, USA (Villaneuva et al.
2018). Given the dearth of sampling from tropical and subtropical habitats, it is expected that

52
numerous new taxa are likely (Dvorak et al. 2015). Our new strain fell within a highly
supported cluster of other Brasilonema, further confirming the monophyletic placement of this
lineage. Our strain was closest to Brasilonema isolates from mangrove trees (Avicennia
schaueriana) from Brazil (Alvarenga et al. 2016). It is noteworthy, though, that another recently
described taxon isolated from a nearby tombstone, B. lichenoides Villanueva & Casamatta
(2018: xxx), was most similar to B. roberti-lamii, isolated from central Mexico.
The secondary folding patterns of the ITS region present an interesting dilemma for
phylogenetic assessment. Typically, patterns in ITS ultrastructure provide characters that may
be used as evidence to erect new taxa (e.g., Osorio-Santos et al. 2014). In the case of B.
geniculosus, though, the two recovered D1-D1’ helices of the clones were very different from
each other (Fig. 2.3a,b). In addition, the one helix was 24 nucleotides longer than the other, thus
impacting the folded structure. Similarly, three helices were identified in the V3 region for B.
geniculosus clone IIB which yielded different structures (Fig. 2.5b,c,d). The first helix was
identical to that found in clone IIA, and it is evident that an insert in this region occurred in a
second operon. How these differences may impact the phylogeny of this genus as a whole,
though, is currently unclear. Very few strains of Brasilonema have sequenced ITS regions
available in Genbank, so it is difficult to make conclusions about patterns without more
extensive sequences from sister taxa available. Additionally, very few clonal replicates are
published, thus potentially missing some of the heterogeneity that may be present in this, and
possible other, cyanobacterial lineages.
The genus Calothrix contains a high number of species predominantly inhabiting aquatic
biotopes all over the world. However, Calothrix has recently underdone significant revision,
with several distinct lineages being identified based on ecology (Berrendo et al. 2016). Hair-like

53
formation in the apical parts of trichomes represents one of the most important diacritic features.
Our strain fell within a highly supported clade containing fresh-water and subaerial taxa.
Calothrix dumas belongs to the group of species without terminal hairs and an aerophytic
ecology. Our strain did not produce terminal hairs in culture, but it must be noted that we can
not say for certain that it is incapable of hair production given an appropriate medium and
growth (e.g., Chu medium). Calothrix conica N.L. Gardner (1927: 66), a morphologically
similar taxon, was described as subaerophytic in Puerto Rico (Gardner 1927). However, C.
conica is rarely false branched, while C. dumas forms numerous branches, including
scytonematoid, tolypotrichoid (Microchaete-like), and rivulariacean types. Calothrix
flamulorum C.L. Sant'Anna, S.M.F. Silva & L.H.Z. Branco (1992: 85), another subaerophytic
species isolated from wet rocks in Brazilian caves, also differs in similar features to C. conica
(cell width, formation of sheath, mode of branching). The thallus and filament habitus of C.
elenkinii Kossinskaja (1924: 11) is similar to C. dumas (dense clusters, opened sheath, and
intercalary heterocytes) as well. However, C. elenkinii forms thinner and isodiametric to slightly
flattened cells and differs from C. dumas in cell width, formation of sheath (closed/opened), and
mode of branching. It is also worth noting that our new taxon displayed a long branch in the
maximum likelihood analysis, with a strain from Japan as our closest relative. Though the
distance was great, the bootstrap support was very high, and it may be that with additional sister
taxa sequenced our new taxon may fit more neatly into a clearly delineated soil clade of
Calothrix. Calothrix as currently accepted is polyphyletic, but with increased sampling and
sequence availability the phylogenetic relationships amongst this lineage may be resolved.
The patterns of ITS folding for Calothrix present some potentially interesting notes for
phylogenetics. Many of the clonal replicates for all secondary structures showed extensive

54
heterogeneity. For example, the Box B helix for some clones are identical (both in structure and
nucleotide sequences, e.g., Fig. 2.7c,d) while other clones exhibit different (structure and
nucleotide sequences, e.g., Fig. 2.7f,g,h) helices. The clones of C. dumas were similar in
ultrastructure but different in nucleotides (e.g., 36 vs. 29). Thus, we advocate caution when
comparing structures from multiple operons as these structures themselves may be under
different evolutionary pressures (e.g., variable expression at different temperatures). In future
studies, it may be useful to address this data gap by more sequencing of multiple operons and
their associated ITS regions.
We note that cemetery tombstones may represent an untapped reservoir of sampling
environments for describing novel cyanobacterial diversity. As noted in Lopez-Bautista et al.
(2006), the total biodiversity of subaerial, cyanobacterial diversity is woefully understudied and
should be a priority for future research. We echo these sentiments and note that we have
recovered four novel (including two from Villanueva et al. 2018) taxa from a single cemetery,
thus spurring future taxonomic inquiries.
Acknowledgement
This research has been supported by Internal Grant Agency of Palacký University Prf-2018-001
and funding from the UNF Coast

55
Chapter 3: Standardizing analysis of Internal Transcribed Spacer regions in multiple 16S-23S
operons: a new evolutionary review of ITS paralog patterns in Cyanobacteria
Chelsea D. Villanueva,1,2 Jeffrey R. Johansen, 3 and Dale A. Casamatta, 1
1 Department of Biology, University of North Florida, Jacksonville, Florida, 32224, USA
2 Department of Regulatory Biology, Cleveland State University, Cleveland, Ohio, 44115, USA
3 Department of Biology, John Carroll University, Cleveland, Ohio, 44118, USA
Correspondence: Chelsea D. Villanueva, [email protected]
Keywords: Secondary structures, systematics

56
Abstract
Cyanobacterial taxonomy first developed over a century ago and was based almost
entirely on morphology, which may be taxonomically uninformative. Modern cyanobacterial
species concepts, however, requires an apomorphy, either ecological, molecular, or
morphological, to define new species. The use of the 16S-23S Internal Transcribed Spacer (ITS)
region secondary structures have been proposed as suitable apomorphies for phylogenetic
reconstructions. However, the relationship between ITS structures, often visualized as hairpin
loops (referred to as helices) in regulatory DNA, has not been thoroughly evaluated or
quantified. Further, the use of these secondary structures is not necessarily standardized amongst
cyanobacterial systematists. To address this, we employed previously published sequence data
from Genbank to evaluate secondary structures of common ITS motifs both within and between
cyanobacterial genera. This endeavor is confounded by the presence of multiple operons, which
may be under differential selective pressures and thus yield different structures. This is coupled
with inconsistent labeling of partial or full sequences into Genbank, a lack of standards for
annotation of ITS domains, and lack of clear naming terminologies for predicted structures. We
note that ITS structures are reliable markers for use within genera but are not necessarily
appropriate for comparisons between genera. We provide recommendations to standardize ITS
secondary structure analysis going forward.

57
Introduction
Early taxonomic proposals for cyanobacteria, suggested in the late nineteenth century,
employed morphology and ecology to catalog cyanobacterial orders (Bornet & Flahault 1886-
1888; Gomont 1890, 1892). In the twentieth century, Frémy (1929) and Geitler (1932) advocated
only three orders of cyanobacteria grouped by morphological characters considered
taxonomically informative, later amended to four orders (Geitler 1942). Differences in
cyanobacterial fatty acid composition prompted the development of chemotaxonomy in the
1970s having either polyunsaturated fatty acids, mono unsaturated fatty acids, alpha-linolenic
acid, or gamma-linolenic acid (Kenyon 1972; Kenyon et al. 1972; Murata et a. 1992).
Subsequent research demonstrated that this classification system could neither account for all
fatty acid variants, nor for culturally induced changes in composition (Lawry & Simon 1982;
Cohen et al. 1995).
Rippka et al. (1979) expanded the morphological classification scheme to include five
subdivisions based on multicellularity, branching patterns, and the presence of specialized cells.
Rippka’s system replaced chemotaxonomy and formed the basis for cyanobacterial taxonomy
into the twenty first century and was included in Bergey’s Manual of Systematic Bacteriology
(Castenholtz 2001). However, this scheme relied on characters (e.g., specialized cells) that either
were subject to multiple evolutionary innovations or were not phylogenetically informative.
All bacterial genomes contain the 16S-23S rRNA operon, consisting of the 16S gene,
Internal Transcribed Spacer (ITS) region, 23S gene, and 5S gene (Figure 1) (Schleifer & Kandler
1989; Iteman et al. 2000). Heterotrophic bacteria and cyanobacteria typically have multiple
copies of this operon, though the copy number varies (Tourova 2003). Heterotrophic bacteria
may have one to 15 operons, varying between and among genera (Klappenbach et al. 2001;

58
Větrovský & Baldrian 2013). Cyanobacteria typically have one to five operon copies, with copy
number typically increasing with morphological complexity (Iteman et al. 2000, 2001;
Schirrmeister et al. 2012). The 16S gene serves as a constituent component of the bacterial small
subunit of the ribosome, stabilizing bonding between the small and large ribosomal subunits, as
well as providing stable bonding for the A site of bacterial ribosomes (Stackebrandt & Goebel
1994; Iteman et al. 2000, Boyer et al. 2001). The structural function of the 16S gene makes large
segments of it highly conserved, with episodic variable regions (Johansen et al. 2015). However,
the ITS region, that regulatory rDNA segment located between the 16S and 23S genes, is more
variable (Woese 1987; Iteman 2000; Boyer 2001).
The ITS regulatory domains are involved in transcriptional control of the flanking 16S
and 23S genes and contain anti-termination and processing sites (Iteman 2000). Additionally,
there may be Ile and Ala tRNA genes located within the ITS (Iteman 2000). Inclusion of tRNA
genes in the ITS region is also variable even within a single genome. One operon copy may have
both tRNA genes, while a second operon copy within the genome may have neither (Boyer et al.
2001). Some taxa may have multiple operons with both tRNA genes, or one tRNA gene within
the ITS, though very few have neither in any copies (Johansen et al. 2011). The mosaic nature of
the conserved and variable regions of the 16S gene and ITS region, along with its highly-
conserved functionality, and presence in all bacteria made it the gold standard for bacterial
systematics, as defined by the bacteriologic code (Vandamme et al. 1996; Stackebrandt et al.
2002).
The accumulation of molecular data has catalyzed continual revision of classic
cyanobacterial taxonomy (e.g., Komárek et al. 2014; Dvorak et al. 2015). Phylogenies
constructed using taxa included in classic morphology-based taxonomies are often polyphyletic

59
(Komárek 2014). Genomic research has demonstrated that many morphological and metabolic
traits classically used for cyanobacterial classification (e.g., multicellularity, baeocyte formation,
presence of akinetes, tapering, polarity, branching patterns, etc.) have complex evolutionary
histories, with serial acquisition and loss, and thus may not be taxonomically informative
(Schirrmeister 2011; Shih et al 2013). For example, analysis of whole genome data has suggested
that multicellularity developed independently in up to four cyanobacterial lineages and was
subsequently lost in at least one (Schirrmeister et al. 2011, 2013). Further, some metabolic
characters such as nitrogen fixation are likely ancestral traits that have been subsequently lost in
many lineages (Larsson et al. 2011). This has led to three very different proposed methodologies
for revision of cyanobacterial taxonomy coming from different research camps (Komárek 2014).
For over fifty years one camp of researchers have been suggesting that the number of
cyanobacterial taxa must be dramatically reduced to simplify the taxonomic system (Drouet &
Daily 1956; Drouet 1973, 1978, 1981; Bourrelly 1970; Otsuka et al. 2001). To the contrary, a
second camp of researchers has recommended bifurcation of polyphyletic groups of both genera
and species until all taxonomic units are monophyletic (Anagnostidis & Komárek 1985;
Casamatta et al. 2005; Johansen & Casamatta 2005; Rehakova et al. 2007; Siegesmund et al.
2008; Perkerson et al. 2011). Lastly, it has been suggested that no further taxonomic changes
should be implemented at all until a great deal more molecular data is collected by researchers
(Hoffman 2005).
The monophyletic species concept sensu Johansen and Casamatta (2005) derived from a
polyphasic approach has been proposed as the standard for cyanobacterial systematics (e.g.,
Komárek et al. 2014; Komárek 2016), which requires the description of an apomorphy, along
with ecology and molecular data, to test phylogenetic hypotheses. If a new strain of

60
cyanobacteria has <98% sequence similarity to previously described taxa, some habitat or
ecological incongruity, and a documented apomorphy, the case can be made to designate the new
strain as a novel species (Johansen & Casamatta 2005). Over fifty new genera were described
between 2000 and 2014, and the new taxonomy presented by Komárek (2014, 2016) attempts to
incorporate all those with taxonomic standing. The Komárekian (2014, 2016) system reflects true
evolutionary relationships by erecting monophyletic groups with exiguous but evidently
monophyletic genera that contain fewer, more closely related species as determined by 16S
sequence data.
Describing and elucidating cyanobacterial species, however, can be problematic, even
with genetic data. Morphological plasticity and cryptic diversity often mask how akin or
divergent various taxa are, stifling attempts to clarify cyanobacterial taxonomy with genetics
(Casamatta et al. 2003; Komárek et al. 2013; Dvořák et al. 2015). Traditionally, non-planctonic
cyanobacterial ecology has been woefully understudied, with only recent forays into non-lentic
ecologies just beginning, leaving the habitat ranges of many taxa to be revised (Dvořák et al.
2015). Thus, most cyanobacterial phylogenies remain unresolved (Dvořák et al. 2015; Komárek
2016).
The 16S rDNA gene, however, has been shown to lack resolving power at the species
level for prokaryotes (Konstantinidis et al. 2006; Goris et al. 2007). The level of 16S rRNA gene
sequence similarity that corresponds to accepted average nucleotide identity (ANI) threshold for
prokaryotic species identification has been calculated as 98.65% (Kim et al. 2014). There have
been instances where well differentiated populations of phenotypically different cyanobacteria
had identical 16S and ITS sequences, though they varied considerably at six nitrogen metabolism
loci (Miller et al. 2006). Other potential molecular markers have been suggested for use in

61
prokaryotic taxonomy, such as the rpoB, nifD, psbA, rbcL genes (Case et al. 2007; Singh et al.
2014; Dvořák et al. 2014). Concatenation of the 16S data with other molecular markers,
collectively known as multilocus sequence analysis (MLSA), has become common in molecular
studies to address the taxonomic shortfall of the 16S rRNA gene (Singh et al. 2014; Wilmotte et
al. 2017). However, a robust multilocus phylogenetic analysis of 23 coding genes, across eight
cyanobacterial orders, showed that when compared to 16S rRNA phylogenies, only minor
differences exist, confirming the utility of the 16S at the generic level, but not so at the species
level (Mares 2017). Thus, the MLSA is of no greater utility than the 16S alone.
Without the use of morphological characters to act as apomorphies, and with the lack of
species level resolution in common molecular markers, differences in ITS secondary structures
have developed into a common taxonomic tool to describe new species (Iteman et al. 2001,
2002; Boyer et al. 2001; Johansen et al. 2005, 2011, 2013). Iteman (2000, 2002) pioneered the
use of ITS, with restriction fragment length polymorphisms of ITS amplicons to distinguish
closely related taxa. Later works by Johansen et al. (e.g., 2005, 2011, 2013) demonstrated how
ITS secondary structures, obtained by folding conserved hairpin loop domains within the ITS,
could be used to delineate cryptic species, and were thus a powerful tool when applied to
phylogenetic studies. ITS secondary structures have become the new gold standard for
describing novel cyanobacterial taxa for the last decade (Johansen 2013; Komárek 2013; Engene
et al. 2015; Suradkar et al. 2017; Villanueva et al. 2018). However, protocols for ITS analysis
have not been standardized, nomenclature and presentation of folded structures vary from author
to author, and taxonomic differences of conserved ITS domains across cyanobacterial lineages
have not been quantified (Johansen 2013; Komárek 2013; Engene et al. 2015; Suradkar et al.
2017).

62
The identification and annotation of whole ITS sequences and conserved domains in
Genbank are inconsistent. Some ITS sequence submissions to Genbank are added separately
from the 16S gene, making their evaluation difficult without knowing the submitter’s cut points
for the two separate entries, while others are submitted as one continuous sequence.
Additionally, many 16S and ITS submissions have no annotation as to possible clonal replicates
sequenced from the same isolate. Because the ITS region is more variable, and repeats are
common especially between conserved domains (Fig 3.1), it is necessary to have flanking
regions to be sure that a sequence is in fact the conserved domain. For example, the D1’
sequence (usually AGGTC), part of the basal clamp for the D1-D1’ helix, can often have a repeat
just upstream of the correct D1’ location. To identify which of the AGGTC repeats represents the
actual D1’ sequence can require evaluation of its location in relation to the flanking D2 sequence
(GGT).
Figure 3.1 The 16S-23S rRNA operon, consisting of the promoter region, 16S gene, Intergenic Transcribed Spacer (ITS) region, 23S gene, 5S gene, and terminator sequence. Denoting the location of the ITS within the operon and the conserved domains of the ITS region flanked by the 16S and 23S genes.
16S rRNA gene 23S rRNA gene 5SIle t
RN
AA
la tR
NA
Promoter ter
Internal Transcribed Spacer (ITS) Region
D1-D1’ D2 D3 tRNA Ile tRNA Ala BoxB BoxA D4 V3Helix16S 23SV2
Conserved Domains within the ITS – Flanked on either side by the 16S gene and the 23S gene

63
The 16S-23S operon is one of many in prokaryotes with multiple copies (Pei et al., 2010;
Sun et al., 2013). Intragenomic heterogeneity of the 16S rRNA gene has been reported in
prokaryotes, including cyanobacteria (Pei et al. 2010; Engene et al. 2011; Sun et al., 2013;
Johansen et al. 2017). Analysis of 37 cyanobacterial genomes suggested that of the 62.7% of
genomes containing multiple 16S-23S operons, only 35.1% displayed intragenomic 16S rRNA
heterogeneity. However, the analysis employed genome assembly programs that typically
formed consensus sequences of those with <6% difference (far above the 1.9% difference in 16S
rRNA that separates species) and the authors noted that the formation of consensus sequences
may have overlooked variation between paralogous 16S copies (Engene & Gerwick, 2011).
Major patterns of intragenomic ITS heterogeneity have been identified in prokaryotes, including
length, tRNA inclusion, and nucleotide divergence (Iteman et al. 2000, 2001; Stewart et al.
2006).
There is evidence, however, that operons may either vary due to differential selective
pressures or drift or may undergo concerted evolution due to gene homogenization (Stewart et
al., 2006) Though the ITS region is regulatory, the conservation of domains across all orders of
cyanobacteria indicates that there is active selection. Further, patterns of tRNA inclusion or
exclusion in ITS regions indicates the possibility that there are differential selective pressures for
individual operons. Many of the helices from ITS operons of differing patterns of tRNA
inclusion, from within the same genome, are significantly different from one another.
Additionally, other patterns of domain deletions and duplications within the ITS have been
identified in various cyanobacterial taxa. This suggests varying evolutionary history for
individual ITS operons. Evolutionary differentiation may have preceded speciation events in
some genera if the duplication event was ancient enough. Thus, comparing ITS domains to

64
paralogous ITS operons from closely related species may not be informative for differentiating
species, analogous to comparisons of apples to oranges, evolutionarily.
Inconsistencies in analyses of ITS secondary structures usually relates to inconsistent
handling of multiple 16S-23S operons. Some researchers clone replicate ITS operons and publish
consensus structures for each paralog to objectively eliminate the possibility of error as the cause
of sequence differences (Johansen et al. 2017; Shalygin et al. 2017). Some groups publish only
one operon as a cloned consensus structure, while others publish only single operon data without
cloning isolates to check for multiple operons. Primers may selectively amplify only certain 16S
and ITS operons, leading to the sequencing of only a single operon when multiples are present if
cloning is not employed (Osorio-Santos et al. 2015). Very few researchers are actively selecting
ITS operons with similar evolutionary patterns to compare to one another or noting patterns of
domain inclusion in publications of new taxa. To address these issues, a pilot study was
undertaken analyzing ITS operons from 224 previously published cyanobacterial taxa from
Genbank for domain inclusion and exclusion, intragenomic heterogeneity of ITS operons, and
the possible relevance of variable selective pressures affecting individual domains.
Methods
A total of 224 ITS sequences from all cyanobacterial orders were sourced from Genbank
(http://blast.ncbi.nlm.nih.gov) and conserved ITS domains annotated as of January 2018.
Evaluation of ITS data began by calculating the percentage of unusable, partial, and full ITS
domains. Usable domains were those defined as having the full conserved domain sequence as
well as the flanking domains, those domains directly upstream and downstream. Full ITS region
sequences were defined as possessing both the flanking 16S gene ending sequence and 23S gene

65
starting sequence. Partial ITS sequences were defined as having at least one usable domain,
including both flanking domains. Unusable ITS sequences did not include any usable domains.
A total of 216 sequences possessed a usable D1-D1’ helix, D2, & D3 domains. Of those,
only 207 included the 23S starting sequence. Sampled sequences with no usable domains were
excluded. Secondary structures were determined for all usable ITS sequences for the D1-D1’
helix, Box-B helix, and the V3 helix using Mfold (Zuker 2003), including non-canonical base
pairs sensu Das et al. (2006). Secondary structures for all families within the order Nostocales
were assembled and organized by family then genus to produce a visual data set of secondary
structures motifs for comparison. To qualitatively assess intragenomic heterogeneity, unweighted
maximum-likelihood (ML) phylogenetic analysis, comparing only the ITS sequences for taxa
with multiple operon sequences available within two Nostocalean clades, Nostoc and
Brasilonema, with Leptolyngbya boryana as an outgroup, was computed using MEGA 7 (Kumar
et al. 2016), and bootstrap support was obtained from 1,000 pseudoreplicate data sets.
Evolutionary analysis of ITS domains with different patterns of tRNA inclusion proceeded by
calculating Tajima’s D, with the assumption of non-coding DNA. Individual ITS domains were
compiled and aligned, then Tajima’s D calculated using MEGA7 (Kumar et al. 2016). Sample
sets used to calculate the test statistic contained either two or no tRNAs, as too few samples
contained a single tRNA to calculate the test statistic with a high enough power. Significance
level for the Tajima’s D calculations was set at 1.0.
Results and Discussion
Of 224 Genbank sequences denoted as having either a full or partial ITS, submitted with
16S gene sequences, 5.6% had no usable ITS domains, where no flanking domains could be

66
identified (usable domains being those with flanking regions, allowing for indisputable
identification of the sequence as that domain) (Figure 3.2). Further, 59.2% contained only partial
ITS sequences with usable domains. Only 35.2% of the samples contained the full ITS sequence
flanked by the upstream 23S gene (Figure 3.2).
Figure 3.2 Of 224 the 16S-23S ITS sequences (denoted as having a full or partial ITS) acquired from Genbank, the percentages of Full, Partial, and Unusable ITS regions.
The percentage of samples including both the Ile and Ala tRNA genes was calculated (n
=207), as well as those with neither, and those with only one tRNA gene (Fig 3.3). Operons with
both tRNAs made up 55% of the sample set, while those with neither made up 41%, and those
containing only the Ile tRNA made up only 4% of the sample. Those operons containing only
one tRNA gene always included the Ile tRNA gene.
D1-D1’ D2 D3 tRNA Ile tRNA Ala BoxB BoxA D4 V3Helix16S 23SV2
FullITS– Alldomainseitherpresentorifmissing, fully flankedbythe16Sand23Sgenes
PartialITS– Onlysomedomainspresent&no23Sgeneflank
NotViable
NoDomainsPresentorOnlytheD1-D1’HelixPresentwithnootherFlankingDomains
6%
59%
35%
UnusableITS6%
PartialITS59%
FullITS35%

67
Figure 3.3 Percentage of 207 ITS sequences with both Ile and Ala tRNA genes, no tRNA genes, or one tRNA within the ITS.
Inclusion of all conserved tRNA domains was calculated and visualized (Figure 3.4). The
end sequence of the 16S gene, and the D1-D1’ helix and D2 sequence conserved domains in the
ITS were all included in 99.07% of the sample set (n = 216) (Fig 3.4). The D3 sequence, which
is only 3 to 4 nucleotides in length, could only be positively identified in 89.8% of the sampled
sequences (n = 216) (Fig 3.4). Because all sequences containing one tRNA contained the Ile
tRNA, inclusion of the Ile tRNA occurred in 60.39% of the sample, while the Ala tRNA was
only included in 56.04% of sampled sequences (n = 207) (Fig 3.4). The V2 helix located
between the tRNA domains was only included in 47.34% of the sampled sequences (Fig 3.4).
The Box B helix, Box A sequence, and D4 sequence were all included in 90.34% of the sampled
sequences (n = 207). While 77.78% of the sampled sequences of the usable expanded sample set
(n = 207) contained the leader sequence for the 23S gene, only 73.91% included a V3 helix (Fig
3.4).
D1-D1’ D2 D3 tRNA Ile tRNA Ala BoxB BoxA D4 V3Helix16S 23SV2
D1-D1’ D2 D3 BoxB BoxA D4 V3Helix16S 23S
D2 D3
tRNA Ile
BoxB BoxA D416S 23SD1-D1’ V3Helix
TwotRNAs55%
NotRNAs41%
OnetRNA4%

68
Figure 3.4 Individual conserved domains within the ITS for 216 usable ITS sequences for domains D1-D1’ helix, D2, & D3, and 207 usable sequences for the remaining domains.
Assembled D1’D1’ helix secondary structures within the order Nostocales were
visualized taxonomically, for two families, Nostocaceae and Tolypothricaceae (Figure 3.5)
(Figure 3.6). Box B helices were similarly displayed for the same families (Figure 3.7) (Figure
3.8). There were found to be distinct patterns of secondary structures included in many of the
families within the Nostocales data subset, which makes comparison of structures outside of
individual genera uninformative (Fig 3.5) (Fig 3.6) (Fig 3.7) (Fig 3.8). Of the usable Nostocales
data, nearly a quarter of the sample set included no V3 helix, although many samples included
the beginning sequence of the flanking 23S gene. Secondary structures for V3 helices were not
visualized as few samples within a single genus were available for comparison, owing to the
uninformative nature of comparisons between genera.
99.07
99.07
99.07
89.8
60.39
47.34
56.04
90.34
90.34
90.34
73.91
77.78
0 10 20 30 40 50 60 70 80 90 100
16S End
D1-D1' helix
D2 sequence
D3 sequence
Ile tRNA
V2 helix
Ala tRNA
Box B helix
Box A sequence
D4 Sequence
V3 helix
23S start
Percentage of Total Containing Conserved Domain

69
Figure 3.5 All D1-D1ʹ helices, folded secondary structures, predicted using Mfold, for the Nostocaceae.
Nostocaceae
Hydrocoryne Cyanocohniella DesmonostocKC346266
Output of sir_graph (©)mfold_util 4.7
Created Wed Mar 28 09:28:49 2018
dG = -13.30 [Initially -13.30] 18Mar28-09-28-48G
A
C
C
U
A
C
C
C
A
U
U
G
AGG
A
A
U
CGA
A
A
G
C
G
GA G
A
G
C GA
A
U
A
G
AG
A
A
U
C
A
A
G
U
G
G
U
C UA
C
UCU
A
G
G
U
C5’ 3’
10
20
30
40
50
60
JN385287
Output of sir_graph (©)mfold_util 4.7
Created Fri Jul 1 11:19:10 2016
dG = -10.40 [Initially -10.40] 16Jul01-11-19-09G
A
C
C
U
A
A
U
C
C
A
U
U
G
A
G
A
AA
U
CG
A
A
C
A
C
A
AU C
A
G
U AA
U
U
A
G
A
U
U
C
C
C
A
A
UU
G
G UC
UAU
CC
U
A
G
G
U
C5’ 3’
10
20
30
40
50
60
KC346265
Output of sir_graph (©)mfold_util 4.7
Created Fri Jul 1 11:21:10 2016
dG = -13.00 [Initially -13.00] 16Jul01-11-21-09G
A
C
C
U
A
A
U
C
C
A
U
U
G
A
G
AU
A
U
CG
A
A
C
A
C
A
AU U
A
G
U AA
U
U
A
G
A
U
U
C
U
U
A
A
UU
G
G UC
UAU
CC
U
A
G
G
U
C5’ 3’
10
20
30
40
50
60
KJ737428
Output of sir_graph (©)mfold_util 4.7
Created Wed Mar 28 09:31:11 2018
dG = -13.40 [Initially -13.40] 18Mar28-09-31-10G
A
C
C
U
A
C
A
C
C
C
C
U
C
A
GA
A
A
U
CGA
A
A
A
C
A
C
AC A
G
U
GA
A
U
A
G
AA
A
C
U
G
A
GUU
G
G
U CU
AAC
CU
A
G
G
U
C5’ 3’
10
20
30
40
50
60
KJ737427
Output of sir_graph (©)mfold_util 4.7
Created Wed Mar 28 09:33:48 2018
dG = -13.40 [Initially -13.40] 18Mar28-09-33-47G
A
C
C
U
A
C
A
C
C
C
C
U
C
A
GA
A
A
U
CGA
A
A
A
C
A
C
AC A
G
U
GA
A
U
A
G
AA
A
C
U
G
A
GUU
G
G
U CU
AAC
CU
A
G
G
U
C5’ 3’
10
20
30
40
50
60
KF934182
Output of sir_graph (©)mfold_util 4.7
Created Wed Mar 28 09:42:39 2018
dG = -13.40 [Initially -13.40] 18Mar28-09-42-39G
A
C
C
U
A
C
A
C
C
C
C
U
C
A
AA
U
A
U
UG
A
A
A
G
C
A
AA C
A
G
C AA
A
U
A
A
A
U
A
U
U
G
A
GAU
G
G
U CA
AAC
CU
A
G
G
U
C5’ 3’
10
20
30
40
50
60
KF417429
Output of sir_graph (©)mfold_util 4.7
Created Wed Mar 28 09:44:52 2018
dG = -14.40 [Initially -14.40] 18Mar28-09-44-51G
A
C
C
U
A
C
C
C
A
C
U
U
A
GA
A
A
U
CG
A
C
A
A
A
C
A
UA C
A
G
U
U AU
A
U
A
G
A
U
A
C
U
A
A
G
U
U
G
G
U
C AU
C
CC
A
G
G
U
C5’ 3’
10
20
30
40
50
60
MojaviaAY577534
Output of sir_graph (©)mfold_util 4.7
Created Wed Mar 28 09:59:51 2018
dG = -12.60 [Initially -12.60] 18Mar28-09-59-50G
A
C
C
U
A
C
A
C
C
C
C
U
C
AA
A
U
A
U
CG
A
A
A
G
C
A
AA C
A
G
CA
A
A
U
A
G
A
U
A
A
U
G
A
GUU
G
G
UC
UAU
CC
A
G
G
U
C5’ 3’
10
20
30
40
50
60
NostocEU586733
Output of sir_graph (©)mfold_util 4.7
Created Fri Jul 1 11:25:59 2016
dG = -18.00 [Initially -18.00] 16Jul01-11-25-57G
A
C
C
U
A
C
A
C
C
C
C
U
C
A
GA
A
A
U
C
U
GA
A
A
A
G
C
A
UA C
A
G
C
UA
U
A
U
A
G
A
U
A
C
U
G
A
GUU
G
G
U CA
UUC
CU
U
A
G
G
U
C5’ 3’
10
20
30
40
50
60
EU586732
Output of sir_graph (©)mfold_util 4.7
Created Fri Jul 1 11:27:56 2016
dG = -15.90 [Initially -15.90] 16Jul01-11-27-55G
A
C
C
U
A
C
A
C
C
C
C
U
U
A
CA
U
A
U
CA
A
A
A
A
G
C
A
UA C
A
G
C
U AU
A
U
A
G
A
U
A
G
U
A
A
GUU
G
G
U CU
AAC
CU
A
G
G
U
C5’ 3’
10
20
30
40
50
60
EU586728
Output of sir_graph (©)mfold_util 4.7
Created Fri Jul 1 11:34:01 2016
dG = -15.90 [Initially -15.90] 16Jul01-11-33-58G
A
C
C
U
A
C
A
C
C
C
C
U
U
A
CA
U
A
U
CA
A
A
A
A
G
C
A
UA C
A
G
C
U AU
A
U
A
G
A
U
A
G
U
A
A
GUU
G
G
U CU
AAC
CU
A
G
G
U
C5’ 3’
10
20
30
40
50
60
HQ847576
Output of sir_graph (©)mfold_util 4.7
Created Fri Jul 1 11:36:05 2016
dG = -18.90 [Initially -18.90] 16Jul01-11-36-04G
A
C
C
U
A
C
A
C
C
C
C
U
CA
A
A
U
A
U
U
G
A
A
A
G
C
A
AA C
A
G
C
U
U
U
C U
AA
A
U
A
U
U
G
A
GAU
G
G
U CA
AAC
CU
A
G
G
U
C5’ 3’
10
20
30
40
50
60
KT763391
Output of sir_graph (©)mfold_util 4.7
Created Fri Jul 1 11:39:44 2016
dG = -19.00 [Initially -19.00] 16Jul01-11-39-43G
A
C
C
U
A
C
C
C
A
A
A
U
C
A
GA
A
A
U
CG
A
A
A
G
C
UC
A
A
A
G
C
UA
G
A
A
G
C
G
AA A
A
G
CA
G
A
A
A
G
CG
A
A
A
A
G
UA
A
A
U
AG
A
G
A
C
U
G
A
G
A
U
G
G UC
UAC
UC
U
A
G
G
U
C5’ 3’
10
20
30
40 50
60
70
80
90
KP001508
Output of sir_graph (©)mfold_util 4.7
Created Fri Jul 1 11:46:25 2016
dG = -10.40 [Initially -10.40] 16Jul01-11-46-24G
A
C
C
U
A
U
A
C
CC
C
A
U
A
CA
U
A
U
CG
A
A
A
A
A
C
A
CA C
A
G
U
U AA
A
U
A
G
A
U
A
G
U
AA
G
U
U
G
G
U CU
AAC
CU
A
G
G
U
C5’ 3’
10
20
30
40
50
60
Pelatocladus CamptylonemopsisJN385293
Output of sir_graph (©)mfold_util 4.7
Created Wed Mar 28 09:04:45 2018
dG = -13.10 [Initially -13.10] 18Mar28-09-04-44G
A
C
C
C
A
A
A
U
C
A
A
A
G
U
A
A
A
A
A
G
U
A
G
A
AR
G
U
A
A
A
A
A
G
U
A
A
A
A
A
G
AA
A
G
A
A
UG A A
G
A
A
A
A
U
C
U
U
U
U
G
A
C
U
U
U
UA
A
G
U
U
U
A
A
A
C
U
U
U
U
G
C
C
U
U
G
A
A
U CA
UCCC
GA
G
G
U
C5’ 3’
20
40
60
80
100
HQ847564
Output of sir_graph (©)mfold_util 4.7
Created Wed Aug 10 10:30:51 2016
dG = -12.30 [Initially -12.30] 16Aug10-10-30-50aG
A
C
C
U
A
C
C
C
A
A
C
U
C
AGA
A
A
U
CG
A
A
A
A
C
A
AA C
A
G
U
UA
A
U
A
G
AC
A
A
U
G
A
G
A
U
G
G UC
UAC
UC
U
A
G
G
U
C5’ 3’
10
20
30
40
50
60
JN385292
Output of sir_graph (©)mfold_util 4.7
Created Wed Aug 10 10:33:16 2016
dG = -12.30 [Initially -12.30] 16Aug10-10-33-15G
A
C
C
U
A
C
C
C
A
A
C
U
C
AGA
A
A
U
CG
A
A
A
A
C
A
AA C
A
G
U
UA
A
U
A
G
AC
A
A
U
G
A
G
A
U
G
G UC
UAC
UC
U
A
G
G
U
C5’ 3’
10
20
30
40
50
60
Anabaena
EF634471
Output of sir_graph (©)mfold_util 4.7
Created Wed Mar 28 09:23:55 2018
dG = -16.20 [Initially -16.20] 18Mar28-09-23-54G
A
C
C
U
A
A
U
C
C
A
U
U
U
A
GA
A
A
U
CG
A
A
A
G
C
A
G
U
G
G AA
A
U
U
G
UG
GG
U
A
G
AA
A
C
U
A
A
A
UU
G
G UC
UAA
CC
U
A
G
G
U
C5’ 3’
10
20
30
40
50
60
3’
KT290322
Output of sir_graph (©)mfold_util 4.7
Created Fri Jul 1 10:59:58 2016
dG = -10.70 [Initially -10.70] 16Jul01-10-59-57G
A
C
C
G
AA
UC
C
A
C
U
C
AA
A
C
A
U
C
G
A
A
A
G
C
A
AA U
U
G
UGA
U
U
G
G
A
UA
A
U
G
A
GU
U
G
G
U
C
A UU
C
CUA
G
G
U
C5’ 3’
10
20
30
40
50
60
KT290379
Output of sir_graph (©)mfold_util 4.7
Created Fri Jul 1 11:05:52 2016
dG = -7.50 [Initially -7.50] 16Jul01-11-05-51G
A
C
C
G
AA
UC
C
A
C
U
CAA
A
C
A
U
CG
A
A
A
A
C
A
AA U
A
G
U GA
A
U
A
G
A
UA
C
W
G
A
GU
U
G
G
U
C
A UU
C
CUA
G
G
U
C5’ 3’
10
20
30
40
50
60
Output of sir_graph (©)mfold_util 4.7
Created Fri Jul 1 11:08:19 2016
dG = -17.00 [Initially -17.00] 16Jul01-11-08-18G
A
C
C
U
A
A
U
C
C
A
U
U
U
A
G
A
A
A
U
CA
A
U
U
G
C
G
AA C
A
G
C
G
A
A
G
AGA
U
U
C
U
A
A
A
UU
G
G UC
UAU
CC
U
A
G
G
U
C5’ 3’
10
20
30
40
50
60
KT290331
Output of sir_graph (©)mfold_util 4.7
Created Fri Jul 1 11:09:57 2016
dG = -13.80 [Initially -13.80] 16Jul01-11-09-56G
A
C
C
U
A
A
U
C
C
A
U
U
U
A
GA
A
A
U
CA
A
U
U
G
C
U
AA C
A
G
C
G
AA
U
A
G
A
U
A
C
U
A
A
A
UU
G
G UC
UAU
CC
U
A
G
G
U
C5’ 3’
10
20
30
40
50
60
KT290323 KF631396
Output of sir_graph (©)mfold_util 4.7
Created Fri Jul 1 11:11:32 2016
dG = -18.50 [Initially -18.50] 16Jul01-11-11-31G
A
C
C
U
A
A
U
C
C
A
U
U
U
A
GA
A
U
U
U
CG
A
C
A
G
C
A
A
U
G
A AA
A
U
U
G
C
UA
A
U
A
G
A
G
C
C
U
A
A
A
UU
G
G UC
UAA
CC
U
A
G
G
U
C5’ 3’
10
20
30
40
50
60
70
Cylindrospermum
KF052609
Output of sir_graph (©)mfold_util 4.7
Created Wed Mar 28 09:14:38 2018
dG = -11.80 [Initially -11.80] 18Mar28-09-14-37G
A
C
C
U
A
C
C
C
A
C
U
C
A
GAUA
U
C
G
A
A
C
A
C
A
AU C
A
G
U C AU
U
A
G
R
U
A
U
U
G
A
G
U
U
G
G
U
C AU
C
CUA
A
G
G
U
C5’ 3’
10
20
30
40
50
60
KF052616
Output of sir_graph (©)mfold_util 4.7
Created Wed Mar 28 09:19:33 2018
dG = -16.80 [Initially -16.80] 18Mar28-09-19-33G
A
C
C
U
G
C
C
C
A
C
U
C
A
AA
U
A
U
CGA
A
A
G
C
A
UU C
A
G
U CA
A
U
A
G
A
U
A
U
U
G
A
G
U
U
G
G
U
C AU
C
CUA
A
G
G
U
C5’ 3’
10
20
30
40
50
60
KF052601
Output of sir_graph (©)mfold_util 4.7
Created Wed Mar 28 09:21:15 2018
dG = -16.50 [Initially -16.50] 18Mar28-09-21-15G
A
C
C
U
A
C
C
C
A
C
U
C
A
AA
U
A
U
CGA
A
A
G
C
A
UU C
A
G
U CA
A
U
A
G
A
U
A
U
U
G
A
G
U
U
G
G
U
C AU
C
CUA
A
G
G
U
C5’ 3’
10
20
30
40
50
60
TrichormusKF417426
Output of sir_graph (©)mfold_util 4.7
Created Mon Jun 20 11:30:08 2016
dG = -5.80 [Initially -5.80] 16Jun20-11-30-06G
A
C
C
U
A
UAC
C
C
C
U
C
AA
G
U
A
U
CA
A
A
A
G
CC
A
G CG
U
G
C AA
A
U
A
G
A
UC
A
U
G
A
GA
U
G
G
U
C AA
A
CCU
A
G
G
U
C5’ 3’
10
20
30
40
50
60
KF761567
Output of sir_graph (©)mfold_util 4.7
Created Fri Jul 1 11:48:09 2016
dG = -15.10 [Initially -15.10] 16Jul01-11-48-08G
A
C
C
U
A
C
A
C
C
C
C
U
C
A
AA
A
C
U
CG
A
A
A
G
C
A
AA A
U
G
C CA
A
U
A
G
A
G
A
U
U
G
A
GUU
G
G
U CU
AAC
CU
A
G
G
U
C5’ 3’
10
20
30
40
50
60
KF761561
Output of sir_graph (©)mfold_util 4.7
Created Fri Jul 1 11:49:47 2016
dG = -15.10 [Initially -15.10] 16Jul01-11-49-46G
A
C
C
U
A
C
A
C
C
C
C
U
C
A
AA
A
C
U
CG
A
A
A
G
C
A
AA A
U
G
C CA
A
U
A
G
A
G
A
U
U
G
A
GUU
G
G
U CU
AAC
CU
A
G
G
U
C5’ 3’
10
20
30
40
50
60
KF417428
Output of sir_graph (©)mfold_util 4.7
Created Fri Jul 1 11:51:06 2016
dG = -16.20 [Initially -16.20] 16Jul01-11-51-05G
A
C
C
U
A
C
A
C
C
C
C
U
C
A
AA
U
C
U
UG
A
A
A
G
C
A
AA G
U
G
C AA
A
U
A
G
A
G
A
U
U
G
A
GAU
G
G
U CA
AAC
CU
A
G
G
U
C5’ 3’
10
20
30
40
50
60
KC854772
Output of sir_graph (©)mfold_util 4.7
Created Fri Jul 1 11:52:34 2016
dG = -9.80 [Initially -9.80] 16Jul01-11-52-33G
A
C
C
U
A
A
U
C
C
A
U
U
U
A
GA
A
A
U
CGA
A
C
A
C
CA
A C AG
U
U
A
U
U
A
G
A
U
C
C
U
A
A
AU
U
G
G UC
UAC
UC
U
A
G
G
U
C5’ 3’
10
20
30
40
50
60
Halotia
KC695877
Output of sir_graph (©)mfold_util 4.7
Created Mon Jun 20 11:22:27 2016
dG = -12.30 [Initially -12.30] 16Jun20-11-22-25G
A
C
C
U
A
CAC
C
C
C
U
C
A
AA
U
C
U
UG
A
A
A
G
C
A
AA A
U
G
C AA
A
U
A
A
A
G
A
U
U
G
A
GU
U
G
G
U
C AA
A
CCG
A
G
G
U
C5’ 3’
10
20
30
40
50
60
KJ843311
Output of sir_graph (©)mfold_util 4.7
Created Wed Mar 28 09:26:39 2018
dG = -15.80 [Initially -15.80] 18Mar28-09-26-38G
A
C
C
U
A
C
A
C
C
C
C
U
C
A
AA
U
C
U
UG
A
A
A
G
C
A
AA A
U
G
C AA
A
U
A
A
A
G
A
U
U
G
A
GUU
G
G
U CU
AAC
CU
A
G
G
U
C5’ 3’
10
20
30
40
50
60

70
Figure 3.6 All D1-D1ʹ helices, folded secondary structures, predicted using Mfold, for the Tolypothricaceae.
Tolypothricaceae
Hassallia
Tolypothrix
HQ847554
Output of sir_graph (©)mfold_util 4.7
Created Wed Mar 28 12:33:42 2018
dG = -16.00 [Initially -16.00] 18Mar28-12-33-41G
A
C
C
U
A
C
C
C
G
C
U
C
A
GA
U
A
U
UGA
A
A
A
CA
AU U
U
G
U GA
U
U
A
G
A
U
A
U
U
G
A
G
U
U
G
G
U
CA U
C
C
UAU
A
G
G
U
C5’ 3’
10
20
30
40
50
60
HQ847555
Output of sir_graph (©)mfold_util 4.7
Created Wed Mar 28 12:45:30 2018
dG = -16.00 [Initially -16.00] 18Mar28-12-45-27G
A
C
C
U
A
C
C
C
G
C
U
C
A
GA
U
A
U
UGA
A
A
A
CA
AU U
U
G
U GA
U
U
A
G
A
U
A
U
U
G
A
G
U
U
G
G
U
CA U
C
C
UAU
A
G
G
U
C5’ 3’
10
20
30
40
50
60
HQ847556
Output of sir_graph (©)mfold_util 4.7
Created Wed Mar 28 12:43:48 2018
dG = -15.60 [Initially -15.60] 18Mar28-12-43-46G
A
C
C
U
A
C
C
C
G
C
U
C
A
GA
U
A
U
UGA
A
A
A
CA
AU U
A
G
U GA
U
U
A
G
A
U
A
U
U
G
A
G
U
U
G
G
U
CA U
C
C
G
AUU
A
G
G
U
C5’ 3’
10
20
30
40
50
60
JQ083648
Output of sir_graph (©)mfold_util 4.7
Created Wed Mar 28 12:36:23 2018
dG = -16.00 [Initially -16.00] 18Mar28-12-36-22G
A
C
C
U
A
C
C
C
G
C
U
C
A
GA
U
A
U
UGA
A
A
A
CA
AU U
U
G
U GA
U
U
A
G
A
U
A
U
U
G
A
G
U
U
G
G
U
CA U
C
C
UAU
A
G
G
U
C5’ 3’
10
20
30
40
50
60
JQ083649
Output of sir_graph (©)mfold_util 4.7
Created Mon Jun 20 10:58:59 2016
dG = -15.40 [Initially -15.40] 16Jun20-10-58-58G
G
C
C
U
A
C
C
C
G
C
U
C
A
GA
U
A
U
UGA
A
A
A
CA
AU U
U
G
U GA
U
U
A
G
A
U
A
U
U
G
A
G
U
U
G
G
U
CA U
C
C
UAU
A
G
G
U
C5’ 3’
10
20
30
40
50
60
JQ083650
Output of sir_graph (©)mfold_util 4.7
Created Mon Jun 20 11:02:46 2016
dG = -16.00 [Initially -16.00] 16Jun20-11-02-45G
A
C
C
U
A
C
C
C
G
C
U
C
A
GA
U
A
U
UGA
A
A
A
CA
AU U
U
G
U GA
U
U
A
G
A
U
A
U
U
G
A
G
U
U
G
G
U
CA U
C
C
UAU
A
G
G
U
C5’ 3’
10
20
30
40
50
60
KF934132
Output of sir_graph (©)mfold_util 4.7
Created Wed Mar 28 12:47:09 2018
dG = -15.90 [Initially -15.90] 18Mar28-12-47-08G
A
C
C
U
A
C
C
C
G
C
U
C
A
GA
U
A
U
UGA
A
A
A
CA
AU U
U
G
U GA
U
U
A
G
A
U
A
U
U
G
A
G
U
U
G
G
U
CA U
C
C
G
AUU
A
G
G
U
C5’ 3’
10
20
30
40
50
60
KF934131
Output of sir_graph (©)mfold_util 4.7
Created Wed Mar 28 12:48:59 2018
dG = -15.90 [Initially -15.90] 18Mar28-12-48-58G
A
C
C
U
A
C
C
C
G
C
U
C
A
GA
U
A
U
UGA
A
A
A
CA
AU U
U
G
U GA
U
U
A
G
A
U
A
U
U
G
A
G
U
U
G
G
U
CA U
C
C
G
AUU
A
G
G
U
C5’ 3’
10
20
30
40
50
60
HassalliaJQ083654
Output of sir_graph (©)mfold_util 4.7
Created Wed Mar 28 12:52:56 2018
dG = -15.90 [Initially -15.90] 18Mar28-12-52-55G
A
C
C
U
A
C
C
C
G
C
U
C
A
GA
U
A
U
UGA
A
A
A
CA
AU U
U
G
U GA
U
U
A
G
A
U
A
U
U
G
A
G
U
U
G
G
U
CA U
C
C
G
AUU
A
G
G
U
C5’ 3’
10
20
30
40
50
60
JQ083653
Output of sir_graph (©)mfold_util 4.7
Created Wed Mar 28 12:54:48 2018
dG = -15.90 [Initially -15.90] 18Mar28-12-54-47G
A
C
C
U
A
C
C
C
G
C
U
C
A
GA
U
A
U
UGA
A
A
A
CA
AU U
U
G
U GA
U
U
A
G
A
U
A
U
U
G
A
G
U
U
G
G
U
CA U
C
C
G
AUU
A
G
G
U
C5’ 3’
10
20
30
40
50
60
JN385291
Output of sir_graph (©)mfold_util 4.7
Created Thu Jun 30 17:48:31 2016
dG = -16.80 [Initially -16.80] 16Jun30-17-48-30G
A
C
C
U
A
C
C
C
A
C
U
C
A
GA
U
A
U
CGA
A
A
A
CU
U
UC U
U
G
U AA
U
U
A
G
A
U
A
U
U
G
A
G
U
U
G
G
U
CA U
C
C
UUC
A
G
G
U
C5’ 3’
10
20
30
40
50
60
JQ083657
Output of sir_graph (©)mfold_util 4.7
Created Thu Jun 30 17:50:21 2016
dG = -17.40 [Initially -17.40] 16Jun30-17-50-20G
A
C
C
U
A
C
C
C
A
C
U
C
A
GA
U
A
U
U
G
A
A
U
UU
A
UU U
G
U
A
A
U
U
A
A
A
U
A
C
U
G
A
G
U
U
G
G
U
CA U
C
C
UAU
A
G
G
U
C5’ 3’
10
20
30
40
50
60
JQ083652
Output of sir_graph (©)mfold_util 4.7
Created Thu Jun 30 17:52:29 2016
dG = -16.00 [Initially -16.00] 16Jun30-17-52-28G
A
C
C
U
A
C
C
C
G
C
U
C
A
GA
U
A
U
UGA
A
A
A
CA
AU U
U
G
U GA
U
U
A
G
A
U
A
U
U
G
A
G
U
U
G
G
U
CA U
C
C
UAU
A
G
G
U
C5’ 3’
10
20
30
40
50
60
KF934130
Output of sir_graph (©)mfold_util 4.7
Created Thu Jun 30 17:54:24 2016
dG = -15.90 [Initially -15.90] 16Jun30-17-54-23G
A
C
C
U
A
C
C
C
G
C
U
C
A
AA
U
A
U
UGA
A
A
A
CA
AU U
U
G
U GA
U
U
A
G
A
U
A
U
U
G
A
G
U
U
G
G
U
CA U
C
C
G
AUU
A
G
G
U
C5’ 3’
10
20
30
40
50
60
Rexia ColeodesmiumSpirirestisTolypothrix
FJ661005
Output of sir_graph (©)mfold_util 4.7
Created Thu Jun 30 17:55:55 2016
dG = -14.60 [Initially -14.60] 16Jun30-17-55-54G
A
C
C
U
A
C
C
C
A
A
C
U
U
U
GA
A
A
U
C
A
A
U
U
G
C
A
AA C
A
GU
C
A
A
U
A
G
AG
A
C
A
A
A
G
A
U
G
G UC
UAC
UC
U
A
G
G
U
C5’ 3’
10
20
30
40
50
60
KF934181
Output of sir_graph (©)mfold_util 4.7
Created Wed Mar 28 12:51:38 2018
dG = -15.60 [Initially -15.60] 18Mar28-12-51-37G
A
C
C
U
A
C
C
C
G
C
U
C
A
AA
U
A
U
UGA
A
A
A
CA
AU U
U
G
U GA
U
U
A
A
A
U
A
U
U
G
A
G
U
U
G
G
U
CA U
C
C
UAA
A
G
G
U
C5’ 3’
10
20
30
40
50
60
JQ083656
Output of sir_graph (©)mfold_util 4.7
Created Thu Jun 30 17:46:39 2016
dG = -15.90 [Initially -15.90] 16Jun30-17-46-38G
A
C
C
U
A
C
C
C
G
C
U
C
A
GA
U
A
U
UGA
A
A
A
CA
AU U
U
G
U GA
U
U
A
G
A
U
A
U
U
G
A
G
U
U
G
G
U
CA U
C
C
G
AUU
A
G
G
U
C5’ 3’
10
20
30
40
50
60
AY493596
Output of sir_graph (©)mfold_util 4.7
Created Wed Mar 28 12:58:28 2018
dG = -16.70 [Initially -16.70] 18Mar28-12-58-27G
A
C
C
U
A
C
C
C
A
C
U
C
A
AA
U
A
U
CGA
A
A
G
CA
AU U
U
G
U AA
A
U
A
G
A
U
A
U
U
G
A
G
U
U
G
G
U
CA U
C
C
UAU
A
G
G
U
C5’ 3’
10
20
30
40
50
60

71
Figure 3.7 All Box B helices, folded secondary structures, predicted using Mfold, for the Nostocaceae.
Nostocaceae
Pelatocladus
Output of sir_graph (©)mfold_util 4.7
Created Fri Mar 30 11:10:27 2018
dG = -9.10 [Initially -8.60] 18Mar30-11-10-26U
A
G
C
A
C
C
U
G
A
A
U
C
A
A A
A
G
A
G
U
C
A
G
U
C
U
G
C
U
G5’ 3’
10
20
30
JN385293
Camptylonemopsis
Output of sir_graph (©)mfold_util 4.7
Created Fri Mar 30 11:20:50 2018
dG = -12.00 [Initially -12.00] 18Mar30-11-20-50C
A
G
C
A
A
A
A
U
G
A
C
U
U
A
AG
A
A
A
A
G
U
C
A
G
A
C
U
G
C
U
G5’ 3’
10
20
30
HQ847564
Output of sir_graph (©)mfold_util 4.7
Created Fri Mar 30 11:26:04 2018
dG = -12.00 [Initially -12.00] 18Mar30-11-26-03C
A
G
C
A
A
A
A
U
G
A
C
U
U
A
AG
A
A
A
A
G
U
C
A
G
A
C
U
G
C
U
G5’ 3’
10
20
30
JN385292
Cylindrospermum
Output of sir_graph (©)mfold_util 4.7
Created Fri Mar 30 11:30:54 2018
dG = -10.50 [Initially -10.50] 18Mar30-11-30-53C
A
G
C
A
A
C
A
U
G
G
U
G
AU
U
A
G
C
C
A
G
A
C
U
G
C
U
G5’ 3’
10 20
KF052609
Output of sir_graph (©)mfold_util 4.7
Created Fri Mar 30 11:36:04 2018
dG = -10.40 [Initially -10.40] 18Mar30-11-36-03C
A
G
C
A
A
U
U
G
A
C
G
A
A AG
A
G
U
C
A
A
A
C
U
G
C
U
G5’ 3’
1020
KF052616
Output of sir_graph (©)mfold_util 4.7
Created Fri Mar 30 11:45:22 2018
dG = -10.40 [Initially -10.40] 18Mar30-11-45-21C
A
G
C
A
A
U
U
G
A
C
G
A
G AG
A
G
U
C
A
A
A
C
U
G
C
U
G5’ 3’
1020
KF052601
Anabaena
Output of sir_graph (©)mfold_util 4.7
Created Fri Mar 30 11:48:33 2018
dG = -11.00 [Initially -11.00] 18Mar30-11-48-33C
A
G
C
A
A
C
U
G
A
A
A
C
U
A
U
A
A CA
A
U
A
G
U
U
U
UU
G
A
C
U
G
C
U
G5’ 3’
10
20
30
EF634471
Output of sir_graph (©)mfold_util 4.7
Created Fri Mar 30 11:55:48 2018
dG = -12.60 [Initially -12.60] 18Mar30-11-55-47C
A
G
C
A
A
U
U
G
A
U
U
G
U
U
UC A
U
A
C
A
A
U
C
G
A
A
C
U
G
C
U
G5’ 3’
10
20
30
KT290322
Output of sir_graph (©)mfold_util 4.7
Created Fri Mar 30 12:23:23 2018
dG = -8.80 [Initially -8.80] 18Mar30-12-23-23C
A
G
C
A
C
C
U
A
A
C
A
A
UA A
U
A
G
U
U
A
G
A
C
U
G
C
U
G5’ 3’
10
20
3’
KF6321396
Halotia
Output of sir_graph (©)mfold_util 4.7
Created Fri Mar 30 12:27:19 2018
dG = -12.10 [Initially -12.10] 18Mar30-12-27-18C
A
G
C
AA
C
A
U
G
G
C
A
U
G
U
A
G
G UA
U
A
U
A
A
U
G
U
C
A
G
A
C
U
G
C
U
G5’ 3’
10
20
30
KC695877
Output of sir_graph (©)mfold_util 4.7
Created Fri Mar 30 12:30:58 2018
dG = -15.40 [Initially -15.40] 18Mar30-12-30-57C
A
G
C
AA
C
A
U
G
A
C
A
U
U
U
A
U
G
U
AU U
G
C
A U
UU
A
G
A
U
G
U
C
A
G
A
C
U
G
C
U
G5’ 3’
10
20
30
40
KJ843311
Hydrocoryne
Output of sir_graph (©)mfold_util 4.7
Created Fri Mar 30 12:36:56 2018
dG = -4.50 [Initially -4.50] 18Mar30-12-36-56C
A
G
C
A
A
C
U
A
A
G
A
A
A G
A
C
C
U
A
G
A
C
U
G
C
U
G5’ 3’
10
20
KC346266
Output of sir_graph (©)mfold_util 4.7
Created Fri Mar 30 12:39:45 2018
dG = -9.90 [Initially -9.90] 18Mar30-12-39-45C
A
G
C
A
A
C
U
G
A
U
G
AA
A
A
G
U
C
A
G
A
C
U
G
C
U
G5’ 3’
10
20
JN385287
Output of sir_graph (©)mfold_util 4.7
Created Fri Mar 30 12:43:49 2018
dG = -12.30 [Initially -12.30] 18Mar30-12-43-47C
A
G
C
A
A
C
U
G
A
C
G
G
G AG
A
G
U
C
A
G
A
C
U
G
C
U
G5’ 3’
1020
KC346265
Cyanocohniella
Output of sir_graph (©)mfold_util 4.7
Created Fri Mar 30 13:07:43 2018
dG = -13.40 [Initially -13.40] 18Mar30-13-07-43C
A
G
C
A
A
C
A
U
G
G
C
U
A
G
A A
C
A
A
G
C
C
A
G
A
C
U
G
C
U
G5’ 3’
10
20
30
KJ737428
Output of sir_graph (©)mfold_util 4.7
Created Fri Mar 30 15:20:59 2018
dG = -13.40 [Initially -13.40] 18Mar30-15-20-58C
A
G
C
A
A
C
A
U
G
G
C
U
A
G
A A
C
A
A
G
C
C
A
G
A
C
U
G
C
U
G5’ 3’
10
20
30
KJ737427
Desmonostoc
Output of sir_graph (©)mfold_util 4.7
Created Fri Mar 30 15:27:14 2018
dG = -15.40 [Initially -15.40] 18Mar30-15-27-12C
A
G
C
AA
A
G
U
G
A
C
A
UA
U
A
G
C
A
U
G
A
U
UA
G
A
U
U
A
U
G
U
A
A
A
U
G
U
C
A
G
A
C
U
G
C
U
G5’ 3’
10
20
30
40
3’
KF934182
Output of sir_graph (©)mfold_util 4.7
Created Fri Mar 30 15:30:21 2018
dG = -11.70 [Initially -11.70] 18Mar30-15-30-19C
A
G
C
AA
C
A
U
G
A
C
A
UG
G
A
U
AU A
AU
A
A
AG
U
G
U
C
A
G
A
C
U
G
C
U
G5’ 3’
10
20
30
3’
KF417429
Output of sir_graph (©)mfold_util 4.7
Created Fri Mar 30 15:36:05 2018
dG = -13.00 [Initially -13.00] 18Mar30-15-36-04C
A
G
C
A
A
C
A
U
G
A
C
U
U
A
C
U
U AA
G
U
G
A
A
G
U
C
A
G
A
C
U
G
C
U
G5’ 3’
10
20
30
Nostoc
Output of sir_graph (©)mfold_util 4.7
Created Fri Mar 30 15:39:13 2018
dG = -11.70 [Initially -11.70] 18Mar30-15-39-12C
A
G
C
A
A
C
A
U
G
A
C
U
G
A
AU
G
U
A
A
G
U
C
A
G
A
C
U
G
C
U
G5’ 3’
10
20
30
EU586732
Output of sir_graph (©)mfold_util 4.7
Created Fri Mar 30 15:41:22 2018
dG = -12.20 [Initially -12.20] 18Mar30-15-41-21C
A
G
C
A
A
C
A
U
G
A
C
A
U
A
U U
A
A
U
G
U
C
A
G
A
C
U
G
C
U
G5’ 3’
10
20
30
EU586728
Output of sir_graph (©)mfold_util 4.7
Created Fri Mar 30 15:43:53 2018
dG = -12.30 [Initially -12.30] 18Mar30-15-43-51C
A
G
C
A
A
C
A
U
G
G
C
U
A U
A
G
C
C
A
G
A
C
U
G
C
U
G5’ 3’
10
20
HQ847576
Output of sir_graph (©)mfold_util 4.7
Created Fri Mar 30 15:47:39 2018
dG = -11.40 [Initially -11.40] 18Mar30-15-47-37C
A
G
C
A
A
C
U
G
A
C
U
G
A
G UA
A
A
G
U
U
A
G
A
C
U
G
C
U
G5’ 3’
10
20
30
KT763391
Output of sir_graph (©)mfold_util 4.7
Created Fri Mar 30 16:05:38 2018
dG = -12.50 [Initially -12.50] 18Mar30-16-05-37C
A
G
C
A
A
C
A
U
G
A
C
A
U
G
A
CU
U
U
A
G
U
G
U
C
A
G
A
C
U
G
C
U
G5’ 3’
10
20
30
KP001508
Output of sir_graph (©)mfold_util 4.7
Created Fri Mar 30 16:10:42 2018
dG = -13.00 [Initially -13.00] 18Mar30-16-10-41C
A
G
C
A
A
C
A
A
G
G
C
G
A A
A
G
C
C
A
G
A
C
U
G
C
U
G5’ 3’
1020
KF417426
Output of sir_graph (©)mfold_util 4.7
Created Fri Mar 30 16:14:39 2018
dG = -12.60 [Initially -12.60] 18Mar30-16-14-38C
A
G
C
A
A
C
A
U
G
G
C
U
UA
A
U
G
C
C
A
G
A
C
U
G
C
U
G5’ 3’
10 20
KF761567
Output of sir_graph (©)mfold_util 4.7
Created Fri Mar 30 16:19:24 2018
dG = -12.00 [Initially -12.00] 18Mar30-16-19-23C
A
G
C
A
A
C
A
U
G
A
C
A
U
A
U
UA
U
U
G
A
U
G
U
C
A
G
A
C
U
G
C
U
G5’ 3’
10
20
30
KF761561
Output of sir_graph (©)mfold_util 4.7
Created Fri Mar 30 16:24:13 2018
dG = -7.70 [Initially -7.70] 18Mar30-16-24-12C
A
G
C
A
A
C
A
C
G
G
U
G
GA
U
A
G
C
C
A
G
A
C
U
G
C
U
G5’ 3’
10 20
KF417428
Trichormus
KC854772
Output of sir_graph (©)mfold_util 4.7
Created Fri Mar 30 16:30:00 2018
dG = -13.40 [Initially -13.40] 18Mar30-16-29-59C
A
G
C
A
A
C
U
G
A
A
G
C
U
A
U
A
A AA
A
U
A
G
C
U
U
UU
G
A
C
U
G
C
U
G5’ 3’
10
20
30
Output of sir_graph (©)mfold_util 4.7
Created Fri Mar 30 16:32:12 2018
dG = -12.30 [Initially -12.30] 18Mar30-16-32-11C
A
G
C
A
A
C
A
U
G
G
C
U
A A
A
G
C
C
A
G
A
C
U
G
C
U
G5’ 3’
10
20
AY577534
Mojavia

72
Figure 3.8 All Box B helices, folded secondary structures, predicted using Mfold, for the Tolypothricaceae.
Maximum likelihood (ML) phylogenetic analysis of was calculated for sequences with
clonal replicates from the same strains of varying copy number and intragenomic heterogeneity
(Figure 3.9). The tree was computed using MEGA 7, with bootstrap support obtained from 1,000
pseudoreplicate data sets. Clades of operons with either both (B), neither (N), or one (1) tRNA
marked on the phylogeny.
TolypothricaceaeOutput of sir_graph (©)mfold_util 4.7
Created Sat Mar 31 20:20:37 2018
dG = -10.60 [Initially -10.60] 18Mar31-20-20-36C
A
G
C
A
A
C
U
G
A
G
C
A
A
UA
U
U
U
G
C
C
A
G
A
C
U
G
C
U
G5’ 3’
10
20
30
HQ847554
Hassallia
Output of sir_graph (©)mfold_util 4.7
Created Sat Mar 31 20:23:57 2018
dG = -10.60 [Initially -10.60] 18Mar31-20-23-56C
A
G
C
A
A
C
U
G
A
G
C
A
A
UA
U
U
U
G
C
C
A
G
A
C
U
G
C
U
G5’ 3’
10
20
30
JQ083648
Output of sir_graph (©)mfold_util 4.7
Created Sat Mar 31 20:26:45 2018
dG = -10.60 [Initially -10.60] 18Mar31-20-26-44C
A
G
C
A
A
C
U
G
A
G
C
A
A
UA
U
U
U
G
C
C
A
G
A
C
U
G
C
U
G5’ 3’
10
20
30
JQ083649
Output of sir_graph (©)mfold_util 4.7
Created Sat Mar 31 20:30:01 2018
dG = -10.60 [Initially -10.60] 18Mar31-20-30-00C
A
G
C
A
A
C
U
G
A
G
C
A
A
UA
U
U
U
G
C
C
A
G
A
C
U
G
C
U
G5’ 3’
10
20
30
JQ083650
Output of sir_graph (©)mfold_util 4.7
Created Sat Mar 31 20:33:05 2018
dG = -10.60 [Initially -10.60] 18Mar31-20-33-05C
A
G
C
A
A
C
U
G
A
G
C
A
A
UA
U
U
U
G
C
C
A
G
A
C
U
G
C
U
G5’ 3’
10
20
30
HQ847556
Output of sir_graph (©)mfold_util 4.7
Created Sat Mar 31 20:38:18 2018
dG = -7.80 [Initially -7.80] 18Mar31-20-38-18C
A
G
C
A
A
C
U
G
A
G
C
A
A
UA
U
U
U
G
C
C
A
A
A
C
U
G
C
U
G5’ 3’
10
20
30
HQ847555
Output of sir_graph (©)mfold_util 4.7
Created Sat Mar 31 20:41:30 2018
dG = -10.60 [Initially -10.60] 18Mar31-20-41-29C
A
G
C
A
A
C
U
G
A
G
C
A
A
UA
U
U
U
G
C
C
A
G
A
C
U
G
C
U
G5’ 3’
10
20
30
KF934132
Output of sir_graph (©)mfold_util 4.7
Created Sat Mar 31 20:53:01 2018
dG = -10.60 [Initially -10.60] 18Mar31-20-53-01C
A
G
C
A
A
C
U
G
A
G
C
A
A
UA
U
U
U
G
C
C
A
G
A
C
U
G
C
U
G5’ 3’
10
20
30
KF934131
Output of sir_graph (©)mfold_util 4.7
Created Sat Mar 31 20:55:37 2018
dG = -11.80 [Initially -11.80] 18Mar31-20-55-36C
A
G
C
A
A
C
U
G
A
G
C
A
A
C
UU
C
A
U
U
G
C
C
A
G
C
C
U
G
C
U
G5’ 3’
10
20
30
KF934181
Rexia
Output of sir_graph (©)mfold_util 4.7
Created Sat Mar 31 20:58:28 2018
dG = -10.60 [Initially -10.60] 18Mar31-20-58-28C
A
G
C
A
A
C
U
G
A
G
C
A
A
UA
U
U
U
G
C
C
A
G
A
C
U
G
C
U
G5’ 3’
10
20
30
JQ083654
Tolypothrix
Output of sir_graph (©)mfold_util 4.7
Created Sat Mar 31 21:00:44 2018
dG = -10.60 [Initially -10.60] 18Mar31-21-00-43C
A
G
C
A
A
C
U
G
A
G
C
A
A
UA
U
U
U
G
C
C
A
G
A
C
U
G
C
U
G5’ 3’
10
20
30
JQ083653
Output of sir_graph (©)mfold_util 4.7
Created Sat Mar 31 21:05:24 2018
dG = -11.60 [Initially -11.60] 18Mar31-21-05-23C
A
G
C
A
A
C
U
G
A
G
C
A
U
U
U UG
U
U
G
C
C
A
G
A
C
U
G
C
U
G5’ 3’
10
20
30
JN385291
Output of sir_graph (©)mfold_util 4.7
Created Sat Mar 31 21:07:52 2018
dG = -12.80 [Initially -12.80] 18Mar31-21-07-52C
A
G
C
A
A
C
U
G
A
G
C
G
G
A
UU
A
U
U
C
G
C
C
A
G
A
C
U
G
C
U
G5’ 3’
10
20
30
JQ083657
Output of sir_graph (©)mfold_util 4.7
Created Sat Mar 31 21:10:05 2018
dG = -10.60 [Initially -10.60] 18Mar31-21-10-04C
A
G
C
A
A
C
U
G
A
G
C
A
A
UA
U
U
U
G
C
C
A
G
A
C
U
G
C
U
G5’ 3’
10
20
30
JQ083652
Output of sir_graph (©)mfold_util 4.7
Created Sat Mar 31 21:12:21 2018
dG = -9.40 [Initially -9.40] 18Mar31-21-12-20C
A
G
C
A
A
C
U
G
A
G
C
A
A
UA
U
U
A
G
C
C
A
G
A
C
U
G
C
U
G5’ 3’
10
20
30
KF934130
Output of sir_graph (©)mfold_util 4.7
Created Sat Mar 31 21:14:31 2018
dG = -10.20 [Initially -10.20] 18Mar31-21-14-30C
A
G
C
A
A
U
U
G
A
C
G
U
G
AA U
A
A
C
A
G
U
C
A
A
A
C
U
G
C
U
G5’ 3’
10
20
30
FJ661005
Output of sir_graph (©)mfold_util 4.7
Created Sat Mar 31 21:03:11 2018
dG = -14.00 [Initially -14.00] 18Mar31-21-03-11C
A
G
C
A
A
C
U
G
A
G
C
A
U
A
G
AU A
A
A
U
G
U
G
C
C
A
G
A
C
U
G
C
U
G5’ 3’
10
20
30
AY493596
Coleodesmium
Output of sir_graph (©)mfold_util 4.7
Created Sat Mar 31 21:20:14 2018
dG = -10.60 [Initially -10.60] 18Mar31-21-20-13C
A
G
C
A
A
C
U
G
A
G
C
A
A
UA
U
U
U
G
C
C
A
G
A
C
U
G
C
U
G5’ 3’
10
20
30
JQ083656

73
Figure 3.9 Unweighted maximum-likelihood (ML) phylogenetic analysis, comparing ITS sequences for taxa with multiple operon sequences available within two Nostocales clades, Nostoc and Brasilonema, with an Oscillatoriaceaen outgroup, computed using MEGA 7, with bootstrap support obtained from 1,000 pseudoreplicate data sets. Clades of operons were marked as having either both (B), neither (N), or one (1) tRNA.
Operon sequences in both the Nostoc and Brasilonema fell out into clades of operons
with similar patterns of tRNA inclusion versus clades including multiple operons from individual
strains, except for those strains with multiple operons with the same pattern of tRNA inclusion
(Fig 3.9). Tajima’s D was calculated for both the D1-D1’ and Box B helices, as well as the full
ITS region for intragenomic multiple operons (Table 3.1).
Table 3.1 Results from Tajima's Neutrality Test Sample Set m S Ps 𝛳 𝜋 D
D1-D1' Helix Both tRNAs 24 77 0.647059 0.173275 0.154518 -0.426579 D1-D1' Helix Neither tRNA 37 89 0.679389 0.162745 0.197029 0.777132 Box B Helix Both tRNAs 25 24 0.648649 0.171784 0.205135 0.713618 Box B Helix Neither tRNA 37 35 0.507246 0.121509 0.138747 0.500298 Full ITS Both tRNAs 25 481 0.558653 0.14795 0.118533 -0.798165 Full ITS Neither tRNAs 34 477 0.584559 0.142966 0.135046 -0.212097
Nostoc CNP AK1 N Nostoc EV1KK1 231 6d Pat2N
F15-VF5-2-DONEn Nostoc CM1VF14 pattern2N
Nostoc CM1VF10 pat2N Nostoc CM1VF10 pat2B Nostoc CM1VF14 pattern2B
F15-VF5 1-DONEo Nostoc CNP AK1 B
Nostoc CM1VF14 pattern1 CM1VF10 220 7F pat1
CM1VF10 220 7H pat1 B. burkei HA4348-LM4 clone 38DB B. burkei HA4348-LM4 clone 38AB B. burkei HA4348-LM4 clone 38BB OutBrasclone1B
B. sp. RKST-322 clone C2B HQ847567B angustatum HA4187-MV1 clone B2+p1HB
B. sp. RKST-322 clone C1N OurBrasclone2N HQ847566 B. angustatum HA4187-MV1 clone B2+p1FN
outgroup EF429295.1 Leptolyngbya boryana UTEX B 488
81100
99
100
78
87
88
77
75
0.1
Clones with neither tRNA gene
Clones with neither tRNA gene
Clones with both tRNA genes
Clones with both tRNA genes
Clones with one tRNA genes

74
Sample size ranged from n = 24 to n = 37 (Tab. 3.1). For the D1-D1’ helix operons
containing both tRNAs demonstrated a higher occurrence of rarer alleles (D = -0.426579), while
operons with neither tRNA (D = 0.777132) demonstrated greater than average heterozygosity.
Both Box B helices (two tRNAs D = 0.713618; neither tRNA D = 0.500298) displayed balancing
selective pressures. Both full ITS sequences displayed positive selection though by different
degrees (two tRNAs, D = -0.798165; neither tRNA, D = -0.212097). The results however were
not statistically significantly at the significance level of 1. Thus, all populations were found to be
evolving neutrally. While prokaryotes cannot have a heterozygous advantage, as multiple
operons are not obligatory across all orders, there may be an evolutionary advantage to
intragenomic heterogeneity through differential expression of multiple operons.
Recommendations
First Recommendation: Sequence data added into Genbank should be standardized in several
respects. First ITS sequences should be included with 16S gene sequence data, not added in
separate files. Secondly, ITS domains should be annotated in uploaded sequences, and the
partiality of ITS domains should be analyzed prior to sequence addition, and correctly noted
given that ITS domains with no flanking 16S and 23S gene regions cannot be considered full,
while those with flanking genes should be considered full even if some motifs are missing. The
inclusion of only a single ITS domain should not be considered even as partial because when
flanking domains are absent there can be no assurance that the included domain has been
correctly identified. Lastly, multiple operons from a single newly sequenced or described taxa
should also be noted and added in Genbank. Published results where cloning has been described
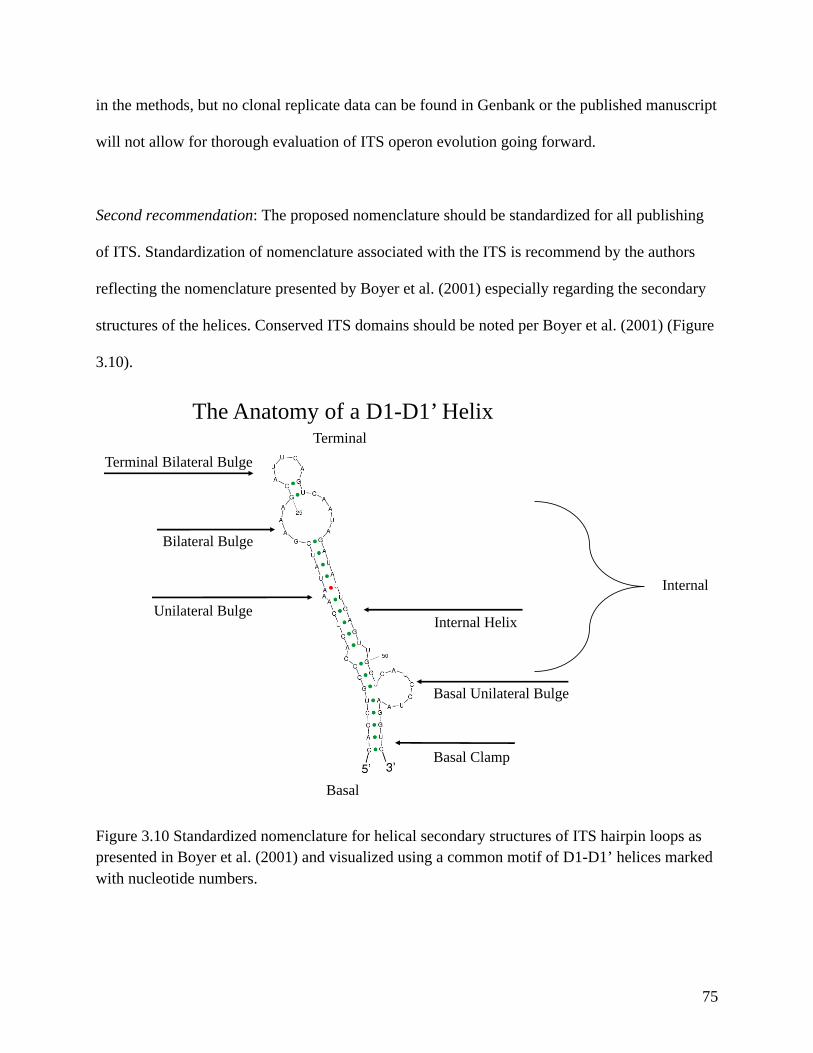
75
in the methods, but no clonal replicate data can be found in Genbank or the published manuscript
will not allow for thorough evaluation of ITS operon evolution going forward.
Second recommendation: The proposed nomenclature should be standardized for all publishing
of ITS. Standardization of nomenclature associated with the ITS is recommend by the authors
reflecting the nomenclature presented by Boyer et al. (2001) especially regarding the secondary
structures of the helices. Conserved ITS domains should be noted per Boyer et al. (2001) (Figure
3.10).
Figure 3.10 Standardized nomenclature for helical secondary structures of ITS hairpin loops as presented in Boyer et al. (2001) and visualized using a common motif of D1-D1’ helices marked with nucleotide numbers.
The Anatomy of a D1-D1’ Helix
Terminal Bilateral Bulge
Bilateral Bulge
Unilateral BulgeInternal Helix
Basal Clamp
Basal Unilateral Bulge
Terminal
Basal
Internal
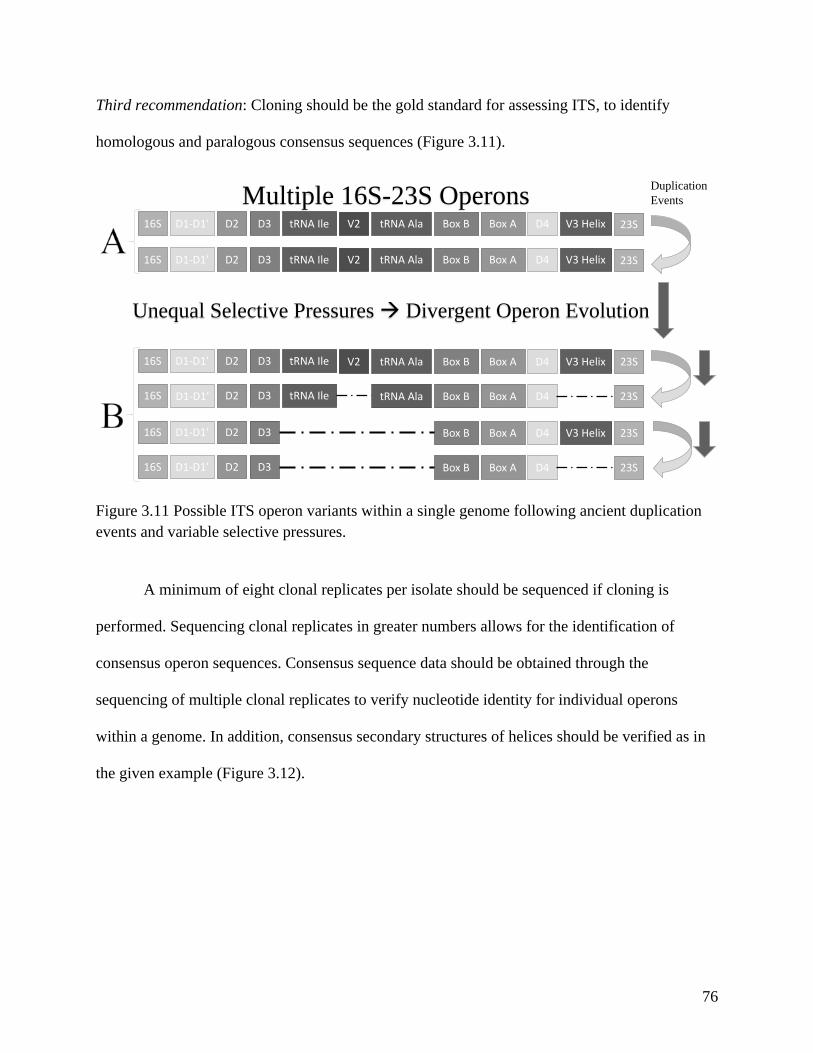
76
Third recommendation: Cloning should be the gold standard for assessing ITS, to identify
homologous and paralogous consensus sequences (Figure 3.11).
Figure 3.11 Possible ITS operon variants within a single genome following ancient duplication events and variable selective pressures.
A minimum of eight clonal replicates per isolate should be sequenced if cloning is
performed. Sequencing clonal replicates in greater numbers allows for the identification of
consensus operon sequences. Consensus sequence data should be obtained through the
sequencing of multiple clonal replicates to verify nucleotide identity for individual operons
within a genome. In addition, consensus secondary structures of helices should be verified as in
the given example (Figure 3.12).
D1-D1’ D2 D3 Box B Box A D4 V3 Helix16S 23S
D1-D1’ D2 D3 tRNA Ile tRNA Ala Box B Box A D4 V3 Helix16S 23SV2
Unequal Selective Pressures à Divergent Operon Evolution
D1-D1’ D2 D3 Box B Box A D416S 23S
D1-D1’ D2 D3 tRNA Ile tRNA Ala Box B Box A D4 V3 Helix16S 23SV2
D1-D1’ D2 D3 tRNA Ile tRNA Ala Box B Box A D4 V3 Helix16S 23SV2
D2 D3 tRNA Ile tRNA Ala Box B Box A D416S 23SD1-D1’
Multiple 16S-23S Operons Duplication Events

77
Figure 3.12 Consensus helical structural motifs identified from consensus multiple operons sequences.
All cloning data should be reported to Genbank and included in manuscripts to
substantially increase the amount of clonal replicate data for cyanobacterial taxonomy. This data
will eventually allow taxonomists to effectively discern evolutionary patterns of operon descent,
and their extent of variation at the extragenomic and intragenomic level.
Fourth recommendation: Standardization of folding protocols is recommended per Boyer et al.
(2001) and Johansen et al. (2005, 2011). First, sequence data should be coded for conserved ITS
domains by hand in a word program. Identification the end of the 16S gene [ 5’-CCTCCTT-3’]
and the beginning of the 23S gene [5’-GGTCAA-3’], with care taken to confirm the beginning of
the 23S gene is 45 nucleotides downstream of the sequence [5’-CACACAGAG-3’], should
precede annotation of ITS domains. All commonly conserved sequence domains both in the ITS
or in the 16S-23S operon at large are variable to some degree and must be identified even if close
TTTTTAGGGAGACCCAAATCGATTCAAAAGTCAAAAATCAAAATTCTCAAACAGGAATTTGGATTTATCATATAACTTTGAATTGATTTTATCCCGAGGTCGGTCGGCAAGCATAGTGTAAGCTTTCAAACTATAAGTTAGGTTCCGATATGGGCTATTAGCTCAGGTGGTTAGAGCGCACCCCTGATAAGGGTGAGGTCCCTGGTTCGAGTCCAGGATGGCCCACCTGAAGTCAATTCCAAAGTTAAAATGATCAATTCAAAAAAACTTTGAATTTTGAATTTTGAGTTTTGAATTGCTTGGGGGGGTATAGCTCAGTTGGTAGAGCGCCTGCTTTGCAAGCAGGATGTCAGGAGTTCGAGTCTCCTTACCTCCACCTGCTCCCTAAGTAATTAAGTTTTGTGATTCCACCCTTGTTGAGTGTACTCAAATAGCAGCAAATAAAAAGAGAGTGCACGCAAGTGAGAAAAGCAAAAGCAAAATTATCATCCGAAAAGGAATTGGAGAAAAATCAGCATCTTGTGAGATAAAGCAAGAATGCTGGGAAATTTCCAGCAAAAGAACCTTGAAAACTGCATAGAAACGCGAAAATTGTCAGGTAGTTAACTATCAACAACAGTTAACACTCCAAACAAAAGCAGCAATGATTGTTTTTTTAGGGAGACCCAAATCGATTCAAAAGTCAAAAATCAAAATTCTCAAACAGGAATTTGGATTTATCATATAACTTTGAATTGATTTTATCCCGAGGTCGGTCGCAAGCATAGTGTAAGCTTTCAAACTATAAGTTAGGTTCGGATATGGGCTATTAGCTCAGGTGGTTAGAGCGCACCCCTGATAAGGGTGAGGTCCCTGGTTCGAGTCCAGGATGGCCCACCTGAAGTCAATTCCAAAGTTAAAATGATCAATTCAAAAAAACTTTGAATTTTGAATTTTGAGTTTTGAATTGCTTGGGGGGGTATAGCTCAGTTGGTAGAGCGCCTGCTTTGCAAGCAGGATGTCAGGAGTTCGAGTCTCCTTACCTCCACCTGCTCCCTAAGTAATTAAGTTTTGTGATTCCACCCTTGTTGAGTGTACTCAAATAGCAGCAAATAAAAAGAGAGTGCACGCAAGTGAGAAAAGCAAAAGCAAAATTATCATCCGAAAAGGAATTGGAGAAAAATCAGCATCTTGTGAGATAAAGCAAGAATGCTGGGAAATTTCCAGCAAAAGAACCTTGAAAACTGCATAGAAACGCGAAAATTGTCAGGTAGTTAACTATCAACAACAGTTAACACTCCAAACAAAAGCAGCAATGATTGTT
TTTTTAGGGAGACCCACTTTTGAGTTAGTTAGAAGCAGTTAATTAGTAACTGATAACTCAAGAGCCATCCCGAGGTCGGTCATTAGTCAATGAGTGCAAGCTTTCAAACTATTTTTGGTTCACCTCAATTTTCTAGCATAAACTCAAAAATAAATTTAATTTCTTAGCTATGCCTAACATATTTGATTTGTGGATATTTTAAGTAACGGCTAGACTATTTACTGATAGACAGTATATTTAAGGGAATAAGGTTTCAGCATCTTGTGAAGATAAGCATGAATGCTGGGAAATTTCCAGCAAAAGAACCTTGAAAACTGCATAGAAACGCGAAAAATGTCAGGTAGTTAACTATCAACAACAGTTAACACTCCAAGCAAAAGCAGCATTGATTTGTTTGTAGTCTAGCAAGAAAAGGCGAATGGTGGATACCTTGGCACACAGAGGTGAAGAATCACTAGTGCGGCCGCCTGCAGGTCGACCATATGGGAGAGCTCCCAATCGCGTTGGATGCATTAGAATGTGTTTTTCTATAGTGTCATCTAAATAGCTTGGCGTAAATCATGGTCATAGCTGTTTCCTGTGTGGAAATTGTTATCCGTTCATAATTTCCACACAACATACGAG
TTTTTAGGGAGACCCACTTTTGAGTTAGTTAGAAGCAGTTAATTAGTAACTGATAACTCAAGAGCCATCCCGAGGTCGGTCATTAGTCAAGAGTGCAAGCTTTCAAACTATTTTTGGTTCACCTCAATTTTCTAGCATAAACTCAAAAATAAATTTAATTTCTTAGCTATGCCTAACATATTTGATTTGTGGATATTTTAAGTAACGGCTAGACTATTTACTGATAGACAGTATATTTAAGGGAATAAGGTTTCAGCATCTTGTGAAGATAAGCATGAATGCTGGGAAATTTCCAGCAAAAGAACCTTGAAAACTGCATAGAAACGCGAAAAATGTCAGGTAGTTAACTATCAACAACAGTTAACACTCCAAGCAAAAGCAGCATTGATTTGTTTGTAGTCTAGCAAGAAAAGGCGAATGGTGGATACCTTGGCACACAGAGGTGAAGAATCACTAGTGCGGCCGCCTGCAGGTCGACCATATGGGAGAGCTCCCAATCGCGTTGGATGCATTAGAATGTGTTTTTCTATAGTGTCATCTAAATAGCTTGGCGTAAATCATGGTCATAGCTGTTTCCTGTGTGGAAATTGTTATCCGTTCATAATTTCCACACAACATACGAG
Four Unique Consensus ITS Sequences
Operon
1
Operon
2
Operon
3
Operon
4
Consensus ITS Structures
Output of sir_graph (©)mfold_util 4.7
Created Thu May 25 12:30:04 2017
dG = -19.40 [Initially -19.40] 17May25-12-30-03G
A
C
C
C
A
A
A
U
C
G
A
U
U
CA
A
A
A
G
UC
A
A
A
A
A
U
C
A
A
A
A
U
U
C
UC
A
AA C
A
G
G
A
A
U
U
U
G
G
A
U
U
U A UC
AUA
UA
A
C
U
U
U
G
A
A
U
U
G
A
U
U
U UA
UCCC
GA
G
G
U
C5’ 3’
10
20
30
40
50
60
70
80
90
Output of sir_graph (©)mfold_util 4.7
Created Thu May 25 12:16:13 2017
dG = -15.40 [Initially -15.40] 17May25-12-16-12G
A
C
C
C
A
C
U
U
U
U
G
A
G
U
U
AG
U
U
A
G
A
A
G
CA
G
U
UA A
U
U
A
G
U
A
A
C
U
G
A
U
A
A
C
U
C
A
A
G
A
G C CA
UCCC
GA
G
G
U
C5’ 3’
10
20
30
40
50
60
Output of sir_graph (©)mfold_util 4.7
Created Thu May 25 12:16:13 2017
dG = -15.40 [Initially -15.40] 17May25-12-16-12G
A
C
C
C
A
C
U
U
U
U
G
A
G
U
U
AG
U
U
A
G
A
A
G
CA
G
U
UA A
U
U
A
G
U
A
A
C
U
G
A
U
A
A
C
U
C
A
A
G
A
G C CA
UCCC
GA
G
G
U
C5’ 3’
10
20
30
40
50
60
Output of sir_graph (©)mfold_util 4.7
Created Thu May 25 12:16:13 2017
dG = -15.40 [Initially -15.40] 17May25-12-16-12G
A
C
C
C
A
C
U
U
U
U
G
A
G
U
U
AG
U
U
A
G
A
A
G
CA
G
U
UA A
U
U
A
G
U
A
A
C
U
G
A
U
A
A
C
U
C
A
A
G
A
G C CA
UCCC
GA
G
G
U
C5’ 3’
10
20
30
40
50
60
Structural Motif A
Structural Motif B
Identical
Structure
Identical
Structure

78
to the suggested sequence. Folding of the conserved helices in Mfold can proceed by copying
and pasting helical sequences into the RNA folding form. On the RNA folding form find the
STRUCTURE DRAW MODE and select ‘Untangle with loop fix’. Often several structures will
be presented by Mfold for the same sequence, the structure with the most negative delta free
energy has the highest likelihood of forming. Folded structures may not always reflect the actual
helix that forms, and some sequences require the forcing of base pairs or preventing of bases
from pairing to produce a correct structure. This requires a variable amount of trial and error,
working with the structure in Mfold, and often result from knowing the typical helical motifs for
the given helix being folded. For example, the D1-D1’ helix always has a basal unilateral clamp,
almost always opening to the right of the helix, just above the basal clamp.
Occasionally, there is a unilateral bulge just opposite the right basal unilateral bulge, with
one to three unpaired nucleotides, which may interfere with the structure of the right basal
unilateral bulge, opening the helix up so that there is a bilateral bulge just above the basal clamp
or forming and secondary helix extending from within the right basal unilateral bulge. Knowing
that this structure is not typically correct and forcing a single base pair to form, corrects the
entire helix structure (Figure 3.13). Folded structures should be presented in manuscripts in a
standardized form. While some authors have access to expensive programs such as adobe
illustrator, to present structures, many do not. Thus, downloading secondary structures in a
picture format directly from Mfold website should also be considered a reasonable representation
for publishing.
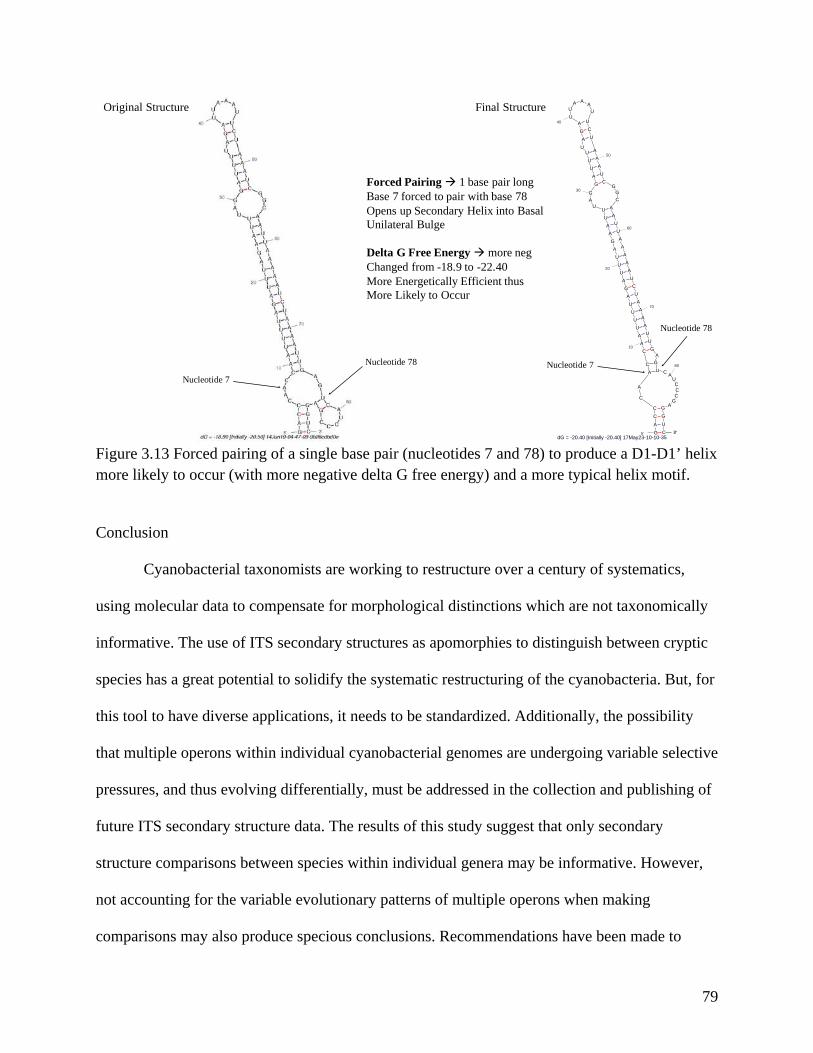
79
Figure 3.13 Forced pairing of a single base pair (nucleotides 7 and 78) to produce a D1-D1’ helix more likely to occur (with more negative delta G free energy) and a more typical helix motif.
Conclusion
Cyanobacterial taxonomists are working to restructure over a century of systematics,
using molecular data to compensate for morphological distinctions which are not taxonomically
informative. The use of ITS secondary structures as apomorphies to distinguish between cryptic
species has a great potential to solidify the systematic restructuring of the cyanobacteria. But, for
this tool to have diverse applications, it needs to be standardized. Additionally, the possibility
that multiple operons within individual cyanobacterial genomes are undergoing variable selective
pressures, and thus evolving differentially, must be addressed in the collection and publishing of
future ITS secondary structure data. The results of this study suggest that only secondary
structure comparisons between species within individual genera may be informative. However,
not accounting for the variable evolutionary patterns of multiple operons when making
comparisons may also produce specious conclusions. Recommendations have been made to
Output of sir_graph (©)mfold_util 4.7
Created Tue May 23 10:10:36 2017
dG = -20.40 [Initially -20.40] 17May23-10-10-35G
A
C
C
C
A
A
C
C
A
A
U
U
U
U
A
G
A
U
U
U
A
G
A
A
U
UU
A
G
G
A
U
U
UU
A
G
A
U
UA A
A
U
U
C
U
A
A
A
U
CG
G
C
A
A
U
U
A
A
A
A
A
U
C
U
A
A
A
A
U
U
G
A
G
U CA
UCCC
GA
G
G
U
C5’ 3’
10
20
30
40
50
60
70
80
3’
Original Structure Final Structure
Forced Pairing à 1 base pair longBase 7 forced to pair with base 78Opens up Secondary Helix into Basal Unilateral Bulge
Delta G Free Energy à more negChanged from -18.9 to -22.40More Energetically Efficient thus More Likely to Occur
Nucleotide 7Nucleotide 7Nucleotide 78
Nucleotide 78

80
standardize the process of producing secondary structures in the future so that both of these
issues may be addressed. Further study is required to demonstrate to what extent ITS secondary
structures statistically correlate with taxonomy.
Acknowledgements
We would like to thank Dr. Matt Gilg from the Department of Biology, at the University of
North Florida for all of his expertise in evolutionary theory.

81
Conclusions
The goal of this research was to identify novel cyanobacterial taxa while clarifying
enigmatic evolutionary relationships between cyanobacterial lineages. Four novel taxa were
identified using a total evidence approach. Ecological, molecular, and morphological differences
were used in concert to identify Calothrix dumas, Brasilonema lichenoides, Brasilonema
geniculosus, and Chroococcidiopsis lichenoides sp. nov. Cyanobacterial systematics is
undergoing a revolution owing to the advent of molecular data. Because much of traditional
cyanobacterial morphology may not be informative, often the burden for identifying novel taxa
rests on the molecular data. ITS secondary structures were also used to identify novel taxa
because the 16S gene sequence, which is the standard for bacterial phylogenetic studies, lacks
resolution at the species level in cyanobacteria. These secondary structures, however, are not
analyzed in a standard fashion. Many genera within a family may produce similar secondary
structures for the same domain, and it is important that ITS structures are only compared within a
genus. Additionally, ITS domains that include two tRNA genes may have variable evolutionary
histories from those without tRNA genes present. Future phylogenetic studies should compare
structures of homologous domains. Further, it is imperative to clone samples in order to recover
all possible operonic variants and compare only homologous (vs. analogous) structures.
Recommendations have been made in this work to standardize folding procedures, data labelling,
and the structural vocabulary used in analysis for ITS comparisons in the future. Further study is
required to calculate quantifiably the relationship between ITS secondary structures and
taxonomy.

82
References Adams, D.G. 2000. Cyanobacterial phylogeny and development: Questions and challenges. In Brun, Y.V. & Shimkets, L.J. [Eds.] Prokaryotic Development, ASM Press, Washington DC, pp. 51–81. Adhikary, S.P., N. Keshari C. Urzì, and R. De Phillips. 2015. Cyanobacteria in biofilms on stone temples of Bhubaneswar, Eastern India. Algol. Stud. 147: 67-93. Aguiar, M., Fiore, F.M., Franco, M.W., Ventrella, M.C., Lorenzi, A.S., Vanetti, C.A. & Alfenas, A.C. 2008. A novel epiphytic cyanobacterial species from the genus Brasilonema causing damage to Eucalyptus leaves. J. Phycol. 44:1322-1334. Alvarenga, D.O., Rigonato, J., Branco, L.H.Z., Melo, I.S., and Fiore, M.F. 2016. Phyllonema aviceniicola gen. nov., sp. nov. and Foliisarcina bertiogensis gen. nov., sp. nov., epiphyllic cyanobacteria associated with Avicennia schaueriana leaves. Int. J. Syst. Evol. Microbiol. 66: 689–700. Anagnostidis K. & Komárek J. 1985. Modern approach to the classification system of the cyanophytes 1: Introduction. Algol. Stud. 38/39: 291–302. Anagnostidis K. & Komárek J. 1988. Modern approach to the classification system of the cyanophytes 2: Oscillatoriales. Algol. Stud. 50/53: 327–472. Anagnostidis K. & Komárek J. 1990. Modern approach to the classification system of the cyanophytes 3: Stigonematales. Algol. Stud. 86: 1–74. Becerra-Absalón, I., Rodarte B., Osorio, K., Alba-Lois, L., Segal-Kischinevzky, C. & Montejano G. 2013. A new species of Brasilonema (Scytonemataceae, Cyanoprokaryota) from Tolantongo, Hidalgo, Central Mexico. Fottea 13:25-38. Bellezza, S., Paradossi, G., De Philippis, R. & Albertano, P. (2003) Leptolyngbya strains from Roman hypogea: cytochemical and physico-chemical characterization of exopolysaccharides. J. Appl. Phycol. 15: 193–200. Berrendero, G.E., Johansen, J.R., Kaštovský, J., Bohunická, M. & Čapková, K. (2016) Macrochaete gen. nov. (Nostocales, Cyanobacteria), a taxon morphologically and molecularly distinct from Calothrix. J. Phycol. 52: 638-55. Bjelland, T., Grube, M., Hoem, S., Jorgensen, S.L., Daae, F.L., Thorseth, I.H. & Øvreås, L. 2011. Microbial metacommunities in the lichen-rock habitat. Env. Microbiol. Rep. 3:434-4422. Bornet E. & Flahault C. 1886–1888. Revision des Nostocacées hétérocystées. Annales des Sciences Naturelles; Botanique 7 Ser., 3:323–381, 4: 343–373, 5: 51–129, 7: 177–262.

83
Bourrelly, P. 1970. Les Algues D’eau Douce. Initiation à la Systématique. Tome III: Les Algues bleues et rouges, Les Eugléniens, Peridiniens et Cryptomonadines. Paris VI: Boubée & Cie. 512 p. Boyer, S. L., Flechtner, V. R., Johansen, J. R. 2001. Is the 16S-23S rRNA Internal Transcribed Spacer region a good tool for use in molecular systematics and population genetics? A case study in cyanobacteria. Mol. Biol. Evol. 18:1057-1069. Büdel, B. & Hennsen, A. 1983. Chroococcidiopsis (Cyanophyceae), a phycobiont in the lichen family Lichinaceae. Phycologia 22:367-375. Buch, B., Martins, M.D. & Branco, L.H.Z. (2017) A widespread cyanobacterium supported by polyphasic approach: proposition of Koinonema pervagatum gen. & sp. nov. (Oscillatoriales). J. Phycol. 53: 1097-1105. Carter, N.E.A. and Viles, H.A. 2003. Experimental investigations into the interactions between moisture, rick surface temperatures and an epilithic lichen cover in the bioprotection of limestone. Build. & Env. 8: 1225-1234. Casamatta, D.A., R.G. Verb, J.R. Beaver & M.L. Vis. 2002. An investigation of some of the cryptobiotic (algal/cyanobacterial and protozoan) sandstone cliff communities from Southeast Ohio. Int. J. Pl. Sci. 163: 837-845. Casamatta, D.A., J.R. Johansen, M.L. Vis & S.T. Broadwater. 2005. Molecular and morphological characterization of ten polar and near-polar strains within the Oscillatoriales (Cyanobacteria). J. Phycol. 41:421-438. Casamatta, D.A., Gomez, S.R. & Johansen, J.R. 2006. Rexia erecta gen. et sp. nov. and Capsosira lowei sp. nov., two newly described cyanobacterial taxa from the Great Smokey Mountains National Park (USA). Hydrobiologia 561:13-26. Casamatta, D.A., Stanić, D., Gantar, M., & Richardson, L.L. 2012. Characterization of Roseofilum reptotaenium (Oscillatoriales, Cyanobacteria) gen. et sp. nov. isolated from Caribbean black band disease. Phycologia, 51:489-499. Case, R. J., Boucher, Y., Dahllöf, I., Holmström, C., Doolittle, W. F., & Kjelleberg, S. 2007. Use of 16S rRNA and rpoB genes as molecular markers for microbial ecology studies. Appl. Environ. Microbiol. 73:278-288. Castenholz R. W. 2001. Phylum BX. Cyanobacteria. In: Boone D. R. & Castenholz R. W. (eds), Bergey’s manual of systematic bacteriology, p. 473–599, Springer, New York. Chua, J.P.S., Wallace, E.J.S., Yardley, J.A., Duncan, E.J., Dearden, P.K. & Summerfield, T.C. 2012. Gene expression indicates a zone of heterocyst differentiation with the thallus of the cyanolichen Pseudocyphellaria crocata. New Phytol. 196:862-872.

84
Cohen, Z., Margheri, M. C., Tomaselli, L. 1995. Chemotaxonomy of cyanobacteria. Phytochemistry 40:1155-1158. Crispim, C.A. & Gaylarde, C.C. 2005. Cyanobacteria and biodeterioration of Cultural Heritage: A Review. Microbial Ecol. 49:1-9. Cumbers, J. & Rothschild, L.J. 2014. Salt tolerance and polyphyly in the cyanobacterium Chroococcidiopsis (Pleurocapsales). J. Phycol. 50:472–482. Cutler N., Oliver A., Viles H. & Whiteley A. 2012. Non-destructive sampling of rock-dwelling microbial communities using sterile adhesive tape. J. Microbiol. Meth. 91:391-398. Dal Grande, F., Alors, D., Divakar, P.K., Bálint, M., Crespo, A. & Schmitt, I. 2014. Insights into intrathalline genetic diversity of the cosmopolitan lichen symbiotic green alga Trebouxia decolorans Ahmadjian using microsatellite markers. Mol. Phyl. Evol. 72:54-60. Das, J., Mukherjee, S., Mitra, A. and Bhattacharyya, D. 2006. Non-canonical base pairs and higher order structures in nucleic acids: crystal structure database analysis. J. Biomol. Struct. Dynam. 24:149-161. de los Ríos, A., Cámara, B., del Cura, M.Á.G., Rico, V.J., Galván, V. and Ascaso, C., 2009. Deteriorating effects of lichen and microbial colonization of carbonate building rocks in the Romanesque churches of Segovia (Spain). Sci. Tot. Environ., 407:1123-1134. Dojani, S., Kauff, F., Weber, B., and Büdel, B. 2014. Genotypic and phenotypic diversity of cyanobacteria in biological soil crusts of the Succulent Karoo and Nama Karoo of Southern Africa. Microb. Ecolol. 67: 286-301. Drouet F. & Daily W. A. 1956. Revision of the coccoid Myxophyceae. Butler Univ. Bot. Stud. 12: 1–218. Drouet F. 1973. Revision of the Nostocaceae with cylindrical trichomes. Hafner Press, New York. Drouet F. 1978. Revision of the Nostocaceae with constricted trichomes. Beih. Nova Hedwig. 57: 1–258. Drouet F. 1981. Revision of the Stigonemataceae with a summary of the classification of the blue-green algae. Beih. Nova Hedwig. 66: 1–221. Dvořák, P., Hindák, F., Hašler, P., Hindáková, A., & Poulíčková, A. 2014. Morphological and molecular studies of Neosynechococcus sphagnicola, gen. et sp. nov. (Cyanobacteria, Synechococcales). Phytotaxa 170:24-34.

85
Dvořák, P., Jahodářová, E., Hašler, P., Gusev, E. & Poulíčková, A. 2015 A new tropical cyanobacterium Pinocchia polymorpha gen. et sp. nov. derived from the genus Pseudanabaena. Fottea 15:113-120. Dvořák, P., Poulíčková, A., Hašler, P., Belli, M., Casamatta, D.A. & Papini, A. 2015b. Species concepts and speciation factors in cyanobacteria, with connection to the problems of diversity and classification. Biodiv. Conserv. 24:739-757. Dvořák, P., Hašler, P., Pitelková, P., Tabáková, P., Casamatta, D.A. & Poulíčková, A. 2017. A new cyanobacterium from the Everglades, Florida – Chamaethrix gen. nov. Fottea 17:269-276. Engene, N., & Gerwick, W. H. 2011. Intra-genomic 16S gene heterogeneity in cyanobacterial genomes. Fottea 1:17-24. Engene, N., Tronholm, A., Salvador-Reyes, L. A., Luesch, H., & Paul, V. J. 2015. Caldora penicillata gen. nov., comb. nov. (Cyanobacteria), a pantropical marine species with biomedical revelence. J. Phycol. 51:670-681. Fiore, M.F., Sant’Anna, C.L., Azevedo M.T., Komárek, J., Kăstovský, J., Sulek, J. & Lorenzi, A.S. 2007. The cyanobacterial genus Brasilonema, gen. nov., a molecular and phenotypic evaluation. J. Phycol. 43:789-798. Flechtner, V.R., Boyer, S.L., Johansen, J.R. & DeNoble, M.L. 2002. Spirirestis rafaelensis gen. et sp. nov. (Cyanophyceae), a new cyanobacterial genus from arid soils. Nova Hedwig. 74:1-24. Frémy P. 1929. Les Nostocacées de la Normandie. Notices mémoires at documents publiés par la Société d’agriculture d’archéologie et d’histoire naturelle du départment de la Manch 41: 197–228. Friedel, T. & Budel, B. 1996. Photobionts. In: T.H. Nash III [Ed.], Lichen Biology, Cambridge University Press, New York, pp. 9-26. Gaylarde, C.C. and Morton, L.H.G. 1999. Deteriogenic biofilms on buildings and their control: a review. Biofouling 14:59-74. Geitler L. 1925. Cyanophyceae. In: Pascher A. (ed.), Süswasserflora 12, p. 481, Gustav Fischer Verl., Jena. Geitler L. 1932. Cyanophyceae. In: Rabenhorst’s Kryptogamen Flora von Deutschland, Vol. 14, p. 1196, Akad. Verlagsges., Leipzig. Geitler L. 1942. Schizophyta (Klasse Schizophyceae). In: Engler A. & Prantl K. (eds), Natürliche Pflanzenfamilien 1b: 1–232, Duncker & Humblot, Berlin.

86
Genuário, D.B., Vaz, M.G.M.V., Hentschke, G.S., Sant’Anna, C.L. & Fiore, M.F. 2015. Halotia gen. nov., a phylogenetically and physiologicaly coherent cyanobacterial genus isolated from marine coastal environments. Int. J. Syst. Evol. Microbiol. 65:663-675. Gómez, E.B., Johansen, J.R., Kaštovsky, Bohunická, M., Čapková. 2016. Macrochaete gen. nov. (Nostocales, Cynobacteria), a taxon morphologically and molecularly distinct from Calothrix. J. Phycol. 52: 638-655. Gomont, M. 1890. Essai de classification des Nostocacees homocystees. Jour. de Bot. 4(20): 349-357. Gomont, M. 1892. Monographie des Oscillariees (Nostocacees homocystees). Ann. Sci. Nat. VII. Bot. 15: 265-368, 16: 91-264 Gordon, T.R. & Martyn, R.D. 1997. The evolutionary biology of Fusarium oxysporum. Ann. Rev. Phytopath. 35:111-128. Goris, J., Konstantinidis, K.T., Klappenbach, J.A., Coenye, T., Vandamme, P., & Tiedje, J.M. 2007. DNA-DNA hybridization values and their relationship to whole genome sequence similarities. Int. J Syst. Evol. Microbiol. 57:81-91. Grube, M. & Berg, G. 2009. Microbial consortia of bacteria and fungi with focus on the lichen symbiosis. Fungal Biol. Rev. 23:72-85. Hauer, T., Bohunická, M., Johansen, J.R., Mareš, and Gómez, E.B. 2014 Reassessment of the cyanobacterial family Microchaetaceae and establishment of new families Tolypothrichaceae and Godleyaceae. J. Phycol. 50: 1089-1100. Henskens, F.L., Green, T.G. & Wilkins, A. 2012. Cyanolichens can have both cyanobacteria and green algae in a common layer as major contributors to photosynthesis. Ann. Bot. 110:555-563. Hentschke, G.S., Johansen, J.R., Pietrasiak, N., Fiore, M.F., Rigonato, J., Sant’Anna, C.L. & Komárek, J. (2016) Phylogenetic placement of Dapisostemon gen. nov. and Streptostemon, two tropical heterocytous genera (Cyanobacteria). Phytotaxa 245: 129-143. Hoffmann L. 2005. Nomenclature of Cyanophyta/Cyanobacteria: round table on the unification of the nomenclature under the Botanical and Bacteriological Codes. Algol. Stud. 117: 13–29. Holland, J. 1977. The Chemistry of the Atmosphere and Oceans. John Wiley & Sons, New York, 369 pp. Iteman I., Rippka R., de Marsac N. T. & Herdman M. 2000. Comparison of conserved structural and regulatory domains within divergent 16S rRNA-23S rRNA spacer sequences of cyanobacteria. Microbiology 146: 1275–1286.

87
Iteman I., Rippka R., de Marsac N. T. & Herdmann M. 2002. rDNA analyses of planktonic heterocystous cyanobacteria, including members of the genera Anabaenopsis and Cyanospira. – Microbiology 148: 481–496. Johansen, J.R. & Casamatta, D.A. 2005. Recognizing diversity through adoption of a new species paradigm. Algol. Stud. 117:71-93. Johansen J. R., Kováčik L., Casamatta D. A., Fučíková K. & Kaštovský J. 2011. Utility of 16S-23S ITS sequence and secondary structure for recognition of intrageneric and intergeneric limits within cyanobacterial taxa: Leptolyngbya corticola sp. nov. (Pseudanabaenaceae, Cyanobacteria). Nova Hedwig. 92: 283–302. Johansen J. R., Pietrasiak N., Osorio-Santos K., Bohunická M., Miscoe L., Kováčik L. & Martin M. P. 2013. Has the time come to name cryptic species of cyanobacteria? A case study in Oculatella. – In: Book of abstracts, 19th Symposium of the International Society for Cyanophyte Research, p. 15, Cleveland, Ohio. Johansen, J. R., Mares, J., Pietrasiak, N., Bohunická M., Zima Jr. J., Stenclova, L., Hauer, T. Highly divergent 16S rRNA sequences in ribosomal operons of Scytonema hyalinum (Cyanobacteria). PLOS One <https://doi.org/10.1371/journal.pone.0186393>. Kenyon, C.N., 1972. Fatty acid composition of unicellular strains of blue-green algae. J Bacteriol. 109(2), pp.827-834. Kenyon, C.N., Rippka, R. and Stanier, R.Y., 1972. Fatty acid composition and physiological properties of some filamentous blue-green algae. Archiv für Mikrobiol. 83:216-236. Kilgore, C.D., C.M. Sheil, D.A. Casamatta, and J.R. Johansen. 2018. Geitleria appalacianna: a novel cyanobacterium isolated from karst caves in the GSMNP. Fottea (In Press) Kim, M., Oh, H., Park, S., & Chun, J. 2014. Towards a taxonomic coherence between average nucleotide identity and 16S rRNA gene sequence similarity for species demarcation of prokaryotes. Int. J Syst. Evol. Microbiol. 64:346-351. Klappenbach J.A., Saxman P.R., Cole J.R., Schmidt T.M. 2001. rrndb: The ribosomal RNA operon copy number database. Nucl. Acid Res 29: 181–184. Komárek, J. Susswasserflora von Mitteleuropa 19/3: Cyanoprokaryota; Teil 3: Heterocytous genera. Berlin [etc.]: Springer, 2013. Komárek J., Zapomělová E., Šmarda J., Kopecký J., Rejmánková E., Woodhouse J., Neilan B. A. & Komárková J. 2013b. Polyphasic evaluation of Limnoraphis robusta, a water–bloom forming cyanobacterium from Lake Atitlán, Guatemala, with a description of Limnoraphis gen. nov. Fottea 13: 39–52.
88
Komárek, J., Kaštovský, J., Mareš, J. & Johansen, J. R. 2014. Taxonomic classification of cyanoprokaryotes (cyanobacterial genera) 2014, using a polyphasic approach. Preslia 86: 295-335. Komárek J. 2016. A polyphasic approach for the taxonomy of cyanobacteria: principles and applications. Eur. J. Phycol. 51:346-353. Konstantinidis, K.T., Ramette, A. and Tiedje, J.M., 2006. The bacterial species definition in the genomic era. Phil. Trans. Royal Soc. B: Biol. Sci., 361:1929-1940. Kumar, S., Stecher, G., and Tamura, K. 2016. MEGA7: Molecular Evolutionary Genetics Analysis version 7.0 for bigger datasets. Mol. Biol. Evol. 33:1870-1874. Lane, D.J. 1991. 16S/23S rRNA Sequencing. In: Stackebrandt, E. and Goodfellow, M. [Eds.], In: Nucleic Acid Techniques in Bacterial Systematic, John Wiley and Sons, New York, 115-175. Larsson, J., Nylander, J.A. & Bergman, B., 2011. Genome fluctuations in cyanobacteria reflect evolutionary, developmental and adaptive traits. BMC Evol. Biol., 11:187. Lawry, N. H., & Simon, R. D. 1982. The normal and induced occurrence of cyanophycin inclusion bodies in several blue-green algae. J. Phycol. 18:391-399. Lopez-Bautista, J., F. Rindi & D. Casamatta. 2007. The Systematics of Subaerial Algae, In: Seckbach, J. (ed.) Extremophilic Algae, Cyanobacteria and Non-Photosynthetic Protists: From Prokaryotes to Astrobiology, Series: Cellular Origin, Life in Extreme Habitats and Astrobiology Volume 11, Springer, pp. 601-617. Maddison, D.R., & Maddison, W.P. 2000. MacClade version 4: Analysis of phylogeny and character evolution. Sinauer Associates, Sunderland Massachusetts. Mares, Jan. 2017. Multilocus and SSU rRNA gene phylogenetic analyses of available cyanobacterial genomes, and their relation to the current taxonomic system. Hydrobiologia 20th IAC Symposium:1-16. McNamara, C.J. & Mitchell, R. 2005. Microbial deterioration of Historic Stone. Front. Ecol. Environ. 3:445-451. McNamara, C.J., Perry, T. D. & Bearce, K.A. 2006. Epilithic and endolithic bacterial communities in limestone from a Maya archaeological site. Microb. Ecol. 51:51-64. Miller, S. R., Purugganan, M. D., & Curtis, S. E. 2006. Molecular population genetics and phenotypic diversification of two populations of the thermophilic cyanobacterium Mastigocladus laminosus. Appl. Environ. Microbiol. 72:2793-2800.

89
Muggia, L., Vancurova, L., Ŝkaloud, P., Peksa, O., Wedin, M. & Grube, M. 2013. The symbiotic playground of lichen thalli – a highly flexible photobiont association in rock-inhabiting lichens. FEMS Microb. Ecol. 85:313-323. Murata, N., Wada, H., Gombos, Z. 1992. Modes of fatty-acid desaturation in Cyanobacteria. Pl. Cell Physiol. 33:933-941. Norris, T.B. & Castenholz, R.W. 2006. Endolithic photosynthetic communities within ancient and recent travertine deposits in Yellowstone National Park. FEMS Microbiol. Ecol. 57:470-483. Osorio-Santos, K., N. Pietrasiak, M. Bohunická, L.H. Miscoe, L. Kováčik, M.P. Martin & J.R. Johansen. 2014. Seven new species of Oculatella (Pseudanabaenales, Cyanobacteria): taxonomically recognizing cryptic diversification. Eur. J. Phycol. 49: 450–470. Otsuka S., Suda S., Shibata S., Oyaizu H., Matsumoto S. & Watanabe M. M. 2001. A proposal for the unification of five species of the cyanobacterial genus Microcystis Kützing ex Lemmermann 1907 under the rules of the Bacteriological Code. Int. J Syst. Evol. Microbiol. 51: 873–879. Pei, A. Y., Oberdorf, W. E., Nossa, C. W., Agarwal, A., Chokshi, P., Gerz, E. A., Jin, Z., Lee, P., Yang, L., Poles, M., Brown, S. M., Sotero, S., DeSantis, T., Brodie, E., Nelson, K., & Pei, Z. 2010. Diversity of 16S rRNA genes within individual prokaryotic genomes. Appl. Environ. Microbiol. 76:3886-3897. Peksa, O. & Škaloud, P. 2011. Do photobionts influence the ecology of lichens? A case study of environmental preferences in symbiotic green alga Asterochloris (Trebouxiophyceae). Mol. Ecol. 20:3936-3948. Pérez-Ortega, S., Ortiz-Álvarez, R., Allan Green, T.G. & de los Ríos, A. 2012. Lichen myco- and photobiont diversity and their relationships at the edge of life (McMurdo Dry Valleys, Antarctica). FEMS Microb. Ecol. 82:429-448. Perkerson, R.B. III, Johansen, J. R., Kovácik, L., Brand, J., Kas’tovsky’, J., Casamatta, D. A. 2011. A unique pseudoanabaenalean (Cyanobacteria) genus Nodosilinea gen. nov. based on morphological and molecular data. J. Phycol. 47:1397-1412. Rai, A.N. 1990. Cyanobacteria in symbiosis. Rai, A.N. [Ed.], In: Handbook of Symbiotic Cyanobacteria, CRC Press, Boca Raton, pp. 1-7. Rai, A.N. & Bergman, B. 2002. Cyanolichens: biology and environment. Proc. Royal Irish Acad. vol. 102B, no. 1, pp. 19-22. Řeháková, K., Johansen, J.R., Casamatta, D.A., Xuesong, L. & Vincent, J. 2007. Morphological and molecular characterization of selected desert soil cyanobacteria: three species new to science including Mojavia pulchra gen. et sp. nov. Phycologia 46:481-502.

90
Rikkinen, J. 2002. Lichen guilds share related cyanobacterial symbionts. Science 297:357-357. Rippka R., Deruelles J., Waterbury J. B., Herdman M. R. & Stanier R. Y. 1979. Generic assignments, strain histories, and properties of pure cultures of Cyanobacteria. J. Gen. Microbiol. 111: 1–61. Rippka, R., Castenholz, R.W., & Herdman, M. 2001. Subsection IV. Bergey's Manual of Systematics of Archaea and Bacteria. Rodarte, B., Becerra-Absalón, I., Montejano G., Osorio-Santos, K., Alba-Lois, L., León-Tejera, H. & Segal-Kischinevzky, C. 2014. Morphological and Molecular Characterization of Brasilonema roberti-lamii (Cyanophyceae, Nostocales, Scytonemataceae), from Central Mexico. Phytotaxa 164:255-264. Sanders, W.B. 2001. Lichens: the interface between mycology and plant morphology. Bioscience 51:1025-1035. Sant'Anna, C.L.; Azevedo, M.T.P.; Fiore, M.F.; Lorenzi, A.S.; Kaštovský, J. & Komárek, J. 2011. Subgeneric diversity of Brasilonema (Cyanobacteria, Scytonemataceae). Revista Brasil. Bot. 34: 51-62. Schirrmeister B. E., Antonelli A. & Bagheri H. C. 2011. The origin of multicellularity in cyanobacteria. BMC Evol. Biol. 11: 45. Schirrmeister, B. E., de Vos J. M., Antonelli, A., & Bagheri, H. C. 2013. Evolution of multicellularity coincided with increased diversification of cyanobacteria and the Great Oxygenation Event. Proc. Natl. Acad. Sci. USA 110:1791-1796. Schleifer, K. H., & Kandler, O. 1989. Phylogenetic relationships of bacteria, p.103-117. In (B. Fernholm, K. Bremer, and H. Jörnvall (Eds.), The hierarchy of life. Elsevier Science Publishers B. V., Amsterdam. Shalygin, S., Shalygina, R., Johansen, J. R., Petrasiak, N., Berrendero Gómez E., Bohunická M., Mares, J., Sheil, C. A. 2017. Cyanomargarita gen. nov. (Nostocales, Cyanobacteria): convergent evolution resulting in a cryptic genus. J. Phycol. 53:762-777. Sherwood, A.R., Carlile, A.L., Vaccarino, M.A. & Johansen, J.R. (2015) Characterization of Hawaiian freshwater and terrestrial cyanobacteria reveals high diversity and numerous putative endemics. Phycol. Res. 63: 85-92. Shih P. M., Wu D., Latifi A., Axen S. D., Fewer D. P., Talla E., Calteau A., Cai F., Tandeau de Marsac N., Rippka R., Herdman M., Sivonen K., Coursin T., Laurent T., Goodwin L., Nolan M., Davenport K. W., Han C. S., Rubin E. M., Eisen J. A., Woyke T., Gugger M. & Kerfeld C. A. 2013. Improving the coverage of the cyanobacterial phylum using diversity-driven genome sequencing. Proc. Natl. Acad. Sci. USA 110:1053–1058.

91
Siegesmund, M. A., Johansen, J. R., Karsten, U., Friedl, T. 2008. Coleofasciculus gen. nov. (Cyanobacteria): morphological and molecular criteria for revision of the genus Microcoleus Gomont. J. Phycol. 44:1572-1585. Singh, P., Singh, S. S., Aboal, M., & Mishra, A. K. 2014. Decoding cyanobacterial phylogeny and molecular evolution using an evonumeric approach. Protoplasma 252:519-535. Spribille, T., Tuovinen, V., Resl, P., Vanderpool, D., Wolinski, H., Aime, M.C., Schneider, K., Stabentheiner, E., Toome-Heller, M., Thor, G., Mayrhofer, H., Johannesson, H. & Mccutcheon, J.P. 2016. Basidiomycete yeasts in the cortex of ascomycete macrolichens. Science 353:488-492. Stackebrandt, E., & Goebel, B.M. 1994. Taxonomic note: a place for DNA-DNA reassociation and 16S rRNA sequence analysis in the present species definition in bacteriology. Int. J. Syst. Bacteriol. 44:846-849. Stackebrandt, E., Frederiksen, W., Garrity, G. M., Grimont, P. A. D., Kämpfer, P., Maiden, M. C. J., Nesme, X., Rosselló-Mora, R., Swings, J., Trüper, H. G., Vauterin, L., Ward, A. C., & Whitman, W. B. 2002. Int. J. Syst. Evol. Microbiol. 52:1043-1047. Staub, R. 1961. Ernährungsphysiologisch-autökologische Untersuchungen an Oscillatoria rubescens D. C. Schweiz. Z. Hydrol. 23:82-198. Stewart, F., & Cavanaugh, C. M. 2006. Intragenomic variation and evolution of the internal transcribed spacer of the rRNA operon in bacteria. J. Mol. Evol. 65:44-67. Strunecký, O., Bohunická, M., Johansen, J.R., Čapková, K., Raabová, L., Dvořák, P., Komárek, J. 2017. A revision of the genus Geitlerinema and a description of the genus Anagnostidinema gen. nov. (Oscillatoriophycidae, Cyanobacteria). Fottea 17:114-126. Sun, D., Jiang, X., Wu, Q. L., & Zhou, N. 2013. Intragenomic Heterogeneity of 16S rRNA gene couses overestimation of prokaryotic diversity. Appl. Environ. Microbiol. 79:5962-5969. Suradkar, A., Villanueva, C., Gaysina, L., Casamatta, D. A., Saraf, A., Dighe, G., Mergu, R., Singh, P. 2017. Nostoc Thermotolerans sp. nov., a soil dwelling species of Nostoc (Cyanobacteria). Int. J. Syst. Evol. Microbiol. 67:1296-1305. Thompson, J.D., Gibson, T.J., Plewniak, F., Jeanmougin, F., & Higgins, D.G. 1997. The CLUSTAL_X windows interface: flexible strategies for multiple sequence alignment aided by quality analysis tools. Nucl. Acids Res. 25:4876-4882. Tourova, T.P. 2003. Copy number of ribosomal operons in prokaryotes and its effect on phylogenetic analyses. Mikrobiologiya 72:437-452. Tschermak-Woess, E. 1988. The algal partner. Galun, M. [Ed.], in: CRC Handbook of Lichenology, vol. 1, CRC Press, Boca Raton, pp. 39-92.

92
Uher, B. (2008) Spatial distribution of cyanobacteria and algae from the tombstone in a historic cemetery in Bratislava, Slovakia. Fottea 9: 81–92. Vaccarino, M.A. & Johansen, J.R. 2012. Brasilonema angustatum sp. nov. (Nostocales), a new filamentous cyanobacterial species from the Hawaiian Islands. J. Phycol. 48:1178-1186. Vandamme, P., Pot, B., Gillis, M., DeVoas, P., Kersters, K., & Swings, J. 1996. Polyphasic Taxonomy, a consensus approach to bacterial systematics. Microbiol. Rev. 60(2):407-438. Větrovský, T., and Baldrian, P. 2013. Variability of the 16S rRNA gene in bacterial genomes and its consequences for bacterial community analyses. PLOS one 8:e57923. Villaneuva, C.D., P. Hašler, P. Dvořák, A. Poulíčková, & D.A. Casamatta. 2018. Brasilonema lichenoides sp. nov. and Chroococcidiopsis lichenoides sp. nov. (cyanobacteria): two novel cyanobacterial constituents isolated from a tripartite lichen of headstones. J. Phycol. 54:224-233. Wilmotte, A. & Herdman, M. 2001. Phylogenetic relationships among the cyanobacteria based on 16S rRNA sequences. Bergey’s Manual of Systematics of Archaea and Bacteria. Wilmotte, A., Laughinghouse IV, D., Capelli, C., Rippka, R., & Salmaso, N. 2017. Taxonomic identification of cyanobacteria by a polyphasic approach. In: Molecular tools for the detection and quantification of toxigenic cyanobacteria (eds. Kumayer, R., Sivonen, K., Wilmotte, A., Salmaso, N.) pp:79-134, John Wiley & Sons, City, USA. Woese, C.R. 1987. Bacterial Evolution. Microbiol. Rev. 51:221-271. Zuker, M. 2003. Mfold web server for nucleic acid folding and hybridization prediction. Nuc. Acids Res. 31 (13), 3406-3415, 2003.

93
Chelsea Villanueva Department of Biology, University of North Florida, 1 UNF Drive, Jacksonville, FL 32224 [email protected] EDUCATION 2018 M.S. Biology Candidate (expected) University of North Florida, Jacksonville, FL
Thesis: Novel microaerophytic cyanobacteria isolated from a symbiotic, epilithic consortia identified with polyphasic approach, using molecular and morphological markers. Advisor: Dale Casamatta, Ph.D.
2015 B.S. Biology University of North Florida, Jacksonville, FL Molecular and Cellular Biology and Biotechnology Minor: Anthropology 2011 A.A. General Education
Florida State College at Jacksonville, Jacksonville, FL PUBLICATIONS Peer-reviewed Villanueva C.D., Hásler P., Dvořák P., Poulíčková A., & Casamatta D.A. 2018. Brasilonema geniculosus
sp. nov. and Calothrix dumas sp. nov. (Cyanobacteria) two new taxa isolated from cemetery tombstones. Phytotaxa (In Review)
Villanueva, C.D., Hásler, P., Dvořák, P., Poulíčková, A., & Casamatta, D.A. 2018. Brasilonema
lichenoides sp. nov. and Chroococcidiopsis epilithica sp. nov. (Cyanobacteria): Two novel cyanobacterial constituents isolated from a tripartite lichen of marble headstones. J. Phycol. 54:224-233.
Suradkar, A., Villanueva, C., Gaysina, L.A., Casamatta, D.A., Saraf, A., Dighe, G., Mergu, R., & Singh,
P. 2017. Nostoc thermotolerans sp. nov., a soil dwelling species of Nostoc (Cyanobacteria) isolated from Madhya Pradesh, India. Int. J. Syst. Evol. Microbiol. 67:1296-1305.
In prep Casamatta D.A., Villanueva C.D., Johansen J.R. 2018. Reptodigitus chapmanii (Stigeonematales,
Cyanobacteria) gen. nov.: a unique Stigeonematalean (Cyanobacteria) genus based on a polyphasic approach. J. Phycol.
Villanueva, C.D., Johansen, J.R., Casamatta, D.A. 2018. Standardizing analysis of Internal Transcribed
Spacer (ITS) regions in multiple 16S-23S operons: a new evolutionary review of ITS paralog patterns in Cyanobacteria. Int. J. Syst. Evol. Microbiol.
Brown, A.O., Foss, A., Garvey, A.D., Gibson, Q.A., Villanueva, C.D., & Casamatta, D.A. 2018.
Komárekiella delphikthonos sp. nov. (Cyanobacteria): an epidermal cyanobacterium implicated in an estuarine bottlenose dolphin (Tursiops trancatus) fatality. Harmful Algae
94
Non-Peer-reviewed Villanueva, C.D. 2015. 5 Reasons why no one is talking about the revolution going on in evolutionary science. Gainsayer online magazine. <http://www.gainsayer.me/5-reasons-why-no-one-is-talking-about-the-revolution-going-on-in-evolutionary-science/> PROFESSIONAL EXPERIENCE Teaching Experience
Graduate Teaching Assistant – Department of Biology, UNF 2016 – 2017 • General Biology I – Laboratory • General Biology II – Laboratory
Supplemental Instruction Leader – Academic Center for Excellence, UNF 2015 – 2016
• General Biology I Distance Learning Coach – Department of Biology, UNF 2014 – 2016
• Biology in the Movies Guest Lecturer – Department of Anthropology, UNF 2014
• Anthropology of Death Research Experience Aeronautic sampling of cyanobacterial bioaerosols: Elucidating local cyanobacterial biogeography, and demonstrating microbial dispersal along the Atlantic coast of northeast FL and the St. Johns River basin (Jacksonville, USA) Qualitatively and quantitatively establishing that highly conserved ITS 16S-23S rRNA domain secondary structures are taxonomically informative. Exploratory study of lichen dominated microbial consortia growing on headstones for isolation and identification of novel microaerophytic cyanobacteria PRESENTATIONS Abstracts (as contributed posters/ oral presentations) 8. Villanueva, CD; Jeffrey R. Johansen; Dale A. Casamatta. 2017. Quantitatively establishing that highly conserved ITS 16S-23S rRNA domain secondary structures are taxonomically informative at the species level. In: PSA 2017 Annual Meeting – Monterey, CA 7. Villanueva, CD; Casamatta Dale A. 2017. Brasilonema lichenoides sp. nov. and Chroococcidiopsis epilithica sp. nov. (Cyanobacteria): Two novel species, one tripartite lichen. In: SOARS – University of North Florida, Jacksonville, FL 6. Villanueva, CD; Casamatta Dale A. 2016. Is everything everywhere? An investigation into the Global Distribution Theory with subaerial cyanobacteria. In: Southeastern Phycological Society Colloquy – Valdosta State University, Valdosta, GA

95
5. Villanueva, CD; Casamatta Dale A. 2016. Novel endolithic and epilithic microaerophytic cyanobacteria isolated from cemetery headstones in northeastern Florida, USA. In: 20th IAC Cyanophyte/Cyanobacteria Research Symposium – University of Innsbruck, Innsbruck, Austria 4. Villanueva, CD; Casamatta Dale A. 2016. Assessing the application of the Internal Transcribed Spacer (ITS) region secondary structures to cyanobacterial systematics. In: PSA Annual Meeting - John Carroll University, OH 3. Villanueva, CD; Casamatta Dale A. 2015. Tolypothrix sp. nov. And Chroococcidiopsis epilithica sp. nov. (Cyanobacteria): Two novel cyanobacterial constituents isolated from a tripartite lichen of marble headstones. In: PSA Annual Meeting – Drexel University, PA 2. Villanueva, CD; 2014. A novel Chroococcidiopsis species (cyanobacteria) isolated from an endolithic lichen inhabiting headstones in Jacksonville Beach, FL, USA. In: Southeastern Phycological Society Colloquy – UNC Wilmington, NC 1. Villanueva, CD. 2013. Cemetery Preservation. In: Department of Anthropology & Sociology Undergraduate Symposium – UNF, FL GRANTS Hoshaw Travel Grant $1000 - Phycological Society of America 2017 Summer Graduate Research Grant $1000 - Department of Biology, University of North Florida 2017 “Aeronautic sampling of cyanobacterial bioaerosols demonstrate microbial dispersal along the Atlantic coast of northeast FL and St. Johns River basin (Jacksonville, USA)” Coastal Biology Research grant $500 - COAS, University of North Florida 2017 “Exploratory study identifying novel symbiotic cyanobacteria from coastal habitats” Graduate Research Grant $500 - Department of Biology, University of North Florida 2016 Hoshaw Travel Grant $750 - Phycological Society of America 2016 Hoshaw Travel Grant $450 - Phycological Society of America 2015 Undergraduate Research Grant of $1000 - Department of Undergraduate Student Research, UNF 2014 “Typifying epilithic lichen communities” AWARDS Department of Anthropology & Sociology Undergraduate Student Symposium, UNF 2013 PROFESSIONAL AFFILIATIONS Phycological Society of America (Student) LANGUAGES Native: English Studied: Latin