moisture properties of self-levelling flooring compounds
TRANSCRIPT

LUND UNIVERSITY
PO Box 117221 00 Lund+46 46-222 00 00
Moisture properties of self-levelling flooring compounds. Part II. Sorption isotherms.
Anderberg, Anders; Wadsö, Lars
Published in:Nordic Concrete Research
2004
Link to publication
Citation for published version (APA):Anderberg, A., & Wadsö, L. (2004). Moisture properties of self-levelling flooring compounds. Part II. Sorptionisotherms. Nordic Concrete Research, Publication 32(2/2004), 16-30.
Total number of authors:2
General rightsUnless other specific re-use rights are stated the following general rights apply:Copyright and moral rights for the publications made accessible in the public portal are retained by the authorsand/or other copyright owners and it is a condition of accessing publications that users recognise and abide by thelegal requirements associated with these rights. • Users may download and print one copy of any publication from the public portal for the purpose of private studyor research. • You may not further distribute the material or use it for any profit-making activity or commercial gain • You may freely distribute the URL identifying the publication in the public portal
Read more about Creative commons licenses: https://creativecommons.org/licenses/Take down policyIf you believe that this document breaches copyright please contact us providing details, and we will removeaccess to the work immediately and investigate your claim.
Download date: 22. Mar. 2022
1
Moisture in Self-levelling Flooring Compounds. Part II. Sorption Isotherms
Anders Anderberg
M.Sc., Dr.-student
Div. Building Materials, Lund University
P.O. Box 118, 221 00 Lund, Sweden
E-mail: [email protected]
Lars Wadsö
Dr., Senior researcher
Div. Building Materials, Lund University
P.O. Box 118, 221 00 Lund, Sweden
E-mail: [email protected]
ABSTRACT
Moisture sorption in self-levelling flooring compounds was
investigated by using a sorption balance. Results are presented as
sorption isotherms. Influence of temperature, age, water to binder
ratio and carbonation are also presented. An increased temperature
and increased water to binder ratio gives lower moisture sorption.
Results from scanning curves indicate that, when changing
sorption mode, even a minute change in moisture content may
result in a significant change in relative humidity in the material.
Key words: sorption isotherm, water vapour, self-levelling
flooring compound, sorption balance.
1. INTRODUCTION
Recently, the connection between the indoor environment and occupants health has gained an
increased interest. Moisture has been shown to be an important factor as it promotes chemical
reactions and biological growth. This is further discussed in the first paper [1] of this series of
two papers dealing with moisture properties of self-levelling flooring compounds.
Moisture in materials has different properties and is of different interest depending on how hard
the water molecules are bound to the surface and the structure of the material. This is important
as not all water inside materials contribute to the processes that may influence the indoor
environment. The weakest bound water is here the most interesting as it supports biological
growth, transport of substances, etc. [2].
The strongest bound water in a cementitious material is chemically bound as reaction products
in the hardened cement paste and is part of the solid structure of the material. As this water is

2
strongly bound in the structure and does not leave the material under normal circumstances it is
of no interest concerning indoor environmental aspects.
Physically bound water stands in equilibrium with the water vapour in the surrounding
atmosphere. The amount of water in a material, excluding chemically bound water, is normally
given as a sorption isotherm, i.e., the relation between the moisture content (the mass of water
per mass of dry material) and the relative humidity (RH) at equilibrium.
Physically bound water can either be adsorbed to surfaces, absorbed in the structure of the
material or capillary condensed in pores. The first layer of adsorbed water is the strongest
bound, most immobile and remains non-frozen at -55 ºC [3]. This water behaves as part of the
solid and corresponds to the monolayer moisture content [2]. A monolayer can be seen as when
all of the dry matter is covered with one layer of water molecules [4]. Further added water is
more mobile. When sufficiently abundant part of this water may allow for chemical reactions
and microbial growth.
In porous materials water is bound not only due to adsorption, but also due to capillary
condensation. Water molecules then condense on concave water menisci. Pores with radii less
than a certain critical radius are then completely water filled. The curvature of the menisci
corresponds to a certain equilibrium RH. A smaller radius corresponds to a lower equilibrium
RH. When a material is in equilibrium with low RH, only small water menisci can exist, i.e.,
only small pores can be completely water filled. At higher RH, larger water menisci can exist
and pores with larger pore radii can thus be water filled. In a fine porous material, capillary
condensed water is the dominant contributor to transport processes, chemical reactions and
microbial growth.
A consequence of capillary condensation is sorption hysteresis [4], i.e., a material will contain
different amounts of water in equilibrium with a certain RH, depending on whether the material
is drying or taking up moisture, Fig. 1. A material taking up moisture never contains more water
than a drying material at the same RH.
As can be seen in Fig. 1, a sorption isotherm contains two main curves, one for desorption and
one for absorption. If a previously desorbing material starts to absorb moisture it follows a
scanning curve from the desorption isotherm towards the absorption isotherm and vice versa. A
result of this is that a small increase in moisture content may lead to a large increase in RH. The
consequence of this for moisture related processes is not fully known, but it is probable that RH
is not the only parameter describing the rate of chemical and biological processes [2] and that
moisture content also may be important, which has been seen for microbial growth on food
stuffs [5].

3
relative humidity
mo
istu
re c
on
ten
t
a
b
c
d
Figure 1 – Example of a sorption isotherm, where a is a desorption isotherm, b an absorption
isotherm, c a scanning curve from the absorption isotherm to the desorption isotherm and d a
scanning curve from the desorption isotherm to the absorption isotherm.
The sorption isotherm is, as the name indicates, only valid at a certain temperature. An increase
in temperature at constant moisture content results in an increase in RH [2, 6], opposite to the
behaviour of air, where an increase in temperature results in lower RH. For concrete, variations
of the sorption isotherm within normal temperature ranges are generally neglected, although
studies by for example Nilsson [7] show a temperature dependence of about 0-0.4 % RH per ºC
depending on moisture condition. An increase in temperature normally increases the rate of
chemical reactions [8].
Chemical degradation reactions are dependent on transport properties, as reactants have to come
in contact with each other. The critical RH limits at which processes start to take place are
somewhat diffuse. A practical value often used in Sweden for concrete slabs with bonded PVC-
flooring is 85 % RH. Generally an RH of at least 80 % is needed for biological growth, although
some species can grow at lower RH [2, 9].
This paper deals with physically bound water in the RH-range of 10-95 %. Measuring moisture
at higher RH levels than 98 %, requires other measurement techniques, see e.g. [10-13].
Measuring moisture down to 0 % RH gives incorrect values for self-levelling flooring
compounds (SLC) as chemically bound hydrate water from ettringite is partly non-reversibly
released. This has been observed during vacuum drying and drying over desiccants [14] and
drying at temperatures above 60 °C [15]. We have noted a significant decrease in mass when
drying specimens from 10 % to 0 % RH (not shown in this paper). This mass decrease
corresponded to more than 5 % moisture content, i.e., more than the total sorption capacity
between 10 % and 95 % RH.

4
2. MATERIALS AND METHOD
2.1 Materials
Sorption isotherms of three different types of commercial SLC were tested. The three tested
commercial products were based on Portland cement, calcium aluminate cement, calcium
sulphate and small amount of silica fume. The three tested product were:
A. Normal SLC with water to binder ratio of about 1.0. This product is generally used in
non-industrial constructions.
B. Rapid-drying SLC, which is similar to the above product, but is used with lower water to
binder ratio (about 0.7) to give the product a higher degree of self-desiccation. This
product is mainly used in renovation as it allows foot traffic in 1-2 hours and final
covering in 1 day.
C. SLC for industrial floors, also containing slag as a binder and a higher amount of
polymer to increase the abrasion resistance [16]. The water to binder ratio is about 0.6.
The final product allows medium heavy rolling equipment.
The products were mixed according to the manufacturers guidelines and left to hydrate, the first
24 hours in open air, approximately 20 ºC and 50 % RH, and after that in sealed glass jars.
Small amounts of water were added to the specimens in the jars to keep the RH at 100 %. Test
specimens were cut from the centre of cast cylinders to avoid edge effects and carbonation.
Specimens had hydrated for a minimum of 12 months prior to testing, if not otherwise stated.
The side lengths of the specimens were in the order of 4x4x3 mm3 with masses in the order of
100 mg. Carbonated specimens were exposed to atmospheric conditions for three months.
Validation of carbonation was made in parallel measurements (not on the tested specimens).
2.2 Method
A sorption balance (DVS 1000, Surface Measurements Systems, London, UK) was used to
determine sorption isotherms and scanning curves. This type of instrument has previously been
used in the study of sorption on various materials, for example, food stuffs [17], plant material
[18] and inorganic building materials [19]. With this instrument it is possible to measure
sorption when the RH is changed in steps and as ramps. A flow of dry nitrogen gas is divided
into two gas streams of which one is saturated with water vapour and the other left dry, see Fig.
2. By mixing different proportions of the gases, RH between 0 and 100 % can be generated,
although for practical reasons, the upper limit is 98 % RH.
5
RwS
Rd
dry
nitrogen
exhaust
balance purge gas
exhaust
sample
holder
reference
holder
balance
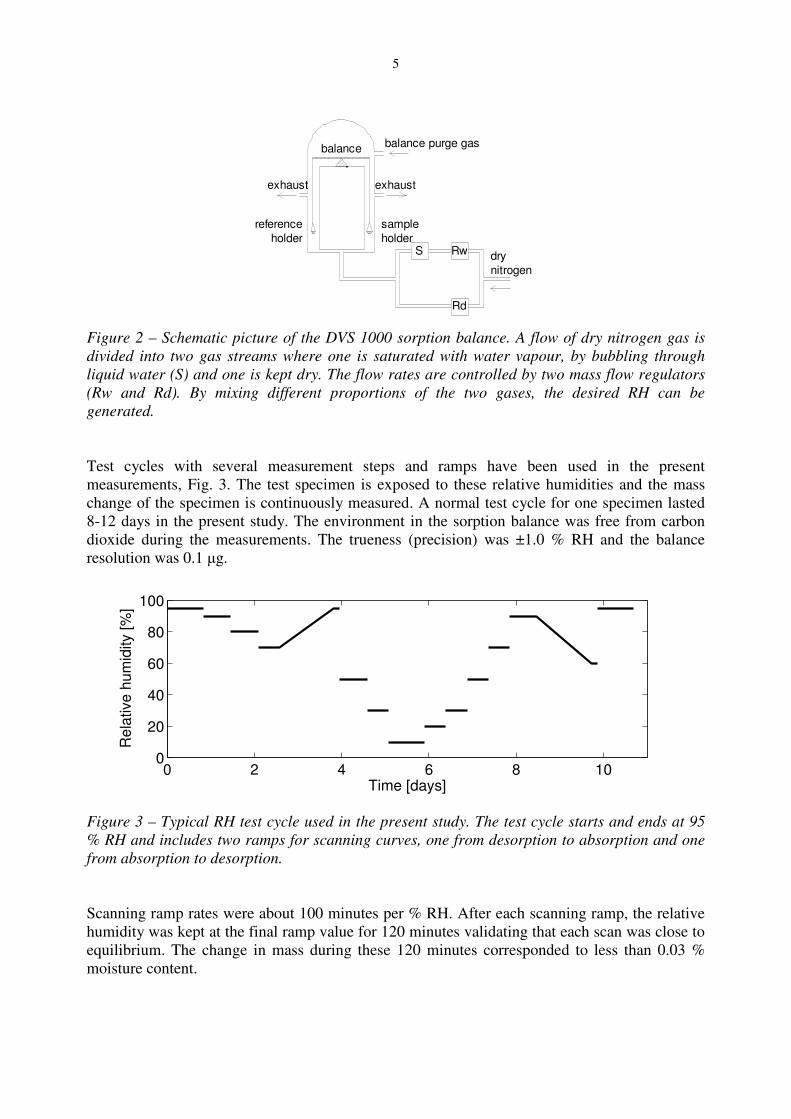
Figure 2 – Schematic picture of the DVS 1000 sorption balance. A flow of dry nitrogen gas is
divided into two gas streams where one is saturated with water vapour, by bubbling through
liquid water (S) and one is kept dry. The flow rates are controlled by two mass flow regulators
(Rw and Rd). By mixing different proportions of the two gases, the desired RH can be
generated.
Test cycles with several measurement steps and ramps have been used in the present
measurements, Fig. 3. The test specimen is exposed to these relative humidities and the mass
change of the specimen is continuously measured. A normal test cycle for one specimen lasted
8-12 days in the present study. The environment in the sorption balance was free from carbon
dioxide during the measurements. The trueness (precision) was ±1.0 % RH and the balance
resolution was 0.1 µg.
0 2 4 6 8 100
20
40
60
80
100
Re
lative
hu
mid
ity [
%]
Time [days]
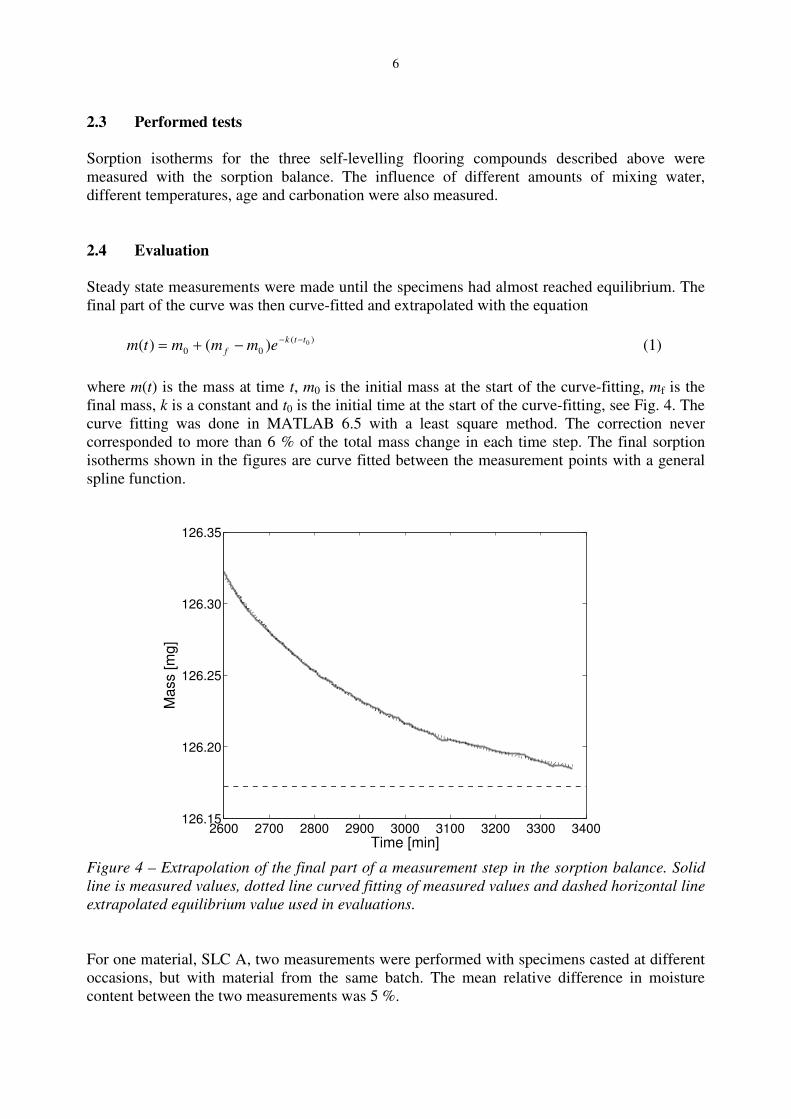
Figure 3 – Typical RH test cycle used in the present study. The test cycle starts and ends at 95
% RH and includes two ramps for scanning curves, one from desorption to absorption and one
from absorption to desorption.
Scanning ramp rates were about 100 minutes per % RH. After each scanning ramp, the relative
humidity was kept at the final ramp value for 120 minutes validating that each scan was close to
equilibrium. The change in mass during these 120 minutes corresponded to less than 0.03 %
moisture content.
6
2.3 Performed tests
Sorption isotherms for the three self-levelling flooring compounds described above were
measured with the sorption balance. The influence of different amounts of mixing water,
different temperatures, age and carbonation were also measured.
2.4 Evaluation
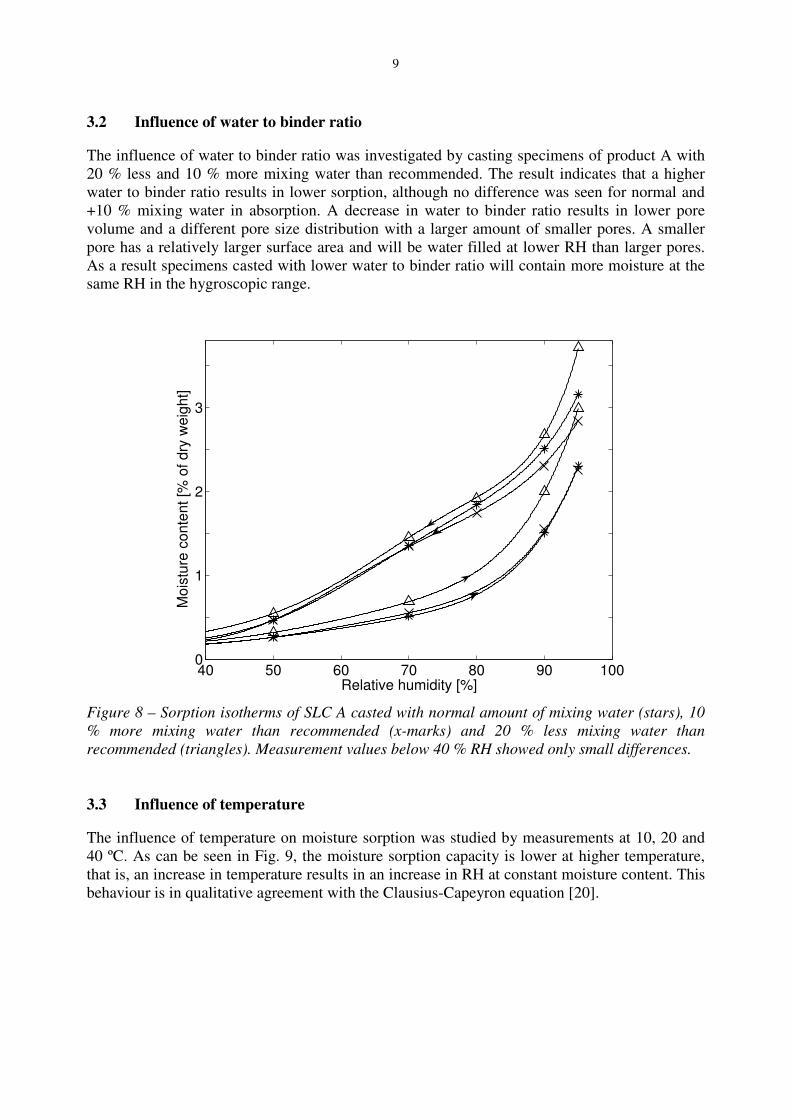
Steady state measurements were made until the specimens had almost reached equilibrium. The
final part of the curve was then curve-fitted and extrapolated with the equation
)(
000)()(
ttk
f emmmtm−−
−+= (1)
where m(t) is the mass at time t, m0 is the initial mass at the start of the curve-fitting, mf is the
final mass, k is a constant and t0 is the initial time at the start of the curve-fitting, see Fig. 4. The
curve fitting was done in MATLAB 6.5 with a least square method. The correction never
corresponded to more than 6 % of the total mass change in each time step. The final sorption
isotherms shown in the figures are curve fitted between the measurement points with a general
spline function.
2600 2700 2800 2900 3000 3100 3200 3300 3400126.15
126.20
126.25
126.30
126.35
Time [min]
Mass [m
g]
Figure 4 – Extrapolation of the final part of a measurement step in the sorption balance. Solid
line is measured values, dotted line curved fitting of measured values and dashed horizontal line
extrapolated equilibrium value used in evaluations.
For one material, SLC A, two measurements were performed with specimens casted at different
occasions, but with material from the same batch. The mean relative difference in moisture
content between the two measurements was 5 %.

7
3 RESULTS AND DISCUSSION
3.1 Sorption isotherms
Results of measurements of SLC A-C are presented in Figs. 5-7. Results are given as moisture
content (relative to mass at 10 % RH, here called dry weight) as a function of RH. SLC B has a
higher moisture sorption than SLC A. This may be an effect of the lower water to binder ratio of
SLC B (see subsection 3.2), but also due to the larger amount of paste in SLC B. The sorption
isotherm of SLC C for industrial floors has a different appearance than the sorption isotherms
for SLC A and B. This might be an effect of the slag content and the lower water to binder ratio.
10 20 30 40 50 60 70 80 90 1000
1
2
3
Relative humidity [%]
Mo
istu
re c
on
ten
t [%
of
dry
we
igh
t]
Figure 5 – Sorption isotherm of flooring compound A. Stars are measured values.

8
10 20 30 40 50 60 70 80 90 1000
1
2
3
4
5
Relative humidity [%]
Mo
istu
re c
on
ten
t [%
of
dry
we
igh
t]
Figure 6 – Sorption isotherm of flooring compound B. Stars are measured values.
10 20 30 40 50 60 70 80 90 1000
1
2
3
4
5
6
Relative humidity [%]
Mo
istu
re c
on
ten
t [%
of
dry
we
igh
t]
Figure 7 – Sorption isotherm of flooring compound C. Stars are measured values.
9
3.2 Influence of water to binder ratio
The influence of water to binder ratio was investigated by casting specimens of product A with
20 % less and 10 % more mixing water than recommended. The result indicates that a higher
water to binder ratio results in lower sorption, although no difference was seen for normal and
+10 % mixing water in absorption. A decrease in water to binder ratio results in lower pore
volume and a different pore size distribution with a larger amount of smaller pores. A smaller
pore has a relatively larger surface area and will be water filled at lower RH than larger pores.
As a result specimens casted with lower water to binder ratio will contain more moisture at the
same RH in the hygroscopic range.
40 50 60 70 80 90 1000
1
2
3
Relative humidity [%]
Mois
ture
conte
nt [%
of dry
weig
ht]
Figure 8 – Sorption isotherms of SLC A casted with normal amount of mixing water (stars), 10
% more mixing water than recommended (x-marks) and 20 % less mixing water than
recommended (triangles). Measurement values below 40 % RH showed only small differences.
3.3 Influence of temperature
The influence of temperature on moisture sorption was studied by measurements at 10, 20 and
40 ºC. As can be seen in Fig. 9, the moisture sorption capacity is lower at higher temperature,
that is, an increase in temperature results in an increase in RH at constant moisture content. This
behaviour is in qualitative agreement with the Clausius-Capeyron equation [20].

10
40 50 60 70 80 90 1000
1
2
3
Relative humidity [%]
Mo
istu
re c
on
ten
t [%
of
dry
we
igh
t]
Figure 9 – Sorption isotherms of SLC A at the following temperatures: 10 ºC (x-marks), 20 ºC
(triangles) and 40 ºC (stars). Measurement values below 40 % RH showed only small
differences.
3.4 Influence of age
The structure of the material gradually develops with time until hydration has stopped. As the
measurements of sorption isotherms in the sorption balance are relatively fast, it is a suitable
instrument for determining sorption isotherms on not completely hydrated materials. Sorption
isotherms for SLC A presented in Fig. 10 were determined at 1, 3 and 12 months of age. A
difference due to hydration can be seen, but the major part of the sorption isotherm was already
developed after one month. The RH in a young material will thus decrease, even if moisture
cannot leave the material. Note that specimens in this investigation hydrated at 100 % RH.

11
40 50 60 70 80 90 1000
1
2
3
Relative humidity [%]
Mois
ture
conte
nt [%
of dry
weig
ht]
Figure 10 – Sorption isotherm of SLC A at 1 month (stars), 3 months (triangles) and 12 months
(x-marks) of age. Measurement values below 40 % RH showed only small differences.
3.5 Scanning curves
Knowledge of scanning curves makes it possible to do more accurate predictions of RH in
materials changing sorption modes. As seen in Figs. 11 and 12 a small change in moisture
content results in a large change in RH. The consequences of this for chemical reactions and
biological growth is however somewhat unclear, as discussed in section 1.
The following scanning curves for SLC A, are presented in Figs. 11 and Fig. 12.
• absorption 70-90 % RH after desorption (Fig. 11)
• desorption 90-70 % RH after absorption (Fig. 11)
• absorption 60-95 % RH after desorption (Fig. 12)
• desorption 95-70 % RH after absorption (Fig. 12)
The results show, e.g., that a sample that has dried to 70 % RH and then absorbs moisture
corresponding to a moisture content increase of 0.1 %, will have a final RH of about 80 %. If a
calculation had been made with only one curve of the isotherm the final RH would have been
about 73 % RH, i.e., only slightly higher than 70 %. The scanning effect will therefore act as a
lever, giving large increases in RH for small increases in moisture content.

12
55 60 65 70 75 80 85 90 95 1000.6
0.8
1.0
1.2
1.4
1.6
1.8
2.0
2.2
Relative humidity [%]
Mois
ture
conte
nt [%
of dry
weig
ht]
Figure 11 – Scanning curve for SLC A, absorption from desorption mode (70 to 90 % RH) and
desorption from absorption mode (90 to 70 % RH).
55 60 65 70 75 80 85 90 95 1000.6
0.8
1.0
1.2
1.4
1.6
1.8
2.0
2.2
Relative humidity [%]
Mois
ture
conte
nt [%
of dry
weig
ht]
Figure 12 – Scanning curve for SLC A (three months old), absorption from desorption mode (60
to 95 % RH) and desorption from absorption mode (95 to 70 % RH)
13
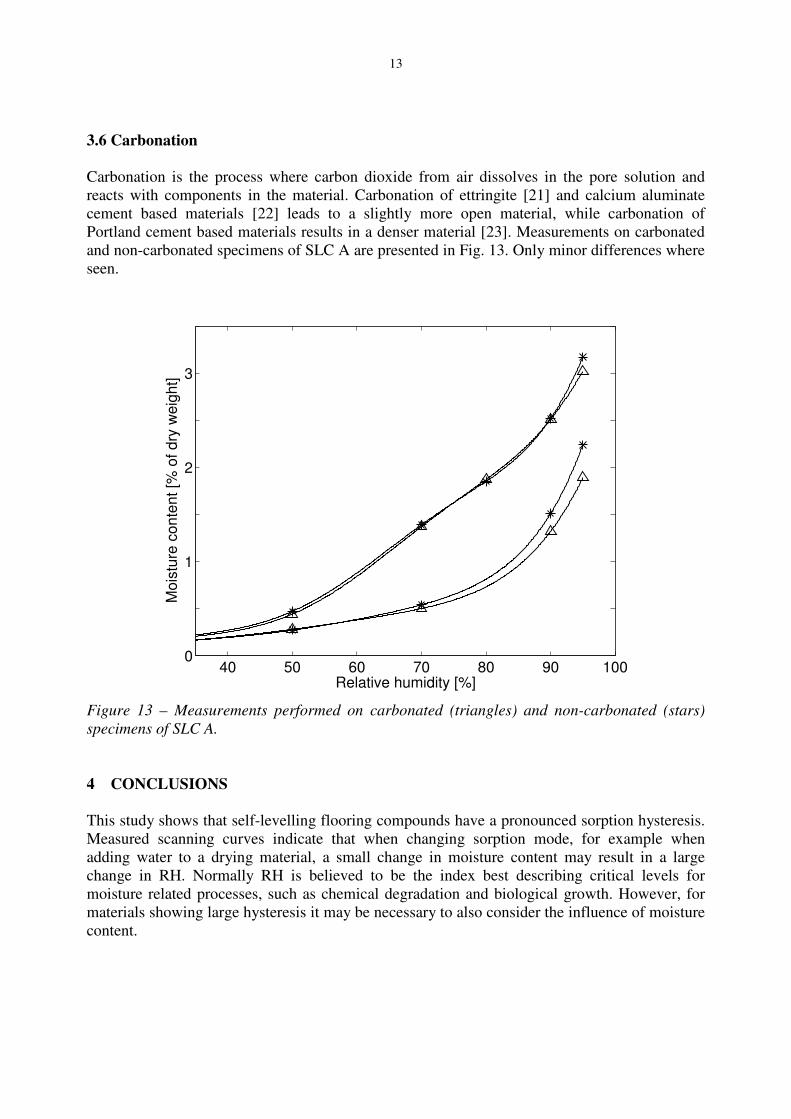
3.6 Carbonation
Carbonation is the process where carbon dioxide from air dissolves in the pore solution and
reacts with components in the material. Carbonation of ettringite [21] and calcium aluminate
cement based materials [22] leads to a slightly more open material, while carbonation of
Portland cement based materials results in a denser material [23]. Measurements on carbonated
and non-carbonated specimens of SLC A are presented in Fig. 13. Only minor differences where
seen.
40 50 60 70 80 90 1000
1
2
3
Relative humidity [%]
Mo
istu
re c
on
ten
t [%
of
dry
we
igh
t]
Figure 13 – Measurements performed on carbonated (triangles) and non-carbonated (stars)
specimens of SLC A.
4 CONCLUSIONS
This study shows that self-levelling flooring compounds have a pronounced sorption hysteresis.
Measured scanning curves indicate that when changing sorption mode, for example when
adding water to a drying material, a small change in moisture content may result in a large
change in RH. Normally RH is believed to be the index best describing critical levels for
moisture related processes, such as chemical degradation and biological growth. However, for
materials showing large hysteresis it may be necessary to also consider the influence of moisture
content.

14
REFERENCES
1. Anderberg, A. and Wadsö, L., "Moisture in Self-levelling Flooring Compounds. Part I
Diffusion Coefficients." Nordic Concrete Research, No. 32, 2004.
2. Fennema, O.R., "Water and Ice", in Food Chemistry, O.R. Fennema, Editor. 1985,
Marcel Dekker Inc. New York and Basel. pp. 23-67.
3. Bager, D.H. and Sellevold, E.J., "Ice formation in hardened cement paste, Part I - Room
temperature cured pastes with variable moisture contents." Cement and Concrete
Research, Vol. 16, 1986, pp. 709-720.
4. Adamson, A.W., "Physical Chemistry of Surfaces". 5th. John Wiley & Sons, Inc., 1990,
777 pp.
5. Labuza, T.P., Cassil, S., and Sinskey, A.J., "Stability of intermediate moisture foods. 2.
Microbiology." Journal of Food Science, Vol. 37, 1972, pp. 160-162.
6. Bažant, Z.P. and Najjar, L.J., "Nonlinear water diffusion in nonsaturated concrete."
Materials and Structures, Vol. 5No 25, 1972, pp. 3-20.
7. Nilsson, L.-O. "Temperature effects in relative humidity measurements on concrete -
some preliminary results". Proceedings, Building physics in the Nordic countries. Lund
1987. pp. 456-462.
8. Jones, L. and Atkins, P., "Chemistry Molecules Matter and Change". 4th edition. W. H.
Freeman and Company, New York, 2002., 998 pp.
9. Fog Nielsen, K., "Mould growth on building materials Secondary metabolites,
mycotoxines and biomarkers" The Mycology group, Biocentrum-DTU. Technical
University of Denmark: Lyngby. 2002, 80 pp.
10. Fagerlund, G., "Determination of pore size distribution by suction porosimetry."
Materials and Structures, Vol. Vol. 6, No 33, 1973, pp. 191-201.
11. Fagerlund, G., "Determination of pore size distribution from freezing-point depression."
Materials and Structures, Vol. Vol. 6, No 33, 1973, pp. 215-225.
12. Krus, M. and Kießl, K., "Determination of the moisture characteristics of porous
capillary active materials." Materials and Structures, Vol. Vol. 31, 1998, pp. 522-529.
13. Janz, M., "Techique for Measuring Moisture Storage capacity at High Moisture Levels."
Journal of Materials in Civil Engineering, Vol. September/October, 2001, pp. 364-370.
14. Zhang, L. and Glasser, F.P., "Critical examination of drying damage to cement pastes."
Advances in cement research, Vol. 122, 2000, pp. 79-88.
15. Shimida, Y. and Young, J.F., "Structual changes during thermal dehydration of
ettringit." Advances in cement research, Vol. 132, 2001, pp. 77-81.
16. Hoffman, A., "Effect of Redispersible Powders on the Properties of Self-Levelling
Compounds". Technical paper, Wacker Polymer Systems, 20 pp.
17. Hébrard, A., et al., "Hydration properties of durum wheat semolina: influence of particle
size and temperature." Powder Technology, Vol. 130, 2003, pp. 211-218.
18. Caro, Y., et al., "Plant Lipases: Biocatalyst Aqueous Environment in relation to Optimal
Catalytic Activity in Lipase-Catalyzed Synthesis Reactions." Biotechnology and
Bioengineering, Vol. 776, 2002, pp. 693-703.
19. Janz, M. and Johannesson, B.F., "Measurement of the Moisture Storage Capacity Using
Sorption Balance and Pressure Extractors." Thermal Envelope & Building Science, Vol.
244, 2001, pp. 316-334.
20. Atkins, P.W., "Physical Chemistry". Sixth edition. Oxford University Press, 1998, 1014
pp.
21. Scrivener, K.L. "Historical and Present Day Applications of Calcium Aluminate
Cements". Proceedings, International Conference on Calcium Aluminate Cements.
Edinburgh, Scotland 2001. pp. 3-23.

15
22. Gaztañaga, M.T., Gonñi, S., and Guerrero, A. "Accelerated Carbonation of Calcium
Aluminate Cement Paste". Proceedings, Calcium Aluminate Cements. Edinburgh,
Scotland 2001. pp. 349-358.
23. Taylor, H.F.W., "Cement Chemistry". 2nd edition. Thomas Telford, London, 1997, 437
pp.