moio: run-time monitoring for i/o protocol violations in
TRANSCRIPT

MoIO: Run-Time Monitoring for I/O Protocol Violations in Storage Device Drivers
Domenico Cotroneo, Luigi De Simone, Francesco Fucci, Roberto NatellaUniversita degli Studi di Napoli Federico II, Naples, Italy
{cotroneo, luigi.desimone, francesco.fucci, roberto.natella}@unina.it
Abstract—Bugs affecting storage device drivers include theso-called protocol violation bugs, which silently corrupt dataand commands exchanged with I/O devices. Protocol violationsare very difficult to prevent, since testing device driver isnotoriously difficult. To address them, we present a monitoringapproach for device drivers (MoIO) to detect I/O protocolviolations at run-time. The approach infers a model of theinteractions between the storage device driver, the OS kernel,and the hardware (the device driver protocol) by analyzingexecution traces. The model is then used as a reference fordetecting violations in production. The approach has beendesigned to have a low overhead and to overcome the lackof source code and protocol documentation. We show thatthe approach is feasible and effective by applying it on theSATA/AHCI storage device driver of the Linux kernel, and byperforming fault injection and long-running tests.
Keywords-Device Drivers; Storage failures; Run-time Moni-toring; Model Inference; Linux kernel
I. INTRODUCTION
It is well-known that device drivers are the most bug-prone part of the OS [1], [2], [3], and represent a criticalcomponent of every storage stack in IT systems. A large-scale study of failures from about 39,000 commercially-deployed storage systems [4], [5] showed that disk faultsare not anymore the dominant factor of storage failures,and that software faults in the I/O protocol stack accountfor a noticeable percentage (up to 10%). These failures arecaused by the so-called protocol violation bugs, i.e., bugsthat violate the protocol between the hardware and the driver,such as misinterpreting or incorrectly setting the device state,and exchanging incorrect data and commands with the I/Odevice. Ryzhyk et al. [6] analyzed about 500 bugs in Linuxdevice drivers, and found that a large proportion (38%)were indeed device protocol faults. Unfortunately, protocolviolations are very difficult to prevent, since testing devicedrivers is notoriously difficult [7], [8]. Moreover, they havea severe impact, since data corruptions can spread withoutbeing noticed until they impact on end-users, when it is toolate and the chances of data recovery are reduced.
In this paper, we address I/O protocol violation bugsthat affect storage device drivers, by proposing an approach(MoIO) for detecting I/O protocol violations at run-time.Failure detection is a fundamental prerequisite for adoptingfault-tolerance strategies: if a failing device driver is timelydetected, then it can be stopped before executing invalidoperations that could corrupt data; moreover, the system
administrator can be informed about the anomaly, thusincreasing the chances of protecting and recovering data.The detection of protocol violations is challenging, as itrequires a model of the driver protocol, which should serveas a reference of the correct behavior, for checking whetherthe actual behavior of the driver deviates from it. However,such a protocol model is difficult to get, since the sourcecode of the device driver may not be available, and thedevice control logic is often not accurately documented [6].
As discussed in this paper, we address the lack of areference model by developing a model inference technique,which automatically learns a protocol model from failure-free execution traces of the device driver. Then, the modelis translated into a lightweight kernel monitoring module,which is executed alongside the device driver in orderto detect I/O protocol violations. This monitor probes theinteractions among the storage device driver, the OS, andthe physical devices (e.g., reads/writes to I/O registers),and quickly raises an alarm once an anomalous interactionis detected. We applied the proposed monitoring approachon the SATA/AHCI device driver of the Linux kernel. Toevaluate the effectiveness of the approach, we conductedan extensive fault injection campaign, in which the monitorwas able to detect storage data corruptions. Moreover, wealso conducted long-running tests using a set of several I/O-bound workloads, showing that the I/O monitor is robustagainst false alarms and has a small performance overhead.
The paper is structured as follows. Section II gives anoverview of past studies on fault tolerance for device drivers.Section III discusses in depth the problem of I/O protocolviolations, and presents the proposed approach. Sections IVand V discuss the application of the approach on the Linuxkernel and experimental results. Section VI closes the paper.
II. RELATED WORK
Research on OS reliability has been mostly focusedon tolerating faulty device drivers. In particular, severalsoftware fault isolation techniques have been developed toprevent (either in hardware or in software) the propagationof drivers’ faults across OS components (e.g., by accessingand corrupting kernel memory), which may cause data lossand the crash of the whole system.
Nooks [9] ensures isolation by confining drivers into adomain, using the Memory Management Unit of the CPU.These domains share the same address space of other kernel
components, but different components have different accesspermissions to pages. In this way, a driver can read all pages,but it is allowed to write only a subset of them. The sameauthors [10] later proposed a technique to automaticallyrecover from transient drivers’ faults, by introducing ashadow driver that runs alongside a device driver: when adriver failure is detected, the shadow driver becomes activeand replies, on behalf of the faulty driver, to kernel requests,in order to guarantee availability. Subsequent studies furtherdeveloped these ideas by moving device drivers into user-space processes (thus, running them in unprivileged mode),such as the microdrivers approach [11], and the microkernelOS architecture (such as Minix3) [12]. Furthermore, theI/O Memory Management Unit has been adopted to isolatekernel data from faults that affect DMA transfers [13], [14].
It is important to note that software fault isolation preventsdevice drivers from access data of other OS components,but it does not prevent device drivers from corrupting thedata managed by them (e.g., memory and storage data of astorage device driver). Protecting the hardware device fromdriver’s faults is still an open problem. Guardrail [15] is oneof the few existing solutions, in which a hypervisor protectsthe hardware device from data races and memory accessfailures. More specific solutions for storage problems, suchas filesystem verifiers (e.g., fsck) [16], check the consistencyof filesystem metadata, but they may not be able to detectsilent data block corruptions, and can have a significantoverhead (and are only run on a periodical basis) [17].Detecting such corruptions would require end-to-end checkson data block contents’, for instance by storing checksumsalongside data, and verifying the checksum when retrievingdata [18]. Some studies have introduced this kind of checksbetween the filesystem and the device driver [19], [20].However, we note that the effectiveness of checksums islimited since data corruptions are detected only when suchdata is retrieved for reading, which may occur only after along time has elapsed since the corruption. To compensatefor this gap, in this paper we investigate an approach formonitoring the individual interactions between the devicedriver, the hardware device and the OS, and to timely detectincorrect interactions as soon as they take place.
III. THE RUN-TIME MONITORING APPROACH
We propose a run-time monitoring approach for detectingI/O protocol violations of storage device drivers. It monitorshow the storage device driver interacts with (i) the physicaldevice, to transmit I/O commands, and (ii) other softwarecomponents of the OS, to transfer I/O data from and to userapplications. The interactions follow a protocol that specifiesthe type and the order of interactions to accomplish I/Ooperations. Device driver bugs can lead to interactions thatviolate such a protocol: in the worst case, the device drivercan corrupt data on the physical device.
Filesystem
Applications
Block I/O manager
Bus management services
DMA management services
Generic kernel services
Device Driver
Disk controller
Device Interface
(DI)
Device Driver
Protocol (DDP)
OS kernel
Physical disk
Driver Programming
Interface (DPI)
Figure 1. Storage architecture.
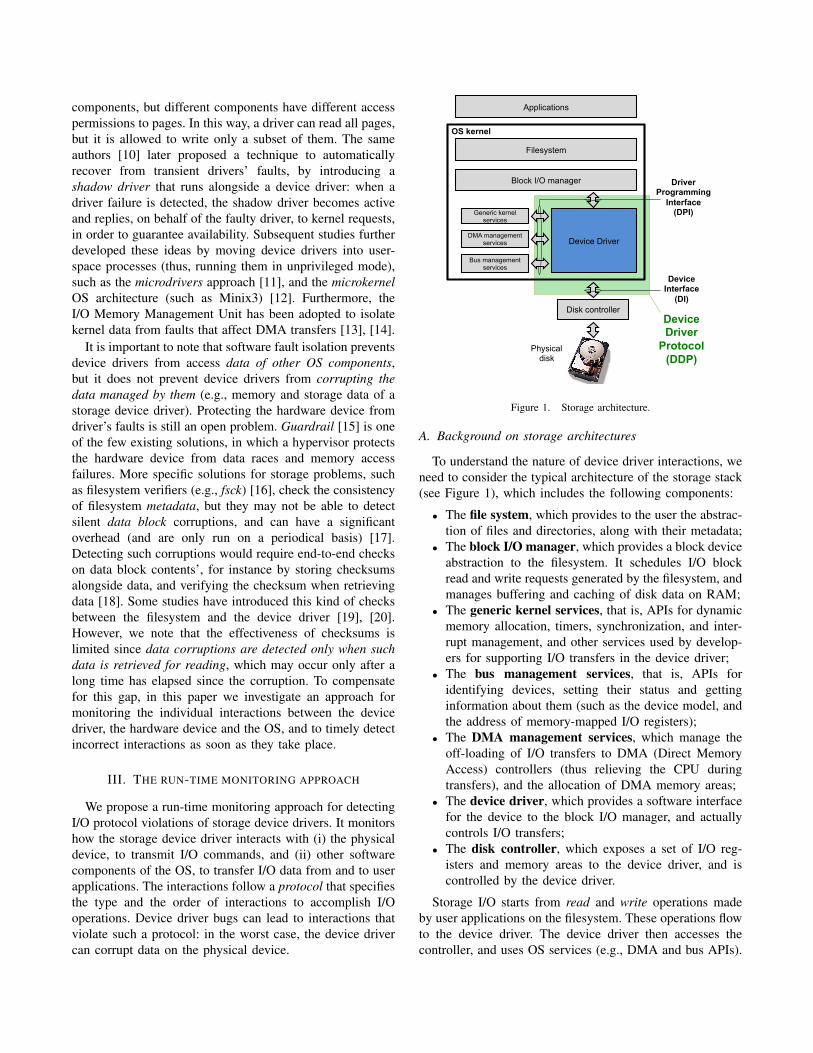
A. Background on storage architectures
To understand the nature of device driver interactions, weneed to consider the typical architecture of the storage stack(see Figure 1), which includes the following components:
• The file system, which provides to the user the abstrac-tion of files and directories, along with their metadata;
• The block I/O manager, which provides a block deviceabstraction to the filesystem. It schedules I/O blockread and write requests generated by the filesystem, andmanages buffering and caching of disk data on RAM;
• The generic kernel services, that is, APIs for dynamicmemory allocation, timers, synchronization, and inter-rupt management, and other services used by develop-ers for supporting I/O transfers in the device driver;
• The bus management services, that is, APIs foridentifying devices, setting their status and gettinginformation about them (such as the device model, andthe address of memory-mapped I/O registers);
• The DMA management services, which manage theoff-loading of I/O transfers to DMA (Direct MemoryAccess) controllers (thus relieving the CPU duringtransfers), and the allocation of DMA memory areas;
• The device driver, which provides a software interfacefor the device to the block I/O manager, and actuallycontrols I/O transfers;
• The disk controller, which exposes a set of I/O reg-isters and memory areas to the device driver, and iscontrolled by the device driver.
Storage I/O starts from read and write operations madeby user applications on the filesystem. These operations flowto the device driver. The device driver then accesses thecontroller, and uses OS services (e.g., DMA and bus APIs).

time
Device driver
Device Interface
(DI)
Driver Programming
Interface (DPI)
The device driver is set-up. DMA, bus, and kernel
resources are allocated
The kernel invokes the driver DPI to request a read/write
The driver accesses registers and memory of
the disk controller
The driver handles an IRQ, and finalizes the
I/O transfer
The I/O completion is notified to the OS
OS kernel
Disk controller
The device is initialized
KEY Invocation of DPI function Return from DPI function
Access to device registers and memory
IRQ
probing probing
Device interface probing (our monitoring approach)
Figure 2. Interactions between the device driver, the disk controller, and the OS kernel.
B. Background on the Device Driver Protocol (DDP)
All the interactions between the device driver and therest of the storage stack follow the Device Driver Pro-tocol (DDP). Overall, I/O operations require a series ofinteractions between the device driver, the OS and the diskcontroller. These interactions must follow strict rules forthe correct execution of I/O operations. The DDP involves:(i) software interfaces of the OS kernel (such as APIs forI/O transfers and for managing kernel resources); and (ii)hardware interfaces with the device (such as I/O control andstatus registers, and interrupts). The software and hardwareinterfaces are respectively referred to as the Driver Pro-gramming Interface (DPI) and the Device Interface (DI).For instance (Figure 2), when an user application requests anI/O write operation, the OS interacts with the device driverthrough the DPI, and the device driver reads and writes theDI to actually perform the I/O transfer on the disk.
The DDP can be quite complex, as it involves severallayers of the storage stack, both in hardware and in software(Figure 1). On the hardware side, the DDP involves the DI,which is specified by industry standards from organizationssuch as the ANSI, the ISO, and the IEC. These standardsdescribe several rules for communicating with the device,including the layout of registers and data structures, theformat of I/O commands, data, and status information, andthe temporal sequence at which this information should beread and written from/to the disk controller. On the softwareside, the interactions between the device driver and the OSare defined by OS developers in the form of DPI rules.For instance, such interactions can include the sequence ofAPIs to be called for configuring a DMA buffer, and forinitializing a data structure with I/O data or commands.
The goal of our run-time monitoring approach is to detectwhether the device driver deviates from the DDP. Detectingsuch violations requires a reference model of the DDP, whichshould accurately specify how the device driver is expectedto interact with the rest of the storage stack. However,obtaining an accurate model is a challenging problem. Onthe hardware side, as a matter of fact, industry standards in-tentionally leave out of scope some aspects of the disk devicespecifications, which vary across different manufacturers, oreven across different products of the same manufacturer(e.g., a specific disk controller can provide registers notrequired by an industry standard, to enhance performance orto provide more rich functionalities). In many cases, devicemanufacturers deviate from standard specifications, or mayadopt proprietary interfaces not compliant with any standard.On the software side, the DDP is also difficult to model,since the DPI rules between the device driver and the OSare documented in natural language, and in some cases suchdocumentation is lacking, outdated or not consistent withthe actual implementation. Even worse, the DPI itself oftenvaries across different OS versions.
C. Overview of the monitoring approach
Given the architecture and the issues discussed above, wedesign a monitoring approach by taking into account thefollowing requirements:
• No need for user-provided protocol specifications:Since the DDP has a cross-layer nature and its speci-fication is not easily available, we do not require theuser to provide a specification of the DDP.
• Applicable on binary-only device drivers: We do notassume the availability of the source code of the devicedriver, since the device driver may be only provided in

binary form, for instance by a device manufacturer thatwants to protect intellectual property.
• Low-overhead: Run-time monitoring should not causea significant loss of I/O performance, since it woulddiscourage users that do not want to sacrifice perfor-mance for improving reliability.
To fulfil these requirements, the MoIO approach adoptsa technique to automatically infer the DDP model fromfailure-free execution traces of DDP events. These eventsare then monitored in production for detecting protocol vio-lations, using the inferred DDP model. Events are collectedat driver’s interfaces (the DPI and the DI), which can betraced even without access to the source code of the driver.We design the approach to collect only a small amount ofinformation to keep low the performance overhead.
The proposed monitoring approach consists of two phases.The first phase (model learning and synthesis) collectsexecution traces from the OS, and generates a monitoringcomponent (which we call monitor) from them. Traces areobtained by inserting low-overhead probes at selected pointsof the kernel, which intercept and record I/O interactionsduring the execution of the storage device driver. The tracesare turned into a finite state machine (FSM) that summarizesthe behavior of the device driver according to the traces.Finally, a monitor is generated from the learned FSM. Inthe second phase (run-time monitoring) the monitor isdeployed in production, to detect deviations from the DDP.
The underlying idea of the approach is to automaticallygenerate a behavioral model of the device driver by analyz-ing its failure-free execution traces. This idea is based onthe observation that device driver failures have a transientnature, and are triggered by relatively-rare environmentalfactors that are difficult to reproduce and to debug [21],[10], [12], [22], [23], [24], [25]. Such environmental fac-tors include multi-threading, asynchrony, interrupts, lockingprotocols, hardware events and virtual memory [21].
For this reason, it is feasible to collect failure-free exe-cution traces before deployment (as failures are unlikely),and use these execution traces to build a “reference model”,that will be used at run-time to detect anomalous behaviors(i.e., transient failures) that have not been observed before.The device driver can be executed and traced in a testingenvironment, by using traditional performance benchmarksor other test workloads. The user can guarantee the absenceof errors during the training phase, since he/she has fullcontrol on the workload executed and can easily check its(expected) outputs. For example, if the training workloadconsists in a file copy, the user can check that the copy isequal to the original file. In a similar way, benchmarkingtools allow checking the end-to-end correctness of I/Otransfers. For example, IOzone provides the “+d” optionfor this purpose [26]. Tools for checking the consistencyof filesystems and DBs can also be applied.
Technical details about the approach are presented in
the following subsections, which discuss the monitoringarchitecture (III-D) and the model learning algorithm (III-E).
D. Monitoring architectureThe high-level monitoring architecture of MoIO is showed
in Figure 3. It includes a prober component, which istriggered both at the start and at the end of every I/O oper-ation. When triggered, it records the current contents of thedevice interface (DI), which include commands and statusinformation for on-going I/O operations. This informationfrom the DI is used to keep track of the “current state” ofthe DDP. During the model learning phase, the prober copiesthe contents of the DI in a trace, to be later processed andsynthesized into an executable monitor component. Duringthe run-time monitoring phase, the prober collects againthe contents of the DI, and forwards this information tothe monitor component, which checks whether the currentstate complies to the DDP model. If this is not the case,the monitor raises a warning to notify a DDP violation. Forinstance, a violation may occur when the device driver doesnot follow the correct format and sequencing of commandsand data according to the DDP (e.g., the device driver writesinvalid or out-of-order commands on the DI).
OS kernel Device Driver
Device Interface
Monitor Trace
Prober
DDP violations
Model learning & synthesis
1. The prober gets the address of memory-mapped
registers and shared data structures from the DMA and
bus APIs
2. The prober is triggered at the beginning and end of I/O transfers
(denoted by DPI calls)
4a. In the learning phase, data are stored and processed for model learning and synthesis
3. The prober collects the contents of memory-mapped registers and
shared data structures
4b. In the run-time monitoring phase, data are checked against
the DDP model
Figure 3. High-level architecture of the MoIO monitoring approach.
As discussed in subsection III-B (see also Figure 2), thedevice driver interacts with the OS and with the devicecontroller when: (i) the device driver starts an I/O transfer,and (ii) the device driver finalizes an I/O transfer and notifiesthe OS. On these events (denoted by the “probing” marks inFigure 2), the device driver updates the contents of the DI.Therefore, to identify the DDP, our approach collects andanalyzes the DI when these events occur. In modern storagecontrollers (Figure 4), the DI consists of:
• Memory-mapped registers, that is, control, data, andstatus registers of the disk controller that are associatedto the physical memory address space. These registersare accessed by the device driver using the sameinstructions for accessing RAM memory.
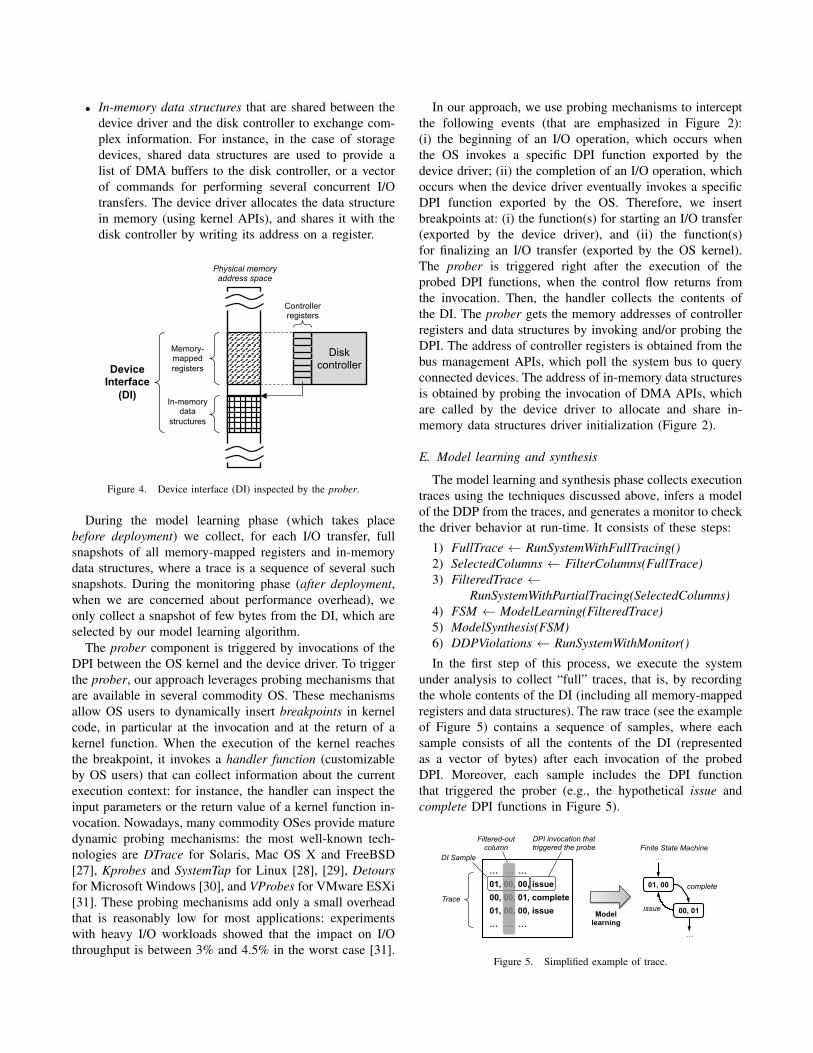
• In-memory data structures that are shared between thedevice driver and the disk controller to exchange com-plex information. For instance, in the case of storagedevices, shared data structures are used to provide alist of DMA buffers to the disk controller, or a vectorof commands for performing several concurrent I/Otransfers. The device driver allocates the data structurein memory (using kernel APIs), and shares it with thedisk controller by writing its address on a register.
Disk controller
Physical memory address space
Device Interface
(DI)
Memory-mapped registers
In-memory data
structures
Controller registers
Figure 4. Device interface (DI) inspected by the prober.
During the model learning phase (which takes placebefore deployment) we collect, for each I/O transfer, fullsnapshots of all memory-mapped registers and in-memorydata structures, where a trace is a sequence of several suchsnapshots. During the monitoring phase (after deployment,when we are concerned about performance overhead), weonly collect a snapshot of few bytes from the DI, which areselected by our model learning algorithm.
The prober component is triggered by invocations of theDPI between the OS kernel and the device driver. To triggerthe prober, our approach leverages probing mechanisms thatare available in several commodity OS. These mechanismsallow OS users to dynamically insert breakpoints in kernelcode, in particular at the invocation and at the return of akernel function. When the execution of the kernel reachesthe breakpoint, it invokes a handler function (customizableby OS users) that can collect information about the currentexecution context: for instance, the handler can inspect theinput parameters or the return value of a kernel function in-vocation. Nowadays, many commodity OSes provide maturedynamic probing mechanisms: the most well-known tech-nologies are DTrace for Solaris, Mac OS X and FreeBSD[27], Kprobes and SystemTap for Linux [28], [29], Detoursfor Microsoft Windows [30], and VProbes for VMware ESXi[31]. These probing mechanisms add only a small overheadthat is reasonably low for most applications: experimentswith heavy I/O workloads showed that the impact on I/Othroughput is between 3% and 4.5% in the worst case [31].
In our approach, we use probing mechanisms to interceptthe following events (that are emphasized in Figure 2):(i) the beginning of an I/O operation, which occurs whenthe OS invokes a specific DPI function exported by thedevice driver; (ii) the completion of an I/O operation, whichoccurs when the device driver eventually invokes a specificDPI function exported by the OS. Therefore, we insertbreakpoints at: (i) the function(s) for starting an I/O transfer(exported by the device driver), and (ii) the function(s)for finalizing an I/O transfer (exported by the OS kernel).The prober is triggered right after the execution of theprobed DPI functions, when the control flow returns fromthe invocation. Then, the handler collects the contents ofthe DI. The prober gets the memory addresses of controllerregisters and data structures by invoking and/or probing theDPI. The address of controller registers is obtained from thebus management APIs, which poll the system bus to queryconnected devices. The address of in-memory data structuresis obtained by probing the invocation of DMA APIs, whichare called by the device driver to allocate and share in-memory data structures driver initialization (Figure 2).
E. Model learning and synthesis
The model learning and synthesis phase collects executiontraces using the techniques discussed above, infers a modelof the DDP from the traces, and generates a monitor to checkthe driver behavior at run-time. It consists of these steps:
1) FullTrace ← RunSystemWithFullTracing()2) SelectedColumns ← FilterColumns(FullTrace)3) FilteredTrace ←
RunSystemWithPartialTracing(SelectedColumns)4) FSM ← ModelLearning(FilteredTrace)5) ModelSynthesis(FSM)6) DDPViolations ← RunSystemWithMonitor()
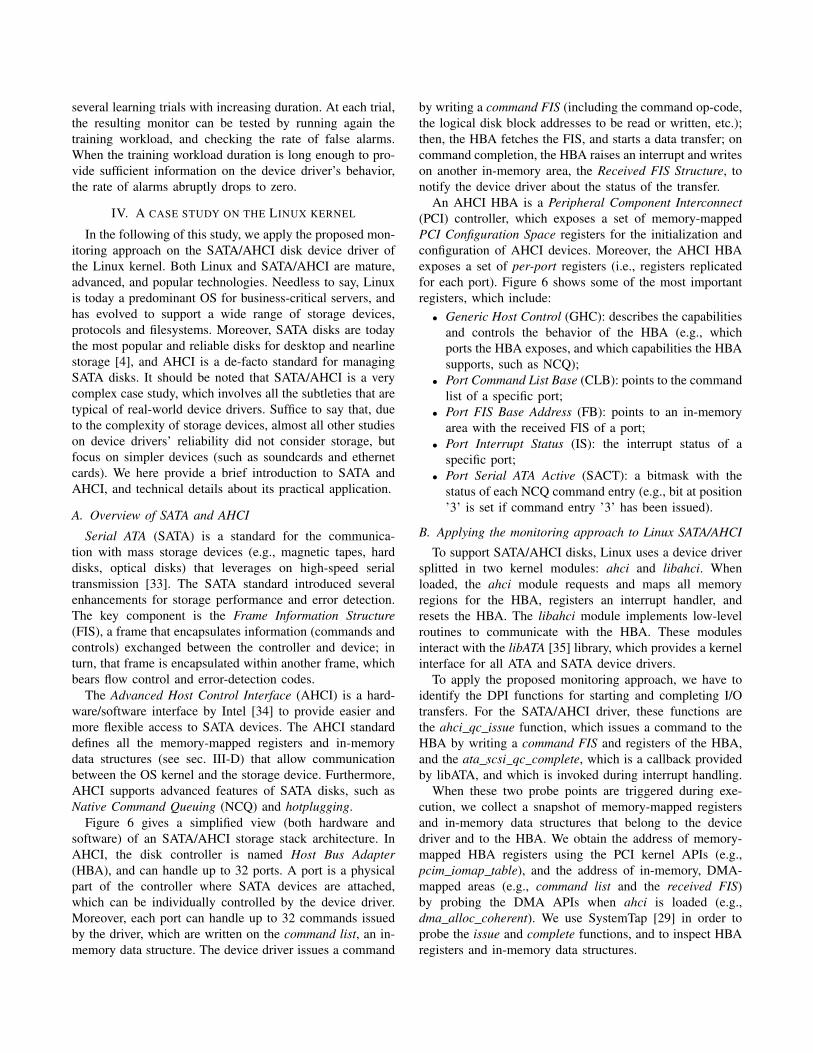
In the first step of this process, we execute the systemunder analysis to collect “full” traces, that is, by recordingthe whole contents of the DI (including all memory-mappedregisters and data structures). The raw trace (see the exampleof Figure 5) contains a sequence of samples, where eachsample consists of all the contents of the DI (representedas a vector of bytes) after each invocation of the probedDPI. Moreover, each sample includes the DPI functionthat triggered the prober (e.g., the hypothetical issue andcomplete DPI functions in Figure 5).
… … … 01, 00, 00, issue 00, 00, 01, complete 01, 00, 00, issue … … …
DI Sample
Trace
Filtered-out column
01, 00 complete
issue 00, 01
…
…
Finite State Machine DPI invocation that triggered the probe
Model learning
Figure 5. Simplified example of trace.

The initial tracing needs to sample the whole contentsof the DI since, before the model learning process, westill do not know the DDP and which parts of the DI arerelevant for monitoring purposes. By analyzing this initialtrace, our approach learns about which types of informationare included in the DI (e.g., command codes, bitmasks,addresses, etc.) and selects a subset of DI’s contents, whichwill be the focus of the subsequent steps.
In fact, we note that not every information from the DIis useful: for instance, we are not interested at analyzingregisters that are never modified during I/O transfers (e.g.,registers only written during the device initialization). More-over, we want to avoid noisy and highly-variable informationthat have little influence on the DDP, such as memoryaddresses (which are non-deterministically selected by thedynamic memory allocator). Including noisy informationwould inflate the learned model (thus potentially increasingthe performance overhead), and would make it prone tofalse alarms when there are small variations in I/O transferpatterns. Instead, the most valuable information for the DDPmodel is the sequence of commands and status informationthat is exchanged between the device driver and the diskcontroller. Focusing on this information makes the modelcompact and robust against small variations in I/O patterns(e.g., the I/O command codes are still the same regardlessof allocated memory addresses).
The FilterColumns procedure inspects raw traces to locateuseful information in the DI. Each sample in the trace issplit into a sequence of bytes. The set of bytes at the sameposition of each sample (e.g., the third byte of each sample)is referred to as column of the trace. The output of thisprocedure is the list of columns of the trace with relevant in-formation. For instance, in Figure 5, FilterColumns removesthe second column, and retains the other two for furtheranalysis. FilterColumns identifies:
Constants: Columns are first analyzed independentlyfrom each other. For each column, we analyze the number ofdifferent values that are assumed by the bytes in the column,and remove columns that are constant across the whole trace.
Large fields: The remaining columns are further ana-lyzed, to coalesce adjacent columns that are part of thesame information (e.g., a group of several bytes that forma command code). Two or more columns are coalescedinto a new multi-byte column when: (i) they are located atadjacent positions (e.g., two subsequent bytes from an in-memory data structure), and (ii) there is at least one samplein the trace where all the bytes in the group vary from thehomologous bytes in the precedent sample. For instance, iftwo adjacent bytes both change their values between twoconsecutive samples, then their columns are grouped.
Bitmasks: Columns that represent bitmasks (e.g., bitswith the state of a set of I/O ports) are denoted by variationsthat involve only involve one bit at a time. We identify them
by: (i) comparing, for each byte in each sample, the numberof bits that have varied compared to the homologous bytein the precedent sample; (ii) identifying columns where, inmost of the samples (e.g., 90% or more), the variationsonly involve one bit. The margin of tolerance accounts forsporadic cases when several bits vary almost at the sametime (e.g., the completion of concurrent I/O transfers). Thesecolumns are rewritten by replacing bitmask values with thenumber of bits that change between consecutive samples,which is the most useful information from the point of viewof the DDP protocol, and allows to simplify the DDP model.
Addresses: To deal with columns that are prone tovariations across different executions (e.g., columns withmemory addresses), we remove the columns that exhibita high number of different values (i.e., the cardinality ofthe column). This strategy is based on the observation thatcommand and status codes (and similar information) areunlikely to exhibit very large cardinality. Since such fieldscan assume few tens of different values at most, it is safe todiscard columns that assume more than one hundred values.Another strategy is to remove columns that only containmemory addresses: these columns can be identified by alsotracing memory areas allocated to the driver (by probingmemory allocation APIs) and comparing their addresses withthe values in the columns.
Once relevant columns have been selected, the systemunder analysis is again executed (RunSystemWithPartial-Tracing(...)), but this time only “partial” traces are collected,i.e., we collect only the bytes from the DPI that are selectedby the previous procedure (SelectedColumns). We re-executethe system since partial tracing has much lower overheadthan full tracing, and thus is less likely to perturb theexecution of the system (the “probe effect” [32]). While fulltracing is useful to identify data types in the DI (commands,bitmasks, addresses, ...), partial tracing is more suitable tocollect accurate traces of the dynamic behavior of the devicedriver (e.g., by preserving the timing of events and thesequencing of commands). Columns in the partial trace arecoalesced and converted to bitmask counts.
From the filtered trace, we generate an FSM (ModelLearn-ing). Each distinct vector of bytes in the trace is turned intoa state of the FSM, and the DPI function that triggered theprobe is turned into a transition between the current stateand the previous one. In the example of partial trace inFigure 5, two states are generated from the two distinctvectors (01, 00) and (00, 01), with two transitions issue andcomplete that connect them. Finally, the FSM is synthesizedinto a monitor component. The monitor collects selectedbytes from the DI, in the same way of partial tracing. Inaddition, the monitor keeps track of the state of the devicedriver on the FSM, and detects a DDP violation when thecurrent state is not compliant to the FSM.
To tune the duration of tracing runs, the user can perform
several learning trials with increasing duration. At each trial,the resulting monitor can be tested by running again thetraining workload, and checking the rate of false alarms.When the training workload duration is long enough to pro-vide sufficient information on the device driver’s behavior,the rate of alarms abruptly drops to zero.
IV. A CASE STUDY ON THE LINUX KERNEL
In the following of this study, we apply the proposed mon-itoring approach on the SATA/AHCI disk device driver ofthe Linux kernel. Both Linux and SATA/AHCI are mature,advanced, and popular technologies. Needless to say, Linuxis today a predominant OS for business-critical servers, andhas evolved to support a wide range of storage devices,protocols and filesystems. Moreover, SATA disks are todaythe most popular and reliable disks for desktop and nearlinestorage [4], and AHCI is a de-facto standard for managingSATA disks. It should be noted that SATA/AHCI is a verycomplex case study, which involves all the subtleties that aretypical of real-world device drivers. Suffice to say that, dueto the complexity of storage devices, almost all other studieson device drivers’ reliability did not consider storage, butfocus on simpler devices (such as soundcards and ethernetcards). We here provide a brief introduction to SATA andAHCI, and technical details about its practical application.
A. Overview of SATA and AHCI
Serial ATA (SATA) is a standard for the communica-tion with mass storage devices (e.g., magnetic tapes, harddisks, optical disks) that leverages on high-speed serialtransmission [33]. The SATA standard introduced severalenhancements for storage performance and error detection.The key component is the Frame Information Structure(FIS), a frame that encapsulates information (commands andcontrols) exchanged between the controller and device; inturn, that frame is encapsulated within another frame, whichbears flow control and error-detection codes.
The Advanced Host Control Interface (AHCI) is a hard-ware/software interface by Intel [34] to provide easier andmore flexible access to SATA devices. The AHCI standarddefines all the memory-mapped registers and in-memorydata structures (see sec. III-D) that allow communicationbetween the OS kernel and the storage device. Furthermore,AHCI supports advanced features of SATA disks, such asNative Command Queuing (NCQ) and hotplugging.
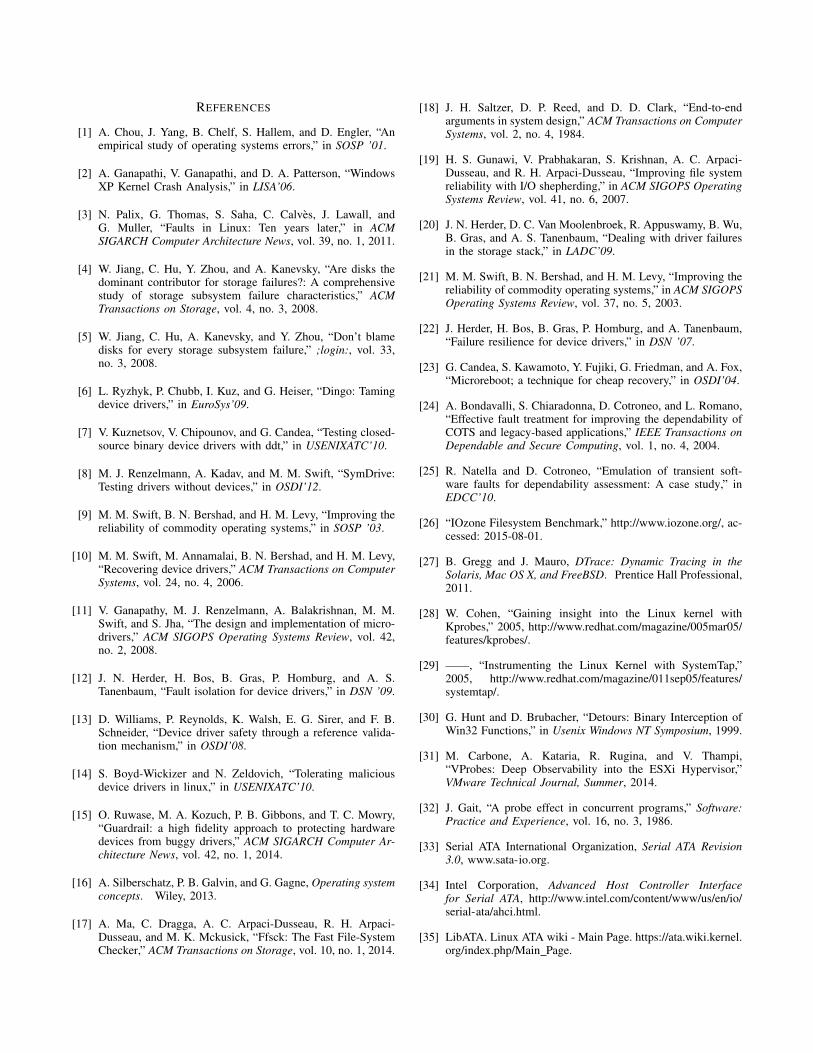
Figure 6 gives a simplified view (both hardware andsoftware) of an SATA/AHCI storage stack architecture. InAHCI, the disk controller is named Host Bus Adapter(HBA), and can handle up to 32 ports. A port is a physicalpart of the controller where SATA devices are attached,which can be individually controlled by the device driver.Moreover, each port can handle up to 32 commands issuedby the driver, which are written on the command list, an in-memory data structure. The device driver issues a command
by writing a command FIS (including the command op-code,the logical disk block addresses to be read or written, etc.);then, the HBA fetches the FIS, and starts a data transfer; oncommand completion, the HBA raises an interrupt and writeson another in-memory area, the Received FIS Structure, tonotify the device driver about the status of the transfer.
An AHCI HBA is a Peripheral Component Interconnect(PCI) controller, which exposes a set of memory-mappedPCI Configuration Space registers for the initialization andconfiguration of AHCI devices. Moreover, the AHCI HBAexposes a set of per-port registers (i.e., registers replicatedfor each port). Figure 6 shows some of the most importantregisters, which include:
• Generic Host Control (GHC): describes the capabilitiesand controls the behavior of the HBA (e.g., whichports the HBA exposes, and which capabilities the HBAsupports, such as NCQ);
• Port Command List Base (CLB): points to the commandlist of a specific port;
• Port FIS Base Address (FB): points to an in-memoryarea with the received FIS of a port;
• Port Interrupt Status (IS): the interrupt status of aspecific port;
• Port Serial ATA Active (SACT): a bitmask with thestatus of each NCQ command entry (e.g., bit at position’3’ is set if command entry ’3’ has been issued).
B. Applying the monitoring approach to Linux SATA/AHCI
To support SATA/AHCI disks, Linux uses a device driversplitted in two kernel modules: ahci and libahci. Whenloaded, the ahci module requests and maps all memoryregions for the HBA, registers an interrupt handler, andresets the HBA. The libahci module implements low-levelroutines to communicate with the HBA. These modulesinteract with the libATA [35] library, which provides a kernelinterface for all ATA and SATA device drivers.
To apply the proposed monitoring approach, we have toidentify the DPI functions for starting and completing I/Otransfers. For the SATA/AHCI driver, these functions arethe ahci qc issue function, which issues a command to theHBA by writing a command FIS and registers of the HBA,and the ata scsi qc complete, which is a callback providedby libATA, and which is invoked during interrupt handling.
When these two probe points are triggered during exe-cution, we collect a snapshot of memory-mapped registersand in-memory data structures that belong to the devicedriver and to the HBA. We obtain the address of memory-mapped HBA registers using the PCI kernel APIs (e.g.,pcim iomap table), and the address of in-memory, DMA-mapped areas (e.g., command list and the received FIS)by probing the DMA APIs when ahci is loaded (e.g.,dma alloc coherent). We use SystemTap [29] in order toprobe the issue and complete functions, and to inspect HBAregisters and in-memory data structures.

Command 0
. . .
Command 31 AHCI disk controller
(HBA)
CLB FB IS . . .
SACT . . .
CLB FB IS . . .
SACT . . .
OS kernel
Block I/O
AHCI device driver
request
notification
Apps I/O
system calls
Kernel services
commands
interrupts FS
. . . CLB FB IS . . .
SACT . . .
GHC
Port 0..31
SATA bus
FRAME FRAME
Received FIS Structure Command List
Command 0
. . .
Command 31
Software Hardware
Command Table 0 (FIS to be issued)
SATA disk
Figure 6. SATA/AHCI architecture.
V. EXPERIMENTAL EVALUATION
We evaluate our monitoring approach in the context of theSATA/AHCI device driver of the Linux kernel (presentedin sec. IV). We consider three aspects for the evaluation:(i) the ability to detect protocol violations, (ii) the amountof false positives, and (iii) the I/O performance overhead.These three aspects are evaluated in two sets of experiments:(i) fault injection experiments, in which we inject faultsin the device driver to force failures (including protocolviolations) and analyze the coverage of the monitor atdetecting them; (ii) fault-free experiments, in which we runthe monitor under heavy workloads, and analyze the rateof false positives (i.e., alarms generated when there are nofaults), and the performance overhead (i.e., comparing theI/O throughput with and without the monitor).
A. Fault injection experiments
We performed fault injection experiments on a Linuxsystem (which we refer to as the System Under Test (SUT))that is based on the Fedora distribution version 21, and onthe Linux kernel version 3.19. Experiments are orchestratedby an Experiment Management Software (EMS), whichconfigures the SUT, including the workload and the faultloadof the experiment, and collects data for later analysis.
Figure 7 shows the experimental setup and the workflow.The SUT is executed in a virtual machine, while the EMSis executed in the physical machine that hosts the virtualmachine. This separation is more and more adopted in faultinjection experiments in OS [36], [37], [38], and is necessaryin order to protect the Experiment Management Softwarefrom the faults injected into the SUT: when using a virtualmachine, the injected faults remain isolated within the SUT,thus allowing the EMS to correctly save the data from thecurrent experiment, and to start the subsequent one. We useVMware Workstation 11 to run the SUT within a virtualmachine, which fully emulates a SATA AHCI disk controller(i.e., the disk controller of the virtual machine is managed
Linux kernel
VM
Workload
AHCI driver
Fault Injector
System Under Test
Host machine
Experiment Management
Software
Data collection: • AHCI driver logs • Linux kernel logs • Workload logs • FS check results • Monitor logs
Experiment execution: • Restart VM • Deploy the monitor • Configure the fault injector • Start the workload generator
Monitor
Figure 7. Fault injection setup.
and accessed by the Linux kernel in the same way of aphysical disk controller, using the ahci device driver) [39].
Commands for executing experiments (e.g., to start theworkload, and to configure the fault injector) are sentthrough an SSH connection, and experimental data (e.g.,logs from the OS, from the monitor, and from user-spaceprocesses) are collected from both a virtual serial connectionand an SSH connection. Experimental data are analyzed toidentify whether the injected fault caused a failure of theSUT. Possible outcomes of the experiments are:
• The crash or stall of either the OS or of the workload.They are identified by crash messages, and by checkingthe responsiveness of the SUT at the end of the exper-iment (e.g., the SUT completes all experimental stepsand responds to commands from the EMS);
• Data corruptions, that is, executions that neither crashnor stall, but where the data are corrupted at the end ofthe experiment. They are identified by (i) checking thecontents of the output files produced by the workload(by comparing them to fault-free executions), and (ii)checking the consistency of filesystem data structures

(such as damaged directory trees and “orphaned” files)using the fsck filesystem verification tool;
• No failure of the SUT. This outcome happens when theinjected fault does not propagate within the SUT (e.g.,corrupted data is never accessed, or is overwritten bycorrect data), and is identified by the lack of failures.
Our analysis is focused on I/O protocol violations thatcause data corruption failures. These failures are subtle andnot detectable by simply checking for crashes or stalls; ourmonitor fills this gap by detecting I/O protocol violations.We evaluate the coverage of failure detection, which is thepercentage of experiments where data corruption is detected,among all experiments with data corruption failures.
We perform three fault injection campaigns by using thefollowing well-known I/O workloads [40], [41]:
• IOzone: A filesystem benchmarking tool. It generatesa variety of file operations, using several read and writepatterns (e.g., sequential, random, repeated, strided),sizes (e.g., both small and large record and file sizes),and APIs (e.g., memory-mapped, asynchronous I/O);
• Postmark: An I/O benchmark that emulates a largeemail server, by performing a mix of data- andmetadata-intensive operations on a pool of random textfiles. It first creates the pool of files with uniformly dis-tributed sizes, and then it performs a sequence (namelytransaction) of randomly selected I/O operations (e.g.,file creation, deletion, read, and append);
• SQLite: a software library that implements a serverlesstransactional SQL database engine. It is exercised byperforming several insert and select queries.
We generate the monitor component by running the SUTusing the IOzone workload. Then, we use the monitor trainedwith IOzone for failure detection in all the three faultinjection campaigns. In this way, we are considering both(i) the case when the workload for training the monitor isrepresentative of the workload in production (fault injectionexperiments under IOzone), and (ii) the case when the work-load in production differs from training (experiments underPostmark and SQLite). Executing the IOzone workload forfive minutes was sufficient to train a robust monitor.
We inject faults in the SATA/AHCI device driver duringthe execution of the SUT. We adopt the fault injectordeveloped by Ng and Chen for testing the Rio File Cachein FreeBSD [42], and later ported to Linux and Minix insubsequent studies on OS fault tolerance [21], [12]. Thisfault injector emulates software bugs that are common in OScode, according to field failure data [43]. The injector canemulate assignment faults (i.e., incorrect source or destina-tion in assignment instruction), control faults (i.e., incorrectlogical condition in loop or branch), parameter faults (i.e.,incorrect parameter in a function call), omission faults (i.e.,a missing instruction, by removing it), and pointer faults(i.e., an incorrect memory pointer computation). Faults are
injected at run-time by replacing the original instructionswith corrupted ones in the binary code of the driver [44].We perform 210 fault injection experiments, by randomlyselecting the fault type and location at each experiment.
From the experimental data, we identified the outcomeof the injected fault (crash/stall, data corruption, no failure)and, in the case of data corruption failures, the outcome offailure detection. Figure 8 summarizes both failure modesand failure detection. Most of the cases resulted in nofailures, since the injected fault did not impact on thedevice driver (e.g., the fault results in corrupted memorythat is overwritten or ignored by the device driver)—this isa known phenomenon that is often observed in fault injectionexperiments [45]. Experiments also include data corruptionfailures, that affect both application data (causing incorrectoutputs) and the filesystem (such as, invalid partition infor-mation; orphaned inodes; corrupted superblocks).
The monitor detected data corruptions in 85% of cases(Figure 8d). In these experiments, faults caused the devicedriver to omit a write on the DI or lead to incorrect writes;they then resulted in I/O transfers that were not completed,and to an incorrect sequencing of events that was detected bythe DDP model. Undetected corruptions can be attributed tothe relative simplicity of the monitor, which trades-off lessimportant information about the DDP (since some fields ofthe DI are filtered-out and excluded from monitoring, asdiscussed in sec. III-E) in order to be lightweight and robustagainst noise (as discussed in the next subsection).
It must also be noted that the failure detection coverage ofthe monitor is still high even when the workload for trainingthe monitor is different than the workload of the experiments(i.e., the coverage in Figures 8b and 8c is comparable tothe coverage in Figure 8a). This can be explained by thelayered architecture of the storage stack (Figure 1) betweenuser applications and the device driver: the variations acrossworkloads (e.g., in terms of number and size of files and ofI/O system calls) are not perceived by the device driver, sincethe filesystem and the block I/O manager (which performsI/O buffering, caching and scheduling) turns them into aregular sequence of I/O interactions. This behavior allows touse the monitoring approach even if there is a lack of a rep-resentative workload of the production environment, sinceusing a generic (but enough comprehensive) benchmarkingtool, such as IOzone, suffices to train an effective monitor.
B. Performance and long-running experiments
We evaluate the robustness of the monitoring approachto false positives, by executing the SUT for a long timein the absence of faults. We perform three long-runningexperiments, by repeatedly executing the IOzone, Postmark,and SQLite workloads for one day. Again, we train themonitor using IOzone, and use this monitor in all threeexperiments. To assure a fault-free execution, we check thecorrectness of outputs of the workload at each iteration

No failure 53%
Crash/Stall 17%
Undetected corruptions
14%
Detected corruptions
86%
Corruptions 30%
IOzone
(a) IOzone experiments.
No failure 71%
Crash/Stall 20% Undetected
corruptions 0%
Detected corruptions
100%
Corruptions 9%
Postmark
(b) Postmark experiments.
No failure 77%
Crash/Stall 17%
Undetected corruptions
25%
Detected corruptions
75%
Corruptions 6%
SQLite
(c) SQLite experiments.
No failure 67%
Crash/Stall 18%
Undetected corruptions
15%
Detected corruptions
85%
Corruptions 15%
All
(d) All experiments.
Figure 8. Distributions of fault injection outcomes, and failure detection coverage.
and do not inject any fault during the experiment. In theseconditions, the monitor should not detect any failure, thusany DDP violation raised by the monitor is a false positive.
The long-running experiments gave a promising result: nofalse alarms were raised. This result must be interpreted withcaution, since our monitor cannot assure freedom from falsepositives. In general, any method based on dynamic programanalysis can be affected by false positives, since executiontraces of large software are not a comprehensive represen-tation of all possible device driver executions. However,the model learning technique has been able to extract onlyminimal and stable features of the device driver protocol,that are very likely to hold under fault-free executions. Weavoid false positives by filtering the parts of the deviceinterface that are prone to very high variability and thatwould add little to the failure detection power. This allows toachieve a reasonable trade-off between false positives, falsenegatives, and overhead for practical applications.
Finally, we evaluated the impact of run-time monitoringon performance. We measured the execution time of the IO-zone, Postmark, and SQLite workloads, respectively withoutand with monitoring. Figure 9 shows the average and thestandard deviation of the execution time, that have beenevaluated from 20 repeated executions of each workload.Monitoring introduces a very small overhead (mostly dueto the overhead of dynamic probing mechanisms), since theaverage execution time increases only by 2.97% in the worstcase (Postmark), and the differences of average executiontime are not statistically significant according to a t-test.
VI. CONCLUSION
We addressed the problem of detecting I/O protocol vio-lations of storage device drivers at run-time. We proposed a
IOzone SQLite Postmark0
10
20
30
40
50
60
70
80
90
100
Aver
age
exec
utio
n tim
e [s
]
without monitorwith monitor
Figure 9. Performance overhead of the monitoring approach.
monitoring approach based on a model inference technique,which automatically learns the device driver protocol with-out relying on documentation or source code. This approachhas been applied on a complex, real-word case study (theSATA/AHCI driver of the Linux kernel), showing that it isa promising solution with a good failure detection coverage,a low rate of false positives, and small overhead.
ACKNOWLEDGMENT
This work was supported by the COSMIC public-privatelaboratory, projects SVEVIA (PON02 00485 3487758),MINIMINDS (PON02 00485 3164061) and DISPLAY(PON02 00485 3487784), and the TENACE PRIN project(n. 20103P34XC), funded by the Italian Ministry of Educa-tion, University and Research.
REFERENCES
[1] A. Chou, J. Yang, B. Chelf, S. Hallem, and D. Engler, “Anempirical study of operating systems errors,” in SOSP ’01.
[2] A. Ganapathi, V. Ganapathi, and D. A. Patterson, “WindowsXP Kernel Crash Analysis,” in LISA’06.
[3] N. Palix, G. Thomas, S. Saha, C. Calves, J. Lawall, andG. Muller, “Faults in Linux: Ten years later,” in ACMSIGARCH Computer Architecture News, vol. 39, no. 1, 2011.
[4] W. Jiang, C. Hu, Y. Zhou, and A. Kanevsky, “Are disks thedominant contributor for storage failures?: A comprehensivestudy of storage subsystem failure characteristics,” ACMTransactions on Storage, vol. 4, no. 3, 2008.
[5] W. Jiang, C. Hu, A. Kanevsky, and Y. Zhou, “Don’t blamedisks for every storage subsystem failure,” ;login:, vol. 33,no. 3, 2008.
[6] L. Ryzhyk, P. Chubb, I. Kuz, and G. Heiser, “Dingo: Tamingdevice drivers,” in EuroSys’09.
[7] V. Kuznetsov, V. Chipounov, and G. Candea, “Testing closed-source binary device drivers with ddt,” in USENIXATC’10.
[8] M. J. Renzelmann, A. Kadav, and M. M. Swift, “SymDrive:Testing drivers without devices,” in OSDI’12.
[9] M. M. Swift, B. N. Bershad, and H. M. Levy, “Improving thereliability of commodity operating systems,” in SOSP ’03.
[10] M. M. Swift, M. Annamalai, B. N. Bershad, and H. M. Levy,“Recovering device drivers,” ACM Transactions on ComputerSystems, vol. 24, no. 4, 2006.
[11] V. Ganapathy, M. J. Renzelmann, A. Balakrishnan, M. M.Swift, and S. Jha, “The design and implementation of micro-drivers,” ACM SIGOPS Operating Systems Review, vol. 42,no. 2, 2008.
[12] J. N. Herder, H. Bos, B. Gras, P. Homburg, and A. S.Tanenbaum, “Fault isolation for device drivers,” in DSN ’09.
[13] D. Williams, P. Reynolds, K. Walsh, E. G. Sirer, and F. B.Schneider, “Device driver safety through a reference valida-tion mechanism,” in OSDI’08.
[14] S. Boyd-Wickizer and N. Zeldovich, “Tolerating maliciousdevice drivers in linux,” in USENIXATC’10.
[15] O. Ruwase, M. A. Kozuch, P. B. Gibbons, and T. C. Mowry,“Guardrail: a high fidelity approach to protecting hardwaredevices from buggy drivers,” ACM SIGARCH Computer Ar-chitecture News, vol. 42, no. 1, 2014.
[16] A. Silberschatz, P. B. Galvin, and G. Gagne, Operating systemconcepts. Wiley, 2013.
[17] A. Ma, C. Dragga, A. C. Arpaci-Dusseau, R. H. Arpaci-Dusseau, and M. K. Mckusick, “Ffsck: The Fast File-SystemChecker,” ACM Transactions on Storage, vol. 10, no. 1, 2014.
[18] J. H. Saltzer, D. P. Reed, and D. D. Clark, “End-to-endarguments in system design,” ACM Transactions on ComputerSystems, vol. 2, no. 4, 1984.
[19] H. S. Gunawi, V. Prabhakaran, S. Krishnan, A. C. Arpaci-Dusseau, and R. H. Arpaci-Dusseau, “Improving file systemreliability with I/O shepherding,” in ACM SIGOPS OperatingSystems Review, vol. 41, no. 6, 2007.
[20] J. N. Herder, D. C. Van Moolenbroek, R. Appuswamy, B. Wu,B. Gras, and A. S. Tanenbaum, “Dealing with driver failuresin the storage stack,” in LADC’09.
[21] M. M. Swift, B. N. Bershad, and H. M. Levy, “Improving thereliability of commodity operating systems,” in ACM SIGOPSOperating Systems Review, vol. 37, no. 5, 2003.
[22] J. Herder, H. Bos, B. Gras, P. Homburg, and A. Tanenbaum,“Failure resilience for device drivers,” in DSN ’07.
[23] G. Candea, S. Kawamoto, Y. Fujiki, G. Friedman, and A. Fox,“Microreboot; a technique for cheap recovery,” in OSDI’04.
[24] A. Bondavalli, S. Chiaradonna, D. Cotroneo, and L. Romano,“Effective fault treatment for improving the dependability ofCOTS and legacy-based applications,” IEEE Transactions onDependable and Secure Computing, vol. 1, no. 4, 2004.
[25] R. Natella and D. Cotroneo, “Emulation of transient soft-ware faults for dependability assessment: A case study,” inEDCC’10.
[26] “IOzone Filesystem Benchmark,” http://www.iozone.org/, ac-cessed: 2015-08-01.
[27] B. Gregg and J. Mauro, DTrace: Dynamic Tracing in theSolaris, Mac OS X, and FreeBSD. Prentice Hall Professional,2011.
[28] W. Cohen, “Gaining insight into the Linux kernel withKprobes,” 2005, http://www.redhat.com/magazine/005mar05/features/kprobes/.
[29] ——, “Instrumenting the Linux Kernel with SystemTap,”2005, http://www.redhat.com/magazine/011sep05/features/systemtap/.
[30] G. Hunt and D. Brubacher, “Detours: Binary Interception ofWin32 Functions,” in Usenix Windows NT Symposium, 1999.
[31] M. Carbone, A. Kataria, R. Rugina, and V. Thampi,“VProbes: Deep Observability into the ESXi Hypervisor,”VMware Technical Journal, Summer, 2014.
[32] J. Gait, “A probe effect in concurrent programs,” Software:Practice and Experience, vol. 16, no. 3, 1986.
[33] Serial ATA International Organization, Serial ATA Revision3.0, www.sata-io.org.
[34] Intel Corporation, Advanced Host Controller Interfacefor Serial ATA, http://www.intel.com/content/www/us/en/io/serial-ata/ahci.html.
[35] LibATA. Linux ATA wiki - Main Page. https://ata.wiki.kernel.org/index.php/Main Page.

[36] T. Banzai, H. Koizumi, R. Kanbayashi, T. Imada, T. Hanawa,and M. Sato, “D-Cloud: Design of a Software Testing En-vironment for Reliable Distributed Systems Using CloudComputing Technology,” in CCGRID’10.
[37] I. Irrera, J. Duraes, H. Madeira, and M. Vieira, “Assessingthe Impact of Virtualization on the Generation of FailurePrediction Data,” in LADC’13.
[38] S. Winter, O. Schwahn, R. Natella, N. Suri, and D. Cotroneo,“No PAIN, No Gain? The Utility of PArallel Fault INjec-tions,” in ICSE’15.
[39] E. Bugnion, S. Devine, M. Rosenblum, J. Sugerman, andE. Y. Wang, “Bringing Virtualization to the x86 Architecturewith the Original VMware Workstation,” ACM Transactionson Computer Systems, vol. 30, no. 4, 2012.
[40] A. Traeger, E. Zadok, N. Joukov, and C. Wright, “A NineYear Study of File System and Storage Benchmarking,” ACMTransactions on Storage, vol. 4, no. 2, 2008.
[41] K. Kanoun, Y. Crouzet, A. Kalakech, A. Rugina, andP. Rumeau, “Benchmarking the Dependability of Windowsand Linux using PostMarkTM Workloads,” in ISSRE’05.
[42] W. T. Ng and P. M. Chen, “The design and verification of therio file cache,” IEEE Trans. Comput., vol. 50, no. 4, 2001.
[43] M. Sullivan and R. Chillarege, “Software Defects and theirImpact on System Availability: A Study of Field Failures inOperating Systems,” in FTCS’91.
[44] D. Cotroneo, A. Lanzaro, R. Natella, and R. Barbosa, “Ex-perimental analysis of binary-level software fault injection incomplex software,” in EDCC’12.
[45] A. Lanzaro, R. Natella, S. Winter, D. Cotroneo, and N. Suri,“An Empirical Study of Injected versus Actual InterfaceErrors,” in ISSTA’14.