mohamed radhouane aniba - unistra.fr · mohamed radhouane aniba . développement d’un système...
TRANSCRIPT
Thèse présentée pour obtenir le titre de
Docteur de l’Université de Strasbourg
Discipline : Sciences du Vivant
Spécialité : Bioinformatique
Par
Mohamed Radhouane Aniba
Développement d’un Système Expert basé sur les connaissances
en Bioinformatique : Application à l’alignement multiple de séquences
protéiques
***
Knowledge Based Expert System development in Bioinformatics
applied to Multiple Sequence Alignment of protein sequences
Soutenue publiquement le 15 Septembre 2010 devant le jury :
Directeur de Thèse Dr. Julie Thompson, IGBMC, Strasbourg
Dr. Aron Marchler-Bauer, NCBI, USA
Rapporteur Externe 1 Pr. Amos Bairoch, SIB, CH
Rapporteur Externe 2 Dr. Pierre Pontarotti, Université de Provence, Marseille
Rapporteur Interne Dr. Pierre Gancarski, LSIIT, Strasbourg
Membre invité Dr. Olivier Poch, IGBMC, Strasbourg

1
Je dédie cette thèse,

2
A la mémoire de mon Oncle Foued Ouali et à mon Cousin Mehdi Mzali, tous les deux
partis trop tôt.
Vous étiez très chers à mon cœur, vous avez toujours cru en moi et vous aurez toujours
chacun une place très particulière dans ma vie…
Que Dieu ait vos âmes
Je vous aimerais infiniment

3
Au premier amour de ma vie, ma grand-mère Aroussia
Ton éducation, tes leçons, ton amour, tes valeurs, ta patience, tous les moments de mon
enfance passés à tes côtés et tout ce qui fait que je ne serais jamais là où j’en suis aujourd’hui
sans toi. Je t’aime plus que tout au monde. Que dieu te garde pour nous.
A mes très chers parents, Zineb et Hamadi, à mes très chers frères Abdou et Karim, à
mon adorable belle sœur Souad et mes neveux Bibou et Foufou
Que ce travail soit le témoignage de mon amour et ma gratitude. Aucune dédicace ne
saurait exprimer l’étendue de ma reconnaissance pour les sacrifices et la patience que vous
m’avez consentis. Pour votre amour, votre compréhension, votre patience et le bien être moral
et matériel que vous m’avez toujours assuré depuis mon enfance.
Que Dieu vous protège et que je puisse vous apporter que du bonheur, vous le méritez
tellement…
A ma très chère épouse, Rym
Pour ta gentillesse, ta patience, tes encouragements et tous les sentiments qui nous
unissent. Sans ton soutien, ce travail n’aurait pas vu le jour.
Merci d’exister pour me rendre plus heureux que je ne le suis déjà…
A mes complices Kaboura et Najib Ben Mena
Pour tout l’amour et l’affection que je vous porte, pour les moments agréables passés en
votre compagnie chaque fois que l’on se voit et pour votre bonne humeur et humour
continuels.
A Sihem et Mohamed Ben Othman, Hend, Zied et Mahmoud Bacha, Asma et Walid
Ghannouchi
Merci pour votre soutien, encouragements et votre compréhension. Vous êtes toujours
là pour moi. Que Dieu vous protège et vous accorde santé, bonheur et longue vie
A mon complice de toujours Ahmed Chakroune
Pour ton soutien, tes idées, tes principes, tous les fous rires qu’on a eu à chaque moment
partagé, ton humour et ton amitié sincère et si forte.

4
Remerciements - Ackowledgments
I would like to thank Aron Marchler-Bauer, Amos Bairoch, Pierre Pontarotti and Pierre
Gancarski for accepting to evaluate my thesis and their interest in my research work.
Merci à tous les membres du Laboratoire de Bioinformatique et Génomique Intégrative
qui m’ont apporté aide et soutien pendant cette thèse. Grâce à leurs compétences et leurs
qualités humaines, mon travail s’est déroulé dans une ambiance chaleureuse. Un merci tout
particulier à Luc Moulinier avec qui les discussions sont toujours « stimulantes », et sa bonne
humeur communicative qui rend le travail de tous les jours agréable (enfin quand je dis tous
les jours … !), ET à Yanick Noel Anno avec qui j’ai eu de très agréables moments de
complicité et partagé les bons passages de nos parcours mutuels.
Je tiens particulièrement à remercier Julie Thompson, sans qui ce travail n’aurais
probablement pas vu le jour et pour la chance qu’elle ma donné en m’accordant sa confiance
pour être son premier thésard. En dehors de son assiduité, j’ai appris énormément à son
contact.
Et bien sûr, un grand merci à Olivier Poch, pour son enthousiasme et son énergie
débordante. Merci pour la confiance qu’il m’a accordée et qui m’a fait avancer
scientifiquement, sans oublier ces bons moments si particuliers à chaque fois qu’il m’initiait
aux incontournables références de la littérature française.
Merci aussi aux membres de la Plate-forme Bioinformatique de Strasbourg, et à Serge
Uge pour son assiduité et sa persévérance contre les « trials and tribulations » de nos systèmes
informatique.

5
6
Résumé - Summary
Le travail décrit dans cette thèse porte sur le développement d’une nouvelle approche
informatique favorisant l’intégration d’algorithmes complémentaires, de données biologiques
ainsi que l’expertise humaine dans le but de la découverte de connaissances. En dépit des
analyses bioinformatique traditionnelles qui ont largement contribué à l’extraction
d’informations pertinentes, le contexte actuel, caractérisé d’une part par une variété de
données tant quantitativement que qualitativement, et d’autre part par l’impossibilité
d’automatiser l’expertise humaine pour les traiter, rend l’exploitation de ces données très
difficile et complexe. Dans ce travail, on introduit la notion de système expert basé sur la
connaissance et son application en Bioinformatique appliqué au problème des alignements
multiples de séquences protéiques, à travers le développement d’une application AlexSys.
La société de l’information et la dynamique de la découverte de connaissance
Le 21ème siècle nous a donné accès à un large éventail de données résultant de
technologies à haut débit dans des domaines tels que la génomique, transcriptomique,
protéomique, interactomique, etc .. Cette large gamme de données constitue une source
importante pour élucider, au niveau des systèmes, des réseaux moléculaires complexes
impliqués dans des processus fondamentaux de la vie. Un facteur essentiel pour bien mener
ces études réside en la faculté à organiser et valider ces données brutes, extraire les
informations les plus importantes, inférer de nouvelles hypothèses et théories ainsi que
présenter ces connaissances aux biologistes de manière fluide et intuitive.
7
Pour ce faire, nous devons clairement définir les différences qui existent entre données,
informations et connaissances, qui sont trois concepts différents mais souvent employés d’une
manière confuse. Les données peuvent être définies comme une liste de faits ou
d’observations sans contexte ni sens. Nous devons définir le contexte ainsi que les relations
qui existent entre ces données afin d’en extraire des informations utiles. Ainsi, l’information
peut être définie comme étant des données organisées qui donnent un sens à travers la
définition de leurs connexions. A un niveau plus évolué, la connaissance représente notre
capacité à intégrer et à assimiler ces informations.
Notre aptitude à acquérir de la connaissance afin de contribuer à de nouvelles
découvertes biologiques dépend de notre prédisposition à combiner et à corréler des données à
des proportions et échelles différentes. A titre d’exemple, les séquences biologiques doivent
être intégrées à des données structurales et informationnelles, mais également des données
d’expression, des réseaux d’interactions, des données phénotypiques et cliniques, etc .. Il est
donc clair que de nouvelles approches bioinformatiques sont nécessaires pour régir ces
concepts dans un contexte de biologie systémique et intégrative.
Des données à la connaissance : l’intelligence artificielle en bioinformatique
Le chemin vers la connaissance à travers l'exploration de données, l'intégration et
l'extraction d'information est un modèle commun dans de nombreux domaines, allant du
monde des affaires et de la culture, vers la recherche scientifique. Récemment, des méthodes
d'intelligence artificielle ont été appliquées dans ces domaines, afin de reconnaître
automatiquement les modèles et d'apprendre des concepts et des règles à partir de données, en
utilisant par exemple des méthodes d'inférence, d'ajustement du modèle, ou d’acquérir des
connaissances à travers des exemples. Ces méthodes constituent une approche
complémentaire aux méthodes informatiques classiques. Ces systèmes «intelligents» diffèrent
8
de la programmation classique par le fait qu'ils adaptent leur comportement en réaction aux
données qu'ils reçoivent comme entrée. L'entrée peut être par exemple, des données de bases
de données relationnelles (apprentissage supervisé / non supervisé), ou une série de données
d’apprentissage dont les résultats sont connus (apprentissage par renforcement).
Les systèmes experts (souvent connus sous le nom de systèmes basés sur la
connaissance) peuvent être construits par l’intégration d’une expertise humaine, représentée
par une combinaison de connaissances théoriques dans un domaine donné et une collection de
règles heuristiques de résolution de problèmes dont l’efficacité a été démontrée d’une manière
expérimentale. La connaissance est alors transformée en un format que l'ordinateur peut
utiliser pour résoudre des problèmes similaires. Ainsi, un système expert peut être décrit
comme étant un programme informatique qui simule le jugement et le comportement des
experts dans un domaine particulier et utilise leurs connaissances pour analyser et résoudre
automatiquement les problèmes.
Développement d’un système expert pour les alignements multiples des séquences
Grâce au travail réalisé dans cette thèse, un système expert basé sur la connaissance a
été élaboré et appliqué à la construction et l'analyse des alignements multiples de séquences
protéiques. L’analyse des protéines représente un cas d'étude idéal pour un certain nombre de
raisons dont les suivant :
• Les protéines sont des composants essentiels et incontournables en biologie
moléculaire, à l’origine d'une gamme impressionnante de fonctions essentielles, comme la
catalyse, le transport des nutriments, la reconnaissance et la transmission des signaux, etc
Disposant d’une protéine non encore caractérisée ou annotée, l'analyse de sa séquence

9
d'acides aminés, par l'intermédiaire d’alignements multiples, peut révéler des informations
importantes sur sa structure 3D et de son rôle fonctionnel dans la cellule.
• Les bases de données de séquences de protéines sont en croissance exponentielle et
représentent désormais une source importante de données brutes. Néanmoins, un certain
nombre de problèmes ont été identifiés. Les séquences ne sont pas équitablement réparties,
par exemple, certains organismes modèles et des familles de protéines fonctionnellement
importantes sont plus largement étudiés que d’autres. Les bases de données contiennent
également un grand nombre d'artefacts, tels que les fragments de séquences ou des séquences
mal prédites.
• l'analyse de séquences protéiques est l'un des domaines les plus étudiés en
bioinformatique. De nombreux algorithmes d'alignement ont été développés en réponse aux
défis posés par les nouvelles collections de données à grande échelle. Une comparaison de
plusieurs de ces méthodes, basée sur un ensemble d’alignements de référence, a mis en
exergue le fait qu'aucun algorithme, utilisé seul, n’a pas été capable de construire des
alignements de qualité pour tous les cas proposés par les données.
Ainsi, l'alignement multiple des protéines est une étape essentielle, rendue complexe par
la taille et la qualité des données disponibles et la grande variété d’algorithmes qui ont été
développés. Toutefois, nous avons acquis, durant ces années, une expertise importante dans ce
domaine qui est maintenant suffisamment mature pour le développement d’applications
orientées système expert. Les objectifs de cette thèse sont de mettre au point un système
expert pour tester, évaluer et optimiser toutes les étapes de la construction et l'analyse d'un
alignement multiple. Ceci a été réalisé par une combinaison de différentes approches
algorithmiques complémentaires et l'intégration de séquences hétérogènes, de données
structurales et fonctionnelles.
10
L’architecture utilisée pour le développement du système expert : UIMA
La première étape dans la conception de notre système expert a été le choix d'une
architecture de développement appropriée. Une première étude des systèmes disponibles a
permis d’identifier un certain nombre de possibilités, y compris (i) les "shells" par exemple C
Language Integrated Production System (CLIPS) ou le Java Expert System Shell (JESS), (ii)
la construction d'un système expert personnalisé en utilisant C ou Prolog. Nous avons choisi
UIMA (Unstructured Information Management Architecture), initialement développé par
IBM, qui fournit un système approprié pour la gestion dynamique de l'information par
l'intégration d'outils d'analyse spécifiques. Les outils à utiliser dans une situation donnée sont
choisis par des modules spéciaux qui décident du choix des algorithmes les plus appropriés à
utiliser selon le type d'informations traitées (processus dirigé par les données et non par les
algorithmes).
En utilisant cette architecture, un prototype de système expert a été conçu avec une
organisation à trois couches: (i) la collecte de données (ii) l'annotation de données et
l'extraction de l’information et (iii) la construction de l’alignement. Le prototype a fourni une
preuve de concept pour démontrer la pertinence de l’utilisation de UIMA pour la construction
de systèmes experts.
Construction de la base de connaissance
Une étape capitale dans tout système expert consiste en la construction de la base de
connaissances. Dans le cas d’AlexSys, nous avons exploité l'expertise acquise au sein de notre
groupe, concernant l'évaluation et la comparaison des algorithmes d'alignement. La base de
connaissances est donc élaborée en utilisant des ensembles de séquences qui ont servi à la
construction d’alignements de référence (BaliBase, OxBench) qui ont été construits par des
11
programmes d’alignement multiple et corrigés manuellement par des experts du domaine. En
outre, un nouvel ensemble de 230 alignements de référence a été ajouté qui introduit plus de
cas de figures difficile, ce qui représente des problèmes typiques rencontrés lors de
l'alignement de séquences à grande échelle. Une fonction objective a été définie pour mesurer
la qualité des alignements générés par rapport aux alignements de référence, et pour
déterminer les ensembles de données servant à l'algorithme d'apprentissage décrit ci-dessous.
En ce basant sur des connaissances antérieures, un certain nombre d'attributs a été
identifié qui caractérise les séquences utilisées pour l’apprentissage au sein d’AlexSys,
comme à titre d’exemple le nombre des séquences dans un ensemble, la longueur des
séquences, le nombre de structures / domaines fonctionnels, l'hydrophobicité, etc
L’apprentissage automatique
Un de nos principaux objectifs lors du développement d’AlexSys était d'améliorer
l'efficacité de la construction d'alignement multiple, en sélectionnant les programmes les plus
appropriés à utiliser le plus tôt possible dans le processus d'alignement. Pour ce faire, un
«moteur d'inférence intelligente» a été construit pour prédire a priori les performances de 6
programmes différents. Les programmes ont été sélectionnés connaissant leur capacité à bien
aligner des séquences et du fait de la complémentarité de leurs algorithmes. Les règles
utilisées dans le moteur d'inférence ont été élaborées en utilisant 348 cas de test d'alignement
dans la base de connaissances. Basée uniquement sur les attributs prédéfinis de l'ensemble des
séquences à aligner, nous identifions les programmes d’alignement les plus appropriés et qui
sont les plus susceptible de produire un alignement de qualité, en utilisant un algorithme
d'apprentissage automatique. La performance de certains algorithmes d'apprentissage
automatique a été évaluée dans une série d'expériences, aboutissant à la définition d'un
12
problème de classification binaire et le choix d'un arbre de décision comme méthode finale à
implémenter dans AlexSys
Evaluation du système expert
La précision de prédiction du moteur d’inférence implémenté dans AlexSys a été
évaluée dans un essai à grande échelle, en utilisant des alignements multiples construits dans
le cadre d’une nouvelle version du benchmark BaliBase. Deux approches différentes ont été
testées, une fondée sur des probabilités et une fondée sur des règles, pour identifier les
algorithmes d’alignement les plus appropriés à utiliser pour chaque ensemble de séquences.
Le moteur d'inférence basé sur la probabilité a donné lieu à une plus grande précision que le
système fondé sur des règles. La différence au niveau de la qualité de l'alignement entre ces
deux méthodes peut être expliquée par les connaissances de base construite dans les règles, ce
qui favorise en premier lieu les programmes d’alignement plus rapides au dépend des
programmes d’alignement plus précis.
L'efficacité et la précision du processus de construction d'alignement multiple ont
ensuite été évaluées en utilisant les alignements de référence en comparaisons avec les
programmes d’alignements utilisés seuls pour traiter les séquences. En termes de précision
d'alignement, les deux méthodes mises en œuvre dans AlexSys (probabilité et règles)
permettent d’aboutir à des alignements ayant des scores significativement plus élevés que la
plupart des programmes existants. Un seul programme donne lieu à des scores d’alignements
significativement plus élevés que AlexSys, mais qui nécessité près de 3 fois plus de temps
par rapport à AlexSys. Nos résultats sont donc très prometteurs et le système peut être utilisé
pour construire des alignements multiples de qualité supérieure en un temps «acceptable»
pour les projets à haut débit apportant ainsi un réel compromis entre qualité et rapidité
d’exécution.
13
Conclusions et perspectives
L'objectif de ce projet de thèse a été le développement d'un système expert afin de
tester, évaluer et d'optimiser toutes les étapes de la construction et l'analyse d'un alignement
multiple de séquences. Le nouveau système a été validé en utilisant des alignements de
référence et apporte une nouvelle vision pour le développement de logiciels en
bioinformatique: les systèmes experts basés sur la connaissance.
L'architecture utilisée pour construire le système expert est très modulaire et flexible,
permettant à AlexSys d'évoluer en même temps que de nouveaux algorithmes seront mis à
disposition. Ultérieurement, AlexSys sera utilisé pour optimiser davantage chaque étape du
processus d'alignement, par exemple en optimisant les paramètres des différents programmes
d’alignement. Le moteur d'inférence pourrait également être étendu à identification des
combinaisons d'algorithmes qui pourraient fournir des informations complémentaires sur les
séquences. Par exemple, les régions bien alignées par différents algorithmes pourraient être
identifiées et regroupées en un alignement consensus unique. Des informations structurales et
fonctionnelles supplémentaires peuvent également être utilisées pour améliorer la précision de
l’alignement final. Enfin, un aspect crucial de tout outil bioinformatique consiste en son
accessibilité et la convivialité d’utilisation. Par conséquent, nous sommes en train de
développer un serveur web, et un service web, nous allons également concevoir un nouveau
module de visualisation qui fournira une interface intuitive et conviviale pour toutes les
informations récupérées et construites par AlexSys.

14
Summary
The work described in this thesis concerns the development of a new vision of software
in bioinformatics, emphasizing the exploitation of complementary computer algorithms,
biological data and human expertise, for the purposes of knowledge discovery. Although
traditional bioinformatics analyses have provided the basis for the extraction of much useful
information, today’s data-rich context means that the knowledge discovery process is
complicated on the one hand, by the huge amount of heterogeneous data available, and on the
other hand, by the next-to-impossible automation of the human expertise required. Here, we
describe the development of a new knowledge-based expert system, AlexSys, for complex
bioinformatics analyses and its subsequent application to a crucial task: Multiple Sequence
Alignment.
Information revolution and the dynamics of knowledge discovery
The 21st century has given us access to vast amounts of data resulting from high
throughput technologies in fields such as genomics, transcriptomics, proteomics,
interactomics, etc. This wealth of data provides an important resource for system-level studies
of the complex molecular networks implicated in the fundamental processes of life.
Nevertheless, the success of such studies will depend on our ability to organize and validate
the raw data, to extract previously unknown information, to infer new hypotheses and to
present the results in a user-friendly way to the biologist.
In this context, the concepts of data, information and knowledge need to be clearly
distinguished. Data can be defined as a list of simple facts or observations without any context
or meaning. The context and the associations or relations between data are needed before the
data can be transformed into useful information. Thus, information can be considered as being
organized data that has been given meaning by way of the relationships between pieces of
data. For example, single entries in a database are data, whereas reports created from
intelligent database queries result in information. At a higher level, knowledge refers to the
facts and ideas that the human mind has learned. Thus acquiring knowledge can be defined as
assimilating information.
Our capability to acquire knowledge and make novel biological discoveries will depend
on our ability to combine and correlate diverse data sets of multiple proportions and scales.

15
For example, sequence data must be integrated with structure and function data, but also gene
expression data, pathways data, phenotypic and clinical data, and so on. Novel bioinformatics
approaches are clearly needed to handle these issues in integrative systems biology.
From data to knowledge: computational intelligence in bioinformatics
The road to knowledge through data exploration, integration and information extraction
is a common pattern in many areas from business and culture, to scientific research. Recently,
artificial intelligence methods have been applied in these fields, in order to automatically
recognize patterns and learn concept and rules from the data, using for example inference
methods, model fitting, or gaining knowledge through examples. Such methods constitute a
practical complementary approach to traditional computational analyses. These “intelligent”
systems differ from simple programmed ones by the fact that they adopt their behavior in
response to the input they get from the outer world. The input can be for example, data in
relational databases (supervised/unsupervised learning), or a training set of examples with
known outputs (reinforcement learning).
Computer-based expert systems (also known as knowledge-based systems) can be
constructed by obtaining human expert knowledge, represented by a combination of a
theoretical understanding in a given domain and a collection of heuristic problem-solving
rules that experience has shown to be effective. The knowledge is then transformed into a
form that a computer may use to solve similar problems. Thus, an expert system can be
described as a computer program that simulates the judgment and behavior of experts in a
particular field and uses their knowledge to provide automatic problem analysis to users of the
software.
Development of an expert system approach for multiple sequence alignment
During this thesis, a new knowledge-based expert system has been developed and
applied to the construction and analysis of multiple alignments of protein sequences. Protein
sequence analysis represents an ideal case study for a number of reasons:
Proteins are the molecular workhorses of biology, responsible for carrying out
a tremendous range of essential functions, such as catalysis, transportation of nutrients,
recognition and transmission of signals, etc. Given an uncharacterized protein, the
analysis of its amino acid sequence, via multiple alignment, can reveal important
information about its 3D structure and its functional role in the cell.
16
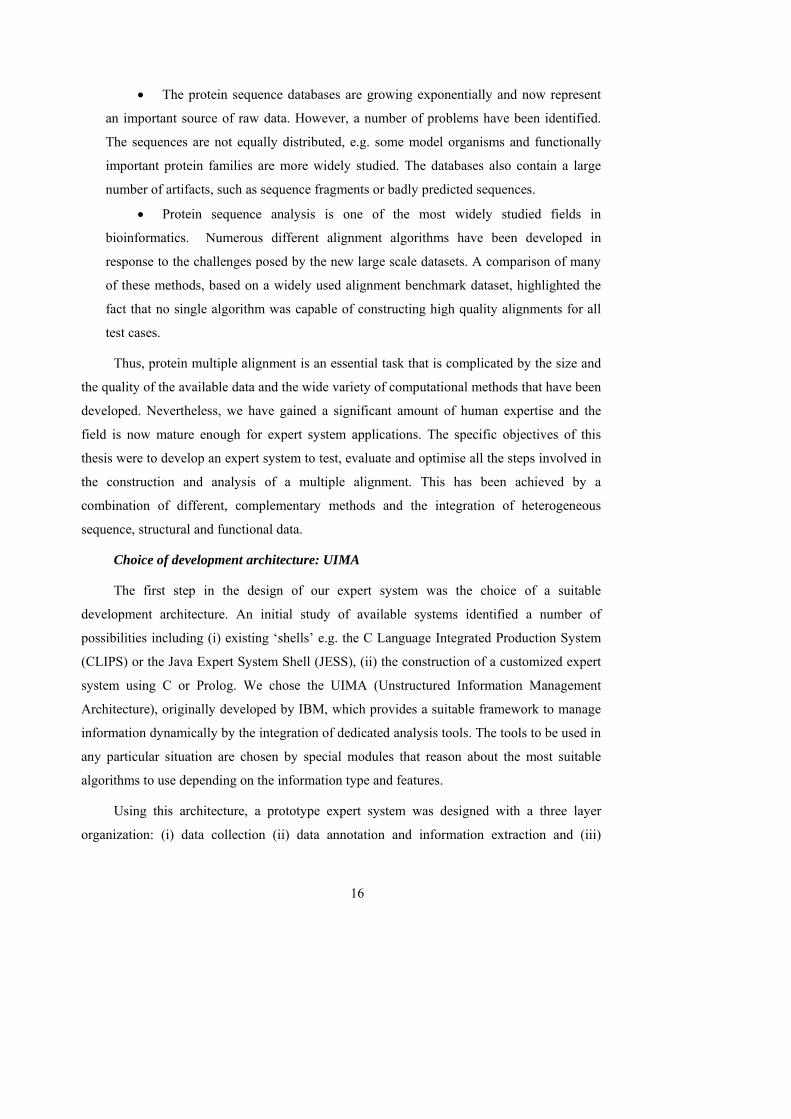
The protein sequence databases are growing exponentially and now represent
an important source of raw data. However, a number of problems have been identified.
The sequences are not equally distributed, e.g. some model organisms and functionally
important protein families are more widely studied. The databases also contain a large
number of artifacts, such as sequence fragments or badly predicted sequences.
Protein sequence analysis is one of the most widely studied fields in
bioinformatics. Numerous different alignment algorithms have been developed in
response to the challenges posed by the new large scale datasets. A comparison of many
of these methods, based on a widely used alignment benchmark dataset, highlighted the
fact that no single algorithm was capable of constructing high quality alignments for all
test cases.
Thus, protein multiple alignment is an essential task that is complicated by the size and
the quality of the available data and the wide variety of computational methods that have been
developed. Nevertheless, we have gained a significant amount of human expertise and the
field is now mature enough for expert system applications. The specific objectives of this
thesis were to develop an expert system to test, evaluate and optimise all the steps involved in
the construction and analysis of a multiple alignment. This has been achieved by a
combination of different, complementary methods and the integration of heterogeneous
sequence, structural and functional data.
Choice of development architecture: UIMA
The first step in the design of our expert system was the choice of a suitable
development architecture. An initial study of available systems identified a number of
possibilities including (i) existing ‘shells’ e.g. the C Language Integrated Production System
(CLIPS) or the Java Expert System Shell (JESS), (ii) the construction of a customized expert
system using C or Prolog. We chose the UIMA (Unstructured Information Management
Architecture), originally developed by IBM, which provides a suitable framework to manage
information dynamically by the integration of dedicated analysis tools. The tools to be used in
any particular situation are chosen by special modules that reason about the most suitable
algorithms to use depending on the information type and features.
Using this architecture, a prototype expert system was designed with a three layer
organization: (i) data collection (ii) data annotation and information extraction and (iii)
17
alignment construction and analysis. The prototype provided a proof-of-concept test case for
the suitability of UIMA for building expert systems.
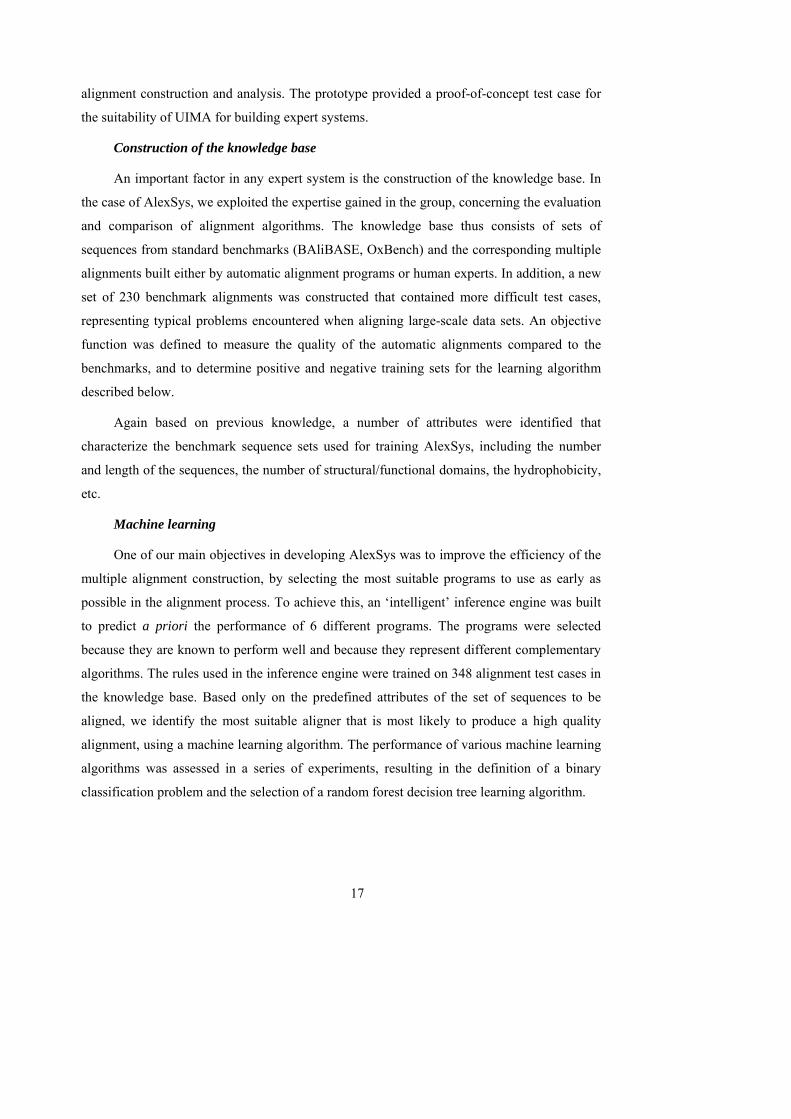
Construction of the knowledge base
An important factor in any expert system is the construction of the knowledge base. In
the case of AlexSys, we exploited the expertise gained in the group, concerning the evaluation
and comparison of alignment algorithms. The knowledge base thus consists of sets of
sequences from standard benchmarks (BAliBASE, OxBench) and the corresponding multiple
alignments built either by automatic alignment programs or human experts. In addition, a new
set of 230 benchmark alignments was constructed that contained more difficult test cases,
representing typical problems encountered when aligning large-scale data sets. An objective
function was defined to measure the quality of the automatic alignments compared to the
benchmarks, and to determine positive and negative training sets for the learning algorithm
described below.
Again based on previous knowledge, a number of attributes were identified that
characterize the benchmark sequence sets used for training AlexSys, including the number
and length of the sequences, the number of structural/functional domains, the hydrophobicity,
etc.
Machine learning
One of our main objectives in developing AlexSys was to improve the efficiency of the
multiple alignment construction, by selecting the most suitable programs to use as early as
possible in the alignment process. To achieve this, an ‘intelligent’ inference engine was built
to predict a priori the performance of 6 different programs. The programs were selected
because they are known to perform well and because they represent different complementary
algorithms. The rules used in the inference engine were trained on 348 alignment test cases in
the knowledge base. Based only on the predefined attributes of the set of sequences to be
aligned, we identify the most suitable aligner that is most likely to produce a high quality
alignment, using a machine learning algorithm. The performance of various machine learning
algorithms was assessed in a series of experiments, resulting in the definition of a binary
classification problem and the selection of a random forest decision tree learning algorithm.

18
Evaluation of the expert system
The prediction accuracy of the inference engine in AlexSys was evaluated in a large-
scale test, using multiple alignments built in the context of a new version of BaliBase
benchmark. Two alternative approaches were tested, based on probability- and rule-based
methods, for identifying the most suitable aligner to use for each alignment set. The
probability-based inference engine resulted in higher accuracy than the rule-based system.
The difference in alignment accuracy could be explained by the background knowledge built
into the rules, which favors a shorter running time when more than one aligner is predicted to
give a strong performance.
The efficiency and accuracy of the multiple alignment construction process were then
evaluated using the standard benchmarks and compared to some of the most widely used
alignment programs. In terms of alignment accuracy, both methods implemented in AlexSys
(probability- and rule-based) achieved significantly higher scores than most of the existing
programs. Only one program scored significantly higher than AlexSys, but required almost 3
times as much CPU time compared to AlexSys. Our results are thus very promising and the
system can be used to construct high quality multiple alignment in an “acceptable time” for
high throughput projects.
Conclusions and Perspectives
The objective of this PhD project was the development of an integrated expert system to
test, evaluate and optimize all the stages of the construction and the analysis of a multiple
sequence alignment. The new system was validated using standard benchmark cases and
brings a new vision to software development in Bioinformatics: knowledge-guided systems.
The architecture used to build the expert system is highly modular and flexible,
allowing AlexSys to evolve as new algorithms are made available. In the future, AlexSys will
be used to further optimize each stage of the alignment process, for example by optimizing
the input parameters of the different algorithms. The inference engine could also be extended
to identify combinations of algorithms that could potentially provide complementary
information about the input sequences. For example, well aligned regions from different
aligners could be identified and combined into a single consensus alignment. Additional
structural and functional information could also be exploited to improve the final alignment
accuracy. Finally, a crucial aspect of any bioinformatics tool is its accessibility and usability.

19
Therefore, we are currently developing a web server, and a web services based distributed
system. We will also design a novel visualization module that will provide an intuitive, user-
friendly interface to all the information retrieved and constructed by AlexSys.
20
RÉSUMÉ ‐ SUMMARY.............................................................................................................6
LIST OF FIGURES .................................................................................................................. 25
LIST OF TABLES .................................................................................................................... 27
INTRODUCTION ................................................................................................................... 28
CHAPTER 1........................................................................................................................... 29
1. INFOSPHERE, INFOGLUT AND KNOWLEDGE DISCOVERY: ............................................... 29
WHEN THE INFORMATION AGE MEETS THE POSTGENOMIC ERA.......................................... 29
1.1. THE INFOSPHERE AND THE INFORMATION AGE ...................................................................... 30
1.1.1. Introduction ........................................................................................................ 30
1.1.2. Information Systems........................................................................................... 31
1.1.3. The information revolution................................................................................. 33
1.1.4. The road to Knowledge is paved with Data that generates Information ........... 34
1.1.5. Knowledge Discovery via Artificial Intelligence .................................................. 36
1.2. THE BIOLOGICAL INFOSPHERE: THE GENOMIC REVOLUTION ..................................................... 37
1.2.1. Bioinformatics in the pre‐genomic era ............................................................... 37
1.2.2. Genome sequencing projects and biological data growth ....................................... 44
1.2.2. Bioinformatics in the post‐genomic era.............................................................. 46
1.3 CONCLUSION................................................................................................................... 51
CHAPTER 2........................................................................................................................... 52
2. BIOLOGICAL DATABASES:.............................................................................................. 52
DATA STORAGE AND WAREHOUSING IS GREAT, DATA QUALITY IS BETTER .......................... 52
2.1 DATA COLLECTION........................................................................................................... 54
2.1.1. Data warehouses ................................................................................................ 54
2.1.2. Distributed databases......................................................................................... 55
2.2. DATA INTEGRATION AND VALIDATION.................................................................................. 56
2.3. DATA EXTRACTION AND QUERYING: THE MORE WE FORMALIZE, THE BETTER WE LEARN!............. 58
CHAPTER 3........................................................................................................................... 60
3. FROM DATA INTEGRATION TO KNOWLEDGE DISCOVERY .............................................. 60
THE ROLE OF COMPUTATIONAL INTELLIGENCE IN BIOINFORMATICS.................................... 60
21
3.1. DATA MINING IN BIOINFORMATICS...................................................................................... 60
3.1.1. Classification....................................................................................................... 62
3.1.2. Clustering............................................................................................................ 62
3.1.3. Association rules ................................................................................................. 62
3.1.4. Sequential patterns............................................................................................. 63
3.2. TEXT MINING IN BIOINFORMATICS: FOCUS ON LITERATURE...................................................... 63
3.2.1 Functional annotation ............................................................................................... 64
3.2.2 Cellular localization ................................................................................................... 64
3.2.3 DNA‐expression arrays .............................................................................................. 64
3.2.4 Protein interactions ................................................................................................... 65
3.2.5 Molecular medicine ................................................................................................... 65
3.3. THE ROLE OF MACHINE LEARNING IN MODERN BIOINFORMATICS ............................................. 66
3.1.1. Supervised learning ............................................................................................ 66
3.1.2. Unsupervised learning ........................................................................................ 67
CHAPTER 4........................................................................................................................... 69
4. KNOWLEDGE BASED EXPERT SYSTEMS IN BIOINFORMATICS ......................................... 69
4.1. EXPERT SYSTEMS FOR SYSTEMS‐LEVEL BIOLOGY ..................................................................... 69
4.2. EXPERT SYSTEMS: REAL‐WORLD APPLICATIONS...................................................................... 71
4.2.1 Medical diagnostics ................................................................................................... 71
4.2.2. DNA sequence analysis: Forensic science ................................................................. 72
4.2.3. Protein sequence analysis ........................................................................................ 73
4.2.4. Genome annotation ................................................................................................. 76
4.3. EXPERT SYSTEM DESIGN: FOCUS ON KNOWLEDGE‐BASED SYSTEMS........................................... 77
CHAPTER 5........................................................................................................................... 80
5. MULTIPLE ALIGNMENT OF PROTEIN SEQUENCES: A CASE STUDY FOR EXPERT SYSTEMS IN
BIOINFORMATICS.......................................................................................................................... 80
5.1. INTRODUCTION................................................................................................................ 80
5.2. THE PROTEIN WORLD........................................................................................................ 81
5.2.1. Protein sequence, structure and function........................................................... 81
5.2.2. Protein evolution ................................................................................................ 83
5.2.3. Protein comparative analysis ............................................................................. 84

22
5.3. MULTIPLE SEQUENCE ALIGNMENT....................................................................................... 84
5.4. MULTIPLE ALIGNMENT APPLICATIONS.................................................................................. 86
5.4.1. Phylogenetic studies ........................................................................................... 86
5.4.2. Comparative genomics ....................................................................................... 87
5.4.3. Gene prediction and validation .......................................................................... 89
5.4.4. Protein function characterization ....................................................................... 91
5.4.5. Protein 2D/3D structure prediction .................................................................... 93
5.4.6. RNA structure and function ................................................................................ 94
5.4.7. Interaction networks........................................................................................... 96
5.4.8. Genetics .............................................................................................................. 97
5.4.9. Drug discovery, design........................................................................................ 97
CHAPTER 6........................................................................................................................... 99
6. MULTIPLE SEQUENCE ALIGNMENT ALGORITHMS .......................................................... 99
6.1. MULTIPLE ALIGNMENT CONSTRUCTION................................................................................ 99
6.1.1 Progressive multiple alignment ............................................................................. 99
6.1.2 Iterative strategies ............................................................................................... 103
6.1.3 Co‐operative strategies ........................................................................................ 103
6.2. ALIGNMENT PARAMETERS ............................................................................................... 104
6.2.1 Scoring matrices .................................................................................................... 104
6.2.2 Gap schemes........................................................................................................... 105
6.2.3 Alignment statistics ................................................................................................ 106
6.3. MULTIPLE ALIGNMENT QUALITY ....................................................................................... 107
6.3.1. Multiple alignment objective scoring functions................................................ 107
6.3.2. Determination of reliable regions ................................................................... 109
6.3.2. Benchmarking................................................................................................... 110
6.3.3. Comparison of multiple alignment programs................................................... 114
MATERIALS AND METHODS ............................................................................................... 117
CHAPTER 7......................................................................................................................... 118
7.1 COMPUTING RESOURCES................................................................................................. 118
7.1.1 Servers................................................................................................................... 118
7.1.2 Databases ............................................................................................................. 118

23
7.1.3 DATA RETRIEVAL ............................................................................................................ 119
7.2 MSA PROGRAMS........................................................................................................... 120
7.3 OTHER BIOINFORMATICS PROGRAMS AND UTILITIES ............................................................. 122
7.3.1 MACSIMS ................................................................................................................. 122
7.3.2 Biojava..................................................................................................................... 123
7.4 ALIGNMENT BENCHMARKS .............................................................................................. 123
7.4.1 BAliBASE................................................................................................................ 123
7.4.2 OXBench................................................................................................................ 124
7.5 WEKA MACHINE LEARNING PACKAGE................................................................................. 124
7.6 UIMA: UNSTRUCTURED INFORMATION MANAGEMENT ARCHITECTURE.................................. 125
7.6.1 The Architecture, the Framework and the SDK..................................................... 125
7.6.2 Analysis Engines, Annotators and Results ............................................................ 127
7.6.3 Representing Analysis Results in the CAS.............................................................. 127
7.6.4 Component Descriptors......................................................................................... 128
7.6.5 Aggregate Analysis Engines .................................................................................. 128
7.6.6 Application building and Collection Processing .................................................... 129
RESULTS AND DISCUSSION................................................................................................. 130
PREAMBLE: ALEXSYS DESIGN, IMPLEMENTATION AND EVALUATION .................................................. 131
CHAPTER 8......................................................................................................................... 133
8. CREATION OF THE ALEXSYS KNOWLEDGE BASE ........................................................................ 133
8.1 MACHINE LEARNING INPUT ............................................................................................. 133
8.1.1 What is a concept (Class)? .................................................................................... 133
8.1.2 What is an example (Instance)?............................................................................ 134
8.1.3 What is an attribute? ............................................................................................ 135
8.2 ALEXSYS INSTANCE SELECTION ......................................................................................... 136
8.3 ALEXSYS ATTRIBUTE SELECTION ........................................................................................ 137
8.4 ARFF FORMAT .............................................................................................................. 141
CHAPTER 9......................................................................................................................... 143
9. MACHINE LEARNING IN ALEXSYS........................................................................................... 143
9.1 Defining a suitable model ..................................................................................... 143
9.2 Constructing a Decision Tree................................................................................. 146
24
9.2.1 AlexSys decision tree algorithm ............................................................................ 149
9.3 MODEL AND MACHINE LEARNING EVALUATION .................................................................. 150
9.3.1 AlexSys Performance and Evaluation.................................................................... 151
9.4 MODEL CREATION AND ACCESS THROUGH JAVA API ............................................................ 153
CHAPTER 10....................................................................................................................... 155
10. EXPERT SYSTEM CONSTRUCTION ................................................................................. 155
10.1 EXPERT SYSTEM ARCHITECTURE ........................................................................................... 155
10.2 UIMA MODULE CREATION ................................................................................................. 156
10.2.1 AlexSys Type System.............................................................................................. 156
10.2.2 AlexSys Analysis Engine Descriptor........................................................................ 157
10.2.3 AlexSys Analysis Engine Annotator........................................................................ 158
10.3 METADATA LAYER............................................................................................................. 159
10.4 ALEXSYS COMPUTATIONAL CORE ......................................................................................... 159
10.4.1 Input data handling (IDH)..................................................................................... 159
10.4.2 Annotation and Information Extraction (AIE)....................................................... 160
10.4.3 Multiple Alignment Construction (MAC) .............................................................. 160
10.5 ALEXSYS INSTALLATION AND USAGE..................................................................................... 163
11. ALEXSYS EVALUATION.................................................................................................. 164
11.1 CONSTRUCTING NEW TRAINING AND TEST SETS ...................................................................... 165
11.2 EVALUATION OF MSA QUALITY AND EFFICIENCY..................................................................... 169
CONCLUSION AND PERSPECTIVES ...................................................................................... 172
FRAMEWORK CHOICE FOR THE DEVELOPMENT OF THE KNOWLEDGE BASED SYSTEM ............................. 174
TAKING INTO ACCOUNT THE ALIGNMENT CONTEXT: KNOWLEDGE ENHANCEMENT................................. 175
ALIGNMENT ALGORITHM INTEGRATION ......................................................................................... 176
MULTIPLE ALIGNMENT PROGRAM PARAMETERS............................................................................. 177
ALEXSYS ADDITIONAL FEATURES................................................................................................... 178
ALEXSYS IN THE CLOUDS............................................................................................................. 179
REFERENCES ...................................................................................................................... 181
APPENDIX.......................................................................................................................... 210

25
List of Figures
Figure 1 : Data, Information and Knowledge
Figure 2 : Conceptual hierarchy of data, information and knowledge
Figure 3 : Protein function annotation typical workflow
Figure 4 : Human genome project timeline
Figure 5 : The Omix matrix and Integromics
Figure 6 : Some of the most well known Machine learning algorithms applied in
Bioinformatics
Figure 7 : Typical expert system architecture, components and human interface
Figure 8 : Different levels of protein structure
Figure 9 : Example alignment of a set of 7 hemoglobin domain sequences
Figure 10 : Alternative hypotheses for the rooting of the tree of life
Figure 11 : UCSC Genome browser display
Figure 12 : vALId display of a multiple alignment of plant alcohol dehydrogenases
Figure 13: Multiple alignment of the BBS10 protein and homologs found in in-depth
database searches
Figure 14 : Multiple sequence alignment of NR ligand binding domains and class-
specific features
Figure 15: S2S display of a multiple alignment of the RNA element conserved in the
SARS virus genome
Figure 16: The basic progressive alignment procedure
Figure 17 : Overview of different progressive alignment algorithms
Figure 18 : PAM 250 Matrix
Figure 19 : Schematic view of the MACSIMS alignment annotation system.
Figure 20 : UIMA Component Architecture
26
Figure 21 : Input data examples for machine learning algorithms
Figure 22 : Example ARFF files.
Figure 23 : Input data representation in Weka.
Figure 24 : Tree construction for the weather data
Figure 25 : Expanded tree stumps for the weather data
Figure 26 : Final Decision tree
Figure 27 : Evaluation of the Random Forest algorithm for the classification of aligner
performance
Figure 28 : Simple Java code showing how to implement a classifier
Figure 29 : Interaction between UIMA and public available APIs
Figure 30 : An example of a Type System (TS) in AlexSys
Figure 31 : Analysis Engine Descriptor Editor
Figure 32 : Flat and Layered representation of AlexSys
Figure 33 : General statistics computed for the benchmark alignments
Figure 34 : Reference alignment of representative sequences of the p53/p63/p73 family
Figure 35 : Overall alignment performance for each of the MSA programs tested.
Figure 36 : Evaluation of alignment accuracy and efficiency for AlexSys and the six
existing aligners.
Figure 37 : Back-To-Back comparison of AlexSys and other MSA programs
Figure 38 : AlexSys future infrastructure enhancement

27
List of Tables
Table 1: Some examples of ‘-omics’ data resources
Table 2: Current state of the art for multiple sequence alignment methods
Table 3: Number of test cases in version 3 of the BAliBASE alignment benchmark
Table 4: Attributes used to describe the input data in AlexSys
Table 5: Correctly and incorrectly classified instances for each aligner

28
Introduction
Chapter 1 : Infosphere, Infoglut and Knowledge Discovery
29
Chapter 1
1. Infosphere, Infoglut and Knowledge Discovery:
When the Information Age meets the Postgenomic Era
Among the jungle of terms experts use to qualify the world we live in, like the atomic
age, the postindustrial era, the space age, to cite a few, the “information age” has become a
standard expression. Today, we are all surrounded by gadgets, tools and devices that allow us
to be informed and stay connected to anyone, anywhere and anytime. Accessing media of all
kinds has become a human reflex that some scientists qualify as dangerous [1], because we
are not in control and it is the new technologies that shape our lives. To quote some examples,
hundreds to thousands of television channels are transmitting both correct and incorrect
information, social networks and information superhighways are linking people around the
world and bringing down geographical frontiers (Facebook, Myspace, Twitter and thousands
of others), and more recently, virtual reality is bringing sight, sound, and other senses to the
electronic experience.
Today, software companies and suppliers have dethroned computer makers, while audio
and video equipment industries are turning into entertainment companies. We are living in a
world where hundreds of products come from the information sector instead of manufacturing
since we work with computers and we entertain ourselves with electronic devices.
Human beings are thus surrounded with various forms of information sources, from
books, magazines, newspapers to CDs, DVDs, websites, docuramas, databases, etc. to the
point where, in the wealthier countries, new topics of discussion are arising, for example the
future of newspapers in the internet age. While the format with which the information is

Chapter 1 : Infosphere, Infoglut and Knowledge Discovery
30
provided is certainly an interesting subject, it might be more important to consider what to do
with all the information: do we really need this amount of data, how we can manage it, how to
transform it, how to benefit from it, who is actually undergoing these data and who is
profiting from it, what does it bring to humanity and how? All these questions are now
occupying more and more scientists, from philosophers, to linguists, to biologists … One
recurring theme is the need to conceptualize and to distinguish between data, information and
knowledge.
In this chapter we will introduce and relate two distinct, but at the same time, analogous
historical changes. First, we will describe the infosphere in which we live, introducing the
information age, and how it impacts our everyday life (section 1.1). We will try then to map
these concepts in the biological field, where the postgenomic era constitutes a good “case
study” for the information revolution. Indeed, the emergence of omics science, based on high
throughput technologies, has led to a torrent of new data, and new challenges in terms of data
integration and analysis (section 1.2).
1.1. The Infosphere and the information age
1.1.1. Introduction
The data that now flows around the world does not generally come in raw format but is
encrypted and the information it contains is often hidden and needs decryption. In this lock
and keys information context, even if the data is made public and thus freely available, only
those that hold the keys can benefit from the knowledge underneath the information stack.
Data, information and knowledge are different concepts that need to be understood, so
that we can correctly place ourselves in this informational hierarchy. The terms that define
these concepts are often misused: data, information and knowledge are often employed to talk
about the same thing, despite the fact that they are distinct. When acquiring a data message, if
we do not have enough contextual background to decrypt it, we may not be “informationally”
armed to react in a suitable manner. The French poet Eugène Emile Paul Grindel known as
Paul Eluard, in his famous diction “La Terre est bleue comme une orange” which means
literally “The earth is blue like an orange” was neither blind nor ignorant about the color of an
orange or the earth’s size. Understanding the sentence is not directly related to its simple
decryption, prior knowledge is needed, and the message, as a result can then generate
Chapter 1 : Infosphere, Infoglut and Knowledge Discovery
information that will change that knowledge. It is therefore important to distinguish between
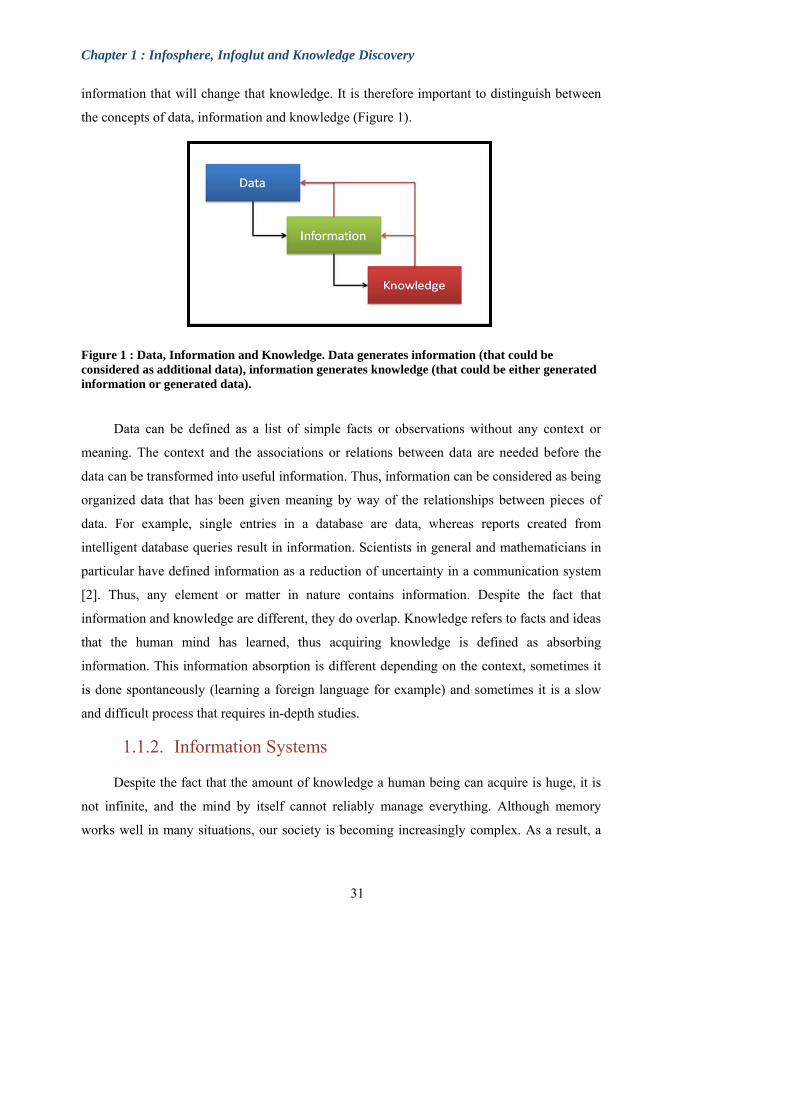
the concepts of data, information and knowledge (Figure 1).
Figure 1 : Data, Information and Knowledge. Data generates information (that could be considered as additional data), information generates knowledge (that could be either generated information or generated data).
Data can be defined as a list of simple facts or observations without any context or
meaning. The context and the associations or relations between data are needed before the
data can be transformed into useful information. Thus, information can be considered as being
organized data that has been given meaning by way of the relationships between pieces of
data. For example, single entries in a database are data, whereas reports created from
intelligent database queries result in information. Scientists in general and mathematicians in
particular have defined information as a reduction of uncertainty in a communication system
[2]. Thus, any element or matter in nature contains information. Despite the fact that
information and knowledge are different, they do overlap. Knowledge refers to facts and ideas
that the human mind has learned, thus acquiring knowledge is defined as absorbing
information. This information absorption is different depending on the context, sometimes it
is done spontaneously (learning a foreign language for example) and sometimes it is a slow
and difficult process that requires in-depth studies.
1.1.2. Information Systems
Despite the fact that the amount of knowledge a human being can acquire is huge, it is
not infinite, and the mind by itself cannot reliably manage everything. Although memory
works well in many situations, our society is becoming increasingly complex. As a result, a
31
Chapter 1 : Infosphere, Infoglut and Knowledge Discovery
32
single person’s memory is now too unreliable, since the known facts are generally too random
to satisfy the requirements of many situations. Easy and rapid access to external information
is thus playing an increasingly important role in society and knowing the answer is strongly
related to our ability to acquire the pertinent information.
As a consequence, the discipline of Information Systems (IS) has developed recently to
study the methods that people employ to organize, manage, and share information. It was
initially conceived to complement people’s mental functions, memory or even speech. A vast
array of techniques has been employed that can be divided into a number of different classes
[3]:
The first class covers the numerous techniques used to gather information, including
those used by journalists, researchers, and spies; and, much more elaborately, the activities of
research organizations, laboratories, surveys, and censuses, to name only a few.
The second class consists of techniques for naming, classifying, and organizing pieces
of information to make them comparable and accessible in an effective way. The need to
classify grows in proportion to the quantity of information, so classification techniques are
normally connected with corporations that manage vast quantities of information, for example
the police, the patent office, or even phone businesses.
Because information can take numerous forms, the third class consists of all of the
techniques used to transform information from one form into another one and to screen it in a
new way. Examples include turning narrative descriptions into lists, lists into statistical tables,
statistics into graphs, or graphs into three-dimensional objects. There are numerous techniques
that transform and output information, from engineering drawing to polling to mapmaking,
and numerous corporations that do this sort of function.
The fourth class covers techniques created for storing and retrieving information, from
historical artifacts such as dictionaries and encyclopedias, schedules and calendars, phone
publications and directories, via corporations such as museums, archives, libraries, to the
more recent electronic storage in databases.
Finally, the fifth class consists of techniques for communicating information. In this
class, some methods, for example the postal system, messengers, the telegraph, the phone, or
electronic mail, transmit information from individual to individual, while others, e.g.
newspapers, radio, television, or the world wide web, broadcast information to a wider public.
Chapter 1 : Infosphere, Infoglut and Knowledge Discovery
33
This classification is only one example, and is certainly not the only one. Many
information systems are dedicated to more than one function at a time, for example,
newspapers are at the same time a means of communicating information and an information
system that stores old news. In this sense, it is important to distinguish the form the
information takes within the systems that handle it. What makes the complexity of the
information age is the amount of data generated and the increasing number of systems
required for its management, as well as the objectives that organizations employ these
systems for.
1.1.3. The information revolution
The dynamic, evolutionary nature of data and information prompts us to ask questions
about how everything started, what was the start point of this incredible information explosion
and how individuals caused and managed this phenomenon? According to Michael Riordan
and Lillian Hoddeson, two historians, today’s information age started with the invention of
transistors in the beginning of the fifties. Even this may be too recent a timeline to explain the
significant changes in our culture brought about by the information revolution. Others have
suggested for more ancient origins and each historian has a different date in mind. Many link
the information age to the late nineteenth century, with the evolution of railroads and other
large business enterprises spread across a continent. Others focus on the printing press or the
introduction of, telegraphs and steam powered newspaper presses in the first half of the
nineteenth century.
Since there seems to be little agreement about the beginning of the information age, a
possible question that we can ask is: did the information age really begin or is it only a means
that humans have invented to label what they cannot really explain? Although our current
vision of the information sphere is largely influenced by what we hear or see via new
technologies, such as the internet and other media, the data stream is rooted in ancient
civilizations. Consider for example, the Egyptian or Maya hieroglyphics that continue to
fascinate scientists today, providing new information and knowledge about their life styles,
beliefs and traditions. Thus, we might conclude that the information age had no beginning, for
it is as old as humankind.
Nevertheless, there have been periods in history that witnessed rapid accelerations or
revolutions, related to the amount of information that people had access to and the creation of
Commentaire [MSOffice1] : Ref ?
Chapter 1 : Infosphere, Infoglut and Knowledge Discovery
34
new information systems to handle it. For example, the development of the written alphabet
certainly contributed to the acceleration of information accumulation. Today, we live in what
has been called the Information Age, also known as the Computer Age or the Information Era,
characterized by the ability of individuals to transfer information freely, and to have instant
access to knowledge that would have been difficult or impossible to find previously.
1.1.4. The road to Knowledge is paved with Data that generates
Information
There are a huge number of diverse purposes for which individuals extract and use
information. One of these is simply possession and the satisfaction it procures, for example,
extensive libraries, collections, maps or even computer programs. In addition, having the
information procures prestige; learning and especially initiation into impenetrable knowledge
spheres of a given sector’s secrets have conferred prestige and impressed the badly informed
individuals throughout history, and even created international challenges between nations
running after prestigious scientific discoveries. A good example is the famous challenge that
opposed Russians and Americans while competing to be the forerunners of space exploration,
and the millions of people sitting in front of their TVs watching Neil Armstrong stepping onto
the moon for the first time.
Time is also an important factor in the equation. Most information is employed at a
given point in time within a dynamic situation, for example in business, law, medicine, war
etc., and generally results in some sort of decision making. The time required to extract and
use the information depends on the quality of the raw data and the efficiency with which it
was planned.
An efficient use of information involves processing, classification, storage, extraction
and broadcasting of information rapidly and with minimal cost and effort. To achieve this, the
information must be condensed, codified and structured in a methodical manner. Descriptive
information has to be converted into data which can be represented in several formats such as
words, numbers, alphanumeric codes, symbols, graphics, maps, scientific illustrations etc. The
process is an iterative one: every time we use or generate data, and when we consume data,
we produce new information that could be used by others and transformed into additional
Chapter 1 : Infosphere, Infoglut and Knowledge Discovery
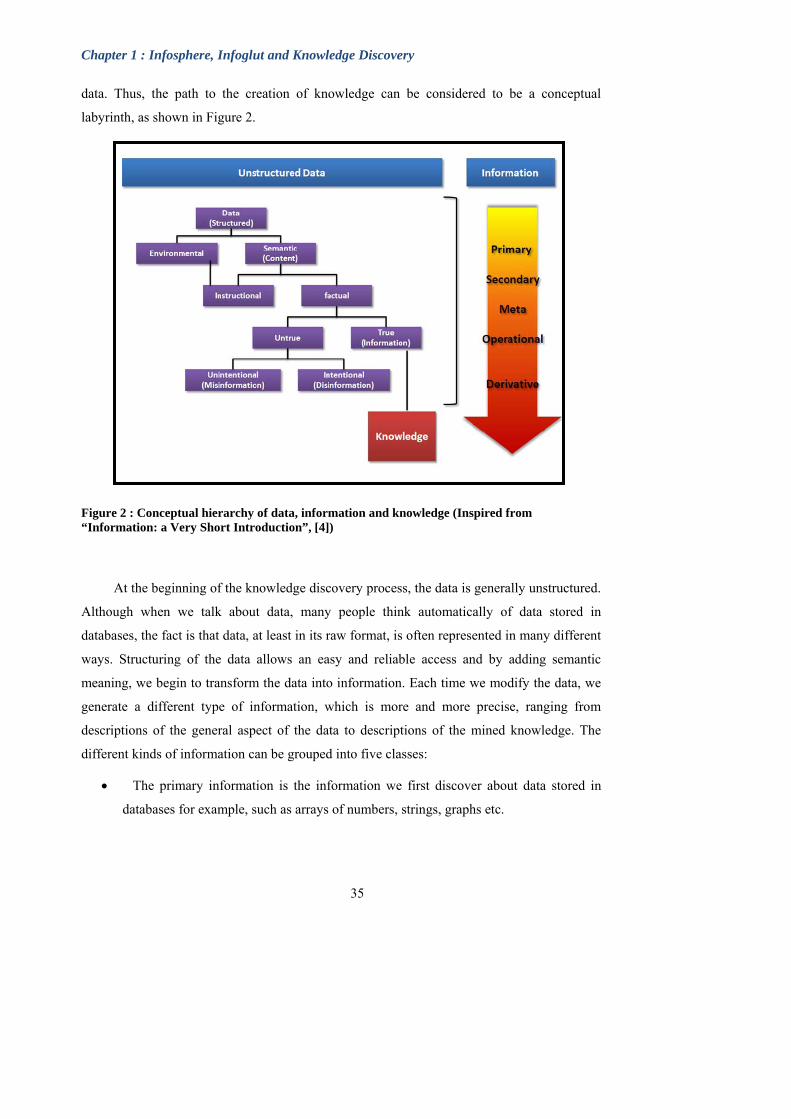
data. Thus, the path to the creation of knowledge can be considered to be a conceptual
labyrinth, as shown in Figure 2.
Figure 2 : Conceptual hierarchy of data, information and knowledge (Inspired from “Information: a Very Short Introduction”, [4])
At the beginning of the knowledge discovery process, the data is generally unstructured.
Although when we talk about data, many people think automatically of data stored in
databases, the fact is that data, at least in its raw format, is often represented in many different
ways. Structuring of the data allows an easy and reliable access and by adding semantic
meaning, we begin to transform the data into information. Each time we modify the data, we
generate a different type of information, which is more and more precise, ranging from
descriptions of the general aspect of the data to descriptions of the mined knowledge. The
different kinds of information can be grouped into five classes:
The primary information is the information we first discover about data stored in
databases for example, such as arrays of numbers, strings, graphs etc.
35
Chapter 1 : Infosphere, Infoglut and Knowledge Discovery
36
The secondary information is the inverse of the primary information, characterized
by its absence. As Carl Sagan said “Absence of Evidence is not Evidence of Absence”
(“The Fine Art of Baloney Detection “, Chapter 12, page 221). The absence of data
describing a problem, does not mean that we don’t have information about it, since the
absence itself could be sometimes much more informative.
The meta-information refers to a set of indications about the nature of some other
information; it generally describes properties such as location, format, updates,
availability, etc.
The operational information describes operations of the whole data system and the
system’s performance (the dynamics of the information).
The derivative information is extracted from the other types of information, either
directly or indirectly. It is generally what we obtain as inferential evidence or as a
result of a comparative or quantitative analysis.
The final concept of knowledge is more difficult to define. Knowledge is defined by the
Oxford English Dictionary as (i) expertise and skills acquired by a person through experience
or education; the theoretical or practical understanding of a subject; (ii) what is known in a
particular field or in total; facts and information; or (iii) awareness or familiarity gained by
experience of a fact or situation.
1.1.5. Knowledge Discovery via Artificial Intelligence
The knowledge discovery process is often a very time consuming task, depending on the
domain in which we evolve and the amount of the raw data available. As a consequence,
scientists have tried to emulate human intelligence using sophisticated algorithms generally
referred to as Artificial Intelligence approaches, in order to automatically achieve either
everyday tasks or more specific missions such as:
Making decisions, diagnosing, scheduling and planning using expert systems or neural
networks
Evolving solutions to very complex problems using genetic algorithms
Learning from a single previous example, where this is particularly relevant and using it
to solve a current problem using case-based reasoning
Commentaire [MSOffice2] : Ref ?

Chapter 1 : Infosphere, Infoglut and Knowledge Discovery
37
Recognizing hand writing or understanding sensory data, simulated by artificial neural
networks
Identifying cause and effect relationships using data mining
Artificial intelligence technologies will be discussed in more detail in chapters 2-4.
1.2. The Biological infosphere: the genomic revolution
Since the beginning of this century, the biological data landscape has been transformed
by the rapid development of new high throughput genome technologies, including genome
sequencing, gene expression analysis, proteomics, interactomics, etc. As a consequence,
bioinformatics is playing an increasing active role in the analysis of modern biology. It is now
impossible to develop research initiatives or studies without having a preceding search or
consultation of several bioinformatics resources. The reason is that the large-scale data
produced by today’s genome technologies can only be used efficiently with various kinds of
computerized analysis workflows. As a consequence, new computational strategies are being
developed to handle the information, as well as mathematical or statistical strategies, in order
to discover the biological knowledge hidden in the data.
Bioinformatics can therefore be defined as the application of computational as well as
analytical techniques to solve biological issues. More specifically, bioinformatics describes
the search for and usage of patterns or inherent structure in biological data such as genome
sequences, and the development of novel methods for database access and querying. The
closely related term, computational biology, is more frequently used to talk about the physical
or mathematical simulation of biological processes.
In this chapter, we will review the recent evolution of the bioinformatics field, from the
pre-genomic era, when most studies involved a single biological entity (gene, RNA, protein,
etc…), to the post-genomic era and the development of bioinformatics to become a more
integrative and complex discipline involving the management and characterization of large
amounts of heterogeneous data.
1.2.1. Bioinformatics in the pre-genomic era
Bioinformatics has been used since the early 1960s to organize information and to
answer fundamental questions in the life sciences [5]. At that time, an expanding collection of
Commentaire [MSOffice3] : The origins of bioinformatics. Hagen JB. Nat Rev Genet. 2000 Dec;1(3):231-6.
Chapter 1 : Infosphere, Infoglut and Knowledge Discovery
38
molecular sequences provided both a source of data and a set of interesting problems that
were infeasible to solve without the power of computers. The idea that macromolecules carry
information became a central part of the conceptual framework of molecular biology and
numerous methods were developed to analyze the information flow between the raw DNA
sequence and the structure, function and evolution of the encoded molecules.
1.2.1.1 DNA sequence analysis
The DNA sequence contains the blueprint for the potential development and activity of
an organism, but the implementation of this information depends on the functions of the
encoded gene products (nucleic acids and proteins). Thus, the identification/characterization
of non-coding RNA and protein-coding genes is one of the first objectives of numerous
bioinformatics approaches.
The most powerful computational methods for predicting RNA genes, such as transfer
RNAs (tRNAs), ribosomal RNAs (rRNAs), small nuclear RNAs (snRNAs), or microRNA,
make use of the fact that many gene families are conserved in evolutionarily related genomes.
This comparative approach is the best way to detect sequence and structure features that have
been conserved during evolution and that are therefore likely to play a functional role.
Examples of such methods include for example DYNALIGN and FOLDALIGN. Ab initio
methods exist, which aim to predict locally stable RNA structures for example [6], but these
are more rarely used. RNA prediction methods are reviewed in more detail in 2007 by Meyer.
[7]
Protein coding regions of a genome can be identified by searching for Open Reading
Frames (ORFs), defined as long sequences of codons (triplets of nucleotides) limited by a
start codon and a stop codon. The coding regions can be distinguished from non coding ones
since they have different statistical properties, such as their codon usage, defined by a matrix
of 64 possible codons. Among the first mathematicians interested in characterizing biological
molecules, there are those who established the so called Hidden Markov Models (HMMs),
that use species-specific parameters related to coding and non-coding regions [8]. Such
approaches have been used to successfully predicting the coding regions of prokaryotic
organisms [9]. Locating the coding regions in eukaryotic genomes is less evident, since they
are scattered as small DNA fragments throughout the genome and represent a small
percentage of the total sequence. Furthermore, they are not continuous in the genome, but are
Commentaire [MSOffice4] : refs
Commentaire [MSOffice5] : Meyer IM. A practical guide to the art of RNA gene prediction, Briefings in Bioinformatics 2007.

Chapter 1 : Infosphere, Infoglut and Knowledge Discovery
39
split into regions, known as exons, separated by non-coding regions, known as introns. The
separate exons are then joined during transcription in the cell by a specific process called
splicing. The junctions between the exons and introns contain splicing signals, which
combined with the specific properties of the coding regions, are used in many gene finding
programs e.g. Genscan [10], in addition to statistical models such as HMMs [11].
In addition to these ab initio statistical methods to reveal gene structures and predict
their existence inside a genomic sequence, other approaches such as sequence similarity
searches can be used to find genes. As more and more genomes are sequenced, existing
methods for gene annotation tend to use more than one genomic sequence to predict gene
structures [12]. These comparative methods are based on the assumption that, due to selection
pressure, coding regions are more conserved than non-coding regions. They have the benefit
of providing more accurate gene identification, especially if multiple genomes across a variety
of evolutionary distances are available [13]. As an example, a modified version of the
dynamic programming algorithm, known as spliced alignment, has been developed to detect a
set of exons that is similar to a known protein sequence [14] or expressed sequence tag (EST,
sequenced fragments from mRNAs) [15].
Today, the statistical and sequence similarity based approaches are often used in a
cooperative manner in large software systems dedicated to gene prediction and annotation
[16] and have lead to significant progress. Nevertheless, gene annotation remains a crucial
research area in bioinformatics, that will continue to evolve as long as large amounts of new
sequences need to be characterized.
1.2.1.2 Protein function analysis
Once a gene and its functional transcript have been identified, the next step is the
prediction of its function. Bioinformaticians and computational biologists have developed
hundreds to thousands of different methods and techniques to analyse gene sequences and
extract information about the mechanisms by which they function.
One of the most widely used approaches is to transfer functional information from an
annotated gene, generally obtained from a well documented model-organism, to an
unannotated one, based on the assumption that two sequences with a high degree of similarity
have most likely evolved from a common ancestor (i.e. the sequences are homologous) and
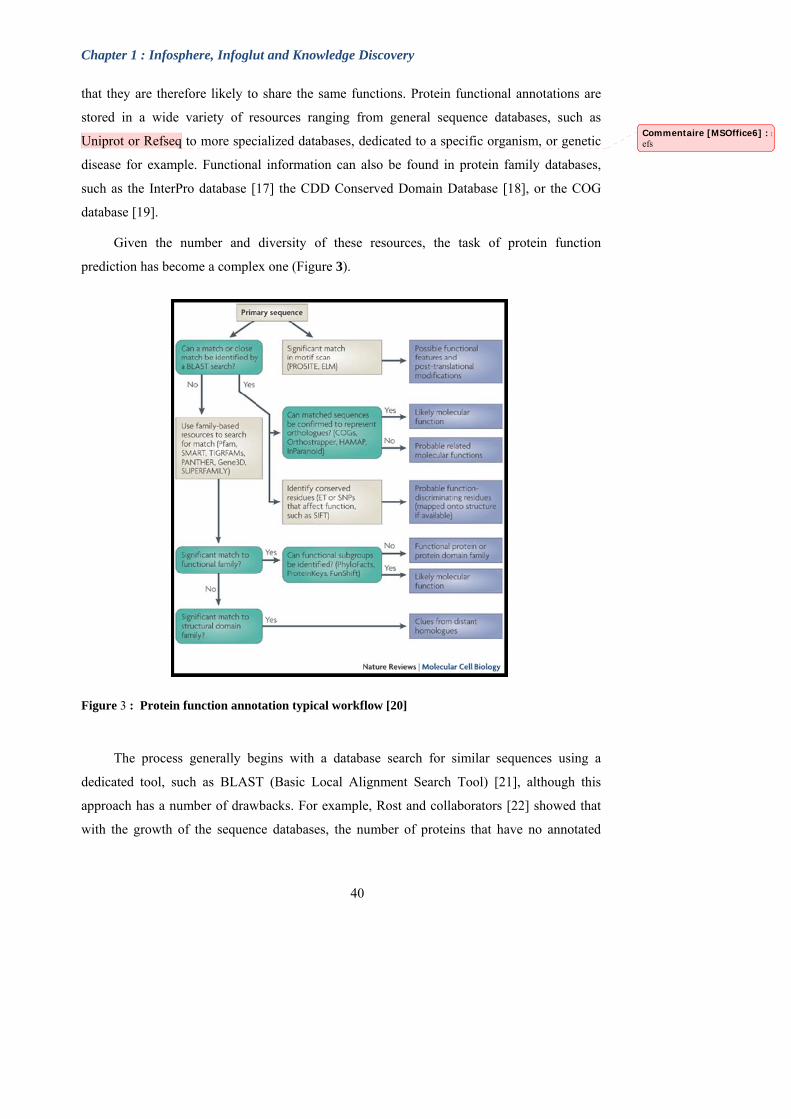
Chapter 1 : Infosphere, Infoglut and Knowledge Discovery
that they are therefore likely to share the same functions. Protein functional annotations are
stored in a wide variety of resources ranging from general sequence databases, such as
Uniprot or Refseq to more specialized databases, dedicated to a specific organism, or genetic
disease for example. Functional information can also be found in protein family databases,
such as the InterPro database [17] the CDD Conserved Domain Database [18], or the COG
database [19].
Commentaire [MSOffice6] : refs
Given the number and diversity of these resources, the task of protein function
prediction has become a complex one (Figure 3).
Figure 3 : Protein function annotation typical workflow [20]
The process generally begins with a database search for similar sequences using a
dedicated tool, such as BLAST (Basic Local Alignment Search Tool) [21], although this
approach has a number of drawbacks. For example, Rost and collaborators [22] showed that
with the growth of the sequence databases, the number of proteins that have no annotated
40
Chapter 1 : Infosphere, Infoglut and Knowledge Discovery
41
reference is expanding exponentially. They estimated the number of proteins that could be
annotated automatically by BLAST-based methods to be under 30% of all proteins (with an
error rate of 5%). They added that even if we allow an error rate of more than 40%, there is no
existing annotation for more than 30% of all proteins. Furthermore, errors can be introduced
by the fact that homologous sequences do not always share the same function. For example,
[23] showed that even with a high degree of sequence similarity, enzymatic function could be
different and not conserved.
Such annotation errors from automatic function prediction methods often find their way
into the public databases and are further propagated by subsequent genome annotation
projects [24, 25]. One of the solutions to this problem has been the use of multiple sequence
comparisons or alignments, where the annotation from a set of related sequences is cross-
validated to ensure its high quality before being transferred to the unannotated sequence [26].
When homology-based methods are not applicable, for example when no similar
sequences are found, other approaches can be used to characterize the unknown sequence that
rely on finding matches to known functional motifs. For example, within a functional domain
in a protein sequence, that could be several hundred amino acids long, less than 10% of the
residues are directly involved in the protein's active site [27]. Instead of considering the entire
sequence, the presence of a specific signature can therefore give some functional clues.
Signatures may be located at a single position or may cover several positions, known as a
fingerprint or pattern. Some specific databases offer the possibility to search for known
functional motifs. For example, PROSITE [28] contains manually curated biologically
important motifs, corresponding to three types of signature: patterns, rules and profiles.
Additional well-known motif databases include BLOCKS [29] and PRINTS [30].
1.2.1.3 Protein Structure Prediction
The biological activity of a protein sequence is determined by its 3D-structure, which
differs from one protein sequence to another. Many small proteins are organized in a single
unit, known as a domain, whereas many others are formed by the combination of several
structural domains, motifs or repeats. These basic building blocks, their modular presentation
and organization contribute to the functional diversity in proteins. One of the largest examples
is the protein titin which is a 34350 residue long scaffold protein. A number of databases exist
Commentaire [R7] : Laquelle exactement ?
Chapter 1 : Infosphere, Infoglut and Knowledge Discovery
42
that organize the known protein 3D structures, the most widely known structure database
being the Protein Data Bank (PDB) [31]. Other resources, such as CATH [32] and SCOP [33]
store protein structures by splitting them into domains and classifying them in a hierarchical
fashion. The first uses the topology, architecture and class to classify proteins, whereas the
latter relies on classes, folds, superfamilies and families.
Some methods have been developed to predict the 3D structure of a protein based only
on its primary sequence [34], known as ab initio methods. Nevertheless, the most accurate in
silico method for determining the structure of an unknown protein is homology structure
modeling. This approach assumes that sequence similarity between proteins usually indicates
a structural resemblance and relies on the availability of a related protein with known 3D
structure in the public databases.
1.2.1.4 Phylogenetic analysis
Phylogenetics can be defined as the estimation of evolutionary relationships and
describes the classification of organisms according to their evolutionary history. It is an
integral part of the science of systematics that aims to establish the phylogeny of all
organisms based on their characteristics. Phylogenetics is also central to evolutionary biology
as a whole as it is the condensation of the overall paradigm of how life arose and developed
on earth.
A phylogenetic history is generally represented as a graph-like diagram or tree-like
representation. The main idea behind phylogenetics is that members of the same group or
clade share the same evolutionary history, and compared to members of other clades, they are
more likely to be more closely related. During evolution, some features disappear and others
appear, which means that for a given group, its members share unique features that are not
present in the common ancestor. These features (or characters) could be anything observable
or "describable", from two organisms that have developed a spinal column to two sequences
that have mutations located at the same position.
Gene sequences have now replaced anatomical features to become the standard
“characters” used to investigate organismal phylogenies. Phylogenies are generally built using
homologous sequences i.e. sequences that share a common ancestor, but that may or may not
have common structure and function. Homologs can be divided into orthologs and paralogs
Chapter 1 : Infosphere, Infoglut and Knowledge Discovery
43
(Fitch). Orthologs are genes in different species that evolved from a common ancestral gene
by speciation. Normally, orthologs retain the same function in the course of evolution.
Identification of orthologs is therefore critical for reliable prediction of gene function in newly
sequenced genomes. Paralogs are genes related by duplication within a genome. In contrast to
orthologs, paralogs often evolve new functions, even if these are related to the original one.
A typical phylogenetic analysis based on molecular sequences consists of five steps:
Homologous sequences are identified by database searches and selected according to a
certain confidence threshold.
The sequences are then compared to identify similarities and differences between them.
“Informative” positions in the sequences are identified.
The phylogenetic tree is then constructed, based on the similarities observed in the
sequences and a specific evolutionary model.
The tree is then evaluated to determine a reliable tree topology.
Each step is fundamental for the analysis and ought to be treated appropriately. For
instance, trees are only as good as the initial sequence comparisons they are determined from.
When carrying out a phylogenetic analysis, it is therefore frequently informative to construct
trees based on various adjustments of the parameters used at each step to observe how they
affect the tree.
Recently, a number of databases have been developed to store phylogenetic trees, for
example:
TreeFam (www.treefam.org) is a database of phylogenetic trees of animal genes.
It aims at developing a curated resource that gives reliable information about
ortholog and paralog assignments, and evolutionary history of various gene
families [35, 36].
PhylomeDB (phylomedb.org) is a public database for complete collections of
gene phylogenies (phylomes) that allows users to interactively explore the
evolutionary history of genes through the visualization of phylogenetic trees and
multiple sequence alignments [37].
TreeBASE (www.treebase.org) stores phylogenetic trees and the multiple
sequence alignments used to generate them from published research papers [38].
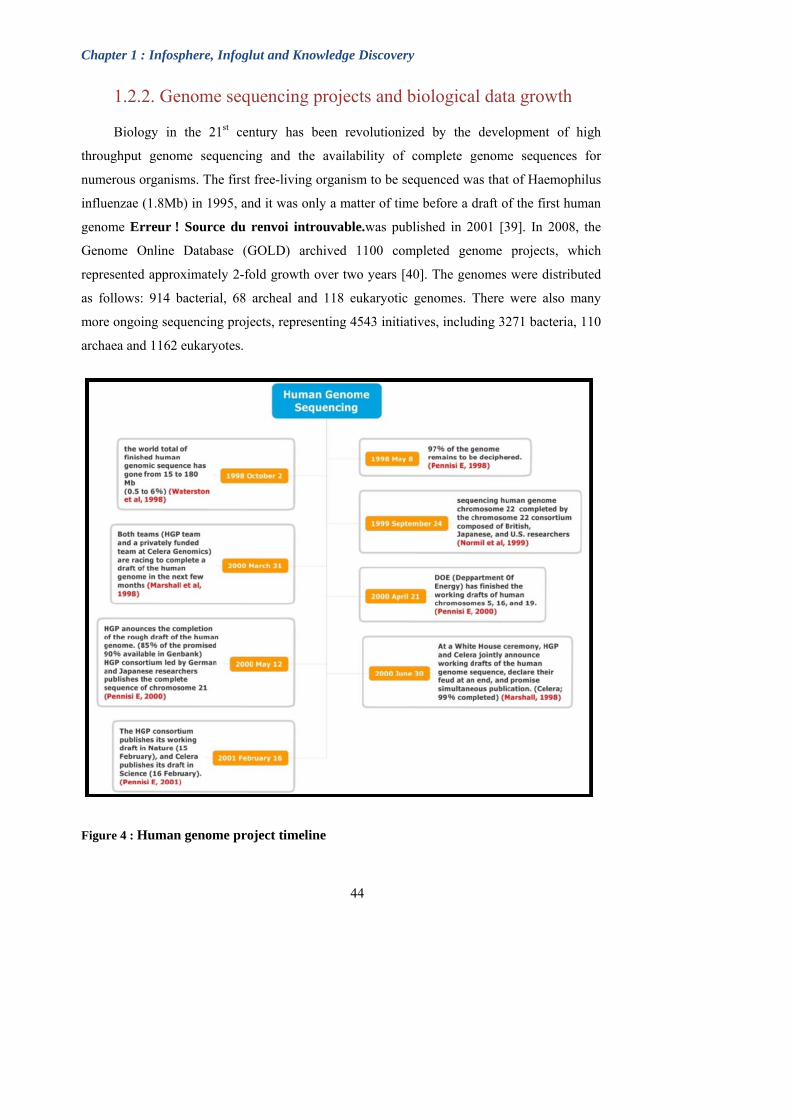
Chapter 1 : Infosphere, Infoglut and Knowledge Discovery
1.2.2. Genome sequencing projects and biological data growth
Biology in the 21st century has been revolutionized by the development of high
throughput genome sequencing and the availability of complete genome sequences for
numerous organisms. The first free-living organism to be sequenced was that of Haemophilus
influenzae (1.8Mb) in 1995, and it was only a matter of time before a draft of the first human
genome Erreur ! Source du renvoi introuvable.was published in 2001 [39]. In 2008, the
Genome Online Database (GOLD) archived 1100 completed genome projects, which
represented approximately 2-fold growth over two years [40]. The genomes were distributed
as follows: 914 bacterial, 68 archeal and 118 eukaryotic genomes. There were also many
more ongoing sequencing projects, representing 4543 initiatives, including 3271 bacteria, 110
archaea and 1162 eukaryotes.
Figure 4 : Human genome project timeline
44

Chapter 1 : Infosphere, Infoglut and Knowledge Discovery
45
Many of these genomes, when completely sequenced, are submitted to publicly
available databases such as Genbank [41], EMBL [42] or DDBJ [43]. Unfortunately, this is
not systematic. In fact, due to the rapid increase in the number of sequencing projects, some
of them do not have an associated publication in the literature. The problem concerns a
considerable fraction: 408 of the 1100 genomes available in GOLD.
Other large-scale data resources are also emerging from high-throughput experimental
technologies such as microarrays for systematically analyzing gene expression profiles or
yeast two-hybrid systems and mass spectroscopy for detecting protein-protein interactions.
The impact of the genome projects is thus not simply an increased amount of sequence data,
but the diversification of molecular biology data. Table 1 lists some examples of these data
resources, which have been denoted with the suffix ‘-ome’ (from the Greek for ‘all’, ‘every’
or ‘complete’) to indicate studies undertaken on a large or genome-wide scale.
Transcriptome the mRNA complement of an entire organism, tissue
type, or cell Proteome the entire complement of proteins in a given biological
organism or system at a given time Metabolome the population of metabolites in an organism Secretome the population of gene products that are secreted from
the cell Lipidome the totality of lipids in an organism Interactome the complete list of interactions between all
macromlecules in a cell Spliceosome the totality of the alternative splicing protein isoforms Kinome The totality of protein kinases in a cell Neurome The complete neural makeup of an organism ORFeome the totality of protein-encoding open reading frames
(ORFs) Unknome The totality of genes of unknown function Textome The body of scientific literature which text mining can
analyse
Resourceome The full set of bioinformatics resources
Table 1 : Some examples of ‘-omics’ data resources
The availability of numerous complete genome sequences and other large datasets has
led to a paradigm shift in biological research. Traditionally, biologists accumulated

Chapter 1 : Infosphere, Infoglut and Knowledge Discovery
46
knowledge based on a starting hypothesis concerning a particular biological issue, and then
proceeded to experimental assays to confirm the strength or weakness of their theories. This
hypothesis-driven research approach can now be complemented by new technology-based or
data-based approaches.
In comparison to the traditional hypothesis-based research, the new models have many
novel aspects, such as a high throughput platform, a torrent of data collection, and a free data
exchange among the entire scientific community. As a consequence, computational analysis
of the large amounts of data produced by genomics has partially replaced wet lab
experiments, introducing new possibilities for generating biological knowledge. The field of
bioinformatics, combining life sciences with computer and physical sciences, offers an
exciting playground for the creation and deployment of new technologies for data mining and
analysis, with the ultimate goal of answering biological and medical questions.
In the rest of this chapter, we will discuss the new challenges and problems posed by the
high throughput genomics data.
1.2.2. Bioinformatics in the post-genomic era
Since the emergence of high throughput technologies and their application to the
elucidation of molecular biology systems, a new era of biological and biomedical research has
begun. The emphasis in biology and bioinformatics is shifting from studying individual
components, such as genes, RNA or proteins in isolation, to the study of the vast networks
that biological molecules create, which regulate and control life.
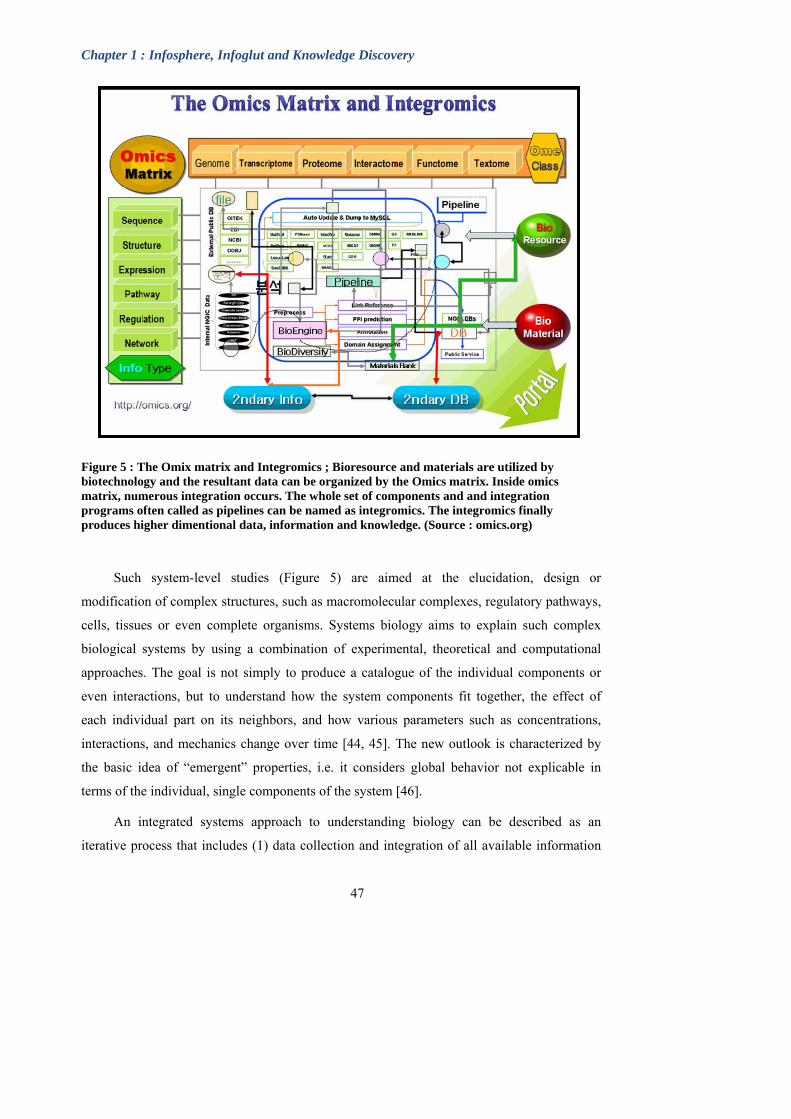
Chapter 1 : Infosphere, Infoglut and Knowledge Discovery
Figure 5 : The Omix matrix and Integromics ; Bioresource and materials are utilized by biotechnology and the resultant data can be organized by the Omics matrix. Inside omics matrix, numerous integration occurs. The whole set of components and and integration programs often called as pipelines can be named as integromics. The integromics finally produces higher dimentional data, information and knowledge. (Source : omics.org)
Such system-level studies (Figure 5) are aimed at the elucidation, design or
modification of complex structures, such as macromolecular complexes, regulatory pathways,
cells, tissues or even complete organisms. Systems biology aims to explain such complex
biological systems by using a combination of experimental, theoretical and computational
approaches. The goal is not simply to produce a catalogue of the individual components or
even interactions, but to understand how the system components fit together, the effect of
each individual part on its neighbors, and how various parameters such as concentrations,
interactions, and mechanics change over time [44, 45]. The new outlook is characterized by
the basic idea of “emergent” properties, i.e. it considers global behavior not explicable in
terms of the individual, single components of the system [46].
An integrated systems approach to understanding biology can be described as an
iterative process that includes (1) data collection and integration of all available information
47
Chapter 1 : Infosphere, Infoglut and Knowledge Discovery
48
(ideally all components and their relationships in the organism), (2) mathematical modelling
of the system, (3) generation of new hypotheses and (4) experimentation at a global level. In
this new approach, global sets of biological data are integrated from as many hierarchical
levels of information as possible. This is the initiation point for the formulation of detailed
graphical or mathematical models, which are then refined by hypothesis-driven, iterative
systems perturbations and new data integration. Cycles of iteration will result in a formal
working model of how the systems function dynamically in the growth, development and
maintenance of the organism in the context of its environment. Ultimately, these models will
explain the systems or emergent properties of the biological system of interest. Once the
model is sufficiently accurate and detailed, it will allow biologists to accomplish two tasks not
possible before: (i) to predict the behavior of the system given any perturbation and (ii)
redesign or perturb the gene regulatory networks to create completely new emergent systems
properties.
The rest of this section will describe in more detail some of the new “omics” data
resources and the computational approaches that have been developed recently to analyze
them.
1.2.3.1 Comparative genomics
Due to the fact that a variety of distinct genomes have been sequenced it is now
conceivable to tackle comparative studies of genomes, giving rise to a new research field
known as comparative genomics. By comparing genomes from related species we can identify
functional regions, such as genes or regulatory elements that are conserved among species, as
well as the regions that give each organism its unique characteristics. Comparative genomics
also provides a powerful tool for studying evolutionary changes among organisms, helping to
begin to understand some of the fundamental mechanisms by which genes and genomes
evolve.
In order for researchers to use an organism's genome efficiently in comparative studies,
data about its DNA must be in large, contiguous segments, anchored to chromosomes and,
ideally, fully sequenced. Furthermore, the data needs to be organized to allow easy access for
researchers using sophisticated computer software to conduct high-speed analyses. A number
of resources have been developed specifically to store and make available the complete

Chapter 1 : Infosphere, Infoglut and Knowledge Discovery
49
genomes, e.g. the UCSC Genome browser (genome.ucsc.edu), NCBI complete genomes
(www.ncbi.nlm.nih.gov/sites/genome) or Ensembl genomes (www.ensembl.org).
1.2.3.2 Transcriptomics
The study of transcriptomics, also referred to as expression profiling, examines the
expression level of mRNAs in a given cell population, for example in a given tissue and at a
specific time during the development of an organism. Because it includes all mRNA
transcripts in the cell, the transcriptome reflects the genes that are being actively expressed at
any given time. Common technologies for genome-wide or high-throughput analysis of gene
expression are cDNA microarrays and oligo-microarrays, cDNA-AFLP and SAGE. By
comparing the transcriptomes of different cell populations, e.g. healthy versus diseased
individuals, or normal versus cancer cells, genes that are under-expressed or over-expressed
can be identified.
In addition to the various transcriptome databases dedicated to a specific organism, cell
line, cancer, stem cells, etc., a number of more general databases have been developed,
including the Gene Expression Omnibus GEO) [47] at the NCBI
(www.ncbi.nlm.nih.gov/geo/) or the ArrayExpress database [48] at the EBI
(www.ebi.ac.uk/microarray-as/ae/).
The analysis of transcriptomes can be complicated by the large-scale nature of data, a
high level of noise and the variability and low reproducibility of expression microarrays. Key
areas in data analysis include experimental design, the assessment of significance of
differential expression, discriminant analysis and clustering. These require efficient data
acquisition and storage, normalization between different data sets and visualization [49-51] .
1.2.3.3 Proteomics
As the emerging field of proteomics continues to expand at an extremely rapid rate, the
relative quantification of proteins, targeted by their function, has become its greatest
challenge. Complex analytical strategies have been designed that allow comparative analysis
of large proteomes, as well as in depth detection of the core proteome or the interaction
network of a given protein of interest. The protocols being developed address many of the
problems encountered in high-throughput proteomics projects, from the experimental design
to the methods used for the interpretation of the mass spectrometry data and the search
Chapter 1 : Infosphere, Infoglut and Knowledge Discovery
50
engines used for the identification of the proteins in the different types of sequence data banks
available. Dedicated databases include:
The PRIDE PRoteomics IDEntifications database (www.ebi.ac.uk/pride/) [52] is a
centralized, standards compliant, public data repository for proteomics data. It has been
developed to provide the proteomics community with a public repository for protein and
peptide identifications together with the evidence supporting these identifications.
The PeptideAtlas (www.peptideatlas.org/) [53] is a multi-organism, publicly accessible
compendium of peptides identified in a large set of tandem mass spectrometry proteomics
experiments. Mass spectrometer output files are collected for human, mouse, yeast, and
several other organisms, and searched using the latest search engines and protein sequences.
The ExPASy (www.expasy.org) [54] proteomics server of the Swiss Institute of
Bioinformatics (SIB) is dedicated to the analysis of protein sequences and structures as well
as 2-D PAGE.
1.2.3.4 Interactomics: protein-protein interactions
In order to understand the structure and the function of an integrated cellular network,
ideally, we have to identify all functional protein-protein interactions in the different cells and
tissues at any developmental stages and in any given physiological status [55]. Several
interaction maps on a genome-scale have been established, based on experimental yeast two-
hybrid [56] and co-affinity purification in conjunction with mass-spectrometry techniques. In
addition, computational approaches have been developed that predict protein–protein
interactions by relying upon shared characteristics of known interacting proteins [57] or
phylogenetic evolutionary information [58].
Today, protein–protein interaction networks have been established for bacteria
(Escherichia coli [59] and Helicobacter pylori [60]), the malarial pathogen Plasmodium
falciparum [61], Saccharomyces. cerevisiae [62], the fruitfly Drosophila melanogaster [63],
Caenorhabditis elegans [64] and human [65]. Many follow-up studies have analyzed the
patterns of interacting components, or topological properties, which are revealed by the
resulting networks [66] and have argued the potential fundamental biological implications.
A number of dedicated resources have been developed, such as BIND [67], IntAct [68]
and STRING [69]. While BIND and IntAct contain only reliable, experimentally determined
Commentaire [j8] : Gary D. Bader, Doron Betel and Christopher W.V. Houge, BIND: the biomolecular interaction network database, Nucleic Acids Res 31 (1) (2003), pp. 248–250. fs414) [4]Henning Hermjakob, Luisa Montecchi-Palazzi, Chris Lewington and Sugath Mudali, IntAct: an open source molecular interaction database, Nucleic Acids Res 1 (32Database issue) (2004), pp. 452–455. [5] Christian von Mering, Lars J. Jensen, Berend Snel1 and Sean D. Hooper, STRING: known and predicted protein–protein associations, integrated and transferred across organisms, Nucleic Acids Res 33 (Database issue) (2005), pp. 433–437.
Chapter 1 : Infosphere, Infoglut and Knowledge Discovery
51
protein-protein interactions, STRING has a wider coverage. It contains both known and
predicted protein interactions, including both direct (physical) and indirect (functional)
associations. They are derived from four sources: genomic context, high-throughput
experiments, (conserved) coexpression and the scientific literature.
1.2.3.5 Metabolomics
Metabolomics is dedicated to identifying the complete set of metabolites, or the
metabolome, of the cell. The metabolome is thus complementary to the transcriptomes and
proteomes described above. As one of the most recent elements of omics data types, work is
still ongoing toward the improvement of the methods that generate these data, but generally
they rely on mass spectrometry, NMR spectroscopy and vibrational spectroscopy [70] to
analyse the metabolite contents that are extracted from isolated cells or tissues. Given the
extremely varied collection of biomolecules and the significant dynamic range of metabolite
concentrations that need detection, current strategies must find hundreds of different chemical
entities. Even with these challenges and the resultant restrictions, metabolomics is rapidly
turning into a common tool for exploring the cellular state of many systems, such as plants,
the human red blood cell and microbes , and also in pharmacology and toxicology, in
metabolic-engineering applications and in human nutritional research [71].
1.3 Conclusion
The life sciences have entered a new information age characterized by a flood of
complex, heterogeneous data and a vast array of computational algorithms designed to
analyze and extract the knowledge buried in the data. Novel bioinformatics solutions are now
needed that will provide a conceptual framework for representing, integrating and modeling
the data as well as deciphering complex patterns and systems to generate new knowledge.
Chapter 2 will discuss the database infrastructures developed to collect, process and store
biological data. Chapters 3 and 4 will then discuss algorithms developed in the context of
artificial intelligence for knowledge extraction, focusing on machine learning and knowledge
based expert systems.
Chapter 2 : Biological databases: Data Storage and Warehousing is great, data quality is better quality
52
Chapter 2
2. Biological databases:
Data storage and warehousing is great, data quality is
better
The first biological databases (actually flat files), established in the early 1980s,
represented nucleotide sequences, and contained several million bases. Today, over 106
billion nucleotide bases from more than 108 million individual sequences and 300,000
organisms are currently contained in the databases of the International Nucleotide Sequence
Database Collaboration (INSDC) represented jointly by EMBL, Genbank and DDBJ. The
combined data represents a fundamental bioinformatics resource since most of the other
bioinformatics data is more or less dependent on inference from nucleotide sequences.
Unfortunately the information stored within the archives is not consistently well
annotated. A large majority of the sequences and the associated annotations are themselves
the result of computational predictions, with their inherent inaccuracy [72]. As an example, a
recent study of a specific enzyme family, the ribonucleotide reductases [73], showed that only
23% of the sequences were correctly annotated in Genbank. Furthermore, when submitting
sequences to databases, scientists generally choose which sequence annotations they want to
publish, considering that these annotations are more pertinent than others. Consequently,
nothing can be inferred from the absence of information in the databases. To make things
worse, the errors in the databases are often propagated when new sequences are predicted.
Most of the gene prediction methods rely on the existing information stored in the databases.
This means that prediction models rely on the information that is defined at a given time and
Commentaire [MSOffice9] : vALId: validation of protein sequence quality based on multiple alignment data. Bianchetti L, Thompson JD, Lecompte O, Plewniak F, Poch O.J Bioinform Comput Biol. 2005
Chapter 2 : Biological databases: Data Storage and Warehousing is great, data quality is better quality
53
when the information is upgraded, the established models may not be accurate and in some
cases are obsolete.
More recently, the whole genome sequencing technologies have given rise to a new
generation of specialist databases storing data from specific species that have the particularity
to hold the sequence and its automatically generated annotation made available in advance.
Generally the content of such resources are frequently revised, especially when the genome
has been recently deciphered. The Ensembl database of metazoan genome annotation is a
good example of such a resource [74].
In addition to nucleotide databases, protein sequence databases are also of great interest
in the biological informational context. While the automatically annotated databases, such as
TrEMBL [75] or Refseq [76], represent a rich source of data, the most reliable store of
functional information today is probably Swiss-Prot, a subsection of the Uniprot Knowledge
base (UniprotKB) [75] is the annotations in Swiss-Prot are manually curated from scientific
literature, and although they are less complete than the automatic databases, they are
frequently used to infer information about proteins not yet subjected to specific experimental
study.
Nucleotide and protein sequence databases are cited here as examples of biological
databases, since they are considered as the "ancestors" of database types. Today, several
hundred bioinformatics databases exist in total, with many resources concentrating on a
particular taxonomic or methodological field. As an example, a lot of databases are dedicated
to model organisms such as yeasts [77, 78], mouse [79] etc. These specialized databases
generally represent more detailed information sources about gene and protein functions within
their taxonomic scope. As mentioned in Chapter 1, other databases are dedicated to different
types of data, including transcriptomic, proteomic, interactomic, phenotypic resources.
In parallel with biological component databases, the scientific literature describing them
is also an invaluable source of information. MEDLINE, frequently accessed as part of
PubMed, is the largest database containing biological literature with its 10 million citations.
Bioinformatics and literature databases are linked through cross-references. As an example,
UniprotKB cross-references hundreds of other resources (including MEDLINE and PubMed)

Chapter 2 : Biological databases: Data Storage and Warehousing is great, data quality is better quality
54
which give scientists direct access to more detailed information on a particular biological
component.
In this dynamic heterogeneous environment consisting of numerous different data
resources, including both generalist and specialist databases, the entries stored in the different
databases are often strongly related and mutually dependent on each other. For example, the
function of a gene depends on its biological context: its interactions with other genes, the
pathways they are involved in, their expression under certain conditions, etc. Similarly, the
function of an interaction depends on the function of the interacting partners. To retrieve the
broader view of an entity, a biologist usually has to search multiple databases. This poses a
number of problems. Most public databases have their own format and querying system.
Links between databases are not always available and are not always coordinated between the
different resources, giving rise to problems of consistency, redundancy, connectivity and
synchronization. Even on a small scale, for example for a single protein or complex, data
integration becomes a daunting task. To overcome these problems, new data integration
systems have been developed that read data from multiple sources, perform simple
transformations of data into a unified format and provide access to the data.
2.1 Data collection
To obtain an integrated view of a biological system, an essential perquisite is the
collection of data from different databases, which are generally distributed over various
geographical sites. Two main approaches have been developed to address this task: data
warehouses and distributed databases.
2.1.1. Data warehouses
Data warehousing first emerged in the nineties as a solution to the information
explosion in the business domain. A data warehouse solution is a structured repository of a
large amount of data collected from various sources to support an analytical process. In the
Business Intelligence field, sales and client data distributed across the company are integrated
within a data warehouse framework. Concepts such as customer buying behavior can then be
mined from such a system to prepare targeted marketing campaigns and strategies. Data
warehousing in bioinformatics, as in other fields, involves collecting data from the different
Chapter 2 : Biological databases: Data Storage and Warehousing is great, data quality is better quality
55
databases, integrating the data and resolving conflicts and transforming it in order to discover
the hidden knowledge. This being said, the nature of biological information and the systems
that generate these data dictates some specific requirements for biological data warehousing.
The two most widely used data warehousing systems in bioinformatics are SRS and
Entrez. SRS is maintained by the European Bioinformatics Institute (EBI) and represents a
gateway to over 100 bioinformatics databases [80]. It is powerful but complex, allowing the
construction of inter-database queries in a generic manner. Entrez is maintained by the NCBI
and offers a simpler interface with less support for structured queries, but data retrieval is
more rapid. Both data warehouses allow literature mining by the incorporation of PubMed for
example.
EnsMart [81] is another warehouse-based system that is distinguished by its user-
friendly query front end that allows users to compose complex queries interactively. EnsMart
runs on Oracle and MySQL. Data types currently supported by EnsMart are genes, SNP data,
and controlled vocabularies. The Atlas system [82] provides a data warehouse based on
relational data models, which locally stores and integrates biological sequences, molecular
interactions, homology information and functional annotations of genes. First, Atlas stores
data of similar types using common data models and second, integration is achieved through a
combination of APIs, ontology and tools to perform common sequence and feature retrieval
tasks. Because the databases are installed locally, data retrieval is direct, efficient and
relatively simple. Warehousing guarantees that the data needed are always available. Also
users have control over the databases installed, which versions are used and when they are
updated. The disadvantage of this approach is that the overhead costs can be very heavy in
terms of the hardware required for database installation and maintenance.
2.1.2. Distributed databases
Distributed systems provide an alternative to data warehousing approaches. Here,
software is implemented to access heterogeneous databases that are dispersed over the
internet and to provide a query facility to access the data. Many examples have been
developed. OPM (Object Protocol Model) [83] uses an entity model and generic servers that
retrofit the data and unify data sources, and provides a query language OPM-MQL to query
the distributed data. The integrated data can be output in XML format. IBM’s DiscoveryLink
Chapter 2 : Biological databases: Data Storage and Warehousing is great, data quality is better quality
56
[84] uses a relational model and the SQL language for modelling and accessing distributed
data. TAMBIS [85] is a semantic-based system utilising ontologies and a services model to
support user queries. BioMOBY [86] like TAMBIS, is also ontology-based and service-model
driven. SEMEDA [87] is an ontology based semantic metadatabase and is implemented as a 3
tiered architecture consisting of a relational database (backend) and jsp 1.1 (java server pages)
as the middle tier, which dynamically generates the html frontend. Using this architecture has
several advantages: data (ontologies and database metainformation) can be consistently stored
independently from the application and can also be retrieved or imported by using the various
built in interfaces and tools of the DBMS. These implementations do not house the data
locally, but instead query the original data resource for available services before sending
queries. These systems are powerful for interrogating disparate data sources. However, a
disadvantage is that large queries may take a long time to return or may not be returned at all.
Thus, remote access requires complex systems to manage communication between the server
and the client, particularly when errors occur because remote systems are not available.
A number of solutions have been developed recently to address these problems. For
example, the Distributed Sequence Annotation System (DAS) [88] allows sequence
annotations to be decentralized among multiple third-party annotators and integrated on an as-
needed basis by client-side software. The communication between client and servers in DAS
is defined by the DAS XML specification. A more general solution is the SOAP (Simple
Object Access Protocol) for access to distributed webservices. SOAP uses XML requests and
responses for the transport of information between different nodes. An alternative is the REST
(Representational State Transfer) approach for getting information content from a web site by
reading a designated web page containing an XML (Extensible Markup Language) file that
describes and includes the desired content.
2.2. Data integration and validation
One of the major benefits of both data warehouses and distributed databases is the
possibility to integrate data from the different resources. This is achieved via cross-
referencing of entries from different databases, as well as data enrichment with information
from the literature, although this is not void of problems or limitations. Accurate cross-
references are crucial to obtaining relevant results, but the current data volume exceeds the
Chapter 2 : Biological databases: Data Storage and Warehousing is great, data quality is better quality
57
ability for manual curation of almost all bioinformatics resources. As an illustration, about
220,000 records in the UniProtKB are manually curated, but despite this high volume of data,
this represents only 7% of the total records. To tackle this problem, cross-referencing has to
be done automatically by means of identifier tracking or by comparison of the properties of
entities to establish their equivalence. This is not a simple task since the identifiers used in the
different databases are generally not the same. The problem is even more complex when
searching the literature, due to the widespread use of synonyms and homonyms for genes,
proteins and other biological entities and the lack of well-established standards. Another
important problem when searching for cross-referenced information is related to the data
quality in bioinformatics databases. Data conflicts, occurring when the "same" object is
described by different properties in different resources, need to be resolved, or at least
signaled to the user. .
The problems cited above are just some examples showing that badly cross-referenced
information could be considered as a brake to knowledge discovery in bioinformatics. But,
what about well annotated and cross-referenced information? There is no evidence that no
problems exist in this case and here are some examples of possible deficiencies that could
occur:
1. The lack of naming standardization between resources means that records with the
same name in different databases may be conceptually dissimilar
2. The content could be different depending on the bioinformatics repository and the
data included in databases describing the same biological object could be different
3. There are no rules or guidelines concerning database updates and each resource
follows its own policy concerning either the update frequency or the update protocols
(automatic, manually curated, etc.). This results in a lack of synchronization between
bioinformatics databases leading to, on the one hand, the existence of out-of-date
information, and on the other hand, incoherence between data describing the same
biological object in two or more repositories. It is then difficult to determine which
one is more accurate or true.
It is clear that the usefulness of a warehouse or distributed database system is dependent
on the coherence of the data it contains. Efforts are now underway to improve the reliability

Chapter 2 : Biological databases: Data Storage and Warehousing is great, data quality is better quality
58
of the shared bioinformatics data resources, for example by the standardization of
vocabularies using ontologies such as the Gene Ontology [89] or the development of
standards for data representation in emerging research areas such as transcriptomics and
proteomics.
2.3. Data Extraction and Querying: The more we
formalize, the better we learn!
Traditionally, knowledge was extracted from biological databases by searching for
specific information concerning the object of interest. This was generally achieved using
dedicated data analysis software. To illustrate this, we can consider the typical case where the
object of interest is a gene, identified by a protein name or identifier that, once submitted as a
query to one of the resources cited above (UniprotKB, Ensembl, etc.), returns a database
record containing more or less relevant information known about that entity. The data of
interest could also be a raw sequence and in this case, several tools exist to compare the new
sequence with existing annotated sequences, such as BLAST or FASTA [90]. For protein
sequences, with their modular domain organization, the new sequence can also be compared
to known domains in databases such as InterPro or CDD . Other examples of traditional data
analyses were described in Chapter 1.
Bioinformatics data is a very generic term, generally employed to describe information
that is contained in databases, or data that we use as input to several tools and programs.
Furthermore, most bioinformatics data is represented in textual format: records in databases,
flat files, the battery of bioinformatics formats (Genbank, EMBL, Fasta, PDB, ..), in addition
to program outputs from sequence database searches, multiple sequence alignments,
biological feature predictions etc. All these information resources contain biological
knowledge that is more or less structured, sometimes containing the same information but
presented differently, and sometimes providing extra information that is not integrated or
taken into account during a specific analysis process.
Despite the numerous efforts to facilitate data exchange in bioinformatics, a true
standardized format for all is not expected for tomorrow. Even for the same data type, we can
find lots of differences, for example, GenBank developed the ASN.1 format (Abstract Syntax
Chapter 2 : Biological databases: Data Storage and Warehousing is great, data quality is better quality
59
Notation One) for sequence data, while Swiss-Prot designed a different one. Another example
is the introduction of XML (Extensible markup Language) as a generic data exchange format
which then gave rise to a battery of bioinformatics XML representations: GBSeq XML for
GenBank, SPTr-XML for SwissProt, XEMBL for EMBL, GEML for Gene Expression
Markup Language, MAGE-ML for MicroArray and Gene Markup Language, and many
others. The existence of so many data formats represents a major problem in bioinformatics
data management, In this context, important progress have been achieved in computer science
concerning the standardization of machine readable vocabularies or ontologies, which provide
explicit specifications of commonly used abstract models [91]. In addition to concept
definitions, ontologies provide a basis for the development of software able to reason and
infer properties and relationships in a given domain. With the emergence of ontologies, one
important task was to make the concepts persistant and communicable, and as a consequence,
standard formats such as RDF (Resource Description Framework) and OWL (Web Onltology
Langage) were developed. As an illustration, RDF allows the establishment of statements
concerning a particular domain using the Subject-Predicate-Object model. Here, the Subject
and the Object refer to concepts, while the Predicate refers to the relationship between them.
Despite the problems described above, the standardization of data has facilitated the
recent introduction of Knowledge Discovery approaches in bioinformatics, employing various
techniques and methods such as data and text mining or machine learning described in the
next chapter.
Chapter 3 : From Data Integration to Knowledge Discovery, The role of Computational Intelligence in Bioinformatics
60
Chapter 3
3. From Data Integration to Knowledge Discovery
The role of Computational Intelligence in Bioinformatics
During the last few years, bioinformatics and computational biology have relied mainly
on statistical algorithms to formalize, extract and analyze efficiently the vast amount of
information available in databases. However, the recent explosion of the volumes of data
available, combined with the growing complexity and heterogeneity in terms of data types
and data quality, means that biologists now need tools that can represent their data in a
comprehensible fashion, annotated with contextual information, estimates of accuracy and
intuitive explanations. As a consequence, combining bioinformatics / computational biology
with computational intelligence methodologies has become an important area of research in
intelligent information processing. Computational intelligence combines elements of data
mining and machine learning approaches to create systems that are, in some sense, intelligent.
Section 3.1 describes the data mining approaches used to explore large data sets and to
discover hidden patterns. The main goal of these methods is to understand relationships,
validate models or identify unexpected relationships. Section 3.2 discusses more specific
algorithms designed to automatically extract information from the literature. Finally, section
3.3 introduces machine learning algorithms that allow the computer to learn from data. The
learning process involves data mining to extract the patterns but the end goal is to use the
knowledge to do prediction on new data,
3.1. Data mining in bioinformatics
Chapter 3 : From Data Integration to Knowledge Discovery, The role of Computational Intelligence in Bioinformatics
61
Humans have "manually" extracted patterns from data for centuries, but the increasing
volume of data in modern times has called for more automated approaches. As data sets have
grown in size and complexity, data analysis has increasingly been augmented with automatic
data processing. Data mining is the process of selecting, exploring and modeling data in order
to extract hidden patterns and to produce new, meaningful and useful information. It has been
defined as “The non trivial extraction of implicit, previously unknown, and potentially useful
information from data" [92]. In bioinformatics this process could refer to finding motifs in
sequences, to discovering expression profiles shared by different genes, to identifying specific
features in cellular images, and so on.
Technically, data mining software allows users to analyze data from many different
dimensions or angles, categorize it, and summarize the relationships identified. Thus, data
mining can be defined as the process of finding correlations or patterns among dozens of
fields in large relational databases. Generally, four types of relationships are sought:
Clusters: Data items are grouped according to specific features. For example, genes
can be grouped into clusters sharing similar gene expression profiles.
Classes: New data is assigned to one of a set of predetermined groups or clusters. For
example, a protein sequence can be assigned to a predefined family group. The class
can then be used to infer structural or functional information.
Associations: Data can be mined to identify associations. The discovery of genotype-
phenotype relationships is an example of associative mining.
Sequential patterns: Data is mined to anticipate behavior patterns and trends. For
example, gene regulation could be predicted based on the presence of specific
promoter motifs and proteins, such as transcription factors.
In order to discover these relationships, statistics methods, such as
clustering/classification, or machine learning methods such as decision trees, artificial neural
networks and support vector machines (SVM) and pattern recognition are used. The most
appropriate method will depend on the nature of the input data and the specific requirements
of the user. Some examples of data mining in bioinformatics are discussed in the following
sections.
Commentaire [MSOffice10] :rawley WJ, Piatetsky-Shapiro G and Matheus CJ. Knowledge Discovery in Databases, 1992 AAAI Press

Chapter 3 : From Data Integration to Knowledge Discovery, The role of Computational Intelligence in Bioinformatics
62
3.1.1. Classification
Classification is used to predict the group (or class) a given object belongs to.
Classification techniques are widely used to mine health.care data, for example, to generate
diagnostics from breast cancer data [93] or to diagnosis pigmented skin lesions [94]. In the
latter example, they compared several classification methods and concluded that, for their
data, logistic regression, artificial neural networks and SVM outperformed K-nearest
neighbor classification and decisions trees.
3.1.2. Clustering
Clustering might be considered today as the most used data mining technique for biological
data. Clustering can be defined as the process of grouping a set of objects into classes of
similar objects. For example, in order to target groups of genes sharing similar expression
profiles, Eisen used hierarchical clustering on the Saccharomyces cerevisiae gene expression
data and produced very promising results that were later validated experimentally [95, 96].
More recently, other clustering techniques have been developed, including k-means
clustering, used by [97] amongst many other, back propagation neural networks [98], fuzzy
clustering [99] and many more.
3.1.3. Association rules
Association rule learning is a popular and well researched method for discovering
interesting relations between variables in large databases. A simple example taken from the
analysis of data recorded by point-of-sale (POS) systems in supermarkets would be the rule:
{onions, potatoes}=>{beef} which indicates that if a customer buys onions and potatoes
together, he or she is likely to also buy beef.
In the past few years, association rules have been used to find knowledge patterns
hidden in various biological datasets. Many of the early applications used the Apriori
algorithm [100] that was developed for mining sparse and weakly correlated data. However,
when mining dense or correlated data, like most biological data, the efficiency of this
algorithm drastically decreases [101]. Moreover, with such data, a huge number of rules are
extracted and many of them are redundant, thus complicating their interpretation [102].
GenMiner [103] is a generic tool designed for association rule discovery in biological data. It

Chapter 3 : From Data Integration to Knowledge Discovery, The role of Computational Intelligence in Bioinformatics
63
allows the analysis of datasets integrating multiple sources of biological data represented as
both discrete values, such as gene annotations, and continuous values, such as gene
expression measures.
3.1.4. Sequential patterns
Sequential pattern mining is used to find the relationships between occurrences of
sequential events, to search for specific order of the occurrences. To quote a simple example,
if we consider data from a book seller database, we could mine the following pattern: 80%
customers who bought the book Database Management typically bought the book Data
Warehousing at the same time, and then later bought the book Knowledge Discovery in
Databases after a certain time interval. In bioinformatics, this has obvious applications in the
analysis of DNA or protein sequences, but it can also be used to search for patterns in time-
associated data, for example, data in relational databases which are time-stamped, or time-
series gene expression profiles.
Tan and Gilbert compared three types of data mining techniques on E. coli, yeast,
promoters and HIV data sets [104]. They compared rule-based learning systems (rules,
decision trees ...), ensemble methods (stacking, bagging, boosting) and statistics based
learning systems (naive Bayes, SVM, artificial neural networks, etc ...) and concluded that no
single algorithm used alone were able to achieve a good classification of the biological data
used. In the same way, they proved that when combining different methods, the classifications
were most accurate. This observation was confirmed a year later by Katsuri and Acharya
[105] who used this time unsupervised techniques to find gene clusters using a mixture of data
(promoter sequences, DNA binding motifs, gene ontologies, data location, etc.) and showed
that collaborative methods identified correlated genes more accurately.
3.2. Text mining in Bioinformatics: focus on
literature
Literature mining is probably the most studied problem in bioinformatics textual
analysis today. Most, if not all, existing applications are based on the processing and analysis
of literature and other scientific publications; despite the fact that nearly all biological data
Chapter 3 : From Data Integration to Knowledge Discovery, The role of Computational Intelligence in Bioinformatics
64
could be considered to be textual. In the rest of this section, we will give an overview of some
developments in the field, although this is far from being an exhaustive list.
3.2.1 Functional annotation
Basic computational applications in bioinformatics rely on protein sequence similarity
and database annotation. The EUCLID system [106] is one illustration of the use of text
mining in bioinformatics, classifying proteins into functional groups based on Swissprot
database keywords. Other examples are based on rules for transferring database information
based on the relationship between proteins in families. Information Extraction (IE)
methodologies have also been deployed to mine information that is not automatically
available from biological databases. As an example Andrade et al, created one of the first
programs in this field by detecting terms in the scientific papers that are statistically correlated
to literature associated with protein families [107].
Other methodologies that rely on ontologies such as the Gene Ontology (GO), are more
efficient than keyword based methodologies in structuring knowledge. Thus, Raychaudhuri et
al, explored the deployment of different document-classification approaches for this task
[108], while Xie et al, combined textual information with sequence similarity scores to
enhance functional annotation using GO [109].
3.2.2 Cellular localization
Determining the subcellular localization of a protein is generally achieved based on
experimental studies. Several studies have also addressed this problem using information
extraction from literature. For example, Nair and Rost in 2002 used lexical information
accessible through annotation database records to predict protein location [110], while Stapley
et al developed an SVM-based system to classify proteins depending on their subcellular
localization from PubMed abstracts [111].
3.2.3 DNA-expression arrays
Text mining techniques applied to scientific papers provide an alternative insight into
expression array experiments by the statistical analysis of the words cited in abstracts that are
linked to genes displaying similar expression patterns. Blaschke et al. in 2001 created a
method called GEISHA using this type of statistical methodology [112]. Other approaches
Chapter 3 : From Data Integration to Knowledge Discovery, The role of Computational Intelligence in Bioinformatics
65
use manually curated keywords or concepts (from GO for example). As an example, FatiGO
system [113] detects relevant GO terms for a gene cluster, with respect to the reference set of
genes. The PubGene system [114] is another approach where the analysis of microarray data
relies on already constructed literature networks for human genes linked to MeSH and GO
terms.
3.2.4 Protein interactions
Most of genome sequencing projects such as Drosophila genome has generated large
scale protein interaction networks gathered into maps. This constitutes a valuable new source
of information concerning protein function and possible new drug targets. Text mining could
help a lot in that sense by connecting the new experiments to the already archived information
in the literature, which provides a complementary analysis for bioinformatics predictions of
protein interactions [115].
3.2.5 Molecular medicine
Biomedical domain is full of cases where text mining, NLP (Natural language
processing) and knowledge-discovery solutions have been employed. Among these solutions,
some are dedicated to the discovery of the relationship between relevant entities like chemical
substances and diseases, some others are used to extract and structure information contained
in clinical records and finally some others are focused on molecules of interest interaction
visualization.
Automatic textual research to find out new, so-called ‘undiscovered’, public knowledge
and to check suggested hypotheses had been primary carried out by Swanson and co-workers.
They achieved an indirect relationship between dietary fish oil and the blood circulation
dysfunction often known as Raynaud’s disease [116]. A series of papers on both topics was
accessible at the time, but no thoughts about using dietary fish oil to cure this illness had been
suggested before. This theory was likewise followed by other scientists to get indirect
relationships between estrogen and Alzheimer’s disease [117] . These kind of methods have
been employed not just to suggest new therapeutic approaches but also to get potentially
negative drug outcomes or also animal models for particular human disorders. NLP methods
have also been built to assist the processing of medical information included in healthcare
documents. As an example MedLEE [118] is a structure that treat medical records to extract
Chapter 3 : From Data Integration to Knowledge Discovery, The role of Computational Intelligence in Bioinformatics
66
and structure scientific facts, and has been used for a long time by the New York Presbyterian
Hospital Clinical Information System. Other illustrations consists on for example the GENIES
approach, within the integrated GeneWays system [119], carries out automated analysis, and
extraction of molecular-interaction information and pathways from full-text journals.
3.3. The role of Machine Learning in modern
bioinformatics
Machine learning is a subfield of artificial intelligence concerned with the design and
development of algorithms for intelligent problem solving and decision making. Although
data mining and machine learning exploit similar algorithms, the goals of the two approaches
are different. While the goal of data mining is to discover interesting patterns or associations
in large datasets, machine learning aims to use such patterns to make predictions or inferences
and to generate new knowledge. Machine learning has a wide spectrum of applications
including natural language processing, speech and handwriting recognition, object recognition
in computer vision, game playing and robot locomotion, as well as bioinformatics. The
general framework for machine learning is as follows: The learning system aims to determine
a description of a given concept from a set of concept examples. Concept examples can be
positive (iron, when teaching the concept of metals) or negative (marble). The learning
algorithm then builds on the type of examples to develop algorithms for making decisions.
For example, a chess computer game uses previous games to learn winning strategies. Some
machine learning systems attempt to eliminate the need for human intervention (unsupervised
learning), while others adopt a collaborative approach between human and machine
(supervised learning). In most cases, human intervention cannot, however, be entirely
eliminated, since the system's designer must specify how the input data is to be represented
and what learning mechanisms will be used.
3.1.1. Supervised learning
Supervised learning is a machine learning technique for deducing a function from
training data. The training data consist of pairs of input objects and desired outputs. The
output of the function can be a continuous value (called regression), or can predict a class of
the input object (called classification). The task of the supervised learner is to predict the
Chapter 3 : From Data Integration to Knowledge Discovery, The role of Computational Intelligence in Bioinformatics
67
value of the function for any valid input object after having seen a number of training
examples (i.e. pairs of input and target output). To achieve this, the learner has to generalize
from the presented data to unseen situations in a "reasonable" way. Supervised learning thus
generates a function that maps inputs to desired outputs, for example, using genetic
algorithms, artificial neural networks, Bayesian networks, decision trees or inductive logic
programming.
3.1.2. Unsupervised learning
Unsupervised learning attempts to determine how the data are organized. Many of the
methods are based on the data mining methods that are used to preprocess data. In contrast to
supervised learning, the learner is given only input examples: the corresponding outputs are
unknown.
The most widely used forms of unsupervised learning are clustering and dimensionality
reduction approaches, such as Principal Components Analysis (PCA) or Independent
Components Analysis (ICA). In this type of learning, the goal is not to develop a mapping
function, but simply to find similarities in the training data. For instance, clustering
individuals based on demographics might result in a clustering of the wealthy in one group
and the poor in another. Although the algorithm cannot assign labels to the clusters, it can
produce them and then use the clusters to assign new objects into one or the other of the
clusters. This is a data-driven approach that can work well when there is sufficient data; for
instance, social information filtering algorithms, such as those that Amazon.com use to
recommend books, are based on the principle of finding similar groups of people and then
assigning new users to groups.
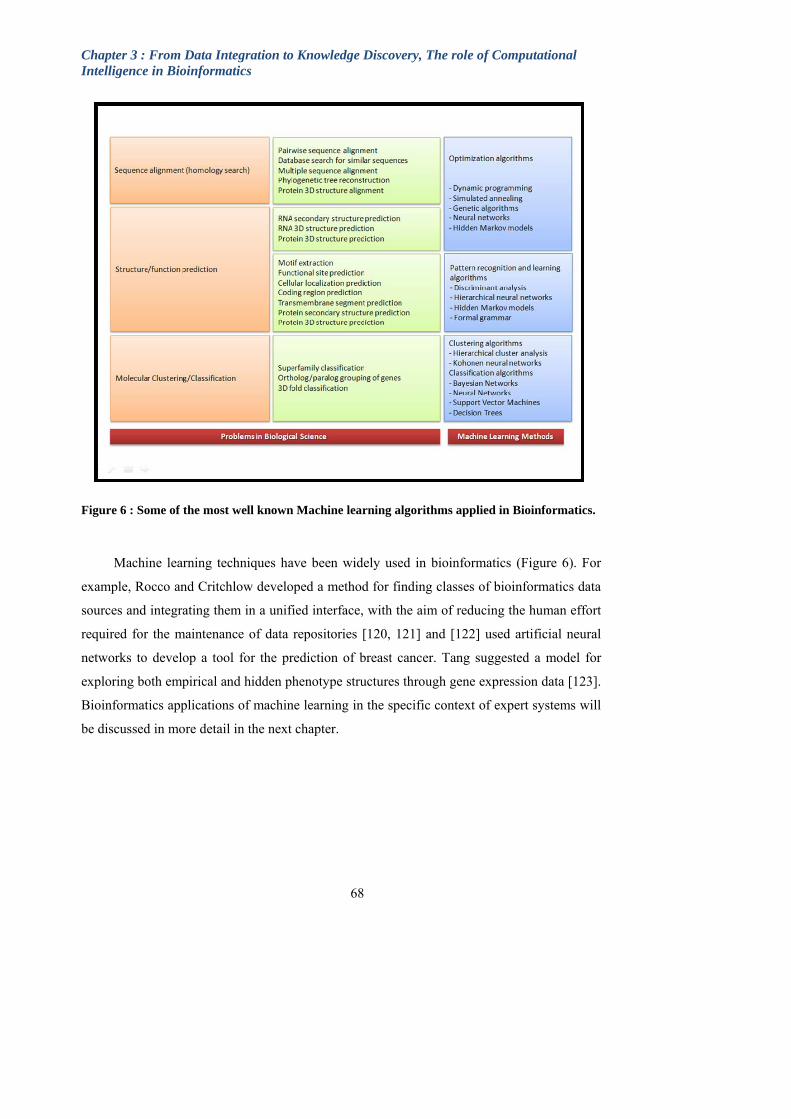
Chapter 3 : From Data Integration to Knowledge Discovery, The role of Computational Intelligence in Bioinformatics
68
Figure 6 : Some of the most well known Machine learning algorithms applied in Bioinformatics.
Machine learning techniques have been widely used in bioinformatics (Figure 6). For
example, Rocco and Critchlow developed a method for finding classes of bioinformatics data
sources and integrating them in a unified interface, with the aim of reducing the human effort
required for the maintenance of data repositories [120, 121] and [122] used artificial neural
networks to develop a tool for the prediction of breast cancer. Tang suggested a model for
exploring both empirical and hidden phenotype structures through gene expression data [123].
Bioinformatics applications of machine learning in the specific context of expert systems will
be discussed in more detail in the next chapter.
Chapter 4 : Knowledge Bases Expert Systems in Bioinformatics
69
Chapter 4
4. Knowledge based expert systems in Bioinformatics
The field of bioinformatics has reached the end of its first phase, where it was mainly
inspired by computer science and computational statistics. The motivation behind this chapter
is to characterize the principles that may underlie the second phase of bioinformatics,
incorporating artificial intelligence techniques in novel systems that attempt to learn, reason
and provide answers to problems that until now required the intervention of a human expert.
Such ‘expert’ systems must first capture the knowledge pertinent to a specific problem.
Techniques exist for helping to extract knowledge from human experts. One such method is
the induction of rules from expert generated examples of problem solutions. This approach
differs from data mining in that the examples used to train the system are selected by experts.
They are designed to cover the important real-world cases and as a consequence, the
‘knowledge base’ is generally of much higher quality. In contrast, data in databases often
contain redundant, irrelevant, noisy data. Furthermore, experts are available to confirm the
validity and usefulness of the discovered patterns. Thus, expert systems represent an ideal tool
for the new field of integrative systems biology. In the rest of this chapter, we will first
discuss the requirements for expert systems in systems-level biology (section 4.1). We will
then enumerate some real world applications of expert systems in the biological field (section
4.2) before making a focus on one type of expert system: Knowledge Based Expert Systems
(section 4.3).
4.1. Expert systems for systems-level biology
The development of high-throughput biotechniques and the subsequent omics studies is
leading the way to exciting new routes of scientific exploration. Instead of being restricted to
the analysis of a handful of genes or proteins per experiment, whole genomes and proteomes
can be analyzed today. This allows biologists, with the help of bioinformaticians, to explore

Chapter 4 : Knowledge Bases Expert Systems in Bioinformatics
70
more complicated processes than were possible before [124-127]. This task is not easy to
achieve. The more new data we have, the harder their exploitation is. The human genome
project [128] provides a good illustration: once the technological limitations were overcome
and the DNA sequence was obtained, the goals rapidly moved to its annotation, i.e. the
identification of the genes encoded by the genome and their functions. Hence, like the
biotechniques, large projects have been started, with research groups collaborating to find
solutions to complex bioinformatics problems.
As a consequence, new layers of bioinformatics annotations, predictions and analysis
results are being added to the experimental omics data. The new data is then made
progressively available through public web-accessible data resources such as Ensembl or the
UCSC Genome Browser. Because the data is broadcast via the web, this results in new
problems of data management, maintenance and usage. Easy access is clearly necessary to
allow biologists to use these data as a source of information for in silico data integration
experiments.
Nevertheless, integrating these heterogeneous data sets across different databases is
technically quite difficult, because one must find a way to extract information from a variety
of search interfaces, web pages and APIs. To complicate matters, some databases periodically
change their export formats, effectively breaking the tools that allow access to their data. At
the same time, most omics databases do not yet provide computer-readable metadata and,
when they do, it is not in a standard format. Hence, expert domain-specific knowledge is
needed to understand what the data actually represents, before it can be used in integration
experiments. This limits the practical scale and breadth of integration, given the variety and
amount of data obtainable from distributed resources.
Today’s bioinformatics analyses require a combination of experimental, theoretical and
computational approaches and a crucial factor for their success will be the efficient
exploitation of the mass of heterogeneous data resources that include genomic sequences, 3D
structures, cellular localisations, phenotype and other types of biologically pertinent data.
However, several restrictions of these ‘omics’ data have been highlighted. For example, data
emerging from ‘omic’ approaches are noisy (data can be missing due to false negatives, and
data can be misleading due to false positives) and it has been proposed that some of these
Chapter 4 : Knowledge Bases Expert Systems in Bioinformatics
71
limitations can be overcome by integrating data obtained from two or more distinct
approaches [129].
In this context, scientists from different spheres must collaborate in order to provide the
expert knowledge for their specific domain. As the application of an ‘intelligent’ expert
system depends on the biological data available, we now have a "vicious circle" in the sense
that we need computational intelligence to treat biological data, but the choice of the
computational intelligence approach is data driven, which sometimes makes it difficult to
choose between different algorithms. Nevertheless, expert systems have been used in biology
for several years now, and the next section presents a non exhaustive list of some of the most
important applications.
4.2. Expert systems: real-world applications
4.2.1 Medical diagnostics
One of the first direct applications of expert systems in a biological discipline was in the
medical domain. This is a very data-rich domain and the use of knowledge based systems has
become essential.
Knowledge-based expert systems are popular in areas where knowledge is much more
widespread than data, which then requires heuristics as well as reasoning logic to discover
brand new knowledge. Ackoff described data as a raw entity that just exists, while knowledge
is understood to be an accumulation of relevant, useful information [130]. In the healthcare
industry, a balanced mixture of domain knowledge and data are employed for the detection,
diagnosis, (interpretation) and treatment of diseases. Depending on the specific problem, the
balance between data and knowledge may differ and appropriate systems are selected and
deployed, such as rule-based arguing (RBR), model-based arguing (MBR) or case-based
reasoning (CBR).
RBR, MBR and CBR are complementary approaches with different advantages and
disadvantages. Consequently, some systems make use of a mixed strategy, for example (i)
BOLERO [131] enhances rule-based diagnoses according to the information available
concerning the patient, (ii) MIKAS [132] combines RBR and CBR to automatically produce a
menu designed for a specific patient, (iii) PROTOS [133] is essentially used in medical
audiology and incorporatees knowledge acquisition for heuristic classifications, (iv) CASEY

Chapter 4 : Knowledge Bases Expert Systems in Bioinformatics
72
[134] combines CBR and MBR in order to resolve the problem of Causal models based on
previously observed cases and, at the same time, computing the similarity between behaviors
to extend possible solutions, (v) T-IDDM [135] is a multi-modal reasoning system that helps
physicians by providing an accurate decision support tool for the diagnosis of type 1 diabetes
by integrating RBR, CBR and MBR.
The transformation of implicit knowledge into explicit rules often leads to a change of
data content. An alternative to this type of inference is statistical inference using methods
such as Bayes theorem, which models a probabilistic value for every suggested result (e.g.
disease in medical domain). Two examples of this are the diagnosis and management of
pacemaker-related troubles using an interactive expert system [136] and expert systems for
healthcare forecasts [137]. Such expert systems may be effectively employed for reciprocally
exclusive diseases and independent symptoms, but fail whenever several symptoms have a
similar factor and a patient may suffer from more than one disease. Consequently, there are
many situations where knowledge-based expert systems are not suitable. For this kind of
scenario, artificial neural networks have been developed. Artificial neural networks (ANN)
are extensively employed for diagnosis when a large amount of data is available, for example
in cardiology [138]. An alternative approach is the use of a Genetic Algorithm (GA), for
example [139] who used GA to find the number of neurons of the hidden level.
4.2.2. DNA sequence analysis: Forensic science
An interesting application of expert systems is the analysis of DNA sequences in
forensic science. We have all heard about forensic science thanks to Hollywood movies and
TV series, where a scientist simply inserts a tube into a machine and immediately recognizes
the suspect. A lot of us think that this is somewhat exaggerated and untrue. Well this is not the
case. Forensic Science is a very developed science and due to its importance, governments
devote large budgets to research in this domain.
The control of forensic biological materials and the decryption of DNA profile data is
complicated and needs significant resources both in terms of equipment and of experienced
staff. However the development of automatic equipment to speed up the extraction of DNA
from forensic samples, to evaluate and amplify the samples, along with multi-capillary
electrophoresis instrumentation has shifted the importance towards the information analysis
level. Typically, the analysis and decryption of DNA profile data was carried out by hand by
Commentaire [j11] : ???
Chapter 4 : Knowledge Bases Expert Systems in Bioinformatics
73
at least two independent experienced, knowledgeable human researchers. Nevertheless, this
can be a time-consuming procedure and recently, DNA profiling interpretation has been
automated by exchanging the human staff with bioinformatics software and notably, expert
systems.
Knowledge based expert systems have been developed as a way to speed up the DNA
analysis, therefore decreasing the time required to analyse a significant quantity of DNA
profiles, for example, GeneMapper ID (Applied Biosystems, Foster City, CA, USA), FaSTR
DNA [140] or FSS-i3 (The Forensic Science Service DNA Expert System Suite FSS-i3).
In each one of these expert systems, rules are activated each time a DNA profile is not
from a unique source or when the standard of the profile is substandard. The expert system
then requests the analyst to manually re-examine the information and accept or reject the
assignment made. The combined usage of such automated systems has been shown to offer
impartial “expert” analyses, which improve consistency and save analysis time in comparison
to manual processing.
4.2.3. Protein sequence analysis
The sequencing of complete genomes for numerous organisms has resulted in the
classification of a large number of new proteins of unknown biological function. In order to
investigate the biological activity of the proteins, the first step is to determine its primary
structure, i.e. the ordered sequence of amino acids making up the protein. Knowledge of the
amino acid sequence then allows predictions to be made about protein structure and the
relationships between different proteins. Expert systems have been used to solve a number of
different problems in protein sequence analysis.
The precise determination of amino acid sequences in proteins is a very important
analytical task in biochemistry, and the most common type of instrumentation used for this
employs Edman degradation [141]. In this method, N-terminal amino acid residues are
repeatedly labelled and cleaved from the protein. The amino acids are then identified as their
phenylthiohydantoin (PTH) derivatives by high performance liquid chromatography (HPLC is
a form of column chromatography used frequently in biochemistry and analytical chemistry to
separate, identify, and quantify compounds).
Chapter 4 : Knowledge Bases Expert Systems in Bioinformatics
74
In this context [142] developed an expert system that uses heuristic rules built by human
experts in protein sequencing. The system is used to the chromatographic data of
phenylthiohydantoin-amino acids acquired from an automated sequencer. The peak intensities
in the current cycle are compared with those in the previous cycle, while the calibration and
succeeding cycles are used as ancillary recognition criteria when necessary. The retention
time for each chromatographic peak in each cycle is corrected by the corresponding peak in
the calibration cycle at the same run.
As another case study of an ES application, [143] reported an expert system for rapid
recognition of metallothionein (MT) proteins. MT proteins are responsible for regulating the
intracellular supply of biologically essential zinc and copper ions and play a role in protecting
cells from the deleterious effects of high concentration metal ions. MT is generally induced
when the organism experiences certain stress conditions and therefore, recognition of MT
from tissues or from animal models is very important.
In order to develop an expert system for this task, the physical and chemical
characteristics of MT proteins were derived based on a set of experiments conducted using
animal models. The derived characteristics were broken into a set of rules, including (1)
proteins with low molecular weight versus high molecular weight, (2) proteins with metal
content versus no metal content, (3) the presence or absence of aromatic amino acids and (4)
sulphur content versus no sulphur content. The derived rules (consisting of a series of
attributes and value pairs, followed by a single conclusion that contains the class and the
corresponding class value) were produced using the ID3 algorithm [144], and a minimum
number of rules were selected using human expertise to maximize true positive recognition.
The rules were then formulated into an IF – THEN – ELSE algorithm.
ProFound [145] is another example of a protein recognition expert system. Developed
in the Rockfeller University, this expert system is a search engine which employs a Bayesian
algorithm to identify proteins from protein databases using mass spectrometric peptide
mapping data. The algorithm ranks protein candidates by taking into account individual
properties of each protein in the database as well as other data relevant to the peptide mapping
experiment. The program consistently identifies the correct protein(s) even when the data
quality is relatively low or when the sample consists of a simple mixture of proteins.
Chapter 4 : Knowledge Bases Expert Systems in Bioinformatics
75
Mass spectrometry is an analytical technique for the identification of the basic
composition of a sample or molecule. It is also used for the determination of the chemical
structures of molecules, such as peptides (parts of protein sequences) and other chemical
compounds.
The rapid growth of protein and DNA sequence databases together with technological
improvements in biological mass spectrometry (MS) has made the association of mass
spectrometric peptide mapping with database searching a good method for the rapid
identification of peptides. The principle of this traditional technique involves degradation of
proteins with an enzyme having high specificity (usually trypsin), the resulting peptides are
subject to analysis by either matrix-assisted laser desorption/ionization mass spectrometry
(MALDI-MS) or electrospray ionization mass spectrometry (ESI-MS). Employing an
appropriate computer algorithm, the masses established for the resulting peptides are
compared with masses calculated for theoretically possible enzymatic degradation products
for every sequence in a protein/DNA sequence database. This technique suffers from several
small problems that taken together cause errors and inaccuracies. Nevertheless, the method is
relatively insensitive to unspecified modifications and/or sequence errors in the database
because high-confidence identifications can be made even when the mapping experiment
yields data on only a small percentage of the sequence.
Protein recognition by the described approach requires a strategy for determining the
best match between the studied biological entity and a sequence in the database. Known
systems for finding the best match include ranking by number of matches and a scoring
scheme based on the observed frequency of peptides from all proteins in a database in a given
molecular weight range (the so-called “MOWSE score”). When the mass spectral data are
partial (i.e., only a few peaks in the spectrum) and/or of low mass accuracy, the “number-of
matches” approach may be deficient to make a useful recognition. While the MOWSE scoring
scheme is much superior to the number-of-matches approach, it does not take into account the
individual properties of any given protein. An optimal scoring system requires that individual
properties of each protein in the database be considered.
Thus, the ProFound team developed an expert system for identifying proteins using MS
peptide mapping data. The system ranks protein candidates using a Bayesian algorithm that
takes into account individual properties of each protein in the database as well as other
Chapter 4 : Knowledge Bases Expert Systems in Bioinformatics
76
information pertinent to the experiment. Bayesian probability theory has been widely used to
make scientific inference from incomplete information in distinct fields, including biopolymer
sequence alignment, NMR spectral analysis, and radar target recognition. When the system
under study is modeled properly, the Bayesian approach is believed to be always among the
most coherent, consistent, and efficient statistical methods. Bayesian probability theory was
used to make logical inference about the identity of an unknown protein sample against a
protein sequence database.
4.2.4. Genome annotation
Discovering genes, their organization, structure and function is a significant problem in
the genomic and post-genomic era. Two areas of genomic biology are specialized in this
process, structural and functional annotation. Structural annotation describes the task of
discovering genes, their location over a biological sequence, their exon/intron structure and
predicting the protein sequences that they encode. Functional annotation aspires to predict the
biological function of genes and proteins.
Both structural and functional annotation generally call for the composite chaining of
different algorithms, software and procedures each using its own distinct group of input
parameters and output format. At important steps of these "pipelines", expert biologists are
required in many cases to make crucial decisions, alter the dataset, evaluate intermediate
outcomes, manually handle as well as change different files, etc. which can be laborious and
may end up being error prone. With regard to the management of large volumes of data
published by sequencing projects, automation of these workflows is critical. Several groups
have developed annotation systems to automate these pipelines, especially in the area of
structural annotation (e.g. Ensembl pipeline).
In terms of functional annotation, several systems automate pairwise similarity based
methods, and much less have automated the more complicated phylogenomic inference
techniques. Gouret et al addressed this problem by developing Figenix, which is an expert
system that allow much more automation of the annotation process [146]. The system mimics
the biologist’s expertise at each step of the annotation process and currently has 8 different
workflows of structural and functional annotation.
Chapter 4 : Knowledge Bases Expert Systems in Bioinformatics
77
4.3. Expert System Design: focus on knowledge-based
systems
Human expert knowledge is a combination of a theoretical understanding in a given
domain and a collection of heuristic problem-solving rules that experience has shown to be
effective. Knowledge-based expert systems can be constructed by obtaining this knowledge
from a human expert and transforming it into a form that a computer may use to solve similar
problems. The 'expert' program does not know what it knows through the raw volume of facts
in the computer's memory, but by virtue of a reasoning-like process of applying a set of rules
to the knowledge. It chooses among alternatives, not through brute-force calculation, but by
using some of the same rules-of-thumb that human experts use.
Thus, an expert system can be described as a computer program that simulates the
judgment and behavior of experts in a particular field and uses their knowledge to provide
problem analysis to users of the software. There are several forms of expert systems that have
been classified according to the methodology used [147], including:
rule-based systems use a set of rules to analyze information about a specific class of
problems and recommend one or more possible solutions
case-based reasoning systems adapt solutions that were used to solve previous
problems and use them to solve new problems
neural networks implement software simulations of massively parallel processes
involving the processing of elements that are interconnected in a network architecture
fuzzy expert systems use the method of fuzzy logic, which deals with uncertainty and
is used in areas where the results are not always binary (true or false), but involve grey
areas and the term “may be”.
Expert systems were first used in the mid-1960s when a few AI researchers, who grew
tired of searching for the illusive general-purpose reasoning machine, turned their attention
toward well-defined problems where human expertise was the cornerstone for solving the
problems [148]. But expert systems really took off with the development of the internet in the
1990’s, which facilitated access to data and deployment of applications. Today, thousands of
systems are in routine use world-wide, particularly in business, industry and government.
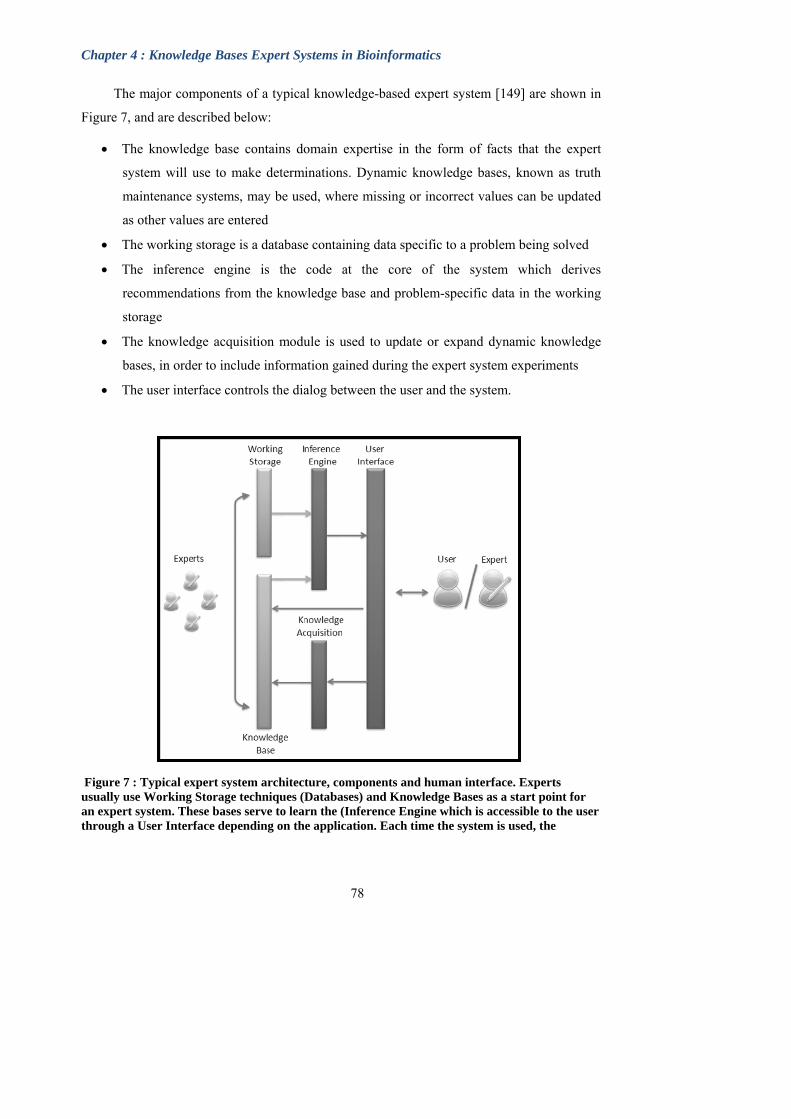
Chapter 4 : Knowledge Bases Expert Systems in Bioinformatics
The major components of a typical knowledge-based expert system [149] are shown in
Figure 7, and are described below:
The knowledge base contains domain expertise in the form of facts that the expert
system will use to make determinations. Dynamic knowledge bases, known as truth
maintenance systems, may be used, where missing or incorrect values can be updated
as other values are entered
The working storage is a database containing data specific to a problem being solved
The inference engine is the code at the core of the system which derives
recommendations from the knowledge base and problem-specific data in the working
storage
The knowledge acquisition module is used to update or expand dynamic knowledge
bases, in order to include information gained during the expert system experiments
The user interface controls the dialog between the user and the system.
Figure 7 : Typical expert system architecture, components and human interface. Experts usually use Working Storage techniques (Databases) and Knowledge Bases as a start point for an expert system. These bases serve to learn the (Inference Engine which is accessible to the user through a User Interface depending on the application. Each time the system is used, the
78
Chapter 4 : Knowledge Bases Expert Systems in Bioinformatics
79
Knowledge Base is enriched through Knowledge Acquisition modules that catch new information generated by the user who might also be an expert.
In this context, we can define an expert system as a framework that manages
information dynamically by the integration of dedicated analysis tools. The tools to be used in
any particular situation are chosen by special modules that reason about the best algorithms to
use according to the information type and features. The reasoning part may be created using
current Artificial Intelligence concepts and subsequently incorporated in the expert system
which may also include workflows as an elementary module.
The following general points about expert systems and their architecture have been
demonstrated [150]:
The sequence of steps used to analysis a particular problem is not explicitly
programmed, but is defined dynamically for each new case
Expert systems allow more than one line of reasoning to be pursued and the results of
incomplete (not fully determined) reasoning to be presented
Problem solving is accomplished by applying specific knowledge rather than a
specific technique. This is a key idea in expert systems technology. Thus, when the
expert system does not produce the desired results, the solution is to expand the
knowledge base rather than to re-program the procedures.
As expert system techniques have matured into a standard information technology, the
most important recent trend is the increasing integration of this technology with conventional
information processing, such as data processing or management information systems. These
capabilities reduce the amount of human intervention required during processing of large-
scale data, such as genome-scale biological data.
Chapter 5 : Multiple Alignment of Protein Sequences : A case study for Expert Systems in Bioinformatics
80
Chapter 5
5. Multiple Alignment of Protein Sequences:
a case study for Expert Systems in Bioinformatics
5.1. Introduction
Protein multiple alignment represents an ideal case study for the development of
knowledge-based expert systems in bioinformatics, for a number of reasons. First, proteins are
the molecular workhorses of biology, responsible for carrying out a tremendous range of
essential functions, such as catalysis, transportation of nutrients, and recognition and
transmission of signals. Second, the genome sequencing projects are providing huge amounts
of raw data, in the form of protein sequences. The sequences are not equally distributed, since
some evolutionary branches are much more widely studied than others and some important
protein families more widely studied than others. Furthermore, the new sequences are mostly
predicted by automatic methods and thus, contain a significant number of sequence errors.
The problem has been exacerbated by the next generation sequencing technologies that can
sequence up to one billion bases in a single day at low cost. However, these new technologies
produce read lengths as short as 35–40 nucleotides, resulting in fragmentary protein
sequences [151]. Third, protein sequence analysis has a long history and is one of the most
widely studied fields in bioinformatics. In particular, hundreds of methods have been
developed for multiple alignment construction and analysis. Some of the most important of
these methods will be discussed in detail in chapter 6.
This chapter begins with a brief discussion of protein function and evolution (section
5.1). Protein multiple alignment is then discussed in more detail. Section 5.2 describes the
fundamental role of multiple alignments in many bioinformatics applications. Section 5.3 then
describes the most widely used methods for multiple alignment construction and analysis.
Commentaire [j12] : Pop M, Salzberg SL Bioinformatics challenges of new sequencing technology. Trends Genet. 2008 Mar;24(3):142-9.
Chapter 5 : Multiple Alignment of Protein Sequences : A case study for Expert Systems in Bioinformatics
81
5.2. The protein world
5.2.1. Protein sequence, structure and function
Classified by biological function, proteins include the enzymes, which are responsible
for catalyzing the thousands of chemical reactions of the living cell; structural proteins, such
as tubulin, keratin or collagen; transport proteins, such as hemoglobin; regulatory proteins,
such as transcription factors or cyclins that regulate the cell cycle; signaling molecules such as
some hormones and their receptors; defensive proteins, such as antibodies which are part of
the immune system; and proteins that perform mechanical work, such as actin and myosin, the
contractile muscle proteins.
Every protein molecule has a characteristic three-dimensional shape or conformation,
known as its native state. Fibrous proteins, such as collagen and keratin, consist of
polypeptide chains arranged in roughly parallel fashion along a single linear axis, thus
forming tough, usually water-insoluble, fibres or sheets. Globular proteins, e.g., many of the
known enzymes, show a tightly folded structural geometry approximating the shape of an
ellipsoid or sphere. The precise 3D structure of a protein molecule is generally required for
proper biological function, since the specific conformation is needed that cell factors can
recognise and interact with. If the tertiary structure is altered, e.g., by such physical factors as
extremes of temperature, changes in pH, or variations in salt concentration, the molecule is
said to be denatured; it usually exhibits reduction or loss of biological activity.
The process by which a protein sequence assumes its functional shape or conformation
is known as folding. Protein folding can be considered as a hierarchical process, in which
sequence defines secondary structure, which in turn defines the tertiary structure (Figure 8).
Other molecules, such as chaperones, may also direct the folding of large newly synthesized
proteins into their native 3D structure.
Commentaire [j13] : j'ai pris cette section de ma these. tu trouveras les refs la-dedans.
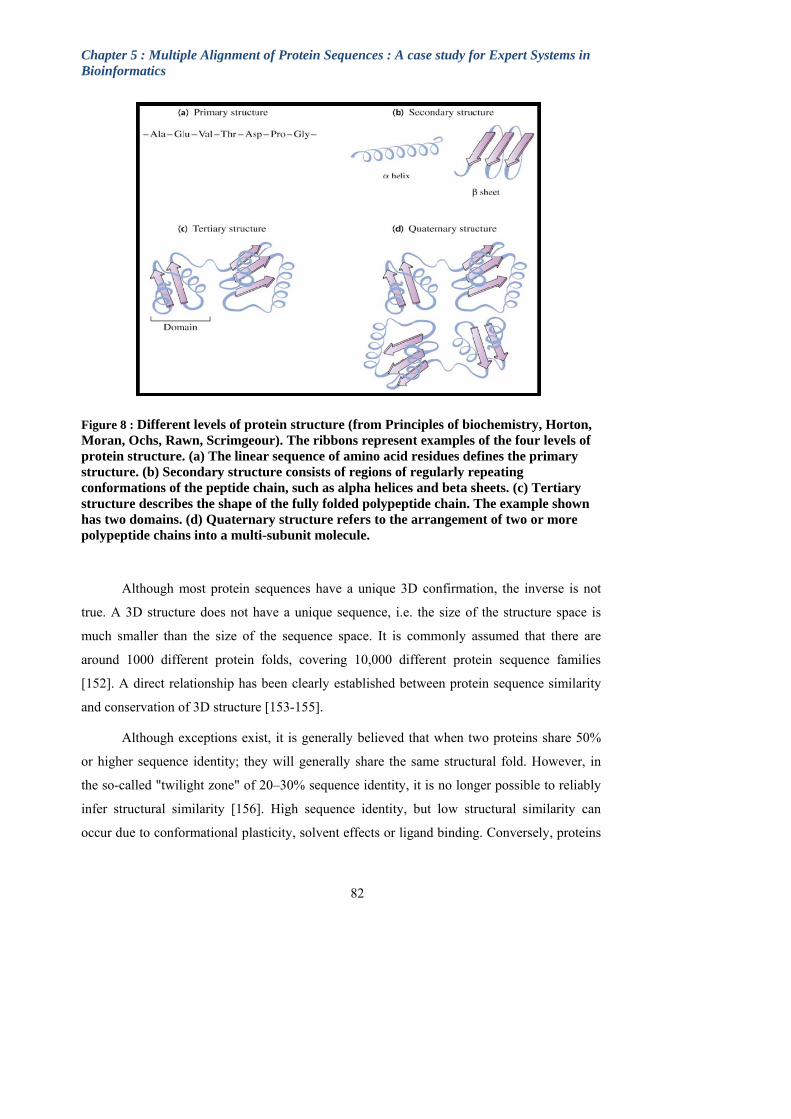
Chapter 5 : Multiple Alignment of Protein Sequences : A case study for Expert Systems in Bioinformatics
82
Figure 8 : Different levels of protein structure (from Principles of biochemistry, Horton, Moran, Ochs, Rawn, Scrimgeour). The ribbons represent examples of the four levels of protein structure. (a) The linear sequence of amino acid residues defines the primary structure. (b) Secondary structure consists of regions of regularly repeating conformations of the peptide chain, such as alpha helices and beta sheets. (c) Tertiary structure describes the shape of the fully folded polypeptide chain. The example shown has two domains. (d) Quaternary structure refers to the arrangement of two or more polypeptide chains into a multi-subunit molecule.
Although most protein sequences have a unique 3D confirmation, the inverse is not
true. A 3D structure does not have a unique sequence, i.e. the size of the structure space is
much smaller than the size of the sequence space. It is commonly assumed that there are
around 1000 different protein folds, covering 10,000 different protein sequence families
[152]. A direct relationship has been clearly established between protein sequence similarity
and conservation of 3D structure [153-155].
Although exceptions exist, it is generally believed that when two proteins share 50%
or higher sequence identity; they will generally share the same structural fold. However, in
the so-called "twilight zone" of 20–30% sequence identity, it is no longer possible to reliably
infer structural similarity [156]. High sequence identity, but low structural similarity can
occur due to conformational plasticity, solvent effects or ligand binding. Conversely, proteins

Chapter 5 : Multiple Alignment of Protein Sequences : A case study for Expert Systems in Bioinformatics
83
in the ‘twilight zone’ of sequence similarity (<25% identity) can share surprisingly similar 3D
folds [157].
The relation between 3D fold and function is much more complex [158, 159] and the
same fold is often seen to have different functions. After translation, the posttranslational
modification (PTM) of amino acids can extend the range of functions of the protein by
attaching to it other biochemical functional groups such as acetate, phosphate, various lipids
and carbohydrates, by changing the chemical nature of an amino acid (e.g. citrullination) or
by making structural changes, such as the formation of disulfide bridges [160]. With respect
to enzymes, local active-site mutations, variations in surface loops and recruitment of
additional domains accommodate the diverse substrate specificities and catalytic activities
observed within several superfamilies. Conversely, different folds can perform the same
function, sometimes with the same catalytic cluster and mechanism (for example, trypsin and
subtilisin proteinases). General rules seem to be that for pairs of domains that share the same
fold, precise function appears to be conserved down to ~ 40 % sequence identity, whereas
broad functional class is conserved to ~ 25 % [161]. These results highlight the need to look
beyond simple evolutionary relationships, at the details of a molecule's active site, to assign a
specific function.
5.2.2. Protein evolution
During evolution, random mutagenesis events take place, which change the gene
sequences that encode RNA and proteins. There are several different types of mutation that
can occur. Point mutations substitute a single nucleic or amino acid residue for another one.
Residue insertions and deletions also occur, involving a single residue up to several hundred
residues. Other evolutionary mechanisms at work in nature include genetic recombination,
where DNA strands are broken and rejoined to form new combinations of genes. Some of
these evolutionary changes will make a protein non-functional, e.g. most mutations of active
site residues in an enzyme, or mutations that prevent the protein from folding correctly. If this
happens to a protein that carries out an essential process, the cell (or organism) containing the
mutation will die. As a result, residues that are essential for a protein's function, or that are
needed for the protein to fold correctly, are conserved over time. Occasionally, mutations

Chapter 5 : Multiple Alignment of Protein Sequences : A case study for Expert Systems in Bioinformatics
84
occur that give rise to new functions. This is one of the ways that new traits and eventually
species may come about during evolution.
5.2.3. Protein comparative analysis
By comparing related sequences and looking for those residues that remain the same in
all of the members in the family, we can learn a lot about which residues are essential for
function [162]. Thus, multiple sequence comparison or alignment has become a fundamental
tool in many different domains in modern molecular biology, from evolutionary studies to
prediction of 2D/3D structure, molecular function and inter-molecular interactions etc. By
placing the sequence in the framework of the overall family, multiple alignments not only
identify important structural or functional motifs that have been conserved through evolution,
but can also highlight particular non-conserved features resulting from specific events or
perturbations [163, 164].
5.3. Multiple sequence alignment
There exist two main categories of sequence alignment: pairwise alignment (or the
alignment of two sequences) and multiple alignment. Pairwise alignments are most commonly
used in database search programs such as Blast and Fasta in order to detect homologues of a
novel sequence. Multiple alignments, containing from three to several hundred sequences, are
more computationally complex than pairwise alignments and in general simultaneous
alignment of more than a few sequences is rarely attempted. Instead a series of pairwise
alignments are performed and amalgamated into a multiple alignment. Nevertheless, multiple
alignments have the advantage of providing an overall view of the family, thus helping to
decipher the evolutionary history of the protein family. Multiple sequence alignments are
useful in identifying conserved patterns in protein families, which may not be evident from
pairwise alignments. They are also used in the determination of domain organisation, to help
predict protein secondary/tertiary structure and in phylogenetic studies.
The purpose of any sequence alignment, whether pairwise or multiple, is to show how a
set of sequences may be related, in terms of conserved residues, substitutions, insertion and
deletion events (indels). In the most general terms, an alignment represents a set of sequences
using a single-letter code for each amino acid (for protein sequences) or nucleotide (for

Chapter 5 : Multiple Alignment of Protein Sequences : A case study for Expert Systems in Bioinformatics
85
DNA/RNA sequences). Structurally / functionally equivalent residues are aligned either in
rows, or more usually in columns (Figure 9). When the sequences are of different lengths,
insertion-deletion events are postulated to explain the variation and gap characters are
introduced into the alignment.
Figure 9 : Example alignment of a set of 7 hemoglobin domain sequences
The alignment shows the 7 helical structure (PDB:1a00) and the conserved residues forming the heme pocket of the beta subunit (green triangles). The symbols below the alignment indicate conserved positions: * = fully conserved identical residue, : = fully conserved ‘similar’ residue, . = partially conserved ‘similar’ residue.
Sequence alignments can be further divided into global alignments that align the
complete sequences and local alignments that identify only the most similar segments or
sequence patterns (motifs). In local alignments, the conserved motifs are identified and the
rest of the sequences are included for information only. Thus, only a subset of the residues is
actually aligned. In global alignments, all the residues in both sequences participate in the
alignment.
In order to allow the maximum integration of biological information in the context of
the complete protein family, a multiple alignment of the full length of the sequences is
essential. Global Multiple Alignments of Complete Sequences (MACS) provide an ideal basis
for more in-depth analyses of protein family relationships. By placing the sequence in the
context of the overall family, the MACS permit not only a horizontal analysis of the sequence
over its entire length, but also a vertical view of the evolution of the protein. The MACS thus
represents a powerful integrative tool that addresses a variety of biological problems, ranging

Chapter 5 : Multiple Alignment of Protein Sequences : A case study for Expert Systems in Bioinformatics
86
from key functional residue detection to the evolution of a protein family. The MACS now
plays a fundamental role in most areas of modern molecular biology, from shaping our basic
conceptions of life and its evolutionary processes, to providing the foundation for the new
biotechnology industry.
5.4. Multiple alignment applications
5.4.1. Phylogenetic studies
One of the earliest applications of multiple sequence alignments was in phylogenetic
studies. Phylogenetics is the science of estimating the evolutionary past, in the case of
molecular phylogeny, based on the comparison of DNA or protein sequences. For example,
the accepted universal tree of life, in which the living world is divided into three domains
(bacteria, archaea, and eucarya), was constructed from comparative analyses of ribosomal
RNA sequences (Figure 10).
Figure 10 : Alternative hypotheses for the rooting of the tree of life
In b), i indicates informational proteins and o indicates operational proteins.
According to this rRNA-based tree, billions of years ago a universal common
prokaryotic-like ancestor gave rise to the two microbial branches, the archaea and bacteria
(collectively called prokarya) and later, the archaea gave rise to the eukarya [165] (Figure
10a). More recently, analyses based on whole-genome comparisons have suggested that the
eukaryotic lineage arose from metabolic symbiosis between eubacteria and methanogenic
archaea [166] (Figure 10b). In this case, early eukaryotes would be a chimera of eubacterial
and archaeal genes, in which the operational genes were primarily from the eubacteria, and
the informational genes from the archaea. But some important eukaryotic genes have no
Chapter 5 : Multiple Alignment of Protein Sequences : A case study for Expert Systems in Bioinformatics
87
obvious predecessors in either the archaeal or the bacterial lines, and an alternative has been
suggested where prokaryotes would have evolved by simplification of an ancestral
eukaryotic-like genome [167, 168] (Figure 10c). In a comprehensive study of ribosomal genes
in complete genomes from 66 different species, the archaeal ribosome appeared to be a small-
scale model of the eukaryotic one in terms of protein composition [169], which would support
the eukaryotic-rooting tree.
The methods for calculating phylogenetic trees fall into two general categories [170].
These are distance-matrix methods, also known as clustering or algorithmic methods (e.g.
UPGMA or neighbour-joining), and discrete data methods, also known as tree searching
methods (e.g. parsimony, maximum likelihood, Bayesian methods). All of these methods use
distance measures based on the multiple sequence alignment and the strategy used to
construct the alignment can have a large influence on the resulting phylogeny [171].
5.4.2. Comparative genomics
Of course, in the current era of complete genome sequences, it is now possible to
perform comparative multiple sequence analysis at the genome level [172]. As genomes
evolve, large-scale evolutionary processes, such as recombination, deletion or horizontal
transfer, cause frequent genome rearrangements [173]. Comparative analyses of complete
genomes present a comprehensive view of the level of conservation of gene order, or synteny,
between different genomes, and thus provide a measure of organism relatedness at the
genome scale [174-176]. Examples of such analyses include comparisons among enteric
bacteria [177] and between mouse and human [178]. Comparative genomics is thus an
attempt to take advantage of the information provided by the signatures of selection to
understand the function and evolutionary processes that act on genomes.
But comparative genomics can also take a medium-resolution view. By identifying all
the known genes from one genome and finding their matching genes, if they exist, in another
genome, we can determine which genes have been conserved between species and which are
unique. The DNA sequences encoding the proteins and RNA responsible for the functions
shared between distantly related organisms, as well as the DNA sequences for controlling the
expression of such genes, should be preserved in their genome sequences. Conversely,
sequences that encode proteins or RNAs responsible for differences between species will
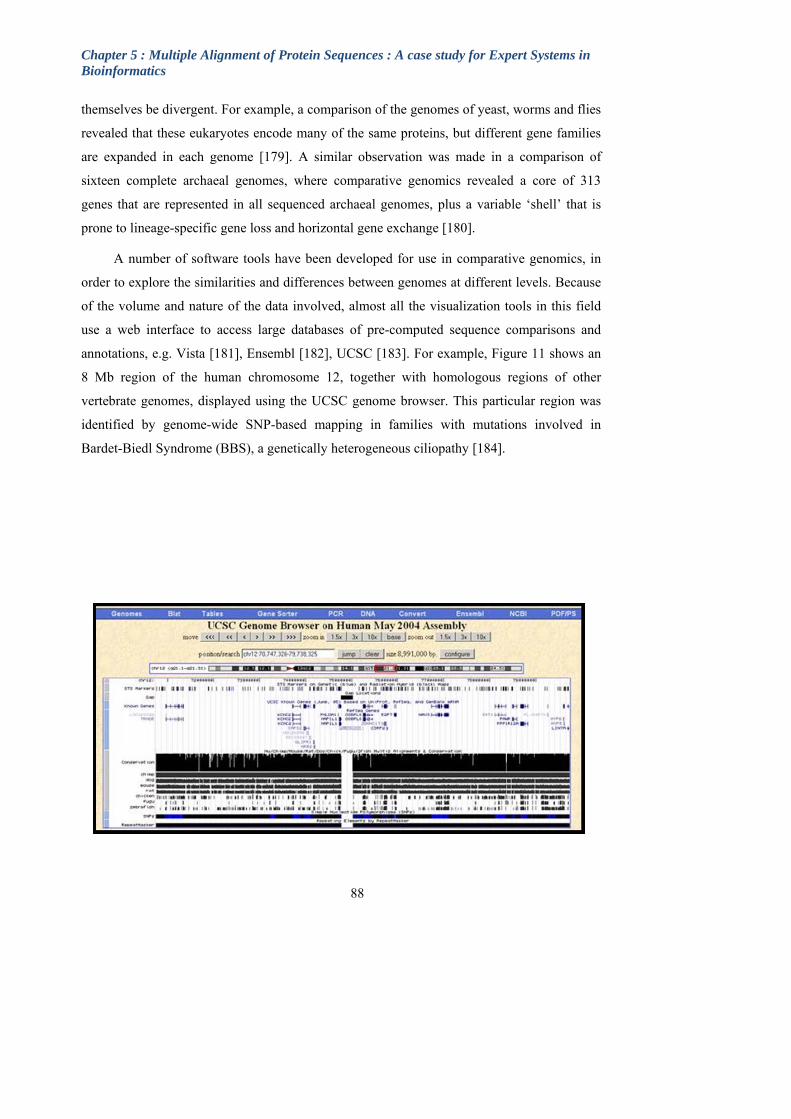
Chapter 5 : Multiple Alignment of Protein Sequences : A case study for Expert Systems in Bioinformatics
themselves be divergent. For example, a comparison of the genomes of yeast, worms and flies
revealed that these eukaryotes encode many of the same proteins, but different gene families
are expanded in each genome [179]. A similar observation was made in a comparison of
sixteen complete archaeal genomes, where comparative genomics revealed a core of 313
genes that are represented in all sequenced archaeal genomes, plus a variable ‘shell’ that is
prone to lineage-specific gene loss and horizontal gene exchange [180].
A number of software tools have been developed for use in comparative genomics, in
order to explore the similarities and differences between genomes at different levels. Because
of the volume and nature of the data involved, almost all the visualization tools in this field
use a web interface to access large databases of pre-computed sequence comparisons and
annotations, e.g. Vista [181], Ensembl [182], UCSC [183]. For example, Figure 11 shows an
8 Mb region of the human chromosome 12, together with homologous regions of other
vertebrate genomes, displayed using the UCSC genome browser. This particular region was
identified by genome-wide SNP-based mapping in families with mutations involved in
Bardet-Biedl Syndrome (BBS), a genetically heterogeneous ciliopathy [184].
88
Chapter 5 : Multiple Alignment of Protein Sequences : A case study for Expert Systems in Bioinformatics
89
Figure 11 : UCSC genome browser display
The display shows a 12Mb region of homozygosity that segregated with the disease phenotype in different sibships in families with Bardet-Biedl Syndrome (BBS) mutations. The region contains 23 known genes, including the BBS10 gene, a major locus for BBS. Syntenic regions from chimp, dog, mouse and other organisms are shown at the bottom of the display.
5.4.3. Gene prediction and validation
One important aspect in biotechnology is gene discovery and target validation for drug
discovery. At the time of writing, over 1000 genomes (from bacteria, archaea and eukaryota,
as well as many viruses and organelles) [40] are either complete or being determined, but
biological interpretation, i.e. annotation, is not keeping pace with this avalanche of raw
sequence data. There is still a real need for accurate and fast tools to analyze these sequences
and, especially, to find genes and determine their functions. Unfortunately, finding genes in a
genomic sequence is far from being a trivial problem. It has been estimated that 44% of the
protein sequences predicted from eukaryotic genomes and 31% of the HTC (High-throughput
cDNA) sequences contain suspicious regions [72].
The most widely used approach consists of employing heterogeneous information from
different methods, including the detection of a bias in codon usage between coding and non-
coding regions and ab initio prediction of functional sites in the DNA sequence, such as splice
sites, promoters, or start and stop codons. Most current methods of detection of a signal that
may represent the presence of a functional site use position-weight matrices (PWM),
consensus sequences or HMM's. The reliability and accuracy of these methods depends
critically on the quality of the underlying multiple alignments [8]. For prokaryotic genomes,
these combined methods are highly successful, identifying over 95% of the genes (e.g. [185]),
although the exact determination of the start site location remains more problematic because
of the absence of relatively strong sequence patterns. The process of predicting genes in
higher eukaryotic genomes is complicated by several factors, including complex gene
organization, the presence of large numbers of introns and repetitive elements, and the sheer
size of the genomic sequence [186]. It has been shown that comparison of the ab initio
predicted exons with protein, EST or cDNA databases can improve the sensitivity and
specificity of the overall prediction. For example, in the re-annotation of the Mycoplasma

Chapter 5 : Multiple Alignment of Protein Sequences : A case study for Expert Systems in Bioinformatics
90
pneumoniae genome [187], sequence alignments were used in the prediction of N/C-terminal
extensions to the original protein reading frame. This approach has also been implemented in
a web server, vALId, developed in our group for automatic protein quality control [72].
Figure 12 : vALId display of a multiple alignment of plant alcohol dehydrogenases
a) Multiple alignment display showing reliable sequence segments in green and potential errors in orange. Grey shading represents regions that have been validated by vALId. b) Validation of the predicted error in Q41767_MAIZE by comparison of a chimeric sequence with the original genome sequence.
Taking advantage of high quality MACS, vALId first warns about the presence of
suspicious insertions/deletions (indels) and divergent segments, and second, proposes
corrections based on transcripts and genome contigs. For example, figure 5.5 shows the
vALId analysis of a multiple alignment of plant alcohol dehydrogenases, highlighting a very
divergent region in the N-terminal region of the sequence Q41767_MAIZE. Divergent
regions are validated by constructing a chimeric sequence, where the suspicious region in the
predicted sequence is replaced by the corresponding segment from the closest neighbour in
the MACS. A TBlastN search with the chimeric sequence (Figure 12) identified an exon
encoding residues that matched the conserved positions in the MACS.
Chapter 5 : Multiple Alignment of Protein Sequences : A case study for Expert Systems in Bioinformatics
91
5.4.4. Protein function characterization
In most genome annotation projects, the standard strategy to determine the function of a
novel protein is to search the sequence databases for homologues and to propagate the
structural/functional annotation from the known to the unknown protein. Recent
developments in database search methods have exploited multiple sequence alignments to
detect more and more distant homologues e.g. [21, 188, 189]. However, most automatic
genome projects only use information from the top best hits in the database search, as
sequence hits with higher expect values are considered unreliable. This has lead to a certain
number of errors in genome annotations. Two types of error have already been identified:
those of under- and over-prediction. Under-prediction implies that functional information is
not transferred because the chain of propagation is broken, for example, because the top-
scoring hits in the database search are all uncharacterised. Over-prediction is perhaps more
serious because it introduces incorrect annotations into the sequence databases. Subsequent
searches against these databases then cause the errors to propagate to future functional
assignments.
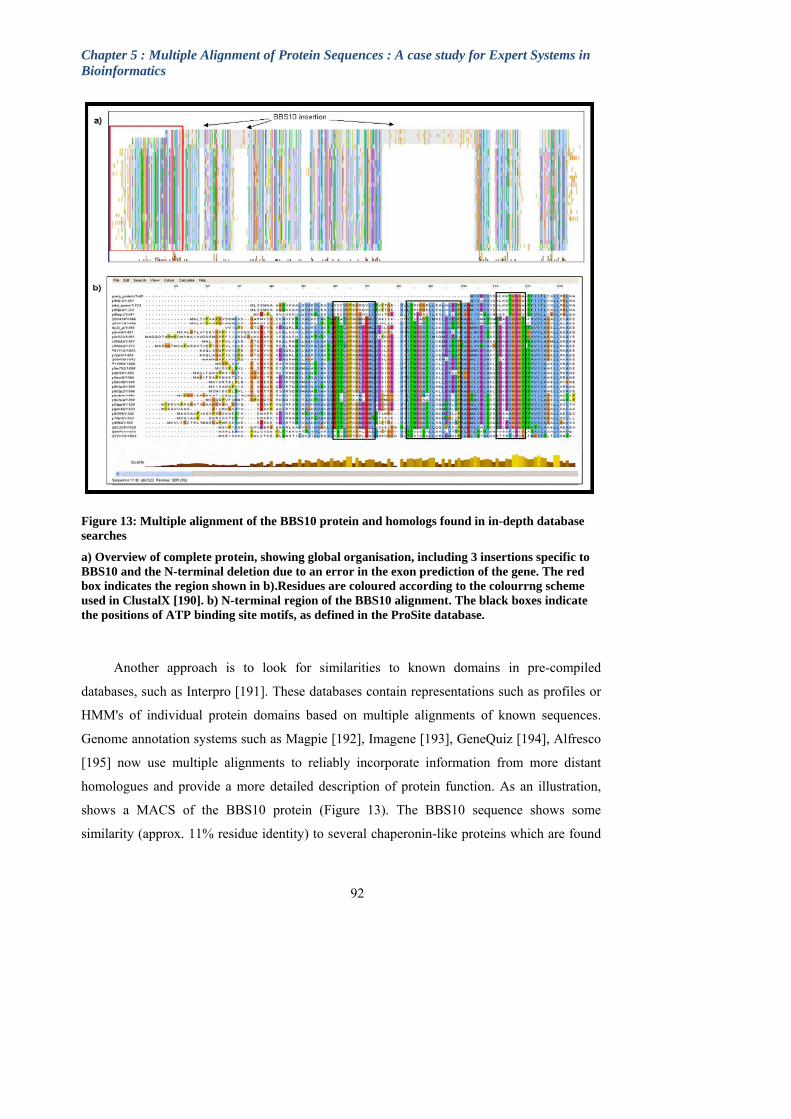
Chapter 5 : Multiple Alignment of Protein Sequences : A case study for Expert Systems in Bioinformatics
92
Figure 13: Multiple alignment of the BBS10 protein and homologs found in in-depth database searches
a) Overview of complete protein, showing global organisation, including 3 insertions specific to BBS10 and the N-terminal deletion due to an error in the exon prediction of the gene. The red box indicates the region shown in b).Residues are coloured according to the colourrng scheme used in ClustalX [190]. b) N-terminal region of the BBS10 alignment. The black boxes indicate the positions of ATP binding site motifs, as defined in the ProSite database.
Another approach is to look for similarities to known domains in pre-compiled
databases, such as Interpro [191]. These databases contain representations such as profiles or
HMM's of individual protein domains based on multiple alignments of known sequences.
Genome annotation systems such as Magpie [192], Imagene [193], GeneQuiz [194], Alfresco
[195] now use multiple alignments to reliably incorporate information from more distant
homologues and provide a more detailed description of protein function. As an illustration,
shows a MACS of the BBS10 protein (Figure 13). The BBS10 sequence shows some
similarity (approx. 11% residue identity) to several chaperonin-like proteins which are found
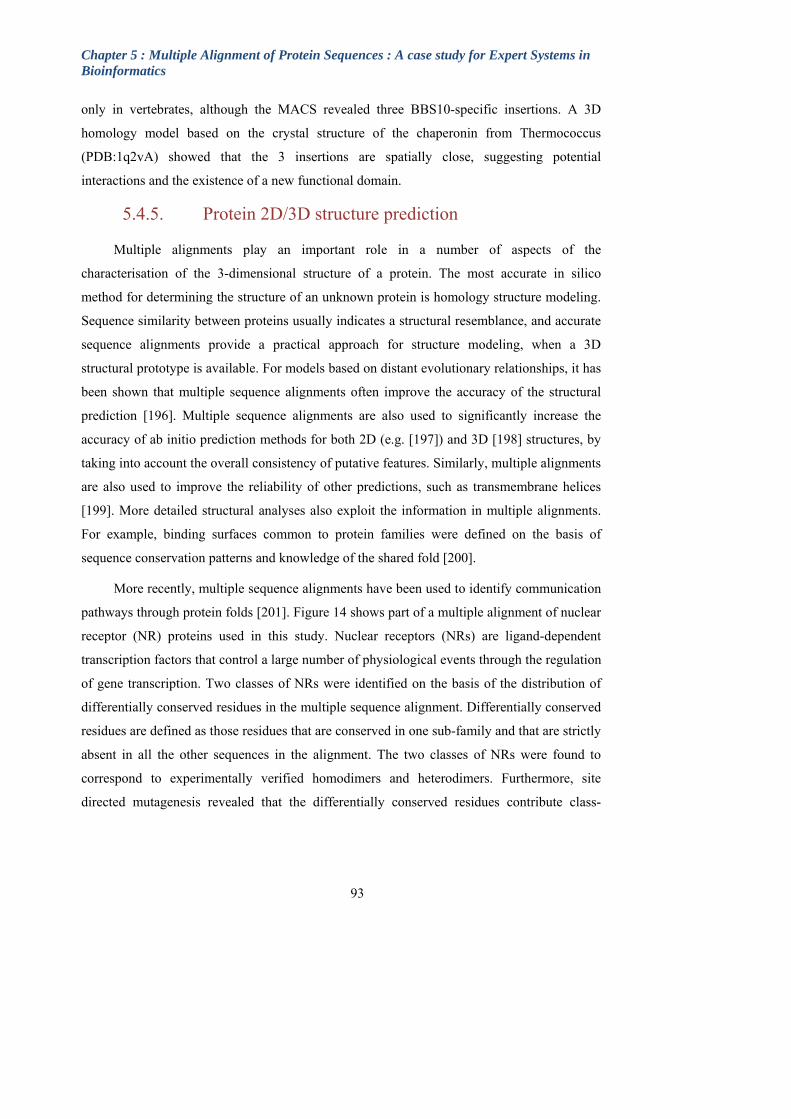
Chapter 5 : Multiple Alignment of Protein Sequences : A case study for Expert Systems in Bioinformatics
93
only in vertebrates, although the MACS revealed three BBS10-specific insertions. A 3D
homology model based on the crystal structure of the chaperonin from Thermococcus
(PDB:1q2vA) showed that the 3 insertions are spatially close, suggesting potential
interactions and the existence of a new functional domain.
5.4.5. Protein 2D/3D structure prediction
Multiple alignments play an important role in a number of aspects of the
characterisation of the 3-dimensional structure of a protein. The most accurate in silico
method for determining the structure of an unknown protein is homology structure modeling.
Sequence similarity between proteins usually indicates a structural resemblance, and accurate
sequence alignments provide a practical approach for structure modeling, when a 3D
structural prototype is available. For models based on distant evolutionary relationships, it has
been shown that multiple sequence alignments often improve the accuracy of the structural
prediction [196]. Multiple sequence alignments are also used to significantly increase the
accuracy of ab initio prediction methods for both 2D (e.g. [197]) and 3D [198] structures, by
taking into account the overall consistency of putative features. Similarly, multiple alignments
are also used to improve the reliability of other predictions, such as transmembrane helices
[199]. More detailed structural analyses also exploit the information in multiple alignments.
For example, binding surfaces common to protein families were defined on the basis of
sequence conservation patterns and knowledge of the shared fold [200].
More recently, multiple sequence alignments have been used to identify communication
pathways through protein folds [201]. Figure 14 shows part of a multiple alignment of nuclear
receptor (NR) proteins used in this study. Nuclear receptors (NRs) are ligand-dependent
transcription factors that control a large number of physiological events through the regulation
of gene transcription. Two classes of NRs were identified on the basis of the distribution of
differentially conserved residues in the multiple sequence alignment. Differentially conserved
residues are defined as those residues that are conserved in one sub-family and that are strictly
absent in all the other sequences in the alignment. The two classes of NRs were found to
correspond to experimentally verified homodimers and heterodimers. Furthermore, site
directed mutagenesis revealed that the differentially conserved residues contribute class-
Chapter 5 : Multiple Alignment of Protein Sequences : A case study for Expert Systems in Bioinformatics
94
specific communication pathways of salt bridges, confirming the functional importance of
these residues for the dimerization process and/or transcriptional activity.
Figure 14 : Multiple sequence alignment of NR ligand binding domains and class-specific features
The differentially conserved residues are highlighted in blue and green for class I and II, respectively. Conserved residues are indicated as follows: 100%, white against black; >80%, white against grey; >60%, black against grey. NR LBD secondary structure elements are indicated. b) Secondary structure diagram showing NR class-specific features. Conserved but not strictly class-specific residues are in black. Arrows indicate the salt bridges in the 3D structures. c) Views of the class-specific residues including the salt bridges forming the class I (blue) and class II (green) communication pathway [201].
5.4.6. RNA structure and function
While proteins have been the traditional candidates for detailed structural and functional
analyses, RNA secondary and tertiary structure studies remain crucial to the understanding of

Chapter 5 : Multiple Alignment of Protein Sequences : A case study for Expert Systems in Bioinformatics
95
complex biological systems. Structure and structural transitions are important in many areas,
such as post-transcriptional regulation of gene expression, intermolecular interaction and
dimerization, splice site recognition and ribosomal frame-shifting. The function of an RNA
molecule depends mostly on its tertiary structure and this structure is generally more
conserved than the primary sequence. The determination of RNA 3D structure is a limiting
step in the study of RNA structure-function relationships because it is very difficult to
crystallize and/or get nuclear magnetic resonance spectrum data for large RNA molecules.
Currently, a reliable prediction of RNA secondary and tertiary structure from its primary
sequence is mainly derived from multiple alignments, searching among members of a family
for compensatory base changes that would maintain base-pairedness in equivalent regions.
For example, the Sequence to Structure (S2S) tool [202] proposes a framework in which a
user can display, manipulate and interconnect RNA multiple sequence alignments, secondary
and tertiary structures (Figure 15).
Figure 15: S2S display of a multiple alignment of the RNA element conserved in the SARS virus genome
Multiple sequence alignment, secondary and tertiary structure. Inside the multiple alignment, the bracket notation is such that the regular parentheses ‘(‘and’)’ denote the helical Watson–Crick pairs and the ‘<’ and ‘>’ characters specify non-Watson–Crick base-pairs typical of RNA motifs.
Chapter 5 : Multiple Alignment of Protein Sequences : A case study for Expert Systems in Bioinformatics
96
These methods have been demonstrated by successful predictions of RNA structures for
tRNAs, 5S and 16S rRNAs, RNase P RNAs, small nuclear RNAs (snRNAs) and other RNAs,
such as group I introns.
The phylogenetic comparative methods are often supported by complementary,
theoretical structure calculations. The most widely used methods are derived from dynamic
programming algorithms, such as MFOLD [203] which predicts on average about 70% of
known base-pairs. However, the search for the equilibrium structure by optimization of the
global free energy is often insufficient. The biologically functional state of a given molecule
may not be the optimal state and moreover, a structured RNA molecule is not a static object.
A molecule may pass through a variety of active and inactive states due to the kinetics of
folding, to the simultaneity of folding with transcription, or to interactions with extra-
molecular factors. To address these problems, integrated systems have been developed that
combine traditional thermodynamic calculations with experimental data, e.g.
STRUCTURELAB [204]. Such systems permit the use of a broad array of approaches for the
analysis of the structure of RNA and provide the capability of analysing the data set from a
number of different perspectives.
5.4.7. Interaction networks
In the post-genomic view of cellular function, each biological entity is seen in the
context of a complex network of interactions. New and powerful experimental techniques,
such as the yeast two-hybrid system or tandem-affinity purification and mass spectrometry,
are used to determine protein-protein interactions systematically. In parallel with these
developments, a number of computational techniques have been designed for predicting
protein interactions. The performance of the Rosetta method, which relies on the observation
that some interacting proteins have homologues in another organism fused into a single
protein chain, has recently been improved using multiple sequence alignment information and
global measures of hydrophobic core formation [205]. A measure of the similarity between
phylogenetic trees of protein families has also been used to predict pairs of interacting
proteins [206]. This method was adapted to consider the multi-domain nature of proteins by
breaking the sequence into a set of segments of predetermined size and constructing a
separate profile for each segment [207]. Another approach involves quantifying the degree of
Chapter 5 : Multiple Alignment of Protein Sequences : A case study for Expert Systems in Bioinformatics
97
co-variation between residues from pairs of interacting proteins (correlated mutations), known
as the "in silico two-hybrid" method. For certain proteins that are known to interact,
correlated mutations have been demonstrated to be able to select the correct structural
arrangement of two proteins based on the accumulation of signals in the proximity of
interacting surfaces [208]. This relationship between correlated residues and interacting
surfaces has been extended to the prediction of interacting protein pairs based on the
differential accumulation of correlated mutations between the interacting partners
(interprotein correlated mutations) and within the individual proteins (intraprotein correlated
mutations) [209].
5.4.8. Genetics
A considerable effort is now underway to relate human phenotypes to variation at the
DNA level. Most human genetic variation is represented by single nucleotide polymorphisms
(SNPs) and many of them are believed to cause phenotypic differences between individuals
[210]. One of the main goals of SNP research is therefore to understand the genetics of human
phenotype variation and especially the genetic basis of complex diseases, thus providing a
basis for assessing susceptibility to diseases and designing individual therapy. Whereas a
large number of SNPs may be functionally neutral, others may have deleterious effects on the
regulation or the functional activity of specific gene products. Non-synonymous single-
nucleotide polymorphisms (nsSNPs) that lead to an amino acid change in the protein product
are of particular interest because they account for nearly half of the known genetic variations
related to human inherited disease [211]. With more and more data available, it has become
imperative to predict the phenotype of a nsSNP in silico. Computational tools are therefore
being developed, which use structural information or evolutionary information from multiple
sequence alignments to predict a nsSNP’s phenotypic effect and to identify disease-associated
nsSNPs, e.g. [212].
5.4.9. Drug discovery, design
The structural and functional analyses described above provide an opportunity to
identify the proteins associated with a particular disease that are therefore potential drug
targets. Rational drug design strategies can then be directed to accelerate and optimize the
drug discovery process using experimental and virtual (computer-aided drug discovery)

Chapter 5 : Multiple Alignment of Protein Sequences : A case study for Expert Systems in Bioinformatics
98
methods. Recent advances in the computational analyses of enzyme structures and functions
have improved the strategies used to modify enzyme specificities and mechanisms by site-
directed mutagenesis, and to engineer biocatalysts through molecular reassembly.
For example, vitamin D analogs have been proposed for the treatment of severe rickets
caused by mutations in the vitamin D receptor (VDR) gene [213]. The known mutations in the
coding regions of the human VDR gene can be divided into two classes, representing two
different phenotypes. Mutations in the VDR DNA-binding domain (DBD) prevent the
receptor from activating gene transcription, although vitamin D binding is normal. Patients
with this DNA binding-defective phenotype do not respond to vitamin D treatment. In
contrast, some patients with mutations in the ligand binding domain (LBD) that cause reduced
or complete hormone insensitivity have been partially responsive to high doses of calcium and
vitamin D, although this often necessitates long term intravenous infusion therapy. For these
patients, an alternative treatment using vitamin D analogs was proposed. Knowledge of the
3D structure of the hormone-occupied VDR LBD [214] and the nature of the amino acid
residues that contribute to the functional surface of the receptor allowed the selection of 3
candidate VDR mutations with the potential to interact with the receptor at amino acid contact
points that differ from those utilized by the natural ligand, thus restoring the function of
mutant VDRs [213]. This example clearly illustrates the importance of polymorphism data
that, combined with structural and evolutionary information, can form the basis for
biochemical and cellular studies which may eventually lead to new drug therapies.
Chapter 6 : Multiple sequence alignment algorithms
99
Chapter 6
6. Multiple sequence alignment algorithms
In the face of the growing number of alignment applications, a vast array of diverse
algorithms has been developed in an attempt to construct reliable, high-quality multiple
alignments within a reasonable time limit that will allow high-throughput processing of large
sequence sets. The first formal algorithm for multiple sequence alignment [215] was a direct
extension of the dynamic programming algorithm for the alignment of two sequences
developed by Needleman and Wunsch [216]. However, the optimal multiple alignment of
more than a few sequences (more than 10) remains impractical due to the intensive computer
resources required, despite some space and time improvements [217]. Therefore, in order to
multiply align larger sets of sequences, most programs in use today employ some kind of
heuristic approach to reduce the problem to a reasonable size.
6.1. Multiple alignment construction
6.1.1 Progressive multiple alignment
Traditionally the most popular method has been the progressive alignment procedure
[218], which exploits the fact that homologous sequences are evolutionarily related. A
multiple sequence alignment is built up gradually using a series of pairwise alignments,
following the branching order in a phylogenetic tree. An example using five immunoglobulin-
like domains is shown in Figure 16.

Chapter 6 : Multiple sequence alignment algorithms
Figure 16: The basic progressive alignment procedure
The algorithm is illustrated using a set of five immunoglobulin-like domains. The sequence names are from the Swissprot or PDB databases: 1HNF: human cell adhesion (CD2) protein, CD2_HORSE: horse cell adhesion protein, CD2_RAT: rat cell adhesion protein, MYPS_HUMAN: human myosin-binding protein, 1WIT: nematode twitchin muscle protein. The secondary structure elements of the immunoglobulin-like domains from the human CD2 (1HNF) and the nematode twitchin (1WIT) proteins are shown above and below the alignment (right arrow = beta sheet, coil = alpha helix).
The first step involves aligning all possible pairs of sequences in order to determine the
distances between them. A guide tree is then created and is used to determine the order of the
multiple alignment. The two closest sequences are aligned first and then larger and larger sets
of sequences are merged, until all the sequences are included in the multiple alignment. In the
example, the human and horse CD2 sequences are aligned first. These two sequences are then
aligned with the rat CD2 sequence. Finally, the myosin-binding protein sequence is aligned
100
Chapter 6 : Multiple sequence alignment algorithms
101
with the twitchin sequence, before being merged with the alignment of the three CD2
sequences. This procedure works well when the sequences to be aligned are of different
degrees of divergence. Pairwise alignment of closely related sequences can be performed very
accurately. By the time the more distantly related sequences are aligned, important
information about the variability at each position is available from those sequences already
aligned. A number of different alignment programs based on this method exist, using either a
global alignment method to construct an alignment of the complete sequences, or a local
algorithm to align only the most conserved subsegments of the sequences (Figure 17). For
example, Multalign [219], Multal [220], Pileup (Wisconsin Package, Genetics Computer
Group, Madison, WI), ClustalW/X [190, 221] are all based on the global Needleman-Wunsch
algorithm. The main difference between these programs lies in the algorithm used to
determine the final order of alignment. For example, Multal uses a sequential branching
algorithm to identify the two closest sequences first and subsequently align the next closest
sequence to those already aligned. Multalign and Pileup use a simple bottom-up data
clustering method, known as the Unweighted Pair Grouping Method with Arithmetic means
(UPGMA) [222], to construct a phylogenetic tree that is then used to guide the progressive
alignment step. ClustalW/X uses another phylogenetic tree construction method, called
neighbour-joining (NJ) [223]. Although the NJ method is less efficient than the UPGMA, it
has been extensively tested and usually finds a tree that is quite close to the optimal tree. In
contrast to the global alignment methods, the Pima program [224] uses the Smith-Waterman
algorithm to find a local multiple alignment.

Chapter 6 : Multiple sequence alignment algorithms
Figure 17 : Overview of different progressive alignment algorithms
SB=sequential branching, ML=maximum likelihood, NJ=neighbour joining, UPGMA=Unweighted Pair Grouping Method with Arithmetic mean.
Since then, the sensitivity of the progressive multiple sequence alignment method has
been somewhat improved with the introduction of several important enhancements to the
basic method. For example, Treealign [225] extends the progressive alignment process by
adding a parsimony step: an initial alignment is constructed and used to build a parsimony
tree which in turn is used to direct the final alignment algorithm. ClustalX [190] reduces the
problem of the over-representation of certain sequences by incorporating a sequence
weighting scheme that downweights near-duplicate sequences and upweights the most
divergent ones. In addition, position-specific gap penalties encourage the alignment of new
gaps on existing gaps introduced earlier in the multiple alignments. Most of the alignment
programs mentioned above use one residue scoring matrix and two gap penalties (one for
opening a new gap and one for extending an existing gap). When identities dominate an
alignment, almost any set of parameters will find approximately the correct solution. With
very divergent sequences, however, the scores given to non-identical residues will become
critically important. Also, the exact values of the gap penalties become important for success.
102
Chapter 6 : Multiple sequence alignment algorithms
103
Thus, the choice of alignment parameters remains a decisive factor affecting the quality of the
final alignment.
6.1.2 Iterative strategies
The next generation of multiple alignment algorithms used iterative strategies to refine
and improve the initial alignment. The PSI-Blast program builds multiple alignments by
aligning the homologous segments detected by a Blast database search to the query sequence.
Hidden Markov Models (HMM’s) have been used in a number of programs HMMT [226] or
SAM [188] to build multiple alignments and have been employed notably to create large
reference databases of sequence alignments such as Pfam and ProSite. The flexibility and
efficiency of stochastic techniques such as Gibbs Sampling [227] and Genetic Algorithms
[228] have also been exploited in the search for more accurate alignments. Iteration
techniques have also been used to refine an initial multiple alignment built using the
traditional progressive alignment algorithm in PRRP [229]. An alternative to the global
alignment approach is the ‘segment-to-segment’ alignment method used in Dialign [230].
Segments consisting of locally conserved residue patterns or motifs, rather than individual
residues, are detected and then combined to construct a local multiple alignment of only the
most conserved regions of the sequences.
6.1.3 Co-operative strategies
The complexity of the multiple alignment problem has lead to the combination of
different alignment algorithms and the incorporation of biological information other than the
sequence itself. A comparison of a number of local and global protein alignment methods
based on the BAliBASE benchmark [231] showed that no single algorithm was capable of
constructing accurate alignments for all test cases. A similar observation was made in another
study of RNA alignment programs [232], where algorithms incorporating structural
information outperformed pure sequence-based methods for divergent sequences. Therefore,
recent developments in multiple alignment methods have tended towards an integrated system
bringing together knowledge-based or text-mining systems and prediction methods with their
inherent unreliability. For example, methods were introduced that combined both global and
local information in a single alignment program, such as DbClustal [233], T-Coffee [234],
MAFFT [235], Muscle [236] or Probcons [237]. Other authors introduced different kinds of
information in the sequence alignment, such as or 3D structure [238] or domain organisation
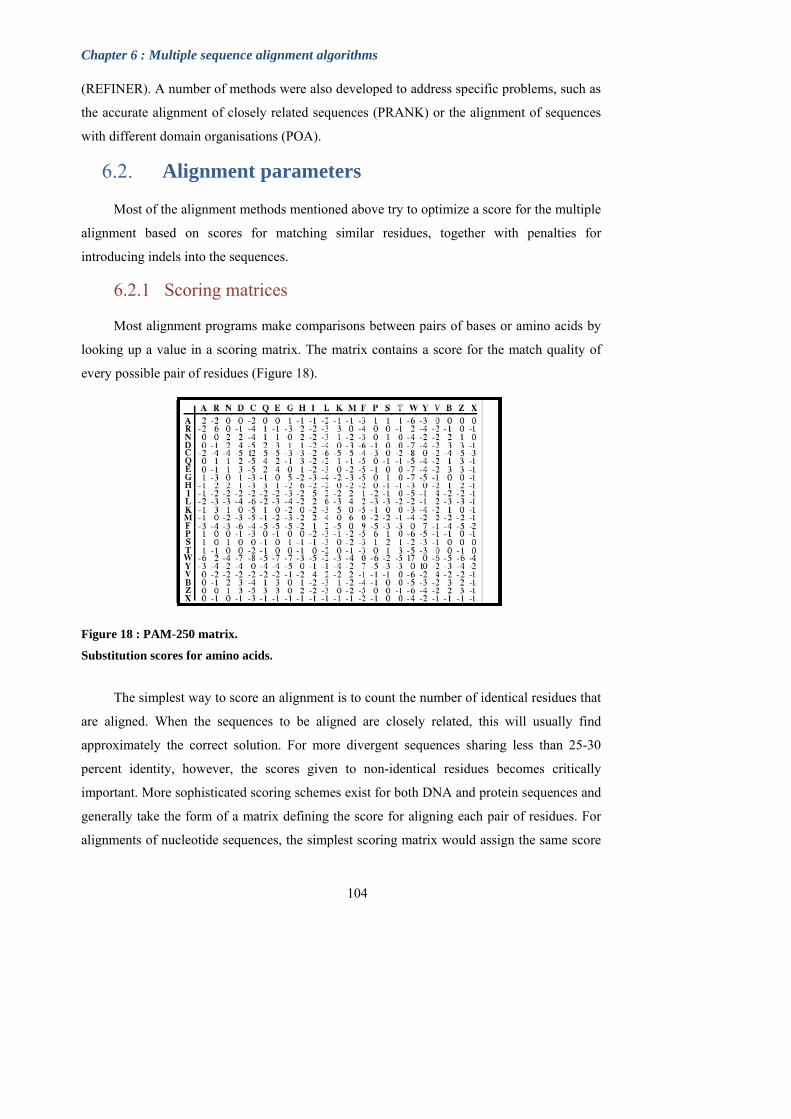
Chapter 6 : Multiple sequence alignment algorithms
(REFINER). A number of methods were also developed to address specific problems, such as
the accurate alignment of closely related sequences (PRANK) or the alignment of sequences
with different domain organisations (POA).
6.2. Alignment parameters
Most of the alignment methods mentioned above try to optimize a score for the multiple
alignment based on scores for matching similar residues, together with penalties for
introducing indels into the sequences.
6.2.1 Scoring matrices
Most alignment programs make comparisons between pairs of bases or amino acids by
looking up a value in a scoring matrix. The matrix contains a score for the match quality of
every possible pair of residues (Figure 18).
Figure 18 : PAM-250 matrix.
Substitution scores for amino acids.
The simplest way to score an alignment is to count the number of identical residues that
are aligned. When the sequences to be aligned are closely related, this will usually find
approximately the correct solution. For more divergent sequences sharing less than 25-30
percent identity, however, the scores given to non-identical residues becomes critically
important. More sophisticated scoring schemes exist for both DNA and protein sequences and
generally take the form of a matrix defining the score for aligning each pair of residues. For
alignments of nucleotide sequences, the simplest scoring matrix would assign the same score
104

Chapter 6 : Multiple sequence alignment algorithms
105
to a match of the four classes of bases, ACGT, and 0 for any mismatch. However, transitions
(substitution of A-G or C-T) happen much more frequently than transversions (substitution of
A-T or G-C) and it is often desirable to score these substitutions differently. More complex
matrices also exist in which matches between ambiguous nucleotides are given values
whenever there is any overlap in the sets of nucleotides represented by the two symbols being
compared. For protein sequence comparisons, scoring matrices generally take into account the
biochemical similarities between residues and/or the relative frequencies with which each
amino acid is substituted by another. The most widely used scoring matrices are known as the
PAM (point accepted mutation) matrices [239]. The original PAM1 matrix was constructed
based on the mutations observed in a large number of alignments of closely related sequences.
A series of matrices was then extrapolated from the PAM1. The matrices range from strict
ones, useful for comparing very closely related sequences to very 'soft' ones that are used to
compare very divergent sequences. For example, the PAM250 matrix corresponds to an
evolutionary distance of 250%, or approximately 80% residue divergence. Other matrices
have been derived directly from either sequence-based or structure-based alignments. For
example, the Blosum matrices are based on the observed residue substitutions in aligned
sequence segments from the Blocks database. The proteins in the database are clustered at
different percent identities to produce a series of matrices. For example, the Blosum-62 matrix
is based on alignment blocks in which all the sequences share at least 62% residue identity.
Other more specialized matrices have been developed e.g. for specific secondary structure
elements [240] or for the comparison of particular types of proteins such as transmembrane
proteins [241].
6.2.2 Gap schemes
As well as assigning scores for residue matches and mismatches, most alignment
scoring schemes in use today calculate a cost for the insertion of gaps in the sequences. One
of the first gap scoring schemes for the alignment of two sequences charged a fixed penalty
for each residue in either sequence aligned with a gap in the other. Under this system, the cost
of a gap is proportional to its length. Alignment algorithms implementing such length-
proportional gap penalties are efficient, however the resulting alignments often contain a large
number of short indels that are not biologically meaningful. To address this problem, linear or
‘affine’ gap costs are used that define a gap insertion or ‘gap opening’ penalty in addition to
the length-dependent or ‘gap extension’ penalty. Thus, a smaller number of long gaps is

Chapter 6 : Multiple sequence alignment algorithms
106
favoured over many short ones. Fortunately, algorithms using affine gap costs are only
slightly more complex than those using length-proportional gap penalties, requiring only a
constant factor more space and time. Again, more complex schemes have been developed,
such as 'concave' gap costs [242] or position-specific gap penalties [243]. Most of these are
attempts to mimic the biological processes or constraints that are thought to regulate the
evolution of DNA or protein sequences.
6.2.3 Alignment statistics
An important aspect of sequence alignment is to establish how meaningful a given
alignment is. It is always possible to construct an alignment between a set of sequences, even
if they are unrelated. The problem is to determine the level of similarity required to infer that
the sequences are homologous, i.e. that they descend from a common ancestor. A simple rule-
of-thumb for protein sequences states that if two sequences share more than 25% identity over
more than 100 residues, then the two sequences can be assumed to be homologous. However,
many proteins sharing less than 25% residue identity, said to be in the 'twilight zone' [244], do
still have very similar structures. The measure of the percent identity or similarity of the
sequences is generally not sensitive enough to distinguish between alignments of related and
unrelated sequences. Much work has been done on the significance of both ungapped and
gapped pairwise local alignments [245, 246], although the statistics of global alignments or
alignments of more than two sequences are far less well understood. The aim of the statistical
analysis is to estimate the probability of finding by 'chance' at least one alignment that scores
as high as or greater than the given alignment. For ungapped local alignments, these
probabilities or P-values may be derived analytically. For alignments with gaps, empirical
estimates are used based on the scores obtained during a database search, or from randomly
generated sequences. For database search programs, the significance of an alignment between
the query sequence and a database sequence is often expressed in terms of Expect- or E-
values. The E-value specifies the number of matches with a given score that are expected to
occur by chance in a search of a database. An Expect-value of zero, with a given score, would
indicate that no matches with this score are expected purely by chance.
Chapter 6 : Multiple sequence alignment algorithms
107
6.3. Multiple alignment quality
In the search for more accurate alignments, most state of the art methods now often use
a combination of complementary techniques, such as local/global alignments or
sequence/structure information. Although much progress has been achieved, the latest
methods are not perfect and misalignments can still occur. If these misalignments are not
detected, they will lead to further errors in the subsequent applications that are based on the
multiple alignment. The assessment of the quality and significance of a multiple alignment
has therefore become a critical task, particularly in high-throughput data processing systems,
where a manual verification of the results is no longer possible.
A number of quality issues can be distinguished. First, given a set of sequences, how to
evaluate the quality of a multiple alignment of those sequences. The most reliable is probably
to compare the alignment to a reference alignment, e.g. 3D structural superposition. In the
absence of a known reference, a score is calculated, known as an objective function that
estimates how close the alignment is to the correct or optimal solution. Objective scoring
functions are discussed in section 6.3.1. In general though, most multiple alignments contain
regions that are well aligned and regions that contain errors. Section 6.3.2 describes methods
that can distinguish reliable from unreliable regions. Even if the alignment is optimal, this
does not mean that the sequences are actually homologous. Most multiple alignment methods
available today will produce an alignment even if the sequences are unrelated. Finally, section
6.3.3 describes the most widely used benchmarks that are used to compare multiple alignment
methods and evaluate the improvements obtained by the new methods.
6.3.1. Multiple alignment objective scoring functions
Given a particular set of sequences, an objective score is needed that describes the
optimal or "biologically correct" multiple alignment. Sub-optimal or incorrect alignments
would then score less than this maximal score. Such measures, also known as objective
functions, are currently used to evaluate and compare multiple alignments from different
sources and to detect low-quality alignments. They are also used in iterative alignment
methods to improve the alignment by seeking to maximize the objective function.

Chapter 6 : Multiple sequence alignment algorithms
108
Njji
jismS,
,
One of the first scoring systems was the Sum-of-Pairs score (Carrillo and Lipman,
1988). For each pair of sequences in the multiple alignment a score is calculated based on the
percent identity or the similarity between the sequences. (Pairwise alignment scores are
discussed in detail in Chapter 6). The score for the multiple alignment, S(m), is then taken to
be the sum of all the pairwise scores:
where s(i, j) is the score of the pairwise alignment between sequences i and j and N is the total
number of sequences in the alignment.
Pairwise scores are also used in the COFFEE objective function [247], which reflects
the level of consistency between a multiple sequence alignment and a library containing
pairwise alignments of the same sequences. This method was shown to be a good estimation
of the accuracy of the multiple alignment when high quality pairwise alignments, such as 3D
structural superpositions, are available as reference. One problem with multiple alignment
scores based on pairwise sequence comparisons is that they assume that substitution
probabilities are uniform and time-invariant at all positions in the alignment. This is
unrealistic as the variability may range from total invariance at some positions to complete
variability at others, depending on the functional or structural constraints of the protein.
For this reason, more recent work has concentrated on column statistics. One approach
uses an Information Content statistic, assuming that the most interesting alignments are those
where the frequencies of the residues found in each column are significantly different from a
predefined set of a priori residue probabilities [248]. The Information Content of a multiple
alignment is defined as:
i
jiL
j
A
iji p
ffmI ,
1 1, ln
where N
nf ji
ji,
, is the frequency that letter i occurs at position j
A is the total number of letters in the alphabet
L is the total number of positions in the alignment
Chapter 6 : Multiple sequence alignment algorithms
109
N is the total number of sequences in the alignment
pi is the a priori probability of letter i
ni,j is the frequency that letter i occurs at position j
One disadvantage of this measure is that it considers only the frequencies of identical
residues in each column and does not take into account similarities between residues. For this
reason, another column-based measure, norMD, was introduced [249], based on the Mean
Distance (MD) column scores implemented in ClustalX [190]. The MD scores are summed
over the full-length of the alignment and the total score is then normalized to take into
account the number, length and similarity of the sequences in the alignment, and the presence
of gaps. The norMD score can be used to estimate the quality of the alignment even when the
optimal alignment score is unknown. It was shown that most alignments scoring higher than
the threshold score of 0.5 are correct, while alignments scoring less than 0.3 are generally of
poor quality. Nevertheless, a twilight zone still exists for norMD scores between 0.3 and 0.5,
where no distinction can be made between good and bad alignments.
6.3.2. Determination of reliable regions
The objective functions described above calculate a global score that estimates the
overall quality of a multiple alignment. However, even when misalignments occur, it is not
necessarily true that all of the alignment is incorrect. Useful information could still be
extracted if the reliable regions in the alignment could be distinguished from the unreliable
regions. The prediction of the reliability of specific alignment positions has therefore been an
area of much interest. One of the first automatic methods for the analysis of position
conservation was the AMAS program [250], which was based on a set-based description of
amino acid properties. Since then, a large number of different methods have been proposed.
For example, Al2Co [251] calculates a conservation index at each position in a multiple
sequence alignment using weighted amino acid frequencies at each position. The DIVAA
method [252] is based on a statistical measure of the diversity at a given position. The
diversity measures the proportion of the 20 possible amino acids that are observed. If the
position is completely conserved (i.e. only one amino acid is observed in all sequences
analyzed), the diversity is 0.05 (1/20); if it is populated by equal proportions of all amino
acids, the diversity is 1.0 (20/20). Diversity is inversely and non-linearly related to the
measure of sequence information content described above, with a highly conserved position
Chapter 6 : Multiple sequence alignment algorithms
110
exhibiting relatively low diversity and high information content. For nucleic acid sequences,
the ConFind program [253] identifies regions of conservation in multiple sequence alignments
that can serve as diagnostic targets and is designed to work with a large number of highly
mutable target sequences such as viral genomes.
An alternative approach has been implemented in the MUMSA program [254], based on
the comparison of several alignments of the same sequences. The idea here is to search for
regions which are identically aligned in many alignments, assuming that these are more
reliable than regions differently aligned in many alignments. The method also results in a
score for a given alignment. A high quality alignment in this case, is one that shares more
aligned residues with other alignments. The choice of multiple alignment methods used as
input is therefore crucial, in order to avoid a bias towards one particular algorithm. Ideally,
different algorithms should be used, such as local and global methods, algorithms designed
for transmembrane sequences, repeats, etc. In tests on BAliBASE, the MUMSA scores
correlate higher with true alignment quality than the norMD scores. However, a major
drawback of the MUMSA method is that several multiple alignments of the same set of
sequences have to be constructed for the purpose of comparison, which is not always
computationally feasible.
6.3.2. Benchmarking In computer science, the quality of an algorithm is often estimated by comparing the
results obtained with a pre-defined benchmark or ‘gold standard’. Clearly, the tests need to be
of high-quality. Errors in the benchmark will lead to biased or erroneous results. The tests in
the benchmark need not be comprehensive, but must be representative of ones that the system
is reasonably expected to handle in a natural (meaning not artificial) setting and the
performance measure used must be pertinent to the comparisons being made. Enough tests
need to be included in order to obtain statistical differences between programs tested. It
should be possible to complete the task domain sample and to produce a good solution. A task
that is too difficult for all or most tools yields little data to support comparisons. A task that is
achievable, but not trivial, provides an opportunity for systems to show their capabilities and
their shortcomings [255].
One of the first studies to compare the quality of different methods for protein sequence
alignment was performed in 1994, when McClure et al. compared several progressive

Chapter 6 : Multiple sequence alignment algorithms
111
alignment methods, including both global and local algorithms [256]. They concluded that
global methods generally performed better. However, the number of suitable test sets
available at that time was somewhat limited and this was therefore not a comprehensive test.
BAliBASE
One of the first large scale benchmarks specifically designed for multiple sequence
alignment was BAliBASE [231, 257]. The alignment test cases in BAliBASE are based on 3D
structural superpositions that are manually refined to ensure the correct alignment of
conserved residues. The alignments are organised into reference sets that are designed to
represent real multiple alignment problems. The first version of BAliBASE consisted of 5
reference sets representing many of the problems encountered by multiple alignment methods
at that time, from a small number of divergent sequences, to sequences with large N/C-
terminal extensions or internal insertions (see figure 7.3). In version 2 [257], three new
Reference sets were included, devoted to the particular problems posed by sequences with
transmembrane regions, repeats and inverted domains. In each reference alignment, core
blocks are defined that exclude the regions for which the 3D structure superpositions are
unreliable, for example, the borders of secondary structure elements or in loop regions. In the
latest version 3, a semi-automatic update protocol was introduced to facilitate the construction
of larger alignments, particularly for reference sets 1-5. In addition, full-length sequences
were provided for all test cases, which thus represent difficult cases for both global and local
alignment programs.
In order to assess the accuracy of a multiple alignment program, the alignment produced
by the program for each BAliBASE test case is compared to the reference alignment. Two
scores are used to evaluate the alignment:
the SP (sum of pairs) score calculates the percentage of pairwise residues aligned the
same in both alignments
the CS (column score) calculates the percentage of complete columns aligned the
same. These scores are calculated in the core block regions only.
Commentaire [MSOffice14] :etails of the benchmarks might be better in materials and methods.
Chapter 6 : Multiple sequence alignment algorithms
112
OxBench
The OXBench benchmark suite from the Barton group [258], provides multiple
alignments of protein domains that are built automatically using structure and sequence
alignment methods. The automatic construction means that a large number of tests can be
included, however the benchmark results will be biased towards sequence alignment
programs using the same methodology as that used to construct the reference. The benchmark
is divided into three data sets. The master set currently consists of 218 alignments of
sequences of known 3D structure, with from 2 to 122 sequences in each alignment. The
extended data set is constructed from the master set by including sequences of unknown
structure. Finally, the full-length data set includes the full-length sequences for the domains in
the master data set.
A number of different scores are included in the benchmark suite, in order to evaluate
the accuracy of multiple alignment. The average number of correctly aligned positions is
similar to the column score used in BAliBASE. This can be calculated over the full alignment
or over Structurally Conserved Regions (SCR). The Position Shift Error measures the average
magnitude of error, so that misalignments that cause a small shift between two sequences are
penalized less than large shifts. Two other measures are also provided that are independent of
the reference alignment, and are calculated from the structure superposition implied by the
test alignment.
The OxBench suite was used to compare 8 different alignment programs, including
many of those in the BAliBASE study, together with the AMPS program [219]. The MSA
[217] and T-COFFEE [234] programs were also tested, although the tests were restricted to a
smaller data set because these methods were unable to align the largest test sets due to
prohibitive space and time requirements. The AMPS program was shown to perform as well
or better than the other progressive alignment methods in most tests. The T-COFFEE method
which incorporates both local and global pairwise alignment algorithms was shown to
outperform the other methods on the smaller data set. Another important result was that the
rigorous dynamic programming method used in the MSA program did not perform better than
Chapter 6 : Multiple sequence alignment algorithms
113
the heuristic progressive methods in this study, supporting the hypothesis that the optimal
sum-of-pairs score does not always correspond to the biologically correct alignment.
PREFAB
The PREFAB [236] benchmark was constructed using a fully automatic protocol and
currently contains 1932 multiple alignments. Pairs of sequences with known 3D structures
were selected and aligned using two different 3D structure superposition methods. A multiple
alignment was constructed for each pair of structures, by including 50 homologous sequences
detected by sequence database searches.
The accuracy of an alignment program is estimated by comparing the alignment of the
structure pair in the test multiple alignment with the reference superposition in each test case.
Only positions that are aligned the same by the two different superposition methods are
considered. The PREFAB benchmark was used to compare the MUSCLE program [236] with
MAFFT [235], T-COFFEE and ClustalW and showed that the MUSCLE program performed
significantly better than the other methods. The programs were also compared with the
BAliBASE benchmark, where a similar ranking of programs was obtained although the
difference between MUSCLE and T-COFFEE was not significant in this case.
SABmark
SABmark [259] contains reference sets of sequences derived from the SCOP protein
structure classification, divided into 2 sets, twilight zone (Blast E-value>=1) and
superfamilies (residue identity<=50%). Pairs of sequences in each reference set are then
aligned based on 3D structure superpositions. To evaluate the quality of a multiple alignment
program, multiple alignments of each reference set are constructed. Pairwise alignments are
then extracted from the multiple alignment and compared to the structure superpositions.
Although the benchmark covers most of the known protein fold space, the major disadvantage
of this benchmark is that only pairwise reference alignments are considered and no multiple
alignment solution is provided.
In a comparison of 4 different alignment methods using SABmark, two different scores
were used. The first, fD is similar to the SP score and is defined as the ratio of the number of
correctly aligned residues divided by the length of the reference alignment, and may be
thought of as a measure of sensitivity. The fM score measures the specificity and is defined as
Chapter 6 : Multiple sequence alignment algorithms
114
the ratio of the number of correctly aligned residues divided by the length of the test
alignment. At the SCOP family level, T-COFFEE and ClustalW were shown to perform
better, while Align-m [260] was more successful at constructing pairwise alignments at the
SCOP superfamily level.
Homstrad
HOMSTRAD [261] is a database of protein families, clustered on the basis of sequence
and structural similarity. It was not specifically designed as a benchmark database, although it
has been employed as such by a number of authors.
Comparison of multiple alignment benchmarks
A comparison of a number of benchmarks for protein sequence alignment algorithms,
including those described above, has been performed [262]. They concluded that, although
SABmark boasts full coverage of the known fold space, there are only pairwise references for
each group, so multiple alignment assessment becomes complicated depending on how the
results are treated. The importance of core region annotation was also stressed by the authors.
HOMSTRAD is often used as a benchmark though it lacks this annotation. Finally, they
recommended that several benchmarks be used for program comparison, although this can
become time-consuming and confusing. Oxbench, PREFAB and BAliBASE all contain
difficult cases containing full-length sequences of low sequence identity. The authors noted
that BAliBASE has the advantage that several distinct problem areas are explicitly addressed.
It is smaller than the other test sets, but nevertheless has a large enough range of
representative examples from the known fold-space to evaluate relative performance.
6.3.3. Comparison of multiple alignment programs
The objective evaluation of alignment quality and the introduction of large-scale
alignment benchmarks have clearly had a positive effect on the development of multiple
alignment methods. From their beginnings in 1975, until 1994 when McClure first compared
different methods systematically, the main innovation was the introduction of the heuristic
progressive method that allowed the multiple alignment of larger sets of sequences within a
practical time limit.

Chapter 6 : Multiple sequence alignment algorithms
115
A comparison of some of the alignment methods described above [263], based on
BAliBASE (version 1.0) showed that there was no single algorithm that was consistently
better than the others. The study revealed a number of specificities in the different algorithms.
For example, while most of the programs successfully aligned sequences sharing >40%
residue identity, an important loss of accuracy was observed for more divergent sequences
with <20% identity. Another important discovery was the fact that global alignment methods
in general performed better for sets of sequences that were of similar length, although local
algorithms were more successful at identifying the most conserved motifs in sequences
containing large extensions and insertions. Of the local methods, Dialign [230] was the most
successful. The iterative methods, such as PRRP [229] or SAGA [228] were generally more
accurate than the traditional progressive methods, although at the expense of a large time
penalty.
Soon after this initial comparison, various new methods were introduced that exploited
novel algorithms, such as Iterative refinement, Hidden Markov Models or Genetic algorithms.
These new approaches significantly improved alignment quality, as shown in the comparison
of these methods by Thompson et al. [263]. Nevertheless, this study highlighted the fact that
no single algorithm was capable of constructing high quality alignments for all test cases. In
particular, global methods (e.g. ClustalW) were shown to perform well when the sequences
were homologous over their entire lengths, while local methods (e.g. DiAlign) were shown to
perform better when the sequence set contained large insertions or N/C terminal extensions.
As a consequence, the first methods were introduced that combined both global and
local information in a single alignment program, such as DBClustal, T-Coffee, MAFFT,
MUSCLE or ProbCons. Table 2 shows the scores obtained using most of these new methods
for the different multiple alignment benchmarks described above.
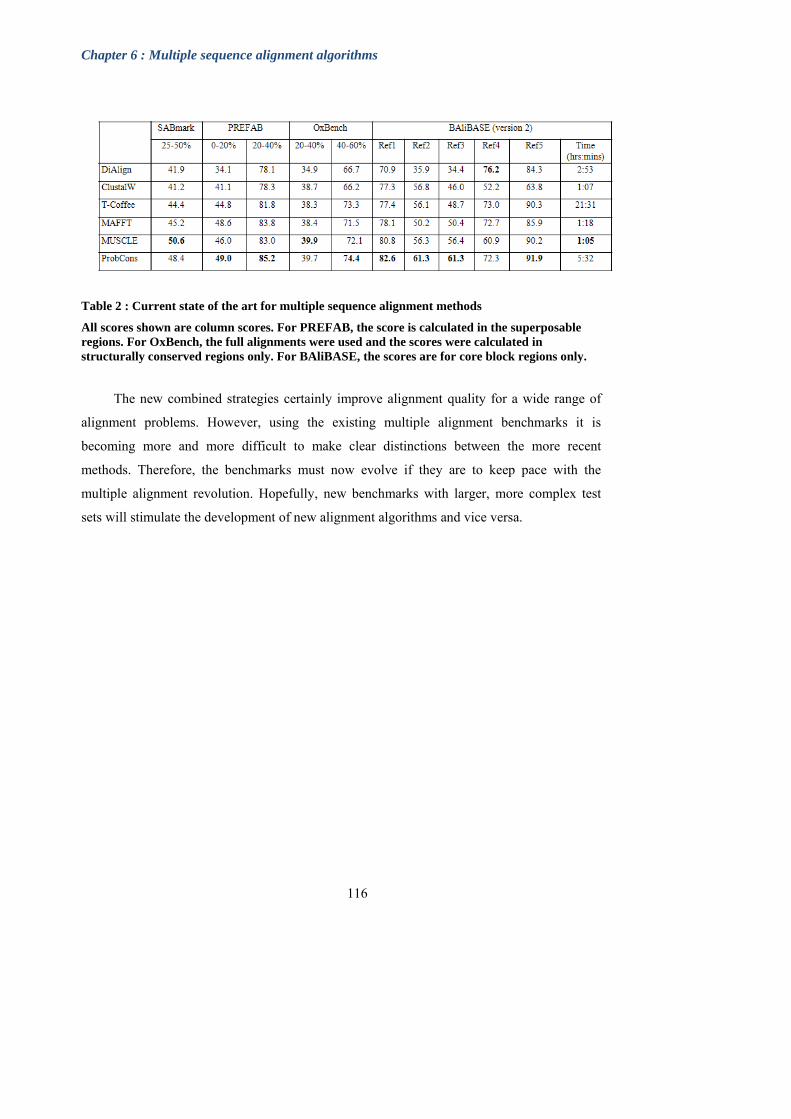
Chapter 6 : Multiple sequence alignment algorithms
116
Table 2 : Current state of the art for multiple sequence alignment methods
All scores shown are column scores. For PREFAB, the score is calculated in the superposable regions. For OxBench, the full alignments were used and the scores were calculated in structurally conserved regions only. For BAliBASE, the scores are for core block regions only.
The new combined strategies certainly improve alignment quality for a wide range of
alignment problems. However, using the existing multiple alignment benchmarks it is
becoming more and more difficult to make clear distinctions between the more recent
methods. Therefore, the benchmarks must now evolve if they are to keep pace with the
multiple alignment revolution. Hopefully, new benchmarks with larger, more complex test
sets will stimulate the development of new alignment algorithms and vice versa.

117
Materials and Methods
Chapter 7 : Materials and Methods
118
Chapter 7
The expert system for multiple alignment construction, evaluation and analysis
described in the results section of this thesis were developed using the existing infrastructure
and computer resources of the Laboratoire de Biologie et Genomique Integratives (LBGI) and
the Plate-forme Bio-informatique de Strasbourg (BIPS). The BIPS is a high-throughput
platform for comparative and structural genomics, which was identified in 2003 as a national
inter-organisational technology platform (Plate-forme Nationale RIO). The BIPS obtained the
ISO 9001:2000 certification in 2007.
7.1 Computing resources
7.1.1 Servers Three central servers are currently available for program development and computational
data analyses:
(i) Interactive and web services: Sun Enterprise 450 (Solaris 9). 4 processors with 1
Gb shared memory.
(ii) Computational servers:
6 Compaq ES40 cluster (Tru64 UNIX). 6 x 4 EV67 processors. Of the 6
machines in this cluster, 5 have 4 Gb memory each, and the sixth has 16 Gb.
6 Sun Enterprise V40z server (2 x Solaris 10 and 4 x RedHat Enterprise Linux
4). 6 x 4 Opteron processors with 2 x 32 Gb and 4 x 16 Gb memory.
(iii) Disk server: Sun V480 (Solaris 9) providing 8 Tera-bytes on Raid5 disks shared
with other servers using NFS.
7.1.2 Databases A number of general as well as some more specialist databases are installed and updated
regularly on the LBGI servers. These databases are available in GCG format [264] and can
also be queried using the SRS (Sequence Retrieval Software) [265].

Chapter 7 : Materials and Methods
119
Generalist databases:
The main public sequence and structure databases have been installed locally on the
IGBMC servers. The protein sequence database Uniprot [266], consists of both SwissProt and
SpTrEMBL databases [75]. The SpTrEMBL sequences are produced by automatic translation
of the coding sequences from the EMBL nucleotide sequence database. After validation and
annotation by experts, the sequences in SpTrEMBL are incorporated in the SwissProt
database. The protein 3D structure database PDB (Protein Data Bank) [267], includes
structures determined by X-ray crystallography or by NMR. The amino acid sequences of the
proteins or domains in PDB are also available.
Specialist databases:
In addition to these generalist databases, a number of specialist databases are
maintained locally. In particular, the InterPro database [191] contains information on protein
families, protein domains and functional sites. InterPro is a collaboration between a number of
different protein signature databases, including the protein domain databases: Pfam [268],
Prodom [269], Smart [270] and the protein pattern databases: Prints [30] and Prosite [28].
Protein signatures are manually integrated into InterPro database entries and are then curated
to provide reliable biological and functional information. InterPro also provides links to other
specialised databases, including the Gene Ontology [89]. The Interpro database contains
signature information for many of the sequences in the generalist databases. Other sequences,
that have not yet been integrated, can be used as queries to search the database using the
Interproscan software.
7.1.3 Data retrieval
Structural and functional information was retrieved from the public databases using the
Bird system developed in-house. The BIRD System (Nguyen et al, CORIA 2008, Hermes
Edition) was designed to manage large collections of biological data and to perform intensive
computation and simulation A generic configurable data model has been designed and allows
the simultaneous integration of genomics, transcriptomics and ontology datasets using a
limited number of product mapping rules provided by the user (operator or system
Commentaire [j15] : ref
Chapter 7 : Materials and Methods
120
administrator). The integration rules allow the easy creation of a database according to
semantic topics and real requirements. BIRD is driven by a high level query engine (BIRD-
QL), based on SQL and a full text engine allowing the biologist to quickly extract knowledge
without programming. Thus, the system is capable of generating sub-databases in accordance
with the real requirements of a given project. The hosted data can then be accessed by the
wider community using various methods such as a Web interface, Http Service, an API Java
or a BIRD-QL Engine Query.
The BIRD System is developed using the Java technology and uses the IBM DB2 as the
data server, as well as the Websphere Federation Server for virtual databases. The web
application is hosted either by a Tomcat Server or by a WebSphere Application Server.
7.2 MSA programs
Comparative analyses of the diverse algorithms used to align protein sequences have
identified many of their strengths and weaknesses and have led to significant progress in the
field recently. Today, there are hundreds of different programs available for the construction
of multiple sequence alignments and it is clearly impossible to incorporate all of these in
AlexSys. We therefore selected a small number of aligners, representing different alignment
approaches. ClustalW is a global alignment method, while Dialign uses a local alignment
algorithm. Mafft and Muscle were developed more recently and use both local and global
information to construct the alignment. Kalign and Mafft are very fast aligners, while
ProbCons is less efficient but often produces a higher quality final alignment.
ClustalW (version 2.0) performs a traditional progressive alignment, by first comparing
all pairs of sequences, then building a guide tree using the Neighbour Joining approach, and
finally aligning all the sequences according to the branch order in the guide tree. For
sequences that are globally related, ClustalW often provides accurate alignments, while in
more complex cases it can be used as a good starting point for further refinement.
Dialign [271] (version 2.2.1) constructs multiple alignments by comparing segments of
the sequences, rather than single residues. The main difference between Dialign and the other
alignment approaches is the underlying scoring scheme or objective function. Instead of
summing up substitution scores for aligned residues and subtracting gap penalties, the score
of an alignment is based on P-values of local sequence similarities. Only those parts of the
Chapter 7 : Materials and Methods
121
sequences are aligned that share some statistically significant similarity, unrelated parts of the
sequences remain unaligned. This approach is particularly successful in situations where
sequences share only local homologies.
Mafft (version 6.240) (Multiple sequence alignment based on Fast Fourier Transform)
(option FFT-NS-i) is a fast aligner that builds an initial progressive alignment using an
approximate measure based on shared 6-tuples to estimate the distance between pairs of
sequences. A guide tree is then generated using the UPGMA algorithm with modified linkage
and sequences are aligned following the branch order of the tree. The initial MSA is then
improved by recalculating the distance matrix and repeating the progressive alignment steps.
The final phase involves an iterative refinement to optimise a weighted sum of pairs (WSP)
[272] score, using a group-to-group alignment and a tree-dependent restricted partitioning
technique.
Muscle (version 3.7) (Multiple sequence comparison by log-expectation) uses a three
phase approach similar to the one implemented in Mafft. In the initial alignment phase, a k-
mer distance is used to estimate the pairwise distances and the guide tree is built using the
UPGMA algorithm. The initial MSA is then improved by calculating a more accurate Kimura
distance [273] for aligned pairs, again repeating the progressive alignment steps. The final
iterative refinement stage employs a variant of the tree dependent restricted partitioning
algorithm.
Kalign (version 2.03) also uses a progressive alignment approach, the main difference
being that it employs the Wu-Manber approximate string matching algorithm [274] when
calculating the distances among sequences. This methodology allows for a fast, yet accurate
distance estimation. As in Mafft and Muscle, the UPGMA algorithm is used to build the guide
tree. In addition, the program performs a consistency check in order to define the largest set of
sequence matches that can be inserted in the alignment, using a modified version of the
Needleman-Wunsch algorithm [216] to find the most consistent path through the dynamic
programming matrix.
ProbCons (version 1.12) (Probabilistic Consistency-based MSA) incorporates a pair-
hidden Markov model-based progressive alignment algorithm. The alignment procedure is
divided into four steps, starting with a computation of posterior-probability matrices for every
pair of sequences, followed by a dynamic programming calculation of the expected accuracy
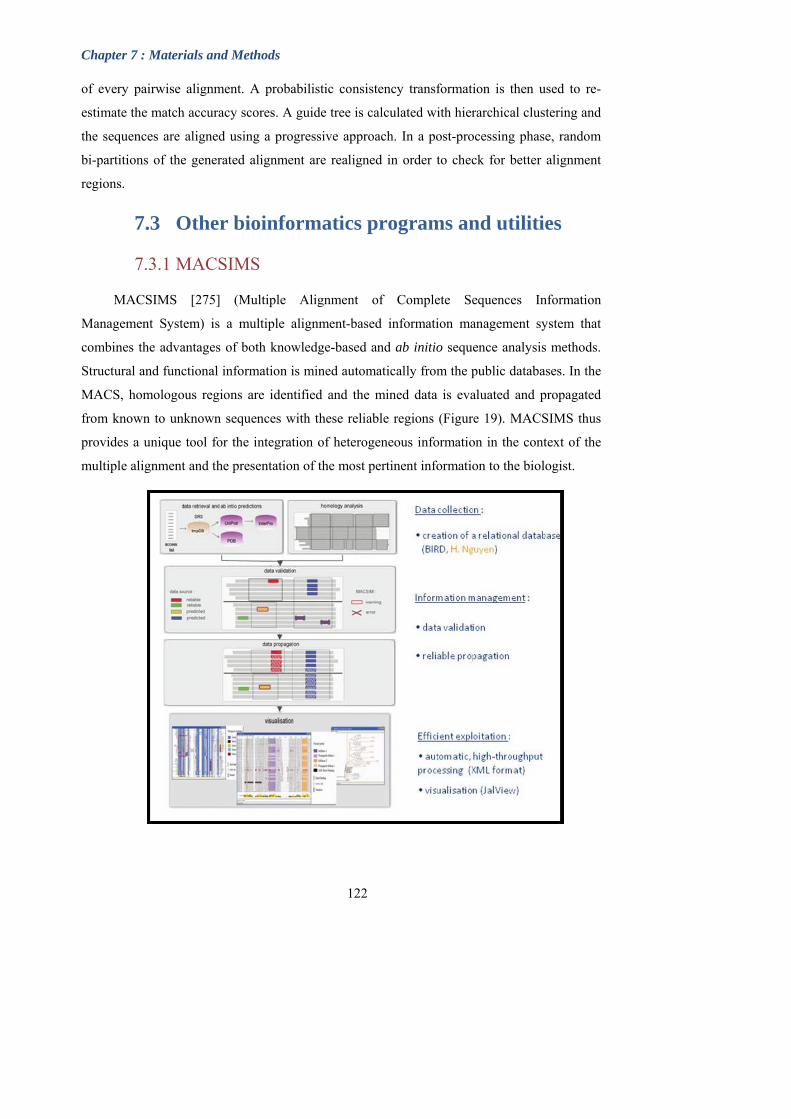
Chapter 7 : Materials and Methods
of every pairwise alignment. A probabilistic consistency transformation is then used to re-
estimate the match accuracy scores. A guide tree is calculated with hierarchical clustering and
the sequences are aligned using a progressive approach. In a post-processing phase, random
bi-partitions of the generated alignment are realigned in order to check for better alignment
regions.
7.3 Other bioinformatics programs and utilities
7.3.1 MACSIMS
MACSIMS [275] (Multiple Alignment of Complete Sequences Information
Management System) is a multiple alignment-based information management system that
combines the advantages of both knowledge-based and ab initio sequence analysis methods.
Structural and functional information is mined automatically from the public databases. In the
MACS, homologous regions are identified and the mined data is evaluated and propagated
from known to unknown sequences with these reliable regions (Figure 19). MACSIMS thus
provides a unique tool for the integration of heterogeneous information in the context of the
multiple alignment and the presentation of the most pertinent information to the biologist.
122
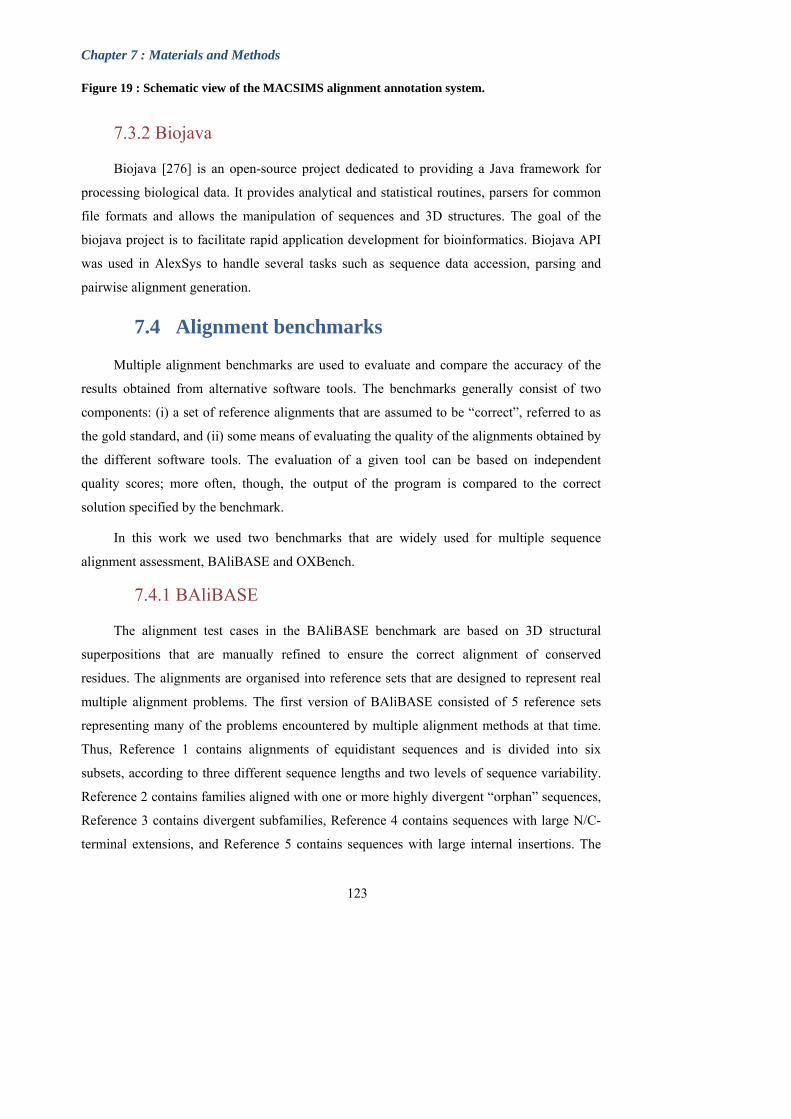
Chapter 7 : Materials and Methods
123
Figure 19 : Schematic view of the MACSIMS alignment annotation system.
7.3.2 Biojava
Biojava [276] is an open-source project dedicated to providing a Java framework for
processing biological data. It provides analytical and statistical routines, parsers for common
file formats and allows the manipulation of sequences and 3D structures. The goal of the
biojava project is to facilitate rapid application development for bioinformatics. Biojava API
was used in AlexSys to handle several tasks such as sequence data accession, parsing and
pairwise alignment generation.
7.4 Alignment benchmarks
Multiple alignment benchmarks are used to evaluate and compare the accuracy of the
results obtained from alternative software tools. The benchmarks generally consist of two
components: (i) a set of reference alignments that are assumed to be “correct”, referred to as
the gold standard, and (ii) some means of evaluating the quality of the alignments obtained by
the different software tools. The evaluation of a given tool can be based on independent
quality scores; more often, though, the output of the program is compared to the correct
solution specified by the benchmark.
In this work we used two benchmarks that are widely used for multiple sequence
alignment assessment, BAliBASE and OXBench.
7.4.1 BAliBASE
The alignment test cases in the BAliBASE benchmark are based on 3D structural
superpositions that are manually refined to ensure the correct alignment of conserved
residues. The alignments are organised into reference sets that are designed to represent real
multiple alignment problems. The first version of BAliBASE consisted of 5 reference sets
representing many of the problems encountered by multiple alignment methods at that time.
Thus, Reference 1 contains alignments of equidistant sequences and is divided into six
subsets, according to three different sequence lengths and two levels of sequence variability.
Reference 2 contains families aligned with one or more highly divergent “orphan” sequences,
Reference 3 contains divergent subfamilies, Reference 4 contains sequences with large N/C-
terminal extensions, and Reference 5 contains sequences with large internal insertions. The

Chapter 7 : Materials and Methods
124
three Reference sets (6-8) devoted to the particular problems posed by sequences with
transmembrane regions, repeats and inverted domains, were not used in this work. Table 3
shows the size of the latest version of the benchmark used for evaluating AlexSys.
Small number of equi-distant sequences Reference 1
short medium long sub-total
V1 (<20% identity) 14 12 12 38
V2 (20-40% identity 14 16 15 45
Reference 2 Family with one or more ‘orphan’ sequences 41
Reference 3 Divergent subfamilies 30
Reference 4 Large N/C terminal extensions 48
Reference 5 Large internal insertions 16
Total 217
Table 3 : Number of test cases in version 3 of the BAliBASE alignment benchmark
In each reference alignment, core blocks are defined that exclude the regions for which
the 3D structure superpositions are unreliable, for example, the borders of secondary structure
elements or in loop regions. Alignment programs were then compared using only the reliable
core blocks.
7.4.2 OXBench
This benchmark provides multiple alignments of proteins that are built automatically using
structure and sequence alignment methods. The benchmark is divided into three data sets. The
master set currently consists of 673 alignments of protein domains of known 3D structure,
with from 2 to 122 sequences in each alignment. The extended data set is constructed from the
master set by including sequences of unknown structure. Finally, the full-length data set
includes the full-length sequences for the domains in the master data set.
7.5 Weka machine learning package
The Weka (Waikato Environment for Knowledge Analysis) workbench is a selection of
state-of-the-art data preprocessing tools and machine learning methods, including clustering,
classification, regression and feature selection. Weka is freely available
(sourceforge.net/projects/weka/) under the GNU General Public License. It is implemented in

Chapter 7 : Materials and Methods
125
the Java programming language and thus runs on almost any modern computing platform. It
was developed to enable scientists to rapidly check out existing approaches on new datasets in
versatile ways. It offers considerable support for the entire procedure for experimental data
mining, such as preparing the input data, analyzing learning schemes statistically, and
visualizing the input data and the end result of learning. This diverse and complete toolkit is
used via a common user interface so that users can evaluate various methods easily and
determine the ones that are most suitable for the problem at hand.
7.6 UIMA: Unstructured Information Management
Architecture
UIMA was originally developed by IBM as a platform for creating, integrating and
deploying unstructured information management solutions from powerful text or multi-modal
analysis and search components. The Apache UIMA project is an implementation of the Java
UIMA framework available under the Apache License, providing a common foundation for
industry and academia to collaborate and accelerate the world-wide development of
technologies critical for discovering vital knowledge present in the fastest growing sources of
information today.
An unstructured information management (UIM) application may be generally
characterized as a software system that analyzes large volumes of unstructured information
(text, audio, video, images, etc.) to discover, organize and deliver relevant knowledge to the
client or application end-user. An example is an application that processes millions of medical
abstracts to discover critical drug interactions. Although UIMA was originally designed to
manage unstructured information, it can also accept structured data, for example, from
formatted flat files or relational databases.
This section presents an overview of the basic architectural philosophy of UIMA and
the essential components for expert system construction.
7.6.1 The Architecture, the Framework and the SDK
UIMA is a software architecture which specifies component interfaces, data
representations, design patterns and development roles for creating, describing, discovering,
composing and deploying multi-modal analysis capabilities. The UIMA framework then

Chapter 7 : Materials and Methods
126
provides a run-time environment in which developers can plug in their UIMA component
implementations and with which they can build and deploy UIM applications. The framework
is not specific to any IDE or platform. Apache hosts a Java and (soon) a C++ implementation
of the UIMA Framework. The UIMA Software Development Kit (SDK) includes the UIMA
framework, plus tools and utilities for using UIMA. Some of the tools support an Eclipse-
based (www.eclipse.org/) development environment.
Many UIM applications analyze entire collections of Input data. They connect to
different data sources and do different things with the results.
UIMA supports UIM application development for this general type of processing
through its Collection Processing Architecture. As part of the collection processing
architecture UIMA introduces two primary components in addition to the annotator and
analysis engine.
These are the Collection Reader and the CAS Consumer. The complete flow from
source, through input analysis, and to CAS Consumers supported by UIMA is illustrated in
Figure 20. The Collection Reader's job is to connect to and iterate through a source collection,
acquiring inputs and initializing CASes for analysis.
CAS Consumers, as the name suggests, function at the end of the flow. Their job is to
do the final CAS processing. A CAS Consumer may be implemented, for example, to index
CAS contents in a search engine, extract elements of interest and populate a relational
database or serialize and store analysis results to disk for subsequent and further analysis.
A UIMA Collection Processing Engine (CPE) is an aggregate component that specifies
a “source to sink” flow from a Collection Reader though a set of analysis engines and then to
a set of CAS Consumers. CPEs are specified by XML files called CPE Descriptors. These are
declarative specifications that point to their contained components (Collection Readers,
Analysis Engines and CAS Consumers) and indicate a flow among them. The flow
specification allows for filtering capabilities, for example, to skip over AEs based on CAS
contents.
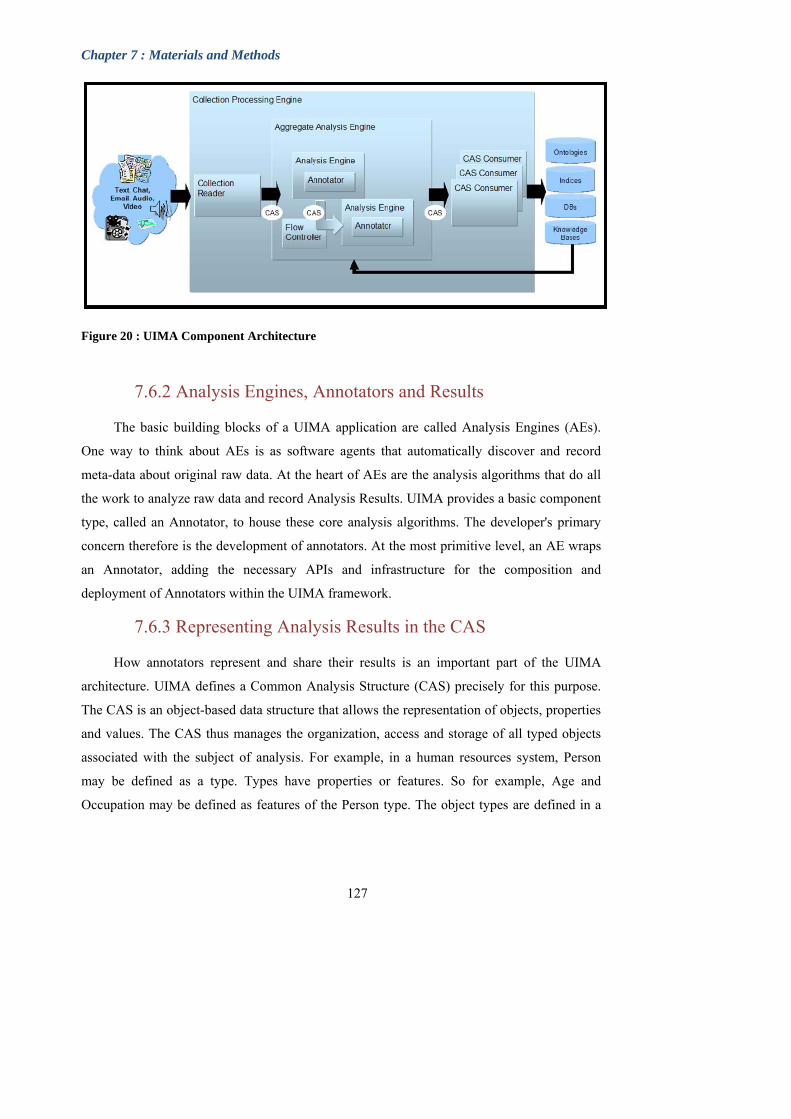
Chapter 7 : Materials and Methods
Figure 20 : UIMA Component Architecture
7.6.2 Analysis Engines, Annotators and Results
The basic building blocks of a UIMA application are called Analysis Engines (AEs).
One way to think about AEs is as software agents that automatically discover and record
meta-data about original raw data. At the heart of AEs are the analysis algorithms that do all
the work to analyze raw data and record Analysis Results. UIMA provides a basic component
type, called an Annotator, to house these core analysis algorithms. The developer's primary
concern therefore is the development of annotators. At the most primitive level, an AE wraps
an Annotator, adding the necessary APIs and infrastructure for the composition and
deployment of Annotators within the UIMA framework.
7.6.3 Representing Analysis Results in the CAS
How annotators represent and share their results is an important part of the UIMA
architecture. UIMA defines a Common Analysis Structure (CAS) precisely for this purpose.
The CAS is an object-based data structure that allows the representation of objects, properties
and values. The CAS thus manages the organization, access and storage of all typed objects
associated with the subject of analysis. For example, in a human resources system, Person
may be defined as a type. Types have properties or features. So for example, Age and
Occupation may be defined as features of the Person type. The object types are defined in a
127

Chapter 7 : Materials and Methods
128
hierarchically organized annotation Type System (TS). Thus, we can think of a TS as the
equivalent of an object schema for a relational database.
7.6.4 Component Descriptors
For every component specified in UIMA, such as Annotators and Analysis Engines,
there are two parts required for its implementation: the declarative part and the code part. The
code part implements the algorithm, for example a program in Java. The declarative part
contains metadata describing the component, its identity, structure and behavior and is called
the Component Descriptor. In addition to these standard fields, a component descriptor
identifies the Type System the component uses and the types it requires in an input CAS and
the types it produces in an output CAS. Component descriptors are represented in XML,
however the UIMA SDK provides tools for easily creating and maintaining the component
descriptors that relieve the developer from editing XML directly.
7.6.5 Aggregate Analysis Engines
A simple or primitive UIMA Analysis Engine (AE) contains a single annotator.
Annotators tend to perform fairly granular functions, for example language detection,
tokenization or part of speech detection. These functions typically address just part of an
overall analysis task. More complex AEs may also be defined to contain other AEs organized
in a workflow. These are called Aggregate Analysis Engines (AAE).
AAEs are designed to encapsulate potentially complex internal structure and insulate it
from users of the AE. The AAE developer acquires the internal components, defines the
necessary flow between them in a Flow Controller, and publishes the resulting AE. The Flow
Controller is responsible for determining the order in which the AE's will process the CAS.
Users of this AAE need not know how it is constructed internally, but only need its name and
its published input requirements and output types. These must be declared in the AAE's
descriptor. The AAE's descriptor also declares the components it contains and a flow
specification. The flow specification defines the order in which the internal component AEs
should be run.
The UIMA framework is equipped to handle different deployments where the AEs, for
example, are tightly-coupled (running in the same process) or loosely-coupled (running in
separate processes or even on different machines). The framework supports a number of
Chapter 7 : Materials and Methods
129
remote protocols for loose coupling deployments of aggregate analysis engines, including
SOAP (Simple Object Access Protocol) a standard Web Services communications protocol.
The UIMA framework facilitates the deployment of AEs as remote services by using an
adapter layer that automatically creates the necessary infrastructure in response to a
declaration in the component's descriptor.
7.6.6 Application building and Collection Processing
As mentioned above, the basic AE interface may be thought of as simply CAS in/CAS
out. The application is responsible for interacting with the UIMA framework to instantiate an
AE, create or acquire an input CAS, initialize the input CAS with a document and then pass it
to the AE through the process method. The UIMA AE Factory takes the declarative
information from the Component Descriptor and the class files implementing the annotator,
and instantiates the AE instance, setting up the CAS and the UIMA Context.
The AE, possibly calling many delegate AEs internally, performs the overall analysis
and its process method returns the CAS containing new analysis results.
The application then decides what to do with the returned CAS. There are many
possibilities. For instance the application could: display the results, store the CAS to disk for
post processing, extract and index analysis results as part of a search or database application
etc.

130
Results and Discussion
131
Preamble: AlexSys Design, Implementation and
Evaluation
AlexSys stands for Alignment expert System. It is a knowledge based expert system,
whose first objective is to establish a relationship between the nature of the protein sequences
to be aligned and the strengths and weaknesses of different alignment algorithms. A more
general objective for the development of AlexSys is the introduction of data-driven intelligent
systems, rather than fixed, predefined workflows or pipelines. A data-driven platform allows
more flexibility and can take into account the context of the analysis, by dynamically
modifying the workflow depending on the analysis scenario and the specific features of the
input data. The multiple sequence alignment (MSA) problem reported in this work is an ideal
case study to address such issues. MSA plays a key role in modern biological research and is
used differently depending on the analysis context. For example, a phylogenetic study might
have different expectations from a MSA than a functional annotation or 3D structure
homology modeling study. By ‘different expectations’, we implicitly mean MSA accuracy
and efficiency.
The work described in this thesis provides some answers to the MSA problem and goes
beyond making a simple decision concerning the most suitable algorithm for a given situation.
We consider some open questions such as whether today’s alignment algorithms can still be
considered pertinent, in a context where the sequence space is evolving rapidly and data
volumes continue to grow exponentially. Should we control the data to match the algorithms?
Or should we allow the data to drive the analysis process, in such a way that the data decides,
as a scientist would, which computational methodology is more suited to information
extraction and knowledge discovery? In the latter case, we are faced with the problem of how
to reuse human expertise in order to learn from the past and to treat as yet unseen cases, thus
inferring new knowledge from the data itself. Using cutting-edge technologies, we can now
hope to develop novel ‘expert’ systems that are data driven, incorporating machine learning
algorithms, artificial intelligence, and rules learned from the past.
In the following chapters, we will describe how we designed and implemented
AlexSys to efficiently drive a multiple alignment construction process. We will list some of

132
the problems that we faced during the development, and will argue our choices of some
specific methodologies rather than others. Chapter 8 will discuss the creation of the
knowledge base, used as input for the machine learning algorithm, described in Chapter 9. In
Chapter 10, we will discuss the alternative solutions considered for the construction of the
expert system itself. Finally, in Chapter 11, we present the evaluation process designed to
measure the efficiency and accuracy of the multiple alignment process.
Chapter 8 : Creation of the AlexSys knowledge base
133
Chapter 8
8. Creation of the AlexSys knowledge base
A crucial element in any computer-based expert system is the knowledge base used to
store the theoretical understanding and heuristic problem-solving rules gained from human
experts. But first, this knowledge has to be transformed into a form that the computer can use.
Section 8.1 describes the most widely used forms of knowledge representation, designed for
supervised machine learning algorithms. The remaining sections then describe in more detail
some of the specific issues involved in collecting and formatting the necessary background
information for the AlexSys machine learning algorithm, that will ‘learn’ the rules necessary
for selecting the most appropriate aligner(s), based on the input data.
8.1 Machine Learning Input
A supervised machine learning algorithm uses a set of well understood examples to
‘learn’ the rules required to classify these examples. This learning process is known as
training. The rules learnt can then be used to predict the outcome (known as a concept or
class) of a new unknown example.
The information that the learner is provided usually takes the form of a collection of
instances. Each instance is an individual, independent example of the concept to be learnt. It
is characterized by the values of attributes that determine different facets of the instance. The
following sections provide more detailed definitions of the terms: class, instance and attribute.
8.1.1 What is a concept (Class)?
Four fundamentally different types of learning are widely used (described in more detail
in chapter 3): classification learning, association learning, clustering and numeric prediction.
Regardless of the type of learning used, we call the fact to be learned the concept and the
output created by the learning system the concept description.
In the contact lens example (Figure 21 (a)), the learning problem is to discover ways to
determine a lens prescription for any new individual. Thus, the concept is the lens prescription
and the concept description is the method learnt to predict it. The weather data (Figure 21(b)

Chapter 8 : Creation of the AlexSys knowledge base
and Figure 21(c)) shows some days along with a decision to play games or not. Here, the
concept (class) to be predicted for each day is play or don’t play. For the irises (Figure 21(d)),
the issue is to discover ways to decide whether a new iris flower is setosa, versicolor, or
virginica, given its sepal measurements and petal ones.
Figure 21 : Input data examples for machine learning algorithms
Lines corresponds to instances, columns to attributes, and the last column generally serves as Class
8.1.2 What is an example (Instance)?
The examples input to the machine learning system are known as instances. Most of
these instances tend to be things that should be classified, associated, or clustered. Although
we have referred to them as examples so far, henceforth we will make use of the more
specific name ‘instances’ to refer to the input. Every instance is an individual, independent
example associated with the class to be learned. For example, in the weather data shown
above, each represents one instance. Each instance is described by the values of some
134

Chapter 8 : Creation of the AlexSys knowledge base
135
established attributes. In the case of the weather example, days are characterized by outlook,
temperature, humidity and wind conditions. A dataset is then represented by a matrix of
instances versus attributes, which in database terminology is usually a single relation, or a flat
file. Providing the input information as separate instances is probably the most frequent
scenario for useful machine learning.
8.1.3 What is an attribute?
Every unique, independent instance that is used as input to machine learning is
described by a fixed, predetermined group of characteristics or attributes. The instances are
the rows of the tables shown above for the weather, contact lens, and iris examples, and the
attributes are the columns Figure 21. The application of a predetermined list of features
imposes an additional limitation on machine learning. What if different instances possess
different attributes? If the instances were transport vehicles, then number of tires is an
attribute that relates to several vehicles although not to boats, for example, while number of
masts could be a feature that relates to ships although not to land vehicles. The conventional
workaround would be to make every possible feature an attribute and to employ a special
“irrelevant value” flag in order to specify that a specific attribute is not designed for a
particular situation. The value of an attribute for any specific case is often a measurement of
the quantity to which the attribute relates. Attributes can be defined as numeric, nominal or
ordinal:
Numeric attributes, often referred to as continuous attributes, determine numbers -
both real and integer values. It should be noted that the word continuous is
sometimes misused in this context: integer-valued attributes are generally not
continuous from the mathematical point of view.
Nominal attributes refer to values that are restricted to a pre-specified, limited
group of possibilities and therefore are often called categorical attributes. But there
are other possibilities. Nominal quantities have values that are distinct symbols.
The values themselves serve just as labels or names—hence the term nominal,
which comes from the Latin word for name. For example, in the weather data the
attribute outlook has values: sunny, overcast, and rainy. No relation is implied
among these three—no ordering or distance measure. It certainly does not make

Chapter 8 : Creation of the AlexSys knowledge base
sense to add the values together, multiply them, or even compare their size. A rule
using such an attribute can only test for equality or inequality, as follows:
Ordinal quantities are ones that make it possible to rank order the categories.
However, although there is a notion of ordering, there is no notion of distance. For
example, in the weather data the attribute temperature has values hot, mild, and
cool. These are ordered. Whether we say
is a matter of convention—it does not matter which is used as long as consistency is
maintained. What is important is that mild lies between the other two. Although it
makes sense to compare two values, it does not make sense to add or subtract
them—the difference between hot and mild cannot be compared with the difference
between mild and cool. A rule using such an attribute might involve a comparison,
as follows:
8.2 AlexSys Instance Selection
Preparing the input for a machine learning algorithm usually represents the most
significant portion of the effort invested in the entire process. Bitter experience shows that
real data is often of disappointingly low in quality, and careful checking—a process that has
become known as data cleaning—pays off many times over. In the case of Alexsys, the
Instances for the learning process correspond to multiple sequence alignments. In order to
predict how alignment algorithms will perform in real world situations, it is crucial to select
alignments that represent real problems. Based on previous comparisons of alignment
benchmarks, we initially chose to use alignments from the BAliBASE and OXBench
benchmarks. We thus used the 218 alignments in BAliBASE References 1-5, corresponding
to (i) equidistant sequences with various levels of conservation, (ii) families aligned with a
highly divergent ‘orphan’ sequence, (iii) subgroups with <25% residue identity between
136

Chapter 8 : Creation of the AlexSys knowledge base
137
groups, (iv) sequences with N/C-terminal extensions and (v) internal insertions. These 218
alignments contain a total of 6222 protein sequences, including both full length sequences and
fragmentary sequences from the PDB database. In addition to the alignments from
BAliBASE, we used the set of 672 extended alignments from OXBench, containing a total of
66742 protein sequences. These alignments contain sequences corresponding to isolated
structural domains. The combined data set was then divided into a training set of 712
alignments (80% of the alignments were selected at random) used to create the rules in the
inference engine and a test set of 178 alignments (the remaining 20%) used for evaluation
purposes.
8.3 AlexSys attribute selection
The majority of machine learning algorithms are designed to determine which attributes
are the most pertinent to use for generating their decisions for a given problem. For instance,
decision tree methods (described in chapter 9) select the most discriminating attribute at each
level and, in theory, should not choose irrelevant or unhelpful attributes. Therefore, again in
theory, using more attributes to describe the set of instances, should result in better
discrimination and better prediction accuracy.
Nevertheless, tests using a decision tree learner (C4.5) and standard datasets have
established that incorporating a random binary attribute leads to a decrease in the overall
classification performance (typically by 5% to 10% in the situations tested). This happens
simply because at some point in the training process, the irrelevant attribute is selected,
leading to random errors in the subsequent predictions.
Decision tree classifiers have problems with this effect since they inflexibly reduce the
quantity of data on which they base decision taking. Instance-based learners are prone to
irrelevant attributes since they usually operate in local neighborhoods, getting a few training
instances into consideration for each decision. Indeed, the amount of training instances
required to make a predetermined degree of efficiency for instance-based learning often
increases significantly with the number of unimportant attributes present. Naïve Bayes, by
comparison, does not fragment the instance space and robustly disregards unimportant
attributes. It assumes that most attributes are separate from one another, a supposition which
is good for random “distracter” attributes. But through this very same supposition, Naïve
Commentaire [MSOffice16] :eference
Chapter 8 : Creation of the AlexSys knowledge base
138
Bayes pays a huge cost in other ways since its procedure is harmed by the addition of
redundant attributes.
The fact that irrelevant attributes lower the performance of state-of-the art decision tree
and rule learners is, initially, surprising. Much more surprising is the fact that relevant
attributes may also be harmful. For instance, suppose that in a two-class dataset a new
attribute is added that has the same value as the class to be predicted most of the time (65%)
and the opposite value the rest of the time, randomly distributed among the instances.
Experiments with standard datasets have shown that this can cause classification accuracy to
deteriorate (by 1% to 5% in the situations tested). The problem is that the new attribute is
(naturally) chosen for splitting high up in the tree. This has the effect of fragmenting the set of
instances available at the nodes below, so that subsequent choices are based on sparser data.
Because of the negative effect of irrelevant attributes on most machine learning
algorithms, the learning process is often preceded by an attribute selection stage to try to
eliminate all but the most relevant attributes. The best way to select relevant attributes is
manually, based on a deep understanding of the learning problem and what the attributes
actually mean. However, automatic methods can also be useful. Reducing the dimensionality
of the data by removing unsuitable attributes improves the accuracy of learning algorithms. It
also speeds them up, although this may be outweighed by the computation involved in
attribute selection. More importantly, dimensionality reduction yields a more compact, more
easily interpretable representation of the rules, focusing the user’s attention on the most
relevant attributes.
In the case of AlexSys, the selection of pertinent features or ‘attributes’, that adequately
describe the input sequences, posed particular problems. There are two possibilities that could
make of this task either efficient or long and difficult. If we choose the appropriate features
that have an effect on the quality of the alignments obtained by the different algorithms, the
problem is simply one of optimization of these features. In contrast, a random choice of
features could lead to a long, iterative process of attribute evaluation and testing. Based on our
previous knowledge acquired working on multiple sequence alignments, we identified the
following relevant attributes:
The number of sequences in the dataset has been shown to be determinant for the
running time of an alignment program or its accuracy. In the high throughput context,
Commentaire [MSOffice17] :eference
Commentaire [MSOffice18] :ho said manual is best? Do you have a reference?
Chapter 8 : Creation of the AlexSys knowledge base
139
this feature plays an important role in the alignment process. Thus it is important to
consider this attribute when making a decision on which algorithm to use.
The sequence length has also been shown to affect the efficiency and accuracy of
alignment programs. In order to fully describe the variability observed within a set of
sequences to be aligned, we defined a number of attributes, namely the minimal and
maximal lengths, the mean and the standard deviation.
The similarity of the sequences to be aligned clearly has an effect on alignment
quality. More similar sequences are generally aligned better than more divergent ones.
Here, we use the residue percent identity to measure the similarity of the sequences,
based on pairwise alignments of all the sequences in the dataset. As for sequence
length, a number of attributes are defined (minimum, maximum, mean and standard
deviation) to describe the variability observed in the dataset.
To investigate the impact of protein structural information on the alignment strategy,
the following attributes were defined: the number of sequences with known 3D
structure (as defined in the PDB database), the average number of residues found in α-
helices in each sequence, and the average number of residues found in β-strands in
each sequence. These attributes are mined using our in-house programs that connect to
the PDB via Bird (described in the Materials and Methods).
The presence of multi-domain proteins, where each domain may have a different
evolutionary history, poses problems for multiple alignment construction. Here, we
use the average number of functional domains per sequence, according to the Pfam
database to estimate this effect.
Most alignment algorithms are optimized to align globular protein domains. Therefore,
we included measures of low complexity, or non-globular regions, namely; the
number of sequences with low complexity regions and the average number of regions
with low complexity per sequence.
In order to investigate the effects of amino acid composition, we defined a number of
features including average hydrophobicity of the sequences, average number of
predicted transmembrane segments per sequence and average amino acid composition
based on the six groups: [PAGST], [DEQN], [KRH], [LIVM], [FWY] and [C].
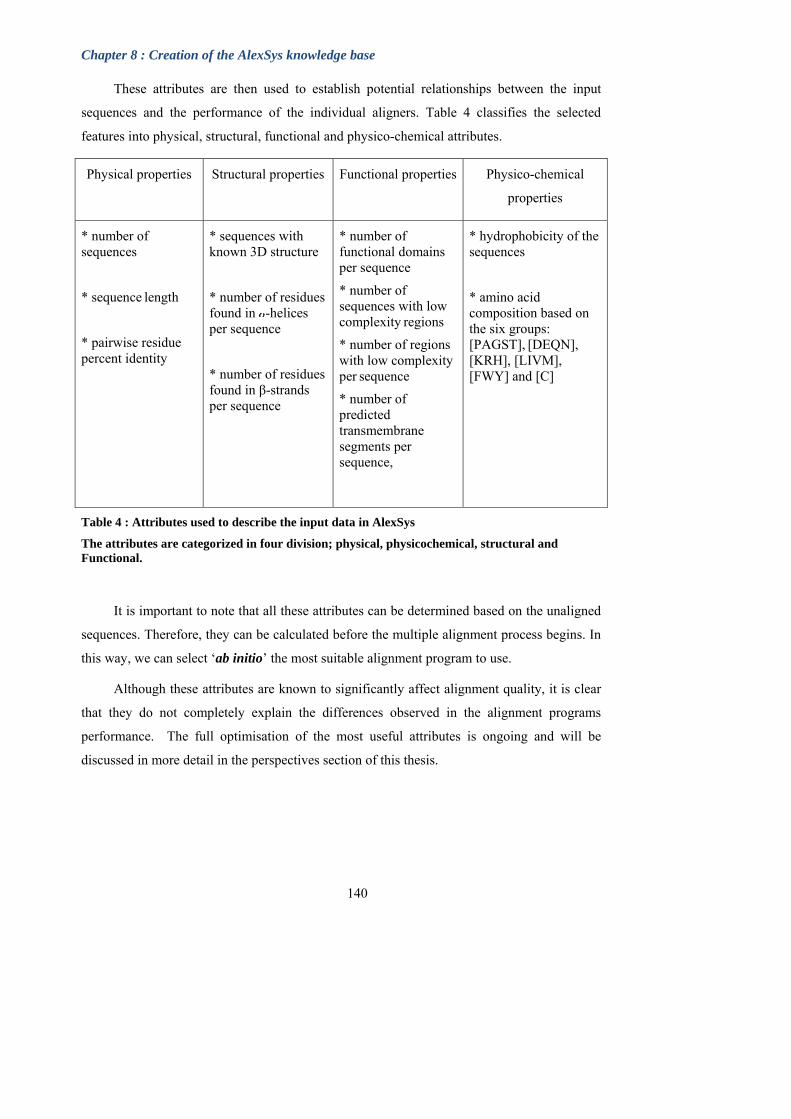
Chapter 8 : Creation of the AlexSys knowledge base
These attributes are then used to establish potential relationships between the input
sequences and the performance of the individual aligners. Table 4 classifies the selected
features into physical, structural, functional and physico-chemical attributes.
Physical properties Structural properties Functional properties Physico-chemical
properties
* number of sequences
* sequence length
* pairwise residue percent identity
* sequences with known 3D structure
* number of residues found in -helices per sequence
* number of residues found in β-strands per sequence
* number of functional domains per sequence
* number of sequences with low complexity regions
* number of regions with low complexity per sequence
* number of predicted transmembrane segments per sequence,
* hydrophobicity of the sequences
* amino acid composition based on the six groups: [PAGST], [DEQN],
[KRH], [LIVM], [FWY] and [C]
Table 4 : Attributes used to describe the input data in AlexSys
The attributes are categorized in four division; physical, physicochemical, structural and Functional.
It is important to note that all these attributes can be determined based on the unaligned
sequences. Therefore, they can be calculated before the multiple alignment process begins. In
this way, we can select ‘ab initio’ the most suitable alignment program to use.
Although these attributes are known to significantly affect alignment quality, it is clear
that they do not completely explain the differences observed in the alignment programs
performance. The full optimisation of the most useful attributes is ongoing and will be
discussed in more detail in the perspectives section of this thesis.
140

Chapter 8 : Creation of the AlexSys knowledge base
8.4 ARFF format
There exists a standard file format for representing datasets which include independent,
unordered instances and do not contain relationships between instances, known as ARFF
(Attribute-Relation File Format). Figure 22 illustrates an ARFF file for the weather data in
Figure 21(c). Lines starting with a % character are comments. These are followed by the
relation (weather) and a block listing the attributes (outlook, temperature, humidity, windy,
play?). Nominal attributes are accompanied by the list of values they can accept, surrounded
by curly braces. Values may contain spaces, in which case, they should be placed inside
quotation marks. Numeric values are followed by the keyword numeric.
Figure 22 : Example ARFF files.
a) A typical ARFF file corresponding to the weather data example and b) the ARFF file used in the context of AlexSys, representing the different attributes as well as the first line of the data itself (file truncated).
141
Chapter 8 : Creation of the AlexSys knowledge base
142
Although the weather issue is to estimate the class value ‘play?’ from the values of the
different attributes, the class concept is not defined in this format. Indeed, the ARFF format
does not designate which of the attributes is to be predicted. This means that the same file
may be used for example, to investigate how effectively each attribute can be predicted from
the others, or to discover association rules, or for clustering. In addition to nominal and
numeric attributes, shown in the weather data for example, the ARFF format has two
additional attribute types, string and date attributes. String attributes have values that are
textual. After the attribute definitions, the @data line indicates the beginning of the instances
in the dataset. Instances are written one per line, with the values for each attribute in turn,
separated by commas. If a value is missing, it is represented by a single question mark (there
are no missing values in these datasets). The attribute specifications in ARFF files allow
validation of the dataset to make sure that it includes legal values for all attributes, and
applications that read ARFF files generally do this automatically.
Chapter 9 : Machine learning in AlexSys
143
Chapter 9
9. Machine learning in AlexSys
The goal of the machine learning stage in AlexSys is to determine the most appropriate
alignment program to use, given a specific set of sequences to align. In the previous chapter,
we discussed the input to this learning step, in terms of training instances, and their associated
attributes. More specifically, the input to the AlexSys machine learning process is a set of
training alignments, and a number of pre-calculated characteristics which describe the
sequence set to be aligned. The goal of the learning process is to use these training alignments
in order to determine a set of rules that can be used to select a suitable alignment program, i.e.
given a set of sequences, can we predict which alignment program will produce the best
multiple alignment?
The definition of the machine learning model in AlexSys is described in Section 9.1.
We chose to base our model on a decision tree algorithm (i) because we needed a method that
clearly describe our input attributes in relation with our classes, and (ii) because of the wide
use of decision trees in bioinformatics, they have proved to be effective. In section 9.2, we
discuss the general issues involved in building an accurate decision tree and the remaining
sections then describe in more detail the decision tree algorithm used in AlexSys and its initial
evaluation.
9.1 Defining a suitable model
Before starting the model creation, we need to pose the pertinent question that fits our
problem. We initially attempted to predict the most suitable multiple sequence alignment
algorithm (aligner) for a set of sequences. We therefore created a single model containing the
alignment instances, the attributes, and as a class (the decision) a nominal value (label)
corresponding to the name of the highest scoring aligner. For the benchmark alignments used
here, the sum-of-pairs (SP) scores obtained by each aligner are calculated with reference to
the ‘correct’ alignment. Thus, we defined six classes corresponding to the six multiple
sequence alignment programs. After testing the model using the facilities in the Weka
Chapter 9 : Machine Learning in AlexSys
144
package (decision trees and cross validation), we obtained a classification performance that
did not exceed 40%. In the context of AlexSys, this was not satisfactory, since the model
resulted in an error rate of 60% when trying to attribute an aligner to a given instance. Two
explanations were possible for this poor performance. First, the scores obtained by different
aligners were identical or very similar for a certain number of the instances. For example, for
a given instance, Mafft obtained a score of 0.845, while ClustalW obtained a score of 0.832. It
is then difficult to distinguish between the two aligners. Second, the number of instances may
not have been sufficient to resolve this multi-class problem.
This led us to redesign the question so that we could reduce the problem to a binary
classification one. Thus, we divided our original model into 6 separate ones, each
corresponding to a single aligner. In each model, the performance (class) of the aligner is
defined as ‘strong’ or ‘weak’ for the instance. The problem was then the quantification of the
strength or weakness of each aligner. We chose to specify a critical threshold that makes an
alignment acceptable or not, based on the SP score of the alignment. Above a threshold of 0.5,
an aligner is considered to be Strong, and below this value, an aligner is considered to be
Weak. The final model is shown in Figure 23.
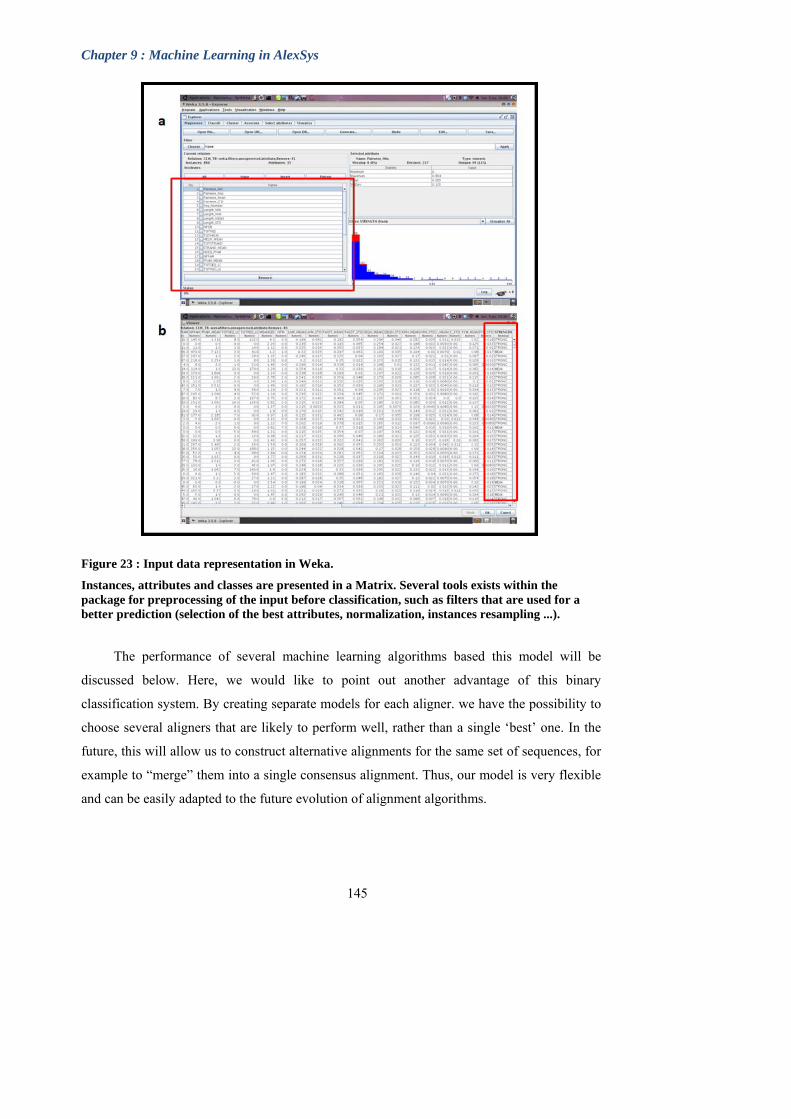
Chapter 9 : Machine Learning in AlexSys
Figure 23 : Input data representation in Weka.
Instances, attributes and classes are presented in a Matrix. Several tools exists within the package for preprocessing of the input before classification, such as filters that are used for a better prediction (selection of the best attributes, normalization, instances resampling ...).
The performance of several machine learning algorithms based this model will be
discussed below. Here, we would like to point out another advantage of this binary
classification system. By creating separate models for each aligner. we have the possibility to
choose several aligners that are likely to perform well, rather than a single ‘best’ one. In the
future, this will allow us to construct alternative alignments for the same set of sequences, for
example to “merge” them into a single consensus alignment. Thus, our model is very flexible
and can be easily adapted to the future evolution of alignment algorithms.
145

Chapter 9 : Machine Learning in AlexSys
9.2 Constructing a Decision Tree
The challenge of building a decision tree can be stated recursively. First, choose an
attribute to position at the root node and create one branch for every possible value. This splits
up the example group into subsets, one for each value of the attribute. At this point, the
process can be repeated recursively for every branch, using only those instances that are
grouped on the branch. If at any time most cases in a node have the same classification, we
stop building that part of the tree.
The remaining problem concerns how to determine which attribute to split on, given a
set of examples with various classes. Let's consider the weather data used in chapter 8. There
are four choices for every split, and at the first level they produce trees like those in Figure 24.
Which is the best option? The number of yes and no classes are shown at the leaves. Any leaf
with just one class - yes or no - will not need to be divided further, and the recursive
procedure down that branch will end.
Figure 24 : Tree construction for the weather data introduced in chapter 8 (from Witten and Frank, 2005).
At a given step in the tree construction process, one of four possible attributes has to be selected to split the set of training instances. Attributes are shown in circles and their associated values are indicated on the arrows. The classes of the training instances (yes or no) are shown in grey boxes.
146
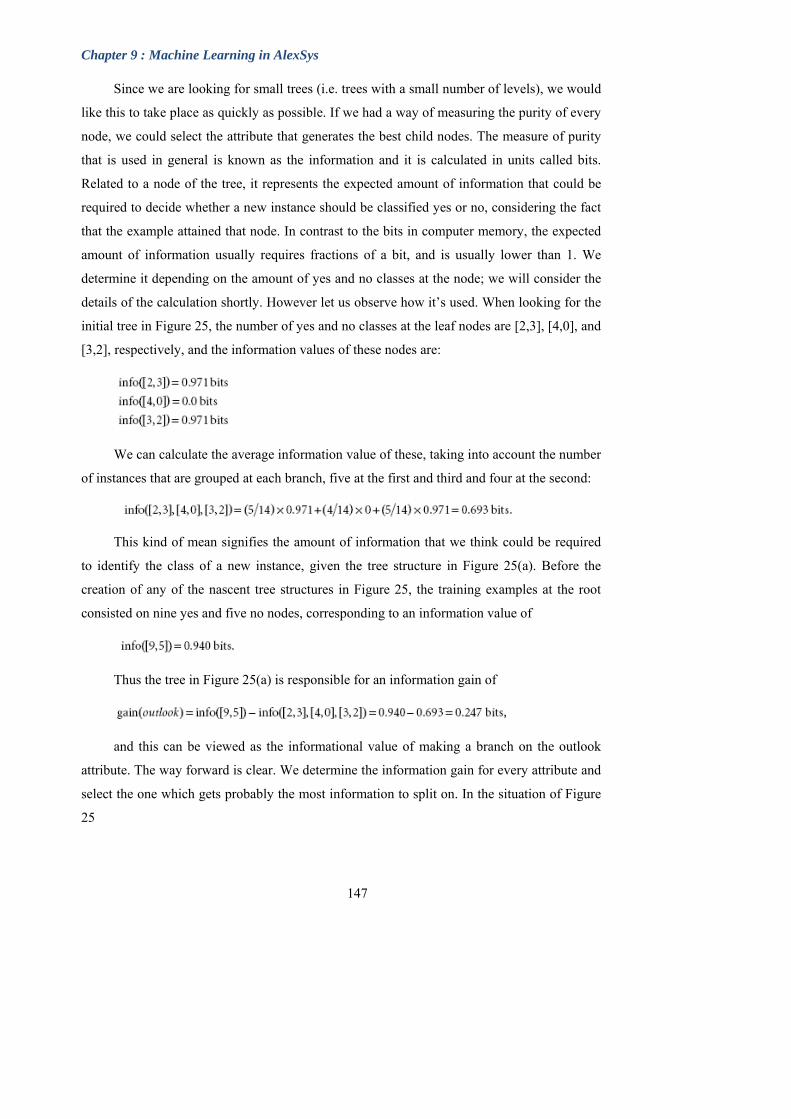
Chapter 9 : Machine Learning in AlexSys
Since we are looking for small trees (i.e. trees with a small number of levels), we would
like this to take place as quickly as possible. If we had a way of measuring the purity of every
node, we could select the attribute that generates the best child nodes. The measure of purity
that is used in general is known as the information and it is calculated in units called bits.
Related to a node of the tree, it represents the expected amount of information that could be
required to decide whether a new instance should be classified yes or no, considering the fact
that the example attained that node. In contrast to the bits in computer memory, the expected
amount of information usually requires fractions of a bit, and is usually lower than 1. We
determine it depending on the amount of yes and no classes at the node; we will consider the
details of the calculation shortly. However let us observe how it’s used. When looking for the
initial tree in Figure 25, the number of yes and no classes at the leaf nodes are [2,3], [4,0], and
[3,2], respectively, and the information values of these nodes are:
We can calculate the average information value of these, taking into account the number
of instances that are grouped at each branch, five at the first and third and four at the second:
This kind of mean signifies the amount of information that we think could be required
to identify the class of a new instance, given the tree structure in Figure 25(a). Before the
creation of any of the nascent tree structures in Figure 25, the training examples at the root
consisted on nine yes and five no nodes, corresponding to an information value of
Thus the tree in Figure 25(a) is responsible for an information gain of
and this can be viewed as the informational value of making a branch on the outlook
attribute. The way forward is clear. We determine the information gain for every attribute and
select the one which gets probably the most information to split on. In the situation of Figure
25
147
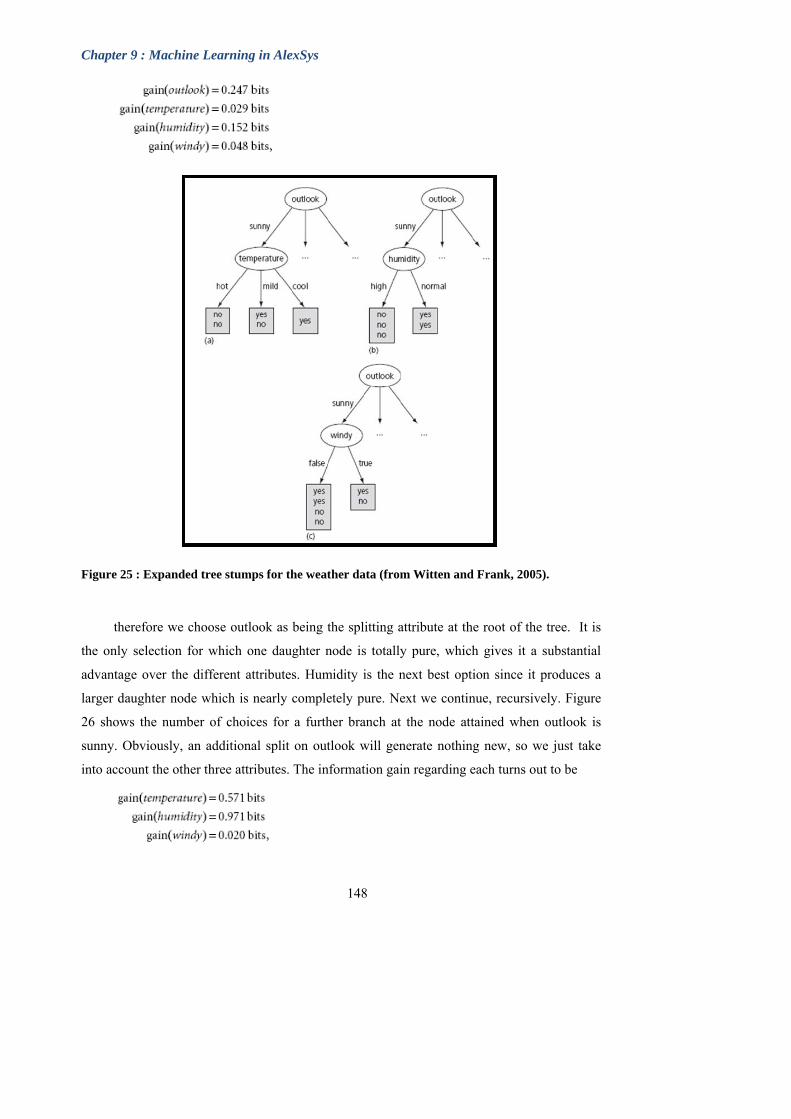
Chapter 9 : Machine Learning in AlexSys
Figure 25 : Expanded tree stumps for the weather data (from Witten and Frank, 2005).
therefore we choose outlook as being the splitting attribute at the root of the tree. It is
the only selection for which one daughter node is totally pure, which gives it a substantial
advantage over the different attributes. Humidity is the next best option since it produces a
larger daughter node which is nearly completely pure. Next we continue, recursively. Figure
26 shows the number of choices for a further branch at the node attained when outlook is
sunny. Obviously, an additional split on outlook will generate nothing new, so we just take
into account the other three attributes. The information gain regarding each turns out to be
148
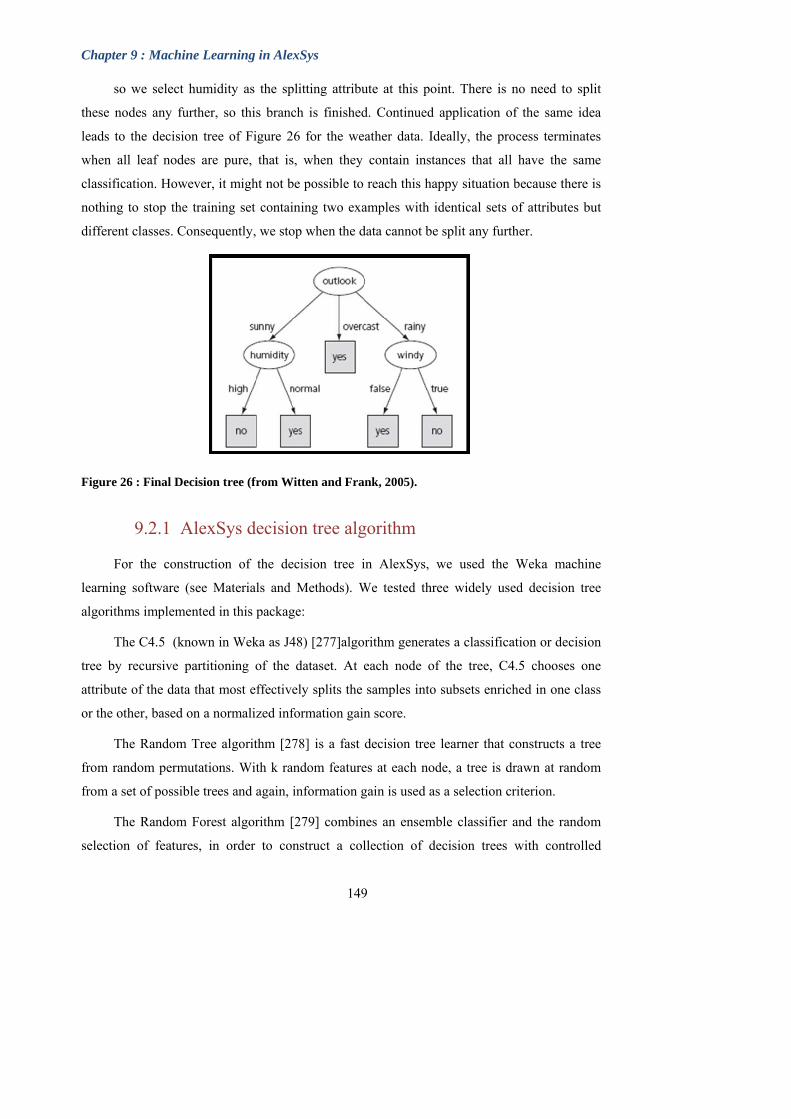
Chapter 9 : Machine Learning in AlexSys
so we select humidity as the splitting attribute at this point. There is no need to split
these nodes any further, so this branch is finished. Continued application of the same idea
leads to the decision tree of Figure 26 for the weather data. Ideally, the process terminates
when all leaf nodes are pure, that is, when they contain instances that all have the same
classification. However, it might not be possible to reach this happy situation because there is
nothing to stop the training set containing two examples with identical sets of attributes but
different classes. Consequently, we stop when the data cannot be split any further.
Figure 26 : Final Decision tree (from Witten and Frank, 2005).
9.2.1 AlexSys decision tree algorithm
For the construction of the decision tree in AlexSys, we used the Weka machine
learning software (see Materials and Methods). We tested three widely used decision tree
algorithms implemented in this package:
The C4.5 (known in Weka as J48) [277]algorithm generates a classification or decision
tree by recursive partitioning of the dataset. At each node of the tree, C4.5 chooses one
attribute of the data that most effectively splits the samples into subsets enriched in one class
or the other, based on a normalized information gain score.
The Random Tree algorithm [278] is a fast decision tree learner that constructs a tree
from random permutations. With k random features at each node, a tree is drawn at random
from a set of possible trees and again, information gain is used as a selection criterion.
The Random Forest algorithm [279] combines an ensemble classifier and the random
selection of features, in order to construct a collection of decision trees with controlled
149
Chapter 9 : Machine Learning in AlexSys
150
variation. Each tree defines a classification, and is said to "vote" for that classification. The
forest algorithm then chooses the classification having the most votes (over all the trees in the
forest).
9.3 Model and Machine Learning Evaluation
Evaluation is paramount to making genuine improvement in machine learning. Given
the training set, we could simply measure how effectively different methods perform on this
data. However, efficiency on the training set may be a bad indicator of performance on other
unknown test sets. We therefore need methods for predicting the true performance in blind
tests. When various sets of data are available this is no problem, we simply train a model on a
sizable training set, and evaluate it on a separate large test set. However, it is often the case
that data, at least quality data, is rare.
Based on restricted data, comparing the efficiency of various machine learning
techniques is not as simple as it might seem and reliable, statistical tests are needed. One
solution to this is cross-validation. One of the simplest approaches, given a single source of
quality data, is the holdout method, which reserves a certain amount for testing and uses the
remainder for training. In practical terms, it is common to hold out one-third of the data for
testing and use the remaining two-thirds for training.
In this case, it is important that the samples used for training and testing are
representative. In general, it is difficult to tell whether a sample is representative or not,
however random sampling can be used to ensure that each class is represented in similar
proportions in the training and testing sets. Another solution is to repeat the whole training
and testing process several times with different random samples. In each iteration, a certain
proportion, e.g. two-thirds of the data, is randomly selected for training and the remainder
used for testing. The performances on the different iterations are averaged to give an overall
performance estimate.
A variant of the holdout method is cross-validation. Here, the data is divided into a
fixed number of approximately equal parts, usually 10. Each part is held out in turn and the
remainder is used for training. Thus the learning procedure is executed a total of 10 times on
different training sets (each of which have a lot in common). Finally, the 10 performance
estimates are averaged to yield an overall estimate. This 10-fold cross-validation has become
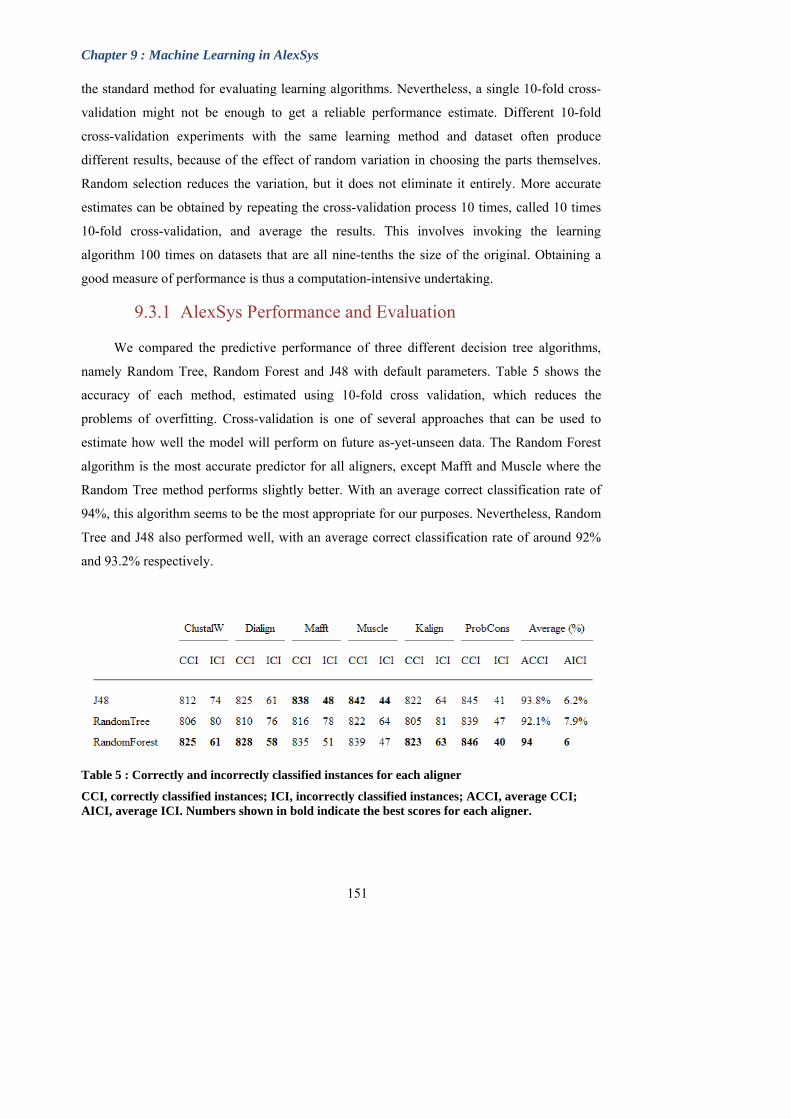
Chapter 9 : Machine Learning in AlexSys
the standard method for evaluating learning algorithms. Nevertheless, a single 10-fold cross-
validation might not be enough to get a reliable performance estimate. Different 10-fold
cross-validation experiments with the same learning method and dataset often produce
different results, because of the effect of random variation in choosing the parts themselves.
Random selection reduces the variation, but it does not eliminate it entirely. More accurate
estimates can be obtained by repeating the cross-validation process 10 times, called 10 times
10-fold cross-validation, and average the results. This involves invoking the learning
algorithm 100 times on datasets that are all nine-tenths the size of the original. Obtaining a
good measure of performance is thus a computation-intensive undertaking.
9.3.1 AlexSys Performance and Evaluation
We compared the predictive performance of three different decision tree algorithms,
namely Random Tree, Random Forest and J48 with default parameters. Table 5 shows the
accuracy of each method, estimated using 10-fold cross validation, which reduces the
problems of overfitting. Cross-validation is one of several approaches that can be used to
estimate how well the model will perform on future as-yet-unseen data. The Random Forest
algorithm is the most accurate predictor for all aligners, except Mafft and Muscle where the
Random Tree method performs slightly better. With an average correct classification rate of
94%, this algorithm seems to be the most appropriate for our purposes. Nevertheless, Random
Tree and J48 also performed well, with an average correct classification rate of around 92%
and 93.2% respectively.
Table 5 : Correctly and incorrectly classified instances for each aligner
CCI, correctly classified instances; ICI, incorrectly classified instances; ACCI, average CCI; AICI, average ICI. Numbers shown in bold indicate the best scores for each aligner.
151

Chapter 9 : Machine Learning in AlexSys
A more detailed study of the performance of the Random Forest algorithm is shown in
Figure 27. The results confirm that the classification is highly accurate for all five aligners
used here. The true positive (TP) rates range from 0.97 to 0.99 for high scoring multiple
alignments (class=Strong), whereas for low scoring alignments (class=Weak) the TP rates
range from 0.72 to 0.87. The F-Measure, defined as:
FPFNTP
TP
precisionrecall
precisionrecallMeasureF
2
22
is a widely used score in the information retrieval and natural language processing
communities and combines measures of precision (also called positive predictive value =
TP/TP+FP) and recall (also called sensitivity =TP/TP+FN). The F-measure score ranges from
0.0 to 1.0, with 0.0 indicating the poorest result and 1.0 a perfect retrieval. In these tests, the
F-measures for the Random Forest algorithm range from 0.96 to 0.98 for Strong class
alignments and from 0.77 to 0.90 for Weak class alignments.
Based on these results, we concluded that the Random Forest approach was the most
appropriate for our purposes. This was then used to build the inference engine used by the
AlexSys to select the most appropriate aligner for a given set of sequences.
152

Chapter 9 : Machine Learning in AlexSys
Figure 27 : Evaluation of the Random Forest algorithm for the classification of aligner performance as S=strong or W=weak.
For each aligner, the TP (True Positive rate = proportion of correctly classified instances), FP (False Positive rate = proportion of wrongly classified instances), Precision (=TP/TP+FP), Recall (=TP/TP+FN), F-measure (combines recall and precision scores into a single measure of performance) and ROC area (or the area under the receiver operating characteristic (ROC) curve = the probability that when we randomly pick one positive and one negative example, the classifier will assign a higher score to the positive example than to the negative) are indicated.
9.4 Model creation and access through java API
The Weka package offers the possibility to use their Java API to implement certain
functions in other software or pipelines. The rich API and the large Weka community allowed
us to test our models outside the AlexSys core implementation and then to reproduce the
results programmatically through the API.
This feature is well adapted to our case and in the next section we will show how we
linked the Weka API to other components in AlexSys. Figure 28 shows a simple case of
model building and testing.
153

Chapter 9 : Machine Learning in AlexSys
154
Figure 28 : Simple Java code showing how to implement a classifier, using a training set and test set and output the classification results and performance.
The code implemented in AlexSys to connect the knowledge base and the model was verified
to ensure that we obtain the same results as in the Weka implementation.
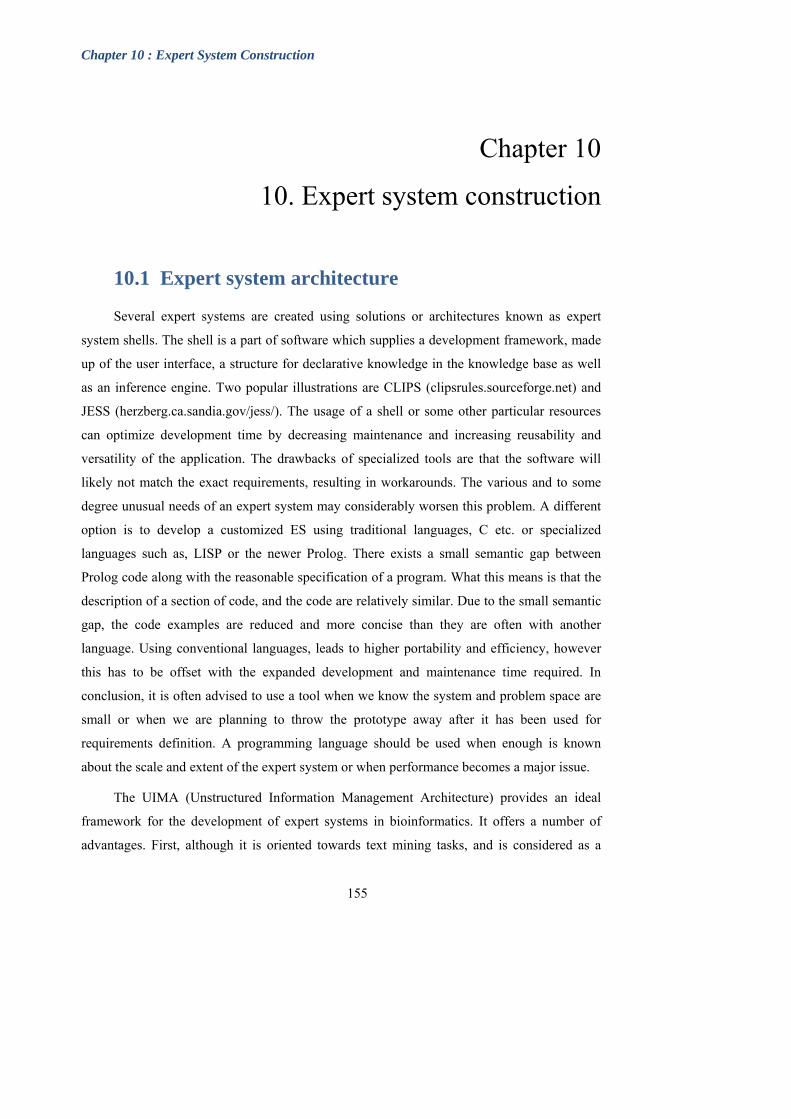
Chapter 10 : Expert System Construction
155
Chapter 10
10. Expert system construction
10.1 Expert system architecture
Several expert systems are created using solutions or architectures known as expert
system shells. The shell is a part of software which supplies a development framework, made
up of the user interface, a structure for declarative knowledge in the knowledge base as well
as an inference engine. Two popular illustrations are CLIPS (clipsrules.sourceforge.net) and
JESS (herzberg.ca.sandia.gov/jess/). The usage of a shell or some other particular resources
can optimize development time by decreasing maintenance and increasing reusability and
versatility of the application. The drawbacks of specialized tools are that the software will
likely not match the exact requirements, resulting in workarounds. The various and to some
degree unusual needs of an expert system may considerably worsen this problem. A different
option is to develop a customized ES using traditional languages, C etc. or specialized
languages such as, LISP or the newer Prolog. There exists a small semantic gap between
Prolog code along with the reasonable specification of a program. What this means is that the
description of a section of code, and the code are relatively similar. Due to the small semantic
gap, the code examples are reduced and more concise than they are often with another
language. Using conventional languages, leads to higher portability and efficiency, however
this has to be offset with the expanded development and maintenance time required. In
conclusion, it is often advised to use a tool when we know the system and problem space are
small or when we are planning to throw the prototype away after it has been used for
requirements definition. A programming language should be used when enough is known
about the scale and extent of the expert system or when performance becomes a major issue.
The UIMA (Unstructured Information Management Architecture) provides an ideal
framework for the development of expert systems in bioinformatics. It offers a number of
advantages. First, although it is oriented towards text mining tasks, and is considered as a
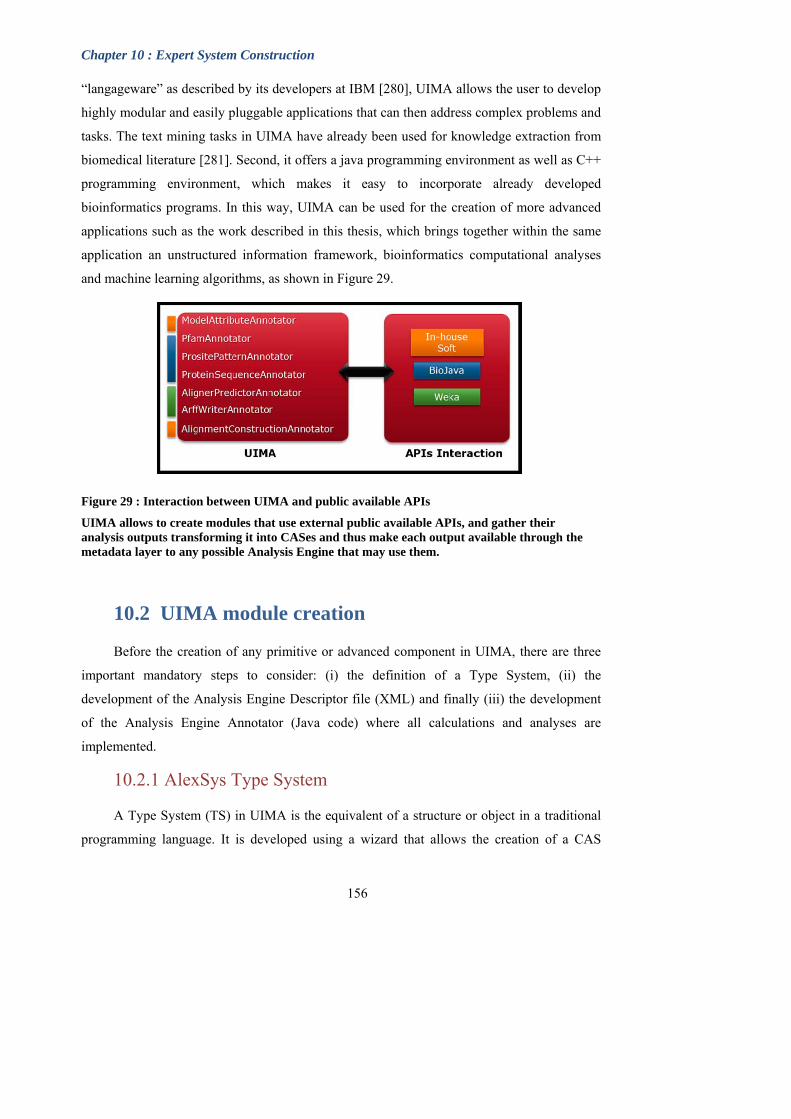
Chapter 10 : Expert System Construction
“langageware” as described by its developers at IBM [280], UIMA allows the user to develop
highly modular and easily pluggable applications that can then address complex problems and
tasks. The text mining tasks in UIMA have already been used for knowledge extraction from
biomedical literature [281]. Second, it offers a java programming environment as well as C++
programming environment, which makes it easy to incorporate already developed
bioinformatics programs. In this way, UIMA can be used for the creation of more advanced
applications such as the work described in this thesis, which brings together within the same
application an unstructured information framework, bioinformatics computational analyses
and machine learning algorithms, as shown in Figure 29.
Figure 29 : Interaction between UIMA and public available APIs
UIMA allows to create modules that use external public available APIs, and gather their analysis outputs transforming it into CASes and thus make each output available through the metadata layer to any possible Analysis Engine that may use them.
10.2 UIMA module creation
Before the creation of any primitive or advanced component in UIMA, there are three
important mandatory steps to consider: (i) the definition of a Type System, (ii) the
development of the Analysis Engine Descriptor file (XML) and finally (iii) the development
of the Analysis Engine Annotator (Java code) where all calculations and analyses are
implemented.
10.2.1 AlexSys Type System
A Type System (TS) in UIMA is the equivalent of a structure or object in a traditional
programming language. It is developed using a wizard that allows the creation of a CAS
156
Chapter 10 : Expert System Construction
structure for the TS, as well as the definition of the TS characteristics. An example is shown
in Figure 30.
Figure 30 : An example of a Type System (TS) in AlexSys
ProteinSequenceTS is an object composed of the protein sequence name as well as the sequence itself. UIMA allows the creation of more complex TS, depending on the complexity of the task studied. The TS is stored in XML format and will be used to generate the metadata that will drive the analysis process in AlexSys.
10.2.2 AlexSys Analysis Engine Descriptor
UIMA requires that descriptive information about an Analysis Engine be represented in
an XML file and provided along with the annotator class file(s) to the UIMA framework at
run time. This XML file is called an Analysis Engine Descriptor. The descriptor includes:
The name, description, version, and vendor (Developer) of the annotator
The annotator's inputs and outputs, defined in terms of the types in a Type System
Descriptor
Declaration of the configuration parameters that the annotator accepts
157

Chapter 10 : Expert System Construction
158
The Component Descriptor Editor plugin (Figure 31), which we previously used to edit
the Type System Descriptor, can also be used to edit Analysis Engine Descriptors. The
Component Descriptor Editor consists of several tabbed pages. The initial page of the
Component Descriptor Editor is the Overview page, the other pages are dedicated to the
specification of the TS used for the Analysis Engine (AE), the parameters that will be needed,
and the capabilities page which provides an interface for the specification of the Input and
Output TS for the developed AE.
Commentaire [MSOffice19] :s this the wizard?
Commentaire [MSOffice20] :hat’s this? You didn’t mention it above
Commentaire [MSOffice21] :? annotator
Figure 31 Analysis Engine Descriptor Editor.
The pages in the editor facilitate the specification of the Analysis Engine (AE) properties. Here, (a) the Protein Sequence AE will update the CAS and (b) the Type System will be used as the AE Output.
10.2.3 AlexSys Analysis Engine Annotator
The annotator is the part where we implement code. Depending on the task to be
treated, the modular organization of different Analysis Engines is a perfect representation of
Chapter 10 : Expert System Construction
159
the Object Oriented programming spirit. After designing a model, UML generally, that
describes the whole system picture, when using UIMA, the annotator (core of an Analysis
Engine) allow us to write the code that will take as input CASes generated by other Analysis
Engines so that to generate new CASes whithout carrying about who will use them after, and
this is the real concept behind a data-driven system.
10.3 Metadata layer
The metadata layer in AlexSys contains the “on-the-fly” data that will drive the multiple
alignment construction process. It consists of a set of UIMA Type Systems (TS). There are
currently six TS designed to represent the major data structures used:
• the Protein Sequence TS contains the basic sequence information
• the Model Attributes TS stores the attribute data associated with the alignment
models
• the Pfam TS and Prosite Pattern TS contain information about function
domains mapped on the sequences, obtained from the InterPro database (
Separated from Model Attributes TS to enhance the capability of UIMA to gatjer
unstructured information from different sources)
• the Arff Analyzed TS contains information about the sequence attributes in
Arff (Attribute-Relation File Format)
• the Aligner Predictor TS collects information concerning the aligners, such as
the predicted strengths and weaknesses for each aligner and the final choice of an
aligner
10.4 AlexSys computational core
10.4.1 Input data handling (IDH)
When a set of sequences is input to AlexSys, they are transferred to the metadata layer
(Protein Sequence TS), using the Protein Sequence AE. This AE uses the framework of the
Biojava sequence input/output API to provide access to sequences from a number of common
file formats such as FASTA, GenBank and EMBL. Thus, regardless of the input format used,
sequences can be simply transformed into UIMA TS, making them easily available to the
other AE.
Commentaire [MSOffice22] :ou mention this above, but don’t describe it.

Chapter 10 : Expert System Construction
160
10.4.2 Annotation and Information Extraction (AIE)
This Aggregate Analysis Engine (AAE) contains a number of AE that are used to obtain
pertinent information associated with the set of input sequences. When new data is stored in
the Protein Sequence TS, the Model Attributes AE calculates the sequence attributes required
for the selection of an appropriate aligner and stores the information in the Model Attributes
TS. The attributes are also read by the Arff Writer AE, which transforms them into a special
format called Arff (Attribute-Relation File Format) used by the Aligner Predictor AE to select
one or more appropriate aligners for the input sequences.
In addition to the attributes that can be calculated directly from the sequence data, two
AE have been defined that extract additional information from external databases. The Pfam
AE uses the WSInterProScan web service to retrieve the associated Pfam domains from the
InterPro database and maps them to the sequences. The additional information generated is
then stored in the Pfam TS. In a similar way, the Prosite Pattern AE maps patterns from the
Prosite database to the input sequences.
10.4.3 Multiple Alignment Construction (MAC)
The first task in the multiple alignment process is the selection of an appropriate aligner
to use. This is performed by the Aligner Predictor AE, which represents the AlexSys
inference engine. Based on the attributes associated with the input sequences, the inference
engine uses the alignment models in the knowledge base to predict the class (Strong or Weak)
of each aligner. Two alternative methods have been developed to make the final selection of
the most suitable aligner:
• The first method is based on the probability scores (provided by the Weka software.
For each of the five aligners, the probability associated with a Strong prediction is
obtained and the aligner with the highest probability is then selected.
• The second method builds a set of IF-THEN rules. Each of the five aligners
incorporated in AlexSys is classified as either Strong or Weak. In the case where
more than one aligner is classified as Strong, we select the one that requires the
least CPU time.
Once an aligner has been selected, a UIMA Flow Controller is used to call the
appropriate alignment AE. These AE encapsulate the actual alignment program, accessible via

Chapter 10 : Expert System Construction
161
JNI (Java Native Interface). AlexSys requires that these programs are already installed on the
user’s platform.
The final architecture is show in Figure 32

Chapter 10 : Expert System Construction
Figure 32 : Flat and Layered representation of AlexSys
AlexSys is data driven, thus representing the system as a workflow (A) may alter the concept of data-driven architecture. There are three interconnected layers, the knowledge base layer (B-up), the AlexSys core (B-middle) and the Metadata Layer (B-down)
162

Chapter 10 : Expert System Construction
163
10.5 AlexSys Installation and Usage
AlexSys binaries and source code are available through AlexSys website
(http://alnitak.u-strasbg.fr/~aniba/alexsys ).
To install and use AlexSys one should follow these instructions (the Ubuntu operating
system is used here as an example)
1 Download AlexSys
2 The installation is done by double clicking on Alignment_Expert_System-1.0-Linux-
x86-Install
3 Install some necessary external tools :
4 Run these command to install software from appropriate repositories
sudo apt-get install clustalw
sudo apt-get install mafft
sudo apt-get install kalign
sudo apt-get install probcons
sudo apt-get install muscle
sudo apt-get install curl
sudo apt-get install tcsh
5 Prepare the directory that will contain all protein sequences to align and the directory
for the generated multiple alignments (example /home/Input and /home/Output)
6 To run AlexSys, use this command with the appropriate options : Java –jar AlexSys-1-
1.jar INPUTFOLDER OUTPUTFOLDER OPTIONS OUTFILE
where OPTIONS represents two possible arguments:
“doalignment“ performs a multiple alignment
“noalignment” only predict aligner accuracies
OUTFILE is the file that will contain all the alignment construction
results, including the features extracted as well as the prediction scores.
Example: java –jar AlexSys-1-1.jar /home/Input /home/Output doalignment
/home/log.txt
Chapter 11 : AlexSys Evaluation
164
Chapter 11
11. AlexSys Evaluation
The efficiency and accuracy of the multiple alignment construction process in AlexSys
were first evaluated using a test set of 178 multiple alignments (see Materials and Methods).
The results of this study are described in detail in Publication No. 2, included in appendix.
Alignment accuracy was estimated by comparing the results obtained with AlexSys to the
reference alignments in both BAliBASE and OXBench benchmarks. Two alternative
approaches, using probability- and rule-based methods, for selecting the most suitable aligner
in the AlexSys inference engine were tested here. The probability-based inference engine
resulted in higher accuracy, with an average score of 0.891, compared to a score of 0.888
obtained by the rule-based system.
The difference in alignment accuracy can be explained by the background knowledge
built into the rules, which favors a shorter running time when more than one aligner is
predicted to give a strong performance. In contrast, the probability-based implementation
systematically selects the aligner with the highest probability of a strong performance. The
performance of these alternative methods was also compared to the five existing aligners run
independently. To assess the performance of the aligners used in this study, we used the sum-
of-pairs score (SP) to compare the alignments produced by the aligner with the reference
alignments. The SP score corresponds to the proportion of pairs of residues aligned the same
in both alignments.
The results presented above were obtained using, as mentioned above, training and test
alignments from the BAliBASE (version 3.0) and OXBench benchmarks. There are two
major concerns here that need to be discussed. When we develop a system based on a
machine learning approach we should i) supply as many training instances as possible as input
to the machine learning algorithm, in order to obtain accurate results and ii) make sure that the
input offers a wide range of complex cases covering most classification possibilities. In this
Commentaire [MSOffice23] : also added a similar comment at the end of section 10.1.
Chapter 11 : AlexSys Evaluation
165
way, the training phase is more likely to result in classifications and predictions that are closer
to reality and thus, better mimic the human expert decisions.
11.1 Constructing new training and test sets
In our original study, we noticed that the different alignment programs integrated in
AlexSys obtained similar SP scores for many of the benchmark alignments, particularly those
from the OXBench benchmark. This lead us to think about the accuracy of the decision trees
learned. Even if the results shown before clearly demonstrates that we avoid the problem of
learning overfitting, we are unable at this point to say whether AlexSys will perform better for
more complicated protein alignment cases or not. To address this problem, we decided to
enrich the BAliBASE benchmark with larger and more complex reference alignments, in
order to observe how AlexSys behaves. The new ‘gold standard’ alignments were designed to
represent some of the new problems resulting from the widespread application of genome
sequencing and next generation sequencing technologies. Some of the issues involved in
building the benchmark are discussed in Publication No. 3 included in the appendix.
We thus constructed a new BAliBASE reference set (manuscript in preparation)
composed of 230 reference alignments, containing a total of 17813 protein sequences. For
each family, the reference alignment was constructed using a semi-automatic protocol similar
to the one developed for the construction of the BAliBASE (version) alignments. Briefly,
potential sequence homologs were detected by PSI-BLAST searches in the Uniprot and PDB
databases using a given query sequence. Sequences with known 3D structure were aligned
using the SAP 3D superposition program. Sequences with no known 3D structure were
initially aligned by (i) identifying the most conserved segments in the PSI-BLAST HSP
alignments with the Ballast [282] program and (ii) using these conserved segments as anchors
for the progressive multiple alignment strategy implemented in DbClustal [233]. Unrelated
sequences were removed from the multiple alignment using the LEON [283] program and the
quality of the alignment was evaluated using the NorMD [249] objective function. Finally,
structural and functional annotations (including known domains from the Interpro database:
www.ebi.ac.uk/interpro/) were added using the multiple alignment information management
system (MACSIMS) [275]. The automatic alignment was then manually verified and refined
to correct any badly aligned sequences or locally misaligned regions.
Commentaire [MSOffice24] :here? In the publication? Or in chapter 9?

Chapter 11 : AlexSys Evaluation
For each benchmark alignment, we identified the conserved regions, or ‘blocks’, using
an automatic method. This led to the definition of 7985 blocks, covering on average 46% of
the total multiple alignment (general statistics are shown in Figure 33).
Figure 33 : General statistics computed for the benchmark alignments.
In the box-and-whisker plots, boxes indicate lower and upper quartiles, and whiskers represent minimum and maximum values
The benchmark alignments reflect some of the problems specific to aligning large sets
of complex sequences. For example, many of the protein families (>64% of the alignments)
have multi-domain architectures and their members often share only a single domain. In
addition, the alignments have a high proportion of partial sequences, corresponding either to
naturally occurring variants, or to artifacts, including PDB sequences (typically covering a
single structural domain) and proteins translated from partially sequenced genomes or ESTs.
The alignment of the highly studied P53/P63/P73 family (Figure 34A) illustrates this notion
with 45% of the aligned sequences (61 out of 134) being partial. Further difficulties arise due
to the presence of potential gene prediction errors, resulting in erroneous protein sequences
with spurious, artificial insertions or deletions. Another important feature of today’s multiple
alignment task is linked to the distribution of the conserved blocks. In Figure 34A, only 18%
of the blocks are present in most (>90%) of the aligned sequences, while 30% are found in
166

Chapter 11 : AlexSys Evaluation
less than 10%. These ‘rare’ segments or patterns are often characteristic of functional sub-
families.
Figure 34 : (A) Reference alignment of representative sequences of the p53/p63/p73 family, with the domain organization shown above the alignment (AD: activation domain, Oligo: oligomerization, SAM: sterile alpha motif). Colored blocks indicate conserved regions. The grey regions correspond to sequence segments that could not be reliably aligned and white regions indicate gaps in the alignment. (B) Different MSA programs produce different alignments, especially in the N-terminal region (boxed in red in A) containing rare motifs and a disordered proline-rich domain.
For each of the 230 reference alignments in the benchmark, we tested the six alignment
programs incorporated in AlexSys, resulting in a total of 1380 automatically constructed
MSAs. Analysis of the overall alignment quality confirmed previous results, in terms of
167

Chapter 11 : AlexSys Evaluation
program ranking (Figure 35). Probcons achieves the highest scores on average (78.6%),
although a large time penalty was incurred. Mafft obtained the next highest average scores
(77.7%), with a significant reduction in the time required to produce the alignments.. As
expected, the methods incorporating both local and global information were generally more
accurate than global (ClustalW: 63.1%) or local (Dialign: 72.9%) algorithms alone. These
results showed that our new benchmark alignment tests were capable of distinguishing
between the existing alignment methods, in terms of alignment accuracy and the CPU time
required to perform the texts. Nevertheless, alignment accuracy was observed to be highly
variable even for the best programs (with a standard deviation of 18.9 and 19.8 for Mafft and
Probcons respectively). We hypothesize that this is due to the greater complexity of the large
alignments, resulting from an increased number of multi-domain proteins, as well as the
presence of many partial and erroneous sequences.
Figure 35 : Overall alignment performance for each of the MSA programs tested.
(A) Overall alignment quality measured using CS. (B) Total run time for constructing all alignments (a log10 scale is used for display purposes).
168
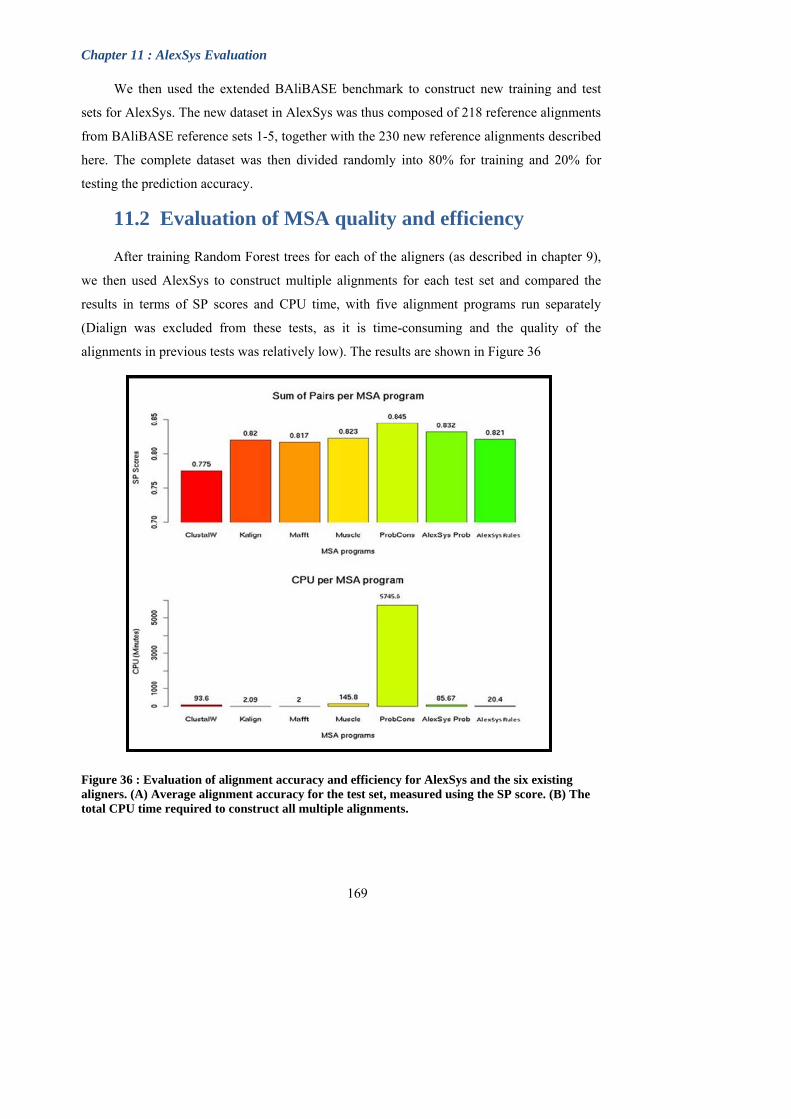
Chapter 11 : AlexSys Evaluation
We then used the extended BAliBASE benchmark to construct new training and test
sets for AlexSys. The new dataset in AlexSys was thus composed of 218 reference alignments
from BAliBASE reference sets 1-5, together with the 230 new reference alignments described
here. The complete dataset was then divided randomly into 80% for training and 20% for
testing the prediction accuracy.
11.2 Evaluation of MSA quality and efficiency
After training Random Forest trees for each of the aligners (as described in chapter 9),
we then used AlexSys to construct multiple alignments for each test set and compared the
results in terms of SP scores and CPU time, with five alignment programs run separately
(Dialign was excluded from these tests, as it is time-consuming and the quality of the
alignments in previous tests was relatively low). The results are shown in Figure 36
Figure 36 : Evaluation of alignment accuracy and efficiency for AlexSys and the six existing aligners. (A) Average alignment accuracy for the test set, measured using the SP score. (B) The total CPU time required to construct all multiple alignments.
169
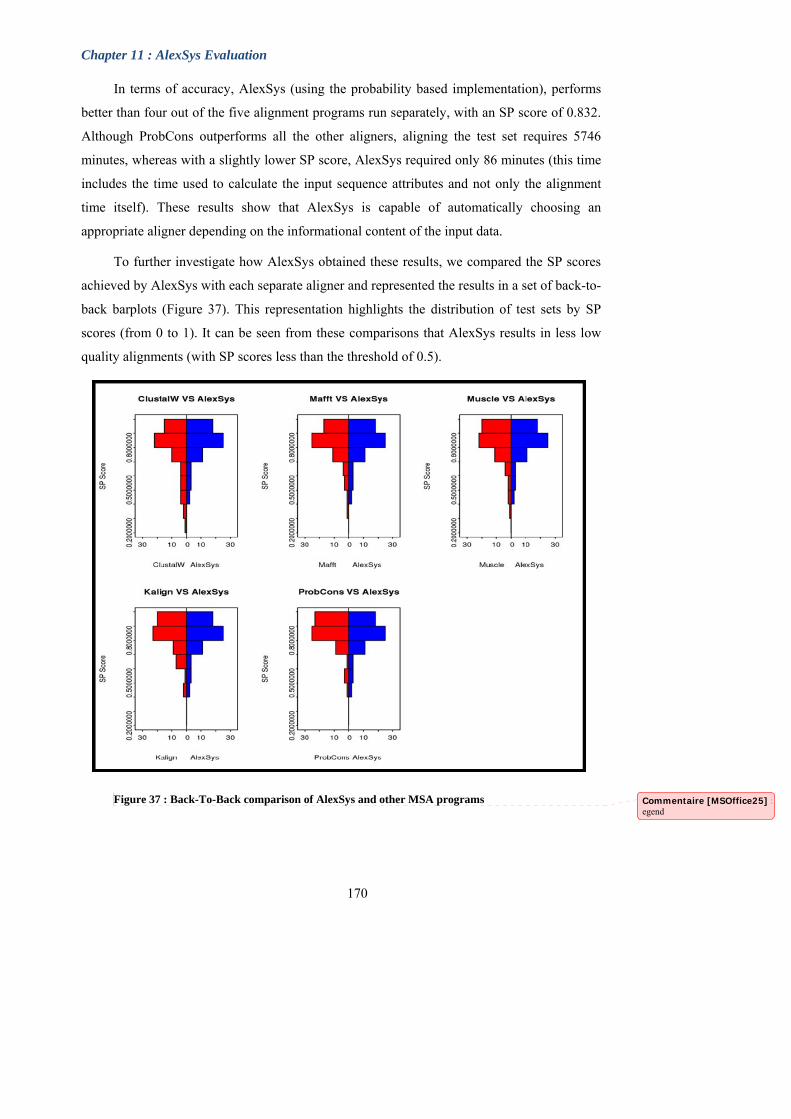
Chapter 11 : AlexSys Evaluation
In terms of accuracy, AlexSys (using the probability based implementation), performs
better than four out of the five alignment programs run separately, with an SP score of 0.832.
Although ProbCons outperforms all the other aligners, aligning the test set requires 5746
minutes, whereas with a slightly lower SP score, AlexSys required only 86 minutes (this time
includes the time used to calculate the input sequence attributes and not only the alignment
time itself). These results show that AlexSys is capable of automatically choosing an
appropriate aligner depending on the informational content of the input data.
To further investigate how AlexSys obtained these results, we compared the SP scores
achieved by AlexSys with each separate aligner and represented the results in a set of back-to-
back barplots (Figure 37). This representation highlights the distribution of test sets by SP
scores (from 0 to 1). It can be seen from these comparisons that AlexSys results in less low
quality alignments (with SP scores less than the threshold of 0.5).
Figure 37 : Back-To-Back comparison of AlexSys and other MSA programs
170
Commentaire [MSOffice25] :egend

Chapter 11 : AlexSys Evaluation
171
These results, together with the results shown in Figure 36, confirm that AlexSys is
capable of producing reliable alignments in a time-scale suitable for projects requiring high
throughput processing.
The results obtained here confirm the effectiveness of cooperative alignment approaches
that can exploit different methods to obtain more accurate, reliable multiple alignments.
Integration of these different algorithmic approaches with new data types, other than the
sequence itself, in knowledge-enabled, dynamic systems will facilitate and improve the
complete MSA construction and analysis process; from the selection of a suitable set of
sequences, via data cleaning and preprocessing, data mining and the evaluation of results, to
the final knowledge presentation and visualization. Such systems could then be used to fully
exploit the potential of MSAs as models of the underlying evolutionary processes that have
created and fashioned extant protein sequences and fine-tuned their structure, function and
regulation.

172
Conclusions and Perspectives
Conclusions and perspectives
173
In this work, we have studied a new paradigm to address the problems of data
integration and analysis, from their initial collection and transformation to valuable
information to the final generation of new knowledge. With the current data torrent resulting
from the high throughput genomics technologies, scientists in the field of bioinformatics are
facing, not only an increasing volume of data, but the nature and quality of the data are also
changing. This introduces additional difficulties for the exploitation of this knowledge in
terms of new discoveries and the validation of what we learned in the past.
In the era of systems biology, the combination of the heterogeneous data from many
different resources, coupled with comparative and predictive analyses, has become a crucial
element for the analysis and comprehension of complex biological networks. In this context,
gene sequences can no longer be considered in isolation, but must be integrated with other
genomics data to provide more detailed descriptions of their functions, not only at the
molecular level, but also at the higher levels of their macromolecular complexes and cellular
processes.
In the face of these challenges, we need novel approaches that introduce additional
capabilities in the diverse traditional algorithms we already possess, to bring a kind of
“artificial life” to these applications. Fortunately, new technologies in the machine learning
and artificial intelligence fields have been developed recently to allow this. Many of these
techniques have been inspired by biology (e.g. neural networks, genetic algorithms) and vice
versa (e.g. data mining, cluster analysis, pattern recognition, knowledge representation). This
crossing over is giving rise to new cutting edge technologies that are used today as standards
in the process of knowledge discovery in a wide variety of fields. Bioinformaticians are now
taking into consideration these novel aspects, by creating tools that mimic human intelligence
in order to deal with the data torrents both accurately and efficiently.
Here, we have studied the applicability of a knowledge based expert system approach,
that emphasizes the modeling and integration of human expertise in computational systems
that can thus act as additional “problem solvers”, together with scientists. The goal is not the
development of “yet another program”, but the creation of a system that can take into account
the strengths and weaknesses of different, complementary bioinformatics applications. Such
an expert system would not follow a predefined analysis pipeline, but would include the

Conclusions and perspectives
174
nature of the data (more precisely meta-data) in the choice of a specific analysis process. This
data driven architecture has the advantage of allowing the deployment of different analysis
scenarios, depending on the input data and the analysis problem.
In this thesis, after describing in detail the fundamentals of knowledge based expert
systems, we introduced AlexSys, a novel application of knowledge discovery through
knowledge based expert systems applied to bioinformatics. My previous experience as a
bioinformatician and my interest in knowledge discovery in the biology field led me to
discover a new generation of bioinformatics software with an incredible range of potential
applications. In particular, I was interested in the application of such technologies to the
multiple sequence alignment problem, because of its important central role in most
bioinformatics applications today, and the challenges that this field faces, from a developer
point of view more than a user’s.
What was more exciting during this thesis, and what I will try to describe in this section,
is the fascinating idea of extrapolation and scaling in science. I was engaged in discussions
that by far exceed the specific problems and solutions discussed here. When we applied
knowledge based expert systems to the multiple sequence alignment problem, we also treated
lots of fundamental questions in bioinformatics and we “blackboarded” the limits and the
strengths of such methodologies. In this section I will try to resume what we learnt during this
thesis, in order to provide some directions for future developments and perspectives.
Framework choice for the development of the
Knowledge Based System
In order to build the AlexSys expert system, we used the UIMA (Unstructured
Information Management Architecture). UIMA represents an ideal framework for the
integration of both structured and unstructured data. It also provides unique facilities for the
creation of highly modular computational systems capable of performing complex analysis
applications. In the future, this will allow us to combine information from complementary
alignment methods, for example to produce a single consensus alignment. The system will
also allow the integration of structural and functional data, such as gene expression, cellular
localization, interactions, etc., to guide the construction of the multiple alignment and to
facilitate the interpretation of the results for the biologist.
Conclusions and perspectives
175
The use of UIMA as a framework for the development of our knowledge based system
opens the way for the integration of new methods dedicated to the analysis of biological
literature and the extraction of the knowledge in a format that can be exploited by the
computer. A growing number of groups, such as BioNLP (bionlp.sourceforge.net) and
BioCreative (www.biocreative.org), are developing and using text mining applications on
biological literature, in order to complement existing studies or to establish entirely new
analysis based on knowledge discovery in texts.
Taking into account the alignment context: knowledge
enhancement
Although the knowledge currently selected and implemented in AlexSys provides
accurate results in many cases, we have to keep in mind the alignment context and the final
purpose of the user. For example, constructing a multiple sequence alignment for annotation
purposes is different from constructing one for 3D structure homology modeling. In some
cases we can accept an alignment that is “approximate” with many badly placed gaps for
example. In other cases this type of alignment might not be helpful, nor meaningful. A
question then arises concerning the objective functions used in the MSA context. Are they as
objective as they seem to be? With the rapid growth of the known protein universe, and thus
the expected low coverage of multiple alignment benchmarks, we can question the accuracy
of existing multiple sequence alignment algorithms and approaches, not in a critical way, but
in order to anticipate solutions and reduce the complexity of aligning protein sequences. Such
MSA algorithm studies provide lots of information about the factors that affect alignment
quality. Some of this prior knowledge has already been quantified and incorporated in the
AlexSys inference engine. Some examples of other information that could be incorporated in
the future are given below.
The accuracy of multiple sequence alignment programs is closely linked to sequence
conservation. It has been widely established that alignment accuracy dramatically decreases
for sequences sharing less than 30% identity [263]. Other factors affecting the accuracy have
been less well studied. Here, we have described a number of sequence attributes that have an
effect on the quality of one or more of the alignment programs tested, including the number of
sequences, their lengths and their structural and amino acid compositions.

Conclusions and perspectives
176
The multiple alignment of multi-domain proteins is a particularly difficult task.
Evolutionary events that alter the domain organization of the input protein sequences
represent significant problems for alignment algorithms. In particular, global approaches
cannot cope with permuted domain orders and normally use strict gap penalties that make it
difficult to insert long gaps equivalent to the length of more than one protein domain. Local
multiple alignment methods, such as the Dialign approach, can be useful in such cases.
MSA accuracy could also be seriously affected by the presence of repeats in protein
sequences. Sammeth and Heringa, developed an MSA technique that keeps track of various
types of repeat regions, using specific algorithms for the detection of these repeats. The
alignment accuracy can be significantly improved by this method, although it is strongly
correlated to the repeat information provided [284].
Another problematic class of proteins is the membrane-associated proteins. The specific
regions in these proteins which are inserted in the cell membrane present a significantly
different hydrophobicity pattern compared to soluble proteins. Since the scoring matrices
(e.g., PAM or BLOSUM) generally employed in MSA approaches are produced from
alignments of sequences of soluble proteins, the general alignment methods are in theory
unsuitable for the alignment of membrane bound protein regions. Fortunately, transmembrane
(TM) regions can be reliably identified using prediction strategies such as TMHMM [285] or
Phobius [286]. These methods could be incorporated in an alignment expert system, to locate
the putative TM regions in the sequences and to align them separately from the remainder of
the sequence.
Alignment algorithm integration
The current version of AlexSys includes some of the most widely used multiple
alignment programs representing different, complementary alignment strategies. However,
this is clearly not an exhaustive list of the hundreds of alignment programs currently
available. The modular design of AlexSys allows developers to create additional plugins for
the integration of additional alignment algorithms. The inclusion of new algorithms however
requires the revision of the included prediction models in order to take into account the newly
added algorithm. As described in the Results section, adding an aligner is quite easy using
UIMA, all we have to do is to create the appropriate Analysis Engine and to slightly modify
the inference engine. Including additional aligners is expected to improve the accuracy of the
Conclusions and perspectives
177
alignment in respect to the input attributes. Furthermore, the MSA field is constantly
evolving, with new methods being developed in response to new alignment applications and
changing user requirements.
Multiple Alignment Program parameters
Prior to this thesis work, I was involved in a study aimed at the optimization of the
ClustalW progressive algorithm. However, as far as we know, there has been no
comprehensive study of other multiple sequence alignment programs to try to establish a
relationship between the nature of the sequences to be aligned and the optimal program
parameters. A trial was made during the development of AlexSys (not yet fully implemented),
and it was shown that optimizing a program’s parameters based on a benchmark covering a
wide range of protein families, could improve the accuracy of the final alignment compared to
the parameter values used by default.
One important parameter is the substitution matrix used to define the scores for
matching and mismatching residues in the alignment. The PAM [239] and Blosum [287]
matrices are amongst the most widely used for protein alignments. A general rule states that
high PAM values or low Blosum values are advised for sequences with increasingly divergent
sequences, whereas the opposite case is recommended for more related sequences. Similarly,
the penalties associated with introducing gaps are an important component of algorithms for
protein sequence alignment: the larger the gap penalties, the smaller the number of gaps that
can be inserted in the alignment. Sequences that have evolved over long periods of time tend
to have more insertions and deletions and as a consequence, it can be beneficial to reduce the
gap penalty values for more divergent sequence sets. Nevertheless, attention should be paid
not to deviate too far from the advised configuration. Too large gap penalty values may
impose a gap-less alignment, while too low gap penalties may result in alignments with too
many gaps. In both cases, the final alignment will probably be biologically inaccurate.
An expert system should be able to detect automatically which program parameters to
use depending on the input sequences. Including this information as prior knowledge in an
expert system, e.g. in the form of Inductive Logic rules, decision trees, etc., is expected to
improve the final alignment results. At the current stage of AlexSys development, this kind of
parameter optimization could be achieved in two ways. First, we could consider the aligner
parameters (at least the common ones) as new classes in the existing model, in order to predict
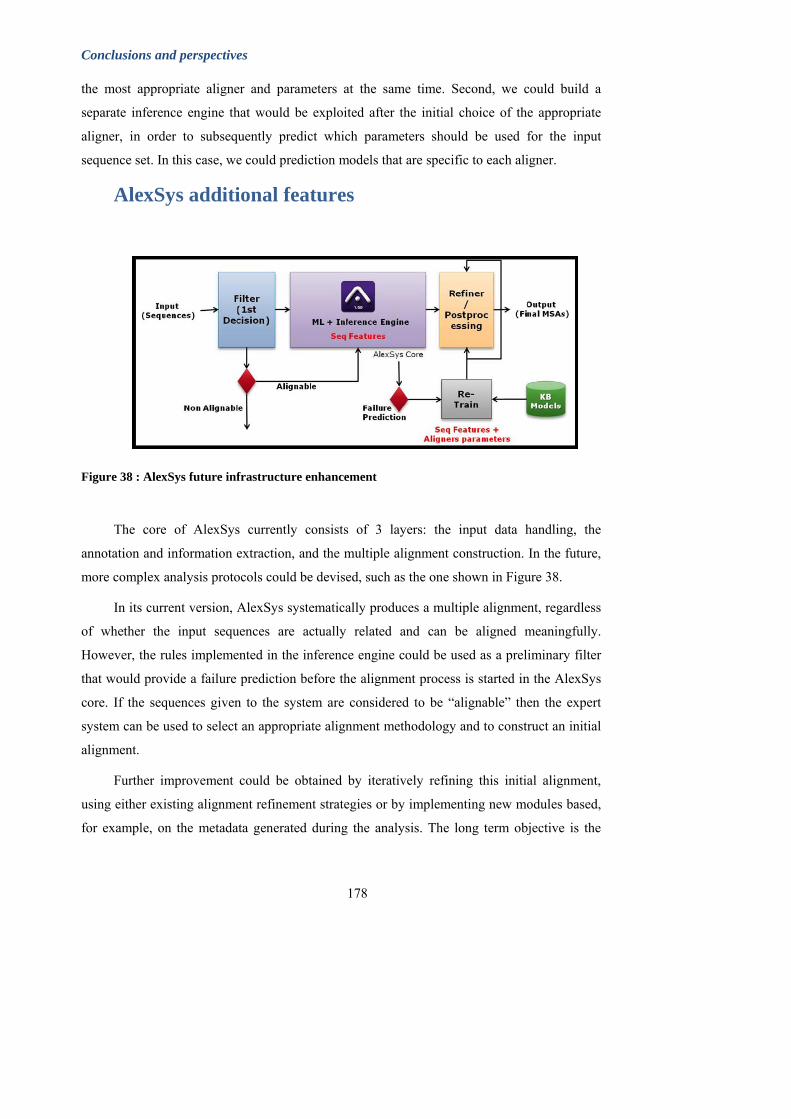
Conclusions and perspectives
the most appropriate aligner and parameters at the same time. Second, we could build a
separate inference engine that would be exploited after the initial choice of the appropriate
aligner, in order to subsequently predict which parameters should be used for the input
sequence set. In this case, we could prediction models that are specific to each aligner.
AlexSys additional features
Figure 38 : AlexSys future infrastructure enhancement
The core of AlexSys currently consists of 3 layers: the input data handling, the
annotation and information extraction, and the multiple alignment construction. In the future,
more complex analysis protocols could be devised, such as the one shown in Figure 38.
In its current version, AlexSys systematically produces a multiple alignment, regardless
of whether the input sequences are actually related and can be aligned meaningfully.
However, the rules implemented in the inference engine could be used as a preliminary filter
that would provide a failure prediction before the alignment process is started in the AlexSys
core. If the sequences given to the system are considered to be “alignable” then the expert
system can be used to select an appropriate alignment methodology and to construct an initial
alignment.
Further improvement could be obtained by iteratively refining this initial alignment,
using either existing alignment refinement strategies or by implementing new modules based,
for example, on the metadata generated during the analysis. The long term objective is the
178
Conclusions and perspectives
179
development of more robust versions of AlexSys. This could be achieved by enriching the
knowledge base with new data that could be exploited by complementary algorithms in
AlexSys. Nevertheless, manual curation of the raw data by experts will be crucial in order to
eliminate erroneous or noisy data.
AlexSys in the Clouds
During the development of AlexSys, when our ideas were confronted with the reality of
biological datasets, we sometimes felt frustrated that we could not reach our ideals. However,
this is often the case when dealing with high throughput data. We need a lot of CPU and
memory resources to run our programs in an acceptable time frame. Fortunately a number of
alternatives exist to overcome these problems. During the initial development of AlexSys, we
applied the system, as described in the Results section, on benchmark sequences from
BaliBase or Oxbench, for training and for testing. The sequence sets from these benchmarks
are relatively small and can be handled in a reasonable time. A validation phase using larger
sequence sets (the next version of BAliBASE and other sequences from genome-scale
projects in the laboratory) highlighted some limitations of AlexSys. The time required to
extract features and attributes, as well as the alignment itself was acceptable. The only
problem that we faced during this validation phase was the calculation of the mean pairwise
identity attribute, since this still relies on dynamic programming and the computation time
increases exponentially with the number of sequences to be aligned. That said, the tools used
for AlexSys development provide a key answer to the problem. The use of UIMA makes it
easy to parallelize any analysis process, and thanks to the modular design we can assign each
analysis engine to a dedicated node in a parallel computer system, Grid system or Cloud
Computing system.
The LBGI is currently implicated in the development of original data management and
analysis systems for the Décrypthon Grid infrastructure: a joint project of the French
Muscular Dystophy Association (AFM), the CNRS and IBM. We therefore plan to implement
AlexSys on this Grid system in the near future.
One of the most widely used Cloud Computing systems in biology is the Amazon EC2
cloud. Many common biological databases are already uploaded onto Amazon, making it
simpler and less expensive to use this service. For example, the entire BioLinux suite of tools
is available as an image, which means that users can get up and running quickly. Recently,
Commentaire [MSOffice26] :his is what should be in the results section?

Conclusions and perspectives
180
some methods for sequence alignment have also been made available for “aligning in the
clouds” (Cloud-Coffee [288], XMPP [289])
Through the appropriate selection of acceleration technology the demanding job of
keeping up with the analysis of data from high throughput projects can be accomplished at a
reasonable cost and without requiring enormous in-house resources. Hopefully, the
development of new faster, more accurate sequence alignment and analysis tools will also
have significant consequences for more wide-reaching areas, such as protein engineering,
metabolic modelling, genetic studies of human disease susceptibility, and the development of
new drug discovery strategies.

181
References
1. Wriston WB. 'Comments on The Twilight of Sovereignty: How the Information
Revolution Is Transforming Our World.', 1992; Marketplace, American Public Media.
2. Shannon C. A mathematical theory of communication, Bell System Technical Journal
1948.
3. Szajna B. Determining information system usage: some issues and examples,
Information and Management 1993;25
4. Floridi L. Information: A Very Short Introduction Oxford University press 2010.
5. Hagen JB. The origins of bioinformatics, Nature Reviews Genetics 2000;1:231-236.
6. Hofacker IL. RNAs everywhere: genome-wide annotation of structured RNAs,
Genome Inform 2006;17:281-282.
7. Meyer IM. A practical guide to the art of RNA gene prediction, Brief Bioinform
2007;8:396-414.
8. Mathe C, Sagot, M. F., Schiex, T. and Rouze, P. Current methods of gene prediction,
their strengths and weaknesses, Nucleic Acids Res 2002;30:4103-4117.
9. Azad RK, Borodovsky, M. Probabilistic methods of identifying genes in prokaryotic
genomes: connections to the HMM theory, Brief Bioinform 2004;5:118-130.
10. Burge C, Karlin, S. Prediction of complete gene structures in human genomic DNA, J
Mol Biol 1997;268:78-94.
11. Zhang C, Chen, K., Seldin, M.F. and Li, H. A hidden Markov modeling approach for
admixture mapping based on case-control data., Genet Epidemiol. 2004;27:225-239.
12. Turner FS, Clutterbuck, D.R. and Semple, C.A. POCUS: mining genomic sequence
annotation to predict disease genes, Genome Biol 2003;4:R75.
182
13. Zhang L, Pavlovic, V., Cantor, C.R. and Kasif, S. Human-mouse gene identification
by comparative evidence integration and evolutionary analysis, Genome Res 2003;13:1190-
1202.
14. Foissac S, Schiex, T. Integrating alternative splicing detection into gene prediction,
BMC Bioinformatics 2005;6:25.
15. Gemund C, Ramu, C., Altenberg-Greulich, B. and Gibson, T.J. Gene2EST: a BLAST2
server for searching expressed sequence tag (EST) databases with eukaryotic gene-sized
queries, Nucleic Acids Res 2001;29:1272-1277.
16. Baxevanis AD, Ouellette, B.F.F. Bioinformatics: A Practical Guide to the Analysis of
Genes and Proteins, John Wiley & Sons, NY. (1X, red) 2005.
17. Hunter S, Apweiler, R., Attwood, T.K., Bairoch, A., Bateman, A., Binns, D., Bork, P.,
Das, U., Daugherty, L., Duquenne, L., Finn, R.D., Gough, J., Haft, D., Hulo, N., Kahn, D.,
Kelly, E., Laugraud, A., Letunic, I., Lonsdale, D., Lopez, R., Madera, M., Maslen, J.,
McAnulla, C., McDowall, J., Mistry, J., Mitchell, A., Mulder, N., Natale, D., Orengo, C.,
Quinn, A.F., Selengut, J.D., Sigrist, C.J., Thimma, M., Thomas, P.D., Valentin, F., Wilson,
D., Wu, C.H. and Yeats, C. InterPro: the integrative protein signature database, Nucleic Acids
Res. 2009 37:D211-215.
18. Marchler-Bauer A, Anderson, J.B., Chitsaz, F., Derbyshire, M.K., DeWeese-Scott, C.,
Fong, J.H., Geer, L.Y.; Geer, R.C., Gonzales, N.R., Gwadz, M., He, S., Hurwitz, D.I..,
Jackson, J.D., Ke, Z., Lanczycki, C.J., Liebert, C.A., Liu, C., Lu, F., Lu, S., Marchler, G.H.,
Mullokandov, M., Song, J.S., Tasneem, A., Thanki, N., Yamashita, R.A., Zhang, D., Zhang,
N. and Bryant, S.H. CDD: specific functional annotation with the Conserved Domain
Database, Nucleic Acids Res 2009;37:D205-210.
19. Tatusov RL, Natale, D.A., Garkavtsev, I.V., Tatusova, T.A., Shankavaram, U.T., Rao,
B.S., Kiryutin, B., Galperin, M.Y., Fedorova, N.D. and Koonin, E.V. The COG database: new
developments in phylogenetic classification of proteins from complete genomes, Nucleic
Acids Res 2001;29:22-28.
20. Lee D, Redfern, O. and Orengo, C. Predicting protein function from sequence and
structure, Nature Reviews Molecular Cell Biology 2007;8:995-1005
183
21. Altschul SF, Madden TL, Schaffer AA et al. Gapped BLAST and PSI-BLAST: a new
generation of protein database search programs, Nucleic Acids Res 1997;25:3389-3402.
22. Rost B, Liu, J., Nair, R., Wrzeszczynski, K.O. and Ofran, Y. Automatic prediction of
protein function, Cell Mol Life Sci 2003;60:2637-2650.
23. Rost B. Enzyme function less conserved than anticipated, J Mol Biol 2002;318:595-
608.
24. Bork P. Powers and pitfalls in sequence analysis: the 70% hurdle, Genome Res
2000;10:398-400.
25. Gilks WR, Audit, B., De Angelis, D., Tsoka, S. and Ouzounis, C.A. Modeling the
percolation of annotation errors in a database of protein sequences, Bioinformatics
2002;18:1641-1649.
26. Thompson JD, Poch, O. Multiple sequence alignment as a workbench for molecular
systems biology., Current Bioinformatics. 2006;1:95-104.
27. Friedberg I. Automated protein function prediction--the genomic challenge, Brief
Bioinform 2006;7:225-242.
28. Hulo N, Bairoch, A., Bulliard, V., Cerutti, L., Cuche, B.A., de Castro, E., Lachaize,
C., Langendijk-Genevaux, P.S. and Sigrist, C.J. The 20 years of PROSITE, Nucleic Acids
Res 2008;36:D245-249.
29. Henikoff JG, Greene, E.A., Pietrokovski, S. and Henikoff, S. Increased coverage of
protein families with the blocks database servers, Nucleic Acids Res 2000;28:228-230.
30. Attwood TK, Blythe, M. J., Flower, D. R., Gaulton, A., Mabey, J. E., Maudling, N.,
McGregor, L., Mitchell, A. L., Moulton, G., Paine, K. and Scordis, P. PRINTS and PRINTS-
S shed light on protein ancestry, Nucleic Acids Res 2002;30:239-241.
31. Berman HM, Westbrook, J., Feng, Z., Gilliland, G., Bhat, T. N., Weissig, H.,
Shindyalov, I. N. and Bourne, P. E. The Protein Data Bank, Nucleic Acids Res 2000;28:235-
242.
32. Orengo CA, Michie, A.D., Jones, S., Jones, D.T., Swindells, M.B. and Thornton, J.M.
CATH--a hierarchic classification of protein domain structures, Structure 1997;5:1093-1108.

184
33. Andreeva A, Howorth, D., Chandonia, J. M., Brenner, S. E., Hubbard, T. J., Chothia,
C. and Murzin, A. G. Data growth and its impact on the SCOP database: new developments,
Nucleic Acids Res 2008;36:D419-425.
34. Bonneau R, Baker, D. Ab initio protein structure prediction: progress and prospects,
Annu Rev Biophys Biomol Struct 2001;30:173-189.
35. Li H, Coghlan, A., Ruan, J., Coin, L. J., Heriche, J. K., Osmotherly, L., Li, R., Liu, T.,
Zhang, Z., Bolund, L., Wong, G. K., Zheng, W., Dehal, P., Wang, J. and Durbin, R. TreeFam:
a curated database of phylogenetic trees of animal gene families, Nucleic Acids Res
2006;34:D572-580.
36. Ruan J, Li, H., Chen, Z., Coghlan, A., Coin, L. J., Guo, Y., Heriche, J. K., Hu, Y.,
Kristiansen, K., Li, R., Liu, T., Moses, A., Qin, J., Vang, S., Vilella, A. J., Ureta-Vidal, A.,
Bolund, L., Wang, J. and Durbin, R. TreeFam: 2008 Update, Nucleic Acids Res
2008;36:D735-740.
37. Huerta-Cepas J, Bueno, A., Dopazo, J. and Gabaldon, T. PhylomeDB: a database for
genome-wide collections of gene phylogenies, Nucleic Acids Res 2008;36:D491-496.
38. Page RD. TBMap: a taxonomic perspective on the phylogenetic database TreeBASE,
BMC Bioinformatics 2007;8:158.
39. Lander ES, Linton, L.M., Birren, B., Nusbaum, C., Zody, M.C., Baldwin, J., Devon,
K., Dewar, K., Doyle, M., FitzHugh, W., Funke, R., Gage, D., Harris, K., Heaford, A.,
Howland, J., Kann, L., Lehoczky, J., LeVine, R., McEwan, P., McKernan, K., Meldrim, J.,
Mesirov, J.P., Miranda, C., Morris, W., Naylor, J., Raymond, C., Rosetti, M., Santos, R.,
Sheridan, A., Sougnez, C., Stange-Thomann, N., Stojanovic, N., Subramanian, A., Wyman,
D., Rogers, J., Sulston, J., Ainscough, R., Beck, S., Bentley, D., Burton, J., Clee, C., Carter,
N., Coulson, A., Deadman, R., Deloukas, P., Dunham, A., Dunham, I., Durbin, R., French, L.,
Grafham, D., Gregory, S., Hubbard, T., Humphray, S., Hunt, A., Jones, M., Lloyd, C.,
McMurray, A., Matthews, L., Mercer, S., Milne, S., Mullikin, J. C., Mungall, A., Plumb, R.,
Ross, M., Shownkeen, R., Sims, S., Waterston, R.H., Wilson, R.K., Hillier, L.W., McPherson,
J.D., Marra, M.A., Mardis, E.R., Fulton, L.A., Chinwalla, A.T., Pepin, K.H., Gish, W.R.,
Chissoe, S.L., Wendl, M.C., Delehaunty, K.D., Miner, T.L., Delehaunty, A., Kramer, J.B.,
Cook, L.L., Fulton, R.S., Johnson, D.L., Minx, P.J., Clifton, S.W., Hawkins, T., Branscomb,
E., Predki, P., Richardson, P., Wenning, S., Slezak, T., Doggett, N., Cheng, J.F., Olsen, A.,

185
Lucas, S., Elkin, C., Uberbacher, E., Frazier, M., Gibbs, R.A., Muzny, D.M., Scherer, S.E.,
Bouck, J.B., Sodergren, E.J., Worley, K.C., Rives, C.M., Gorrell, J.H., Metzker, M.L.,
Naylor, S.L., Kucherlapati, R.S., Nelson, D. L., Weinstock, G.M., Sakaki, Y., Fujiyama, A.,
Hattori, M., Yada, T., Toyoda, A., Itoh, T., Kawagoe, C., Watanabe, H., Totoki, Y., Taylor,
T., Weissenbach, J., Heilig, R., Saurin, W., Artiguenave, F., Brottier, P., Bruls, T., Pelletier,
E., Robert, C., Wincker, P., Smith, D.R., Doucette-Stamm, L., Rubenfield, M., Weinstock, K.,
Lee, H.M., Dubois, J., Rosenthal, A., Platzer, M., Nyakatura, G., Taudien, S., Rump, A.,
Yang, H., Yu, J., Wang, J., Huang, G., Gu, J., Hood, L., Rowen, L., Madan, A., Qin, S.,
Davis, R.W., Federspiel, N.A., Abola, A.P., Proctor, M.J., Myers, R.M., Schmutz, J.,
Dickson, M., Grimwood, J., Cox, D. R., Olson, M.V., Kaul, R., Shimizu, N., Kawasaki, K.,
Minoshima, S., Evans, G.A., Athanasiou, M., Schultz, R., Roe, B.A., Chen, F., Pan, H.,
Ramser, J., Lehrach, H., Reinhardt, R., McCombie, W.R., de la Bastide, M., Dedhia, N.,
Blocker, H., Hornischer, K., Nordsiek, G., Agarwala, R., Aravind, L., Bailey, J.A., Bateman,
A., Batzoglou, S., Birney, E., Bork, P., Brown, D.G., Burge, C.B., Cerutti, L., Chen, H.C.,
Church, D., Clamp, M., Copley, R.R., Doerks, T., Eddy, S.R., Eichler, E.E., Furey, T.S.,
Galagan, J., Gilbert, J.G., Harmon, C., Hayashizaki, Y., Haussler, D., Hermjakob, H.,
Hokamp, K., Jang, W., Johnson, L.S., Jones, T.A., Kasif, S., Kaspryzk, A., Kennedy, S.,
Kent, W.J., Kitts, P., Koonin, E.V., Korf, I., Kulp, D., Lancet, D., Lowe, T.M., McLysaght,
A., Mikkelsen, T., Moran, J.V., Mulder, N., Pollara, V.J., Ponting, C.P., Schuler, G., Schultz,
J., Slater, G., Smit, A.F., Stupka, E., Szustakowski, J., Thierry-Mieg, D., Thierry-Mieg, J.,
Wagner, L., Wallis, J., Wheeler, R., Williams, A., Wolf, Y. I., Wolfe, K.H., Yang, S.P., Yeh,
R.F., Collins, F., Guyer, M.S., Peterson, J., Felsenfeld, A., Wetterstrand, K.A., Patrinos, A.,
Morgan, M.J., de Jong, P., Catanese, J.J., Osoegawa, K., Shizuya, H., Choi, S. and Chen, Y.J.
Initial sequencing and analysis of the human genome, Nature 2001;409:860-921.
40. Liolios K, Chen, I. M., Mavromatis, K., Tavernarakis, N., Hugenholtz, P., Markowitz,
V. M. and Kyrpides, N. C. The Genomes On Line Database (GOLD) in 2009: status of
genomic and metagenomic projects and their associated metadata, Nucleic Acids Res
2009;38:D346-354.
41. Benson DA, Karsch-Mizrachi, I., Lipman, D. J., Ostell, J. and Wheeler, D. L.
GenBank, Nucleic Acids Res 2007;35:D21-25.
42. Kulikova T, Akhtar, R., Aldebert, P., Althorpe, N., Andersson, M., Baldwin, A.,
Bates, K., Bhattacharyya, S., Bower, L., Browne, P., Castro, M., Cochrane, G., Duggan, K.,
186
Eberhardt, R., Faruque, N., Hoad, G., Kanz, C., Lee, C., Leinonen, R., Lin, Q., Lombard, V.,
Lopez, R., Lorenc, D., McWilliam, H., Mukherjee, G., Nardone, F., Pastor, M.P., Plaister, S.,
Sobhany, S., Stoehr, P., Vaughan, R., Wu, D., Zhu, W. and Apweiler, R. EMBL Nucleotide
Sequence Database in 2006, Nucleic Acids Res 2007;35:D16-20.
43. Okubo K, Sugawara, H., Gojobori, T. and Tateno, Y. DDBJ in preparation for
overview of research activities behind data submissions, Nucleic Acids Res 2006;34:D6-9.
44. Ideker T, Galitski, T. and Hood, L. A new approach to decoding life: systems biology,
Annu Rev Genomics Hum Genet 2001;2:343-372.
45. Kitano H. Systems biology: a brief overview, Science 2002;295:1662-1664.
46. Chong LD, Ray, L.B. Reproductive Biology, Science 2002.
47. Barrett T, Troup, D. B., Wilhite, S. E., Ledoux, P., Rudnev, D., Evangelista, C., Kim,
I. F., Soboleva, A., Tomashevsky, M., Marshall, K. A., Phillippy, K. H., Sherman, P. M.,
Muertter, R. N. and Edgar, R. NCBI GEO: archive for high-throughput functional genomic
data, Nucleic Acids Res 2009;37:D885-890.
48. Rocca-Serra P, Brazma, A., Parkinson, H., Sarkans, U., Shojatalab, M., Contrino, S.,
Vilo, J., Abeygunawardena, N., Mukherjee, G., Holloway, E., Kapushesky, M., Kemmeren,
P., Lara, G.G., Oezcimen, A. and Sansone, S.A. ArrayExpress: a public database of gene
expression data at EBI, C R Biol 2003;326:1075-1078.
49. Ness SA. Basic microarray analysis: strategies for successful experiments, Methods
Mol Biol 2006;316:13-33.
50. Quackenbush J. Extracting meaning from functional genomics experiments, Toxicol
Appl Pharmacol 2005;207:195-199.
51. Zhang Y, Szustakowski, J. and Schinke, M. Bioinformatics analysis of microarray
data, Methods Mol Biol 2009;573:259-284.
52. Vizcaino JA, Cote, R., Reisinger, F., Barsnes, H., Foster, J.M., Rameseder, J.,
Hermjakob, H. and Martens, L. The Proteomics Identifications database: 2010 update,
Nucleic Acids Res 2010;38:D736-742.
53. Deutsch EW, Lam, H. and Aebersold, R. PeptideAtlas: a resource for target selection
for emerging targeted proteomics workflows, EMBO Rep 2008;9:429-434.
187
54. Gasteiger E, Gattiker, A., Hoogland, C., Ivanyi, I., Appel, R.D. and Bairoch, A.
ExPASy: The proteomics server for in-depth protein knowledge and analysis, Nucleic Acids
Res 2003;31:3784-3788.
55. Kreeger PK, Lauffenburger, D.A. Cancer systems biology: a network modeling
perspective, Carcinogenesis 2010;31:2-8.
56. Legrain P, Selig, L. Genome-wide protein interaction maps using two-hybrid systems,
FEBS Lett 2000;480:32-36.
57. Kann MG. Protein interactions and disease: computational approaches to uncover the
etiology of diseases, Brief Bioinform 2007;8:333-346.
58. Sato T, Yamanishi, Y., Kanehisa, M. and Toh, H. The inference of protein-protein
interactions by co-evolutionary analysis is improved by excluding the information about the
phylogenetic relationships, Bioinformatics 2005;21:3482-3489.
59. Butland G, Peregrin-Alvarez, J.M., Li, J., Yang, W., Yang, X., Canadien, V.,
Starostine, A., Richards, D., Beattie, B., Krogan, N., Davey, M., Parkinson, J., Greenblatt, J.
and Emili, A. Interaction network containing conserved and essential protein complexes in
Escherichia coli, Nature 2005;433:531-537.
60. Busler VJ, Torres, V.J., McClain, M.S., Tirado, O., Friedman, D.B. and Cover, T.L.
Protein-Protein Interactions among Helicobacter pylori Cag Proteins Journal of Bacteriology
2006;188:4787-4800.
61. LaCount DJ, Vignali, M., Chettier, R., Phansalkar, A., Bell, R., Hesselberth, J. R.,
Schoenfeld, L.W., Ota, I., Sahasrabudhe, S., Kurschner, C., Fields, S. and Hughes, R.E. A
protein interaction network of the malaria parasite Plasmodium falciparum, Nature
2005;438:103-107.
62. Nandy SK, Jouhten, P. and Nielsen, J. Reconstruction of the yeast protein-protein
interaction network involved in nutrient sensing and global metabolic regulation, BMC Syst
Biol 2010;4:68.
63. Giot L, Bader J.S., Brouwer, C., Chaudhuri, A., Kuang, B., Li, Y., Hao, Y.L., Ooi,
C.E., Godwin, B., Vitols, E., Vijayadamodar, G., Pochart, P., Machineni, H., Welsh, M.,
Kong, Y., Zerhusen, B., Malcolm, R., Varrone, Z., Collis, A., Minto, M., Burgess, S.,
McDaniel, L., Stimpson, E., Spriggs, F., Williams, J., Neurath, K., Ioime, N., Agee, M., Voss,
188
E., Furtak, K., Renzulli, R., Aanensen, N., Carrolla, S., Bickelhaupt, E., Lazovatsky, Y.,
DaSilva, A., Zhong, J., Stanyon, C.A., Finley, R.L .Jr., White, K.P., Braverman, M., Jarvie,
T., Gold, S., Leach, M., Knight, J., Shimkets, R.A., McKenna, M.P., Chant, J. and Rothberg,
J.M. A protein interaction map of Drosophila melanogaster, Science 2003;302:1727-1736.
64. Li S, Armstrong, C. M., Bertin, N., Ge, H., Milstein, S., Boxem, M., Vidalain, P.O.,
Han, J. D., Chesneau, A., Hao, T., Goldberg, D.S., Li, N., Martinez, M., Rual, J.F., Lamesch,
P., Xu, L., Tewari, M., Wong, S.L., Zhang, L.V., Berriz, G.F., Jacotot, L., Vaglio, P., Reboul,
J., Hirozane-Kishikawa, T., Li, Q., Gabel, H.W., Elewa, A., Baumgartner, B., Rose, D.J., Yu,
H., Bosak, S., Sequerra, R., Fraser, A., Mango, S.E., Saxton, W.M., Strome, S., Van Den
Heuvel, S., Piano, F., Vandenhaute, J., Sardet, C., Gerstein, M., Doucette-Stamm, L.,
Gunsalus, K.C., Harper, J.W., Cusick, M.E., Roth, F.P., Hill, D.E. and Vidal, M. A map of the
interactome network of the metazoan C. elegans, Science 2004;303:540-543.
65. Stelzl U, Worm, U., Lalowski, M., Haenig, C., Brembeck, F.H., Goehler, H.,
Stroedicke, M., Zenkner, M., Schoenherr, A., Koeppen, S., Timm, J., Mintzlaff, S., Abraham,
C., Bock, N., Kietzmann, S., Goedde, A., Toksoz, E., Droege, A., Krobitsch, S., Korn, B.,
Birchmeier, W., Lehrach, H. and Wanker, E.E. A human protein-protein interaction network:
a resource for annotating the proteome, Cell 2005;122:957-968.
66. Turanalp ME, Can, T. Discovering functional interaction patterns in protein-protein
interaction networks, BMC Bioinformatics 2008;9:276.
67. Salwinski L, Miller, C. S., Smith, A.J., Pettit, F.K., Bowie, J.U. and Eisenberg, D. The
Database of Interacting Proteins: 2004 update, Nucleic Acids Res 2004;32:D449-451.
68. Kerrien S, Alam-Faruque, Y., Aranda, B., Bancarz, I., Bridge, A., Derow, C., Dimmer,
E., Feuermann, M., Friedrichsen, A., Huntley, R., Kohler, C., Khadake, J., Leroy, C., Liban,
A., Lieftink, C., Montecchi-Palazzi, L., Orchard, S., Risse, J., Robbe, K., Roechert, B.,
Thorneycroft, D., Zhang, Y., Apweiler, R. and Hermjakob, H. IntAct--open source resource
for molecular interaction data, Nucleic Acids Res 2007;35:D561-565.
69. von Mering C, Jensen, L.J., Kuhn, M., Chaffron, S., Doerks, T., Kruger, B., Snel, B.
and Bork, P. STRING 7--recent developments in the integration and prediction of protein
interactions, Nucleic Acids Res 2007;35:D358-362.
189
70. Kell DB. Metabolomics and systems biology: making sense of the soup, Curr Opin
Microbiol 2004;7:296-307.
71. Joyce AR, Palsson, B.O. The model organism as a system: integrating 'omics' data
sets, Nat Rev Mol Cell Biol 2006;7:198-210.
72. Bianchetti L, Thompson, J.D., Lecompte, O., Plewniak, F. and Poch, O. vALId:
validation of protein sequence quality based on multiple alignment data, J Bioinform Comput
Biol 2005;3:929-947.
73. Lundin D, Torrents, E., Poole, A. M. and Sjoberg, B. M. RNRdb, a curated database of
the universal enzyme family ribonucleotide reductase, reveals a high level of misannotation in
sequences deposited to Genbank, BMC Genomics 2009;10:589.
74. Kersey PJ, Lawson, D., Birney, E., Derwent, P.S., Haimel, M., Herrero, J., Keenan, S.,
Kerhornou, A., Koscielny, G., Kahari, A., Kinsella, R.J., Kulesha, E., Maheswari, U., Megy,
K., Nuhn, M., Proctor, G., Staines, D., Valentin, F., Vilella, A.J., Yates, A. Ensembl
Genomes: extending Ensembl across the taxonomic space, Nucleic Acids Res 2010;38:D563-
569.
75. Boeckmann B, Bairoch, A., Apweiler, R., Blatter, M. C., Estreicher, A., Gasteiger, E.,
Martin, M. J., Michoud, K., O'Donovan, C., Phan, I., Pilbout, S. and Schneider, M. The
SWISS-PROT protein knowledgebase and its supplement TrEMBL in 2003, Nucleic Acids
Res 2003;31:365-370.
76. Pruitt KD, Maglott, D.R. RefSeq and LocusLink: NCBI gene-centered resources,
Nucleic Acids Res 2001;29:137-140.
77. Costanzo MC, Hogan, J. D., Cusick, M. E., Davis, B. P., Fancher, A. M., Hodges, P.
E., Kondu, P., Lengieza, C., Lew-Smith, J. E., Lingner, C., Roberg-Perez, K. J., Tillberg, M.,
Brooks, J. E. and Garrels, J. I. The yeast proteome database (YPD) and Caenorhabditis
elegans proteome database (WormPD): comprehensive resources for the organization and
comparison of model organism protein information, Nucleic Acids Res 2000;28:73-76.
78. Costanzo MC, Crawford, M. E., Hirschman, J. E., Kranz, J. E., Olsen, P., Robertson,
L. S., Skrzypek, M. S., Braun, B. R., Hopkins, K. L., Kondu, P., Lengieza, C., Lew-Smith, J.
E., Tillberg, M. and Garrels, J. I. YPD, PombePD and WormPD: model organism volumes of

190
the BioKnowledge library, an integrated resource for protein information, Nucleic Acids Res
2001;29:75-79.
79. Bult CJ, Eppig, J.T., Kadin, J.A., Richardson, J.E. and Blake, J.A. The Mouse Genome
Database (MGD): mouse biology and model systems, Nucleic Acids Res 2008;36:D724-728.
80. Zdobnov EM, Lopez, R., Apweiler, R. and Etzold, T. The EBI SRS server-new
features, Bioinformatics 2002;18:1149-1150.
81. Kasprzyk A, Keefe, D., Smedley, D., London, D., Spooner, W., Melsopp, C.,
Hammond, M., Rocca-Serra, P., Cox, T. and Birney, E. EnsMart: a generic system for fast
and flexible access to biological data, Genome Res 2004;14:160-169.
82. Shah SP, Huang, Y., Xu, T., Yuen, M.M., Ling, J. and Ouellette, B.F. Atlas - a data
warehouse for integrative bioinformatics, BMC Bioinformatics 2005;6:34.
83. Topaloglou T, Kosky, A. and Markowitz, V. Seamless integration of biological
applications within a database framework, Proc Int Conf Intell Syst Mol Biol 1999:272-281.
84. Haas LM, Schwarz, P.M. , Kodali, P. , Kotlar, E. , Rice, J.E. and Swope, W.C.
DiscoveryLink: a system for integrated access to life sciences data sources, IBM Syst. J.
2001;40:489-511.
85. Baker PG, Brass, A., Bechhofer, S., Goble, C., Paton, N. and Stevens, R. TAMBIS--
Transparent Access to Multiple Bioinformatics Information Sources, Proc Int Conf Intell Syst
Mol Biol 1998;6:25-34.
86. Wilkinson MD, Links, M. BioMOBY: an open source biological web services
proposal, Brief Bioinform 2002;3:331-341.
87. Kohler J, Schulze-Kremer, S. The semantic metadatabase (SEMEDA): ontology based
integration of federated molecular biological data sources, In Silico Biol 2002;2:219-231.
88. Jenkinson AM, Albrecht, M., Birney, E., Blankenburg, H., Down, T., Finn, R.D.,
Hermjakob, H., Hubbard, T.J., Jimenez, R.C., Jones, P., Kahari, A., Kulesha, E., Macias, J.R.,
Reeves, G.A. and Prlic, A. Integrating biological data--the Distributed Annotation System,
BMC Bioinformatics 2008;9 Suppl 8:S3.
89. Ashburner M, Ball, C. A., Blake, J. A., Botstein, D., Butler, H., Cherry, J. M., Davis,
A. P., Dolinski, K., Dwight, S. S., Eppig, J. T., Harris, M. A., Hill, D. P., Issel-Tarver, L.,
191
Kasarskis, A., Lewis, S., Matese, J. C., Richardson, J. E., Ringwald, M., Rubin, G. M. and
Sherlock, G. Gene ontology: tool for the unification of biology. The Gene Ontology
Consortium, Nat Genet 2000;25:25-29.
90. Pearson WR. Rapid and sensitive sequence comparison with FASTP and FASTA,
Methods Enzymol 1990;183:63-98.
91. Sleator R, Walsh, P. An overview of in silico protein function prediction, Archives of
Microbiology 2010;192:151-155.
92. Frawley WJ, Piatetsky-Shapiro, G. and Matheus, C.J. Knowledge Discovery in
Databases, AAAI Press 1992.
93. Kovalerchuk B, Triantaphyllou, E., Ruiz, J.F., Torvik, V.I. and Vityaev, E. The
reliability issue of computer-aided breast cancer diagnosis, Comput Biomed Res 2000;33:296-
313.
94. Dreiseitl S, Ohno-Machado, L., Kittler, H., Vinterbo, S., Billhardt, H. and Binder, M.
A comparison of machine learning methods for the diagnosis of pigmented skin lesions, J
Biomed Inform 2001;34:28-36.
95. Bammert GF, Fostel, J.M. Genome-wide expression patterns in Saccharomyces
cerevisiae: comparison of drug treatments and genetic alterations affecting biosynthesis of
ergosterol, Antimicrob Agents Chemother 2000;44:1255-1265.
96. Eisen MB, Spellman, P.T., Brown, P.O. and Botstein, D. Cluster analysis and display
of genome-wide expression patterns, Proc Natl Acad Sci U S A 1998;95:14863-14868.
97. Herwig R, Poustka, A. J., Muller, C., Bull, C., Lehrach, H. and O'Brien, J. Large-scale
clustering of cDNA-fingerprinting data, Genome Res 1999;9:1093-1105.
98. Sawa TaO-M, L. A neural network-based similarity index for clustering DNA
microarray data, Computers in Biology and Medicine 2003;33:1-15
99. Belacel N, Cuperlovic-Culf, M., Laflamme, M. and Ouellette, R. Fuzzy J-Means and
VNS methods for clustering genes from microarray data, Bioinformatics 2004;20:1690-1701.
100. Agrawal R, Srikant, R. Fast Algorithms for Mining Association Rules, Proc. 20th Int.
Conf. on Very Large Databases (VLDB 1994, Santiago de Chile), 1994; 487-499.

192
101. Brin S, Motwani, R., Ullman, J. D. and Tsur, S. Dynamic itemset counting and
implication rules for market basket data, SIGMOD Record (ACM Special Interest Group on
Management of Data 1997;26(2). 255-264.
102. Carmona-Saez P, Chagoyen, M., Rodriguez, A., Trelles, O., Carazo, J. M. and
Pascual-Montano, A. Integrated analysis of gene expression by Association Rules Discovery,
BMC Bioinformatics 2006;7:54.
103. Martinez R, Pasquier, N. and Pasquier, C. GenMiner: mining non-redundant
association rules from integrated gene expression data and annotations, Bioinformatics
2008;24:2643-2644.
104. Tan AC, Gilbert, D. An empirical comparison of supervised machine learning
techniques in bioinformatics, Proceedings of the First Asia-Pacific bioinformatics conference
on Bioinformatics 2003;19:219-222.
105. Kasturi J, Acharya, R. Clustering of diverse genomic data using information fusion,
Bioinformatics 2005;21:423-429.
106. Tamames J, Ouzounis, C., Casari, G., Sander, C. and Valencia, A. EUCLID:
automatic classification of proteins in functional classes by their database annotations,
Bioinformatics 1998;14:542-543.
107. Andrade MA, Valencia, A. Automatic extraction of keywords from scientific text:
application to the knowledge domain of protein families, Bioinformatics 1998;14:600-607.
108. Raychaudhuri S, Chang, J.T., Sutphin, P.D. and Altman, R.B. Associating genes with
gene ontology codes using a maximum entropy analysis of biomedical literature, Genome Res
2002;12:203-214.
109. Xie H, Wasserman, A., Levine, Z., Novik, A., Grebinskiy, V., Shoshan, A. and Mintz,
L. Large-scale protein annotation through gene ontology, Genome Res 2002;12:785-794.
110. Nair R, Rost, B. Inferring sub-cellular localization through automated lexical analysis,
Bioinformatics 2002;18 Suppl 1:S78-86.
111. Stapley BJ, Kelley, L.A. and Sternberg, M.J. Predicting the sub-cellular location of
proteins from text using support vector machines, Pac Symp Biocomput 2002:374-385.

193
112. Blaschke C, Cornide, L., Oliveros, J.C. and Valencia, A. Biological function and DNA
expression arrays, In van der Vet,P. et al., (eds), Information Extraction in Molecular Biology
2001:13-26.
113. Al-Shahrour F, Diaz-Uriarte, R. and Dopazo, J. FatiGO: a web tool for finding
significant associations of Gene Ontology terms with groups of genes, Bioinformatics
2004;20:578-580.
114. Jenssen TK, Laegreid, A., Komorowski, J. and Hovig, E. A literature network of
human genes for high-throughput analysis of gene expression, Nat Genet 2001;28:21-28.
115. Jaeger S, Gaudan, S., Leser, U. and Rebholz-Schuhmann, D. Integrating protein-
protein interactions and text mining for protein function prediction, BMC Bioinformatics
2008;9 Suppl 8:S2.
116. Swanson D. Fish oil, Raynaud’s syndrome, and undiscovered public knowledge,
Perspectives in Biology and Medicine, 1986;30:7-18.
117. Slooter AJ, Bronzova, J., Witteman, J.C., Van Broeckhoven, C., Hofman, A. and van
Duijn, C.M. Estrogen use and early onset Alzheimer's disease: a population-based study, J
Neurol Neurosurg Psychiatry 1999;67:779-781.
118. Hyun S, Johnson, S.B. and Bakken, S. Exploring the ability of natural language
processing to extract data from nursing narratives, Comput Inform Nurs 2009;27:215-223;
quiz 224-215.
119. Rzhetsky A, Iossifov, I., Koike, T., Krauthammer, M., Kra, P., Morris, M., Yu, H.,
Duboue, P.A., Weng, W., Wilbur, W.J., Hatzivassiloglou, V. and Friedman, C. GeneWays: a
system for extracting, analyzing, visualizing, and integrating molecular pathway data, J
Biomed Inform 2004;37:43-53.
120. Chou SM, Lee, T.S., Shao, Y. E. and Chen, I.F. Mining the breast cancer pattern using
artificial neural networks and multivariate adaptive regression splines., Expert System with
Applications 2004; 27: 133-142.
121. Rocco D, Critchlow, T. Automatic discovery and classification of bioinformatics Web
sources, Bioinformatics 2003;19:1927-1933.

194
122. Pendharkar PC, Rodger, J.A., Yaverbaum, X.X., Herman, N. and Benner, M. .
Association, statistical mathematical and neural approaches, for mining breast cancer patterns,
Expert Systems with Applications 1999;17:223-232.
123. Tang C, Zhang, A. and Pei, J. (2003), 'Mining phenotypes and informative genes from
gene expression data', Proceedings of the ninth ACM SIGKDD international conference on
Knowledge discovery and data mining, ACM, Washington, D.C.
124. Carroll JS, Meyer, C.A., Song, J., Li, W., Geistlinger, T.R., Eeckhoute, J., Brodsky,
A.S., Keeton, E.K., Fertuck, K. C., Hall, G.F., Wang, Q., Bekiranov,S., Sementchenko, V.,
Fox, E.A., Silver, P.A., Gingeras, T.R., Liu, X.S. and Brown, M. Genome-wide analysis of
estrogen receptor binding sites., Nat. Genet. 2006;38:1289–1297.
125. Lein ES, Hawrylycz, M.J., Ao, N., Ayres, M., Bensinger, A., Bernard, A., Boe, A.F.,
Boguski, M.S., Brockway, K.S., Byrnes, E.J., Chen, L., Chen, L., Chen, T.M., Chin, M.C.,
Chong, J., Crook, B.E., Czaplinska, A., Dang, C.N., Datta, S., Dee, N.R., Desaki, A.L., Desta,
T., Diep, E., Dolbeare, T.A., Donelan, M.J., Dong, H.W., Dougherty, J.G., Duncan, B.J.,
Ebbert, A.J., Eichele, G., Estin, L.K., Faber, C., Facer, B.A., Fields, R., Fischer, S.R., Fliss,
T.P., Frensley, C., Gates, S.N., Glattfelder, K.J., Halverson, K.R., Hart, M.R., Hohmann, J.G.,
Howell, M.P., Jeung, D.P., Johnson, R.A., Karr, P.T., Kawal, R., Kidney, J.M., Knapik, R.H.,
Kuan, C.L., Lake, J.H., Laramee, A.R., Larsen, K.D., Lau, C., Lemon, T.A., Liang, A.J., Liu,
Y., Luong, L.T., Michaels, J., Morgan, J.J., Morgan, R.J., Mortrud, M.T., Mosqueda, N.F., Ng
L.L., Ng, R., Orta, G.J., Overly, C.C., Pak, T.H., Parry, S.E., Pathak, S.D., Pearson, O.C.,
Puchalski, R.B., Riley, Z.L., Rockett, H.R., Rowland, S.A., Royall, J.J., Ruiz, M.J., Sarno,
N.R., Schaffnit, K., Shapovalova, N.V., Sivisay, T., Slaughterbeck, C.R., Smith, S.C., Smith,
K.A., Smith, B.I., Sodt, A.J., Stewart, N.N., Stumpf, K.R., Sunkin, S.M., Sutram, M., Tam,
A., Teemer, C.D., Thaller, C., Thompson, C.L., Varnam, L.R., Visel, A., Whitlock, R.M.,
Wohnoutka, P.E., Wolkey, C.K., Wong, V.Y., Wood, M., Yaylaoglu, M.B., Young, R.C.,
Youngstrom, B.L., Yuan, X.F., Zhang, B., Zwingman, T.A. and Jones, A.R. Genome-wide
atlas of gene expression in the adult mouse brain, Nature 2007;445:168-176.
126. Souchelnytskyi S. Bridging proteomics and systems biology: what are theroads to be
traveled? , Proteomics 2005;5:4123–4137.
127. van Steensel B. Mapping of genetic and epigenetic regulatory networks using
microarrays, Nat. Genet. 2005;37:18–24.
195
128. Feingold EA, Good, P.J., Guyer, M.S., Kamholz, S., Liefer, L., Wetterstrand, K. and
Collins, F.S. The ENCODE (ENCyclopedia Of DNA Elements) Project. The ENCODE
Project Consortium, Science 2004;306:636-640.
129. Ge H, Walhout, A.J. and Vidal, M. Integrating `omic' information: a bridge between
genomics and systems biology. Trends in Genetics 2003;19:551-560.
130. Ackoff RL. From data to wisdom, Journal of Applies Systems Analysis 1989;16:3–9.
131. Lopez B, Plaza, E. . Case-based learning of plans and medical diagnosis goal states,
Artificial Intelligence in Medicine 1997;9:29–60.
132. Khan AS, Hoffmann, A. . Building a case-based diet recommendation system without
a knowledge engineer, Artificial Intelligence in Medicine 2003;27:155–179.
133. Porter BW, Bareiss, E.R. . PROTOS: an experiment in knowledge acquisition for
heuristic classification tasks, Proceedings of the First International Meeting on Advances in
Learning (IMAL), Les Arcs, France, 1986:159–174.
134. Koton P. Reasoning about evidence in causal explanations., Proceedings of the
Seventh National Conference on Artificial Intelligence, AAI Press, Menlo Park, CA,(256-
263) 1988.
135. Montani S, Magni, P., Bellazzi, R., Larizza, C., Roudsari, A.V. and Carson, E.R.
Integrating model-based decision support in a multi-modal reasoning system for managing
type 1 diabetic patients, Artificial Intelligence in Medicine 2003;29:131–151.
136. Bernstein AD, Chiang, C.J. and Parsonnet, V. Diagnosis and management of
pacemaker-related problems using and interactive expert system, IEEE 17th Annual
Conference on Engineering in Medicine and Biology Society 1995;1:701–702.
137. Dragulescu D, Albu, A. Expert system for medical predictions, 4th International
Symposium on Applied Computational Intelligence and Informatics 2007:13–18.
138. Itchhaporia D, Snow, P.B., Almassy, R.J. and Oetgen, W.J. Artificial neural networks:
current status in cardiovascular medicine, Journal of the American College of Cardiology
1996; 28:515–521.
196
139. Brasil LM, de Azevedo, F.M. and Barreto, J.M. . Hybrid expert system for decision
supporting in the medical area: complexity and cognitive computing International, Journal of
Medical Informatics 2001;63:19–30.
140. Power T, McCabe, B. and Harbison, S.A. FaSTR DNA: a new expert system for
forensic DNA analysis, Forensic Sci Int Genet 2008 2:159-165.
141. Edman P. On the mechanism of the phenyl isothiocyanate degradation of peptides,
Ada Chim. Scand. 1956;10:761-768.
142. Hu L, Saulinskas, E.F., Johnson, P. and Harrington, P.B. Development of an expert
system for amino acid sequence identification., Comput Appl Biosci. 1996;12:311-318.
143. Praveen B, Vincent, S., Murty, U.S., Krishna, A.R. and Jamil, K. A rapid
identification system for metallothionein proteins using expert system, Bioinformation
2005;1:14-15.
144. Quinlan JR. Induction of Decision Trees, Readings in Machine Learning 1986;1:81-
106.
145. Zhang W, Chait, B.T. ProFound: an expert system for protein identification using
mass spectrometric peptide mapping infocrmation, Anal Chem. 2000;72:2482-2489.
146. Gouret P, Vitiello, V., Balandraud, N., Gilles, A., Pontarotti, P. and Danchin, E.G.
FIGENIX: Intelligent automation of genomic annotation: expertise integration in a new
software platform, BMC Bioinformatics. 2005;6:198.
147. Liao SH. Expert system methodologies and applications-a decade review from 1995 to
2004, Expert Systems with Applications 2005;28:93-103.
148. Durkin J (1996), 'Expert Systems: A View of the Field', pp. 56-63.
149. Dhaliwal JS, Benbasat, I. The Use and Effects of Knowledge-Based System
Explanations: Theoretical Foundations and a Framework for Empirical Evaluation,
INFORMATION SYSTEMS RESEARCH 1996;7:342-362.
150. Giarratano JC, Riley, G. Expert Systems, Principles and Programming. Course
Technology 2005.
151. Pop M, Salzberg, S.L. Bioinformatics challenges of new sequencing technology,
Trends Genet 2008;24:142-149.
197
152. Wang ZX. A re-estimation for the total numbers of protein folds and superfamilies,
Protein Eng 1998;11:621-626.
153. Chothia C, Lesk, A.M. The relation between the divergence of sequence and structure
in proteins, EMBO J 1986;5:823-826.
154. Koehl P, Levitt, M. Sequence variations within protein families are linearly related to
structural variations, J Mol Biol 2002;323:551-562.
155. Yang AS, Honig, B. An integrated approach to the analysis and modeling of protein
sequences and structures. II. On the relationship between sequence and structural similarity
for proteins that are not obviously related in sequence, J Mol Biol 2000;301:679-689.
156. Chung SY, Subbiah, S. A structural explanation for the twilight zone of protein
sequence homology, Structure 1996;4:1123-1127.
157. Gan HH, Perlow, R.A., Roy, S. Ko, J., Wu, M., Huang, J., Yan, S., Nicoletta, A.,
Vafai, J., Sun, D., Wang, L., Noah, J.E., Pasquali, S. and Schlick, T. Analysis of protein
sequence/structure similarity relationships, Biophys J 2002;83:2781-2791.
158. Thornton JM, Todd, A.E., Milburn, D., Borkakoti, N. and Orengo, C.A. From
structure to function: approaches and limitations, Nat Struct Biol 2000;7 Suppl:991-994.
159. Watson JD, Laskowski, R.A. and Thornton, J.M. Predicting protein function from
sequence and structural data, Curr Opin Struct Biol 2005;15:275-284.
160. Eichler J, Adams, M.W. Posttranslational protein modification in Archaea, Microbiol
Mol Biol Rev 2005;69:393-425.
161. Wilson CA, Kreychman, J. and Gerstein, M. Assessing annotation transfer for
genomics: quantifying the relations between protein sequence, structure and function through
traditional and probabilistic scores, J Mol Biol 2000;297:233-249.
162. Lesk AM, Bernstein, H.J. and Bernstein, F.C. . Molecular graphics in structural
biology., Computational Structural Biology, Methods and Applications.(M. Peitsch and T.
Schwede, eds.) 1994:pp.729-770.
163. Lecompte O, Ripp, R., Puzos-Barbe, V., Duprat, S., Heilig, R., Dietrich, J., Thierry,
J.C. and Poch, O. Genome evolution at the genus level: comparison of three complete
genomes of hyperthermophilic archaea, Genome Res 2001;11:981-993.
198
164. Woese CR, Pace, N.R. Probing RNA structure, function and history by comparative
analysis, In “The RNA World”. Cold Spring Harbor Laboratory Press, Cold Spring Harbor,
NY 1993.
165. Iwabe N, Kuma, K., Hasegawa, M., Osawa, S. and Miyata, T. Evolutionary
relationship of archaebacteria, eubacteria, and eukaryotes inferred from phylogenetic trees of
duplicated genes, Proc Natl Acad Sci U S A 1989;86:9355-9359.
166. Lopez-Garcia P, Moreira, D. Metabolic symbiosis at the origin of eukaryotes, Trends
Biochem Sci 1999;24:88-93.
167. Forterre P, Philippe, H. Where is the root of the universal tree of life?, Bioessays
1999;21:871-879.
168. Poole A, Jeffares, D. and Penny, D. Early evolution: prokaryotes, the new kids on the
block, Bioessays 1999;21:880-889.
169. Lecompte O, Ripp, R., Thierry, J.C., Moras, D. and Poch, O. Comparative analysis of
ribosomal proteins in complete genomes: an example of reductive evolution at the domain
scale, Nucleic Acids Res 2002;30:5382-5390.
170. Page RDM, Holmes, E.C. Molecular Evolution: A Phylogenetic Approach, Blackwell
Science, Oxford, U.K 1998.
171. Morrison DA, Ellis, J.T. Effects of nucleotide sequence alignment on phylogeny
estimation: a case study of 18S rDNAs of apicomplexa, Mol Biol Evol 1997;14:428-441.
172. Hardison RC. Comparative genomics, PLoS Biol 2003;1:E58.
173. Shapiro JA. A 21st century view of evolution: genome system architecture, repetitive
DNA, and natural genetic engineering, Gene 2005;345:91-100.
174. Darling AE, Mau, B., Blattner, F.R. and Perna, N.T. GRIL: genome rearrangement
and inversion locator, Bioinformatics 2004;20:122-124.
175. Elnitski L, Giardine, B., Shah, P., Zhang, Y., Riemer, C., Weirauch, M., Burhans, R.,
Miller, W. and Hardison, R.C. Improvements to GALA and dbERGE II: databases featuring
genomic sequence alignment, annotation and experimental results, Nucleic Acids Res
2005;33:D466-470.
199
176. Ye L, Huang, X. MAP2: multiple alignment of syntenic genomic sequences, Nucleic
Acids Res 2005;33:162-170.
177. McClelland M, Florea, L., Sanderson, K., Clifton, S. W., Parkhill, J., Churcher, C.,
Dougan, G., Wilson, R. K. and Miller, W. Comparison of the Escherichia coli K-12 genome
with sampled genomes of a Klebsiella pneumoniae and three salmonella enterica serovars,
Typhimurium, Typhi and Paratyphi, Nucleic Acids Res 2000;28:4974-4986.
178. Waterston RH, Lindblad-Toh, K., Birney, E., Rogers, J., Abril, J.F., Agarwal, P.,
Agarwala, R., Ainscough, R., Alexandersson, M., An, P., Antonarakis, S.E., Attwood, J.,
Baertsch, R., Bailey, J., Barlow, K., Beck, S., Berry, E., Birren, B., Bloom, T., Bork, P.,
Botcherby, M., Bray, N., Brent, M.R., Brown, S.D., Bult, C., Burton, J., Butler, J., Campbell,
R.D., Carninci, P., Cawley, S., Chiaromonte, F., Chinwalla, A.T., Church, D.M., Clamp, M.,
Clee, C., Collins, F.S., Cook, L.L., Copley, R.R., Coulson, A., Couronne, O., Cuff, J.,
Curwen, V., Cutts, T., Daly, M., David, R., Davies, J., Delehaunty, K.D., Deri, J.,
Dermitzakis, E.T., Dewey, C., Dickens, N.J., Diekhans, M., Dodge, S., Dubchak, I., Dunn,
D.M., Eddy, S. R., Elnitski, L., Emes, R.D., Eswara, P., Eyras, E., Felsenfeld, A., Fewell, G.
A., Flicek, P., Foley, K., Frankel, W.N., Fulton, L.A., Fulton, R.S., Furey, T.S., Gage, D.,
Gibbs, R.A., Glusman, G., Gnerre, S., Goldman, N., Goodstadt, L., Grafham, D., Graves,
T.A., Green, E.D., Gregory, S., Guigo, R., Guyer, M., Hardison, R.C., Haussler, D.,
Hayashizaki, Y., Hillier, L. W., Hinrichs, A., Hlavina, W., Holzer, T., Hsu, F., Hua, A.,
Hubbard, T., Hunt, A., Jackson, I., Jaffe, D.B., Johnson, L.S., Jones, M., Jones, T.A., Joy, A.,
Kamal, M., Karlsson, E.K., Karolchik, D., Kasprzyk, A., Kawai, J., Keibler, E., Kells, C.,
Kent, W.J., Kirby, A., Kolbe, D.L., Korf, I., Kucherlapati, R.S., Kulbokas, E.J., Kulp, D.,
Landers, T., Leger, J.P., Leonard, S., Letunic, I., Levine, R., Li, J., Li, M., Lloyd, C., Lucas,
S., Ma, B., Maglott, D.R., Mardis, E.R., Matthews, L., Mauceli, E., Mayer, J. H., McCarthy,
M., McCombie, W.R., McLaren, S., McLay, K.,, McPherson, J.D., Meldrim, J., Meredith, B.,
Mesirov, J.P., Miller, W., Miner, T.L., Mongin, E., Montgomery, K.T., Morgan, M., Mott, R.,
Mullikin, J.C., Muzny, D.M., Nash, W.E., Nelson, J.O., Nhan, M.N., Nicol, R., Ning, Z.,
Nusbaum, C., O'Connor, M.J., Okazaki, Y., Oliver, K., Overton-Larty, E., Pachter, L., Parra,
G., Pepin, K.H., Peterson, J., Pevzner, P., Plumb, R., Pohl, C.S., Poliakov, A., Ponce, T.C.,
Ponting, C.P., Potter, S., Quail, M., Reymond, A., Roe, B.A., Roskin, K.M., Rubin, E.M.,
Rust, A.G., Santos, R., Sapojnikov, V., Schultz, B., Schultz, J., Schwartz, M.S., Schwartz, S.,
Scott, C., Seaman, S., Searle, S., Sharpe, T., Sheridan, A., Shownkeen, R., Sims, S., Singer,

200
J.B., Slater, G., Smit, A., Smith, D.R., Spencer, B., Stabenau, A., Stange-Thomann, N.,
Sugnet, C., Suyama, M., Tesler, G., Thompson, J., Torrents, D., Trevaskis, E., Tromp, J.,
Ucla, C., Ureta-Vidal, A., Vinson, J.P., Von Niederhausern, A.C., Wade, C.M., Wall, M.,
Weber, R.J., Weiss, R.B., Wendl, M.C., West, A. P., Wetterstrand, K., Wheeler, R., Whelan,
S., Wierzbowski, J., Willey, D., Williams, S., Wilson, R.K., Winter, E., Worley, K.C.,
Wyman, D., Yang, S., Yang, S.P., Zdobnov, E.M., Zody, M.C. and Lander, E.S. Initial
sequencing and comparative analysis of the mouse genome, Nature 2002;420:520-562.
179. Rubin GM, Yandell, M.D., Wortman, J.R., Gabor Miklos, G.L., Nelson, C.R.,
Hariharan, I.K., Fortini, M.E., Li, P.W., Apweiler, R., Fleischmann, W., Cherry, J.M.,
Henikoff, S., Skupski, M.P., Misra, S., Ashburner, M., Birney, E., Boguski, M.S., Brody, T.,
Brokstein, P., Celniker, S.E., Chervitz, S.A., Coates, D., Cravchik, A., Gabrielian, A., Galle,
R.F., Gelbart, W.M., George, R.A., Goldstein, L.S., Gong, F., Guan, P., Harris, N.L., Hay, B.
A., Hoskins, R.A., Li, J., Li, Z., Hynes, R.O., Jones, S.J., Kuehl, P.M., Lemaitre, B., Littleton,
J.T., Morrison, D.K., Mungall C, O'Farrell, P.H., Pickeral, O.K., Shue, C., Vosshall, L.B.,
Zhang, J., Zhao, Q., Zheng, X.H. and Lewis, S. Comparative genomics of the eukaryotes,
Science 2000;287:2204-2215.
180. Makarova KS, Koonin, E.V. Comparative genomics of Archaea: how much have we
learned in six years, and what's next?, Genome Biol 2003;4:115.
181. Frazer KA, Pachter, L., Poliakov, A., Rubin, E.M. and Dubchak, I. VISTA:
computational tools for comparative genomics, Nucleic Acids Res 2004;32:W273-279.
182. Curwen V, Eyras, E., Andrews, T.D., Clarke, L., Mongin, E., Searle, S.M. and Clamp,
M. The Ensembl automatic gene annotation system, Genome Res 2004;14:942-950.
183. Hsu F, Pringle, T.H., Kuhn, R.M., Karolchik, D., Diekhans, M., Haussler, D. and
Kent, W.J. The UCSC Proteome Browser, Nucleic Acids Res 2005;33:D454-458.
184. Stoetzel C, Laurier, V., Davis, E.E., Muller, J., Rix, S., Badano, J.L., Leitch, C.C.,
Salem, N., Chouery, E., Corbani, S., Jalk, N., Vicaire, S., Sarda, P., Hamel, C., Lacombe, D.,
Holder, M., Odent, S., Holder, S., Brooks, A.S., Elcioglu, N.H., Silva, E.D., Rossillion, B.,
Sigaudy, S., de Ravel, T.J., Lewis, R.A., Leheup, B., Verloes, A., Amati-Bonneau, P.,
Megarbane, A., Poch, O., Bonneau, D., Beales, P.L., Mandel, J.L., Katsanis, N. and Dollfus,
H. BBS10 encodes a vertebrate-specific chaperonin-like protein and is a major BBS locus,
Nat Genet 2006;38:521-524.

201
185. Aggarwal G, Ramaswamy, R. Ab initio gene identification: prokaryote genome
annotation with GeneScan and GLIMMER, J Biosci 2002;27:7-14.
186. Zhang MQ. Computational prediction of eukaryotic protein-coding genes, Nat Rev
Genet 2002;3:698-709.
187. Dandekar T, Huynen, M., Regula, J. T., Ueberle, B., Zimmermann, C. U., Andrade,
M. A., Doerks, T., Sanchez-Pulido, L., Snel, B., Suyama, M., Yuan, Y.P., Herrmann, R. and
Bork, P. Re-annotating the Mycoplasma pneumoniae genome sequence: adding value,
function and reading frames, Nucleic Acids Res 2000;28:3278-3288.
188. Karplus K, Barrett, C. and Hughey, R. Hidden Markov models for detecting remote
protein homologies, Bioinformatics 1998;14:846-856.
189. Yona G, Levitt, M. Within the twilight zone: a sensitive profile-profile comparison
tool based on information theory, J Mol Biol 2002;315:1257-1275.
190. Thompson JD, Gibson, T.J., Plewniak, F., Jeanmougin, F. and Higgins, D.G. The
CLUSTAL_X windows interface: flexible strategies for multiple sequence alignment aided by
quality analysis tools, Nucleic Acids Res 1997;25:4876-4882.
191. Mulder NJ, Apweiler, R., Attwood, T.K., Bairoch, A., Bateman, A., Binns, D.,
Bradley, P., Bork, P., Bucher, P., Cerutti, L., Copley, R., Courcelle, E., Das, U., Durbin, R.,
Fleischmann, W., Gough, J., Haft, D., Harte, N., Hulo, N., Kahn, D., Kanapin, A.,
Krestyaninova, M., Lonsdale, D., Lopez, R., Letunic, I., Madera, M., Maslen, J., McDowall,
J., Mitchell, A., Nikolskaya, A.N., Orchard, S., Pagni, M., Ponting, C.P., Quevillon, E.,
Selengut, J., Sigrist, C. J., Silventoinen, V., Studholme, D.J.., Vaughan, R. and Wu, C.H.
InterPro, progress and status in 2005, Nucleic Acids Res 2005;33:D201-205.
192. Gaasterland T, Sensen, C.W. Fully automated genome analysis that reflects user needs
and preferences. A detailed introduction to the MAGPIE system architecture, Biochimie
1996;78:302-310.
193. Medigue C, Rechenmann, F., Danchin, A. and Viari, A. Imagene: an integrated
computer environment for sequence annotation and analysis, Bioinformatics 1999;15:2-15.
194. Hoersch S, Leroy, C., Brown, N.P., Andrade, M.A. and Sander, C. The GeneQuiz web
server: protein functional analysis through the Web, Trends Biochem Sci 2000;25:33-35.
202
195. Jareborg N, Durbin, R. Alfresco--a workbench for comparative genomic sequence
analysis, Genome Res 2000;10:1148-1157.
196. Moult J. A decade of CASP: progress, bottlenecks and prognosis in protein structure
prediction, Curr Opin Struct Biol 2005;15:285-289.
197. Lee S, Lee, B.C. and Kim, D. Prediction of protein secondary structure content using
amino acid composition and evolutionary information, Proteins 2006;62:1107-1114.
198. Al-Lazikani B, Jung, J., Xiang, Z. and Honig, B. Protein structure prediction, Curr
Opin Chem Biol 2001;5:51-56.
199. Chen CP, Kernytsky, A. and Rost, B. Transmembrane helix predictions revisited,
Protein Sci 2002;11:2774-2791.
200. Lichtarge O, Bourne, H.R. and Cohen, F.E. An evolutionary trace method defines
binding surfaces common to protein families, J Mol Biol 1996;257:342-358.
201. Brelivet Y, Kammerer, S., Rochel, N., Poch, O. and Moras, D. Signature of the
oligomeric behaviour of nuclear receptors at the sequence and structural level, EMBO Rep
2004;5:423-429.
202. Jossinet F, Westhof, E. Sequence to Structure (S2S): display, manipulate and
interconnect RNA data from sequence to structure, Bioinformatics 2005;21:3320-3321.
203. Zuker M. On finding all suboptimal foldings of an RNA molecule, Science
1989;244:48-52.
204. Shapiro BA, Kasprzak, W. STRUCTURELAB: a heterogeneous bioinformatics
system for RNA structure analysis, J Mol Graph 1996;14:194-205, 222-194.
205. Bonneau R, Strauss CE, Baker D. Improving the performance of Rosetta using
multiple sequence alignment information and global measures of hydrophobic core formation,
Proteins 2001;43:1-11.
206. Pazos F, Valencia, A. Similarity of phylogenetic trees as indicator of protein-protein
interaction, Protein Eng 2001;14:609-614.
207. Kim Y, Subramaniam, S. Locally defined protein phylogenetic profiles reveal
previously missed protein interactions and functional relationships, Proteins 2006;62:1115-
1124.

203
208. Pazos F, Helmer-Citterich, M., Ausiello, G. and Valencia, A. Correlated mutations
contain information about protein-protein interaction, J Mol Biol 1997;271:511-523.
209. Pazos F, Valencia, A. In silico two-hybrid system for the selection of physically
interacting protein pairs, Proteins 2002;47:219-227.
210. Ramensky V, Bork, P., Sunyaev, S. Human non-synonymous SNPs: server and
survey, Nucleic Acids Res. 2002 30:3894-3900.
211. Stenson PD, Ball, E.V., Mort, M., Phillips, A.D., Shiel, J.A., Thomas, N.S.,
Abeysinghe, S., Krawczak, M. and Cooper, D.N. Human Gene Mutation Database (HGMD):
2003 update, Hum Mutat 2003;21:577-581.
212. Bao L, Cui, Y. Prediction of the phenotypic effects of non-synonymous single
nucleotide polymorphisms using structural and evolutionary information, Bioinformatics
2005;21:2185-2190.
213. Gardezi SA, Nguyen, C., Malloy, P.J., Posner, G.H., Feldman, D. and Peleg, S. A
rationale for treatment of hereditary vitamin D-resistant rickets with analogs of 1 alpha,25-
dihydroxyvitamin D(3), J Biol Chem 2001;276:29148-29156.
214. Rochel N, Wurtz, J.M., Mitschler, A., Klaholz, B. and Moras, D. The crystal structure
of the nuclear receptor for vitamin D bound to its natural ligand, Mol Cell 2000;5:173-179.
215. Sankoff D. Minimal mutation trees of sequences., SIAM J. Appl. Math 1975 28:35-42.
216. Needleman SB, Wunsch, C.D. A general method applicable to the search for
similarities in the amino acid sequence of two proteins. J Mol Biol. 1970 48:443-453.
217. Lipman DJ, Altschul, S.F. and Kececioglu, J.D. A tool for multiple sequence
alignment, Proc Natl Acad Sci U S A 1989;86:4412-4415.
218. Feng DF, Doolittle, R.F. Progressive sequence alignment as a prerequisite to correct
phylogenetic trees, J Mol Evol 1987;25:351-360.
219. Barton GJ, Sternberg, M.J. A strategy for the rapid multiple alignment of protein
sequences. Confidence levels from tertiary structure comparisons, J Mol Biol 1987;198:327-
337.
220. Taylor WR. Multiple sequence alignment by a pairwise algorithm, Comput Appl
Biosci 1987;3:81-87.
204
221. Thompson JD, Higgins, D.G. and Gibson, T.J. CLUSTAL W: improving the
sensitivity of progressive multiple sequence alignment through sequence weighting, position-
specific gap penalties and weight matrix choice, Nucleic Acids Res 1994;22:4673-4680.
222. Sneath PHA, Sokal, R.R. Numerical taxonomy - the principles and practice of
numerical classification, W. H. Freeman: San Francisco 1973.
223. Saitou N, Nei, M. The neighbor-joining method: a new method for reconstructing
phylogenetic trees, Mol Biol Evol 1987;4:406-425.
224. Smith RF, Smith, T.F. Pattern-induced multi-sequence alignment (PIMA) algorithm
employing secondary structure-dependent gap penalties for use in comparative protein
modelling, Protein Eng 1992;5:35-41.
225. Hein J. Unified approach to alignment and phylogenies, Methods Enzymol
1990;183:626-645.
226. Eddy SR. Profile hidden Markov models, Bioinformatics 1998;14:755-763.
227. Lawrence CE, Altschul, S.F., Boguski, M.S., Liu, J.S., Neuwald, A.F. and Wootton,
J.C. Detecting subtle sequence signals: a Gibbs sampling strategy for multiple alignment,
Science 1993;262:208-214.
228. Notredame C, Higgins, D.G. SAGA: sequence alignment by genetic algorithm,
Nucleic Acids Res 1996;24:1515-1524.
229. Gotoh O. Significant improvement in accuracy of multiple protein sequence
alignments by iterative refinement as assessed by reference to structural alignments, J Mol
Biol 1996;264:823-838.
230. Morgenstern B, Dress, A. and Werner, T. Multiple DNA and protein sequence
alignment based on segment-to-segment comparison, Proc Natl Acad Sci U S A
1996;93:12098-12103.
231. Thompson JD, Plewniak, F. and Poch, O. BAliBASE: a benchmark alignment
database for the evaluation of multiple alignment programs, Bioinformatics 1999;15:87-88.
232. Gardner PP, Wilm, A. and Washietl, S. A benchmark of multiple sequence alignment
programs upon structural RNAs, Nucleic Acids Res 2005;33:2433-2439.

205
233. Thompson JD, Plewniak, F., Thierry, J. and Poch, O. DbClustal: rapid and reliable
global multiple alignments of protein sequences detected by database searches, Nucleic Acids
Res 2000;28:2919-2926.
234. Notredame C, Higgins, D.G. and Heringa, J. T-Coffee: A novel method for fast and
accurate multiple sequence alignment, J Mol Biol 2000;302:205–217.
235. Katoh K, Misawa, K., Kuma, K. and Miyata, T. MAFFT: a novel method for rapid
multiple sequence alignment based on fast Fourier transform, Nucleic Acids Res.
2002;30:3059-3066.
236. Edgar RC. MUSCLE: multiple sequence alignment with high accuracy and high
throughput, Nucleic Acids Res. 2004;32:1792-1797.
237. Do CB, Mahabhashyam, M.S., Brudno, M. and Batzoglou, S. ProbCons: Probabilistic
consistency-based multiple sequence alignment, Genome Res. 2005;15:330-340.
238. O’Sullivan O, Suhre, K., Abergel, C., Higgins, D.G. and Notredame, C. 3DCoffee:
combining protein sequences and structures within multiple sequence alignments, J. Mol.
Biol. 2004;340:385–395.
239. Dayhoff MO, Schwartz, R.M. and Orcutt, B.C. A model of evolutionary change in
proteins, In "Atlas of Protein Sequence and Structure." National Biomedical Research
Foundation 1978: 345-352.
240. Luthy R, McLachlan, A. D. and Eisenberg, D. Secondary structure-based profiles: use
of structure-conserving scoring tables in searching protein sequence databases for structural
similarities, Proteins 1991;10:229-239.
241. Ng PC, Henikoff, J.G. and Henikoff, S. PHAT: a transmembrane-specific substitution
matrix. Predicted hydrophobic and transmembrane, Bioinformatics 2000;16:760-766.
242. Benner SA, Cohen, M. A. and Gonnet, G. H. Empirical and structural models for
insertions and deletions in the divergent evolution of proteins, J Mol Biol 1993;229:1065-
1082.
243. Thompson JD. Introducing variable gap penalties to sequence alignment in linear
space., Comput Appl Biosci. 1995;11:181-186.
206
244. Doolittle RF. Of URFs and ORFs: a primer on how to analyze derived amino acid
sequences., University Science Books, Mill Valley California. 1986.
245. Altschul SF, Gish, W. Local alignment statistics, Methods Enzymol 1996;266:460-
480.
246. Pearson WR. Empirical statistical estimates for sequence similarity searches, J Mol
Biol 1998;276:71-84.
247. Notredame C, Holm, L. and Higgins, D.G. COFFEE: an objective function for
multiple sequence alignments, Bioinformatics 1998;14:407-422.
248. Hertz GZ, Stormo, G.D. Identifying DNA and protein patterns with statistically
significant alignments of multiple sequences, Bioinformatics 1999;15:563-577.
249. Thompson JD, Plewniak, F., Ripp, R., Thierry, J.C. and Poch, O. Towards a reliable
objective function for multiple sequence alignments, J Mol Biol 2001;314:937-951.
250. Livingstone CD, Barton, G.J. Protein sequence alignments: a strategy for the
hierarchical analysis of residue conservation, Comput Appl Biosci 1993;9:745-756.
251. Pei J, Grishin, N.V. AL2CO: calculation of positional conservation in a protein
sequence alignment, Bioinformatics 2001;17:700-712.
252. Rodi DJ, Mandava, S. and Makowski, L. DIVAA: analysis of amino acid diversity in
multiple aligned protein sequences, Bioinformatics 2004;20:3481-3489.
253. Smagala JA, Dawson, E D., Mehlmann, M., Townsend, M.B., Kuchta, R.D. and
Rowlen, K.L. ConFind: a robust tool for conserved sequence identification, Bioinformatics
2005;21:4420-4422.
254. Lassmann T, Sonnhammer, E.L. Automatic assessment of alignment quality, Nucleic
Acids Res 2005;33:7120-7128.
255. Sim SE, Easterbrook, S. and Holt, R.C. Using benchmarking to advance research: a
challenge to software engineering, 25th International Conference on Software Engineering
2003 74-83.
256. McClure MA, Vasi, T.K. and Fitch, W.M. Comparative analysis of multiple protein-
sequence alignment methods, Mol Biol Evol 1994;11:571-592.
207
257. Bahr A, Thompson, J. D., Thierry, J.C. and Poch, O. BAliBASE (Benchmark
Alignment dataBASE): enhancements for repeats, transmembrane sequences and circular
permutations, Nucleic Acids Res 2001;29:323-326.
258. Raghava GP, Searle, S.M., Audley, P.C., Barber, J.D. and Barton, G.J. OXBench: a
benchmark for evaluation of protein multiple sequence alignment accuracy, BMC
Bioinformatics 2003;4:47.
259. Van Walle I, Lasters, I. and Wyns, L. SABmark--a benchmark for sequence alignment
that covers the entire known fold space, Bioinformatics 2005;21:1267-1268.
260. Van Walle I, Lasters, I. and Wyns, L. Align-m--a new algorithm for multiple
alignment of highly divergent sequences, Bioinformatics 2004;20:1428-1435.
261. Mizuguchi K, Deane, C. M., Blundell, T. L. and Overington, J. P. HOMSTRAD: a
database of protein structure alignments for homologous families, Protein Sci 1998;7:2469-
2471.
262. Blackshields G, Wallace, I.M., Larkin, M. and Higgins, D.G. Analysis and comparison
of benchmarks for multiple sequence alignment, In Silico Biol 2006;6:321-339.
263. Thompson JD, Plewniak, F. and Poch, O. A comprehensive comparison of multiple
sequence alignment programs, Nucleic Acids Res. 1999 27:2682-2690.
264. Butler BA. Sequence analysis using GCG, Methods Biochem Anal 1998;39:74-97.
265. Etzold T, Ulyanov, A. and Argos, P. SRS: information retrieval system for molecular
biology data banks, Meth Enzymol 1996;266:114–128.
266. Wu CH, Apweiler, R., Bairoch, A., Natale, D.A., Barker, W.C., Boeckmann, B.,
Ferro, S., Gasteiger, E., Huang, H., Lopez, R., Magrane, M., Martin, M.J., Mazumder, R.,
O'Donovan, C., Redaschi, N. and Suzek, B. The Universal Protein Resource (UniProt): an
expanding universe of protein information, Nucleic Acids Res 2006;34:D187-191.
267. Kouranov A, Xie, L., de la Cruz, J., Chen, L., Westbrook, J., Bourne, P.E. and
Berman, H.M. The RCSB PDB information portal for structural genomics, Nucleic Acids Res
2006;34:D302-305.
208
268. Bateman A, Coin, L., Durbin, R., Finn, R.D., Hollich, V., Griffiths-Jones, S., Khanna,
A., Marshall, M., Moxon, S., Sonnhammer, E.L., Studholme, D.J., Yeats, C. and Eddy, S.R.
The Pfam protein families database, Nucleic Acids Res 2004;32:D138-141.
269. Bru C, Courcelle, E., Carrere, S., Beausse, Y., Dalmar, S. and Kahn, D. The ProDom
database of protein domain families: more emphasis on 3D, Nucleic Acids Res
2005;33:D212-215.
270. Letunic I, Copley, R.R., Pils, B., Pinkert, S., Schultz, J. and Bork, P. SMART 5:
domains in the context of genomes and networks, Nucleic Acids Res 2006;34:D257-260.
271. Subramanian AR, Kaufmann, M. and Morgenstern, B. DIALIGN-TX: greedy and
progressive approaches for segment-based multiple sequence alignment, Algorithms Mol Biol
2008;3:6.
272. Wallace IM, O'Sullivan, O. and Higgins, D.G. Evaluation of iterative alignment
algorithms for multiple alignment, Bioinformatics 2005;21:1408-1414.
273. Kimura M. The Neutral Theory of Molecular Evolution Cambridge: Cambridge
University Press 1983.
274. Wu SaM, U. . Fast text searching allowing errors, Commun. ACM 1992;35:83-91.
275. Thompson JD, Muller, A., Waterhouse, A., Procter, J., Barton, G. J., Plewniak, F. and
Poch, O. MACSIMS: multiple alignment of complete sequences information management
system, BMC Bioinformatics 2006;7:318.
276. Holland RC, Down, T.A., Pocock, M., Prlić, A., Huen, D., James, K., Foisy, S.,
Dräger, A., Yates, A., Heuer, M. and Schreiber, M.J. BioJava: an open-source framework for
bioinformatics, Bioinformatics 2008;24:2096-2097.
277. Quinlan JR. Induction of decision trees., Mach. Learn. 1986; 1:81-106.
278. Fan W, Wang, H., Yu, P.S. and Ma, S. . Is random model better? On its accuracy and
efficiency, Proceedings of the Third IEEE International Conference on Data Mining 2003:51-
58.
279. Breiman L. Random forests, Mach. Learning 2001;45:5-32.
280. Ferrucci D, Lally, A. UIMA: an architectural approach to unstructured information
processing in the corporate research environment, Nat. Lang. Eng. 2004;10:327-348.
209
281. Kano Y, Baumgartner, W.A., Jr., McCrohon, L., Ananiadou, S., Cohen, K.B., Hunter,
L. and Tsujii, J. U-Compare: share and compare text mining tools with UIMA, Bioinformatics
2009;25:1997-1998.
282. Plewniak F, Thompson, J.D. and Poch, O. Ballast: blast post-processing based on
locally conserved segments, Bioinformatics 2000;16:750-759.
283. Thompson JD, Prigent, V. and Poch, O. LEON: multiple aLignment Evaluation Of
Neighbours, Nucleic Acids Res 2004;32:1298-1307.
284. Sammeth M, Heringa, J. Global multiple-sequence alignment with repeats, Proteins
2006;64:263-274.
285. Krogh A, Larsson, B., von Heijne, G. and Sonnhammer, E. L. Predicting
transmembrane protein topology with a hidden Markov model: application to complete
genomes, J Mol Biol 2001;305:567-580.
286. Kall L, Krogh, A. and Sonnhammer, E. L. A combined transmembrane topology and
signal peptide prediction method, J Mol Biol 2004;338:1027-1036.
287. Henikoff S, Henikoff,J. Amino acid substitution matrices from protein blocks, Proc.
Natl Acad. Sci. 1992;89,:10915-10919.
288. Di Tommaso P, Orobitg, M., Guirado, F., Cores, F., Espinosa, T. and Notredame, C.
Cloud-Coffee: Implementation of a parallel consistency-based multiple alignment algorithm
in the T-Coffee package and its benchmarking on the Amazon Elastic-Cloud, Bioinformatics
2010.
289. Wagener J, Spjuth O, Willighagen EL et al. XMPP for cloud computing in
bioinformatics supporting discovery and invocation of asynchronous web services, BMC
Bioinformatics 2009;10:279.

210
Appendix