module-7: experimental hypersonic test facilities and...
TRANSCRIPT

NPTEL – Aerospace
Module-7: Experimental Hypersonic Test facilities and measurements
Lecture-31: Hypersonic wind tunnel
31.1 Hypersonic Test Facilities:
Hypersonic flow is a flow for which speeds are much larger than the local speed of
sound. In general hypersonic flow is defined as the flow at Mach 5 or greater at which
physical properties of the flow changes rapidly. A test facility designed or considered
for hypersonic testing should simulate the typical flow features of this flow regime.
These flow features include thin shock layer, entropy layer, viscous interaction and
most importantly high total or stagnation temperature of the flow. This section deals
with most common facilities for hypersonic testing.
31.2 Continuous Hypersonic Wind Tunnel
Continuous hypersonic wind tunnel is comprised of a compressor, heater, nozzle, test
section, diffuser, second throat and vacuum chamber as major components. Schematic
of such tunnel is as shown in Fig.31.1. During the experimental testing, continuous
operation can be achieved by providing continuously operating compressors. Such
high pressure air is then heated in the heater so as to reach the desired stagnation
temperature. Valve is then operated if sufficient low pressure is attained in the
vacuum chamber. Expansion of the air through the convergent divergent nozzle sets
the hypersonic flow in the test section. Onwards deceleration of the flow through the
second throat ensures the low speed air at the compressor inlet.
1. Heater 2.Valve 3.First Throat 4.Test section 5.Diffuser 6.Second throat 7.Valve
8.Vacuum Chamber 9.Vacuum pump 10. Multistage compressor
Fig. 31.1: Schematic diagram of continuous hypersonic wind tunnel circuit
Joint initiative of IITs and IISc – Funded by MHRD Page 1 of 36

NPTEL – Aerospace
31.2.1 Heaters
Condensation free hypersonic expansion of air requires high stagnation temperatures
as per the Mach number attained in the test section. In the conventional hypersonic
tunnels different types of heater are used to provide the appropriate temperature. The
combustion, the electric resistance and the arc-jet type heaters are suitable for
continuous or long duration operation. Industrial heaters where air is heated using
combustion products are generally preferred up to Mach 8. Resistance wire electric
heaters are used to provide for Mach numbers up to 12 to 14. Ceramic materials or
special alloys provide support for the heating elements in this heater. Nitrogen is used
as the working fluid for high stagnation conditions with direct electric resistance
heating because of serious oxidation rates. Direct electric arc heating of the working
fluid is used in arc-jet heaters. The moderate stagnation temperatures (<5500° K) for
nitrogen freestream are obtained with such type of heaters.
31.2.2 Hypersonic Nozzles
Convergent divergent axi-symmetric nozzles are generally preferred in the hypersonic
tunnels. These nozzles expand the high pressure and high temperature air to the
desired Mach number in the test section. These nozzles can also be equipped contour
to ensure the uniformity of the flow in the test section. The throat of the nozzle needs
to be water-cooled for continuous and also for blow-down hypersonic tunnels
operating at high stagnation temperatures or high enthalpy conditions. Frequent
change of the throat is also encountered for such high enthalpy operations. Beryllium-
copper is often used for the throat liners material to provide strength with high heat
conductivity. In an alternative design, the throat liner, made of titanium, zirconium
and molybdenum alloy, is cooled by working gas (air or nitrogen) before its entry in
to the heater.
Joint initiative of IITs and IISc – Funded by MHRD Page 2 of 36
NPTEL – Aerospace
31.2.3 Hypersonic Diffuser
Typical hypersonic tunnel diffuser is comprised of fixed contraction followed by a
constant area diffuser duct. This contraction reduces the flow Mach number. A
complex three dimensional shock pattern executes this Mach number reduction. These
shock waves interact with the boundary layer during the process. This region is
followed by a subsonic flow where deceleration takes place in a divergent section.
Diffuser design is very important for the continuous closed circuit wind tunnels due to
its dependence on compressor characteristics and drive power. However the design of
diffuser for the impulse type facilities is carried out mainly to evaluate the useful test
time.
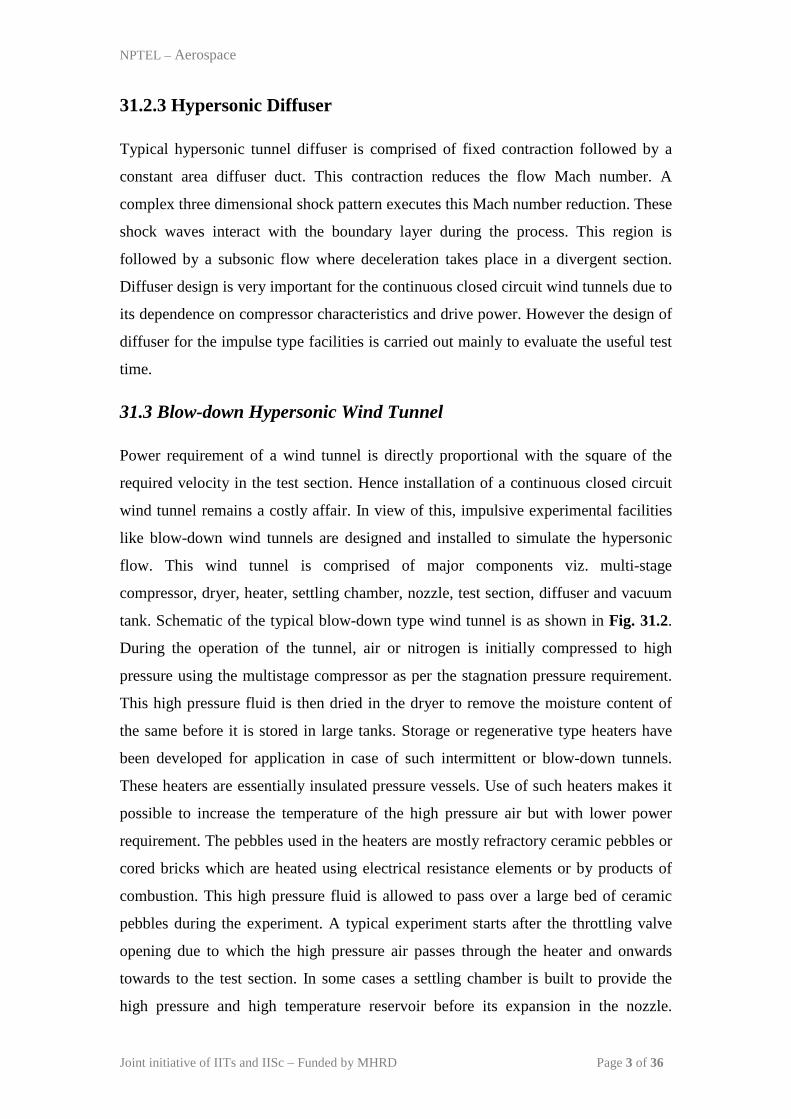
31.3 Blow-down Hypersonic Wind Tunnel
Power requirement of a wind tunnel is directly proportional with the square of the
required velocity in the test section. Hence installation of a continuous closed circuit
wind tunnel remains a costly affair. In view of this, impulsive experimental facilities
like blow-down wind tunnels are designed and installed to simulate the hypersonic
flow. This wind tunnel is comprised of major components viz. multi-stage
compressor, dryer, heater, settling chamber, nozzle, test section, diffuser and vacuum
tank. Schematic of the typical blow-down type wind tunnel is as shown in Fig. 31.2.
During the operation of the tunnel, air or nitrogen is initially compressed to high
pressure using the multistage compressor as per the stagnation pressure requirement.
This high pressure fluid is then dried in the dryer to remove the moisture content of
the same before it is stored in large tanks. Storage or regenerative type heaters have
been developed for application in case of such intermittent or blow-down tunnels.
These heaters are essentially insulated pressure vessels. Use of such heaters makes it
possible to increase the temperature of the high pressure air but with lower power
requirement. The pebbles used in the heaters are mostly refractory ceramic pebbles or
cored bricks which are heated using electrical resistance elements or by products of
combustion. This high pressure fluid is allowed to pass over a large bed of ceramic
pebbles during the experiment. A typical experiment starts after the throttling valve
opening due to which the high pressure air passes through the heater and onwards
towards to the test section. In some cases a settling chamber is built to provide the
high pressure and high temperature reservoir before its expansion in the nozzle.
Joint initiative of IITs and IISc – Funded by MHRD Page 3 of 36
NPTEL – Aerospace
Expansion of the gas in the nozzle attains the required hypersonic freestream
conditions in the nozzle. Higher temperature values of the flow in the test section are
preferred to prevent the liquefaction of the air as it expands to very low temperatures
in the nozzle.
1. Multistage compressor 2.Dryer 3.High pressure air storage 4.Gas inlet 5. Refractory
pebbles 6.Start valve 7.Nozzle with throat cooling apparatus 8.Test section 9.Diffuser
second throat 10.Valve 11.Vacuum Chamber 12. Vacuum pump
Fig. 31.2: Schematic drawing of the blow-down hypersonic wind tunnel circuit
Joint initiative of IITs and IISc – Funded by MHRD Page 4 of 36
NPTEL – Aerospace
Lecture-32: Hypersonic wind tunnel and its calibration
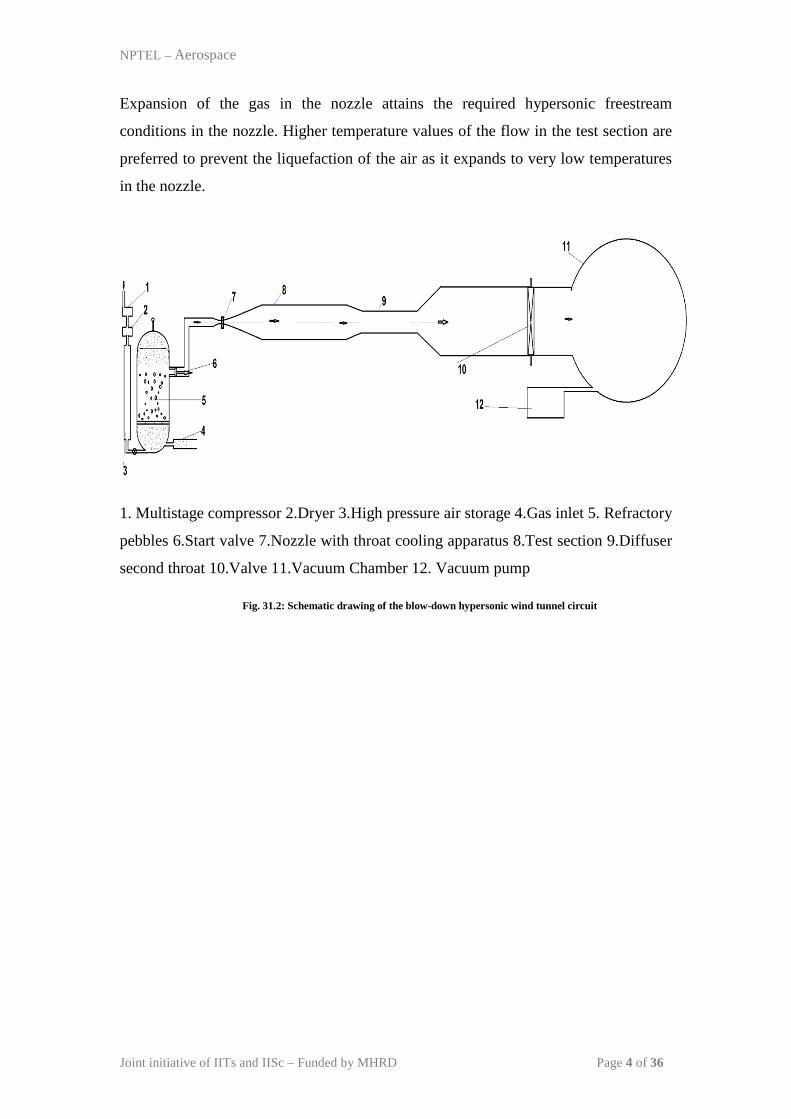
32.1 Nitrogen Wind Tunnel
It is a blow-down wind tunnel operated with high pressure Nitrogen gas. Hence the
arrangement of this tunnel is same as that of a blow-down wind tunnel (Fig. 32.1).
The high pressure Nitrogen gas is initially heated by a graphite resistance heater
contained within a pressure vessel and then allowed to expand through the nozzle.
Experimental duration in these tunnels is in the range of 1 to 4 seconds. Nitrogen
wind tunnels also operate between two temperature limits discussed herein. The lower
limit on temperature is essentially to avoid condensation effects in the test section,
and the upper limit on the temperature is necessarily governed by the heater. Two
servo-systems are installed for two reasons viz. controlling the gas flow to maintain a
constant stagnation pressure and ensuring a constant current through the heater which
effectively controls the stagnation temperature.
1.High pressure vessel 2.Graphite resistance heater 3.Nozzle with water cooling at
throat 4.Multistage compressor 5.Test section 6.Diffuser Second throat 7.Valve
8.Vacuum Chamber 9.Vacuum pump
Fig 32.1: Schematic drawing of Nitrogen wind tunnel circuit
Joint initiative of IITs and IISc – Funded by MHRD Page 5 of 36
NPTEL – Aerospace
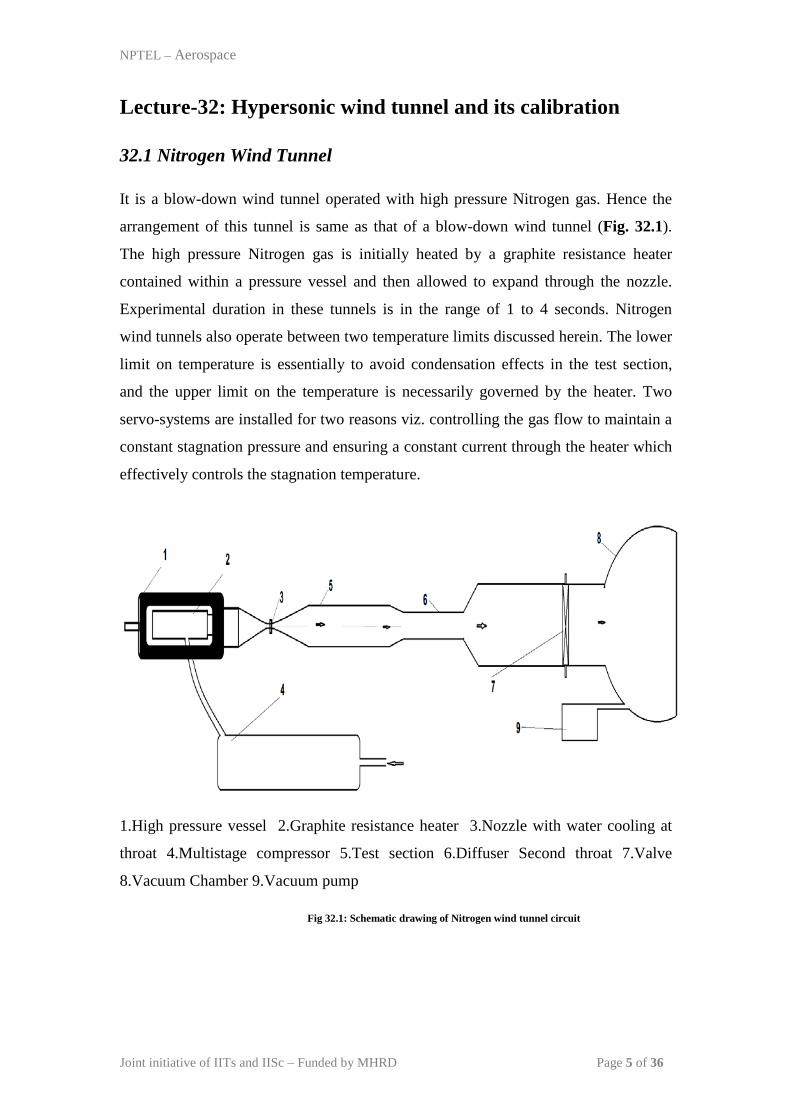
32.2 Continuous Tunnel or Arc Jet Wind Tunnels
This wind tunnel type is used to simulate the hypersonic, hypervelocity and high
enthalpy airflows that are experienced by space flights during atmospheric re-entry
and also to provide the insight for real gas effect aerodynamics for design of thermal
protection system. This tunnel is from the realm of blow-down tunnel where heating
of the test gas is carried out using electric heaters. These heaters are placed in the
pressure vessel containing high pressure test gas. Copper electrodes with water
cooling arrangement are used to enhance the life of the electrode. The high pressure
electrically heated test gas is then passed through the convergent divergent nozzle to
attain the required Mach number in the test section.
1. Multistage compressor 2. Arc-jet heater 3.Nozzle with water cooling at throat
4.Test section 5.Diffuser Second throat 6.Valve 7.Vacuum Chamber 8.Vacuum pump
Fig. 32.2: Schematic drawing of Arc-Jet wind tunnel circuit
Joint initiative of IITs and IISc – Funded by MHRD Page 6 of 36
NPTEL – Aerospace
32.3. Flow Parameter Estimations for a Wind Tunnel.
Following techniques can be used to estimate the hypersonic flow parameters in the
test section when the wind tunnel is used to simulate the hypersonic Mach number
and corresponding Reynolds number.
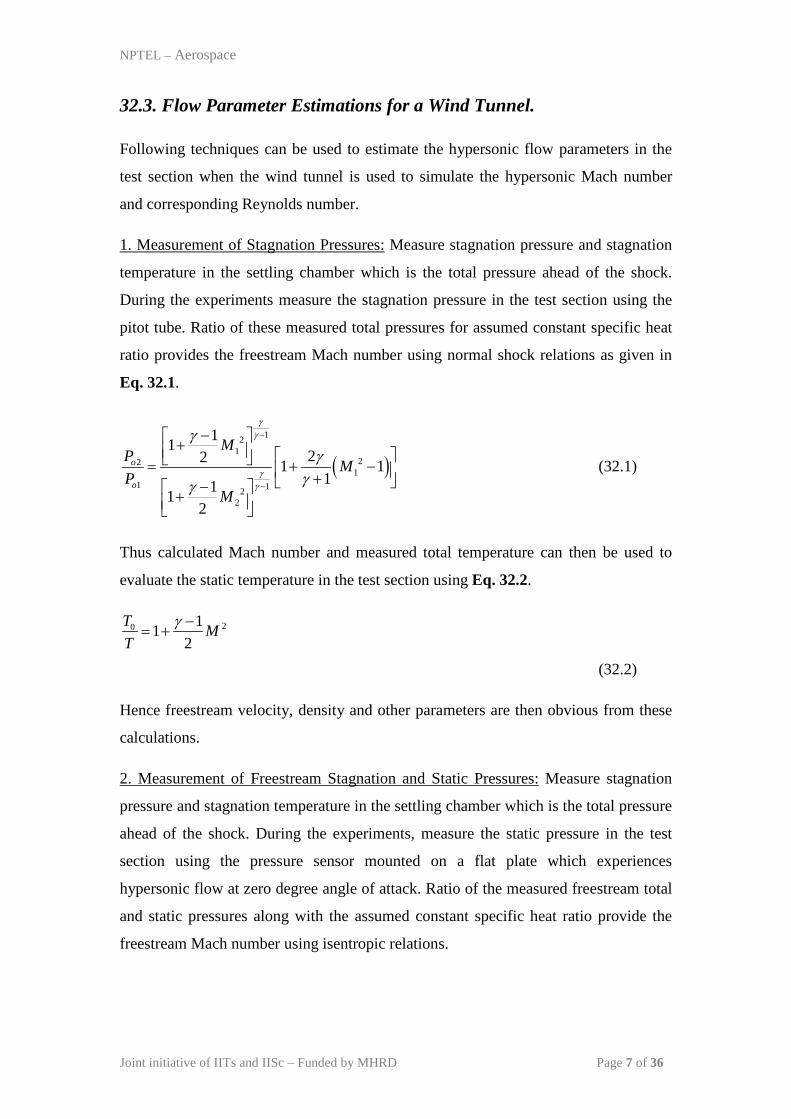
1. Measurement of Stagnation Pressures: Measure stagnation pressure and stagnation
temperature in the settling chamber which is the total pressure ahead of the shock.
During the experiments measure the stagnation pressure in the test section using the
pitot tube. Ratio of these measured total pressures for assumed constant specific heat
ratio provides the freestream Mach number using normal shock relations as given in
Eq. 32.1.
( )12
122
11 12
2
1122 1 1
1112
o
o
MP MP
M
γγ
γγ
γγ
γγ
−
−
− + = + − + − +
(32.1)
Thus calculated Mach number and measured total temperature can then be used to
evaluate the static temperature in the test section using Eq. 32.2.
20 112
T MT
γ −= +
(32.2)
Hence freestream velocity, density and other parameters are then obvious from these
calculations.
2. Measurement of Freestream Stagnation and Static Pressures: Measure stagnation
pressure and stagnation temperature in the settling chamber which is the total pressure
ahead of the shock. During the experiments, measure the static pressure in the test
section using the pressure sensor mounted on a flat plate which experiences
hypersonic flow at zero degree angle of attack. Ratio of the measured freestream total
and static pressures along with the assumed constant specific heat ratio provide the
freestream Mach number using isentropic relations.
Joint initiative of IITs and IISc – Funded by MHRD Page 7 of 36
NPTEL – Aerospace
120 112
P MP
γγγ − − = +
(32.3)
Thus calculated Mach number and measured total temperature can then be used to
evaluate the static temperature in the test section. Hence freestream velocity, density
and other parameters are then obvious from these calculations.
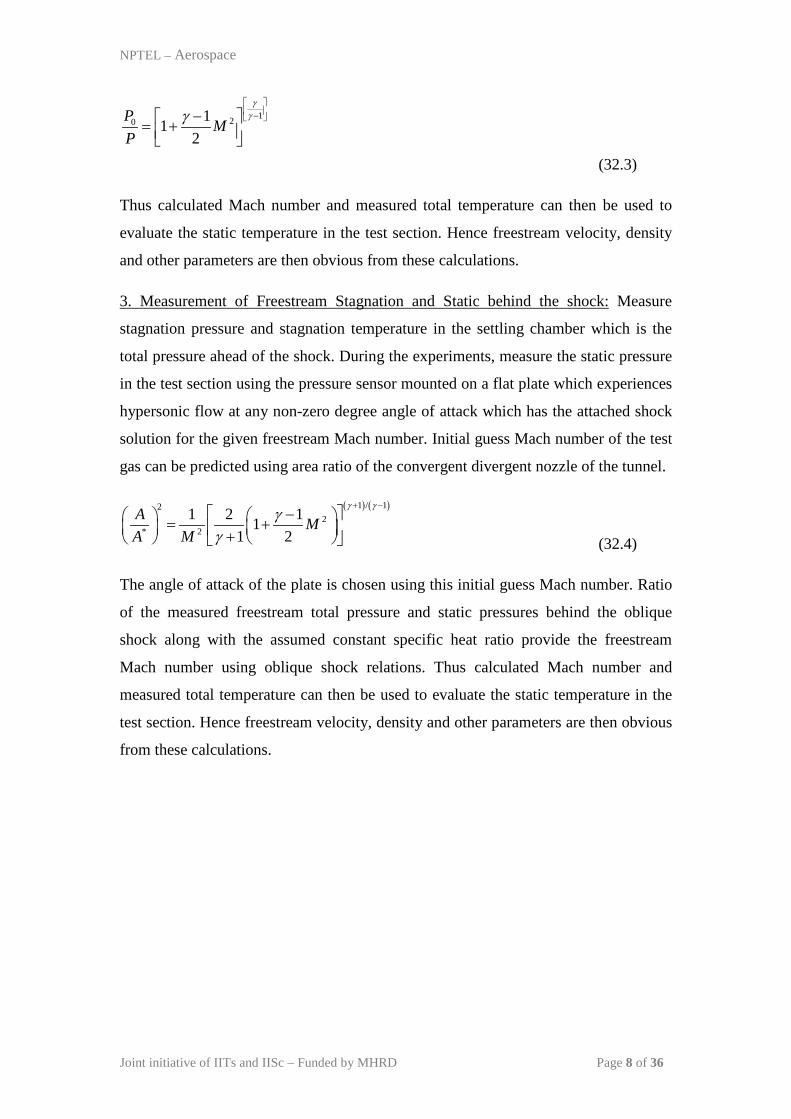
3. Measurement of Freestream Stagnation and Static behind the shock: Measure
stagnation pressure and stagnation temperature in the settling chamber which is the
total pressure ahead of the shock. During the experiments, measure the static pressure
in the test section using the pressure sensor mounted on a flat plate which experiences
hypersonic flow at any non-zero degree angle of attack which has the attached shock
solution for the given freestream Mach number. Initial guess Mach number of the test
gas can be predicted using area ratio of the convergent divergent nozzle of the tunnel.
( ) ( )1 / 122
* 2
1 2 111 2
A MA M
γ γγ
γ
+ − − = + + (32.4)
The angle of attack of the plate is chosen using this initial guess Mach number. Ratio
of the measured freestream total pressure and static pressures behind the oblique
shock along with the assumed constant specific heat ratio provide the freestream
Mach number using oblique shock relations. Thus calculated Mach number and
measured total temperature can then be used to evaluate the static temperature in the
test section. Hence freestream velocity, density and other parameters are then obvious
from these calculations.
Joint initiative of IITs and IISc – Funded by MHRD Page 8 of 36
NPTEL – Aerospace
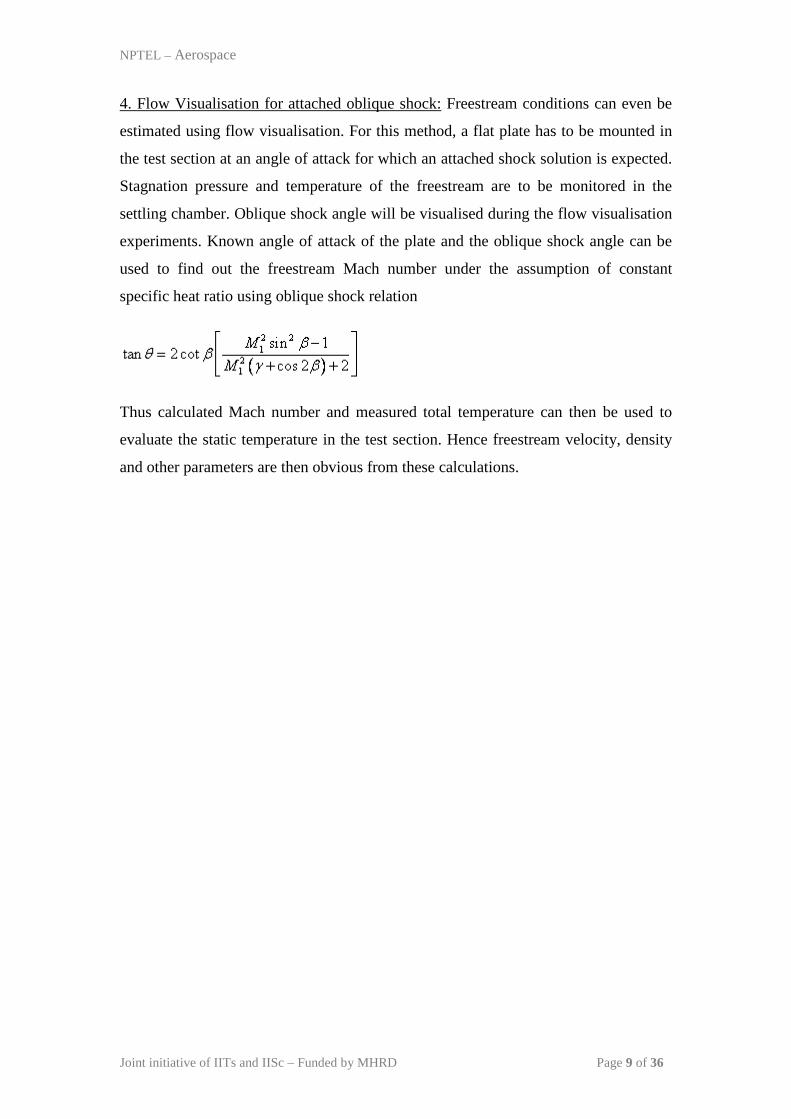
4. Flow Visualisation for attached oblique shock: Freestream conditions can even be
estimated using flow visualisation. For this method, a flat plate has to be mounted in
the test section at an angle of attack for which an attached shock solution is expected.
Stagnation pressure and temperature of the freestream are to be monitored in the
settling chamber. Oblique shock angle will be visualised during the flow visualisation
experiments. Known angle of attack of the plate and the oblique shock angle can be
used to find out the freestream Mach number under the assumption of constant
specific heat ratio using oblique shock relation
Thus calculated Mach number and measured total temperature can then be used to
evaluate the static temperature in the test section. Hence freestream velocity, density
and other parameters are then obvious from these calculations.
Joint initiative of IITs and IISc – Funded by MHRD Page 9 of 36

NPTEL – Aerospace
Lecture-33: Hypersonic impulse facilities
33.1 Impulse Test Facilities
There are many experimental facilities (like hypersonic wind tunnels, hypersonic
shock tunnels etc.) available around the world to simulate the hypersonic flows. The
facilities like wind tunnels are the comparatively long duration facilities, where test
time is of the order of few seconds. The power to drive a wind tunnel is directly
proportional to cube of the velocity. Although this rule does not hold in case of high-
speed flow regimes, the need for rapidly increasing power still remains a fact. Still the
simulation of high Mach number flows can be done in long duration test facilities like
hypersonic wind tunnels but it is very expensive and difficult to simulate flows with
higher energy content in such facilities. Also in the wind tunnels, it is difficult to shift
from the conventional test gas (air) to any other test gas. Hence it becomes difficult to
simulate the flow conditions in the Martian environment, which is predominantly
carbon dioxide. The impulse facilities or short duration test facilities of test duration
varying from few tens of microseconds to few milliseconds are invented and designed
to reduce the experimental cost and to make it possible to conduct the experiments for
hypersonic or hyper-velocity situations. Most of such facilities have their basics in
shock tube.
33.2 Shock Tube
The shock tube is a simple tube closed at both ends. A metallic or non-metalic
diaphragm is used to divide this duct into two compartments called as driver and
driven sections of the shock tube. Driver section is a high pressure section which
contains the high pressure gas and that gas. Driven section is a low pressure section
which contains the low pressure driven or test gas. In this section pressure transducers
are mounted to measure the pressure variation with time at particular location during
the experiments. Schematic of a typical shock tube along with the initial pressure
distribution is as shown in Fig. 33.1
Joint initiative of IITs and IISc – Funded by MHRD Page 10 of 36

NPTEL – Aerospace
Fig. 33.1. Schematic of a typical shock tube and initial pressure distribution.
During operation of the shock tube, a metallic or non-metallic diaphragm is placed
between driver and driven sections. Driven section is then filled with the test gas and
then evacuated to a desired lower pressure. Driver section is then continuously filled
with the low molecular weight driver gas, till the pressure in this section rises to a
value which leads to burst the diaphragm. The diaphragm burst creates compression
waves which propagate downstream in the driven section and the expansion waves
traversing upstream in the driver section. All the compression waves travelling in the
driven section coalesce to form a shock which then travels in the driven section.
Travel of this primary shock in the driven section raises the pressure and temperature
of the test gas. This increase in pressure can be monitored using pressure sensors
mounted in the driven sections. The initial stagnant test gas or driver gas then passes
behind the primary shock. The Mach number of this gas depends on the strength of
Joint initiative of IITs and IISc – Funded by MHRD Page 11 of 36
NPTEL – Aerospace
the shock and can attain supersonic speed in the presence of strong primary shock.
Driver gas at the same time undergoes the expansion in the presence of expansion
waves. However, the driver and driven gases do not mix in each other due to the
presence of contact surface or discontinuity which moves in the driven section behind
the primary shock. The pressure and velocity are same across the contact surface.
Expansion fan and shock reflect from the closed ends of the shock tube. Reflected
shock again passes through the driver gas however it nullifies the momentum making
the gas stagnant. Thus driven section end of the shock tube momentarily acts as a
reservoir for high temperature and high pressure test gas. The strength of the shock
wave and expansion fan thus produced depends on the many parameters viz. initial
pressure ratio across the diaphragm, physical properties of the gases in the driver and
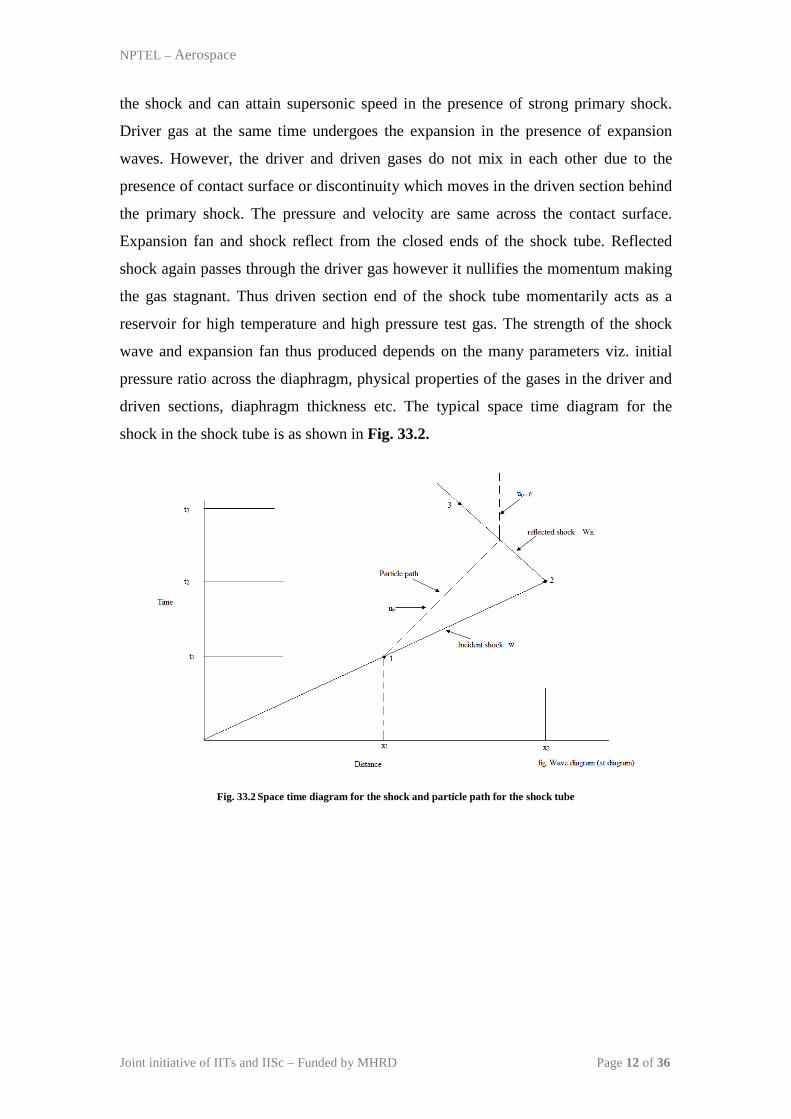
driven sections, diaphragm thickness etc. The typical space time diagram for the
shock in the shock tube is as shown in Fig. 33.2.
Fig. 33.2 Space time diagram for the shock and particle path for the shock tube
Joint initiative of IITs and IISc – Funded by MHRD Page 12 of 36
NPTEL – Aerospace
33.3 Diaphragm-less Shock Tube
The above mentioned conventional shock tube has issues related with the operational
uncertainties. The main reason of the uncertainty is due to use of diaphragm to
operate the shock tube. Change in batch of diaphragm may change the diaphragm
material properties, thickness etc. which in turn changes the diaphragm rupture
pressure for same experimental conditions. The change in diaphragm rupture pressure
changes the primary shock strength and hence the stagnation conditions behind the
reflected shock. Hence a mechanism is invariantly thought for to replace the
diaphragm of the shock tube to reduce the uncertainty. In view of this a fast acting
valve is placed in place of the diaphragm which separates the driver and driven
sections of shock tube. Opening of such valve during the experiment operates the
shock tube. Rest operation of the diaphragm-less shock tube is same as that of the
conventional shock tube.
33.4 Combustion Driven Shock Tube
The shock tube explained earlier is the one where high pressure low temperature
driver gas is used to burst the diaphragm. However the strength of the primary shock
and hence the reflected shock depends on the temperature of driver gas for given
initial driven gas temperature. Hence other derivatives of shock tube are invented to
generate higher temperature and pressure at the end of driven end of the shock tube
which can then be facilitated in shock tunnel to simulate real gas effects.
Combustion driven shock tube has same configuration as that shown in Fig. 33.1.The
only difference lies is in the operation of this shock tube. The driver is filled with the
air and hydrogen along with the low molecular weight driver gas like helium. Spark
plugs are mounted in the driver section to initiate the combustion. Thus started
combustion raises pressure and temperature in the driver section which in tern bursts
the diaphragm. There onwards the operation of the shock tube is as explained earlier
in section 33.2. The increased driver gas temperature helps to increase the shock
strength.
Joint initiative of IITs and IISc – Funded by MHRD Page 13 of 36
NPTEL – Aerospace
Lecture 34: Shock Tunnel and its variants
34.1 Shock Tunnel
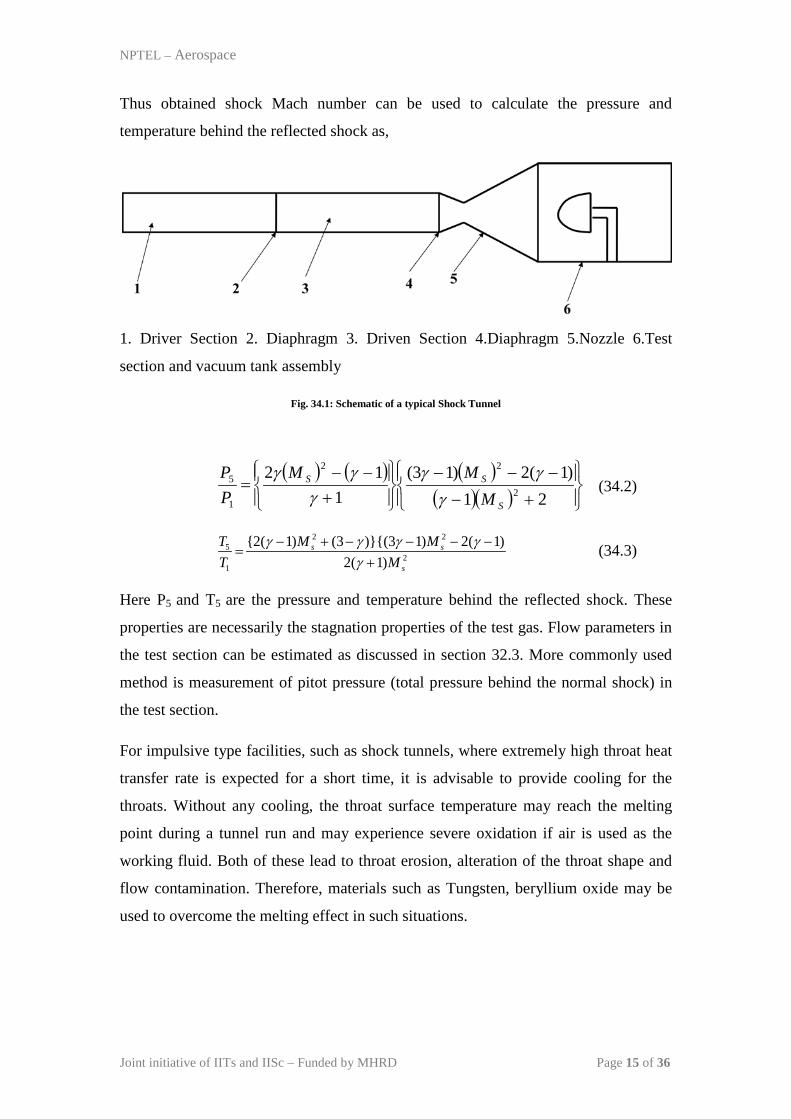
A typical shock tunnel is as shown in Fig. 34.1. It is very much clear from this figure
that, the shock tunnel is an obvious extension of shock tube. A conventional shock
tunnel is comprised of three sections viz. shock tube, nozzle and test section dump
tank assembly. Nozzle, test section and dump tank together are called as wind tunnel
part of the shock tunnel since these parts are similar to that seen in wind tunnel. The
driven section end of the shock tube is kept open and connected to the convergent
divergent nozzle. The convergent part of the nozzle is provided with minimal length
so as to provide the shock reflection. The other end of the nozzle is connected to the
test section and dump tank assembly. During the experiment, diaphragm is installed
between driver and driven sections of the shock tube. A paper diaphragm is put
between the driven section and nozzle. Desired driven or test gas is filled in the driven
section and pressure is adjusted using the vacuum pump connected to it. Lowest
possible pressure is attainted and then maintained in the test section and dump tank
assembly where instrumented test model is mounted. Driver section is then filled with
the driver gas till the metallic diaphragm ruptures. Usual shock tube operation persist
post diaphragm rupture. The reflected shock provides the high pressure and high
temperature test gas at the entry to the nozzle. Further expansion of the test gas in the
nozzle attains desired freestream conditions in the test section.
Pressure sensors mounted in the driven section give the pressure rise across the
primary shock. Primary shock Mach number can be calculated through measured
pressure and known specific heat ratio of the test gas using shock tube relations as,
( ) ( )
112 2
1
2
+−−
=γ
γγ SMPP
(34.1)
Here P1 and P2 are the pressure ahead and behind the moving primary shock, γ is the
specific heat ratio of driver gas and Ms is the primary shock Mach number.
Joint initiative of IITs and IISc – Funded by MHRD Page 14 of 36
NPTEL – Aerospace
Thus obtained shock Mach number can be used to calculate the pressure and
temperature behind the reflected shock as,
1. Driver Section 2. Diaphragm 3. Driven Section 4.Diaphragm 5.Nozzle 6.Test
section and vacuum tank assembly
Fig. 34.1: Schematic of a typical Shock Tunnel
( ) ( ) ( )
( )( )
+−
−−−
+−−
=21
)1(2)13(1
122
22
1
5
S
SS
MMM
PP
γγγ
γγγ
(34.2)
2 2
52
1
{2( 1) (3 )}{(3 1) 2( 1)2( 1)
s s
s
T M MT M
γ γ γ γγ
− + − − − −=
+ (34.3)
Here P5 and T5 are the pressure and temperature behind the reflected shock. These
properties are necessarily the stagnation properties of the test gas. Flow parameters in
the test section can be estimated as discussed in section 32.3. More commonly used
method is measurement of pitot pressure (total pressure behind the normal shock) in
the test section.
For impulsive type facilities, such as shock tunnels, where extremely high throat heat
transfer rate is expected for a short time, it is advisable to provide cooling for the
throats. Without any cooling, the throat surface temperature may reach the melting
point during a tunnel run and may experience severe oxidation if air is used as the
working fluid. Both of these lead to throat erosion, alteration of the throat shape and
flow contamination. Therefore, materials such as Tungsten, beryllium oxide may be
used to overcome the melting effect in such situations.
Joint initiative of IITs and IISc – Funded by MHRD Page 15 of 36

NPTEL – Aerospace
34.2 Modifications in Shock Tunnel
Shock tunnels are preferred over the wind tunnel mainly for two reasons viz. cost of
operation is low and flows with higher stagnation temperature can be simulated.
However the higher stagnation temperature of the flow solely depends on the primary
shock Mach number or stronger primary shock (Eq. 34.1). Hence higher shock speed
is the prime requirement for simulation of flows with higher stagnation temperature.
Higher shock speeds can be achieved by incorporating convergence from driver
section to driven section or by a convergent divergent diaphragm mounting station.
Moreover the strength of the primary shock can be increased with increase in driver to
driven gas pressure ratio and temperature ratio as shown in Eq. 34.4.
( )( ) ( )( )( )( )
24
4 1
21 1 1
1
1 1
1
2 2 ( 1) 1
14 2
1 1
42( 1)4
p p
p p
a pa p
ppγ
γγ
γ
γ γ
− −
−
+ + −
−−
=
(34.4)
Operation of the shock tunnel with combustion driven shock tube (section 33.4) is one
of the options for increase in driver to driven gas temperature ratio. The principle idea
behind using combustion is with regard to driver gas heating. However there are
numerous parallel ways investigated and reported in the literature. High enthalpy
freestream can also be achieved in the test section by heating the driver gas of the
shock tunnel by various methods viz. arc heating, shock heating and adiabatic
compression of driver gas. Arc heating of the driver gas is achieved by installing
electrodes in the driver section and string the arc across them. Thus generated arc
deposits energy in the driver gas which in turn raises the driver gas temperature. The
shock heating is carried out by using a double diaphragm shock tunnel. Schematic of
the double diaphragm shock tunnel is as shown in Fig. 34.2. This operates like a
conventional shock tunnel.
Joint initiative of IITs and IISc – Funded by MHRD Page 16 of 36
NPTEL – Aerospace
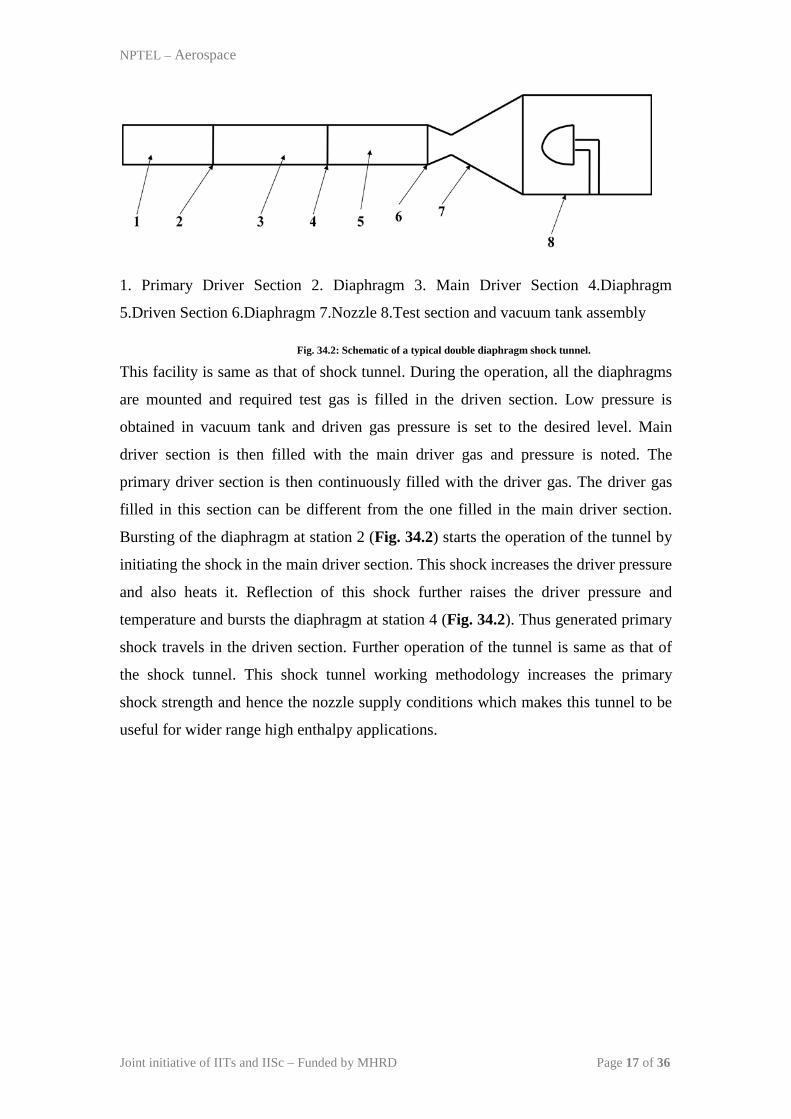
1. Primary Driver Section 2. Diaphragm 3. Main Driver Section 4.Diaphragm
5.Driven Section 6.Diaphragm 7.Nozzle 8.Test section and vacuum tank assembly
Fig. 34.2: Schematic of a typical double diaphragm shock tunnel.
This facility is same as that of shock tunnel. During the operation, all the diaphragms
are mounted and required test gas is filled in the driven section. Low pressure is
obtained in vacuum tank and driven gas pressure is set to the desired level. Main
driver section is then filled with the main driver gas and pressure is noted. The
primary driver section is then continuously filled with the driver gas. The driver gas
filled in this section can be different from the one filled in the main driver section.
Bursting of the diaphragm at station 2 (Fig. 34.2) starts the operation of the tunnel by
initiating the shock in the main driver section. This shock increases the driver pressure
and also heats it. Reflection of this shock further raises the driver pressure and
temperature and bursts the diaphragm at station 4 (Fig. 34.2). Thus generated primary
shock travels in the driven section. Further operation of the tunnel is same as that of
the shock tunnel. This shock tunnel working methodology increases the primary
shock strength and hence the nozzle supply conditions which makes this tunnel to be
useful for wider range high enthalpy applications.
Joint initiative of IITs and IISc – Funded by MHRD Page 17 of 36

NPTEL – Aerospace
Lecture 35: Piston based shock Tunnels
35.1 Free-Piston Driven Shock Tunnel
This experimental facility also has its trait in the shock tube and hence has working
principle similar to that of the shock tunnel. A typical free piston driven shock tunnel
consists of a high pressure gas reservoir (secondary reservoir), piston, compression
tube filled with driver gas, diaphragm, shock tube filled with driven gas or test gas,
nozzle, test section and dump tank connected to a vacuum system. Schematic of a
typical free piston driven reflected shock tunnel is shown in Fig. 35.1.
1. Secondary Reservoir 2. Piston 3. Compression tube 4. Diaphragm 5.Driven Section
or shock tube 6.Diaphragm 7.Nozzle 8.Test section and vacuum tank assembly
Fig. 35.1: Schematic of a typical free piston driven shock tunnel.
Here secondary reservoir is separated by the piston from the compression tube. A
metallic diaphragm separates the compression tube and shock tube or driven tube. The
paper diaphragm (also called as secondary diaphragm) is mounted between shock
tube and nozzle. Driver gas of required to the desired pressure level in the
compression tube and the shock tube is filled with the test gas of at required pressure
before conducting the experiment. Required vacuum is then obtained in the vacuum
tank and test section part by using a high efficiency vacuum pump. During the
experiment, sudden supply of the high pressure gas behind the piston sets it in motion
in the compression tube. Motion of heavy piston in the compression tube adiabatically
compresses the driver gas and in tern increases its pressure and temperature. This high
pressure and high temperature driver gas ruptures the metallic or primary diaphragm.
Rupture of the primary diaphragm produces a strong shock wave, which travels into
Joint initiative of IITs and IISc – Funded by MHRD Page 18 of 36
NPTEL – Aerospace
the driven section or the shock tube. This shock wave then reflects at end of the shock
tube and provides high pressure and high temperature gas at the nozzle entry.
Expansion of this gas through the nozzle produces the desired hypersonic flow in the
test section of the free piston driven shock tunnel.
There are various challenges to operate the free-piston driven shock tunnel.
Piston launch pressure in the secondary reservoir should be set judiciously so as to
maintain constant pressure to drive the primary shock and also to ensure soft landing
of piston at compression tube end. This adjustment of the piston launching pressure is
termed as the ‘tuning operation’ where soft landing is achieved along with
approximately constant driver pressure. Apart from the tuning operation, tailoring is
also important to achieve the longer test duration. Test time of this tunnel is of the
order of few milliseconds. Thus operated free-piston driven shock tunnel turns out to
be an important experimental facility for high enthalpy or re-entry simulations.
Joint initiative of IITs and IISc – Funded by MHRD Page 19 of 36
NPTEL – Aerospace
35.2 Gun Tunnel
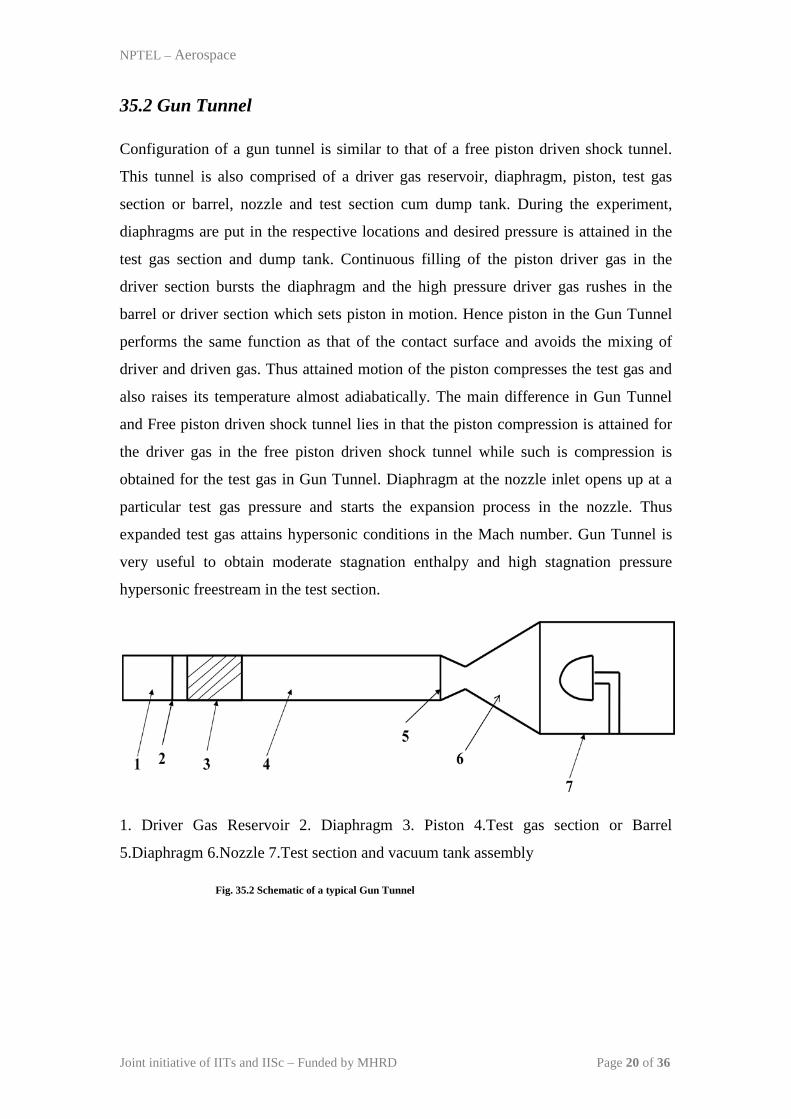
Configuration of a gun tunnel is similar to that of a free piston driven shock tunnel.
This tunnel is also comprised of a driver gas reservoir, diaphragm, piston, test gas
section or barrel, nozzle and test section cum dump tank. During the experiment,
diaphragms are put in the respective locations and desired pressure is attained in the
test gas section and dump tank. Continuous filling of the piston driver gas in the
driver section bursts the diaphragm and the high pressure driver gas rushes in the
barrel or driver section which sets piston in motion. Hence piston in the Gun Tunnel
performs the same function as that of the contact surface and avoids the mixing of
driver and driven gas. Thus attained motion of the piston compresses the test gas and
also raises its temperature almost adiabatically. The main difference in Gun Tunnel
and Free piston driven shock tunnel lies in that the piston compression is attained for
the driver gas in the free piston driven shock tunnel while such is compression is
obtained for the test gas in Gun Tunnel. Diaphragm at the nozzle inlet opens up at a
particular test gas pressure and starts the expansion process in the nozzle. Thus
expanded test gas attains hypersonic conditions in the Mach number. Gun Tunnel is
very useful to obtain moderate stagnation enthalpy and high stagnation pressure
hypersonic freestream in the test section.
1. Driver Gas Reservoir 2. Diaphragm 3. Piston 4.Test gas section or Barrel
5.Diaphragm 6.Nozzle 7.Test section and vacuum tank assembly
Fig. 35.2 Schematic of a typical Gun Tunnel
Joint initiative of IITs and IISc – Funded by MHRD Page 20 of 36
NPTEL – Aerospace
35.3 Expansion Tube
Expansion tube is preferred for very high enthalpy or hypervelocity flows of the order
7 km/s and more. Free piston driven shock tunnel can also thought to use for such
experiments but the disadvantage of this facility is that it provides dissociated
freestream at the nozzle exit which is undesirable. This issue gets sorted by the use of
expansion tube which provides hypervelocity freestream of air without dissociation.
The lone disadvantage of this test facility is short test duration of the order of few tens
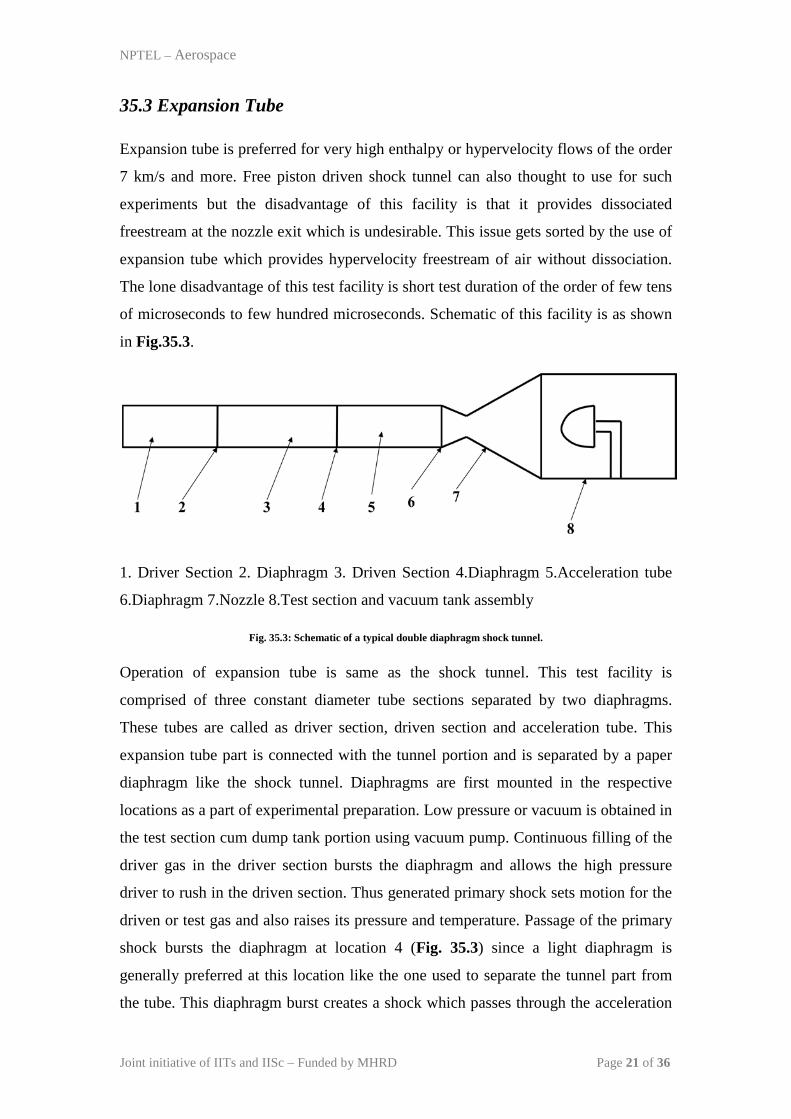
of microseconds to few hundred microseconds. Schematic of this facility is as shown
in Fig.35.3.
1. Driver Section 2. Diaphragm 3. Driven Section 4.Diaphragm 5.Acceleration tube
6.Diaphragm 7.Nozzle 8.Test section and vacuum tank assembly
Fig. 35.3: Schematic of a typical double diaphragm shock tunnel.
Operation of expansion tube is same as the shock tunnel. This test facility is
comprised of three constant diameter tube sections separated by two diaphragms.
These tubes are called as driver section, driven section and acceleration tube. This
expansion tube part is connected with the tunnel portion and is separated by a paper
diaphragm like the shock tunnel. Diaphragms are first mounted in the respective
locations as a part of experimental preparation. Low pressure or vacuum is obtained in
the test section cum dump tank portion using vacuum pump. Continuous filling of the
driver gas in the driver section bursts the diaphragm and allows the high pressure
driver to rush in the driven section. Thus generated primary shock sets motion for the
driven or test gas and also raises its pressure and temperature. Passage of the primary
shock bursts the diaphragm at location 4 (Fig. 35.3) since a light diaphragm is
generally preferred at this location like the one used to separate the tunnel part from
the tube. This diaphragm burst creates a shock which passes through the acceleration
Joint initiative of IITs and IISc – Funded by MHRD Page 21 of 36

NPTEL – Aerospace
tube and expansion waves which pass in the driven section. Driven or test gas speed
increases in the presence of expansion waves. This unsteady expansion continues in
the nozzle and test section where flow achieves hypervelocity test conditions. Various
versions of the acceleration tube are possible which lead to enhance the speed to
super-orbital speeds. Among those changes, use of double diaphragm shock tube,
piston driven shock tube, compound shock tube etc are preferred ones to create the
strong primary shock.
Joint initiative of IITs and IISc – Funded by MHRD Page 22 of 36
NPTEL – Aerospace
Lecture 36: Other hypersonic test facilities
36.1 Hot shot Tunnel
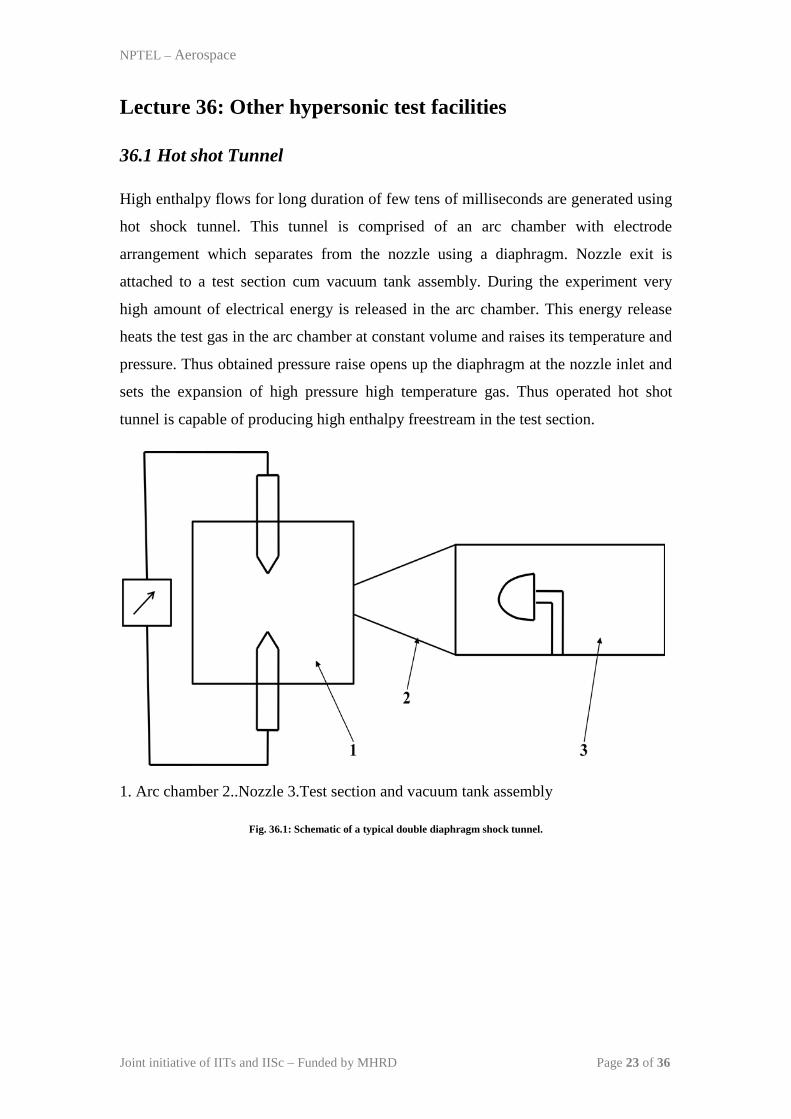
High enthalpy flows for long duration of few tens of milliseconds are generated using
hot shock tunnel. This tunnel is comprised of an arc chamber with electrode
arrangement which separates from the nozzle using a diaphragm. Nozzle exit is
attached to a test section cum vacuum tank assembly. During the experiment very
high amount of electrical energy is released in the arc chamber. This energy release
heats the test gas in the arc chamber at constant volume and raises its temperature and
pressure. Thus obtained pressure raise opens up the diaphragm at the nozzle inlet and
sets the expansion of high pressure high temperature gas. Thus operated hot shot
tunnel is capable of producing high enthalpy freestream in the test section.
1. Arc chamber 2..Nozzle 3.Test section and vacuum tank assembly
Fig. 36.1: Schematic of a typical double diaphragm shock tunnel.
Joint initiative of IITs and IISc – Funded by MHRD Page 23 of 36
NPTEL – Aerospace
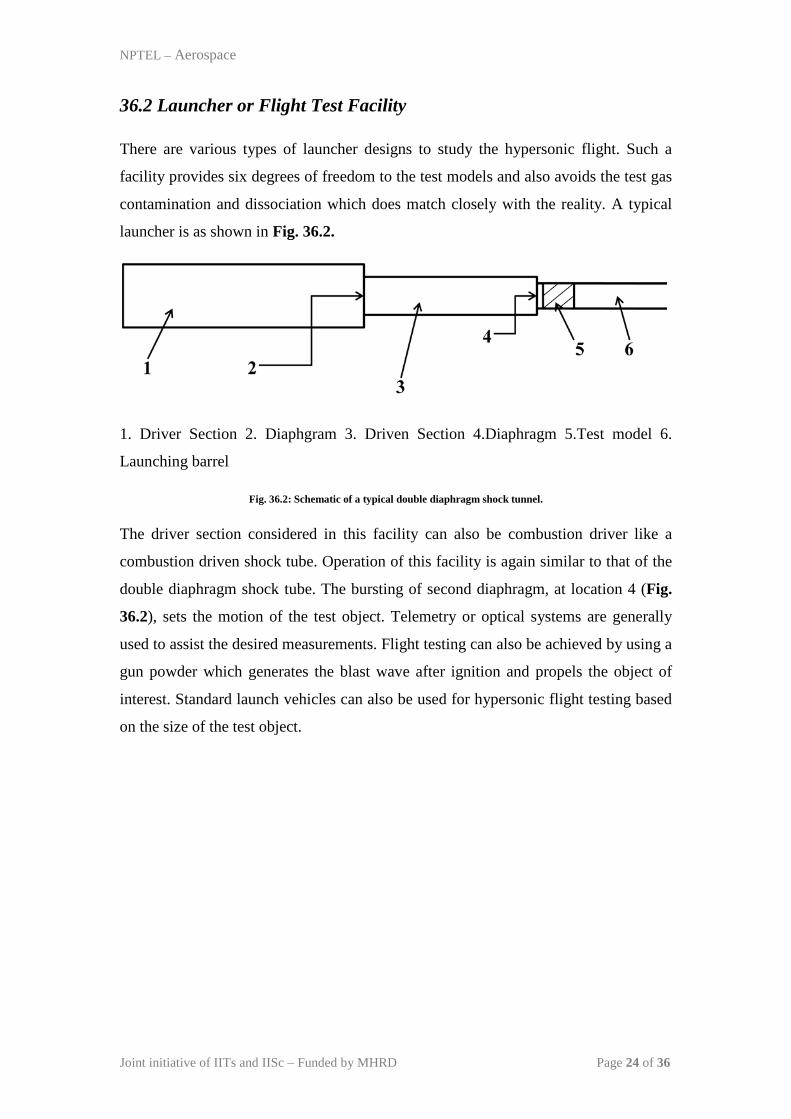
36.2 Launcher or Flight Test Facility
There are various types of launcher designs to study the hypersonic flight. Such a
facility provides six degrees of freedom to the test models and also avoids the test gas
contamination and dissociation which does match closely with the reality. A typical
launcher is as shown in Fig. 36.2.
1. Driver Section 2. Diaphgram 3. Driven Section 4.Diaphragm 5.Test model 6.
Launching barrel
Fig. 36.2: Schematic of a typical double diaphragm shock tunnel.
The driver section considered in this facility can also be combustion driver like a
combustion driven shock tube. Operation of this facility is again similar to that of the
double diaphragm shock tube. The bursting of second diaphragm, at location 4 (Fig.
36.2), sets the motion of the test object. Telemetry or optical systems are generally
used to assist the desired measurements. Flight testing can also be achieved by using a
gun powder which generates the blast wave after ignition and propels the object of
interest. Standard launch vehicles can also be used for hypersonic flight testing based
on the size of the test object.
Joint initiative of IITs and IISc – Funded by MHRD Page 24 of 36
NPTEL – Aerospace
Lecture 37: Heat transfer rate measurement
37.1 Heat transfer rate measurement
Knowledge of heat transfer rate is essential for the hypersonic flights for the design of
thermal protection system. Hence heat transfer measurements are carried out in the
experimental simulations. There are different sensors or methods for measuring the
heat transfer rate which include thin film sensors and thermocouples. These sensors
measure temperature time history during the experiment. This data is then used to
estimate the local surface heat transfer rate.
37.1.1 Thin Film Sensors This sensor is comprised of a substrate or backing material and sensing film.
Various insulating materials like Macor, Pyrex glass etc. are available for the backing
material. Macor (machinable ceramic) is used in experiments for heat transfer
measurement, since it can be easily machined according to the curvature. Apart from
the machinability, Macor is hard and brittle. Pyrex glass is preferred for
configurations like flat plates. Both the backing materials can be used efficiently but
their selection depends on the model to be tested. Thickness of the substrate is a very
important element in the measurement of heat transfer rate since shape of the
substrate is usually governed by the curvature of the test model. Moreover these
sensors are flush mounted with the surface of test model to avoid any protrusion
which affects the aerodynamic shape of the object. Knowledge of thickness of the
substrate is necessary to estimate heat transfer rate from the experimentally obtained
temperature signal using one dimensional heat conduction equation. Following
assumptions are essential to predict the heat flux from temperature signal due to very
small experimental duration.
1. Temperature measured by the sensing element is identical to the temperature
at the substrate.
2. There is no lateral transfer of heat
3. Substrate is of infinite depth and temperature rise at infinity is zero.
4. Thermal properties of the substrate are constant.
Joint initiative of IITs and IISc – Funded by MHRD Page 25 of 36
NPTEL – Aerospace
Considering these assumptions, the temperature sensed by the sensing element can be
considered to the same as the temperature measured on the surface of the substrate.
Therefore, the thickness of the substrate should be orders of magnitude greater than
the thickness of the thermal sensor placed on the substrate. The assumption of infinite
thickness of the substrate makes it obvious to have corresponding temperature change
at that end to be zero.
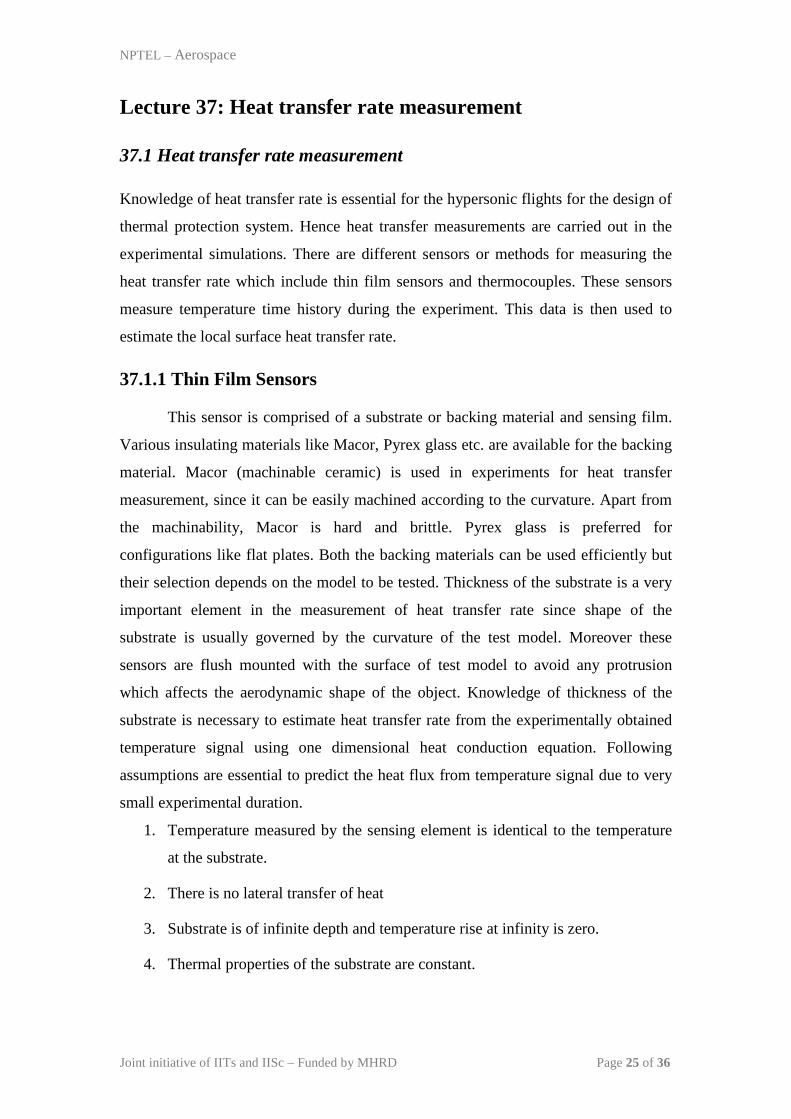
Extreme care is needed while preparing the thermal sensor. The thin film sensors need
to have low response time hence platinum or nickel sensing materials are primarily
considered for short duration testing. There are different techniques available to
deposit platinum on the substrate. Sputtering is one among them and used to make the
platinum thin films of required thickness. Hand painting of platinum paint on the
substrate is also one of the easiest ways to make platinum thin films. The Macor strips
are then put in the oven for baking which is then followed by natural cooling of the
gauges. Silver paste is generally used to establish the required electrical connection to
complete the fabrication of the thermal sensor. Schematic of a typical thermal sensor
is shown in Fig. 37.1.
Fig. 37.1 Schematic of a typical thin film sensor
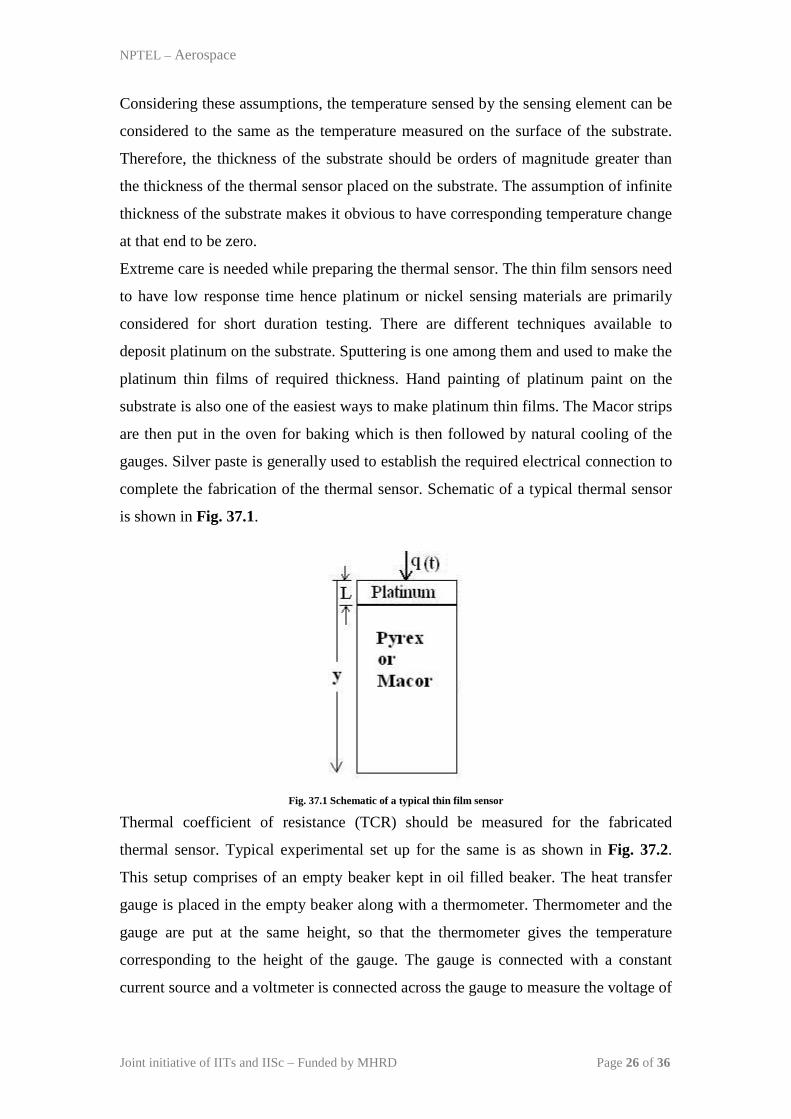
Thermal coefficient of resistance (TCR) should be measured for the fabricated
thermal sensor. Typical experimental set up for the same is as shown in Fig. 37.2.
This setup comprises of an empty beaker kept in oil filled beaker. The heat transfer
gauge is placed in the empty beaker along with a thermometer. Thermometer and the
gauge are put at the same height, so that the thermometer gives the temperature
corresponding to the height of the gauge. The gauge is connected with a constant
current source and a voltmeter is connected across the gauge to measure the voltage of
Joint initiative of IITs and IISc – Funded by MHRD Page 26 of 36
NPTEL – Aerospace
the gauge for the corresponding change in temperature. The oil bath is heated from
the room temperature to maximum temperature of 900C. Then the process of heating
is stopped and the bath is allowed to cool. The corresponding voltage readings are
recorded at an interval of around 50C, while heating and cooling of the oil bath. From
these readings, TCR (α) is obtained by the equation
[ ][ ]TV
V∆∆
=0
α
Here, V0 is the initial voltage measured from initial resistance of the gauge and
constant current and ∆V is the change in voltage for a change in temperature ∆T.
Fig. 37.2 Schematic of the experimental set-up for TCR estimation
Joint initiative of IITs and IISc – Funded by MHRD Page 27 of 36
NPTEL – Aerospace
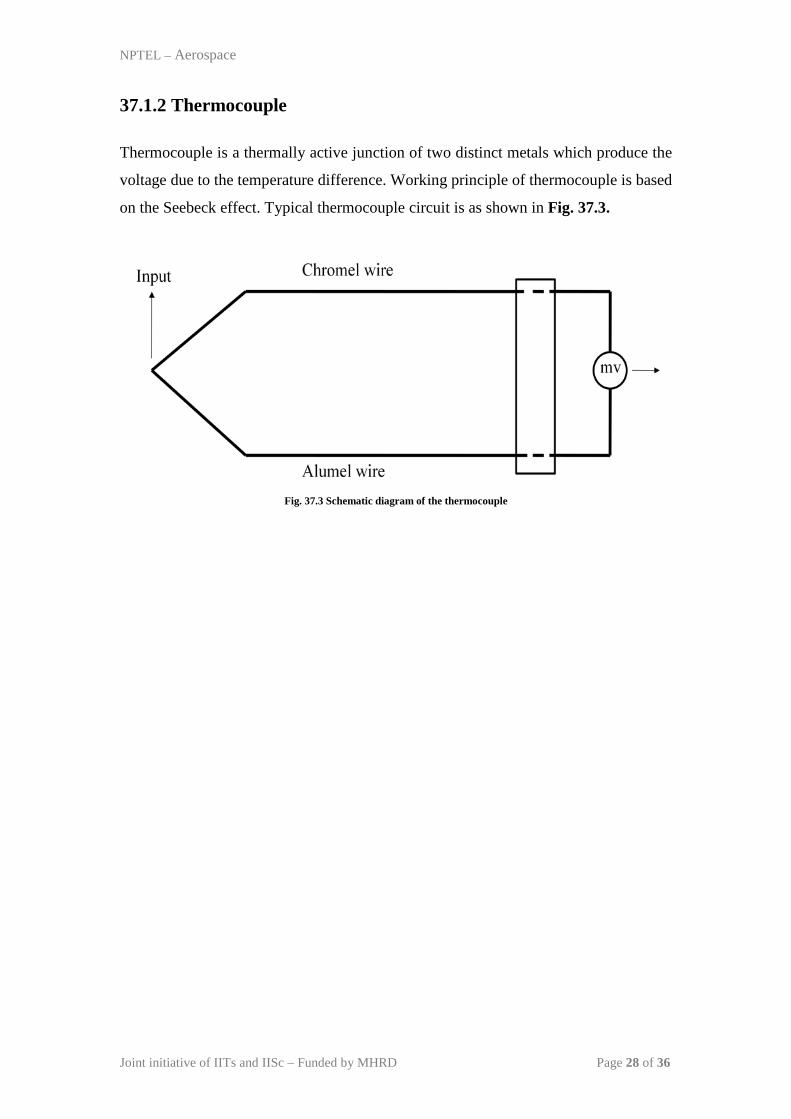
37.1.2 Thermocouple
Thermocouple is a thermally active junction of two distinct metals which produce the
voltage due to the temperature difference. Working principle of thermocouple is based
on the Seebeck effect. Typical thermocouple circuit is as shown in Fig. 37.3.
Fig. 37.3 Schematic diagram of the thermocouple
Joint initiative of IITs and IISc – Funded by MHRD Page 28 of 36
NPTEL – Aerospace
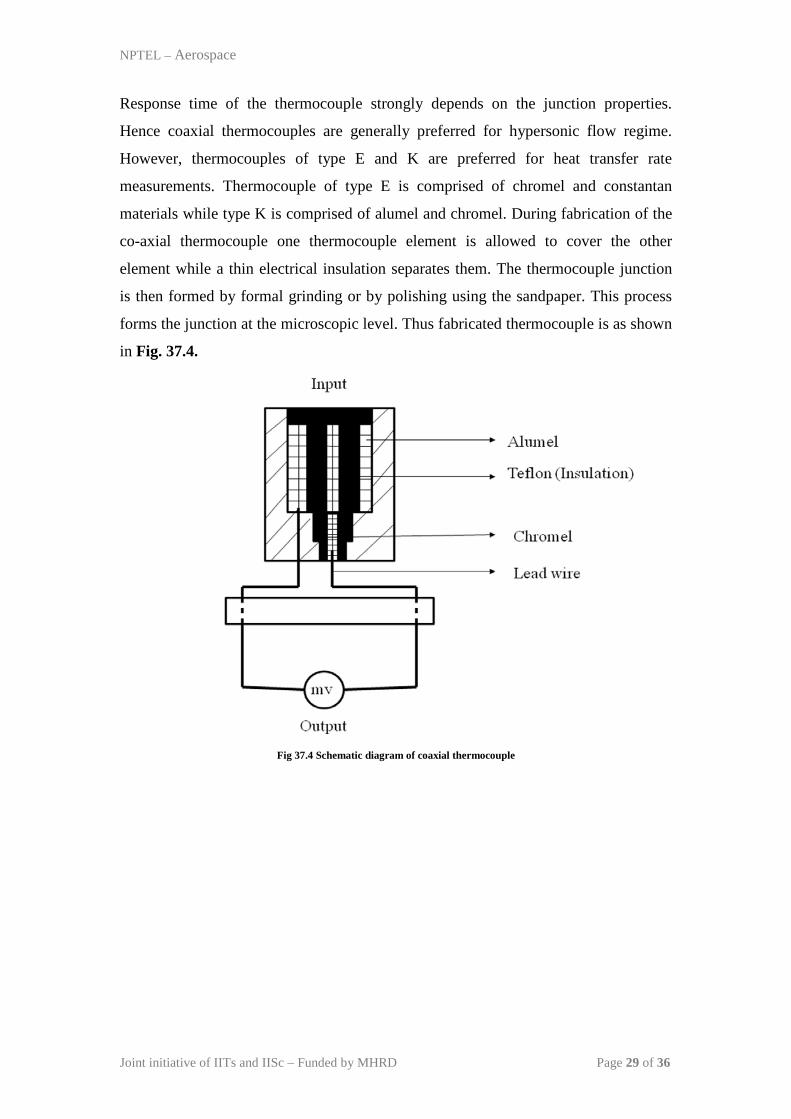
Response time of the thermocouple strongly depends on the junction properties.
Hence coaxial thermocouples are generally preferred for hypersonic flow regime.
However, thermocouples of type E and K are preferred for heat transfer rate
measurements. Thermocouple of type E is comprised of chromel and constantan
materials while type K is comprised of alumel and chromel. During fabrication of the
co-axial thermocouple one thermocouple element is allowed to cover the other
element while a thin electrical insulation separates them. The thermocouple junction
is then formed by formal grinding or by polishing using the sandpaper. This process
forms the junction at the microscopic level. Thus fabricated thermocouple is as shown
in Fig. 37.4.
Fig 37.4 Schematic diagram of coaxial thermocouple
Joint initiative of IITs and IISc – Funded by MHRD Page 29 of 36

NPTEL – Aerospace
37.2 Heat transfer rate prediction
The time history of voltage obtained from the gauge during the experiment is used to
find the heat transfer rate with the help of gauge material and backing material
properties. The principle of unsteady 1D heat conduction is useful for these
calculations of heat transfer rate. The gauge (platinum/nickel) deposited on the
backing material or substrate has thickness in microns. This thickness can be assumed
to be negligible in comparison with any other dimension of the gauge. Hence the
governing equation is the unsteady heat conduction equation for the typical gauge
geometry shown in Fig. 37.5.
From 0 ≤ y ≤ ∞; 2
2
yT
ck
tT
p ∂
∂
=
∂
∂
ρ (7.2)
The boundary conditions that are used (for both the regions) to solve the equation are,
as follows,
For platinum material region,
At y = 0 (at the gauge surface); t ≤ 0, T = 0;
t > 0, )(1
10
tqky
T
y
−=
∂
∂
=
Here, k1 is the thermal conductivity of gauge or sensing material (platinum), and q(t)
is the heat transfer rate at the gauge location. If ‘L’ is the gauge thickness, then the
boundary conditions for the backing material (Pyrex glass) region are
t ≤ 0; T = 0,
t > 0, y = L: T1(L)=T2(L), LyLy
yT
kyT
k==
∂
∂=
∂
∂21
k1 and k2 are the thermal conductivities of region 1 and 2 respectively. It signifies that
the temperature of both the materials at the interface is same and the heat transferred
by one material will be gained by other without any loss.
Joint initiative of IITs and IISc – Funded by MHRD Page 30 of 36
NPTEL – Aerospace
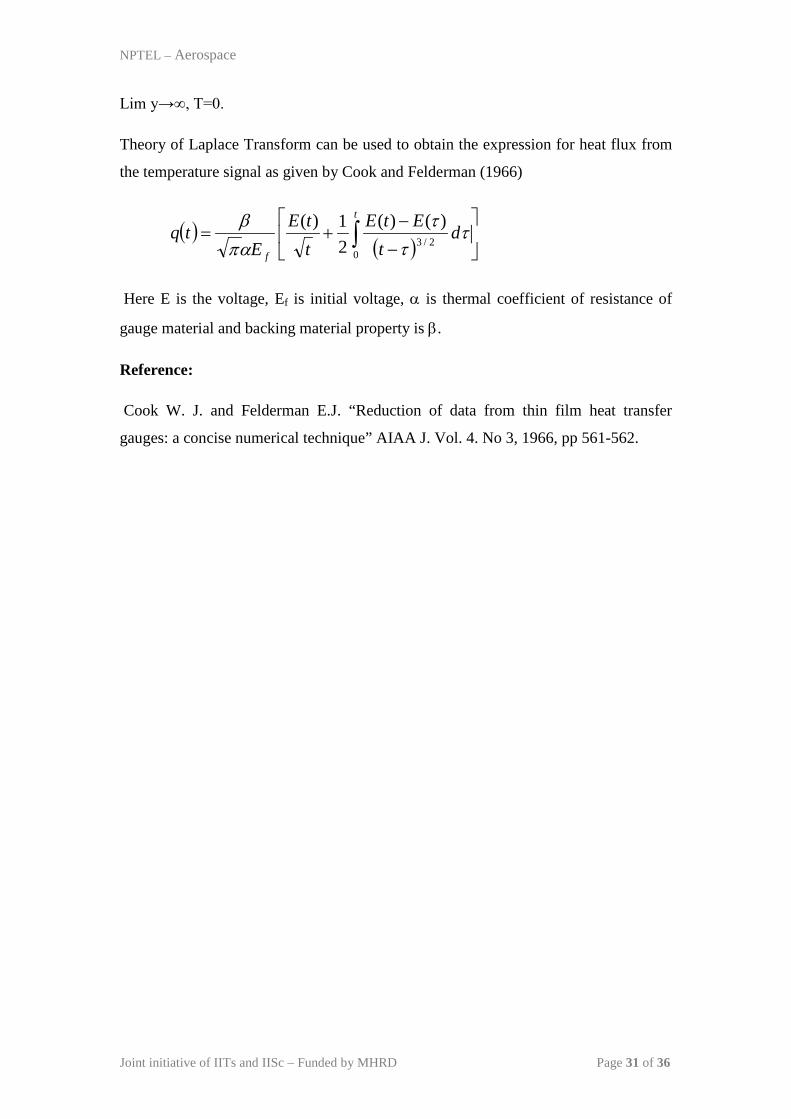
Lim y→∞, T=0.
Theory of Laplace Transform can be used to obtain the expression for heat flux from
the temperature signal as given by Cook and Felderman (1966)
( )( )
−
−+= ∫
t
f
dt
EtEttE
Etq
02/3
)()(21)(
ττ
ταπβ
Here E is the voltage, Ef is initial voltage, α is thermal coefficient of resistance of
gauge material and backing material property is β.
Reference:
Cook W. J. and Felderman E.J. “Reduction of data from thin film heat transfer
gauges: a concise numerical technique” AIAA J. Vol. 4. No 3, 1966, pp 561-562.
Joint initiative of IITs and IISc – Funded by MHRD Page 31 of 36
NPTEL – Aerospace
Lecture 38: Force measurement
38.1 Force measurement
Measurement of forces is useful for determination of aerodynamic coefficients, which
in turn is useful for determination of fuel requirement of space vehicle and also for
stability prediction. However, the measurement of forces in short duration facilities or
at high enthalpy test conditions is difficult task. Several research groups have recently
made the progress in designing force balances useful in flows of duration as short as
one-millisecond. All these techniques for measurement of aerodynamic forces in
impulse facilities are based on the use of either 1) force transducers 2) strain gauges
and 3) accelerometers. Efforts are also put to measure the pressure at various
locations on the object of interest to predict the force and moment. Some of the
important and widely accepted techniques are discussed here.
38.2 Accelerometer Force Balance
Use of accelerometers for the measurement of force was initially proposed by Vidal
(1956). Accelerometer based force balance is considered as the inertial dominated
force balance. The general theory of a three component force balance and its
application is briefly mentioned here. The spring mass concept is used to build this
force balance. Therefore, the model and support system which experience the time
dependant force are replaced by equivalent spring-mass system. The schematic of
such a system, for a generic hypersonic configuration is shown in Fig. 38.1. The
following assumptions have been made while designing the proposed system
(a) The springs are linear and they do not restrain lateral motion.
(b) There is no damping in the system.
(c) The axial force acts only through the center of gravity (C.G) of the model.
(d) Both the axial and normal forces vary with time.
(e) There are no coupling effects of axial and normal forces.
Joint initiative of IITs and IISc – Funded by MHRD Page 32 of 36

NPTEL – Aerospace
Let m, J and I be the mass, mass moment of inertia and the weight moment of inertia
(J=I/g) of the model being used, respectively and K1, K2, K3 be the spring constants
being used. Consider three degrees of freedom to the test model due to the hypersonic
flow over it in x, y and θ directions. Let N(t) be the normal force acting at the center
of pressure at a distance e from the C.G of the model and C(t) be the axial force.
Then, the model and the springs K1 and K2 constitute two degrees of freedom system
with combined rectilinear and angular motion. The spring K3 with the model
constitutes a single degree of freedom system with a linear motion. The Newton’s
second law, the force in y direction can be written as:
( ) ( ) ( )θθ byKayKtNym −−+−=••
21
Rearranging the above equation we get,
( ) ( ) ( )θ2121 bKaKyKKymtN −+++=••
Similarly for x-direction force balance and moment we have,
( ) xKxmtC 3+=••
( ) ( ) ( )bbyKaayKetNJ θθθ −++−⋅=••
21
The boundary conditions for the equations (3.1), (3.2) and (3.3) are the following:
t≤0, N=0, C=0.
t>0, N=N(t), C=C(t).
The above equations with the boundary conditions can be solved using Laplace
transform. Then, the solution for the accelerations works out to be as follows:
( ) ( )
−+
+−
=
••
JbKaKe
mKK
tm
tNy 212121
( )
++
−−
=
••
JKbKa
embKaK
tJ
teN 22
12
2121θ
( )
−
=
••
mK
tm
tCx2
1 32
The unknown forces (N(t) and C(t)) can be determined from above equations using
the experimentally measured accelerations. The spring constants K1, K2 and K3 appear
as the coefficients of t2 in the equations. The terms containing the product of time and
spring constants become negligibly small for the test duration of few milliseconds
Joint initiative of IITs and IISc – Funded by MHRD Page 33 of 36
NPTEL – Aerospace
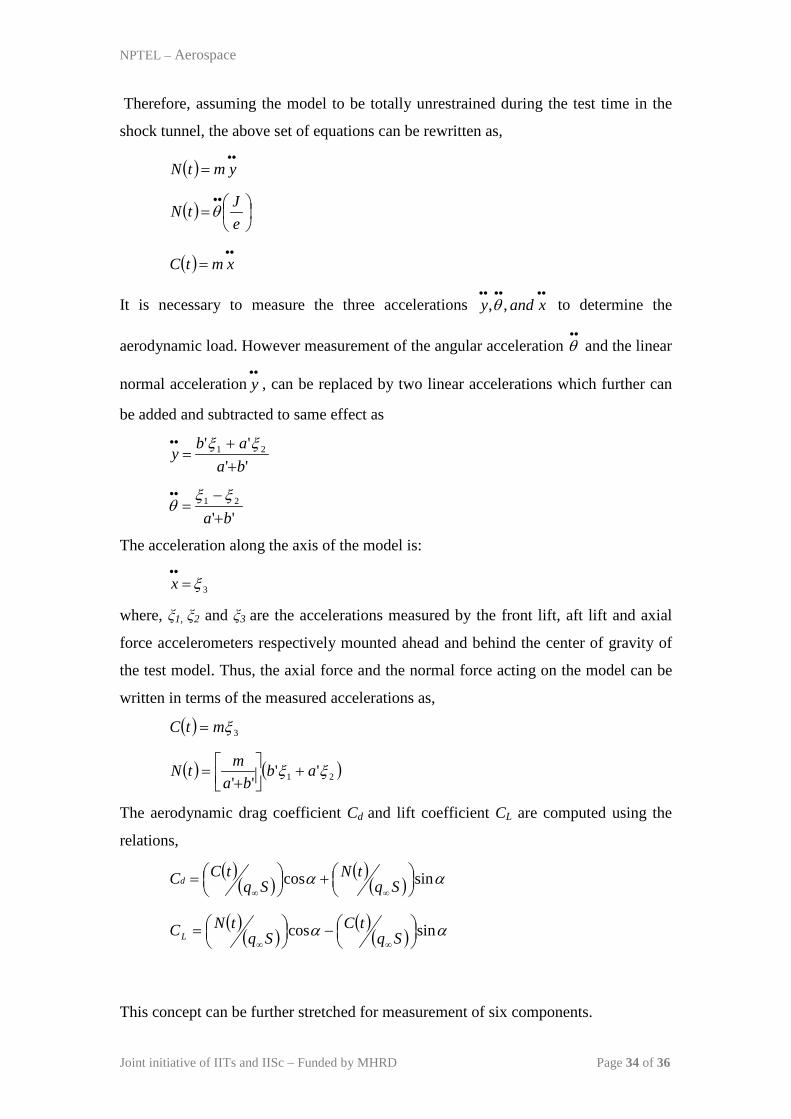
Therefore, assuming the model to be totally unrestrained during the test time in the
shock tunnel, the above set of equations can be rewritten as,
( )••
= ymtN
( )
=••
eJtN θ
( )••
= xmtC
It is necessary to measure the three accelerations ••••••
xandy ,,θ to determine the
aerodynamic load. However measurement of the angular acceleration ••
θ and the linear
normal acceleration••
y , can be replaced by two linear accelerations which further can
be added and subtracted to same effect as
'''' 21
baab
y++
=•• ξξ
''21
ba +−
=•• ξξθ
The acceleration along the axis of the model is:
3ξ=••
x
where, ξ1, ξ2 and ξ3 are the accelerations measured by the front lift, aft lift and axial
force accelerometers respectively mounted ahead and behind the center of gravity of
the test model. Thus, the axial force and the normal force acting on the model can be
written in terms of the measured accelerations as,
( ) 3ξmtC =
( ) ( )21 ''''
ξξ abba
mtN +
+=
The aerodynamic drag coefficient Cd and lift coefficient CL are computed using the
relations,
( )( )
( )( ) αα sincos
+
=
∞∞ SqtN
SqtCCd
( )( )
( )( ) αα sincos
−
=
∞∞ SqtC
SqtNCL
This concept can be further stretched for measurement of six components.
Joint initiative of IITs and IISc – Funded by MHRD Page 34 of 36
NPTEL – Aerospace
38.2 Stress wave force balance
Sanderson and Simmons (1991) developed this technique for measuring a single
component of force. Madhat et. al (2007) then stretched the applicability of this
balance for three degree of freedom system. This force balance is considered as
stiffness dominated force balance. It provides use of strain gauge to measure
aerodynamic forces for test times of only a few milliseconds. Semiconductor strain
gauges for high gauge factor are generally considered for this measurement. This
balance, referred as the stress wave force balance, is based on the interpretation of
transient stress waves propagating within the model and support during the test time.
Upon establishment of the flow about the model and during the useful test period, a
large number of stress wave reflections occur within the model and sting. The
resulting outputs of the strain gauges mounted on the sting are used for the estimation
of time history of the force. Extensive calibration of the instrumented test model is
prime requirement of this force measurement technique.
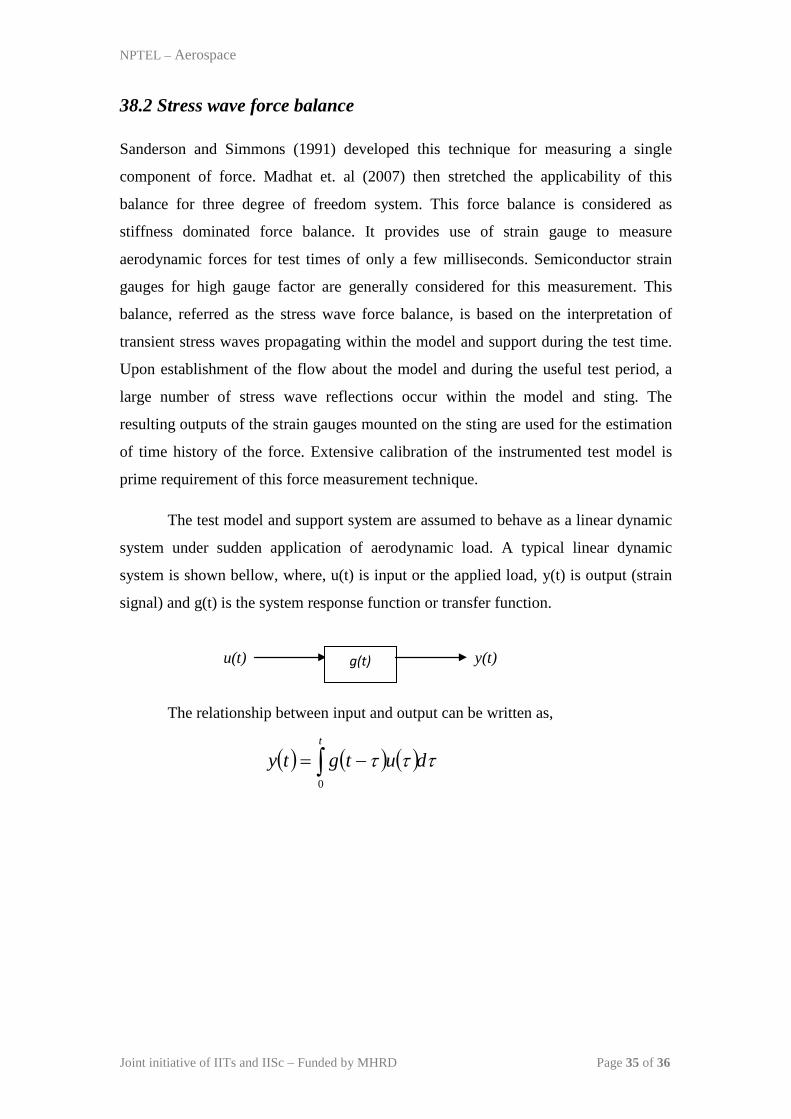
The test model and support system are assumed to behave as a linear dynamic
system under sudden application of aerodynamic load. A typical linear dynamic
system is shown bellow, where, u(t) is input or the applied load, y(t) is output (strain
signal) and g(t) is the system response function or transfer function.
u(t) y(t)
The relationship between input and output can be written as,
( ) ( ) ( ) τττ dutgtyt
∫ −=0
g(t)
Joint initiative of IITs and IISc – Funded by MHRD Page 35 of 36
NPTEL – Aerospace
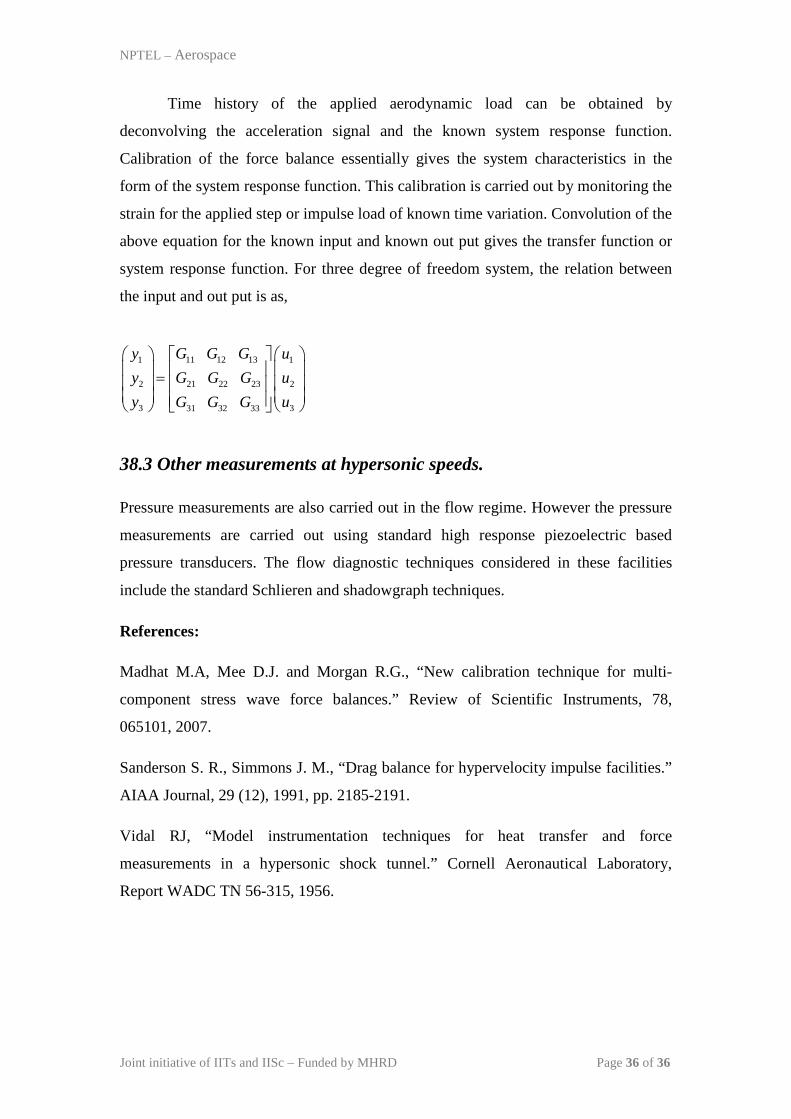
Time history of the applied aerodynamic load can be obtained by
deconvolving the acceleration signal and the known system response function.
Calibration of the force balance essentially gives the system characteristics in the
form of the system response function. This calibration is carried out by monitoring the
strain for the applied step or impulse load of known time variation. Convolution of the
above equation for the known input and known out put gives the transfer function or
system response function. For three degree of freedom system, the relation between
the input and out put is as,
11 12 131 1
2 21 22 23 2
3 331 32 33
G G Gy uy G G G uy uG G G
=
38.3 Other measurements at hypersonic speeds.
Pressure measurements are also carried out in the flow regime. However the pressure
measurements are carried out using standard high response piezoelectric based
pressure transducers. The flow diagnostic techniques considered in these facilities
include the standard Schlieren and shadowgraph techniques.
References:
Madhat M.A, Mee D.J. and Morgan R.G., “New calibration technique for multi-
component stress wave force balances.” Review of Scientific Instruments, 78,
065101, 2007.
Sanderson S. R., Simmons J. M., “Drag balance for hypervelocity impulse facilities.”
AIAA Journal, 29 (12), 1991, pp. 2185-2191.
Vidal RJ, “Model instrumentation techniques for heat transfer and force
measurements in a hypersonic shock tunnel.” Cornell Aeronautical Laboratory,
Report WADC TN 56-315, 1956.
Joint initiative of IITs and IISc – Funded by MHRD Page 36 of 36